ACTA GEOBALCANICA 6-1, 2020, pp. 35-41 35 OPEN SOURCE FLOOD MAPPING TOOLS – QGIS, RIVER GIS AND HEC-RAS DOI: UDC: https://doi.org/10.18509/AGB.2020.04 004.457'23.057.8:[528.932:627.512 Catalin Ioan Cimpianu 1 , Alin Mihu-Pintilie 2 1 Department of Geography, Faculty of Geography and Geology, Alexandru Ioan Cuza University of Iasi, Romania 2 Institute for Interdisciplinary Research, Science Research Department, Alexandru Ioan Cuza University of Iasi, Romania corresponding author: [email protected] submitted: accepted: published: 05.03.2019 01.06.2019 01.09.2019 Abstract Recently, the area of free and open source geospatial data and software has experienced a significant development and progress. Since the start of geospatial open source “revolution” in the early 2000 (that began with QGIS launching), a transition from commercial software to open source alternatives has been noticed among researchers, professionals, local administrations, etc. This study focuses on using available open source solutions in order to obtain useful information regarding the delineation of flood hazard and flood risk areas. QGIS, a free and open-source geographic information system software was used for spatial data visualization, editing and analysis. River GIS is a QGIS plugin that allows the creation of 1D or 2D geometric flow models using the QGIS environment. A 1D flow model and HEC-RAS software was used to estimate the hydraulics of water flow, delineating the vulnerable areas. Useful information about flood hazard and risk exposure was obtained, the methodology used proved efficient considering the time, cost and the quality of the output. The results managed to capture and delimitate the flood prone areas and the amount of social damages in term of affected persons. Taking into consideration the cost related issues, this methodology can be applied easily by all the interested parties (local communities, local authorities, scientists, responsible persons with flood mitigation) in the development of local, regional or national flood management plans. Keywords: QGIS, HEC-RAS, River-GIS, Flood mapping, Open Source Software INTRODUCTION “Open source” software is defined as software in which the source code is available for modification and redistribution by the general public [1]. Open Source Software (OSS) gained more and more credibility as a large number of initiatives regarding this topic emerged over the last two decades, especially in the GIS market [2, 3]. Geospatial open source movement/revolution began as a reply against the numerous limitations imposed by the commercial code (which is traditionally expensive proprietary software) [4, 5]. In this way, many GIS application capabilities and functionalities were developed and distributed without any usage restriction, being guaranteed for free to the public use. Moreover this phenomenon, gather large communities of users which are working to develop better computer software, leading to continuous progresses and constant updates. The Open Source Geospatial Foundation (OSGeo) is one of the best examples of such community (https://www.osgeo.org). Therefore, as a consequence, many of these applications concentrate on developing software for geographic/spatial data management, storage, analysis and visualization [2, 6]. One of the most important open source GIS application developed in the last two decades, is QGIS, software that provides useful GIS tools in spatial analysis, geoprocessing, geometry, and data management tasks [7]. It is one of the most popular open source GIS, offering reliable solutions for public and private sectors like, education, scientific research institutions, non-profit organizations or small business [8, 9]. This study looks at QGIS and HEC-RAS, both open source software and explores their possibilities to delineate the flood hazard and risk over a given area of interest. This is possible due to RiverGIS, a specially developed tool for creating HEC-RAS flow model geometry inputs in

Welcome message from author
This document is posted to help you gain knowledge. Please leave a comment to let me know what you think about it! Share it to your friends and learn new things together.
Transcript

ACTA GEOBALCANICA
6-1, 2020, pp. 35-41
35
OPEN SOURCE FLOOD MAPPING TOOLS –
QGIS, RIVER GIS AND HEC-RAS
DOI:
UDC:
https://doi.org/10.18509/AGB.2020.04
004.457'23.057.8:[528.932:627.512
Catalin Ioan Cimpianu1, Alin Mihu-Pintilie2
1Department of Geography, Faculty of Geography and Geology,
Alexandru Ioan Cuza University of Iasi, Romania 2Institute for Interdisciplinary Research, Science Research Department,
Alexandru Ioan Cuza University of Iasi, Romania
corresponding author: [email protected]
submitted:
accepted:
published:
05.03.2019
01.06.2019
01.09.2019
Abstract Recently, the area of free and open source geospatial data and software has experienced a significant development
and progress. Since the start of geospatial open source “revolution” in the early 2000 (that began with QGIS
launching), a transition from commercial software to open source alternatives has been noticed among researchers,
professionals, local administrations, etc. This study focuses on using available open source solutions in order to obtain
useful information regarding the delineation of flood hazard and flood risk areas. QGIS, a free and open-source
geographic information system software was used for spatial data visualization, editing and analysis. River GIS is a
QGIS plugin that allows the creation of 1D or 2D geometric flow models using the QGIS environment. A 1D flow
model and HEC-RAS software was used to estimate the hydraulics of water flow, delineating the vulnerable areas.
Useful information about flood hazard and risk exposure was obtained, the methodology used proved efficient
considering the time, cost and the quality of the output. The results managed to capture and delimitate the flood prone
areas and the amount of social damages in term of affected persons. Taking into consideration the cost related issues,
this methodology can be applied easily by all the interested parties (local communities, local authorities, scientists,
responsible persons with flood mitigation) in the development of local, regional or national flood management plans.
Keywords: QGIS, HEC-RAS, River-GIS, Flood mapping, Open Source Software
INTRODUCTION
“Open source” software is defined as software in
which the source code is available for modification
and redistribution by the general public [1]. Open
Source Software (OSS) gained more and more
credibility as a large number of initiatives regarding
this topic emerged over the last two decades,
especially in the GIS market [2, 3]. Geospatial open
source movement/revolution began as a reply
against the numerous limitations imposed by the
commercial code (which is traditionally expensive
proprietary software) [4, 5]. In this way, many GIS
application capabilities and functionalities were
developed and distributed without any usage
restriction, being guaranteed for free to the public
use. Moreover this phenomenon, gather large
communities of users which are working to develop
better computer software, leading to continuous
progresses and constant updates. The Open Source
Geospatial Foundation (OSGeo) is one of the best
examples of such community (https://www.osgeo.org).
Therefore, as a consequence, many of these
applications concentrate on developing software for
geographic/spatial data management, storage,
analysis and visualization [2, 6].
One of the most important open source GIS
application developed in the last two decades, is
QGIS, software that provides useful GIS tools in
spatial analysis, geoprocessing, geometry, and data
management tasks [7]. It is one of the most popular
open source GIS, offering reliable solutions for
public and private sectors like, education, scientific
research institutions, non-profit organizations or
small business [8, 9]. This study looks at QGIS and
HEC-RAS, both open source software and explores
their possibilities to delineate the flood hazard and
risk over a given area of interest. This is possible
due to RiverGIS, a specially developed tool for
creating HEC-RAS flow model geometry inputs in

Catalin Ioan Cimpianu, Alin Mihu-Pintilie
Open source flood mapping tools – Qgis, River Gis and Hec-Ras
36
QGIS environment. QGIS with RiverGIS is a
freeware solution, widely used worldwide that can
be perfectly integrated with HEC-RAS software in
order to obtain all the geometry parts of the river
system, as the main channel, cross-sections,
overbanks, flow paths, etc. [10].
One of the most used technique for channel flow
analysis and floodplain delineation is the usage of
HEC-RAS software [11]. Floodplain studies make
usage of hydraulic modeling in order to provide
water surface profiles and floodplain maps for
different administrative purposes [12]. The created
models (using RiverGIS and HEC-RAS) can
reproduce historic water surface elevations
recorded during actual flood events [13] but also
can be used to develop different scenarios using
hypothetical data for flood zoning maps [14]. This
paper attempts to highlight the performance of open
source software QGIS RiverGIS and HEC-RAS as
tools in the flood zoning map development
(development of flood hazard and flood risk maps).
DATA AND METHODS
QGIS is an Open Source Geographic Information
System (GIS) licensed under the GNU General
Public License. QGIS is an official project of the
Open Source Geospatial Foundation (OSGeo). The
project was developed starting from 2002 as a
response to the generally expensive GIS proprietary
software and the unavailability of this specific type
of software as free of cost. Its main purpose is to
provide basic GIS functionalities to anyone with
access to a computer [4].
The initial goal of the project was to provide a GIS
data viewer [4], today its capabilities implying
viewing, editing, advanced geoprocessing and
various analysis possibilities [15, 16]. Today, QGIS
offers many common GIS functionalities provided
by its core features (maintained by the QGIS
Development Team and part of every QGIS
distribution) and plugins (which give the
opportunity that new features and functions to be
easily added to the application by interested
users/developers) [4].
Figure 1. Methodological scheme on how the flood zoning maps were obtained.
QGIS provides a plugin mechanism [17], a Python
application program interface (API), which is used
to expand its functionality. Since the introduction of
this plugin mechanism in QGIS 0.9 in 2007, many
tools were added by the developers using Python
plugins [18]. The distribution of a plugin is
performed using the QGIS official repository,
where the developers can upload their work. In this
way, the QGIS users can locate it (using QGIS
plugin manager) and install it on their computer. All
the uploaded plugins fall under GNU General
Public License [19]. For data management and tool computation, the present study used the latest QGIS 3.4 Madeira version. RiverGIS is a QGIS plugin developed by
Radosław Pasiok, Łukasz Dębek, Rafał Parda and Karol Zieliński, acting for QGIS as HEC-GeoRAS acts for ArcGIS. It is an excellent alternative that helps you create HEC-RAS flow models in a no cost environment. It brings all the HEC-GeoRAS components into the free/libre software world (http://rivergis.com/about.html). RiverGIS 1.0 version was installed using the Plugin Manager in QGIS. PostgreSQL 9.4 version was installed along with its PostGIS extender. PostGIS is an extension to the PostgreSQL object-relational database system which allows GIS (Geographic Information Systems) objects to be stored in the database [20]. This step was mandatory, as RiverGIS plugin needs a connection to a PostgreSQL database with spatial extensions of PostGIS included

ACTA GEOBALCANICA
6-1, 2020, pp. 35-41
37
(http://rivergis.com/about.html). All the necessary data created for the flow model computation were stored in the PostGIS database previously created (Stream Centerlines, XS Cut Lines, Bank Lines, etc.). After the generation of the flow model geometry, an export for future HEC-RAS hydraulic modeling steps was performed. HEC-RAS (Hydraulic Engineering Centre River Analysis System) is a hydraulic software, developed by US Army Corps of Engineers. It is a tool that can perform steady and unsteady flow simulations and obtain water surface elevations within a specific area of interest [11]. For this study, a 1D steady flow model was used. This assumed that at each cross section established, the
water flow proprieties were the same (as entered at the upstream end of the river) and the time variable did not interfered changing this value [21] Figure 1. The flow model and computations were based on a 0.5 m resolution LiDAR Digital Elevation Model of the study area. The model mapped the areas covered with water taking into consideration the steady flow data introduced (5 profiles). 5 flood zoning maps were developed. The results were then viewed and exported in raster and vector format using the RAS Mapper tool available in HEC-RAS. The last step consisted in the realization of the flood hazard maps and risk assessment evaluation. A full methodological schema regarding the steps performed can be seen in Figure 1.
STUDY AREA The study area is located in Iasi, Romania, one of the largest urban area form the county, with a population of almost 350000 inhabitants. For this practical example two of its biggest neighborhoods were selected – Alexandu and Dacia (Figure 2). The
proximity to the Bahlui River and the high population density, make these two neighborhoods vulnerable in the case of a flood event. The selection was based also on the availability of LiDAR data of this region.
Figure 2. Location of the Study area, Iasi, Romania, Basemap: OpenStreetMap.
RESULTS
The results consisted in 5 hydraulic simulations which
were based on 5 scenarios. Each scenario took into
consideration a certain flow rate in the 1D steady flow
model used in HEC-RAS computations. Scenario 1
(Figure 3) simulates the river flow in its official
average flow rate (Q=4mc/s). This scenario was taken
into consideration in order to validate the various
hypothetical scenarios proposed. The other scenarios
were based on various flow rates as:
Scenario 2 – Q=50mc/s; Scenario 3 – Q=100mc/s;
Scenario 4 – Q=300mc/s; Scenario 5 – Q=500mc/s.
The identification of the risk assessment was realized
by intersecting the flood hazard extend map obtained
in Scenario 2 with the buildings and addresses layer of
the neighborhoods (study area) (Figure 8). A number
of 111 building were reported as affected by the flood
extend (proposed by Scenario 2 with an average
Q=50mc/s) cumulating a number of over 10000
individuals (in terms of affected persons). The
cartographical materials (flood hazard maps and flood
risk map) were realized using expressly QGIS
environment.

Catalin Ioan Cimpianu, Alin Mihu-Pintilie
Open source flood mapping tools – Qgis, River Gis and Hec-Ras
38
Figure 2. Scenario 1, Q=4mc/s, Basemap: OpenStreetMap.
Figure 3. Scenario 2, Q=50mc/s, Basemap: OpenStreetMap.
Figure 4. Scenario 3, Q=100ms/s, Basemap: OpenStreetMap.

ACTA GEOBALCANICA
6-1, 2020, pp. 35-41
39
Figure 5. Scenario 4, Q=300mc/s, Basemap: OpenStreetMap.
Figure 6: Scenario 5, Q=500mc/s, Basemap: OpenStreetMap.
Figure 7: Flood risk map of the study area taking into consideration the Scenario 2.
Catalin Ioan Cimpianu, Alin Mihu-Pintilie
Open source flood mapping tools – Qgis, River Gis and Hec-Ras
40
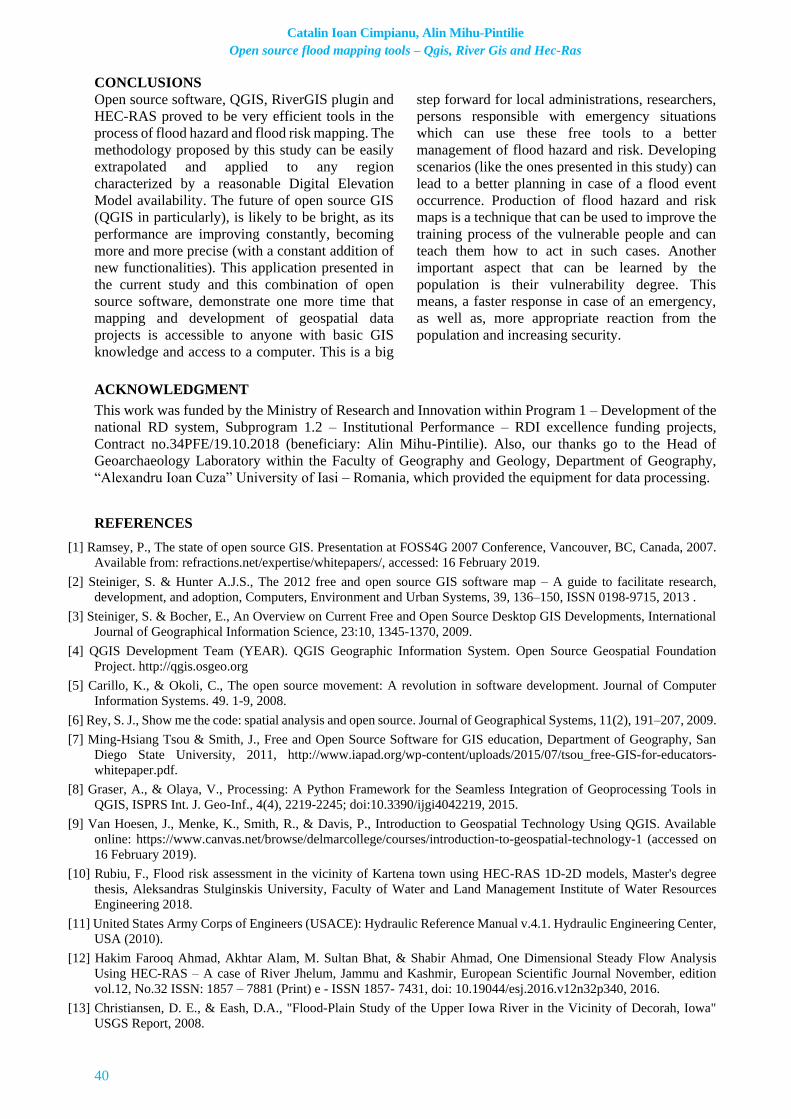
CONCLUSIONS
Open source software, QGIS, RiverGIS plugin and
HEC-RAS proved to be very efficient tools in the
process of flood hazard and flood risk mapping. The
methodology proposed by this study can be easily
extrapolated and applied to any region
characterized by a reasonable Digital Elevation
Model availability. The future of open source GIS
(QGIS in particularly), is likely to be bright, as its
performance are improving constantly, becoming
more and more precise (with a constant addition of
new functionalities). This application presented in
the current study and this combination of open
source software, demonstrate one more time that
mapping and development of geospatial data
projects is accessible to anyone with basic GIS
knowledge and access to a computer. This is a big
step forward for local administrations, researchers,
persons responsible with emergency situations
which can use these free tools to a better
management of flood hazard and risk. Developing
scenarios (like the ones presented in this study) can
lead to a better planning in case of a flood event
occurrence. Production of flood hazard and risk
maps is a technique that can be used to improve the
training process of the vulnerable people and can
teach them how to act in such cases. Another
important aspect that can be learned by the
population is their vulnerability degree. This
means, a faster response in case of an emergency,
as well as, more appropriate reaction from the
population and increasing security.
ACKNOWLEDGMENT
This work was funded by the Ministry of Research and Innovation within Program 1 – Development of the
national RD system, Subprogram 1.2 – Institutional Performance – RDI excellence funding projects,
Contract no.34PFE/19.10.2018 (beneficiary: Alin Mihu-Pintilie). Also, our thanks go to the Head of
Geoarchaeology Laboratory within the Faculty of Geography and Geology, Department of Geography,
“Alexandru Ioan Cuza” University of Iasi – Romania, which provided the equipment for data processing.
REFERENCES
[1] Ramsey, P., The state of open source GIS. Presentation at FOSS4G 2007 Conference, Vancouver, BC, Canada, 2007.
Available from: refractions.net/expertise/whitepapers/, accessed: 16 February 2019.
[2] Steiniger, S. & Hunter A.J.S., The 2012 free and open source GIS software map – A guide to facilitate research,
development, and adoption, Computers, Environment and Urban Systems, 39, 136–150, ISSN 0198-9715, 2013 .
[3] Steiniger, S. & Bocher, E., An Overview on Current Free and Open Source Desktop GIS Developments, International
Journal of Geographical Information Science, 23:10, 1345-1370, 2009.
[4] QGIS Development Team (YEAR). QGIS Geographic Information System. Open Source Geospatial Foundation
Project. http://qgis.osgeo.org
[5] Carillo, K., & Okoli, C., The open source movement: A revolution in software development. Journal of Computer
Information Systems. 49. 1-9, 2008.
[6] Rey, S. J., Show me the code: spatial analysis and open source. Journal of Geographical Systems, 11(2), 191–207, 2009.
[7] Ming-Hsiang Tsou & Smith, J., Free and Open Source Software for GIS education, Department of Geography, San
Diego State University, 2011, http://www.iapad.org/wp-content/uploads/2015/07/tsou_free-GIS-for-educators-
whitepaper.pdf.
[8] Graser, A., & Olaya, V., Processing: A Python Framework for the Seamless Integration of Geoprocessing Tools in
QGIS, ISPRS Int. J. Geo-Inf., 4(4), 2219-2245; doi:10.3390/ijgi4042219, 2015.
[9] Van Hoesen, J., Menke, K., Smith, R., & Davis, P., Introduction to Geospatial Technology Using QGIS. Available
online: https://www.canvas.net/browse/delmarcollege/courses/introduction-to-geospatial-technology-1 (accessed on
16 February 2019).
[10] Rubiu, F., Flood risk assessment in the vicinity of Kartena town using HEC-RAS 1D-2D models, Master's degree
thesis, Aleksandras Stulginskis University, Faculty of Water and Land Management Institute of Water Resources
Engineering 2018.
[11] United States Army Corps of Engineers (USACE): Hydraulic Reference Manual v.4.1. Hydraulic Engineering Center,
USA (2010).
[12] Hakim Farooq Ahmad, Akhtar Alam, M. Sultan Bhat, & Shabir Ahmad, One Dimensional Steady Flow Analysis
Using HEC-RAS – A case of River Jhelum, Jammu and Kashmir, European Scientific Journal November, edition
vol.12, No.32 ISSN: 1857 – 7881 (Print) e - ISSN 1857- 7431, doi: 10.19044/esj.2016.v12n32p340, 2016.
[13] Christiansen, D. E., & Eash, D.A., "Flood-Plain Study of the Upper Iowa River in the Vicinity of Decorah, Iowa"
USGS Report, 2008.

ACTA GEOBALCANICA
6-1, 2020, pp. 35-41
41
[14] Heydari, Mohammad & Shahiri Parsa, Ahmad & Sadeghian, Mohammad & Moharrampour, Mahdi, Flood Zoning
Simulation by HEC-RAS Model (Case Study: Johor River-Kota Tinggi Region). Journal of River Engineerin, 1, 2013.
[15] Graser, A. Learning QGIS, 2nd ed.; Packt Publishing: Birmingham, UK, 2014.
[16] Cutts, A., Graser, A., Learn QGIS - Fourth Edition, November 2018.
[17] Hugentobler M., Quantum GIS. In: Shekhar S., Xiong H. (eds) Encyclopedia of GIS. Springer, Boston, MA, DOI
https://doi.org/10.1007/978-0-387-35973-1, Publisher Name Springer, Boston, MA, Print ISBN - 978-0-387-30858-
6, 2008.
[18] Graser, A., & Olaya V., Processing: A Python Framework for the Seamless Integration of Geoprocessing Tools in
QGIS, ISPRS Int. J. Geo-Inf., 4(4), 2219-2245, 2015.
[19] Lawhead, J., QGIS Python Programming Cookbook, Publisher Packt Publishing Ltd, ISBN 1787121100,
9781787121102, Length 464 pages, 2017.
[20] Ramsey, P. PostGIS Manual, available at: http://www.dcc.fc.up.pt/~michel/ TABD/postgis.pdf
[21] Hicks, F.E. & Peacock, T., "Suitability of HEC-RAS for Flood Forecasting" Canadian Water Resources Journal Vol.
30(2): 159–174. Greener Journal of Science, Engineering and Technology Research ISSN: 2276-7835 Vol. 3 (3), pp.
076-081, 2005.
Related Documents