Open Path Methods Building Environment Research & Education AgAirQuality.com Agricultural and Biological Engineering Purdue University Albert J. Heber, Professor [email protected]

Open Path Methods Building Environment Research & Education AgAirQuality.com Agricultural and Biological Engineering Purdue University Albert J. Heber,
Dec 20, 2015
Welcome message from author
This document is posted to help you gain knowledge. Please leave a comment to let me know what you think about it! Share it to your friends and learn new things together.
Transcript

Open Path Methods
Building EnvironmentResearch & Education
AgAirQuality.com
Agricultural and Biological Engineering
Purdue University
Albert J. Heber, [email protected]
Biocurtain at Laying House
Biocurtain over 3 fans
Lab

Inside Biocurtain at Layer House
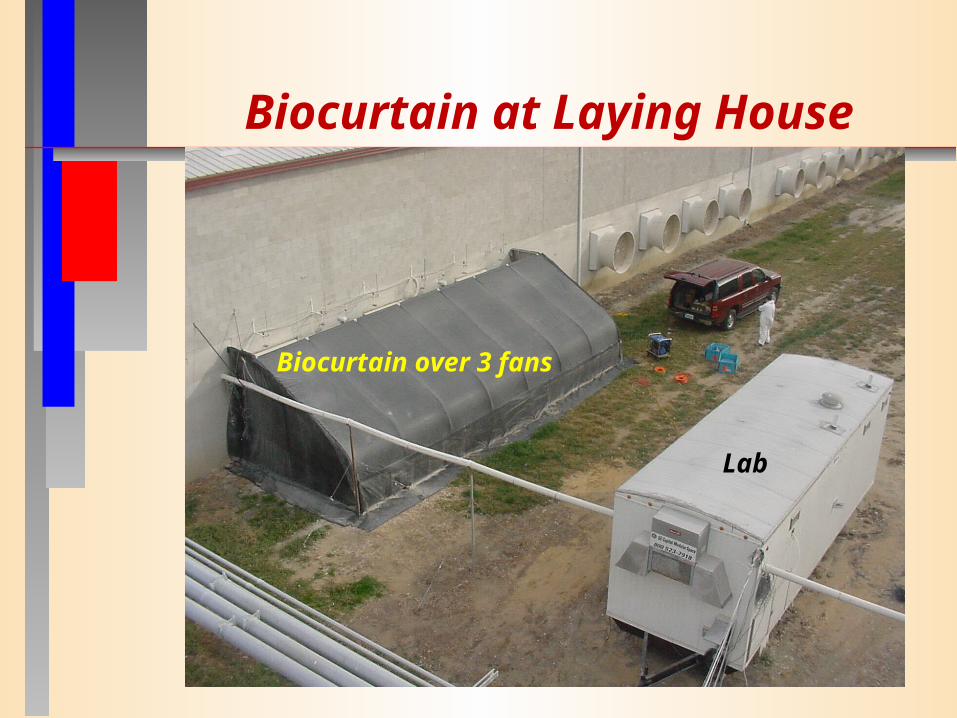
NRC Report on Air EmissionsEmissions Global/Nat. Local Concern
NH3 Major Minor N-Dep/PM2.5
N2O Significant Insignificant Climate
NOx Significant Minor Haze/Health
CH4 Significant Insignificant Climate
VOCs Insignificant Minor Quality
H2S Insignificant Significant Quality
PM10 Insignificant Significant Haze
PM2.5 Insignificant Significant Health/Haze
Odor Insignificant Major Quality

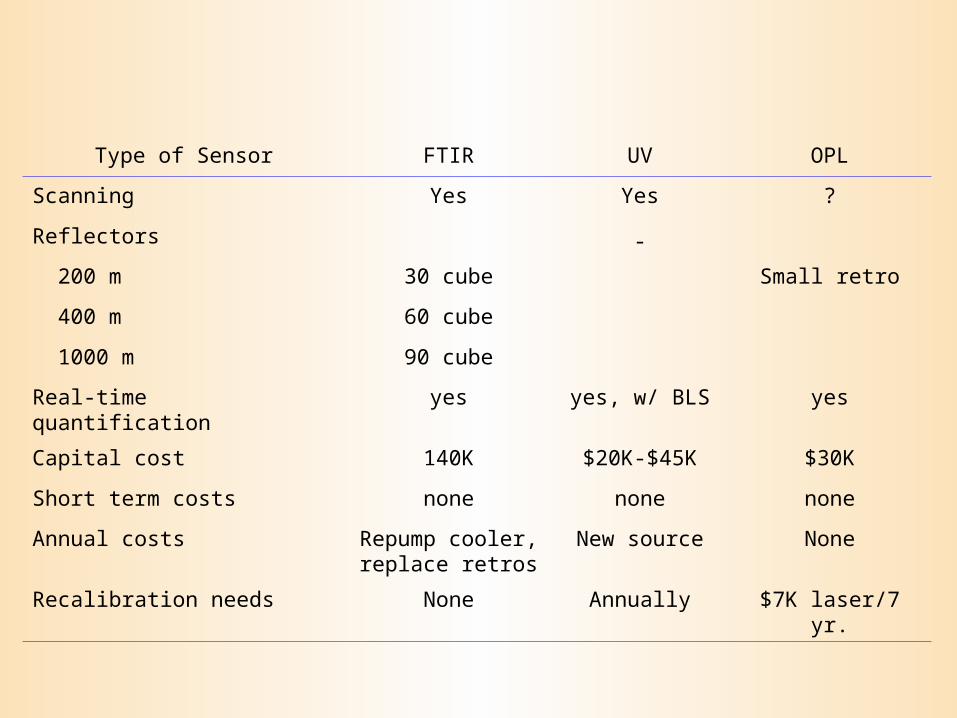
Type of Sensor FTIR UV OPL
Detector cooling Cryocooler - -
Path Length, m 400 150-1000 2000
Mode Monostatic Bistatic Monostatic
Compounds NH3, VOC*, CH4 NH3, H2S, Nox H2S or NH3
Scan frequency, Hz 1 1 4000
Detection Limits
Hydrogen sulfide Deuterium
ppm-m 10-30 0.4-5 6-25
ppb 75-600 2.8-33 3-120
Linear upper range
Ammonia Xenon
ppm-m 1.5 2 2
ppb 2-50 3-20 1-40
Linear upper range 903
Models BLS, TOM BLS, TOM BLS
Comparing Open Path Sensors
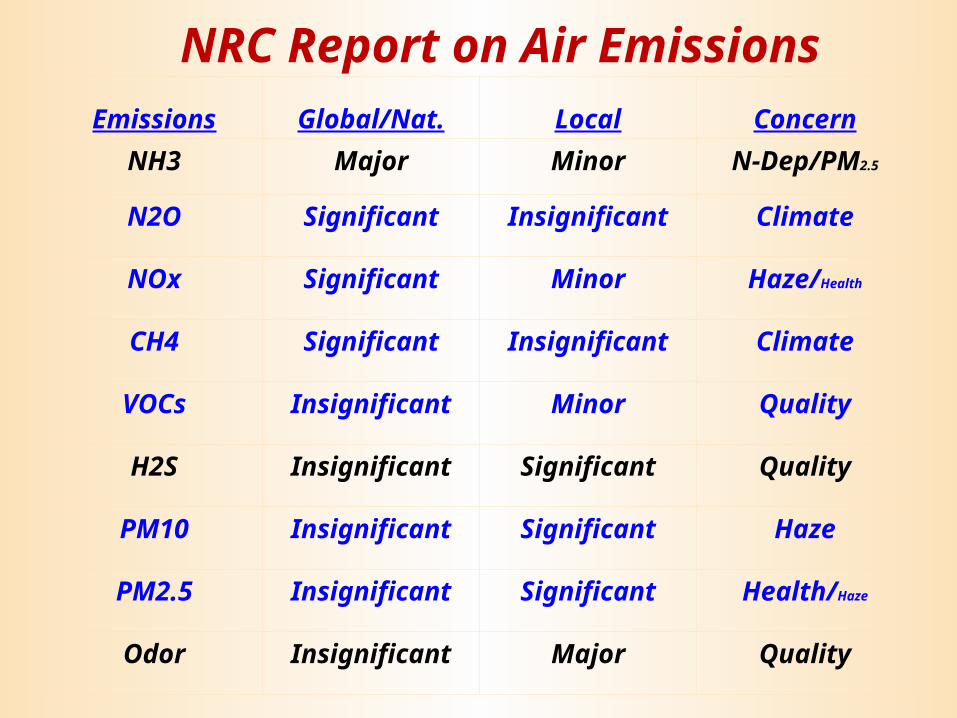
Type of Sensor FTIR UV OPL
Scanning Yes Yes ?
Reflectors -
200 m 30 cube Small retro
400 m 60 cube
1000 m 90 cube
Real-time quantification yes yes, w/ BLS yes
Capital cost 140K $20K-$45K $30K
Short term costs none none none
Annual costs Repump cooler, replace retros
New source None
Recalibration needs None Annually $7K laser/7 yr.
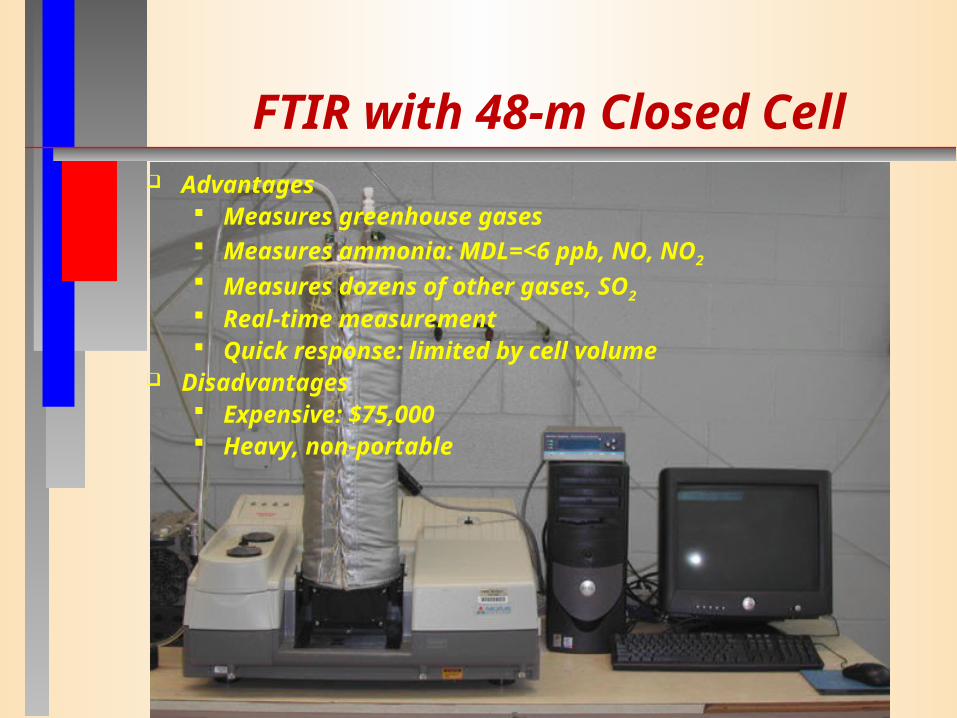
FTIR with 48-m Closed Cell Advantages
Measures greenhouse gases Measures ammonia: MDL=<6 ppb, NO, NO2
Measures dozens of other gases, SO2
Real-time measurement Quick response: limited by cell volume
Disadvantages Expensive: $75,000 Heavy, non-portable
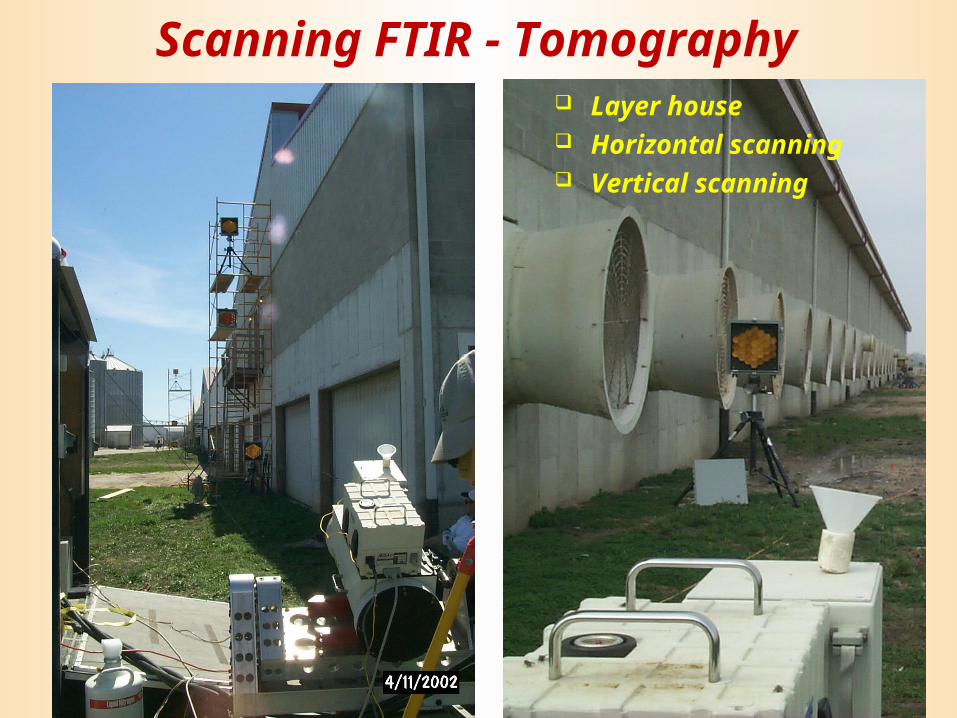
Scanning FTIR - Tomography Layer house Horizontal scanning Vertical scanning
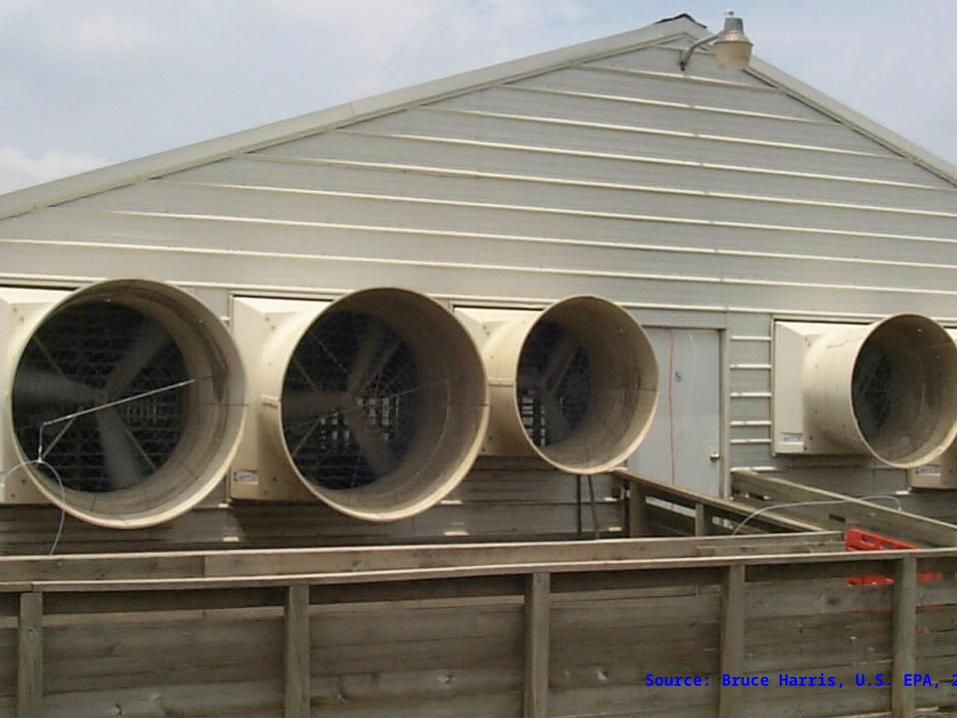
Source: Bruce Harris, U.S. EPA, 2004

Source: Bruce Harris, U.S. EPA, 2004
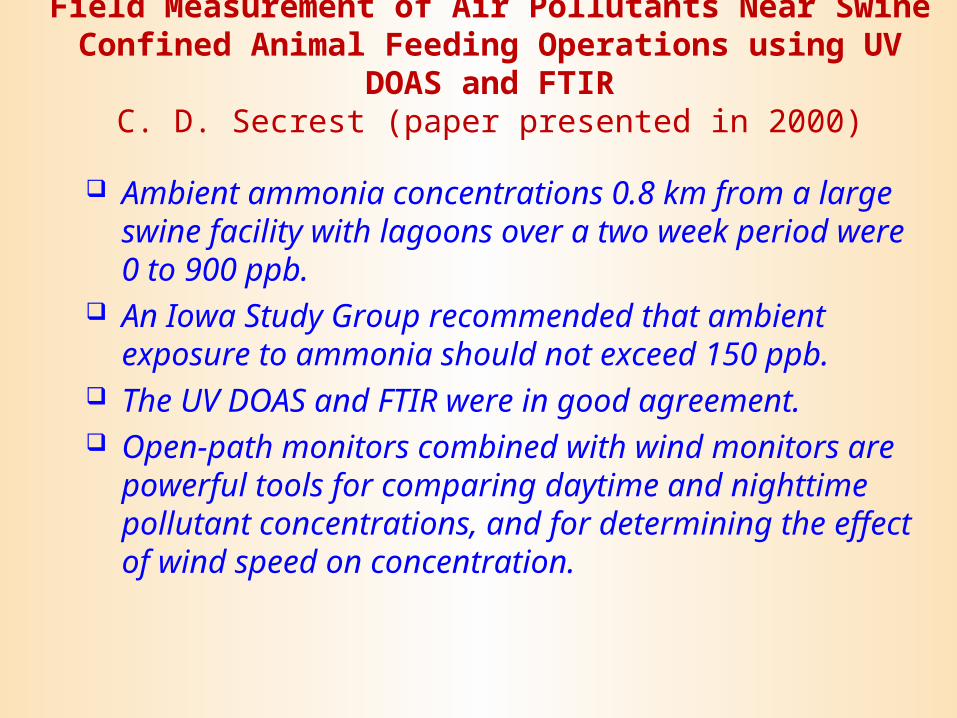
Field Measurement of Air Pollutants Near Swine Confined Animal Feeding Operations using UV DOAS and FTIR
C. D. Secrest (paper presented in 2000)
Ambient ammonia concentrations 0.8 km from a large swine facility with lagoons over a two week period were 0 to 900 ppb.
An Iowa Study Group recommended that ambient exposure to ammonia should not exceed 150 ppb.
The UV DOAS and FTIR were in good agreement. Open-path monitors combined with wind monitors are
powerful tools for comparing daytime and nighttime pollutant concentrations, and for determining the effect of wind speed on concentration.
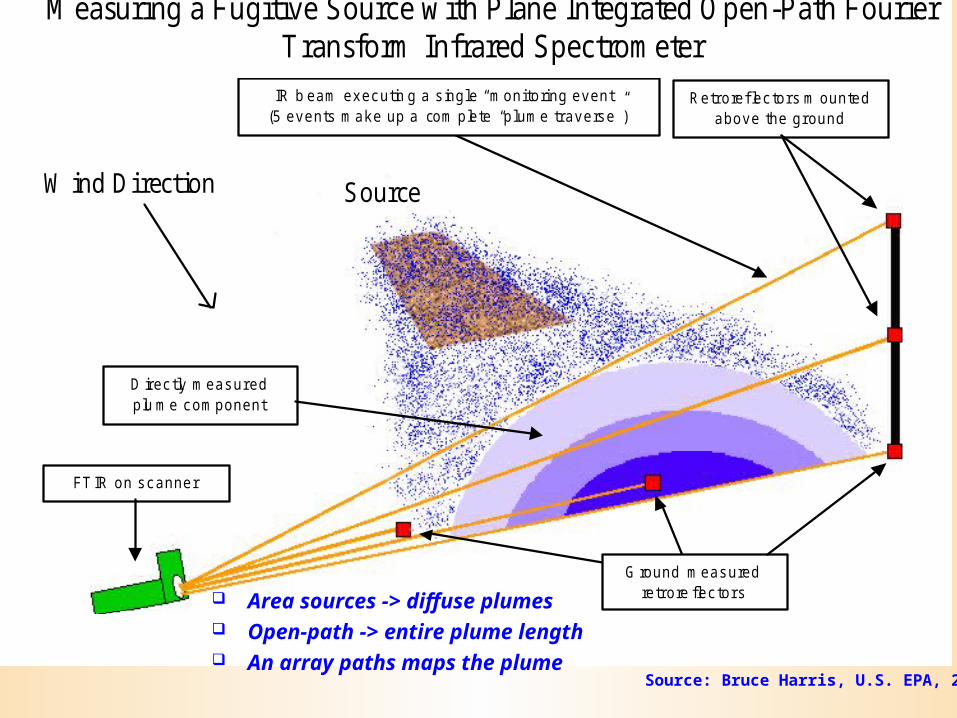
S ourceW ind Di rect ion
FT IR on s c anne r
D ir ec tly m eas u r ed p lu m e c om ponen t
R e tr o re f lec to r s m oun ted abov e the g r ound
IR b eam ex ec u tin g a s ing le “ m on i to ring ev en t” (5 ev en ts m ak e up a com p le te “p lum e tr av e rs e ” )
G round m eas u red re tr o re flec to r s
M easuring a Fugitive Source w ith P lane Integrated O pen -Path Fourier T ransform In frared Spectrom eter
Source: Bruce Harris, U.S. EPA, 2004
Area sources -> diffuse plumes Open-path -> entire plume length An array paths maps the plume

Source: Bruce Harris, U.S. EPA, 2004
wind
OP-FTIR Measurement Pathsfor Path-Integrated Optical Remote Sensing (Tomography)
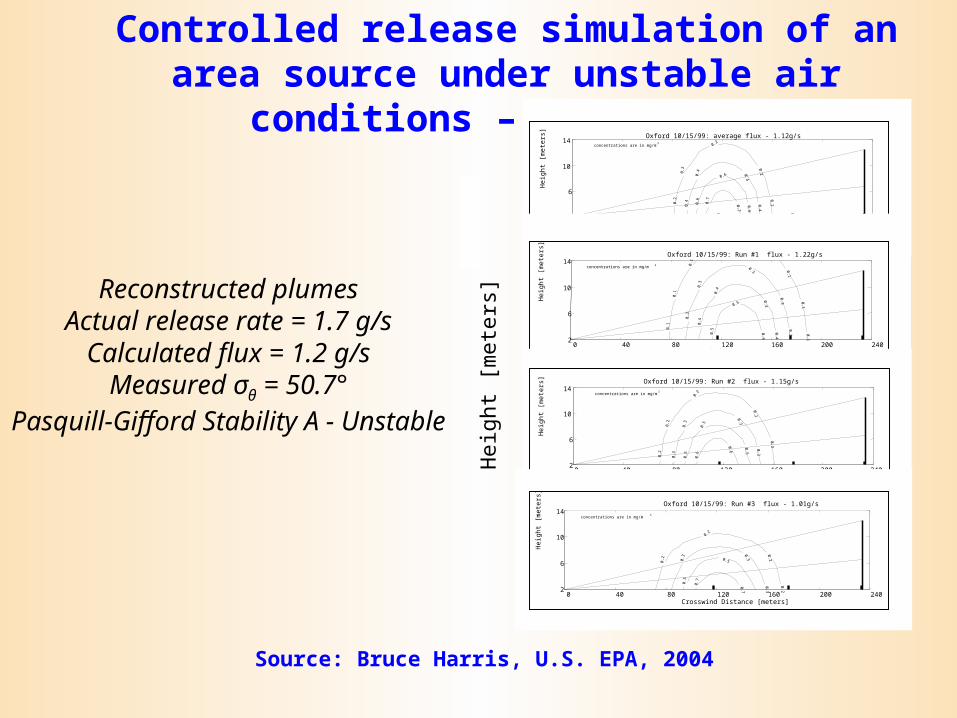
Controlled release simulation of an area source under unstable air conditions – worst case
Source: Bruce Harris, U.S. EPA, 2004
0 40 80 120 160 200 2402
6
10
14
Crosswind Distance [meters]
Hei
ght
[met
ers] Oxford 10/15/99: average flux - 1.12g/s
0.2
0.2
0.2
0.2
0.2
0.4
0.4
0.4
0.4
0.6
0.6
0.6
0.7
0.7
concentrations are in mg/m3
0 40 80 120 160 200 2402
6
10
14
Crosswind Distance [meters]
Hei
ght
[met
ers] Oxford 10/15/99: Run #1 flux - 1.22g/s
0.1
0.1
0.1
0.1
0.10.1
0.3
0.3
0.3
0.3
0.3
0.4
0.4
0.4
0.4
0.5
0.5
0.5
concentrations are in mg/m 3
0 40 80 120 160 200 2402
6
10
14
Crosswind Distance [meters]
Hei
ght
[met
ers]
Oxford 10/15/99: Run #2 flux - 1.15g/s
0.2
0.2
0.2
0.2
0.2
0.3
0.3
0.3
0.3
0.5
0.5
0.5
0.6
0.6
concentrations are in mg/m3
0 40 80 120 160 200 2402
6
10
14
Crosswind Distance [meters]
Hei
ght
[met
ers]
Oxford 10/15/99: Run #3 flux - 1.01g/s
0.2
0.2
0.2
0.2
0.3 0.3
0.3
0.5
0.5
0.7
0.7
concentrations are in mg/m3
Hei
ght [
met
ers]
Reconstructed plumesActual release rate = 1.7 g/s
Calculated flux = 1.2 g/sMeasured σθ = 50.7°
Pasquill-Gifford Stability A - Unstable
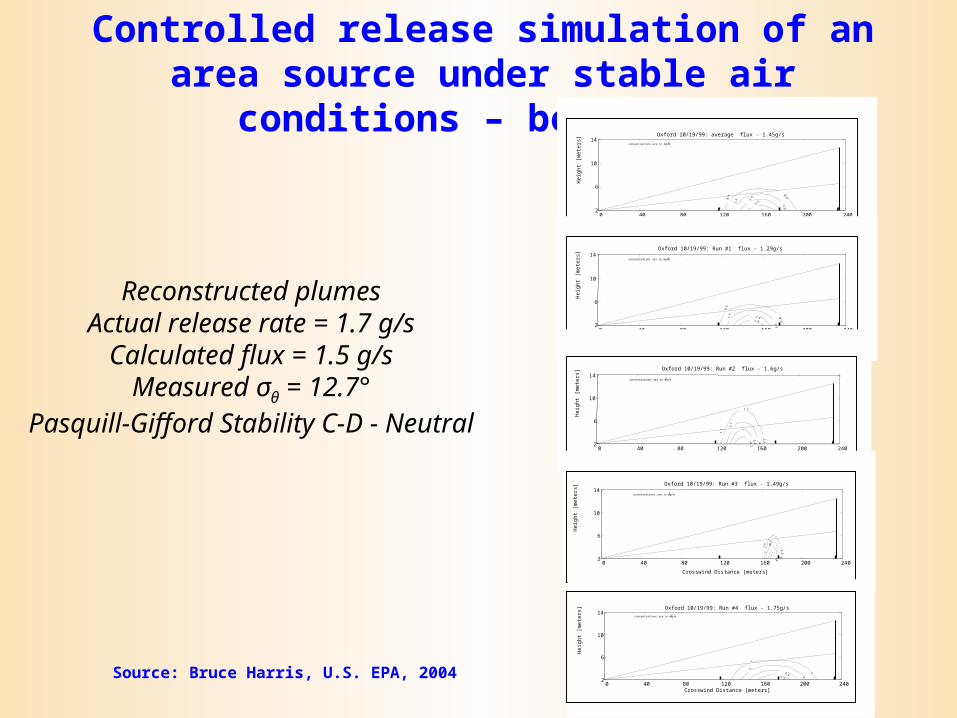
Controlled release simulation of an area source under stable air conditions – best case
Source: Bruce Harris, U.S. EPA, 2004
0 40 80 120 160 200 2402
6
10
14
Crosswind Distance [meters]
Hei
ght [
met
ers]
Oxford 10/19/99: average flux - 1.45g/s
0.9 0.9
1.8
1.8
2.6
3.5
concentrations are in mg/m 3
0 40 80 120 160 200 2402
6
10
14
Crosswind Distance [meters]
Hei
ght [
met
ers]
Oxford 10/19/99: Run #1 flux - 1.29g/s
0.9
0.9
1.9
1.9
2.83.8
concentrations are in mg/m 3
0 40 80 120 160 200 2402
6
10
14
Crosswind Distance [meters]
Hei
ght [
met
ers]
Oxford 10/19/99: Run #2 flux - 1.6g/s
1.1
1.1
1.1
2.1
2.1
3.24.2
concentrations are in mg/m3
0 40 80 120 160 200 2402
6
10
14
Crosswind Distance [meters]H
eigh
t [m
eter
s]
Oxford 10/19/99: Run #3 flux - 1.49g/s
3.5
3.57
7
10.5
14
concentrations are in mg/m3
0 40 80 120 160 200 2402
6
10
14
Crosswind Distance [meters]
Hei
ght [
met
ers]
Oxford 10/19/99: Run #4 flux - 1.75g/s
1
1
2
2
2.93.9
concentrations are in mg/m3
Reconstructed plumesActual release rate = 1.7 g/s
Calculated flux = 1.5 g/sMeasured σθ = 12.7°
Pasquill-Gifford Stability C-D - Neutral
Source: Bruce Harris, U.S. EPA, 2004
FTIR ReferencesHarris, D. B., and E.L. Thompson, Jr. 1998. Evaluation of ammonia emission from
swine operations in North Carolina. Proc. Emission Inventory-Living in a Global Environment, VIP-88, pp. 420-429. AWMA, Pittsburgh, PA.
Harris, D. B., E.L. Thompson, Jr., D.A. Kirchgessner, J.W. Childers, M. Clayton, D.F. Natschke, W.J. Phillips. 1999. Multi-pollutant concentration mapping around a concentrated swine production facility using open-path FTIR spectrometry. Workshop on Atmospheric Nitrogen Compounds II: Emissions, Transport, Transformation, Deposition and Assessment, NCSU, Raleigh, NC, pp. 237-246.
Childers, J. W., E.L. Thompson, Jr., D.B. Harris, D.A. Kirchgessner, M. Clayton, D.A. Natschke, W.J. Phillips. 2001. Multi-pollutant measurements around a concentrated swine production facility using open-path spectrometry. Atm. Env. 35: 1023-1936.
Childers, J. W., Thompson, E. L., Jr., Harris, D. B., Kirchgessner, D. A., Clayton, M., Natschke, D. A., Phillips, W. J. (2001) Application of standardized quality control procedures to open-path fourier transform infrared data collected at a concentrated swine production facility. Env. Science & Tech. 35:1859-1866.

Source: Bruce Harris, U.S. EPA, 2004
FTIR ReferencesChilders, J. W., E.L. Thompson, Jr., D.B. Harris, D.A. Kirchgessner, M. Clayton, D.A.
Natschke, W.J. Phillips. 2000. Comparison of an innovative algorithm to classical least squares for analyzing open-path fourier transform infrared spectra collected at a concentrated swine production facility. Appl.Spect. 56:325-336.
Hashmonay, R. A., D.A. Natschke, K. Wagoner, D.B. Harris, E.L. Thompson, Jr., M.G. Yost. 2001. Field evaluation of a method for estimating gaseous fluxes from area sources using open-path fourier transform infrared. Env. Sci. Tech. 35:2309-2313.
Harris, D. B., E.L. Thompson, Jr., Vogel, C. A., Hashmonay, R. A., Natschke, D. A., Wagoner, K. Yost, M.G. Innovative approach for measuring ammonia and methane fluxes from a hog farm using open-path fourier transform infrared spectroscopy. 94th Annual Conf. of the AWMA, VIP-102-CD, AWMA, Pittsburgh, PA 2001.
Hashmonay, R.A. and D.B. Harris. 2001. Particulate matter measurements using open-path Fourier transform infrared spectroscopy. 94th Annual Conference of the Air & Waste Management Association, VIP-102-CD, AWMA, Pittsburgh, PA.
Harris, D.B., R.C. Shores, L.G. Jones. Ammonia Emission Factors from Swine Finishing Operations. Int. Emissions Inventory Conference, “One Atmosphere, One Inventory, Many Challenges.” www.epa.gov/ttn/chief/conferences/ei10/index.html.
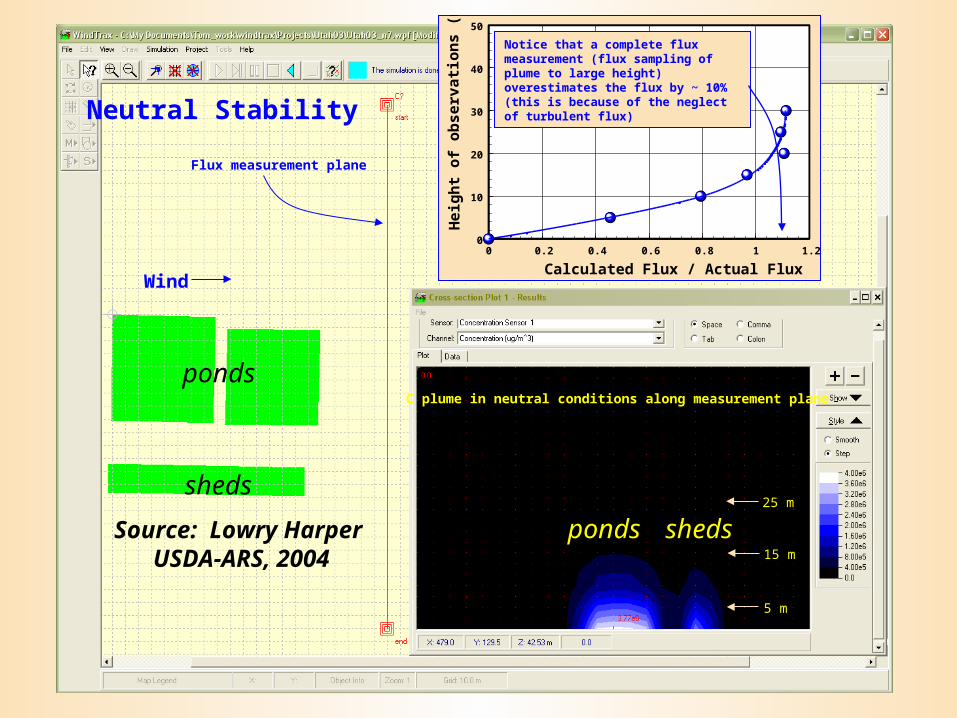
0 0.2 0.4 0.6 0.8 1 1.2
Calculated Flux / Actual Flux
0
10
20
30
40
50
Hei
gh
t o
f o
bse
rvat
ion
s (m
) Notice that a complete flux measurement (flux sampling of plume to large height) overestimates the flux by ~ 10% (this is because of the neglect of turbulent flux)
15 m
5 m
25 m
C plume in neutral conditions along measurement plane
Flux measurement plane
Neutral Stability
Wind
Source: Lowry Harper USDA-ARS, 2004
ponds sheds
ponds
sheds
15 m
5 m
25 m
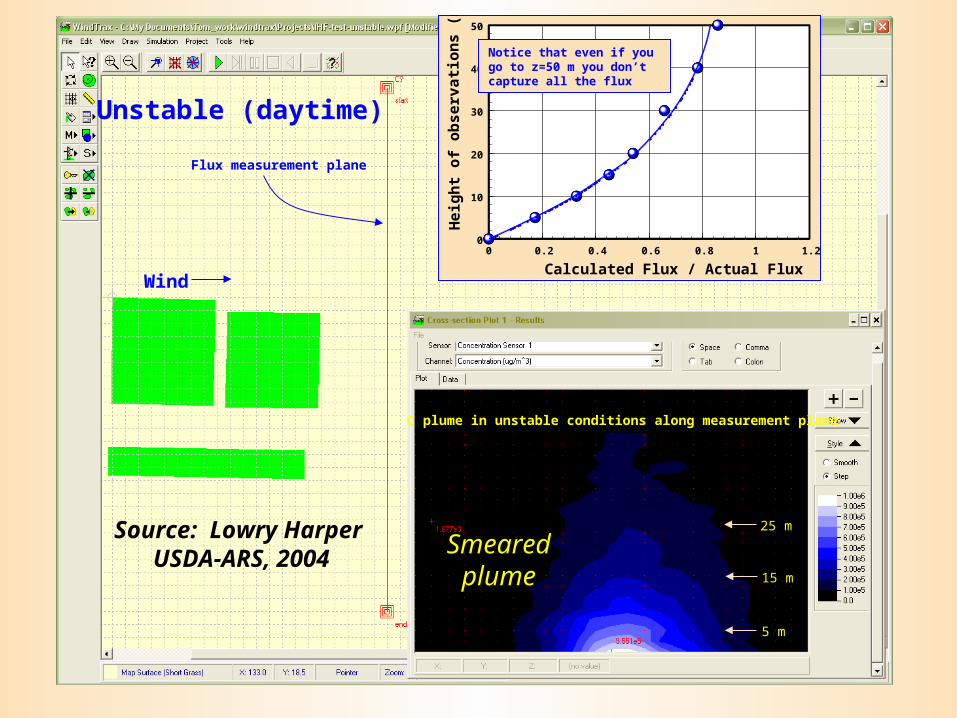
C plume in unstable conditions along measurement plane
Flux measurement plane
0 0.2 0.4 0.6 0.8 1 1.2
Calculated Flux / Actual Flux
0
10
20
30
40
50
Hei
gh
t o
f o
bse
rvat
ion
s (m
)
Notice that even if you go to z=50 m you don’t capture all the flux
Unstable (daytime)
Wind
Source: Lowry Harper USDA-ARS, 2004
Smearedplume
15 m
5 m
25 m
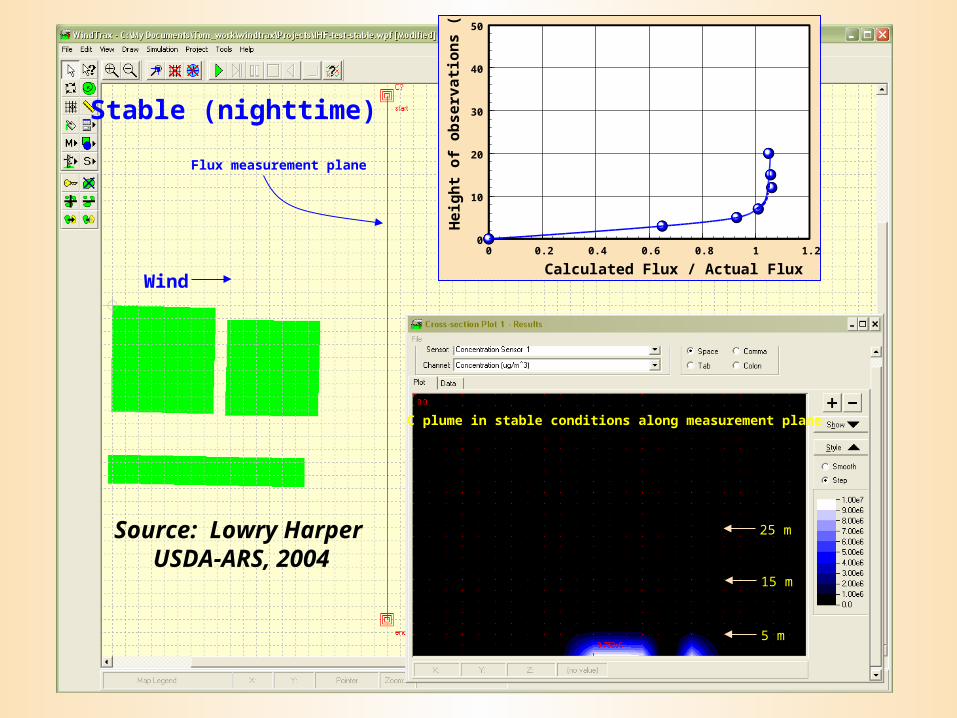
C plume in stable conditions along measurement plane
Flux measurement plane
0 0.2 0.4 0.6 0.8 1 1.2
Calculated Flux / Actual Flux
0
10
20
30
40
50
Hei
gh
t o
f o
bse
rvat
ion
s (m
)
Stable (nighttime)
Wind
Source: Lowry Harper USDA-ARS, 2004
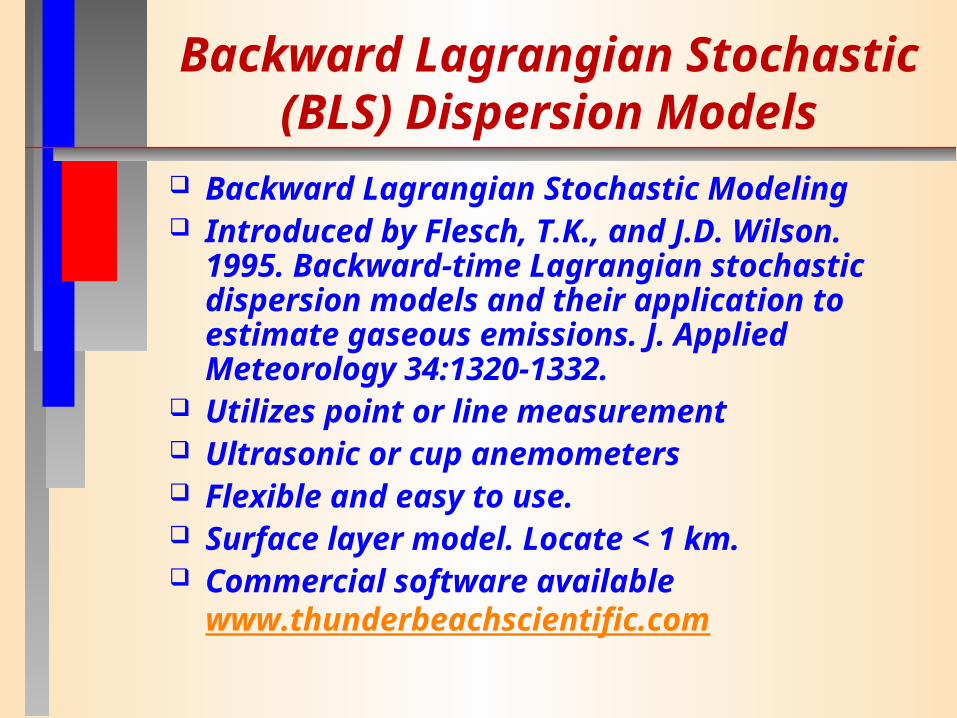
Backward Lagrangian Stochastic (BLS) Dispersion Models
Backward Lagrangian Stochastic Modeling Introduced by Flesch, T.K., and J.D. Wilson.
1995. Backward-time Lagrangian stochastic dispersion models and their application to estimate gaseous emissions. J. Applied Meteorology 34:1320-1332.
Utilizes point or line measurement Ultrasonic or cup anemometers Flexible and easy to use. Surface layer model. Locate < 1 km. Commercial software available
www.thunderbeachscientific.com

UV-DOAS
Ultraviolet Differential Optical Absorption Spectroscopy
1-1000 ppb path length Fast scanning, compact, tunable EPA Equivalent Method for SO2, O3 and NO2. Also measures ammonia, benzene, toluene,
xylenes, styrene, Hg, HF, HNO2, HCHO Continuous operation MDL for ammonia = 2.8 to 5.8 ppb
Source: Myers, J., T. Kelly, C. Lawrie, and K. Riggs. 2000. ETV Technology Evaluation Report. Opsis, Inc. AR-500 Ultraviolet Open-Path
Monitor. ETV Advanced Monitoring Systems Center, Battelle.
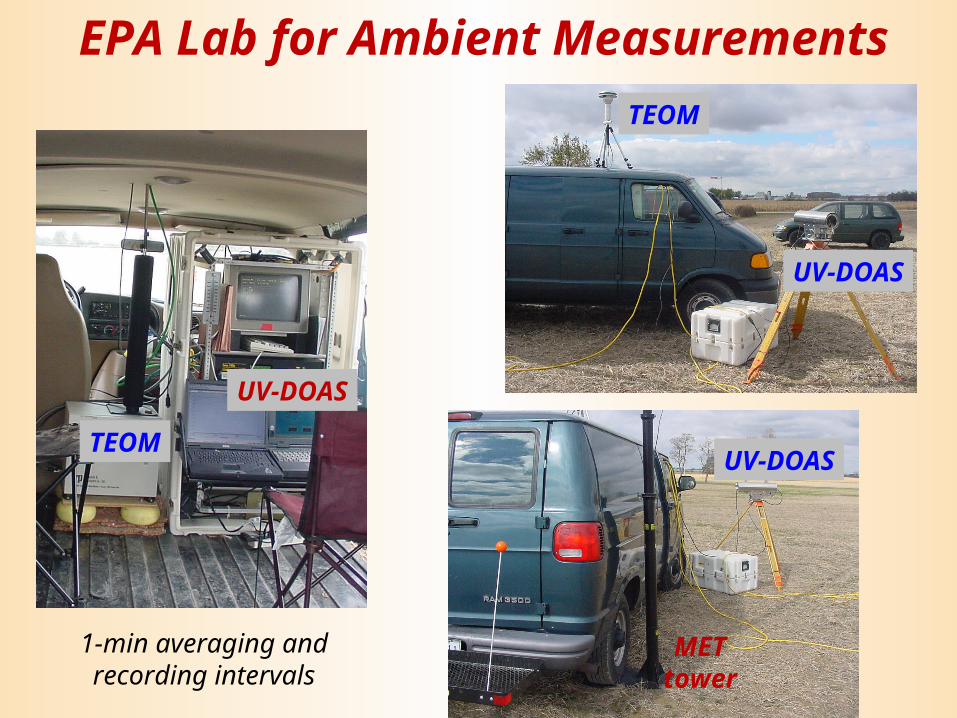
EPA Lab for Ambient Measurements
UV-DOAS
UV-DOAS
UV-DOAS
TEOM
TEOM
METtower
1-min averaging andrecording intervals
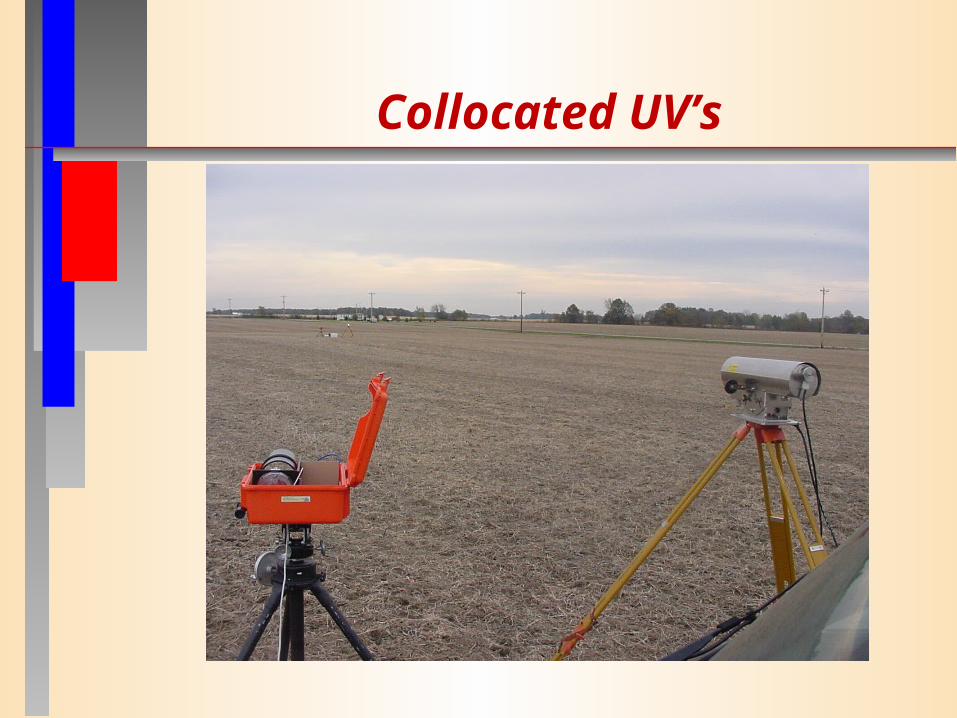
Collocated UV’s
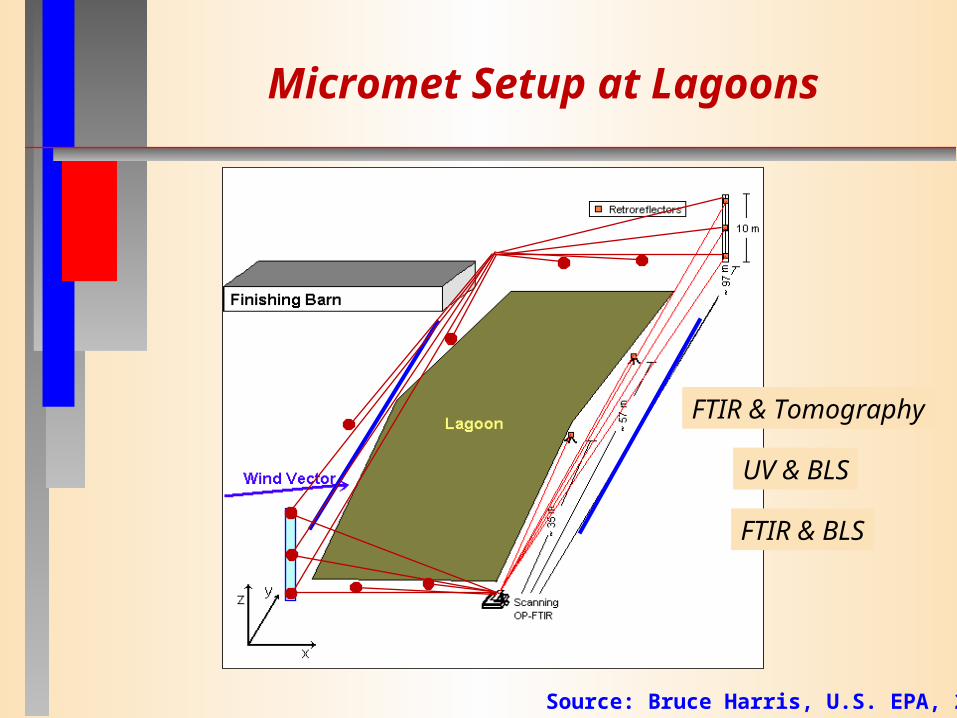
Source: Bruce Harris, U.S. EPA, 2004
Micromet Setup at Lagoons
FTIR & Tomography
UV & BLS
FTIR & BLS

Equipment Required per Team Two FTIR scanning systems with 20 retros Two UV systems Four computers for optical remote sensors One computer for data QAQC and analysis Two 3D ultrasonic anemometers (2 and 12 m) Complete weather station Two, 12-m towers for FTIR/UV systems One, 2 m tower for ultrasonic anemometer Software for computed tomography method Software for BLS method Van and trailer
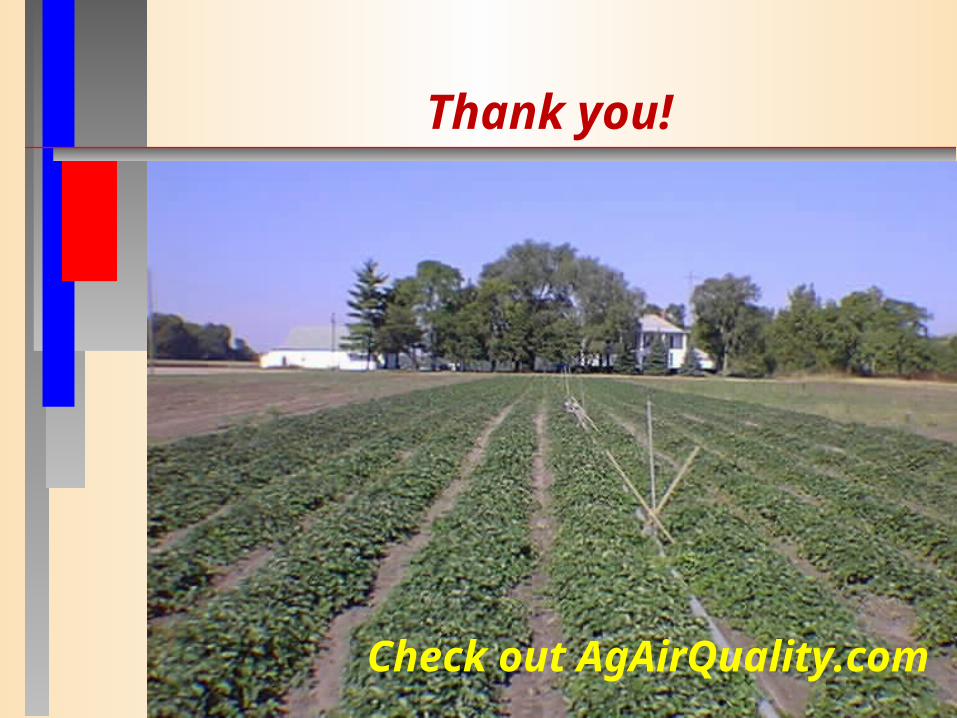
Thank you!
Check out AgAirQuality.com
Related Documents


![Heber Romero ofimaticas]](https://static.cupdf.com/doc/110x72/55ba8babbb61eb360a8b469e/heber-romero-ofimaticas.jpg)