Universal Journal of Environmental Research and Technology All Rights Reserved Euresian Publication © 2013 eISSN 2249 0256 Available Online at: www.environmentaljournal.org Volume 3, Issue 1: 61-71 Open Access Research Article 61 Cara et al. The Water Quality of Devoll and Osum Rivers and Its Impact on the Agricultural Soils Magdalena Cara 1 , Jordan Merkuri 1 , Murtezan Ismaili 2 , Miranda Huta 3 , Bora Qesja 1 1 Agricultural University of Tirana, Albania 2 South East Europe University 3 Centre of Agriculture Technology Transfer, Fushe Kruja Corresponding author: [email protected] Abstract: The Devoll River, one of the sources of Seman River, joins Osum River in the proximity of Kuçova. The above are both used for irrigation purposes. The studies performed (over a period of four years 2003-2006) were aimed at determining the water quality of the Devoll and Osum rivers together with their impact in agriculture. The maximal sodium values recorded in the Devoll and Osum rivers were 1 mg/L (2003) and 0.66 mg/L (2006) respectively. Magnesium levels ranged from 2.67 mg/L (2003) to 2.96 mg/L (2006) with a 4 year average of 2.79 for the Devoll river and 2.02 mg/L (2006) to 3.55 mg/L (2005) with a 4 year average value of 2.57 mg/L for the Osum river. The nutritious elements levels were generally low. The average value of N – NO 3 - recorded in the Devoll waters reached 2.02 mg/L, with a maximal value of 5.88 mg/L (2006). The average value of N - NH 4 + was calculated to be 1.12 mg/L, while the maximal value reached 2.1 mg/L (2006). PO 4 3- and K + had a maximal value of 0.1 mg/L (2005) and 11 mg/L (2006) respectively. The last value was 5.5 times bigger than the allowed one. For the Osum River the maximal values of N - NO 3 - and N – NH 4 + were 9.02 mg/L (2006) and 3.22 mg/L (2006) respectively. The maximal values of PO 4 3- and K + were recorded to be 0.228 mg/L (2004) and 12 mg/L (2006). This maximal value is six times bigger than the allowed value. On average nutrient concentrations were higher in 2006 compared to previously recorded values. These concentration levels, with the exception of K + , were however within the FAO standard levels. Keywords: irrigation, nutrients, parameters, soil, water quality 1.0 Introduction: The hydrographical territory of Albania is approximately 44,000 km 2 or 57% more than the national space of our country. The average altitude of this territory is over 700 m above the sea level. Rivers have always been the most important freshwater resources. They find multiple uses in agriculture, industry, transportation, aquaculture, public water supply etc. (Ravindra et.al, 2003). The multiannual average discharge of Albanian rivers is about 1,245 m 3 /s. All the rivers flow in the sea direction with about 40 billion m 3 water/year (AKBN, 2010). Devoll and Osum rivers are the main afluents of the Seman River. Their watershed areas are 3130 km 2 and 2150 km 2 respectively (Pano, 2008). With their geographic positions, both rivers have been used for irrigation purposes and have been a great part of agricultural and environmental strategies in our country. The soil and water quality play a prominent role in the irrigation process. If they were not to be compatible with one another, the watering process might have a negative impact on the physical – chemical abilities of the soil. The estimation of water quality is based on salinity, sodium and toxicity of chemical elements (Goel 2006). Salinity is the most important criterion for evaluating irrigation water quality (Ghassemi, et al., 1995). High salt concentrations prevent the uptake of water by plants causing crop–yield reductions. This occurs when salts accumulate in the root zone to such an extent that the crop is no longer able to extract sufficient water from the salty soil solution, resulting in water stress for a significant period (FAO, 1994).

Welcome message from author
This document is posted to help you gain knowledge. Please leave a comment to let me know what you think about it! Share it to your friends and learn new things together.
Transcript

Universal Journal of Environmental Research and Technology
All Rights Reserved Euresian Publication © 2013 eISSN 2249 0256
Available Online at: www.environmentaljournal.org
Volume 3, Issue 1: 61-71
Open Access Research Article
61
Cara et al.
The Water Quality of Devoll and Osum Rivers and Its
Impact on the Agricultural Soils
Magdalena Cara1, Jordan Merkuri
1, Murtezan Ismaili
2, Miranda Huta
3, Bora Qesja
1
1Agricultural University of Tirana, Albania
2South East Europe University
3Centre of Agriculture Technology Transfer, Fushe Kruja
Corresponding author: [email protected]
Abstract: The Devoll River, one of the sources of Seman River, joins Osum River in the proximity of Kuçova. The above are
both used for irrigation purposes. The studies performed (over a period of four years 2003-2006) were aimed at
determining the water quality of the Devoll and Osum rivers together with their impact in agriculture. The
maximal sodium values recorded in the Devoll and Osum rivers were 1 mg/L (2003) and 0.66 mg/L (2006)
respectively. Magnesium levels ranged from 2.67 mg/L (2003) to 2.96 mg/L (2006) with a 4 year average of 2.79
for the Devoll river and 2.02 mg/L (2006) to 3.55 mg/L (2005) with a 4 year average value of 2.57 mg/L for the
Osum river. The nutritious elements levels were generally low. The average value of N – NO3- recorded in the
Devoll waters reached 2.02 mg/L, with a maximal value of 5.88 mg/L (2006). The average value of N - NH4+ was
calculated to be 1.12 mg/L, while the maximal value reached 2.1 mg/L (2006). PO43-
and K+ had a maximal value
of 0.1 mg/L (2005) and 11 mg/L (2006) respectively. The last value was 5.5 times bigger than the allowed one.
For the Osum River the maximal values of N - NO3- and N – NH4
+ were 9.02 mg/L (2006) and 3.22 mg/L (2006)
respectively. The maximal values of PO43-
and K+
were recorded to be 0.228 mg/L (2004) and 12 mg/L (2006). This
maximal value is six times bigger than the allowed value. On average nutrient concentrations were higher in
2006 compared to previously recorded values. These concentration levels, with the exception of K+, were
however within the FAO standard levels.
Keywords: irrigation, nutrients, parameters, soil, water quality
1.0 Introduction: The hydrographical territory of Albania is
approximately 44,000 km2 or 57% more than the
national space of our country. The average altitude
of this territory is over 700 m above the sea level.
Rivers have always been the most important
freshwater resources. They find multiple uses in
agriculture, industry, transportation, aquaculture,
public water supply etc. (Ravindra et.al, 2003). The
multiannual average discharge of Albanian rivers is
about 1,245 m3/s. All the rivers flow in the sea
direction with about 40 billion m3 water/year (AKBN,
2010).
Devoll and Osum rivers are the main afluents of the
Seman River. Their watershed areas are 3130 km2
and 2150 km2 respectively (Pano, 2008). With their
geographic positions, both rivers have been used for
irrigation purposes and have been a great part of
agricultural and environmental strategies in our
country.
The soil and water quality play a prominent role in
the irrigation process. If they were not to be
compatible with one another, the watering process
might have a negative impact on the physical –
chemical abilities of the soil. The estimation of water
quality is based on salinity, sodium and toxicity of
chemical elements (Goel 2006). Salinity is the most
important criterion for evaluating irrigation water
quality (Ghassemi, et al., 1995). High salt
concentrations prevent the uptake of water by
plants causing crop–yield reductions. This occurs
when salts accumulate in the root zone to such an
extent that the crop is no longer able to extract
sufficient water from the salty soil solution, resulting
in water stress for a significant period (FAO, 1994).

Universal Journal of Environmental Research and Technology
62
Cara et al.
Salt concentration can exert an effect or prohibit and
delay plant growth. (Rhades, 1977; Raymond et al.,
1995). The irrigation process with low quality water
generally does not represent an immediate damage
to the plant. However, the damage is inflicted in the
long run, as the salts or water sodium will be
accumulated in the soil and lowers its productivity.
Regardless of the effects of the hydrochemistry of
the Devoll and Osum Rivers, there are no previous
studies analyzing the physico-chemical parameters,
nutrients, salinity etc. of the water of the two rivers.
Moreover, there exist no evaluations of the effects
the latter can have on the soil and cultivated
vegetation. The object of the study is to analyze the
water quality of the Devoll and Osum rivers. The aim
of the study is to assess their impact on agricultural
lands and to recommend plants that are more
suitable for cultivation.
2.0 Materials and Methods: The Osum and Devoll rivers and the agricultural soils
adjacent to them were monitored for a period of
four years (2003 – 2006).
2.1 The Investigated Area Albania has a mediterranean climate, with a
relatively short and soft winter and with a hot and
very dry summer. Albania's climate is very different
depending on the region with contrasts in
temperature, precipitation, sunshine, air humidity,
etc. Albania comprises a very concetrated river
network. The upper flow has a mountanous
character, is fast and erosive, whereas the lower
flows have a field character. The Devoll River (196
km) has its sourse at the foundations of the Gramoz
Mountain. It continues its flow north to the city of
Bilisht, returning then west through the valley
between the Dry Mountain north and that of
Morava in the south, where it joins river Osum
(which flows too from the Gramoz Mountain).
Together they form the Seman River. The water
gathering surface of the Devoll River is 3.130 km².
The average discharge is around 49.5 m³/s. The
Osum River is 161 km, with a water gathering
surface of 2.150 km2, average altitude of 828 m and
average multiannual discharge of 32.5 m3/s. Both
rivers have an important impact on agriculture.
Figure 1. Map of area under investigation
Figures 2 and 3. Areas of samples collection
Figure 4. Devoll River, sampling place
Figure 5. Devoll River, sampling place
Figure 6. Osum River, sampling place
Figure 7. Osum River, sampling place

Universal Journal of Environmental Research and Technology
63
Cara et al.
2.3 Samples and Analytical Methods The locations used for sampling are located in:
Murras – Elbasan, Fushë – Devoll, Devoll – Korçë dhe
Berat. The collection of water samples has been
done conforming to standard methods ISO 5667 -
3:200. The collection of soil samples has been done
conforming to standard methods ISO 10381-1993.
Concerning the measurements, contemporary
methods were used: spectrometric and standard
classical methods. The determination of the
exchange cation capacity has been done with the
employment of the methodics ISO 11260-94. Nitrate,
ammonium, phosphate etc., levels were analyzed
according to the standard methods described by
APHA, 1998 & Rodier 1984. Samples for cations
(calcium, magnesium) were analyzed by atomic
absorbance spectrophotometry, while sodium was
measured by flame photometry. Bicarbonate level
was determined by the acid titration method while
the organic matter was determined by the
permanganate oxidation method (Golterman, 1978).
The physico-chemical parameters such as pH and
temperature were measured in the field using a pH
meter while the conductivity of water was measured
by a conductivity meter.
The soil samples tested were implemented
according to ISO 10381-1993 method standard. For
parameter measures, the contemporary methods of
determination such as: Spectroscopy of Atomic
Absorption method and interfrequently classical
standard methods of analysis were used. The
determination of effective cathion exchange,
capacity and base saturation level was achieved via
the usage of a barium chloride solution ISO 11260-94.
The soil quality sampling was implemented
according to ISO 5667 -1-1980. The water samples
were analyzed according to the salt contents, pH,
electrical conductivity, kations, anions (Ca2+
, Mg2+
,
Na+, CO3
2-, HCO3
-, Cl
-, SO4
2-), nutritious elements
(NO3- , NH4
+, PO4
3-, K
+), acidity, ratio of sodium
absorption, dry residue and heavy metals (Zn, Pb,
Mn, Fe, Cu, Cr).
The SAR (Sodium Absorption Ratio) parameter
evaluates the sodium hazard in relation to calcium
and magnesium concentrations (Richards 1954). SAR
was calculated using the following formula:
[Na
+], [Ca
2+], dhe [Mg
2+] are the concentrations in
mmol/L of sodium, calcium dhe magnezium ions in
the soil solution. The Na+, Ca
2+ dhe Mg
2+ ion
concentrations were determined by extracting the
ions from the soil in the solution and using the
Spectroscopy of Atomic Absorption. When SAR
increases over 12 – 15, there are serious physical
problems and furthermore plants show difficulties in
the absorption of water.
3.0 Results and Discussion The results of the parameters are presented on
Tables (1 - 7) and Graphics (1 – 9).
3.1 The pH Measurement For Devoll and Osum Rivers, the analyzed water
samples had pH values of 7.2 – 7.7 and 7.1-7.9
respectively (Table 1 and 2). Conforming to the FAO
specifications, the most adequate pH intervals on
irrigation waters are 6.0-8.5, (Ayers et.al. 1976,
1885, 1994) whereas conforming to the Irrigation
water quality criteria pH = 5 - 7 (Bradli 1998, 2000)
intervals are recommended.
3.2 Electric Conductivity (EC) The average electric conductivity of the water
samples collected in the Devoll River in the
monitored years 2003-2006 has been 0.48-0.65 dSm-
1 while for the Osum river 0.45-0.53 dSm
-1 (Table 1
and 2). The salinity tolerance of plants is related to
the salinity of the soil, described as EC. EC is directly
related to the concentration of ions dissolved in the
water. All the collected water samples (Figures 3 and
4, Devoll River and Figures 5 and 6, Osum River)
were of no salinity, i.e. have no negative effect on
the agricultural soil and its cultivated plants.
3.3 The Dry Residue The values of dry residue for the waters of the Devoll
River are 0.189 g/L (2005) in 0.508 g/L (2003) with
an average value of 0.324 g/L and for Osum River are
0.106 g/L (2005) in 0.316 g/L with an average value
of 0.241 g/L, (Table 1 and 2).

Universal Journal of Environmental Research and Technology
64
Cara et al.
Table 1. Physico-Chemical Parameters of Devoll River in the samples collected during 2003 - 2006.
Parameters Units Intervals 2003 2004 2005 2006
pH - log [ H+] 6.0 - 8.5 7.2 7.7 7.4 7.5
Conductivity
(ECW)
(dS/m) 0 – 3 0.65 0.48 0.52 0.57
Dry residue g/l 0.25 0.32 0.11 0.29
SAR m.e/l 0 – 15 0.64 0.39 0.23 0.30
Table 2. Physico-Chemical Parameters of Osum River in the samples collected during 2003 - 2006.
Parameters Units Intervals 2003 2004 2005 2006
pH - log [ H+] 6.0 - 8.5 7.1 7.9 7.1 7.1
Conductivity
(ECW)
(dS/m) 0 – 3 0.47 0.45 0.46 0.53
Dry residue gr/l 0.25 0.32 0.11 0.29
SAR m.e/l 0 – 15 0.44 0.39 0.25 0.38
Table 3. Nutrient Levels in the Devoll River Samples 2003 – 2006.
Nutrients Units Intervals 2003 2004 2005 2006
N- NO3
-
mg/l 0-10 0.28 0.56 1.34 5.88
N- NH4
+
mg/l 0-5 0.7 0.28 1.4 2.1
PO4
3-
mg/l 0-2 0.066 0.074 0.100 0.042
K
+
mg/l 0-2 5.42 2.761 1.668 11
Table 4. Nutrient Levels in the Osum River Samples 2003 – 2006.
Nutrients Units Intervals 2003 2004 2005 2006
N- NO3
-
mg/l 0-10 0.14 0.56 2.8 9.02
N- NH4
+
mg/l 0-5 - 0.28 1.26 3.22
PO4
3-
mg/l 0-2 0.108 0.228 0.154 0.015
K
+
mg/l 0-2 2.63 1.881 1.356 12

Universal Journal of Environmental Research and Technology
65
Cara et al.
Graph 1. Cations in mg/L River Devoll (2003 – 2006)
Graph 2. Cations in mg/L River Osum (2003 – 2006)
3.4 Sodium The sodium values wereas follows: minimal values of
0.37 mg/L (2005) in the Devoll River with a maximal
value of 1 mg/L (2003). In the Osum River the
minimal values were 0.43 mg/L (2005) and the
maximal values 0.66 mg/L (2006). High
concentration of ions Na+ in water is undesirable
because Na interferes with other ions absorption,
destroying the soil structure, closing the soil pores
and reducing the water flowing (Laze et al., 2002). The medium and high levels of sodium in water
could become toxic for some sensitive plants (fruit
trees or ornamental plants).
3.5 Calcium and Magnezium The calcium concentration in the Devoll waters was
1.92 mg/L (min value, 2004) and 4.55 mg/L (max
value, 2006) (Graph.1). The average value for the 4
years duration was 2.77 mg/L. The calcium
concentration in the Osum waters was 1.52 mg/L
(min value, 2004) and 3.99 mg/L (max value, 2006),
(Graph.2). The average value was 2.44 mg/L. For
magnezium the concentration in the Devoll river
varied from 2.67 mg/L (2003) to 2.96 mg/L (2006)
with a 4 year average of 2.79; for the Osum River it
varied from 2.02 mg/L (2006) to 3.55 mg/L (2005)
(Graph.2) with a 4 year average value of 2.57 mg/L.
The values of SAR (Sodium Absorption Ratio) are
shown in tables 1 and 2. They range from 0,23 – 0,64
m.e./L for Devoll River and from 0,25 – 0,44 m.e./L
for Osum River. The medium and high levels of
calcium and magnezium in water could become toxic
for some sensitive plants.
3.6 Anion Concentration The anion levels in water were as follows: the

Universal Journal of Environmental Research and Technology
66
Cara et al.
sulphate ions concentration in the Devoll river was
0.2 (min values) and 9.79 mg/L (max value) for 2003
and 2004 respectively. The measured minimal and
maximal values are shown Graph 3. In the Osum
River, the concentrations of the carbonate ions,
hidrogen carbonates and chlorine are presented in
Graph 4. A high value of hydrogen carbonates in
water value leads to an increase in the adsorption of
sodium on soil. Irrigation water having hydrogen
carbonates values greater than 5 has been
considered harmful to the growth of plants. Water
with hydrogen carbonates values above 2.5 is not
considered suitable for irrigation purposes, and
water with hydrogen carbonates values less than
1.25 is considered safe. (Yang et.al 2012). Chlorides
are important inorganic anions which contain
varying concentrations in natural waters (Makhoukh
et. al 2011). Chlorides are troublesome in irrigation
water and also harmful to aquatic life (Rajkumar
et.al 2004).
Graph. 3. Anions in mg/L River Devoll (2003 – 2006)
Graph 4. Anions in mg/L River Osum (2003 – 2006)
3.7 Nutritious Elements The nutritious element levels are generally low for N
- NO3- in the Devoll waters with the average value
being 2.02 mg/L. The minimal measured value was
0.28 mg/L (2003) and the maximal one was 5.88
mg/L (2006). All the water samples had higher NO3-
levels, but less than the 10 mg/L limit calculated as N.
Nitrate is an acute contaminant, which means that a
single exposure can affect the health of people.
(Fraser and Chilvers 1981). For N - NH4+, the average
value was 1.12 mg/L, the minimal value 0.28 mg/L
(2004) and the maximal value was 2.1 (2006). The
average value for PO43-
was 0.071 mg/L, the minimal
value was 0.042 mg/L (2006) and the maximal value
0.1 mg/L (2005). For K+ the average value was
5.11mg/L, the minimal value 1.67 mg/L (2005) and
the maximal value 11 mg/L (2006). This maximal
value is 5.5 times bigger than the allowed value

Universal Journal of Environmental Research and Technology
67
Cara et al.
(Table 3). For the Osum River, the average value for
N - NO3- was 2.93 mg/L, the minimal measured value
0.14 mg/L (2003) and the maximal value was 9.02
mg/L (2006). For N - NH4+, the average value was
1.57 mg/L, the minimal value 0.28 mg/L (2004) and
the maximal value was 3.22 (2006). For PO43-
the
average value was 0.126 mg/L, the minimal value
0.015 mg/L (2006) and the maximal value 0.228
mg/L (2004). The average value for K+ was 4.47 mg/L,
the minimal value reached 1.88 mg/L (2004) and the
maximal value was 12 mg/L (2006). This maximal
value is 6 times bigger than the allowed value (Table
4). Nutrients can play a role in toughening up the
plant to make it more resistant to dry conditions,
disease and wear. For example, sufficient potassium
encourages the thickening of cell walls in turf leaves,
toughening the plant so it becomes more wear
resistant (Handreck and Black 2002). With the only
expection of Potasium, the nutrient levels in the
waters of Osum and Devoll in all samples taken
during 2004 – 2006 result in the status “bad” or
“very bad” conforming to the NIVA classification.
(Bratli, 1998 and 2000).
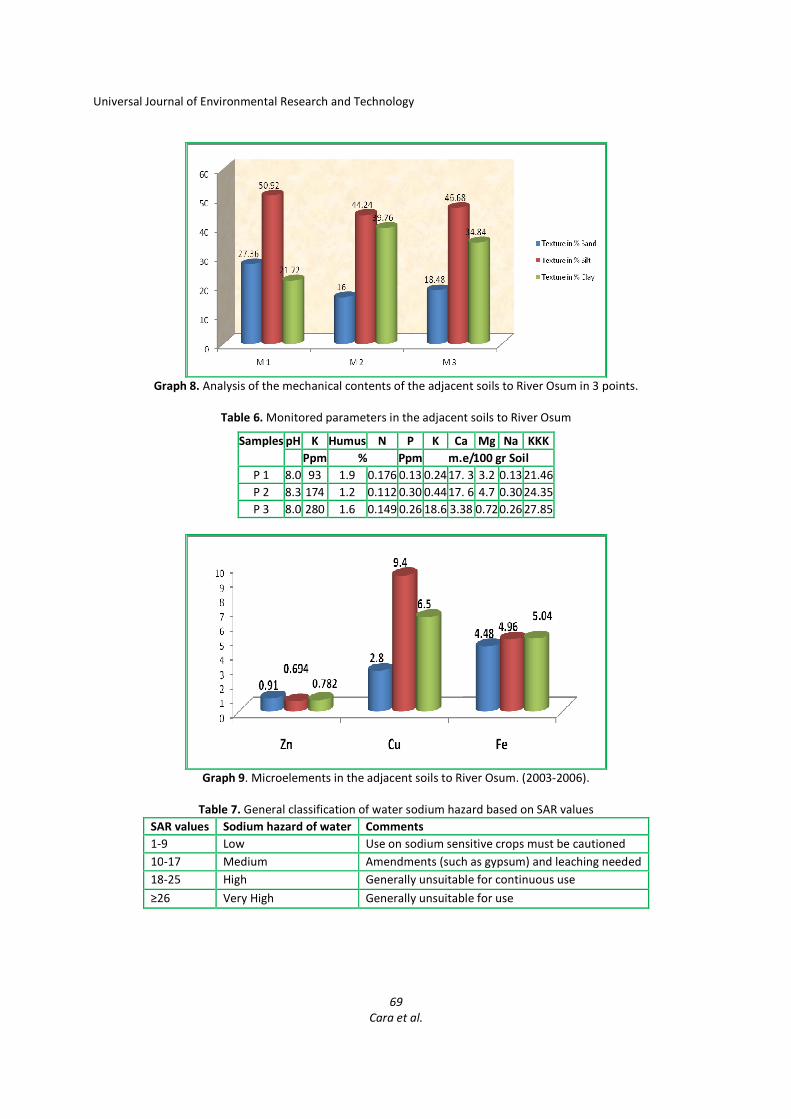
3.8 Soil Samples The soil texture results are presented in Graph 5, for
the soil adjacent to the Devoll River, and in Graph 8,
for those adjacent to River Osum. It can be noticed
from the charts, that the texture of these soils is
respectively silty – sandy – clay and silty – clay –
sandy. Referring to the conductivity EC (ds/m),
Tables 1 and 2, plants that should be cultivated in
these areas are recommended for salinity ranging
from “low” to “averagely sensitive plants” according
to Table 8.
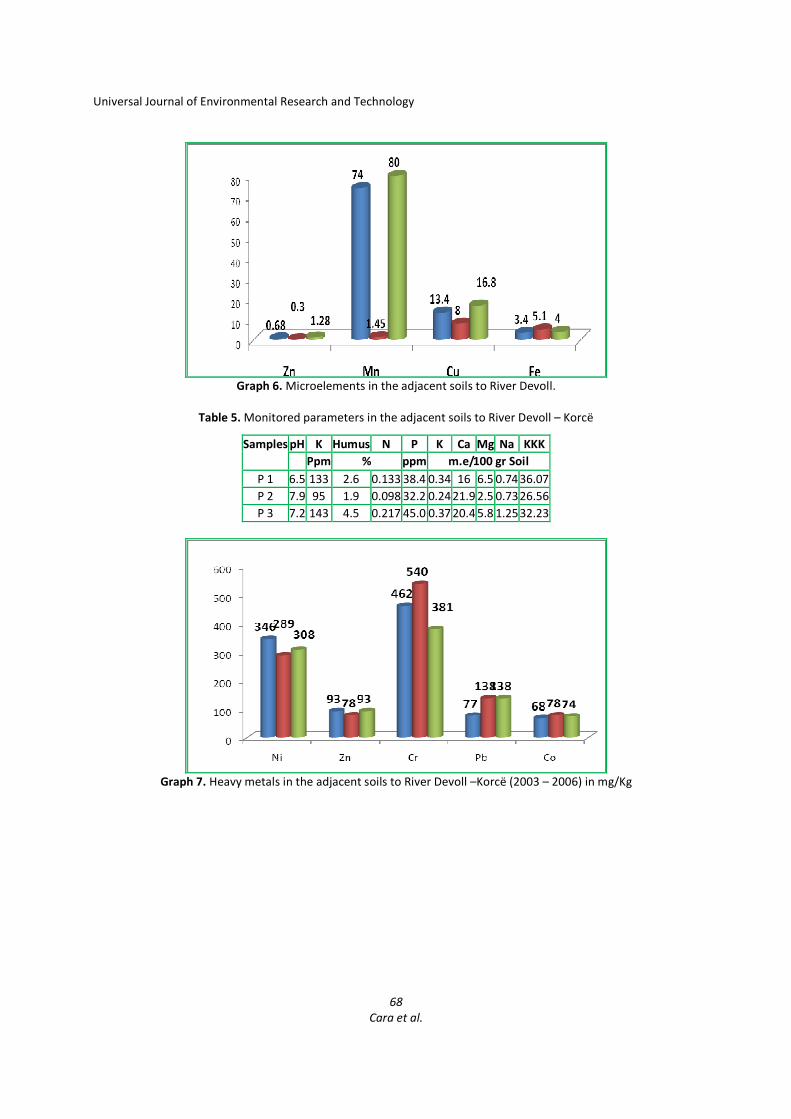
The heavy metals and microelements in both rivers
have not reached disturbing levels (Graph 6, 7 and 9).
Magnesium, an essential nutrient for plants as well
as for animals, is washed from rocks (dolomite,
magnesite, etc.) and subsequently ends up in water,
being also responsible for water hardness. (Trivedi et.
al 2009). Such soils tend to have a relatively high pH
(approximately 7–10), as sodium carbonate is much
more soluble than calcium or magnesium carbonates;
As a result, higher concentrations of carbonate and
bicarbonate are maintained in sodic soil solutions
(Rengasamy and Olsson 1991, Brady and Weil 1999).
Rivers contain approximately 4 mg/L of magnesium
and a concentration of 30 and 50 mg/L is
recommended for drinking waters in EPA (U.S. EPA)
2002.
Graph 5. Texture analysis of adjacent soil to River Devoll.
Universal Journal of Environmental Research and Technology
68
Cara et al.
Graph 6. Microelements in the adjacent soils to River Devoll.
Table 5. Monitored parameters in the adjacent soils to River Devoll – Korcë
Samples pH K Humus N P K Ca Mg Na KKK
Ppm % ppm m.e/100 gr Soil
P 1 6.5 133 2.6 0.133 38.4 0.34 16 6.5 0.74 36.07
P 2 7.9 95 1.9 0.098 32.2 0.2421.9 2.5 0.7326.56
P 3 7.2 143 4.5 0.217 45.0 0.37 20.4 5.8 1.2532.23
Graph 7. Heavy metals in the adjacent soils to River Devoll –Korcë (2003 – 2006) in mg/Kg
Universal Journal of Environmental Research and Technology
69
Cara et al.
Graph 8. Analysis of the mechanical contents of the adjacent soils to River Osum in 3 points.
Table 6. Monitored parameters in the adjacent soils to River Osum
Samples pH K Humus N P K Ca Mg Na KKK
Ppm % Ppm m.e/100 gr Soil
P 1 8.0 93 1.9 0.176 0.13 0.2417. 3 3.2 0.13 21.46
P 2 8.3 174 1.2 0.112 0.30 0.4417. 6 4.7 0.30 24.35
P 3 8.0 280 1.6 0.149 0.26 18.6 3.38 0.720.26 27.85
Graph 9. Microelements in the adjacent soils to River Osum. (2003-2006).
Table 7. General classification of water sodium hazard based on SAR values
SAR values Sodium hazard of water Comments
1-9 Low Use on sodium sensitive crops must be cautioned
10-17 Medium Amendments (such as gypsum) and leaching needed
18-25 High Generally unsuitable for continuous use
≥26 Very High Generally unsuitable for use

Universal Journal of Environmental Research and Technology
70
Cara et al.
Table 8. Soil and water salinity criteria based on plant salt tolerance groupings
Plant salt tolerance
Grouping
Water or soil
salinity rating
Average root zone s
alinity EC (dS/m)
Sensitive crops
Moderately sensitive crops
Moderately tolerant crops
Tolerant crops
Very tolerant crops
Generally too saline
Very low
Low
Medium
High
Very high
Extreme
<0.95
0.95 – 1.9
1.9 – 4.5
4.5 – 7.7
7.7 – 12.2
>12.2
4.0 Conclusion: The water quality was assessed with respect to its
suitability for irrigation activities. Based on the results,
it can be concluded that the water quality is relatively
good. Hydrogen carbonate was the dominant anion,
while sodium and calcium were the dominant cations
in most rivers samples. The main anion differences
are that in river water HCO3- has a much higher
concentration than Cl- (which has the lowest
concentration out of the major anions in river water).
The chemical composition of the river water showed
that HCO3¯ and SO42-
were the most abundant anions
while Ca2+
the most abundant cation. High content of
bicarbonate and calcium in river sites confirm the fact
that 98% of all river waters was of the calcium
carbonate type (Ramesh, R. 1989). Calcium,
Magnesium and Bicarbonate are contributed to river
water mostly by rock weathering. Calcium is the main
cation in river water, followed by Mg and Na, then K.
Water chemistry of the rivers can reflect changes in
their watersheds, making rivers good indicators of
land use (Meybeck and Helmer 1989). According to
the Richards (1954), the low to medium SAR of rivers
makes it suitable for irrigation of most crops with
little danger of development of exchangeable sodium
and salinity, although few of hard water can have high
EC in the Devoll and Osum River. Referring to
different guides and standards of FAO, EU and the
U.S., not only the physical/chemical water conditions
and their impact on land were determined, but also
the required plants that can be grown in those
characteristiced soils ca be recommended. Analysis
performed (texture) in our land have shown a
relatively light silt-sand soil (Hameed et.al.1966). In
general these soils have deficiency in nourishing
elements. Sulfate in water exists as negatively
charged ions. It contributes to the total salt contents.
The principal component regulating ion pH in natural
waters is the carbonate, which comprises CO2, H2CO3
(Larpent, 1997). Low values in pH are indicative of
high acidity, which can be caused by the deposition of
acid forming substances in precipitation. A high
organic content will tend to decrease the pH because
of the carbonate chemistry. A neutral pH in the
interval (6.5–8.5) characterizes water where life
develops in an optimal way (Bhatt, 1999). According
to water analysis, the pH has resulted relatively
neutral with a very slight tendency basic.
Physicochemical parameters were used to evaluate
the quality of river water for determining its
suitability for irrigation purposes. Calculated values of
SAR indicate that most of river water is suitable for
irrigation of most crops. Systematic monitoring
programs are urgently needed in order to understand
and evaluate the actual state and water quality of
these rivers and also to determine the main pollution
sources and the irrigation potential (Cuena 1989).
References: 1) Agjencia Kombëtare e Burimeve Natyrore
(AKBN), Burimet Hidroenergjetike. (2010). f. 239
dhe 244.
2) APHA, (1998) Standard Methods for the Examination
of Water and Wastewater, American Public Health
Association, Washington, DC, USA, 18th edition.
3) Ayers, R.S. & D.W. Westcott. (1976). Water
Quality for Agriculture. Irrigation and Drainage
Paper No. 29. Food and Agriculture Organization
of the United Nations. Rome. p. 89-92.
4) Ayers, R.S., Westcott, D.W., (1985). Water Quality
for Agriculture. FAO Irrigation and Drainage
Paper 29 rev. 1, Rome, 174 pp.
5) Ayers, et.al. (1994). Guidelines for interpretation
of irrigation water quality problem. (R.S. FAO
irrigation and drainage paper, 1994)
6) Bhatt L. R., Lacoul P., Lekhak H. D., and Jha P. K.,
(1999) “Physico-chemical characteristics and
phytoplanktons of Taudaha lake, Kathmandu”
Pollution Research, vol. 18, no. 4, pp. 353–358.
7) Brady NC, Weil RR (1999) ‘The Nature and Properties
of Soils.’ (Prentice Hall: Upper Saddle River, New
Jersey).
Universal Journal of Environmental Research and Technology
71
Cara et al.
8) Bratli, J. L. (1998). Auditing of the agricultural
sector. Effect of pollution measures. Measured
and modeled inputs of nutrients. Water quality
status for main rivers. Norwegian Institute for
Water Research. Oslo, Norway.
9) Bratli L.J. (2000). Classification of the
environmental quality of freshwater in Norway. p
335-340 Follett, R.H. and Soltanpour, P.N.1999.
Irrigation water quality criteria. No.
0.506. Colorado State University Cooperative
Extension. 3/99.
10) Cuena, R.H. (1989). Irrigation System Design.
Prentice Hall, Englewood Cliffs, NJ. 552 pp.
11) FAO. (1994). Water quality for agriculture. FAO
Irrigation and drainage paper. 29 Rev.1. Rome.
12) Fraser P, Chilvers C (1981) Health aspects of
nitrate in drinking water. Sci Total Environ
18:103–116.
13) Ghassemi, F., Jakeman, A.J. & Nix, H.A. (1995).
Salinization of Land and Water Resources. Human
causes, extent, management and case studies.
Center for Resource and Environmental Studies.
Canberra, Australian National University.
14) Goel P.K., (2006). Water Pollution, Cause, and
effects and control Second revised Edition, New
Age international Publishers, 2.
15) Golterman H. L., Clymo R. S., and Ohmstad M. A.
M., 1978. Methods for Physical and Chemical
Analysis of Freshwaters, Blackwell Scientific
Publication, Oxford, UK.
16) Handreck K, Black N (2002) ‘Growing media for
ornamental plants and turf.’ (New South Wales
University Press, Kensington.).
17) Hameed, A., M. S. Randawa and K. D. Gowan.
(1966). Appraisal of quality of tube well water of
SCARP-1, WAPDA Lahore, p. 23-25.
18) ISO 10381-6:1993. Soil quality - Sampling - Part 6:
Guidance on the collection, handling and storage
of soil for the assessment of aerobic microbial
processes in the laboratory.
19) ISO 11260:1994. Soil quality - Determination of
effective cation exchange capacity and base
saturation level using barium chloride solution.
20) ISO 5667-3:2003. Water quality - Sampling - Part
3: Guidance on the preservation and handling of
water samples.
21) Larpent J. P. and Larpent-Gourgand M., Mémento
(1997) Technique de Microbiologie, Lavoisier
Tech et Doc, 3rd edition.
22) Laze P., Cara K., Harizaj F., Belalla S. (2002).
Vlerësimi i cilësive së ujrave në disa skema kullimi
dhe ujitje në rrethin e Lushnjës (B. SH. B. Nr. 2).
23) Makhoukh M., Sbaa M., Berrahou A., and Van
Clooster M., (2011). “Contribution à l’étude
physico-chimique des eaux superficielles de
l’Oued Moulouya (Maroc oriental),” Larhyss
Journal, no. 9, pp. 149–169.
24) Meybeck M, Helmer R (1989). The quality of
rivers: from pristinestage to global pollution.
Global and Planetary Change 1:283–309.
25) Raymond W. Miler., Roy. Donhaue.I. (1995). Soil
in our environment (5th edition): 480-486.
26) Rajkumar S., Velmurugan P., Shanthi K.,
Ayyasamy P. M., and Lakshmanaperumalasamy
P., (2004) “Water quality of Kodaikanal lake,”
in Tamilnadu in Relation to Physico-Chemical and
Bacteriological Characteristics, pp. 339–346,
Capital Publishing Company, Lake.
27) Rhades I. D, (1977). Potencial for using saline
agriculture drainage water for irrigation.
28) Ramesh, R. (1989). Chemical composition of the
St. Lawrence River and its controlling factors.
Department of Geological Sciences, McGill
University, Montreal, PQ .
29) Ravindra, K.; Meenakshi, A.; Rani, M.; Kaushik,
(2003). A. J. Environ. Monit. 5, 419–426.
30) Rengasamy P, Olsson KA (1991) Sodicity and soil
structure. Australian Journal of Soil Research
29, 935-952.
31) Richards LA. (1954). Diagnosis and improvement
of saline and alkali soils. U.S. Dept. of Agriculture,
Washington.
32) Rodier J. (1984) L'Analyse de l'Eau: Eaux
Naturelles, Eaux Résiduaires, Eau de Mer, Dunod,
Paris, France, 7th edition.
33) Trivedi, P., Bajpai, A. and Thareja, S. (2009).
Evaluation of Water Quality: Physico – Chemical
Characteristics of Ganga River at Kanpur by using
Correlation Study. Nature and Sci., 1(6):90-94.
34) Pano N. (2008). Pasuritë ujore të Shqipërisë.
Akademia e Shkencave të Shqipërisë. Monografi.
p. 245-247.
35) United States Environmental Protection Agency
(U.S. EPA ). (2002). National Reco- mmended
Water Quality Criteria. Office of Water EPA-822-
R-02-047 Environmental Protection Office of
Science and Technology, November 2002.
36) Yang L., Song X., Zhang Y., Yuan R., Ma Y., Han D.,
Bu H. (2012). A hydrochemical framework and
water quality assessment of river water in the
upper reaches of the Huai River Basin, China
Environ Earth Sci DOI 10.1007/s12665-012-1654-
7 Springer-Verlag.
Related Documents