Large-Scale Oracle RAC (and Sun Oracle Database Machine) Scalability Design Session S314649 Monday, September 20, 2:00PM Oracle Open World Moscone South, Rm 236 San Francisco Christian BILIEN

Welcome message from author
This document is posted to help you gain knowledge. Please leave a comment to let me know what you think about it! Share it to your friends and learn new things together.
Transcript

Large-Scale Oracle RAC (and Sun Oracle Database Machine) Scalability Design
Session S314649 Monday, September 20, 2:00PM Oracle Open WorldMoscone South, Rm 236 San Francisco
Christian BILIEN

2
Large-Scale Oracle RAC (and Exadata) Scalability Design
� Capacity Management: the performance edge
� The cornerstones of data base scalability
� Data Base storage scalability
� I/O time and the physic of distance
� Exadata: a technological leap in capacity management�Brute force scans�Projection�Restriction�Storage indexing�(Bloom) join filter pruning

3
Capacity Management: the performance edge
Scope of Data base Capacity Management
�Hardware
�Software
�Facilities & utility
�Human Resources
Capacity Management is concerned with having the appropriate IT capacity and making the best use of it.
Under capacity causes performance problems Over capacity is expensive and increases the cost of services
Mission of the ITIL Capacity Management process
To ensure best use of the appropriate IT Infrastructure to cost effectively meet business needs by understanding how IT services will be used and matching IT resources to deliver these services at the agreed levels currently and in the future
Objectives of Capacity Management
�Building capacity for new services�Understanding how the infrastructure is being used and how it will be used�Forecasting and planning infrastructure requirements for ongoing IT Service Delivery

4
Capacity Management Strategies
Incidents
CommonPractice
OptimumCapacity
LevelActualGrowth
In Demand
ITIL Capacity Management Strategy assumes forecasting
Q: What if you cannot forecast ?
Q: What if it is too expensive to buy capacity in excess to accommodate fuzzy scenario ?
A: Build for scalability

5
Design for scalability
� Scalable Storage design
� Server Scale out
� Tiered Storage
Resource Management
� Partitioning, Exadata storage indexes
� Compression � Tables cans are faster due to less I/O. Storage array load is reduced.� Hybrid Columnar compressed tables scan is offloaded to the storage cells
� Parallel execution: increase resource usage
� Inefficient processing : Set vs. row for example
� Information Lifecycle Management built into the applications
Demand management
Data Base toolboxScope
From Wikipedia:
Scalability is a desirable property of a system, a network, or a process, which indicates its ability to
either handle growing amounts of work in a graceful manner or to be readily enlarged

6
Storage scalability: host based mirroring
Cornerstones:
� RAC
� ASM (host based replication) : load balancing I/Os across the available arrays instead of a concept of active primary and passive replica
� Virtualization (RAC and RAC 1 node).
Caveats
� Works well on short distance Fiber Channel links between the mirrored arrays
� Writes, which are always duplicated, and load balanced reads across storage arrays can only done when the arrays are not more than a few miles apart from each other.
� But mirroring and restricted load balancing over 20-70 miles stretches can still be achieved with an appropriate design

7
Storage scalability: Host vs. Array based mirroring
1) I/O write received from host/server into cache of source2) I/O is transmitted to the cache of the target3) Receipt acknowledgment is provided by target back to cache of source4) Ending status is presented to host/server
Limited scalability (but other benefits)
� No load balancing across arrays for a single DB� Local RAC only: storage location is a SPOF� Replicated luns cannot be opened � SRDF is a primary bottleneck
� Two round trips to ship a data frame� SRDF ports are common bottlenecks
Storage source Storage target
SRDF links
Source hosts Target
Hosts
EMC DMX Storage array mirroring (synchronous mode)

8
Storage scalability: host based mirroring

9
I/O time and the physic of distance
� Redo log writes� The most sensitive issue. The application waits synchronously on the log file sync event.� The remote cache acknowledges the I/O to the local site to allow the LGWR’s I/O to
complete.
� Db file scattered and sequential reads� There is little chance random reads are in cache: the storage array read cache is unlikely to
provide much value on top of the SGA and possibly the file system buffer cache (depending of FILESYSTEMIO_OPTIONS and file system direct IO mount options). Hence random read times has a greater dependency on storage load than on distance.
� The I/O load on the arrays weight more than the distance factor.� ASM_PREFERRED_READ_FAILURE_GROUP� Oracle direct reads (or direct path reads) are operating system asynchronous reads.
Assuming a well designed backend, you will be able to use a large disk bandwidth to take advantage of large numbers of parallel disk I/O on the two arrays.
� Db file parallel writes and other writes� Asynchronous from the application, and should be asynchronous from the OS� Large I/Os, one single write in the fiber at any given time� Again, the load factor weights more than the distance
Criticityt

10
Log file write time and the physic of distance
Time to write a small synchronous I/O (less than the 2KB Fiber Channel frame size) =
Zero distance I/O completion time + Transfer time
Zero distance I/O completion time is made of :
• A fixed overhead, commonly around 0.5 ms. This represents storage array processor time and any delay on the host ports for the smallest packet. A small frame such as a log write will heavily depend upon the overhead
• The load time, a linear function of the packet size. As the speed of light in a fiber optic cable = 5/6µs/km, the greater the bandwidth, the smaller the packet length, and the smaller the packet load time. At 4Gb/s, a 2KB packet (a possible log write size) = 1km.
• SCSI write data sequence = a minimun of 2 round-trip handshakes between target and initiator.
Transfer time
A one-way trip at 5µs/km2.3128
1.332
12
Time to load (ms)Frame size (k)
zero distance I/O completion time as a function of the frame size
Write
Ready
Datas
Status
SCSI Handshake
Host Storage array
Redo log writes
Other writes

11
Log file write time and the physic of distance
The log file write will only be degraded by about 33% if you increase the Fiber Channel mirror distance from 10 to 100km.
The « overhead » and the time to load play a much greater role than the transfer time in the overall time to complete the log write 20.510.5100
1.70.510.2550
1.60.510.120
1.50.510.0510
Time to complete the log
write
OverheadTime to loadTransfer timeKm
Theoretical time to complete a 2K synchronous write (in ms)
Fig. 2
The « overhead » can vary by an order of magnitude/. Main factors:
• The load on the SAN network (ISL congestion most of the time)
• The rate of incoming writes. I/O will bottleneck if the write rate exceeds the ability of the cache to flush modified blocks.
• The storage array front end processor load
An example of a couple of host ports on an EMC DMX1000 with 2Gb/s host ports. Thanks to Powerpath, the load is well spread over the two ports.

12
Log File Parallel Write time as a function of the distance
Log file Parallel Write (LFPW)
� The LGWR process writes the redo buffer to the online redo logs by issuing a series of system write calls to the operating system. The LGWR process waits for the writes to complete on the LFPW event.
� User sessions do not directly experience the LFPW wait event, but slow LGWR writes will negatively impact the log file sync waits on which user session waits at commit (or rollback)
LFPW System write calls:
� The local and remote arrays must both acknowledge in their cache the scsci calls before returning to the write call.
� Observations
• The LFPW time increase is approximately proportional to the write time increase.
• Increasing the Fiber Channel mirroring from 0 to 100kms means trebling the LFPW time.
8KB writes on a dedicated port
0
0,5
1
1,5
2
0km 10km 20km 30km 40km 50km 60km
Te
mp
s d
e l
'écr
itu
re (
ms)
Log file parallel write
0
5
10
15
20
25
0 kms 10 kms 20 kms 30 kms 40 kms 50 kms 60 kms
Du
rée
de
l'é
vè
ne
me
nt
(ms)
What happened ?

13
Log File Parallel Write time as a function of the distance
Log file parallel write (ms)
0
5
10
15
20
25
0 kms 10
kms
20
kms
30
kms
40
kms
50
kms
60
kms
Ev
en
t d
ura
tio
n
Logs and DB on the same lun
Dedicated lun
Failgroup DATA1_0001 is local.
Failgroup DATA1_0002 is 40 miles away
�Redo logs were on the same ASM disk groups as some data files
�ASM 10g load balances reads between the local failgroup (DATA1_0001) and the remote failgroup (DATA1_0002)
� Read rates (I/Os/s) and throughput (MB/s) are on DATA1_0002 half of DATA1_0001.
� I/Os are queued on the luns. Synchronous writes are queued
Host mirrored redo logs on dedicated luns :
14
Data blocks read/write time as a function of the distance
Db File scattered reads (ms)
0
5
10
15
20
25
0 kms
10 km
s
10 km
s pre
f read
20 km
s
20 km
s pre
f rea
d30 k
ms
30 km
s pre
f read
40 km
s
40 km
s pre
f read
50 km
s
50 km
s pre
f read
60 km
s
60kms p
ref r
ead
Du
rée
de
s le
ctu
res
(ms)
Db file parallel write
0
1
2
3
4
5
6
0 kms 10 kms 20 kms 30 kms 40 kms 50 kms 60 kms
Du
rée
s d
es
écr
itu
res
(ms)
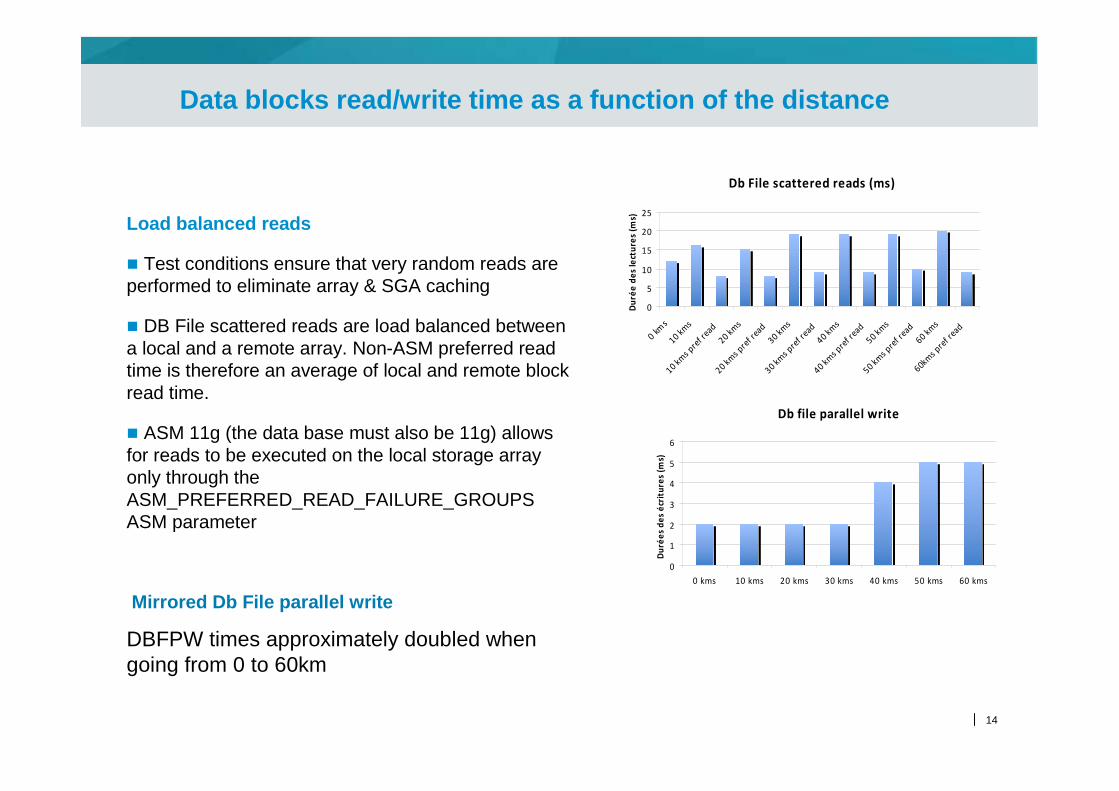
Load balanced reads
� Test conditions ensure that very random reads are performed to eliminate array & SGA caching
� DB File scattered reads are load balanced between a local and a remote array. Non-ASM preferred read time is therefore an average of local and remote block read time.
� ASM 11g (the data base must also be 11g) allows for reads to be executed on the local storage array only through the ASM_PREFERRED_READ_FAILURE_GROUPS ASM parameter
Mirrored Db File parallel write
DBFPW times approximately doubled when going from 0 to 60km
15
The distance factor: conclusions
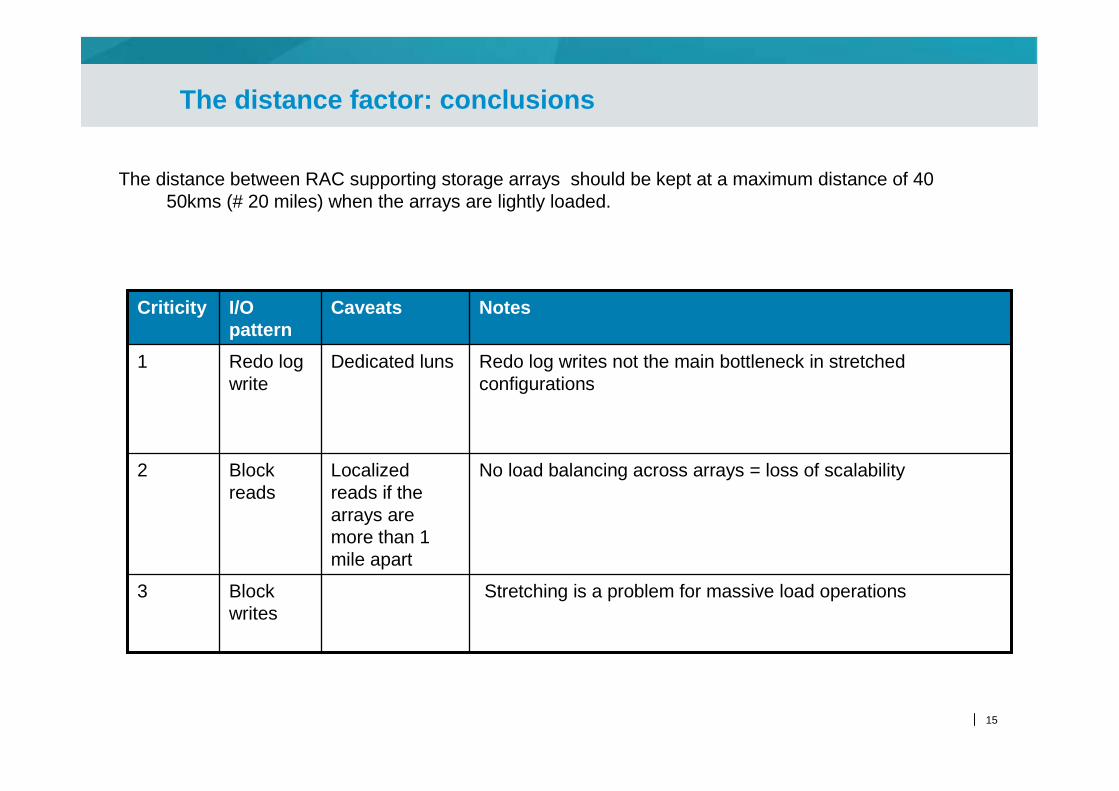
The distance between RAC supporting storage arrays should be kept at a maximum distance of 40 50kms (# 20 miles) when the arrays are lightly loaded.
Stretching is a problem for massive load operationsBlock writes
3
No load balancing across arrays = loss of scalability Localized reads if the arrays are more than 1 mile apart
Block reads
2
Redo log writes not the main bottleneck in stretched configurations
Dedicated lunsRedo log write
1
NotesCaveatsI/O pattern
Criticity

16
Exadata Log File Parallel Write
0.37ms !
This is a 12 SAS cells Exadata replicating to the same configuration across a 10Gb uncongestionedIP link
LNS wait on SENDREQ: This wait event monitors the amount of time spent by all LNS processes to write the received redo to disk as well as open and close the remote archived redo logs.
LGWR-LNS wait on channel: This wait event monitors the amount of time spent by the log writer (LGWR) process or the LNS processes waiting to receive messages.
Can you think of applying an Exadata Data Guard synchronous replication ? No !

17
Exadata: a technological leap in capacity management
Brute force
� 40 Gb/second InfiniBand QDR fabric for database server to Exadata storage server communication and RAC internode communication. Ethernet is today 1/10Gb/s and Fiber Channel 4 /8Gb/s.
� 4x96GB=384GB of Flash PCI cards per cell server, 1GB/s per card (*) + some “intelligence” on what to cache (*)
� Option for SAS and SATA cells
Lowering the demand
� RDS (Reliable Datagram sockets) over Infiniband between the Exadata Storage Servers and the Oracle Database. Direct Memory Access means a low cpu overhead and no extra memory copy
� Smart scans� Offload to the storage layer some of the work performed by Data Base servers in non-exadata
configurations� Reduced the amount of data transferred from the storage cells to the instances� Access method ‘full’ (no index lookup)� PGA buffering through direct path reads. Number of blocks read must be greater than
_small_table_threshold.
(*) Untested
18
Exadata smart scans
Offloading is only used when the execution plan shows a FILTER predicate. Statements without a where clause or which select all columns will not be offloaded.
� Projection
The cells only return the required columns to the instances. This is similar to columnar data bases such as Sybase IQ or Vertica.
� Restriction
Offload to a cell predicates found in the where clause
� Storage indexing
Skip I/Os by keeping track of the minimum and maximum values of columns
� Join filtering pruning (bloom filters)
Support join-filter pruning, which is (can be ?) offloaded to the storage cells
� Hybrid Columnar Compression (HCC) decompression
Decompression handled by the cells (cell offload untested by us)

19
--- Make sure direct path read is used
SQL> alter session set "_serial_direct_read"=true;
SQL> select /*+ OPT_PARAM('cell_offload_processing ' 'true') */ COUNT(i_id) FROM mysch.TST_20100531;
COUNT(I_ID)
-----------
66406397
Elapsed: 00:00:03.48
--------------------------------------------------- ----------------------------------------
| Id | Operation | Name | Rows | Bytes | Cost (%CPU)| Time |
--------------------------------------------------- ----------------------------------------
| 0 | SELECT STATEMENT | | 1 | 8 | 118K (1)| 00:23:43 |
| 1 | SORT AGGREGATE | | 1 | 8 | | |
| 2 | TABLE ACCESS STORAGE FULL| TST_20100531 | 66M| 506M| 118K (1)| 00:23:43 |
--------------------------------------------------- ----------------------------------------
SQL> select /*+ OPT_PARAM('cell_offload_processing' 'false')*/ COUNT(i_id) FROM mysch.TST_20100531;
COUNT(I_ID)
-----------
66406397
Elapsed: 00:00:44.84
The cells only return the required columns to the instances. Example: mysch.TST_20100531, 66 millions lines, 6.2GB, no indexes. The test can be replayed in any order with similar results.
Exadata Projection
Or alter session set "cell_offload_processing" = TRUE;
Note: The « count » function is not listed as off loadable

20
Exadata Projection
The number of bytes that are returned by the cell for Smart Scan only, and does not include bytes for other database I/O.
cell physical IO interconnect bytes returned by smart scan
The total number of I/O bytes processed with physical disks when processing was offloaded to the cell.
cell physical IO bytes eligible for predicate offload
The number of I/O bytes exchanged over the interconnection between the database host and cells.
cell physical IO interconnect bytes
Total amount of I/O bytes for reads processed with physical disks. This includes when processing was offloaded to the cell and when processing was not offloaded.
physical read total bytes
SQL> alter session set "cell_offload_processing" = FALSE;
select count(i_id) from mysch.TST_20100531;
66406397
NAME VALUE
--------------------------------------------------- -------
physical read total bytes 660 0228864
cell physical IO interconnect bytes 660 0228864
cell physical IO bytes eligible for predicate
offload 0
cell physical IO interconnect bytes returned
by smart scan 0
SQL> alter session set "cell_offload_processing" = TRUE;
SQL> select count(i_id) from mysch.TST_20100531;
66406397
NAME VALUE
--------------------------------------------------- -----
physical read total bytes 6600 228864
cell physical IO interconnect bytes 893 709872
cell physical IO bytes eligible for predicate
offload 6600228864
cell physical IO interconnect bytes returned
by smart scan 893709872
14% of the data where processed by the instanceSmart scan filtered data

21
Exadata restriction
Aim: offload to a cell predicates found in the where clause
SQL> set autotrace traceonly
SQL> alter session set "_serial_direct_read"=true;
SQL> select * from mysch.TST_20100531 where messag e_type = 'BILIEN';
no rows selected
Elapsed: 00:00:00.20
--------------------------------------------------- ---------------------------------------
| Id | Operation | Name | Rows | Bytes | Cost (%CPU)| Time |
--------------------------------------------------- ---------------------------------------
| 0 | SELECT STATEMENT | | 15M| 1257M| 119K (1)| 00:23:49 |
|* 1 | TABLE ACCESS STORAGE FULL| TST_20100531 | 15M| 1257M| 119K (1)| 00:23:49 |
--------------------------------------------------- ---------------------------------------
Predicate Information (identified by operation id):
---------------------------------------------------
1 - storage("MESSAGE_TYPE"='BILIEN')
filter("MESSAGE_TYPE"='BILIEN')
physical read total bytes 6600245248
cell physical IO interconnect bytes 918288
physical read flash cache hits 0
cell physical IO bytes eligible for predicate offlo ad 6600237056
cell physical IO bytes saved by storage index 0
cell physical IO interconnect bytes returned by sma rt scan 910096
cell flash cache read hits 0
No storage index
Restriction

22
Exadata Storage indexing
You had partition pruning, now you have storage indexes !
� In Memory storage server structure, built as chunks are read and updated when they are modified (1).
� Keeps track of minimum and maximum values of columns
� Automatic, no administration
� Skip I/Os like partition pruning but more granular (1MB chunks). Unlike partition pruning, free of data-model constraints
� Works best when data are clustered (sorting date on columns found on predicates at INSERT /* +APPEND */ time is the way to achieve this), some caveats though (2)� In memory storage indexes won’t survive a cell reboot� Some data types are not supported� Does not support encrypted column
(1) untested
(2) see MOS note 1094934.1

23
Exadata Storage Indexing
SQL> alter session set "cell_offload_processing" = TRUE;SQL> select * from mysch.TST_20100531 where r_id<2 ;
1179015 rows selected.
Elapsed: 00:00:21.00
--------------------------------------------------- ---------------------------------------| Id | Operation | Name | Rows | Bytes | Cost (%CPU)| Time |--------------------------------------------------- ---------------------------------------| 0 | SELECT STATEMENT | | 2075K| 170M| 118K (1)| 00:23:45 ||* 1 | TABLE ACCESS STORAGE FULL| TST_20100531 | 2075K| 170M| 118K (1)| 00:23:45 |--------------------------------------------------- ---------------------------------------Predicate Information (identified by operation id):---------------------------------------------------
1 - storage("R_ID"<2)filter("R_ID"<2)
SQL> alter session set "cell_offload_processing" = FALSE;
SQL> select * from mysch.TST_20100531 where r_id<2 ;
1179015 rows selected.
Elapsed: 00:01:06.77
--------------------------------------------------- ---------------------------------------
| Id | Operation | Name | Rows | Bytes | Cost (%CPU)| Time |
--------------------------------------------------- ---------------------------------------
| 0 | SELECT STATEMENT | | 2075K| 170M| 118K (1)| 00:23:45 |
|* 1 | TABLE ACCESS STORAGE FULL| TST_20100531 | 2075K| 170M| 118K (1)| 00:23:45 |
--------------------------------------------------- ---------------------------------------
Predicate Information (identified by operation id):
---------------------------------------------------
1 - filter("R_ID"<2)
out of 66 million lines, that’s 0.02%
Cell off-load storage indexes
No flash cache involved: cell flash cache read hits # 0
Beware!

24
Join-Filter Pruning
� Bloom filters are not specific to the Exadata Storage Server: an Enterprise Edition feature available since Oracle Database 10g Release 2
� Commonly used by the Google ‘BigTable’ DBMS
� Reduces data communication between slave processes in parallel joins
� Support join-filter pruning, which is (can be ?) offloaded to the storage cells
What is it ?
� Wikipedia : The Bloom filter […] is a space-efficient probabilistic data structure that is used to test whether an element is a member of a set.
� The join filter builds an array of bits, and turns on bits on for each row of the first table that matches the search conditions. Rows from the joined table which are outside the join are rejected.
� The time needed to check whether an item is in the set is a fixed value.

25
Join-Filter Pruning
--------------------------------------------------- ---------------------
| Id | Operation | Name |
--------------------------------------------------------------------------------------------------------------------------------
| 0 | SELECT STATEMENT | |
| 1 | SORT AGGREGATE | |
| 2 | PX COORDINATOR | |
| 3 | PX SEND QC (RANDOM) | :TQ100 02 |
| 4 | SORT AGGREGATE | |
|* 5 | HASH JOIN | |
| 6 | JOIN FILTER CREATE | :BF000 0 |
| 7 | PX RECEIVE | |
| 8 | PX SEND HASH LOCAL | :TQ100 00 |
| 9 | PX BLOCK ITERATOR | |
| 10 | TABLE ACCESS STORAGE FULL| CLIENT _TEST |
| 11 | PX RECEIVE | |
| 12 | PX SEND HASH LOCAL | :TQ100 01 |
| 13 | JOIN FILTER USE | :BF000 0 |
| 14 | PX BLOCK ITERATOR | |
|* 15 | TABLE ACCESS STORAGE FULL| INST_T EST |
--------------------------------------------------- ---------------------
select /*+ full(cdd) full(i)*/ count(i.i_id) from m ysch.instances i,mysch.client_test cdd
where i.t_dt > to_date('09-09-2001','DD-MM-YYYY’ and i.i_id = cdd.i_id;
Build a bloom filter
Used to filter out the rows from INST_TEST which should not be joined

26
Join-Filter Pruning
select count(i.i_id) from mysch.instances i,mysch.cl ient_test cdd
where i.t_dt > to_date('09-09-2001','DD-MM-YYYY’) an d i.i_id = cdd.i_id and
cdd.client_reference=‘BILIEN’;
Predicate Information (identified by operation id):
---------------------------------------------------
5 - access("I"."I_ID"="CDD"."I_ID")
9 - storage("CLIENT_REFERENCE"=‘BILIEN')
filter("CLIENT_REFERENCE"=‘BILIEN')
11 - storage("I"."T_DT">TO_DATE(' 2001-09-09 00:00:0 0', 'syyyy-mm-dd hh24:mi:ss') AND SYS_OP_BLOOM_FILTER(:BF0000,"I"."I_ID"))
filter("I"."T_DT">TO_DATE(' 2001-09-09 00:00:00', ' syyyy-mm-dd hh24:mi:ss') AND SYS_OP_BLOOM_FILTER(:BF0000,"I"."I_ID"))
Operation 11 is a “storage and filter” predicate :
Offload restriction on i.t_dt > to_date('09-09-2001' ,'DD-MM-YYYY’)
Join-filter pruning: SYS_OP_BLOOM_FILTER(:BF0000,"I" ."I_ID“)

27
Large-Scale Oracle RAC (and Sun Oracle Database Machine) Scalability Design
Q&Ahttp://christianbilien.wordpress.com
Related Documents