Ontogenetic and Among-Individual Variation in Foraging Strategies of Northeast Pacific White Sharks Based on Stable Isotope Analysis Sora L. Kim 1 *, M. Tim Tinker 2 , James A. Estes 3 , Paul L. Koch 1 1 Department of Earth and Planetary Sciences, University of California Santa Cruz, Santa Cruz, California, United States of America, 2 Western Ecological Research Center, United States Geological Survey, Santa Cruz, California, United States of America, 3 Department of Ecology and Evolutionary Biology, University of California Santa Cruz, Santa Cruz, California, United States of America Abstract There is growing evidence for individuality in dietary preferences and foraging behaviors within populations of various species. This is especially important for apex predators, since they can potentially have wide dietary niches and a large impact on trophic dynamics within ecosystems. We evaluate the diet of an apex predator, the white shark (Carcharodon carcharias), by measuring the stable carbon and nitrogen isotope composition of vertebral growth bands to create lifetime records for 15 individuals from California. Isotopic variations in white shark diets can reflect within-region differences among prey (most importantly related to trophic level), as well as differences in baseline values among the regions in which sharks forage, and both prey and habitat preferences may shift with age. The magnitude of isotopic variation among sharks in our study (.5% for both elements) is too great to be explained solely by geographic differences, and so must reflect differences in prey choice that may vary with sex, size, age and location. Ontogenetic patterns in d 15 N values vary considerably among individuals, and one third of the population fit each of these descriptions: 1) d 15 N values increased throughout life, 2) d 15 N values increased to a plateau at ,5 years of age, and 3) d 15 N values remained roughly constant values throughout life. Isotopic data for the population span more than one trophic level, and we offer a qualitative evaluation of diet using shark-specific collagen discrimination factors estimated from a 3+ year captive feeding experiment (D 13 C shark-diet and D 15 N shark-diet equal 4.2% and 2.5%, respectively). We assess the degree of individuality with a proportional similarity index that distinguishes specialists and generalists. The isotopic variance is partitioned among differences between-individual (48%), within-individuals (40%), and by calendar year of sub-adulthood (12%). Our data reveal substantial ontogenetic and individual dietary variation within a white shark population. Citation: Kim SL, Tinker MT, Estes JA, Koch PL (2012) Ontogenetic and Among-Individual Variation in Foraging Strategies of Northeast Pacific White Sharks Based on Stable Isotope Analysis. PLoS ONE 7(9): e45068. doi:10.1371/journal.pone.0045068 Editor: William Hughes, University of Leeds, United Kingdom Received March 20, 2012; Accepted August 14, 2012; Published September 28, 2012 This is an open-access article, free of all copyright, and may be freely reproduced, distributed, transmitted, modified, built upon, or otherwise used by anyone for any lawful purpose. The work is made available under the Creative Commons CC0 public domain dedication. Funding: This study was funded by the National Science Foundation grants NSF-OCE 0345943 and NSF-EAR 1053013 to P. Koch and an Institute of Geophysics and Planetary Physics (IGPP) mini-grant award and the Dr. Earl H. Myers and Ethel M. Myers Oceanographic and Marine Biology Trust Award to S. Kim. The funders had no role in study design, data collection and analysis, decision to publish, or preparation of the manuscript. Competing Interests: The authors have declared that no competing interests exist. * E-mail: [email protected] Introduction Although diet is often treated as a species-level trait, variation in diet composition and foraging behavior occurs within most species. This variation can be attributed to at least three factors–habitat- specific variation in prey availability; differences in the cost-benefit ratios of potential prey among the sexes, or age- or size-classes of consumers; and phenotypic variation among what often appear to be otherwise similar individuals [1–5]. Collectively, this dietary variation influences the fitness of consumers and their ecological and evolutionary impacts on prey species, communities, and ecosystems [1–5]. White sharks (Carcharodon carcharias) are apex predators that can have cascading effects on marine ecosystems [6,7], but our understanding of their foraging ecology is fragmentary and often biased by spectacular accounts, especially attacks on humans and other large mammals. In the northeastern Pacific Ocean, white sharks were once considered a nearshore species that preyed primarily on pinnipeds, a perception arising from many studies focused on coastal sites near pinniped colonies where shark foraging behavior was easy to observe [8–13]. This view has been challenged by recent satellite tagging data from white sharks off the coast of California and Baja California, Mexico, which revealed migration between the North American continental shelf and two offshore areas (18 to 26uN and 125 to 140uW) [14–17]. Isotopic data from tagged individuals corroborated offshore foraging on lower trophic level prey and indicated similar dietary preferences within this population [18]. Although observations of white shark predation on non-pinniped prey are rare, stomach contents include remains from invertebrates, turtles, fish, and sharks [19]. Here, we assess population-level diet variation, potential ontogenetic shifts in prey preferences, and individual diet specialization through analysis of carbon and nitrogen isotope variation. The stable isotope composition of a tissue reflects a temporal integration of dietary and environmental inputs (albeit mediated by animal physiology), and can thus be used as a natural tracer for foraging variation. The most commonly used stable isotope ratios PLOS ONE | www.plosone.org 1 September 2012 | Volume 7 | Issue 9 | e45068

Welcome message from author
This document is posted to help you gain knowledge. Please leave a comment to let me know what you think about it! Share it to your friends and learn new things together.
Transcript
Ontogenetic and Among-Individual Variation inForaging Strategies of Northeast Pacific White SharksBased on Stable Isotope AnalysisSora L. Kim1*, M. Tim Tinker2, James A. Estes3, Paul L. Koch1
1 Department of Earth and Planetary Sciences, University of California Santa Cruz, Santa Cruz, California, United States of America, 2 Western Ecological Research Center,
United States Geological Survey, Santa Cruz, California, United States of America, 3 Department of Ecology and Evolutionary Biology, University of California Santa Cruz,
Santa Cruz, California, United States of America
Abstract
There is growing evidence for individuality in dietary preferences and foraging behaviors within populations of variousspecies. This is especially important for apex predators, since they can potentially have wide dietary niches and a largeimpact on trophic dynamics within ecosystems. We evaluate the diet of an apex predator, the white shark (Carcharodoncarcharias), by measuring the stable carbon and nitrogen isotope composition of vertebral growth bands to create lifetimerecords for 15 individuals from California. Isotopic variations in white shark diets can reflect within-region differences amongprey (most importantly related to trophic level), as well as differences in baseline values among the regions in which sharksforage, and both prey and habitat preferences may shift with age. The magnitude of isotopic variation among sharks in ourstudy (.5% for both elements) is too great to be explained solely by geographic differences, and so must reflectdifferences in prey choice that may vary with sex, size, age and location. Ontogenetic patterns in d15N values varyconsiderably among individuals, and one third of the population fit each of these descriptions: 1) d15N values increasedthroughout life, 2) d15N values increased to a plateau at ,5 years of age, and 3) d15N values remained roughly constantvalues throughout life. Isotopic data for the population span more than one trophic level, and we offer a qualitativeevaluation of diet using shark-specific collagen discrimination factors estimated from a 3+ year captive feeding experiment(D13Cshark-diet and D15Nshark-diet equal 4.2% and 2.5%, respectively). We assess the degree of individuality with a proportionalsimilarity index that distinguishes specialists and generalists. The isotopic variance is partitioned among differencesbetween-individual (48%), within-individuals (40%), and by calendar year of sub-adulthood (12%). Our data revealsubstantial ontogenetic and individual dietary variation within a white shark population.
Citation: Kim SL, Tinker MT, Estes JA, Koch PL (2012) Ontogenetic and Among-Individual Variation in Foraging Strategies of Northeast Pacific White Sharks Basedon Stable Isotope Analysis. PLoS ONE 7(9): e45068. doi:10.1371/journal.pone.0045068
Editor: William Hughes, University of Leeds, United Kingdom
Received March 20, 2012; Accepted August 14, 2012; Published September 28, 2012
This is an open-access article, free of all copyright, and may be freely reproduced, distributed, transmitted, modified, built upon, or otherwise used by anyone forany lawful purpose. The work is made available under the Creative Commons CC0 public domain dedication.
Funding: This study was funded by the National Science Foundation grants NSF-OCE 0345943 and NSF-EAR 1053013 to P. Koch and an Institute of Geophysicsand Planetary Physics (IGPP) mini-grant award and the Dr. Earl H. Myers and Ethel M. Myers Oceanographic and Marine Biology Trust Award to S. Kim. The fundershad no role in study design, data collection and analysis, decision to publish, or preparation of the manuscript.
Competing Interests: The authors have declared that no competing interests exist.
* E-mail: [email protected]
Introduction
Although diet is often treated as a species-level trait, variation in
diet composition and foraging behavior occurs within most species.
This variation can be attributed to at least three factors–habitat-
specific variation in prey availability; differences in the cost-benefit
ratios of potential prey among the sexes, or age- or size-classes of
consumers; and phenotypic variation among what often appear to
be otherwise similar individuals [1–5]. Collectively, this dietary
variation influences the fitness of consumers and their ecological
and evolutionary impacts on prey species, communities, and
ecosystems [1–5].
White sharks (Carcharodon carcharias) are apex predators that can
have cascading effects on marine ecosystems [6,7], but our
understanding of their foraging ecology is fragmentary and often
biased by spectacular accounts, especially attacks on humans and
other large mammals. In the northeastern Pacific Ocean, white
sharks were once considered a nearshore species that preyed
primarily on pinnipeds, a perception arising from many studies
focused on coastal sites near pinniped colonies where shark
foraging behavior was easy to observe [8–13]. This view has been
challenged by recent satellite tagging data from white sharks off
the coast of California and Baja California, Mexico, which
revealed migration between the North American continental shelf
and two offshore areas (18 to 26uN and 125 to 140uW) [14–17].
Isotopic data from tagged individuals corroborated offshore
foraging on lower trophic level prey and indicated similar dietary
preferences within this population [18]. Although observations of
white shark predation on non-pinniped prey are rare, stomach
contents include remains from invertebrates, turtles, fish, and
sharks [19]. Here, we assess population-level diet variation,
potential ontogenetic shifts in prey preferences, and individual
diet specialization through analysis of carbon and nitrogen isotope
variation.
The stable isotope composition of a tissue reflects a temporal
integration of dietary and environmental inputs (albeit mediated
by animal physiology), and can thus be used as a natural tracer for
foraging variation. The most commonly used stable isotope ratios
PLOS ONE | www.plosone.org 1 September 2012 | Volume 7 | Issue 9 | e45068
in dietary studies are 13C/12C and 15N/14N. Physiological
processes lead to a subtle increase in 13C- and 15N-concentration
with trophic level in consumers (,1% and ,3% per trophic step,
respectively) [20]. In addition, there are 13C/12C and 15N/14N
gradients throughout the eastern basin of the Pacific Ocean
controlled by a variety of factors related to primary production at
the base of the food web [21–23]. For carbon, upwelling brings13C-depleted deep water to the surface and nutrient-driven
phytoplankton blooms off the California coast increase the
baseline carbon isotope values ,2–3% relative to less productive
offshore areas [21–23]. The spatial nitrogen isotope gradient has a
similar range, but is more complex as the source of nutrients (i.e.,
nitrate, ammonium, N2) and processes of biological incorporation
or geochemical cycling (i.e., N2 fixation, nitrate or ammonium
assimilation, or denitrification) vary with productivity regimes [23–
27]. These baseline trends are conserved in consumer tissues; for
example, pinnipeds foraging in productive 13C-enriched nearshore
habitats on the Pacific Rim have carbon isotope values ,2%greater than those foraging offshore [28].
Assessments of consumer diet with stable isotope analysis must
address these spatial and trophic variations among potential prey.
This technique has been used to chronicle patterns of diet and
habitat use in a variety of marine predators, including marine
mammals (see review by [29]), marine turtles [30–32], and sharks
[33]. Two issues that are important to disentangling the effects of
spatial versus trophic variations on consumer isotope values are
biological parameters (i.e., discrimination factors and turnover
rates) and distinct prey isotope values. In complex systems,
however, these sources of variation are difficult to tease apart. The
few isotopic studies featuring sharks often calculate trophic
position and report isotopic differences among tissues [33–39],
but other ecological insights, such as dietary preferences and
habitat use, are limited.
The concept of ecological niche [40] was adopted in isotopic
ecology because stable isotopes vary with aspects of a consumer’s diet
and habitat through time [41]. Although ecological and isotopic
niches cannot be directly translated, isotopic variation within and
among individual consumers of a particular species or population
reflects the niche width [41–43]. Data from multiple individuals can
yield an estimate of population-level isotopic niche width, but to
capture within-individual dietary variation, multiple measurements
of an individual’s diet and habitat preferences over time are required.
Serially-sampled accretionary structures (i.e., feathers, baleen,
vibrissae, turtle scutes, shark vertebrae, etc.) produce ontogenetic
time series (e.g., [32,36,43–46]) and can be used to establish within-
individual isotopic niche width [32,36,43–46]. These patterns can be
compared among individuals to identify generalists with overlapping
isotopic values or specialists that occupy just part of the population’s
isotopic range [43]. Although bony fish are featured in studies of
individuality, we are aware of only one other study featuring
elasmobranchs (shark, skates, and rays) despite their considerable
diversity, widedistribution, and functional importance inmarine and
estuarine systems [2,33].
We investigated isotopic time series from the vertebrae of white
sharks collected from the northeast Pacific Ocean between 1957
and 2000. Because white shark vertebrae grow by accretion,
isotopic values from growth bands record lifetime variations in an
individual’s diet. We hypothesized d15N values to increase with
age to reflect a shift to high trophic-level prey. Furthermore, a
quantitative analysis of carbon and nitrogen isotope data will
reveal the degree of dietary variation within and among
individuals in this white shark population.
Methods
(a) Collection and Preparation of Vertebrae for IsotopicAnalysis
The vertebrae of 15 adult white sharks were sampled from
existing collections (Table 1). Fourteen specimens were caught off
the California coast (locations are listed in Table 1, if available).
One specimen (42094–2) was caught offshore from Baja Califor-
nia, Mexico, and may be part of the population that aggregates
near Guadalupe Island [17]. Because the isotopic pattern from this
individual was similar to that for some of the sharks caught off the
California coast, we included data from this shark in our analyses.
All of the vertebrae were stored frozen or dry, with two
exceptions (27015 and 27681), which were preserved in alcohol
until sampling (Table 1). While some prior studies have found
greater isotopic variability and a shift to lower C:Natomic values for
ethanol-preserved muscle [47,48], we found no differences in
isotopic or C:Natomic variability between frozen and ethanol
preserved vertebrae, and so we included data from ethanol
preserved specimens in our analyses.
White shark vertebral centra grow by accretion in concentric
rings and have annual growth bands that are used to age
individuals [49]. We followed sampling and preparation tech-
niques in Kim and Koch [48] for these vertebrae. Briefly, a 1-cm
thick section was cut from the parasagittal plane with a diamond
saw. Then, sections were polished and annual rings, defined as one
opaque and one translucent growth band pair, were independently
counted and marked by SLK and a researcher who conducts
elasmobranch age and growth studies at California State
University, Moss Landing Marine Lab (MLML). Individual
growth rings were sampled from the corpus calcerum using a
New Wave MicroMill (MLML and the Marine Analytical Lab,
University of California, Santa Cruz [UCSC]) from a maximum
depth of 1.2 mm (File S1). Samples were decalcified using 0.5 M
EDTA (pH 8), rinsed 10 times with milliQ water to isolate
collagen, and freeze-dried for stable isotope analysis (method
modified from [48]). Samples were weighed to 300–400 mg into tin
boats (365 mm, Costech) and analyzed at the Stable Isotope
Laboratory at UCSC on an elemental analyzer coupled to an
isotope ratio-monitoring mass spectrometer (Thermo-Scientific
Delta-XP IR-MS). Isotope ratios are expressed in d values, where.
dhX~Rsample
Rs�t�a�ndard
{1
� �|1000 ð1Þ
X is the element of interest, h is the high mass number, and R is
the high mass-to-low mass ratio. Units are parts per thousand (per
mil, %) deviations from a standard. The d13C and d15N values
were referenced to V-PDB and AIR, respectively. Replicates of a
gelatin standard within each analysis session allowed for mass and
drift corrections. Comparisons of this standard within and between
runs yielded SD of ,0.2% and ,0.3% for d13C and d15N values
(n = 77), respectively.
Because of the temporal span of our data, we corrected for
anthropogenic changes in the d13C values of Earth surface carbon
reservoirs that occurred over the past 70 years [50]. As d13C values
did not change constantly through this period, two atmosphere-
derived rates (0.05% per year for 1937–1960 and 0.022% per
year for 1961–2000) were used to correct samples to 2000, the year
of death for the most recent individuals [51].
Variable Foraging Strategies among White Sharks
PLOS ONE | www.plosone.org 2 September 2012 | Volume 7 | Issue 9 | e45068
(b) Quantitative Analysis of OntogenyTo test for the existence of an ontogenetic shift at the population
level in a generalized linear model, we established 2 age classes
and had individuals as a source of variation to determine if d15N
values varied significantly with age using a one-way analysis of
variance (ANOVA). These age classes were based on length data
from observation and tagging studies of white sharks near pinniped
rookeries. The smaller white sharks observed at Ano Neuvo Island,
Southeast Farallon Islands, Tomales Bay, and Point Reyes are
approximately 300–350 cm long [16,52]. Additionally, white
shark teeth develop finer serrations beginning at 300 cm,
indicating a functional shift [53]. Age and growth studies often
use annual vertebral growth bands [49] and relate them to length
or mass based on von Bertalanffy growth functions (VBGF, [54]):
L(t)~L?{ L?{L0ð Þe{kt ð2Þ
where t is time, L‘ is the maximum (or asymptotic) length, L0 is
length at birth (t = 0), and k is an empirically derived growth
constant. According to VBGF, 300 cm corresponds to white
sharks that are 5 years old [55,56]. Based on tooth morphology
and white shark presence at pinniped rookeries, we classified
isotopic data from growth bands corresponding to birth through
the end of the 5th year as ‘‘young’’ and to $6 years old as ‘‘sub-
adult to adult.’’
We next evaluated individual differences in ontogenetic dietary
variation. For each shark, we fit three alternative functions to the
time series data: i) a constant d15N value (assuming random
variation but no prevailing trend with age); ii) a continuous
increase in d15N values with age, fit using a first-order polynomial;
and iii) a non-linear, asymptotic increase in d15N values with age,
fit using VBGF (Equation 2, substituting d15N values for length).
We removed statistically significant outlier data (studentized
residuals that fall outside 95% prediction interval for new data
points) prior to final fitting. We tested the statistical significance of
each function at a = 0.05, and used degrees-of-freedom-adjusted
R2 values to evaluate goodness of fit for each model. We then
assigned individuals to one of three classes based on which of these
models (no ontogenetic shift, linear increase or asymptotic
increase) was significant and provided the best fit. For individuals
exhibiting an asymptotic increase, we designated the age of
transition from young to sub-adult through adult diets as the point
at which the VBGF function equaled 90% of the asymptotic value.
For individuals exhibiting no significant ontogenetic shift and
having high d15N values in early growth bands, we sampled and
analyzed portions of the central vertebra, which form from
maternal resources before parturition, to assess the potential of
metabolic turnover within the vertebra.
(c) Potential Prey for Qualitative Assessment of WhiteShark Diet
We compiled isotopic data for potential prey gleaned from
studies in northeastern Pacific ecosystems to provide a dietary
context for our sub-adult to adult isotopic data from white sharks.
We limited our assessment to qualitative patterns, rather than
estimating specific proportions of dietary inputs, because the large
number of potential prey and their variance would likely produce
indeterminate results [57]. The potential prey we included were as
follows: California sea lion [28,40,58]; harbor seal [28,41];
northern elephant seal [28,41–43]; harbor porpoise [32,36,43–
46,59]; dolphins (Berman and Newsome, unpublished data);
various tuna species [32,36,43–46,60]; neritic fish [43,61]; blue
and hammerhead sharks [62]; and cephalopod species [63,64].
The localities and isotopic values for all prey are compiled in File
S2. All prey isotope values were ‘‘corrected’’ (and error
propagated) to resemble collagen for comparison.
While our shark data span from 1950–2000, the prey data are
relatively recent and thus may not reflect secular shifts in baseline
Table 1. Summary of biological and collection data and proportional similarity index (wij) for white sharks.
IDYear ofdeath Sex
# Growthbands Location caught
Collection ofacquisition Mean adult wij
Method ofstorage
d13C value,% (SD)
d15N value,% (SD)
26245 1957 F 20 Monterey Bay, CA CAS 213.3 (0.6) 20.2 (0.3) 0.17 Dry
26678 1959 ? 11 Selva Beach, CA CAS 211.4 (0.2) 18.8 (1.0) 0.23 Dry
27015 1960 ? 9 Stinson Beach, CA CAS 212.0 (0.2) 18.1 (0.4) 0.25 Ethanol
26781 1960 ? 9 Tomales Bay, CA CAS 211.6 (0.3) 18.9 (0.5) 0.24 Ethanol
42094–2 1965 ? 7 Eastern Pacific, Baja Mexico LACM 214.1 (0.6) 16.7 (0.3) 0.33 Dry
WS CM 1976 ? 10 Point Reyes, CA GC 213.6 (0.6) 17.6 (0.7) 0.50 Dry
WH 17 1980 ? 14 California MLML 213.8 (0.8) 19.0 (0.6) 0.73 Frozen
WS 21 1983 M 16 Anacapa Island, CA MLML 214.9 (0.2) 16.0 (0.4) 0.26 Frozen
WS 100 1985 ? 19 Santa Barbara, CA MLML 212.6 (0.6) 18.1 (0.8) 0.90 Frozen
WS KG 1986 ? 13 SE Farallones, CA KG 213.0 (0.5) 19.6 (0.2) 0.59 Dry
WS 101 1991 ? 11 CA MLML 213.4 (0.2) 16.6 (0.4) 0.74 Frozen
WS 128 1992 ? 17 CA MLML 213.3 (0.8) 18.4 (0.9) 0.42 Frozen
42898 PR 1998 ? 15 Point Reyes, CA SA 212.4 (0.5) 18.5 (0.3) 0.08 Dry
56731–1 2000 ? 17 Catalina Island, CA LACM 212.3 (0.5) 19.0 (0.8) 0.73 Dry
CC3 2000 F 14 Morro Bay, CA LML 212.0 (0.2) 19.8 (0.5) 0.33 Frozen
Abbreviations are as follows: California Academy of Sciences (CAS), Natural History Museum of Los Angeles County (LACM), G. Chan (GC), Moss Landing Marine Lab(MLML), K. Goldman (KG), S. Anderson (SA), and Long Marine Lab (LML).doi:10.1371/journal.pone.0045068.t001
Variable Foraging Strategies among White Sharks
PLOS ONE | www.plosone.org 3 September 2012 | Volume 7 | Issue 9 | e45068
isotope values due to climate change or changes in productivity.
This source of variation is difficult to constrain, but there is little
evidence for major secular shifts (i.e., .1 or 2%), and variation of
this magnitude will not affect our qualitative assessment of diet.
(d) Assessing the Degree of IndividualityTo evaluate niche overlap, we used Pianka’s measure [65]
under multivariate normality [66], which is as follows:
wij~gi(x)gj(x)dxffiffiffiffiffiffiffiffiffiffiffiffiffiffiffiffi
g2i (x)dx
q:ffiffiffiffiffiffiffiffiffiffiffiffiffiffiffiffig2
j (x)dxq : ð3Þ
Equation 3 allows for the calculation of proportional overlap (in
2-dimensional niche space) between two individuals or populations
(i and j), accounting for multivariate covariance and density
distributions [g(x)]. We measured the degree of isotopic niche
overlap, or ‘‘proportional similarity,’’ between each individual’s
sub-adult/adult isotopic range and the population-level isotopic
range (i.e., all sub-adult/adult growth bands for 15 individuals).
Averaged across individuals, this proportional similarity index (wij,
Equation 3; [66]) allowed us to examine the degree of individual
specialization; individual specialists would be expected to have a
low degree of overlap (wij ,,1), while generalists would have
extensive overlap (wij < 1).
We also assessed the effects of individual differences on sub-
adult/adult isotopic values within a generalized linear model. This
analysis allowed us to assess the relative amount of variance
explained by differences among individuals vs. variation within
individuals. We included a temporal category, ‘‘calendar year of
sub-adulthood,’’ defined as the calendar year a shark reached 6
years of age. The three categories for calendar year of sub-
adulthood were based on pinniped populations: before the passage
of the Marine Mammal Protection Act (pre-1972), during the
period when pinniped populations were increasing (1972–1986),
and after pinniped populations doubled from pre-1972 counts
(post-1986) [67,68]. Other biological details (i.e., sex, location
caught, etc.) were not included in our analysis because the
information was not available for all specimens (Table 1). The
best-fit models for d13C and d15N values (weighted equally and
independently) were selected based on minimal Akaike Informa-
tion Criterion (AIC) values [69]. All statistical analysis was
performed in MatLab (version 8.0).
(e) Discrimination FactorsThere are offsets between prey and consumer d13C and d15N
values, known as trophic discrimination factors, which reflect
preferential sorting during metabolism and incorporation into
tissues [20,70,71]. To compare potential prey and consumer
isotope values, discrimination factors defined as:
DhX~dhXconsumer{dhXprey ð4Þ
must be applied to account for trophic enrichment of 13C and 15N.
The average carbon and nitrogen discrimination factors that are
widely used are 0.4% (SD = 1.3%) and 3.4% (SD = 1.0%),
respectively [72], but actual values vary with diet, physiology,
and tissue [22,73,74].
We conducted a controlled feeding study with captive leopard
sharks (Triakis semifasciata) fed squid over 1250 days [62]. The care
and protocol for euthanizing the leopard sharks were approved by
the UCSC Chancellor’s Animal Research Committee (permit
code: Koch 0901) and were in accordance with Institutional
Animal Care and Use Committee (IACUC) standards. Briefly, the
leopard sharks (n = 3) were caught in the San Francisco Bay from
August 2005 to January 2006 and maintained at Long Marine
Lab, UCSC in polyethylene tanks (2.3 m diameter, 1.2 m water
depth) with a continuous flow of filtered seawater from the
Monterey Bay (temperature range: 13u–17uC; salinity range: 30–
34) until July 2009. The sharks were sacrificed using a lethal dose
of tricaine methanesulfonate (MS-222) and vertebrae were
extracted and frozen at 220uC. A pair of adjacent vertebrae
from the anterior column were cleaned and selected for analysis.
For each pair of vertebrae, one vertebra was thin-sectioned to
measure growth bands (following sectioning methods of [75] and
adapted by [76]) and growth bands in the other vertebra were
drilled and collagen prepared for stable isotope analysis. Growth
bands were measured 3 times from each shark’s vertebrae non-
consecutively using a microscope and transmitted light. The
outermost bands without statistically different isotopic values were
averaged as the dhXconsumer value in Equation (4).
Results
(a) White SharksA comparison of young and sub-adult to adult white sharks,
blocked across individuals, demonstrated a significant ontogenetic
shift (F1, 206 = 23.19, p,0.0001, r2 = 0.69), confirming that there is
an ontogenetic shift in dietary preferences or habitat use in the
northeastern Pacific white shark population. Five individuals
showed a non-linear, asymptotic increase in d15N values, with the
transition to the sub-adult to adult diet occurring at approximately
4 years of age (Figure 1A). Five individuals exhibited a linear
relationship between d15N and age, with a mean increase of
0.127 yr2160.073 (p,0.0001; Figure 1B). The remaining 5
individuals showed no significant relationship between age and
d15N values (Figure 1C). For individuals with high d15N values
(.17.0%) before age 6 and linearly increasing or no ontogenetic
shift (i.e., 26678, 56731–1, CC3, WS 100, WS CM), the average
d15N values in the central vertebra, which are formed prior to
parturition, were 0.6–3.4% less than the growth bands for ages 1–
5 (Figure 1). A comparison of individual age vs. d13C values did
not reveal significant patterns (File S3). These three patterns of
individual variation in d15N values within the population are
robust and point to substantial differences in the ontogeny of
foraging behavior among individuals.
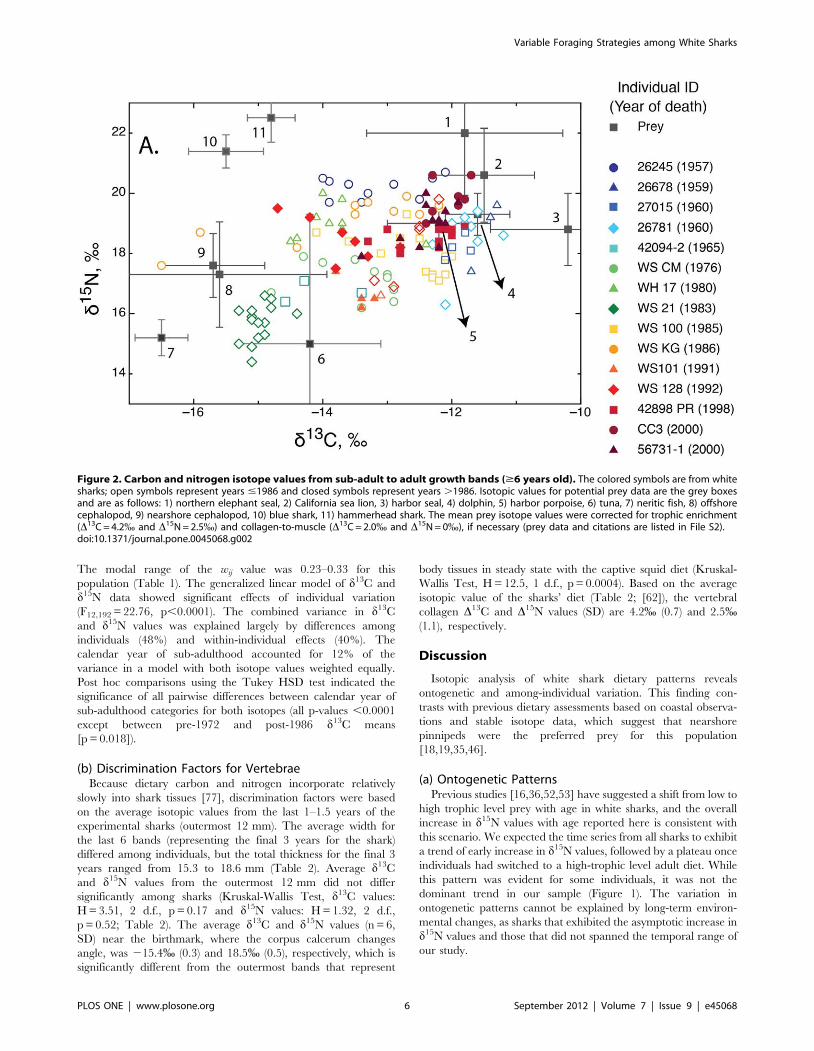
A bivariate plot of isotopic data from sub-adult/adult growth
bands illustrates the dietary diversity within the northeast Pacific
white shark population (Figure 2). The population-level d13C and
d15N values range from –14.5 to –11% and 17 to 21%,
respectively. Within this range, certain individuals (e.g., WS
CM, WS 100, WS 128) exhibit isotopic ratios consistent with a diet
rich in lower trophic level prey, whereas other individuals (e.g.,
26245, WS KG, CC3) appear to consume primarily high trophic
level prey. One individual, WS 21, was an outlier from the
population pattern, with low d13C and d15N values.
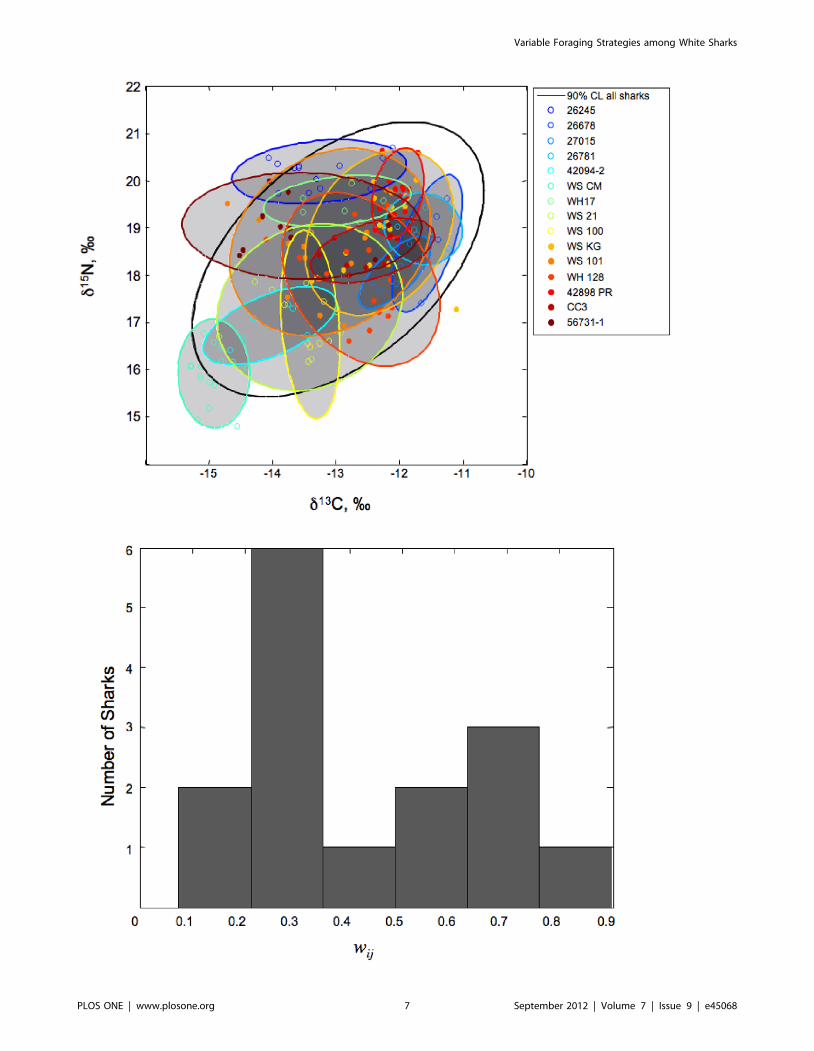
Our data reveal that northeast Pacific white sharks occupy a
wide isotopic niche, as expected for a generalist population.
However, closer inspection reveals a range of strategies among
individuals, which may relate to sex, location, size, or
individuality, as illustrated by the size and placement of
individual bivariate confidence ellipses relative to the population
(Figure 3A). The sharks in the sample population varied
considerably in terms of isotopic overlap, with most sharks
having low degrees of overlap (wij,0.5), but a few having high
values (wij,0.8) suggesting more generalized diets (Figure 3B).
Variable Foraging Strategies among White Sharks
PLOS ONE | www.plosone.org 4 September 2012 | Volume 7 | Issue 9 | e45068
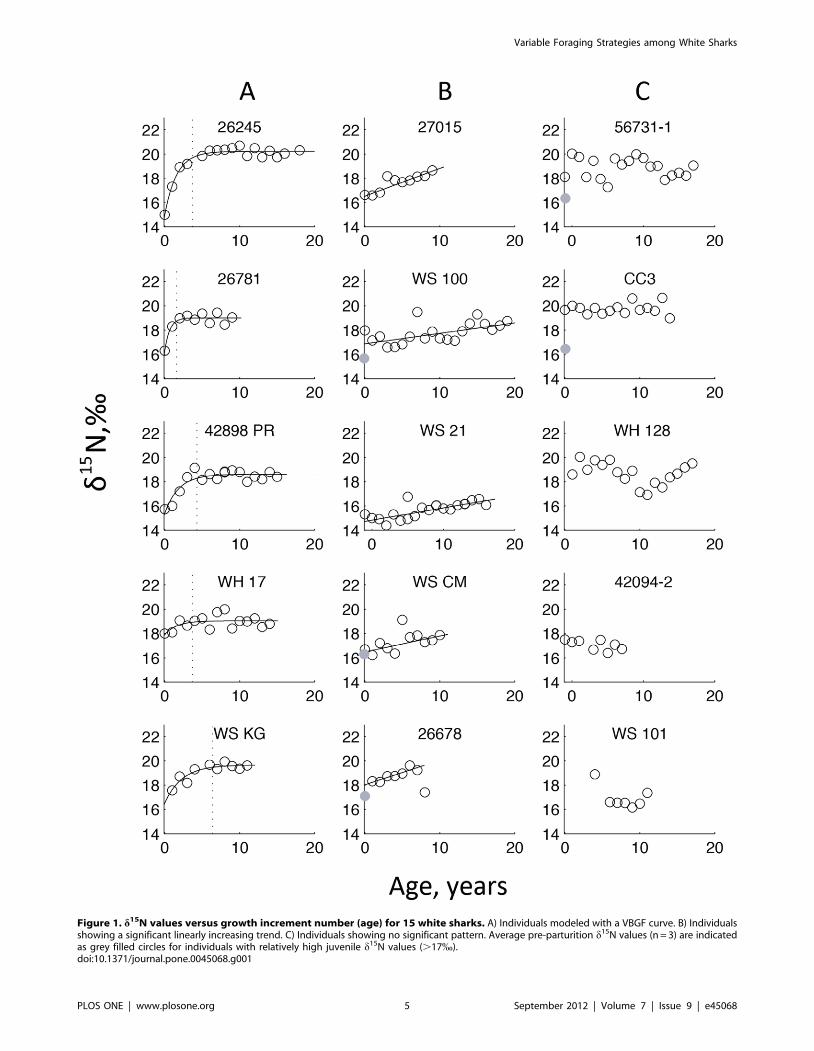
Figure 1. d15N values versus growth increment number (age) for 15 white sharks. A) Individuals modeled with a VBGF curve. B) Individualsshowing a significant linearly increasing trend. C) Individuals showing no significant pattern. Average pre-parturition d15N values (n = 3) are indicatedas grey filled circles for individuals with relatively high juvenile d15N values (.17%).doi:10.1371/journal.pone.0045068.g001
Variable Foraging Strategies among White Sharks
PLOS ONE | www.plosone.org 5 September 2012 | Volume 7 | Issue 9 | e45068
The modal range of the wij value was 0.23–0.33 for this
population (Table 1). The generalized linear model of d13C and
d15N data showed significant effects of individual variation
(F12,192 = 22.76, p,0.0001). The combined variance in d13C
and d15N values was explained largely by differences among
individuals (48%) and within-individual effects (40%). The
calendar year of sub-adulthood accounted for 12% of the
variance in a model with both isotope values weighted equally.
Post hoc comparisons using the Tukey HSD test indicated the
significance of all pairwise differences between calendar year of
sub-adulthood categories for both isotopes (all p-values ,0.0001
except between pre-1972 and post-1986 d13C means
[p = 0.018]).
(b) Discrimination Factors for VertebraeBecause dietary carbon and nitrogen incorporate relatively
slowly into shark tissues [77], discrimination factors were based
on the average isotopic values from the last 1–1.5 years of the
experimental sharks (outermost 12 mm). The average width for
the last 6 bands (representing the final 3 years for the shark)
differed among individuals, but the total thickness for the final 3
years ranged from 15.3 to 18.6 mm (Table 2). Average d13C
and d15N values from the outermost 12 mm did not differ
significantly among sharks (Kruskal-Wallis Test, d13C values:
H = 3.51, 2 d.f., p = 0.17 and d15N values: H = 1.32, 2 d.f.,
p = 0.52; Table 2). The average d13C and d15N values (n = 6,
SD) near the birthmark, where the corpus calcerum changes
angle, was 215.4% (0.3) and 18.5% (0.5), respectively, which is
significantly different from the outermost bands that represent
body tissues in steady state with the captive squid diet (Kruskal-
Wallis Test, H = 12.5, 1 d.f., p = 0.0004). Based on the average
isotopic value of the sharks’ diet (Table 2; [62]), the vertebral
collagen D13C and D15N values (SD) are 4.2% (0.7) and 2.5%(1.1), respectively.
Discussion
Isotopic analysis of white shark dietary patterns reveals
ontogenetic and among-individual variation. This finding con-
trasts with previous dietary assessments based on coastal observa-
tions and stable isotope data, which suggest that nearshore
pinnipeds were the preferred prey for this population
[18,19,35,46].
(a) Ontogenetic PatternsPrevious studies [16,36,52,53] have suggested a shift from low to
high trophic level prey with age in white sharks, and the overall
increase in d15N values with age reported here is consistent with
this scenario. We expected the time series from all sharks to exhibit
a trend of early increase in d15N values, followed by a plateau once
individuals had switched to a high-trophic level adult diet. While
this pattern was evident for some individuals, it was not the
dominant trend in our sample (Figure 1). The variation in
ontogenetic patterns cannot be explained by long-term environ-
mental changes, as sharks that exhibited the asymptotic increase in
d15N values and those that did not spanned the temporal range of
our study.
Figure 2. Carbon and nitrogen isotope values from sub-adult to adult growth bands ($6 years old). The colored symbols are from whitesharks; open symbols represent years #1986 and closed symbols represent years .1986. Isotopic values for potential prey data are the grey boxesand are as follows: 1) northern elephant seal, 2) California sea lion, 3) harbor seal, 4) dolphin, 5) harbor porpoise, 6) tuna, 7) neritic fish, 8) offshorecephalopod, 9) nearshore cephalopod, 10) blue shark, 11) hammerhead shark. The mean prey isotope values were corrected for trophic enrichment(D13C = 4.2% and D15N = 2.5%) and collagen-to-muscle (D13C = 2.0% and D15N = 0%), if necessary (prey data and citations are listed in File S2).doi:10.1371/journal.pone.0045068.g002
Variable Foraging Strategies among White Sharks
PLOS ONE | www.plosone.org 6 September 2012 | Volume 7 | Issue 9 | e45068
Variable Foraging Strategies among White Sharks
PLOS ONE | www.plosone.org 7 September 2012 | Volume 7 | Issue 9 | e45068
The lack of a rise in d15N values in some individuals is due to
high values in years 1–5. Below, we discuss three possible
explanations for these high values.
1) If young sharks scavenged carcasses of pinnipeds or large
squid [78], they would have high d15N values. Because
feeding observations of juvenile white sharks are rare, this
hypothesis is untested.
2) A residual signal from maternally-derived nutrients may label
these early growth increments because of long incorporation
rates [77]. We consider this unlikely, as rapid juvenile growth
[56,79] likely erases the isotopic signal from maternal
resources beyond the first growth increment.
3) A small but significant amount of metabolic turnover within
vertebral centra could label growth bands 1–5 with material
that reflects the high trophic level diets of adults. This
explanation would require near complete turnover of
collagen in grown increments 1–5, which seem unlikely given
the densely mineralized acellular cartilage in shark vertebrae,
but remodeling could occur during sustained swimming, as
evidenced in bony fish [80,81].
(b) Vertebrae Discrimination FactorsThe trophic enrichment used for white shark prey comparisons
was based on the leopard shark discrimination factors (D13C and
D15N values equal 4.2% and 2.5%, respectively). These shark-
specific collagen discrimination factors are greater than other
tissues (i.e., blood or muscle) [22], but similar to other collagen
discrimination factors [82,83]. Because collagen has a high glycine
content, which is relatively 13C-enriched compared to other amino
acids [84], its d13C values are greater than muscle. In contrast to
our study, previously published shark vertebrae discrimination
factors were obtained from relatively short growth periods (,200
days) and collagen was not isolated within the calcified vertebral
tissue [85,86]. Because organic components within a tissue can
have different isotopic values and vary between individuals and
species, it is important to isolate and compare similar substrates,
when possible. Furthermore, the prey isotope values of these
previous studies are confounding factors, as Hussey et al. [85]
estimated prey values from weight-based feeding logs and
Malpica-Cruz et al. [86] fed sharks a pellet diet that was low in
protein relative to natural diets, two important factors in
determining discrimination factors [74,87,88].
(c) Assessment of Sub-adult to Adult White Shark DietIsotopic results from white shark vertebrae indicate a diverse
diet and support their classification as a generalist population
(Figure 2). Representing the entire dietary range of white shark
prey species and localities is not feasible. Therefore we present
data on a subset of common potential prey identified from
stomach content studies that span a diverse range of trophic levels
and habitats (Figure 2). One potential prey group we omitted was
large whales because white sharks selectively consume their
blubber [11] and collagen is primarily routed from dietary protein
[89,90].
Although most white sharks exhibit a range of intermediate
isotopic values, which is consistent with previous isotopic evidence
for both nearshore and offshore foraging [18], strategies may vary
among individuals. In combination, isotopic values, ontogenetic
patterns and wij values can indicate the extent of pinniped
consumption. For example, individuals with intermediate isotope
values, ontogenetic shift to higher trophic level, and a high degree
of specialization (27015, 26781, and WS KG) are likely foraging
on pinnipeds when near shore. However, intermediate isotopic
values suggest that there are some offshore inputs (with lower d3C
and d15N values). Other individuals (i.e., WH 17, WS 100, WS
128, 56731–1) that also have intermediate isotope values, but with
little to no ontogenetic shift and a low degree of specialization, are
likely opportunistic, non-specialized foragers. One distinct outlier
among the sharks in our population is WS 21, which had low d13C
and d15N values throughout its lifetime (Figure 2). These isotopic
values suggest this individual did not consume marine mammals
and its foraging ecology likely diverged from the well-studied
California and Baja populations [14–18].
These isotopic results demonstrate the broad dietary range of
white sharks, but caution should be taken when attempting to
determine prey more specifically. The prey isotope values (after
trophic enrichment correction) mostly encompass the white shark
data, but overlap of a consumer’s d13C and d15N values with a
prey could also result from integration across several outlying prey
taxa. For example, the isotopic values for 26781 overlap with
dolphin and harbor porpoise (preys 4 and 5, respectively, in
Figure 2) whereas CC3’s values overlap with California sea lion,
dolphin, and harbor porpoise (preys 2, 4, and 5, respectively, in
Figure 2). However, it is likely that the isotopic mixing space for
these sharks also included the following outlying prey: northern
elephant seals, harbor seals, tuna, off-, and nearshore cephalopods
(preys 1, 2, 6, 8, and 9 respectively, in Figure 2). Overall, the
isotopic data for 26781 and CC3 suggest marine mammals were
Figure 3. The niche overlap between each individual and the population. A) The 90% confidence limit for the population (black ellipse) andfor individual sharks (colored ellipses). B) The distribution of the proportional similarity index, wij [66], within the sampled population of Californiawhite sharks, which exhibits strong individuality with both specialists and generalists.doi:10.1371/journal.pone.0045068.g003
Table 2. Average width of last 6 growth bands and average isotopic values from outer-12 mm of vertebrae from leopard sharksfed a constant diet of squid over 1250 days.
IndividualAverage width of last 6 growthbands ± SD (n), mm Average d13C value ± SD (n), % Average d15N value ± SD (n), %
Diet 218.560.3 (43) 13.360.7 (43)
CS 3.1060.38 (18) 214.160.4 (8) 15.960.8 (8)
FS 2.5460.51 (18) 214.460.5 (8) 16.161.1 (8)
FL 2.9960.41 (24) 214.660.3 (4) 15.360.5 (4)
doi:10.1371/journal.pone.0045068.t002
Variable Foraging Strategies among White Sharks
PLOS ONE | www.plosone.org 8 September 2012 | Volume 7 | Issue 9 | e45068
the dominant prey but cephalopods and tuna were also likely
consumed when individuals were offshore, similar to results from
satellite tagged white sharks [18].
(d) IndividualityThe isotopic data in aggregate suggest that northeast Pacific
white sharks are generalists at the population level, but further
analysis reveals a high degree of individual specialization within
the population. Individual differences within the white shark
population can be attributed to changes in prey preference and
foraging location with ontogeny. A core constraint on our analysis
of niche occupancy and breadth is that if isotopic values differ
between two specimens, then either prey type or foraging location
(or both) must differ between the specimens. The converse is not
true, however. Isotopic similarity between two specimens could
result from consumption of the same prey in the same location, but
also from fortuitous combinations of different prey types in
different locations. Because we do not attempt to specify the
particular prey, our assessment of individuality is a conservative
measure and reflects minimal niche differences.
The proportional similarity index (wij) quantified and compared
isotopic variation within each individual to the population’s
isotopic distribution. The wij values for the sampled population
indicated 8 specialists (wij = 0–0.33), 4 generalists (wij = 0.73–0.90),
and 3 animals with intermediate values (wij = 0.42–0.59; Table 1).
We note the distinction between wij (which describes the
proportional overlap between an individual’s isotopic values and
the population’s average) and isotopic niche breadth (the absolute
range of isotopic variation in an individual), as these two metrics
are not necessarily correlated. For example, isotopic niche breadth
was similar for specimens 42094–2 and 42898 PR (represented by
individual isotopic distributions in Figure 3A), but their wij values
were 0.33 and 0.51, respectively (Table 1). The higher wij value for
42898 PR reflects the fact that its isotopic niche, while narrow,
overlaps with a greater number of conspecifics.
ConclusionsStable isotope analysis of white shark vertebrae provided
lifetime records of diet and revealed a variety of feeding patterns.
For example, we found significant variability in the degree and
timing of shifts in d15N values with age among individuals.
Although there was a significant difference between young and
adult diets, not all individuals displayed a shift to a higher trophic
level prey. The isotopic data suggest that as a population, sub-
adult to adult white sharks are generalist predators and consume a
diverse array of high and low trophic level prey from nearshore
and offshore habitats. However, a comparison between individual
and population isotopic niche overlap revealed a high degree of
dietary individuality.
Although confounding factors, such as the lack of biological
metadata and unknown effects of physiological characteristics,
prevent specific dietary assessments, this study provides the first
evidence of ontogenetic and individual dietary variation in white
sharks. One potential explanation for this pattern may be a
mechanism to increase foraging success in species experiencing
high intraspecific competition (i.e., the niche variation hypothesis
[91]). Instead of individuals using all resources (i.e., potential prey
or foraging locations) equally, individual foraging patterns diverge
to create a spectrum of specialists that do not differ in survival or
reproductive success [2,4,43,92,93]. This isotopic study, in
conjunction with satellite tagging studies, is expanding our
understanding of the foraging ecology of white sharks.
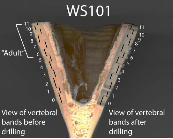
Supporting Information
File S1 Photo showing annual growth bands before (left) and
after drilling (right) on specimen WS101. Ages are also noted next
to the growth bands.
(TIF)
File S2 The compiled prey isotope values from the literature and
unpublished data used in Figure 2.
(DOC)
File S3 The ontogeny of d13C values for the 15 white sharks
analyzed for this study. Individuals are in the same A, B, and C
groups as Figure 1.
(TIF)
Acknowledgments
We thank S. Anderson (Point Reyes Bird Observatory), G. Caillet (Moss
Landing Marine Lab), D. Casper (UCSC), D. Catania, (California
Academy of Sciences), K. Goldman (Alaska Department of Fish & Game),
S. Jorgensen (Stanford University), and J. Seigel (Natural History Museum
of Los Angeles County) for allowing the destructive sampling of white shark
vertebrae used in this study; W. Smith and others at the Moss Landing
Marine Lab Ichthyology lab for secondary vertebral growth band counts
before sampling for isotopic analysis; and R. Brown, K. Fox-Dobbs, S.
Jorgensen, D. Shizuka, P. Wheatley, J. Yeakel, and two anonymous
reviewers for constructive reviews. Any use of trade, product, or firm
names in this publication is for descriptive purposes only and does not
imply endorsement by the U.S. government.
Author Contributions
Conceived and designed the experiments: SLK PLK. Performed the
experiments: SLK MTT JAE PLK. Analyzed the data: SLK MTT JAE
PLK. Contributed reagents/materials/analysis tools: SLK MTT JAE
PLK. Wrote the paper: SLK MTT JAE PLK.
References
1. Ford JKB, Ellis GM, Barrett-Lennard LG, Morton AB, Palm RS, et al. (1998)
Dietary specialization in two sympatric populations of killer whales (Orcinus orca)
in coastal British Columbia and adjacent waters. Can J Zool 76: 1456–1471.
2. Bolnick DI, Svanback R, Fordyce JA, Yang LH, Davis JM, et al. (2003) The
ecology of individuals: incidence and implications of individual specialization.
Am Nat 161: 1–28. doi:10.1086/343878.
3. Tinker M, Costa D, Estes J, Wieringa N (2007) Individual dietary specialization
and dive behaviour in the California sea otter: using archival time–depth data to
detect alternative foraging strategies. Deep Sea Research Part II: Topical Studies
in Oceanography 54: 330–342. doi:10.1016/j.dsr2.2006.11.012.
4. Tinker MT, Bentall G, Estes JA (2008) Food limitation leads to behavioral
diversification and dietary specialization in sea otters. Proceedings of the
National Academy of Sciences 105: 560.
5. Quevedo M, Svanback R, Eklov P (2009) Intrapopulation niche partitioning in a
generalist predator limits food web connectivity. Ecology 90: 2263–2274.
6. Myers RA, Baum JK, Shepherd TD, Powers SP, Peterson CH (2007) Cascading
effects of the loss of apex predatory sharks from a coastal ocean. Science 315:
1846–1850. doi:10.1126/science.1138657.
7. Baum JK, Worm B (2009) Cascading top-down effects of changing oceanic
predator abundances. J Anim Ecology 78: 699–714. doi:10.1111/j.1365–
2656.2009.01531.x.
8. LeBouef BJ, Reidman M, Keyes RS (1982) White shark predation on pinnipeds
in California coastal waters. Fishery Bulletin: 891–895.
9. Klimley A (1985) The areal distribution and autoecology of the white shark,
Carcharodon carcharias, off the west coast of North America. In: Sibley G, editor.
Biology of the White Shark: A Symposium. Los Angeles: Southern California
Academy of Sciences, Vol. 9. 15–40.
10. Klimley AP, Anderson SD, Pyle P, Henderson R (1992) Spatiotemporal patterns
of white shark (Carcharodon carcharias) predation at the South Farallon Islands,
California. Copeia: 680–690.
Variable Foraging Strategies among White Sharks
PLOS ONE | www.plosone.org 9 September 2012 | Volume 7 | Issue 9 | e45068
11. Long DJ, Jones RE (1996) White shark predation and scavenging on cetaceansin the eastern North Pacific. In: Klimley AP, Ainley DG, editors. Great White
Sharks: The Biology of Carcharodon carcharias. San Diego: Academic Press. 293–
307.
12. Long DJ, Hanni KD, Pyle P, Roletto J, Jones RE, et al. (1996) White shark
predation on four pinniped species in central california waters: geographic and
temporal patterns inferred from wounded carcasses. In: Klimley AP, Ainley DP,editors. Great White Sharks: The Biology of Carcharodon carcharias. San Diego:
Academic Press. 309–316.
13. Brown AC, Lee DE, Bradley RW, Anderson S (2010) Dynamics of white shark
predation on pinnipeds in california: effects of prey abundance. Copeia 2010:
232–238. doi:10.1643/CE-08-012.
14. Boustany AM, Davis SF, Pyle P, Anderson SD, Le Boeuf BJ, et al. (2002)
Satellite tagging: expanded niche for white sharks. Nature 415: 35–36.
15. Weng KC, Boustany AM, Pyle P, Anderson SD, Brown A, et al. (2007)Migration and habitat of white sharks (Carcharodon carcharias) in the eastern Pacific
Ocean. Mar Biol 152: 877–894. doi:10.1007/s00227-007-0739-4.
16. Jorgensen SJ, Reeb CA, Chapple TK, Anderson S, Perle C, et al. (2010)Philopatry and migration of Pacific white sharks. Proceedings of the Royal
Society B: Biological Sciences 277: 679–688. doi:10.1098/rspb.2009.1155.
17. Domeier M, Nasby-Lucas N (2008) Migration patterns of white sharksCarcharodon carcharias tagged at Guadalupe Island, Mexico, and identification of
an eastern Pacific shared offshore foraging area. Mar Ecol Prog Ser 370: 221–237. doi:10.3354/meps07628.
18. Carlisle AB, Kim SL, Semmens BX, Madigan DJ, Jorgensen SJ, et al. (2012)
Using Stable Isotope Analysis to Understand the Migration and TrophicEcology of Northeastern Pacific White Sharks (Carcharodon carcharias). PLoS ONE
7: e30492. doi:10.1371/journal.pone.0030492.t006.
19. Compagno L (2001) Sharks of the World, vol. 2. Food and AgricultureOrganization of the United Nations, Rome, Italy. pp.
20. Deniro MJ, Epstein S (1978) Influence of Diet on Distribution of Carbon
Isotopes in Animals. Geochimica et Cosmochimica Acta 42: 495–506.
21. Goericke R, Fry B (1994) Variations of marine plankton d13C with latitude,
temperature, and dissolved CO2 in the world ocean. Global Biogeochem Cycles
8: 85–90.
22. Koch PL (2007) Isotopic study of the biology of modern and fossil vertebrates.
In: Michener R, Lajtha K, editors. Stable Isotopes in Ecology and
Environmental Science. Malden: Blackwell Publishing. 99–154.
23. Graham BS, Koch PL, Newsome SD, McMahon KW, Aurioles D (2010) Using
isoscapes to trace the movements and foraging behavior of top predators in
oceanic ecosystems. Isoscapes: 299–318.
24. Dugdale R, Goering J (1967) Uptake of new and regenerated forms of nitrogen
in primary productivity. Limnology and Oceanography: 196–206.
25. Saino T, Hattori A (1987) Geographical variation of the water columndistrubution of suspended particulate organic nitrogen and its 15N natural
abundance in the Pacific and its marginal seas. Deep Sea ResearchPart A Oceanographic Research Papers 34: 807–827.
26. Altabet MA, Francois R (1994) Sedimentary Nitrogen Isotopic Ratio as a
Recorder for Surface Ocean Nitrate Utilization. Global Biogeochem Cycles 8:103–116.
27. Voss M, Dippner JW, Montoya JP (2001) Nitrogen isotope patterns in the
oxygen-deficient waters of the Eastern Tropical North Pacific Ocean. Deep-SeaResearch Part I-Oceanographic Research Papers 48: 1905–1921.
28. Burton RK, Koch PL (1999) Isotopic tracking of foraging and long-distance
migration in northeastern Pacific pinnipeds. Oecologia 119: 578–585.
29. Newsome SD, Clementz MT, Koch PL (2010) Using stable isotope
biogeochemistry to study marine mammal ecology. Marine Mammal Science
26: 509–572. doi:10.1111/j.1748–7692.2009.00354.x.
30. Reich KJ, Bjorndal KA, Martınez del Rio C (2008) Effects of growth and tissue
type on the kinetics of 13C and 15N incorporation in a rapidly growing
ectotherm. Oecologia 155: 651–663. doi:10.1007/s00442–007–0949-y.
31. McClellan CM, Braun-McNeill J, Avens L, Wallace BP, Read AJ (2010) Stable
isotopes confirm a foraging dichotomy in juvenile loggerhead sea turtles. Journalof Experimental Marine Biology and Ecology 387: 44–51.
32. Vander Zanden HB, Bjorndal KA, Reich KJ, Bolten AB (2010) Individual
specialists in a generalist population: results from a long-term stable isotopeseries. Biology Letters 6: 711–714.
33. Matich P, Heithaus MR, Layman CA (2010) Contrasting patterns of individual
specialization and trophic coupling in two marine apex predators. J AnimEcology 80: 294–305. doi:10.1111/j.1365-2656.2010.01753.x.
34. Fisk AT, Tittlemier SA, Pranschke JL, Norstrom RJ (2002) Using anthropogenic
contaminants and stable isotopes to assess the feeding ecology of greenlandsharks. Ecology 83: 2162–2172.
35. Estrada J, Rice A, Lutcavage M, Skomall G (2003) Predicting trophic position in
sharks of the north-west Atlantic Ocean using stable isotope analysis. J Mar BiolAssoc Uk 83: 1347–1350.
36. Estrada JA, Rice AN, Natanson LJ, Skomal GB (2006) Use of isotopic analysis of
vertebrae in reconstructing ontogenetic feeding ecology in white sharks. Ecology87: 829–834.
37. Domi N, Bouquegneau JM, Das K (2005) Feeding ecology of five commercial
shark species of the Celtic Sea through stable isotope and trace metal analysis.Marine Environmental Research 60: 551–569.
38. MacNeil MA, Skomal GB, Fisk AT (2005) Stable isotopes from multiple tissues
reveal diet switching in sharks. Mar Ecol Prog Ser 302: 119–206.
39. Papastamatiou YP, Friedlander AM, Caselle JE, Lowe CG (2010) Long-term
movement patterns and trophic ecology of blacktip reef sharks (Carcharhinus
melanopterus) at Palmyra Atoll. Journal of Experimental Marine Biology and
Ecology 386: 94–102.
40. Hutchinson G (1992) Population studies: animal ecology and demography.
Bulletin of Mathematical Biology.
41. Newsome SD, Martınez del Rio C, Bearhop S, Phillips DL (2007) A niche for
isotopic ecology. Front Ecol Environ 5: 429–436. doi:10.1890/060150.01.
42. Bearhop S, Adams CE, Waldron S, Fuller RA, Macleod H (2004) Determining
trophic niche width: a novel approach using stable isotope analysis. J Anim
Ecology 73: 1007–1012.
43. Newsome SD, Tinker MT, Monson DH, Oftedal OT, Ralls K, et al. (2009)
Using stable isotopes to investigate individual diet specialization in California sea
otters (Enhydra lutris nereis). Ecology 90: 961–974.
44. Koch PL, Fisher DC, Dettman D (1989) Oxygen isotope variation in the tusks of
extinct proboscideans - a measure of season of death and seasonality. Geology
17: 515–519.
45. Hobson KA, Schell DM (1998) Stable carbon and nitrogen isotope patterns in
baleen from eastern Arctic bowhead whales (Balaena mysticetus). Can J Fish Aquat
Sci 55: 2601–2607.
46. Kerr LA, Andrews AH, Cailliet GM, Brown TA, Coale KH (2006)
Investigations of D14C, d13C, and d15N in vertebrae of white shark (Carcharodon
carcharias) from the eastern North Pacific Ocean. Environ Biol Fish 77: 337–353.
doi:10.1007/s10641-006-9125-1.
47. Kelly B, Dempson JB, Power M (2006) The effects of preservation on fish tissue
stable isotope signatures. J Fish Biology 69: 1595–1611.
48. Kim SL, Koch PL (2012) Methods to collect, preserve, and prepare
elasmobranch tissues for stable isotope analysis. Environ Biol Fish 95: 53–63.
doi:10.1007/s10641-011-9860-9.
49. Natanson LJ, Mello JJ, Campana SE (2002) Validated age and growth of the
porbeagle shark (Lamna nasus) in the western North Atlantic Ocean. Fishery
Bulletin 100: 266–278.
50. Long ES, Sweitzer RA, Diefenbach DR, Ben-David M (2005) Controlling for
anthropogenically induced atmospheric variation in stable carbon isotope
studies. Oecologia 146: 148–156. doi:10.1007/s00442-005-0181-6.
51. Francey R, Allison C, Etheridge D, Trudinger C, Enting I, et al. (1999) A 1000-
year high precision record of d13C in atmospheric CO2. Tellus B 51: 170–193.
52. Ainley DG, Henderson AC, Huber HP, Boekelheide RJ, Allen SG, et al. (1985)
Dynamics of white shark/pinniped interactions in the Gulf of the Farallones. In:
Sibley G, editor. Biology of the White Shark: A Symposium. Los Angeles:
Southern California Academy of Sciences, Vol. 9. 109–122.
53. Hubbell G (1996) Using tooth structure to determine the evolutionary history of
the white shark. In: Klimley AP, Ainley DG, editors. Great White Sharks: The
Biology of Carcharodon carcharias. San Diego: Academic Press. 9–18.
54. Bertalanffy von L (1938) A quantitative theory of organic growth (inquiries on
growth laws II. Human Biol 10: 181–213.
55. Cailliet GM, Natanson L, Welden B, Ebert D (1985) Preliminary studies on the
age and growth of the white shark, Carcharodon carcharias, using vertebral bands.
In: Sibley G, editor. Biology of the White Shark: A Symposium. Los Angeles:
Southern California Academy of Sciences, Vol. 9. 49–60.
56. Wintner SP, Cliff G (1999) Age and growth determination of the white shark,
Carcharodon carcharias, from the east coast of South Africa. Fishery Bulletin 97:
153–169.
57. Moore JW, Semmens BX (2008) Incorporating uncertainty and prior
information into stable isotope mixing models. Ecology Letters 11: 470–480.
doi:10.1111/j.1461-0248.2008.01163.x.
58. Newsome SD, Koch PL, Etnier MA, Aurioles-Gambao D (2006) Using carbon
and nitrogen isotope values to investigate maternal strategies in northeast Pacific
otariids. Marine Mammal Science 22: 556–572.
59. Toperoff AK (2002) Examination of diet of harbor porpoise (Phocoena phocoena)
from central California using stomach content and stable isotope analysis from
multiple tissues. San Jose. p.
60. Graham BS (2008) Trophic dynamics and movements of tuna in the tropical
Pacific Ocean inferred from stable isotope analyses. University of Hawai’i at
Manoa. p.
61. Sydeman WJ, Hobson KA, Pyle P, McLaren EB (1997) Trophic relationships
among seabirds in central California: combined stable isotope and conventional
dietary approach. Condor 99: 327–336.
62. Kim SL, Casper DR, Galvan-Magana F, Ochoa-Dıaz R, Hernandez-Aguilar
SB, et al. (2012) Carbon and nitrogen discrimination factors for elasmobranch
soft tissues based on a long-term controlled feeding study. Environ Biol Fish 95:
37–52. doi:10.1007/s10641-011-9919-7.
63. Gould P, Ostrom P, Walker W (1997) Trophic relationships of albatrosses
associated with squid and large-mesh drift-net fisheries in the North Pacific
Ocean. Can J Zool 75: 549–562.
64. Ochoa Dıaz R (2009) Espectro trofico del tiburon martillo Sphyrna zygaena
(Linnaeus, 1758 ) en Baja California Sur: aplicacion de 13C y 15N. La Paz:
Centro Interdisciplinario de Ciencias Marinas. p.
65. Pianka ER (1974) Niche overlap and diffuse competition. Proceedings of the
National Academy of Sciences 71: 2141.
66. Lu R-P, Smith EP, Good IJ (1989) Multivariate measures of similarity and niche
overlap. Theor Popul Biol 35: 1–21.
Variable Foraging Strategies among White Sharks
PLOS ONE | www.plosone.org 10 September 2012 | Volume 7 | Issue 9 | e45068
67. Sydeman WJ, Allen SG (1999) Pinniped population dynamics in central
California: Correlations with sea surface temperature and upwelling indices.Marine Mammal Science 15: 446–461.
68. Carretta JV, Forney KA, Muto MM, Barlow J, Baker J, et al. (2007) U.S. Pacific
Marine Mammal Stock Assessments: 2006 National Coean and AtmosphericAdministration. p.321.
69. Anderson DR, Burnham KP, White GC (1998) Comparison of Akaikeinformation criterion and consistent Akaike information criterion for model
selection and statistical inference from capture-recapture studies. Journal of
Applied Statistics 25: 263–282.70. Deniro MJ, Epstein S (1981) Influence of diet on the distribution of nitrogen
isotopes in animals. Geochimica et Cosmochimica Acta 45: 341–351.71. Tieszen LL, Boutton TW, Tesdahl K, Slade NA (1983) Fractionation and
turnover of stable carbon isotopes in animal tissues: implications for d13Canalysis of diet. Oecologia 57: 32–37.
72. Post DM (2002) The long and short of food-chain length. Trends in Ecology &
Evolution 17: 269–277.73. Gannes LZ, Obrien DM, Martınez del Rio C (1997) Stable isotopes in animal
ecology: assumptions, caveats, and a call for more laboratory experiments.Ecology 78: 1271–1276.
74. Martınez del Rio C, Wolf N, Carleton SA, Gannes LZ (2009) Isotopic ecology
ten years after a call for more laboratory experiments. Biological Reviews 84:91–111. doi:10.1111/j.1469-185X.2008.00064.x.
75. Ishiyama R (1951) Studies on the rays and skates belonging to the familyRajidae, found in Japan and adjacent regions. 2. On the age-determination of
the Japanese black-skate Raja fusca Garman (Preliminary report). 3. Agedetermination of Raja hollandi Jordan et Richardson chiefly inhabiting waters of
the east China Sea. Bull Japanese Soc Sci Fish 16: 112.
76. Ainsley SM (2009) Age, growth and reproduction of the Bering skate, Bathyraja
interrupta (Gill & Townsend, 1897), from the eastern Bering Sea and Gulf of
Alaska.77. Kim SL, Martınez del Rio C, Casper D, Koch PL (2012) Isotopic incorporation
rates for shark tissues from a long-term captive feeding study. Journal of
Experimental Biology 215: 2495–2500. doi:10.1242/jeb.070656.78. Ruiz-Cooley RI, Markaida U, Gendron D, Aguinga S (2006) Stable isotopes in
jumbo squid (Dosidicus gigas) beaks to estimate its trophic position: comparisonbetween stomach contents and stable isotopes. J Mar Biol Assoc Uk 86: 437–
445.79. Cailliet GM, Smith WD, Mollet HF, Goldman KJ (2006) Age and growth
studies of chondrichthyan fishes: the need for consistency in terminology,
verification, validation, and growth function fitting. Environ Biol Fish 77: 211–228. doi:10.1007/s10641-006-9105-5.
80. Kranenbarg S (2005) Adaptive bone formation in acellular vertebrae of sea bass(Dicentrarchus labrax L.). Journal of Experimental Biology 208: 3493–3502.
doi:10.1242/jeb.01808.
81. Deschamps MH, Girondot M, Labbe L, Sire JY (2009) Changes in vertebral
structure during growth of reared rainbow trout, Oncorhynchus mykiss
(Walbaum): a new approach using modelling of vertebral bone profiles. Journal
of Fish Diseases 32: 233–246.
82. Bocherens H, Drucker D (2003) Trophic level isotopic enrichment of carbon and
nitrogen in bone collagen: case studies from recent and ancient terrestrial
ecosystems. Int J Osteoarchaeol 13: 46–53. doi:10.1002/oa.662.
83. Fox-Dobbs K, Bump JK, Peterson RO, Fox DL, Koch PL (2007) Carnivore-
specific stable isotope variables and variation in the foraging ecology of modern
and ancient wolf populations: case studies from Isle Royale, Minnesota, and La
Brea. Can J Zool 85: 458–471. doi:10.1139/Z07–018.
84. Jim S, Jones V, Ambrose SH, Evershed RP (2006) Quantifying dietary
macronutrient sources of carbon for bone collagen biosynthesis using natural
abundance stable carbon isotope analysis. Brit J Nutr 95: 1055–1062.
85. Hussey NE, Brush J, McCarthy ID, Fisk AT (2009) d15N and d13C diet–tissue
discrimination factors for large sharks under semi-controlled conditions.
Comparative Biochemistry and Physiology, Part A: 1–9. doi:10.1016/
j.cbpa.2009.09.023.
86. Malpica-Cruz L, Herzka SZ, Sosa-Nishizaki O, Lazo JP, Trudel M (2012)
Tissue-specific isotope trophic discrimination factors and turnover rates in a
marine elasmobranch: empirical and modeling results. Can J Fish Aquat Sci 69:
551–564. doi:10.1139/f2011–172.
87. Robbins CT, Felicetti LA, Florin ST (2009) The impact of protein quality on
stable nitrogen isotope ratio discrimination and assimilated diet estimation.
Oecologia 162: 571–579. doi:10.1007/s00442-009-1485-8.
88. Caut S, Angulo E, Courchamp F (2009) Variation in discrimination factors
(D15N and D13C): the effect of diet isotopic values and applications for diet
reconstruction. Journal of Applied Ecology 46: 443–453. doi:10.1111/j.1365-
2664.2009.01620.x.
89. Howland MR, Corr LT, Young SMM, Jones V, Jim S, et al. (2003) Expression
of the dietary isotope signal in the compound-specific delta(13) values of pig bone
lipids and amino acids. Int J Osteoarchaeol 13: 54–65.
90. Jim S, Ambrose SH, Evershed RP (2004) Stable carbon isotopic evidence for
differences in the dietary origin of bone cholesterol, collagen and apatite:
Implications for their use in palaeodietary reconstruction. Geochimica et
Cosmochimica Acta 68: 61–72.
91. Van Valen L (1965) Morphological variation and width of ecological niche.
Amer Natur 99: 377–390.
92. Estes J, Riedman M, Staedler M, Tinker M, Lyon B (2003) Individual variation
in prey selection by sea otters: patterns, causes and implications. J Anim Ecology
72: 144–155.
93. Woo KJ, Elliott KH, Davidson M, Gaston AJ, Davoren GK (2008) Individual
specialization in diet by a generalist marine predator reflects specialization in
foraging behaviour. J Anim Ecology 77: 1082–1091.
Variable Foraging Strategies among White Sharks
PLOS ONE | www.plosone.org 11 September 2012 | Volume 7 | Issue 9 | e45068
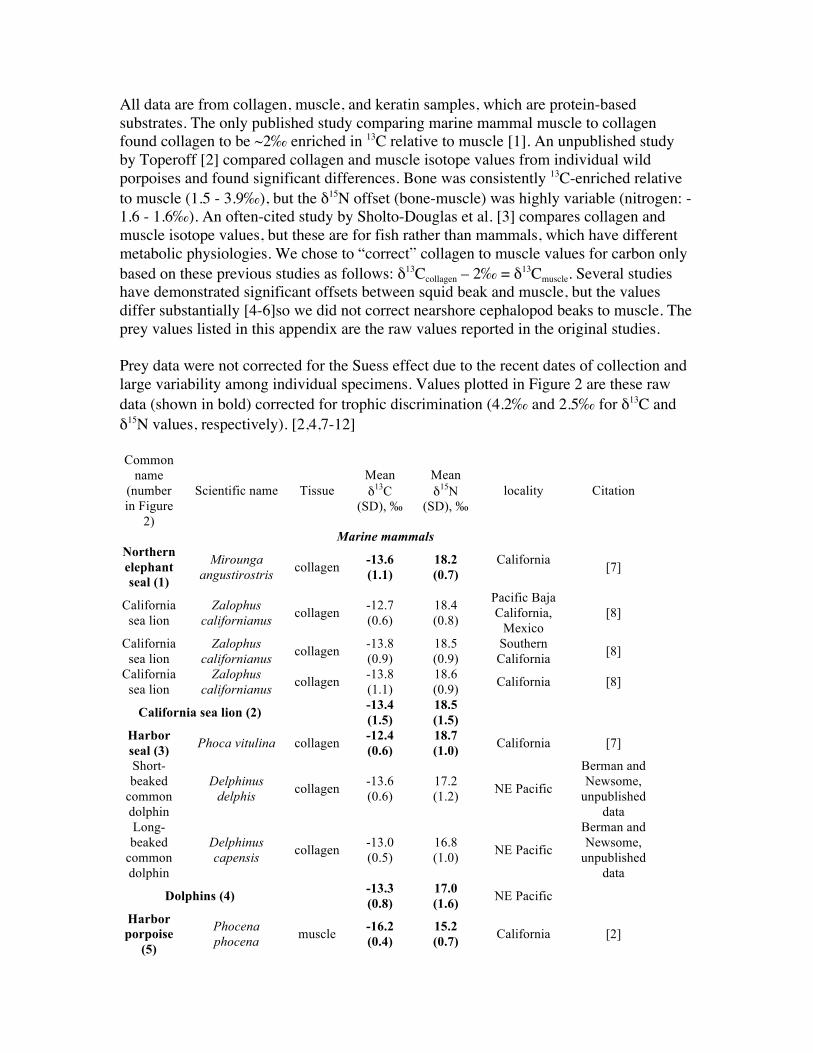
All data are from collagen, muscle, and keratin samples, which are protein-based substrates. The only published study comparing marine mammal muscle to collagen found collagen to be ~2‰ enriched in 13C relative to muscle [1]. An unpublished study by Toperoff [2] compared collagen and muscle isotope values from individual wild porpoises and found significant differences. Bone was consistently 13C-enriched relative to muscle (1.5 - 3.9‰), but the δ15N offset (bone-muscle) was highly variable (nitrogen: -1.6 - 1.6‰). An often-cited study by Sholto-Douglas et al. [3] compares collagen and muscle isotope values, but these are for fish rather than mammals, which have different metabolic physiologies. We chose to “correct” collagen to muscle values for carbon only based on these previous studies as follows: δ13Ccollagen – 2‰ = δ13Cmuscle. Several studies have demonstrated significant offsets between squid beak and muscle, but the values differ substantially [4-6]so we did not correct nearshore cephalopod beaks to muscle. The prey values listed in this appendix are the raw values reported in the original studies. Prey data were not corrected for the Suess effect due to the recent dates of collection and large variability among individual specimens. Values plotted in Figure 2 are these raw data (shown in bold) corrected for trophic discrimination (4.2‰ and 2.5‰ for δ13C and δ15N values, respectively). [2,4,7-12]
Common
name (number in Figure
2)
Scientific name Tissue Mean δ13C
(SD), ‰
Mean δ15N
(SD), ‰ locality Citation
Marine mammals Northern elephant seal (1)
Mirounga angustirostris
collagen -13.6 (1.1)
18.2 (0.7)
California
[7]
California sea lion
Zalophus californianus
collagen -12.7 (0.6)
18.4 (0.8)
Pacific Baja California,
Mexico [8]
California sea lion
Zalophus californianus
collagen -13.8 (0.9)
18.5 (0.9)
Southern California
[8]
California sea lion
Zalophus californianus
collagen -13.8 (1.1)
18.6 (0.9)
California [8]
California sea lion (2) -13.4 (1.5)
18.5 (1.5)
Harbor seal (3)
Phoca vitulina collagen -12.4 (0.6)
18.7 (1.0)
California [7]
Short-beaked
common dolphin
Delphinus delphis
collagen -13.6 (0.6)
17.2 (1.2)
NE Pacific
Berman and Newsome,
unpublished data
Long-beaked
common dolphin
Delphinus capensis
collagen -13.0 (0.5)
16.8 (1.0)
NE Pacific
Berman and Newsome,
unpublished data
Dolphins (4) -13.3 (0.8)
17.0 (1.6)
NE Pacific
Harbor porpoise
(5)
Phocena phocena
muscle -16.2 (0.4)
15.2 (0.7)
California [2]
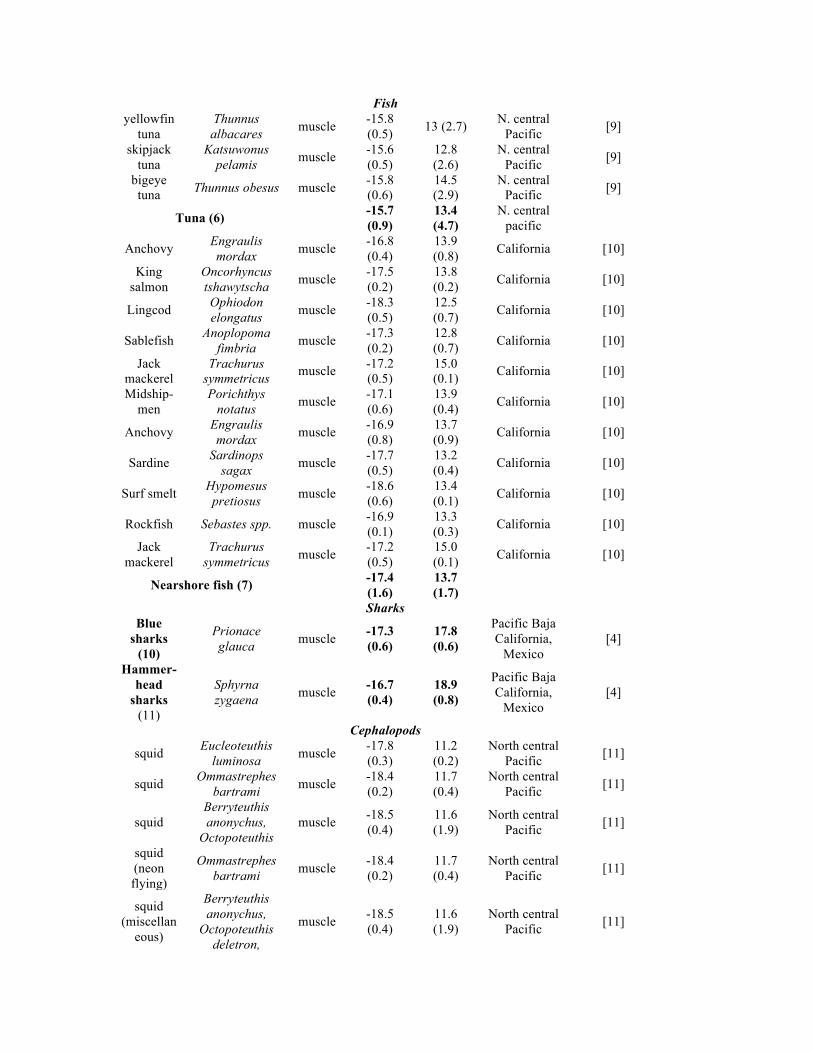
Fish yellowfin
tuna Thunnus
albacares muscle
-15.8 (0.5)
13 (2.7) N. central
Pacific [9]
skipjack tuna
Katsuwonus pelamis
muscle -15.6 (0.5)
12.8 (2.6)
N. central Pacific
[9]
bigeye tuna Thunnus obesus muscle
-15.8 (0.6)
14.5 (2.9)
N. central Pacific [9]
Tuna (6) -15.7 (0.9)
13.4 (4.7)
N. central pacific
Anchovy Engraulis mordax
muscle -16.8 (0.4)
13.9 (0.8)
California [10]
King salmon
Oncorhyncus tshawytscha
muscle -17.5 (0.2)
13.8 (0.2)
California [10]
Lingcod Ophiodon elongatus
muscle -18.3 (0.5)
12.5 (0.7)
California [10]
Sablefish Anoplopoma
fimbria muscle
-17.3 (0.2)
12.8 (0.7)
California [10]
Jack mackerel
Trachurus symmetricus
muscle -17.2 (0.5)
15.0 (0.1)
California [10]
Midship-men
Porichthys notatus
muscle -17.1 (0.6)
13.9 (0.4)
California [10]
Anchovy Engraulis mordax
muscle -16.9 (0.8)
13.7 (0.9)
California [10]
Sardine Sardinops
sagax muscle
-17.7 (0.5)
13.2 (0.4)
California [10]
Surf smelt Hypomesus pretiosus
muscle -18.6 (0.6)
13.4 (0.1)
California [10]
Rockfish Sebastes spp. muscle -16.9 (0.1)
13.3 (0.3)
California [10]
Jack mackerel
Trachurus symmetricus
muscle -17.2 (0.5)
15.0 (0.1)
California [10]
Nearshore fish (7) -17.4 (1.6)
13.7 (1.7)
Sharks Blue
sharks (10)
Prionace glauca
muscle -17.3 (0.6)
17.8 (0.6)
Pacific Baja California,
Mexico [4]
Hammer- head
sharks (11)
Sphyrna zygaena
muscle -16.7 (0.4)
18.9 (0.8)
Pacific Baja California,
Mexico [4]
Cephalopods
squid Eucleoteuthis
luminosa muscle
-17.8 (0.3)
11.2 (0.2)
North central Pacific
[11]
squid Ommastrephes
bartrami muscle -18.4 (0.2)
11.7 (0.4)
North central Pacific
[11]
squid Berryteuthis anonychus,
Octopoteuthis muscle
-18.5 (0.4)
11.6 (1.9)
North central Pacific
[11]
squid (neon flying)
Ommastrephes bartrami muscle
-18.4 (0.2)
11.7 (0.4)
North central Pacific
[11]
squid (miscellan
eous)
Berryteuthis anonychus,
Octopoteuthis deletron,
muscle -18.5 (0.4)
11.6 (1.9)
North central Pacific
[11]
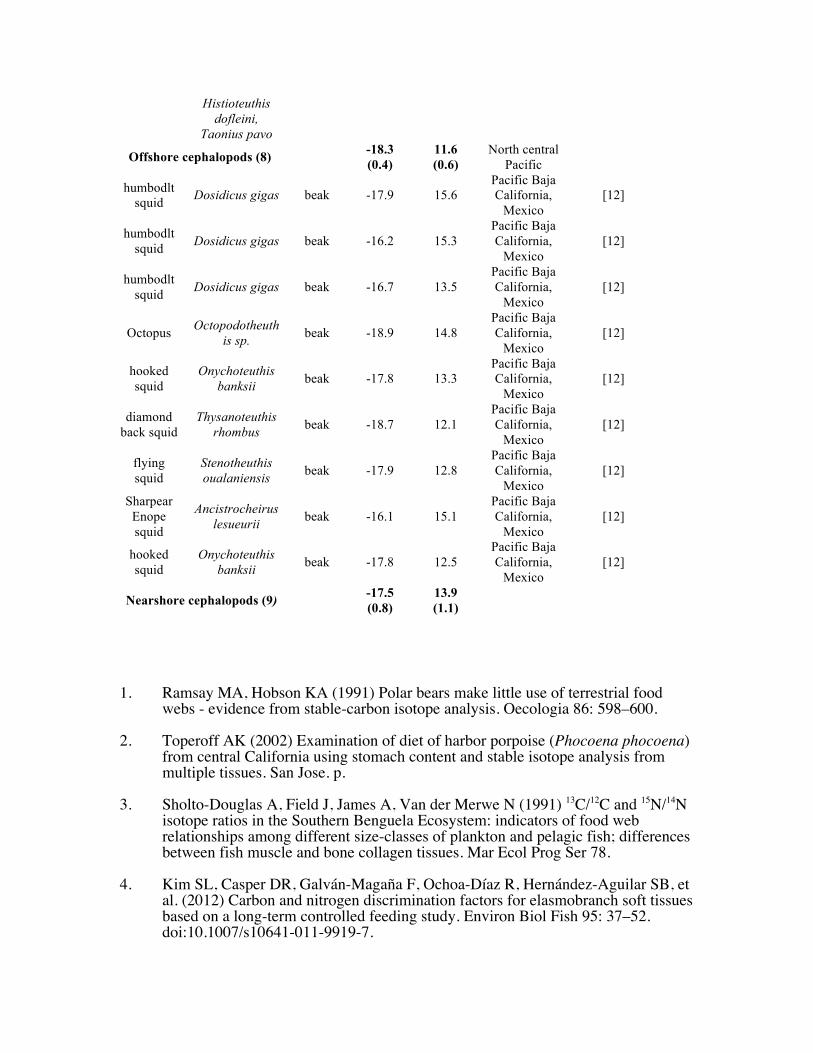
Histioteuthis dofleini,
Taonius pavo
Offshore cephalopods (8) -18.3 (0.4)
11.6 (0.6)
North central Pacific
humbodlt squid
Dosidicus gigas beak -17.9 15.6 Pacific Baja California,
Mexico [12]
humbodlt squid
Dosidicus gigas beak -16.2 15.3 Pacific Baja California,
Mexico [12]
humbodlt squid
Dosidicus gigas beak -16.7 13.5 Pacific Baja California,
Mexico [12]
Octopus Octopodotheuth
is sp. beak -18.9 14.8 Pacific Baja California,
Mexico [12]
hooked squid
Onychoteuthis banksii
beak -17.8 13.3 Pacific Baja California,
Mexico [12]
diamond back squid
Thysanoteuthis rhombus beak -18.7 12.1
Pacific Baja California,
Mexico [12]
flying squid
Stenotheuthis oualaniensis beak -17.9 12.8
Pacific Baja California,
Mexico [12]
Sharpear Enope squid
Ancistrocheirus lesueurii beak -16.1 15.1
Pacific Baja California,
Mexico [12]
hooked squid
Onychoteuthis banksii beak -17.8 12.5
Pacific Baja California,
Mexico [12]
Nearshore cephalopods (9) -17.5 (0.8)
13.9 (1.1)
1. Ramsay MA, Hobson KA (1991) Polar bears make little use of terrestrial food
webs - evidence from stable-carbon isotope analysis. Oecologia 86: 598–600.
2. Toperoff AK (2002) Examination of diet of harbor porpoise (Phocoena phocoena) from central California using stomach content and stable isotope analysis from multiple tissues. San Jose. p.
3. Sholto-Douglas A, Field J, James A, Van der Merwe N (1991) 13C/12C and 15N/14N isotope ratios in the Southern Benguela Ecosystem: indicators of food web relationships among different size-classes of plankton and pelagic fish; differences between fish muscle and bone collagen tissues. Mar Ecol Prog Ser 78.
4. Kim SL, Casper DR, Galván-Magaña F, Ochoa-Díaz R, Hernández-Aguilar SB, et al. (2012) Carbon and nitrogen discrimination factors for elasmobranch soft tissues based on a long-term controlled feeding study. Environ Biol Fish 95: 37–52. doi:10.1007/s10641-011-9919-7.
5. Ruiz-Cooley RI, Markaida U, Gendron D, Aguinga S (2006) Stable isotopes in jumbo squid (Dosidicus gigas) beaks to estimate its trophic position: comparison between stomach contents and stable isotopes. J Mar Biol Assoc Uk 86: 437–445.
6. Hobson KA, Cherel Y (2006) Isotopic reconstruction of marine food webs using cephalopod beaks: new insight from captively raised Sepia officinalis. Can J Zool 84: 766–770. doi:10.1139/z06-049.
7. Burton RK, Koch PL (1999) Isotopic tracking of foraging and long-distance migration in northeastern Pacific pinnipeds. Oecologia 119: 578–585.
8. Newsome SD, Koch PL, Etnier MA, Aurioles-Gambao D (2006) Using carbon and nitrogen isotope values to investigate maternal strategies in northeast Pacific otariids. Marine Mammal Science 22: 556–572.
9. Graham BS (2008) Trophic dynamics and movements of tuna in the tropical Pacific Ocean inferred from stable isotope analyses. University of Hawai'i at Manoa. p.
10. Sydeman WJ, Hobson KA, Pyle P, McLaren EB (1997) Trophic relationships among seabirds in central California: combined stable isotope and conventional dietary approach. Condor 99: 327–336.
11. Gould P, Ostrom P, Walker W (1997) Trophic relationships of albatrosses associated with squid and large-mesh drift-net fisheries in the North Pacific Ocean. Can J Zool 75: 549–562.
12. Ochoa Díaz R (2009) Espectro trófico del tiburón martillo Sphyrna zygaena (Linnaeus, 1758 ) en Baja California Sur: aplicación de 13C y 15N. La Paz: Centro Interdisciplinario de Ciencias Marinas. p.
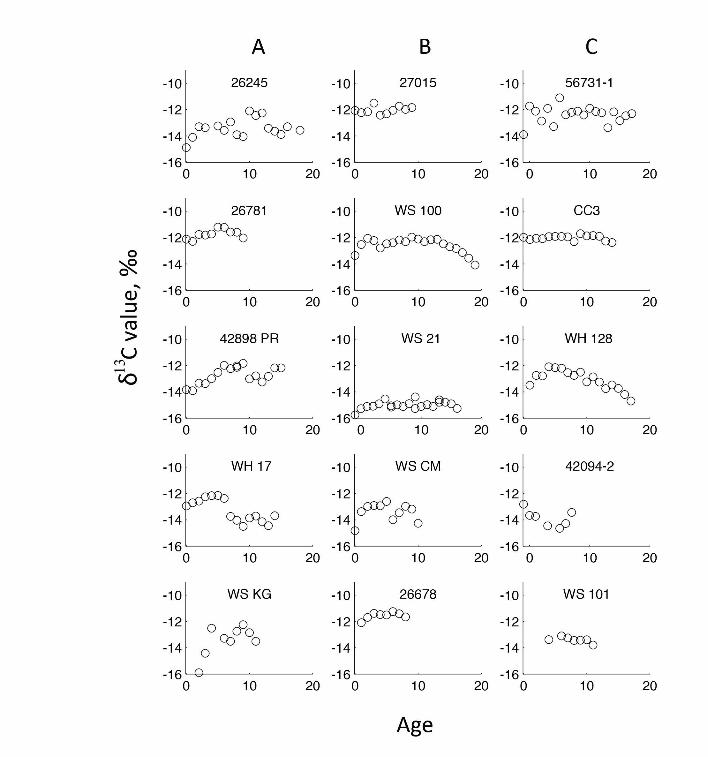
Related Documents