Available online at www.sciencedirect.com Talanta 75 (2008) 1127–1133 Online preconcentration for the determination of lead, cadmium and copper by slotted tube atom trap (STAT)-flame atomic absorption spectrometry Gokce Kaya a , Mehmet Yaman b,∗ a Adiyaman University, Sciences and Arts Faculty, Department of Chemistry, Adiyaman-Turkey b Firat University , Sciences and Arts Faculty, Department of Chemistry, Elazig-Turkey Received 26 September 2007; received in revised form 21 December 2007; accepted 7 January 2008 Available online 16 January 2008 Abstract An online sensitivity enhancement by using atom trapping in flame atomic absorption spectrophotometry was examined for increasing the residence time of the analyte atoms in the light path. For this purpose, various parameters of quartz tubes of the slotted tube atom trap were tested. The studied parameters include the internal diameter, the length of the upper slot and the wall thickness of quartz tube. The best sensitivities as high as 7-fold, 13-fold and 3-fold enhancement were achieved by the tubes having an internal diameter of 6 mm, an upper slot length of 1.0 cm and the wall thickness of 1.5 mm for lead, cadmium and copper, respectively. The limits of quantitation were found to be 30 ng mL −1 for Pb and 3 ng mL −1 for Cd and 30 ng mL −1 for Cu by the optimized method. The achieved technique was applied to determine the concentrations of Pb, Cd and Cu in different plant leaves taken around cement and textile industries. © 2008 Elsevier B.V. All rights reserved. Keywords: The sensitivity improvement; Flame atomic absorption spectrometry; Lead; Cadmium; Copper; Plant leaves 1. Introduction Humans are exposed to Cd, Pb and Cu by food intake and inhaling air which is polluted by environmental conditions and industrial emissions. The accumulation of these metals in human body can have middle and long-term health risks and can adversely affect the physiological functions. For a long time, it is known that lead is toxic for brain, kidney and reproductive system and can also cause impairment in intel- lectual functioning, infertility, miscarriage and hypertension. Several studies have shown that lead exposures in school-aged children can significantly reduce IQ and has been associated with aggressive behavior, delinquency and attention disorders. Due to its malleability, low melting point, and ability to form compounds, Pb has been used in hundreds of products such as pipes, solder, brass fixtures, crystal, paint, cable, ceramics, and batteries [1]. As a result, populations in, at least, 100 countries are still exposed to air pollution with lead in spite of banning the usage of lead in gasoline. ∗ Corresponding author. Fax: +90 4242330062. E-mail addresses: [email protected] (G. Kaya), myaman@firat.edu.tr (M. Yaman). Cd competes with Zn for binding sites and can therefore inter- fere with some of Zinc’s essential functions. Thus, it may inhibit enzyme reactions and utilization of nutrients. Cd can generate free radical tissue damage because it may be a catalyst to oxi- dation reactions. Furthermore, excessive Cd exposure can cause renal damage, reproduction problems, cardiovascular diseases and hypertension. There are several sources of human expo- sure to Cd, including employment in primary metal industries, production of certain batteries, some electroplating processes and consumption of tobacco products [2]. Consequently, it was reported by International Agency Research on Cancer (IARC) that through inhalation cadmium could cause lung cancer in humans and animals [3]. Copper is a necessary element as a component of more than 30 enzymes including superoxide dismutase (SOD), caeruplasmin, cytochrome oxidase, ascorbate oxidase and tyrosinase in the human body. On the other hand, Cu has adverse effects on human health at its high concentrations. Furthermore, in vitro studies have shown that cancer cells in a high copper environment find it easy to proliferate into tumor. It was reported that copper is a well known pro-oxidant and may participate in metal-catalyzed peroxidation of lipids as similar to iron [4]. Recently, increased attention is paid to the use of plant parts such as leaves, shoots and barks as biomonitors. In the most 0039-9140/$ – see front matter © 2008 Elsevier B.V. All rights reserved. doi:10.1016/j.talanta.2008.01.008

Welcome message from author
This document is posted to help you gain knowledge. Please leave a comment to let me know what you think about it! Share it to your friends and learn new things together.
Transcript
A
rTha3a©
K
1
aaha
alScwDcpbau
m
0d
Available online at www.sciencedirect.com
Talanta 75 (2008) 1127–1133
Online preconcentration for the determination of lead, cadmium and copperby slotted tube atom trap (STAT)-flame atomic absorption spectrometry
Gokce Kaya a, Mehmet Yaman b,∗a Adiyaman University, Sciences and Arts Faculty, Department of Chemistry, Adiyaman-Turkey
b Firat University , Sciences and Arts Faculty, Department of Chemistry, Elazig-Turkey
Received 26 September 2007; received in revised form 21 December 2007; accepted 7 January 2008Available online 16 January 2008
bstract
An online sensitivity enhancement by using atom trapping in flame atomic absorption spectrophotometry was examined for increasing theesidence time of the analyte atoms in the light path. For this purpose, various parameters of quartz tubes of the slotted tube atom trap were tested.he studied parameters include the internal diameter, the length of the upper slot and the wall thickness of quartz tube. The best sensitivities as
igh as 7-fold, 13-fold and 3-fold enhancement were achieved by the tubes having an internal diameter of 6 mm, an upper slot length of 1.0 cmnd the wall thickness of 1.5 mm for lead, cadmium and copper, respectively. The limits of quantitation were found to be 30 ng mL−1 for Pb andng mL−1 for Cd and 30 ng mL−1 for Cu by the optimized method. The achieved technique was applied to determine the concentrations of Pb, Cdnd Cu in different plant leaves taken around cement and textile industries.y; Lea
fefdrasparth
ech
2008 Elsevier B.V. All rights reserved.
eywords: The sensitivity improvement; Flame atomic absorption spectrometr
. Introduction
Humans are exposed to Cd, Pb and Cu by food intakend inhaling air which is polluted by environmental conditionsnd industrial emissions. The accumulation of these metals inuman body can have middle and long-term health risks and candversely affect the physiological functions.
For a long time, it is known that lead is toxic for brain, kidneynd reproductive system and can also cause impairment in intel-ectual functioning, infertility, miscarriage and hypertension.everal studies have shown that lead exposures in school-agedhildren can significantly reduce IQ and has been associatedith aggressive behavior, delinquency and attention disorders.ue to its malleability, low melting point, and ability to form
ompounds, Pb has been used in hundreds of products such asipes, solder, brass fixtures, crystal, paint, cable, ceramics, andatteries [1]. As a result, populations in, at least, 100 countries
re still exposed to air pollution with lead in spite of banning thesage of lead in gasoline.∗ Corresponding author. Fax: +90 4242330062.E-mail addresses: [email protected] (G. Kaya),
[email protected] (M. Yaman).
hhiwp
s
039-9140/$ – see front matter © 2008 Elsevier B.V. All rights reserved.oi:10.1016/j.talanta.2008.01.008
d; Cadmium; Copper; Plant leaves
Cd competes with Zn for binding sites and can therefore inter-ere with some of Zinc’s essential functions. Thus, it may inhibitnzyme reactions and utilization of nutrients. Cd can generateree radical tissue damage because it may be a catalyst to oxi-ation reactions. Furthermore, excessive Cd exposure can causeenal damage, reproduction problems, cardiovascular diseasesnd hypertension. There are several sources of human expo-ure to Cd, including employment in primary metal industries,roduction of certain batteries, some electroplating processesnd consumption of tobacco products [2]. Consequently, it waseported by International Agency Research on Cancer (IARC)hat through inhalation cadmium could cause lung cancer inumans and animals [3].
Copper is a necessary element as a component of more than 30nzymes including superoxide dismutase (SOD), caeruplasmin,ytochrome oxidase, ascorbate oxidase and tyrosinase in theuman body. On the other hand, Cu has adverse effects on humanealth at its high concentrations. Furthermore, in vitro studiesave shown that cancer cells in a high copper environment findt easy to proliferate into tumor. It was reported that copper is a
ell known pro-oxidant and may participate in metal-catalyzederoxidation of lipids as similar to iron [4].Recently, increased attention is paid to the use of plant partsuch as leaves, shoots and barks as biomonitors. In the most
1 lanta 75 (2008) 1127–1133
ubcicnptamaAa
poastesdp
tathAsoifmAo
sbamteiflzeottMitttyt
tttl[rcHai
tfactrsititttsia[ttCdl[
thumstr
128 G. Kaya, M. Yaman / Ta
sed expression, biomonitoring may be defined as the use ofioorganism or biomaterials to obtain information on certainompounds in biosphere. The advantages of using of biomon-tors for environmental surveillance lie in the lower cost asompared to direct methods of pollution measurement, sinceo collecting or measuring equipment has to be installed androtected against vandalism. If the biomonitors are widely dis-ributed and occur frequently enough they can be used over largereas for recording and evaluating heavy-metal inputs. Further-ore, they make it possible to identify sources of emissions
nd verify the overland transportation of individual elements.s a result, many plant species are useful for biomonitoring
tmospheric deposition of pollutants [5].The World Health Organization (WHO) [6] established
rovisional tolerable weekly intakes (PTWIs) of Cd and Pbf 0.007 and 0.025 mg kg−1 body weight, respectively, forll human groups. Therefore, analytical techniques with highensitivity are required for detection of these metals. Theseechniques include electrothermal atomic absorption spectrom-try (ETAAS), inductively coupled plasma-atomic emissionpectrometry (ICP-AES), anodic stripping voltammetry (ASV),ifferential-pulse polarography (DPP), and inductively coupledlasma-mass spectrometry (ICP-MS).
It is well known that the flameless atomic absorption spec-rometry is a more sensitive technique than flame atomicbsorption spectrometry (FAAS). However, relative to the laterechnique, flameless AAS has some disadvantages such as itsigh cost, slowness and greater proneness to interferences [7].lthough, effective chemical modifiers, background correction
ystems, improved furnace and platform designs and carefulptimization of temperature programs were used to remove thenterferences [8], it is still widely studied in relation to the inter-erences in this field of flameless AAS [9]. If both of theseethods can be used, FAAS should be preferred to flamelessAS because FAAS is faster, cheaper and does not require expertperators.
Therefore, there are continuing efforts to enhance the sen-itivity of FAAS despite its being the mature analytical (manyelieve “over the hill”) technique. These efforts can be classifieds offline and online methods. The offline methods include theost of preconcentration methods such as liquid–liquid extrac-
ion, adsorption, precipitation, solid phase extraction [10–13]xcept their several special applications. The sensitivity of FAASs limited by several factors. The analyte atoms generated in theame pass rapidly and continuously through the measurementone during sample aspiration. A further limitation is the poorfficiency of the nebulizer/burner system. A maximum of 10%f the aspirated sample solution reaches the flame. The sensi-ivity can be improved if the atomic vapor has been constrainedo remain in the light path for a long time. In a review article,
atusiewicz recently discussed in detail the techniques exam-ned for this purpose [14]. Among these methods, atom-trappingechnique is designed in two different shapes: the slotted quartz
ube and the water-cooled silica tube. Although these techniqueshat can be called as online methods were firstly described 25ears ago [15], it is evident that the scientific literature on thisopic has increased recently [14]. The water-cooled silica sys-acoC
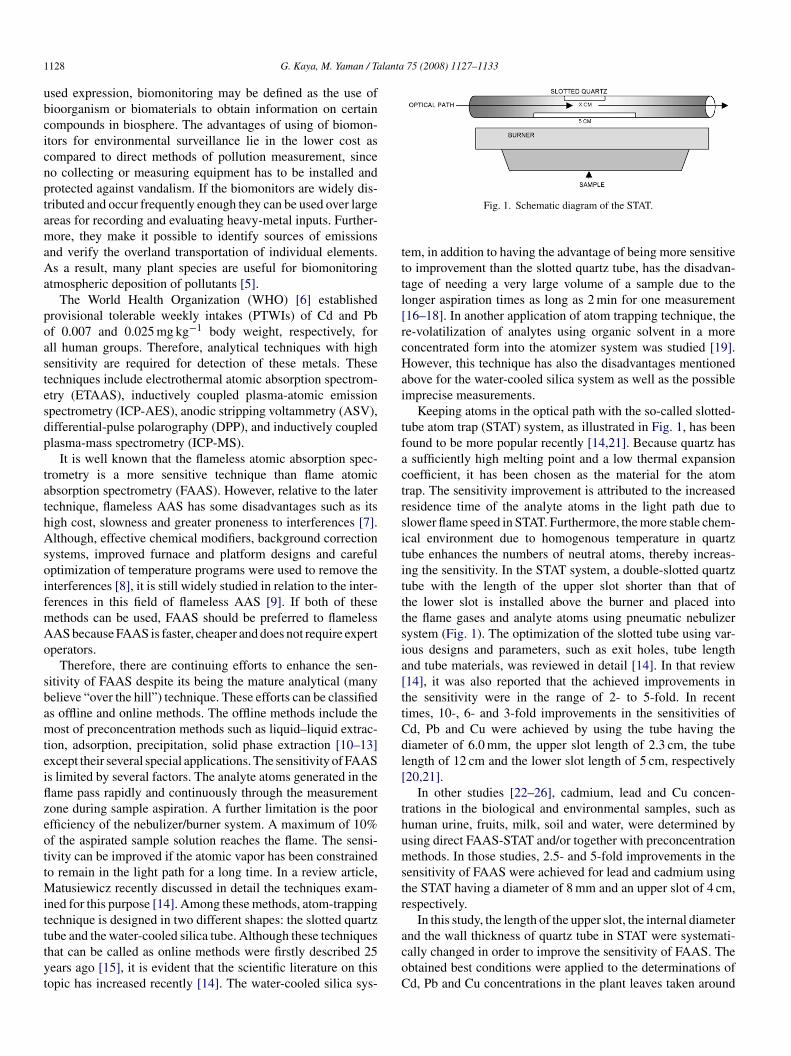
Fig. 1. Schematic diagram of the STAT.
em, in addition to having the advantage of being more sensitiveo improvement than the slotted quartz tube, has the disadvan-age of needing a very large volume of a sample due to theonger aspiration times as long as 2 min for one measurement16–18]. In another application of atom trapping technique, thee-volatilization of analytes using organic solvent in a moreoncentrated form into the atomizer system was studied [19].owever, this technique has also the disadvantages mentioned
bove for the water-cooled silica system as well as the possiblemprecise measurements.
Keeping atoms in the optical path with the so-called slotted-ube atom trap (STAT) system, as illustrated in Fig. 1, has beenound to be more popular recently [14,21]. Because quartz hassufficiently high melting point and a low thermal expansion
oefficient, it has been chosen as the material for the atomrap. The sensitivity improvement is attributed to the increasedesidence time of the analyte atoms in the light path due tolower flame speed in STAT. Furthermore, the more stable chem-cal environment due to homogenous temperature in quartzube enhances the numbers of neutral atoms, thereby increas-ng the sensitivity. In the STAT system, a double-slotted quartzube with the length of the upper slot shorter than that ofhe lower slot is installed above the burner and placed intohe flame gases and analyte atoms using pneumatic nebulizerystem (Fig. 1). The optimization of the slotted tube using var-ous designs and parameters, such as exit holes, tube lengthnd tube materials, was reviewed in detail [14]. In that review14], it was also reported that the achieved improvements inhe sensitivity were in the range of 2- to 5-fold. In recentimes, 10-, 6- and 3-fold improvements in the sensitivities ofd, Pb and Cu were achieved by using the tube having theiameter of 6.0 mm, the upper slot length of 2.3 cm, the tubeength of 12 cm and the lower slot length of 5 cm, respectively20,21].
In other studies [22–26], cadmium, lead and Cu concen-rations in the biological and environmental samples, such asuman urine, fruits, milk, soil and water, were determined bysing direct FAAS-STAT and/or together with preconcentrationethods. In those studies, 2.5- and 5-fold improvements in the
ensitivity of FAAS were achieved for lead and cadmium usinghe STAT having a diameter of 8 mm and an upper slot of 4 cm,espectively.
In this study, the length of the upper slot, the internal diameternd the wall thickness of quartz tube in STAT were systemati-
ally changed in order to improve the sensitivity of FAAS. Thebtained best conditions were applied to the determinations ofd, Pb and Cu concentrations in the plant leaves taken around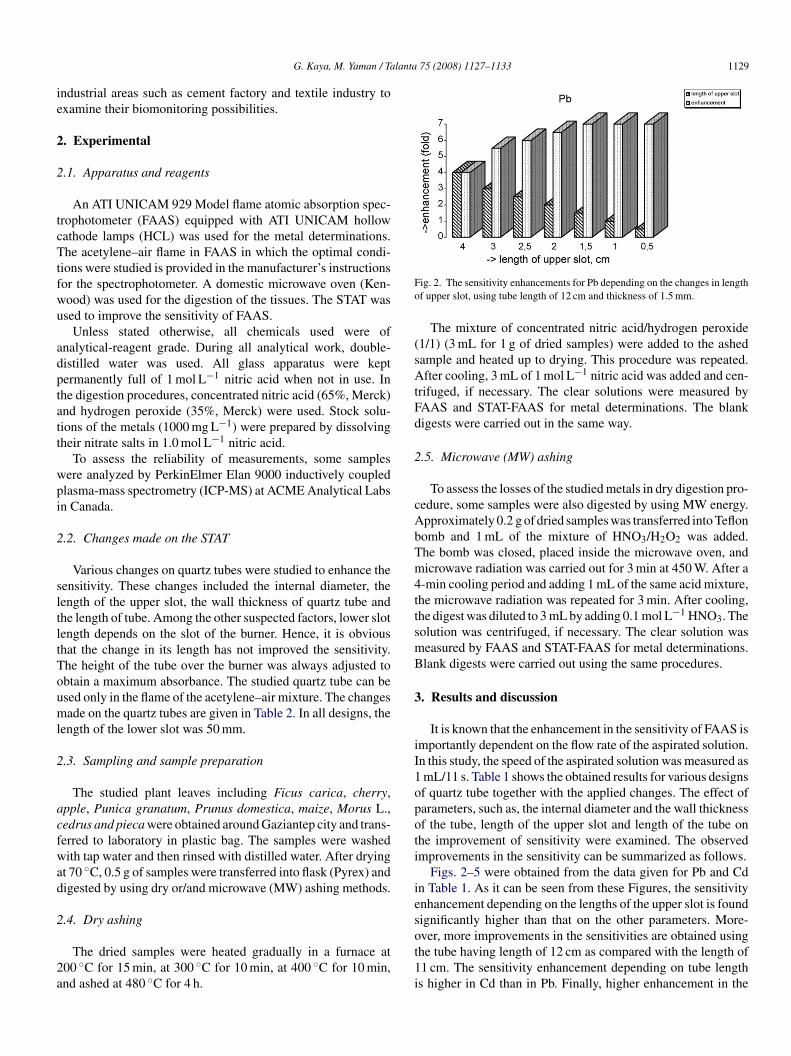
lanta 75 (2008) 1127–1133 1129
ie
2
2
tcTtfwu
adptatt
wpi
2
sltltTouml
2
acfwad
2
2a
Fo
(sAtFd
2
cAbTm4ttsmB
3
iI1opoti
ies
G. Kaya, M. Yaman / Ta
ndustrial areas such as cement factory and textile industry toxamine their biomonitoring possibilities.
. Experimental
.1. Apparatus and reagents
An ATI UNICAM 929 Model flame atomic absorption spec-rophotometer (FAAS) equipped with ATI UNICAM hollowathode lamps (HCL) was used for the metal determinations.he acetylene–air flame in FAAS in which the optimal condi-
ions were studied is provided in the manufacturer’s instructionsor the spectrophotometer. A domestic microwave oven (Ken-ood) was used for the digestion of the tissues. The STAT wassed to improve the sensitivity of FAAS.
Unless stated otherwise, all chemicals used were ofnalytical-reagent grade. During all analytical work, double-istilled water was used. All glass apparatus were keptermanently full of 1 mol L−1 nitric acid when not in use. Inhe digestion procedures, concentrated nitric acid (65%, Merck)nd hydrogen peroxide (35%, Merck) were used. Stock solu-ions of the metals (1000 mg L−1) were prepared by dissolvingheir nitrate salts in 1.0 mol L−1 nitric acid.
To assess the reliability of measurements, some samplesere analyzed by PerkinElmer Elan 9000 inductively coupledlasma-mass spectrometry (ICP-MS) at ACME Analytical Labsn Canada.
.2. Changes made on the STAT
Various changes on quartz tubes were studied to enhance theensitivity. These changes included the internal diameter, theength of the upper slot, the wall thickness of quartz tube andhe length of tube. Among the other suspected factors, lower slotength depends on the slot of the burner. Hence, it is obvioushat the change in its length has not improved the sensitivity.he height of the tube over the burner was always adjusted tobtain a maximum absorbance. The studied quartz tube can besed only in the flame of the acetylene–air mixture. The changesade on the quartz tubes are given in Table 2. In all designs, the
ength of the lower slot was 50 mm.
.3. Sampling and sample preparation
The studied plant leaves including Ficus carica, cherry,pple, Punica granatum, Prunus domestica, maize, Morus L.,edrus and pieca were obtained around Gaziantep city and trans-erred to laboratory in plastic bag. The samples were washedith tap water and then rinsed with distilled water. After drying
t 70 ◦C, 0.5 g of samples were transferred into flask (Pyrex) andigested by using dry or/and microwave (MW) ashing methods.
.4. Dry ashing
The dried samples were heated gradually in a furnace at00 ◦C for 15 min, at 300 ◦C for 10 min, at 400 ◦C for 10 min,nd ashed at 480 ◦C for 4 h.
ot1i
ig. 2. The sensitivity enhancements for Pb depending on the changes in lengthf upper slot, using tube length of 12 cm and thickness of 1.5 mm.
The mixture of concentrated nitric acid/hydrogen peroxide1/1) (3 mL for 1 g of dried samples) were added to the ashedample and heated up to drying. This procedure was repeated.fter cooling, 3 mL of 1 mol L−1 nitric acid was added and cen-
rifuged, if necessary. The clear solutions were measured byAAS and STAT-FAAS for metal determinations. The blankigests were carried out in the same way.
.5. Microwave (MW) ashing
To assess the losses of the studied metals in dry digestion pro-edure, some samples were also digested by using MW energy.pproximately 0.2 g of dried samples was transferred into Teflonomb and 1 mL of the mixture of HNO3/H2O2 was added.he bomb was closed, placed inside the microwave oven, andicrowave radiation was carried out for 3 min at 450 W. After a
-min cooling period and adding 1 mL of the same acid mixture,he microwave radiation was repeated for 3 min. After cooling,he digest was diluted to 3 mL by adding 0.1 mol L−1 HNO3. Theolution was centrifuged, if necessary. The clear solution waseasured by FAAS and STAT-FAAS for metal determinations.lank digests were carried out using the same procedures.
. Results and discussion
It is known that the enhancement in the sensitivity of FAAS ismportantly dependent on the flow rate of the aspirated solution.n this study, the speed of the aspirated solution was measured asmL/11 s. Table 1 shows the obtained results for various designsf quartz tube together with the applied changes. The effect ofarameters, such as, the internal diameter and the wall thicknessf the tube, length of the upper slot and length of the tube onhe improvement of sensitivity were examined. The observedmprovements in the sensitivity can be summarized as follows.
Figs. 2–5 were obtained from the data given for Pb and Cdn Table 1. As it can be seen from these Figures, the sensitivitynhancement depending on the lengths of the upper slot is foundignificantly higher than that on the other parameters. More-
ver, more improvements in the sensitivities are obtained usinghe tube having length of 12 cm as compared with the length of1 cm. The sensitivity enhancement depending on tube lengths higher in Cd than in Pb. Finally, higher enhancement in the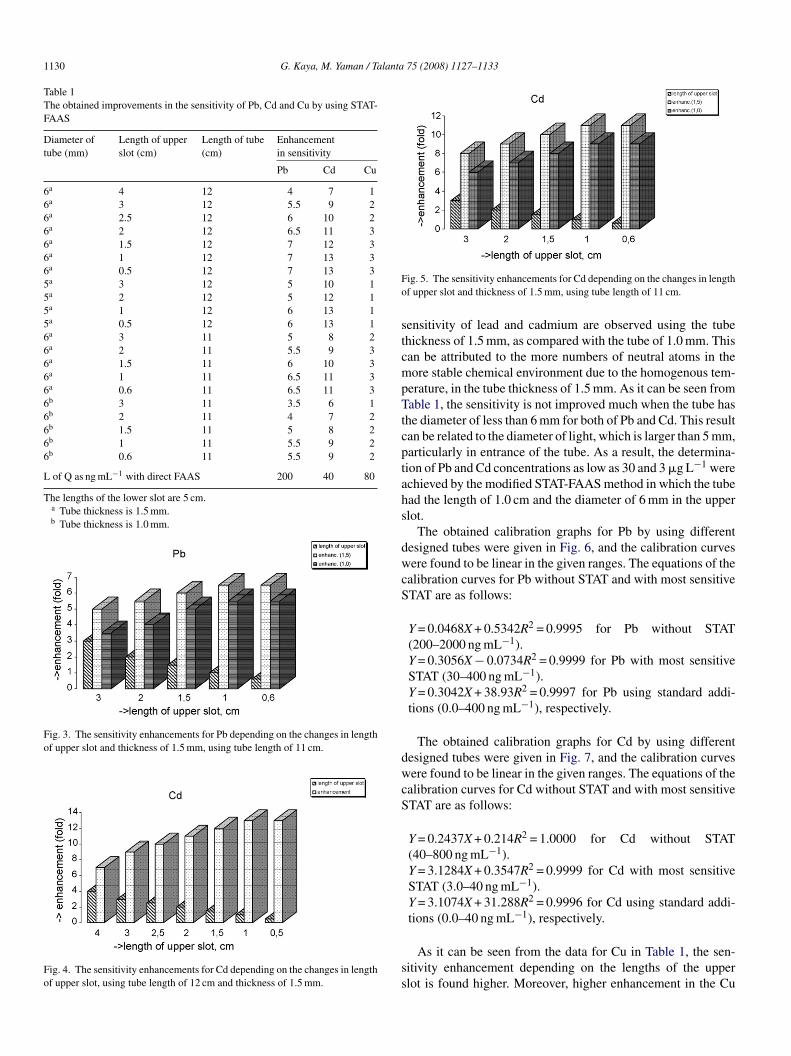
1130 G. Kaya, M. Yaman / Talanta 75 (2008) 1127–1133
Table 1The obtained improvements in the sensitivity of Pb, Cd and Cu by using STAT-FAAS
Diameter oftube (mm)
Length of upperslot (cm)
Length of tube(cm)
Enhancementin sensitivity
Pb Cd Cu
6a 4 12 4 7 16a 3 12 5.5 9 26a 2.5 12 6 10 26a 2 12 6.5 11 36a 1.5 12 7 12 36a 1 12 7 13 36a 0.5 12 7 13 35a 3 12 5 10 15a 2 12 5 12 15a 1 12 6 13 15a 0.5 12 6 13 16a 3 11 5 8 26a 2 11 5.5 9 36a 1.5 11 6 10 36a 1 11 6.5 11 36a 0.6 11 6.5 11 36b 3 11 3.5 6 16b 2 11 4 7 26b 1.5 11 5 8 26b 1 11 5.5 9 26b 0.6 11 5.5 9 2
L of Q as ng mL−1 with direct FAAS 200 40 80
The lengths of the lower slot are 5 cm.a Tube thickness is 1.5 mm.b Tube thickness is 1.0 mm.
Fig. 3. The sensitivity enhancements for Pb depending on the changes in lengthof upper slot and thickness of 1.5 mm, using tube length of 11 cm.
Fig. 4. The sensitivity enhancements for Cd depending on the changes in lengthof upper slot, using tube length of 12 cm and thickness of 1.5 mm.
Fo
stcmpTtcptahs
dwcS
dwcS
ss
ig. 5. The sensitivity enhancements for Cd depending on the changes in lengthf upper slot and thickness of 1.5 mm, using tube length of 11 cm.
ensitivity of lead and cadmium are observed using the tubehickness of 1.5 mm, as compared with the tube of 1.0 mm. Thisan be attributed to the more numbers of neutral atoms in theore stable chemical environment due to the homogenous tem-
erature, in the tube thickness of 1.5 mm. As it can be seen fromable 1, the sensitivity is not improved much when the tube has
he diameter of less than 6 mm for both of Pb and Cd. This resultan be related to the diameter of light, which is larger than 5 mm,articularly in entrance of the tube. As a result, the determina-ion of Pb and Cd concentrations as low as 30 and 3 �g L−1 werechieved by the modified STAT-FAAS method in which the tubead the length of 1.0 cm and the diameter of 6 mm in the upperlot.
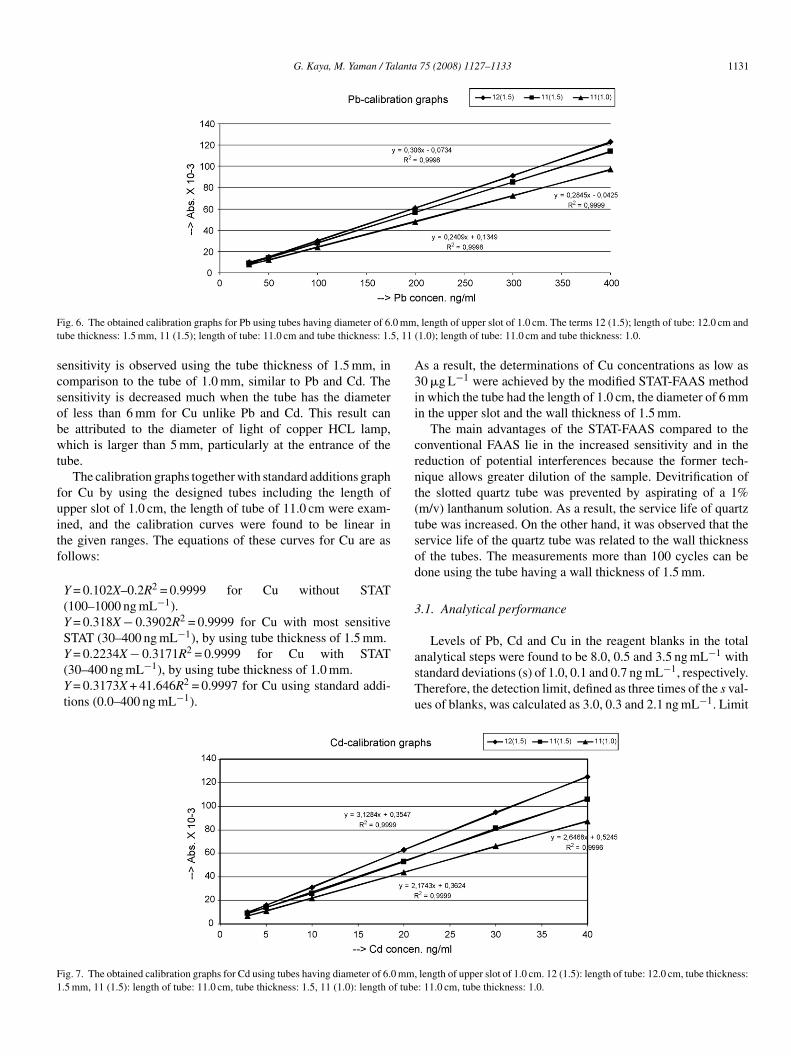
The obtained calibration graphs for Pb by using differentesigned tubes were given in Fig. 6, and the calibration curvesere found to be linear in the given ranges. The equations of the
alibration curves for Pb without STAT and with most sensitiveTAT are as follows:
Y = 0.0468X + 0.5342R2 = 0.9995 for Pb without STAT(200–2000 ng mL−1).Y = 0.3056X − 0.0734R2 = 0.9999 for Pb with most sensitiveSTAT (30–400 ng mL−1).Y = 0.3042X + 38.93R2 = 0.9997 for Pb using standard addi-tions (0.0–400 ng mL−1), respectively.
The obtained calibration graphs for Cd by using differentesigned tubes were given in Fig. 7, and the calibration curvesere found to be linear in the given ranges. The equations of the
alibration curves for Cd without STAT and with most sensitiveTAT are as follows:
Y = 0.2437X + 0.214R2 = 1.0000 for Cd without STAT(40–800 ng mL−1).Y = 3.1284X + 0.3547R2 = 0.9999 for Cd with most sensitiveSTAT (3.0–40 ng mL−1).Y = 3.1074X + 31.288R2 = 0.9996 for Cd using standard addi-tions (0.0–40 ng mL−1), respectively.
As it can be seen from the data for Cu in Table 1, the sen-itivity enhancement depending on the lengths of the upperlot is found higher. Moreover, higher enhancement in the Cu
G. Kaya, M. Yaman / Talanta 75 (2008) 1127–1133 1131
F 0 mmt , 11 (
scsobwt
fuitf
A3ii
crnt(tsod
3
F1
ig. 6. The obtained calibration graphs for Pb using tubes having diameter of 6.ube thickness: 1.5 mm, 11 (1.5); length of tube: 11.0 cm and tube thickness: 1.5
ensitivity is observed using the tube thickness of 1.5 mm, inomparison to the tube of 1.0 mm, similar to Pb and Cd. Theensitivity is decreased much when the tube has the diameterf less than 6 mm for Cu unlike Pb and Cd. This result cane attributed to the diameter of light of copper HCL lamp,hich is larger than 5 mm, particularly at the entrance of the
ube.The calibration graphs together with standard additions graph
or Cu by using the designed tubes including the length ofpper slot of 1.0 cm, the length of tube of 11.0 cm were exam-ned, and the calibration curves were found to be linear inhe given ranges. The equations of these curves for Cu are asollows:
Y = 0.102X–0.2R2 = 0.9999 for Cu without STAT(100–1000 ng mL−1).Y = 0.318X − 0.3902R2 = 0.9999 for Cu with most sensitiveSTAT (30–400 ng mL−1), by using tube thickness of 1.5 mm.
Y = 0.2234X − 0.3171R2 = 0.9999 for Cu with STAT(30–400 ng mL−1), by using tube thickness of 1.0 mm.Y = 0.3173X + 41.646R2 = 0.9997 for Cu using standard addi-tions (0.0–400 ng mL−1).asTu
ig. 7. The obtained calibration graphs for Cd using tubes having diameter of 6.0 mm,.5 mm, 11 (1.5): length of tube: 11.0 cm, tube thickness: 1.5, 11 (1.0): length of tube
, length of upper slot of 1.0 cm. The terms 12 (1.5); length of tube: 12.0 cm and1.0); length of tube: 11.0 cm and tube thickness: 1.0.
s a result, the determinations of Cu concentrations as low as0 �g L−1 were achieved by the modified STAT-FAAS methodn which the tube had the length of 1.0 cm, the diameter of 6 mmn the upper slot and the wall thickness of 1.5 mm.
The main advantages of the STAT-FAAS compared to theonventional FAAS lie in the increased sensitivity and in theeduction of potential interferences because the former tech-ique allows greater dilution of the sample. Devitrification ofhe slotted quartz tube was prevented by aspirating of a 1%m/v) lanthanum solution. As a result, the service life of quartzube was increased. On the other hand, it was observed that theervice life of the quartz tube was related to the wall thicknessf the tubes. The measurements more than 100 cycles can beone using the tube having a wall thickness of 1.5 mm.
.1. Analytical performance
Levels of Pb, Cd and Cu in the reagent blanks in the total
nalytical steps were found to be 8.0, 0.5 and 3.5 ng mL−1 withtandard deviations (s) of 1.0, 0.1 and 0.7 ng mL−1, respectively.herefore, the detection limit, defined as three times of the s val-es of blanks, was calculated as 3.0, 0.3 and 2.1 ng mL−1. Limitlength of upper slot of 1.0 cm. 12 (1.5): length of tube: 12.0 cm, tube thickness:: 11.0 cm, tube thickness: 1.0.

1132 G. Kaya, M. Yaman / Talanta 75 (2008) 1127–1133
Table 2The observed metal concentrations in plant leaves taken from around Gaziantep cement and textile industries
Plant Pb (mg kg−1) Cd (�g kg−1) Cu (mg kg−1)
Cement (ICPMS) Textile (ICPMS) Cement (ICPMS) Textile (ICPMS) Cement (ICPMS) Textile (ICPMS)
Cedrus libani 7.6 ± 0.9 1.3 ± 0.3 (1.3 ± 0.2) 39 ± 8 50 ± 5 (46 ± 4) 3.0 ± 0.4 2.4 ± 0.5 (2.8 ± 0.4)Picea 1.1 ± 0.2 (1.0 ± 0.2) 23 ± 4 (20 ± 2) 2.5 ± 0.3 (2.3 ± 0.2)N. Oleander 2.1 ± 0.5 (1.8 ± 0.3) 2.1 ± 0.3 (2.3 ± 0.3) 66 ± 12 (61 ± 5) 56 ± 6 (52 ± 5) 8.2 ± 1.0 (8.7 ± 1.0) 3.7 ± 0.5 (4.0 ± 0.7)Aesculus 11 ± 2 (10 ± 1) 41 ± 8 (46 ± 7) 5.8 ± 1.0 (6.2 ± 0.9)Morus L. 0.8 ± 0.2 2.4 ± 0.4 1.9 ± 0.2a 11 ± 4 18 ± 2 19 ± 5a 4.8 ± 0.5 3.3 ± 0.3 3.5 ± 0.3a
Eriobotrya Japonica 4.0 ± 0.5 (3.4 ± 0.5) 2.3 ± 0.2 (2.7 ± 0.4) 176 ± 26 (200 ± 32) 367 ± 44 (394 ± 40) 2.8 ± 0.5 (3.2 ± 0.4) 4.0 ± 0.6 (4.4 ± 0.5)Rosa canina 1.5 ± 0.4 (1.8 ± 0.1) 40 ± 5 (46 ± 8) 3.2 ± 0.4 (3.6 ± 0.2)Prunus domestica 6.7 ± 1.2 7 ± 2 4.0 ± 0.8Punica granatum 6.8 ± 0.8 3.5 ± 0.6 44 ± 6 36 ± 4 4.7 ± 0.6 3.0 ± 0.2Cydonia oblonga 4.4 ± 0.3 (4.4 ± 0.4) 112 ± 13 (103 ± 10) 5.3 ± 0.5 (5.9 ± 0.8)Ficus carica 3.0 ± 0.2 2.5 ± 0.6 30 ± 5 32 ± 4 2.5 ± 0.3 1.7 ± 0.2Juglans 5.0 ± 0.4 2.5 ± 0.4 (2.9 ± 0.3) 18 ± 4 25 ± 7 (28 ± 6) 2.8 ± 0.5 3.3 ± 0.6 (3.7 ± 0.5)Apple 2.6 ± 0.4 2.9 ± 0.5a 31 ± 7 33 ± 7a 2.7 ± 0.3 2.5 ± 0.1a
Armena 2.4 ± 0.4 2.3 ± 0.3a 24 ± 2 18 ± 3a 3.3 ± 0.1 3.3 ± 0.2a
Prunus 2.9 ± 0.7 (3.3 ± 0.6) 10 ± 2 (9 ± 4) 5.4 ± 1.0 (6.0 ± 0.6)ified 15
T
oftdfw
SwCr
tdrfrotfrCaoTomtttsiscaTCw
ic
emmpctc
3
atatamtoh
ooomEotoa
SRM-Tomato leaves-1573a – Cert
he values in parenthesis are obtained by using ICP-MS.a These values are obtained by using MW ashing.
f quantitation for Pb, Cd and Cu were found as 200, 40 and 80or direct FAAS and 30, 3 and 30 ng mL−1 for the best condi-ions of sensitivity. For total analytical procedure containing theigestion procedure, the relative standard deviations measuredor concentrations of 100, 20 and 80 ng mL−1 of Pb, Cd and Cuere found as 5, 3 and 4%, respectively (n = 8).The accuracy of the method was studied by examining the
tandard Reference Material-Tomato Leaves-1573a. The resultsere given in Table 2. It can be seen that the recovery values ford and Cu in Tomato Leaves-1573a was found as 96 and 98%,
espectively.In addition, the plant leaves containing the highest concen-
rations of Pb and/or Cd and/or Cu were analyzed by using bothirect conventional FAAS and the STAT-FAAS. The obtainedesults using STAT-FAAS were compared with those obtainedrom the direct conventional FAAS. It was observed that theesults obtained from STAT-FAAS were agreed with the resultsbtained from the conventional FAAS, at least 95%. In addi-ion, the recoveries of Pb, Cd and Cu from the plant leavesortified with the Pb, Cd and Cu were used to test of the accu-acy of the modified method. The concentrations of Pb, Cd andu spiked to the samples are in the range of 100–300, 10–30nd 40–60 ng mL−1, respectively. It was found that at least 96%f Pb, Cd and Cu added to the plant leaves were recovered.he effect of contamination was eliminated by subtracting thebtained values for blanks. In addition, to overcome the enhance-ent or suppression due to the presence of major components of
he leaves matrix, calibration solutions were performed withinhe sample matrix itself. On the other hand, the standard addi-ions method for the determination of Pb, Cd and Cu in the plantamples was examined. As described above, the slopes of the cal-bration curves were compared with the slopes obtained by thetandard additions method. These results indicate the absence ofhemical interferences, because the slopes of calibration curves
nd standard additions are identical for three studied elements.herefore, the calibration graphs were used to determine Pb,d and Cu in the studied plant samples. The optimized methodas applied to the determination of lead, cadmium and copper4
b
20 ± 40 Found 1495 ± 25 Certified 4.70 ± 0.14 Found 4.5 ± 0.12
n different plant leaves using the quartz tube having the bestonditions described above.
Finally, it is observed that there is not a significant differ-nce between the data (Table 2) obtained by FAAS and ICP-MSethods using t-test at confidence level of 90% for the studiedetals. Similarly, Pb, Cd and Cu concentrations in plant sam-
les were found to be in acceptable limits by using dry ashing inonsidering t-test at confidence level of 90% as compared withhe MW ashing results. No losses of Pb and Cd in dry ashingan be attributed to the differences in matrices [11].
.2. Application
Lead, Cd and Cu concentrations in the leaves of various plantsre summarized in Table 2. As it can be seen that lead concen-ration (dw) ranges from 0.8 to 11 �g g−1 for the cement factoryrea and 1.1–3.5 �g g−1 for the textile industry area. This varia-ion may be depending on varying uncontaminated and pollutedreas by cement factory. The authors generally determined theetal concentrations in plants to evaluate atmospheric pollu-
ion [5,27,28]. From Table 2, Pb concentrations in the leavesf Cedrus libani taken around cement factory were found to beigher about five times than in the textile area.
Cd concentrations in leaves of E. Japonica and Cydoniablonga plants were found to be 10-fold higher than in thosether plants taken around cement factory. As a result, the leavesf these two plants can be used as biomonitors for environ-ental Cd pollution. Higher Cd concentration (367 ng g−1) in. Japonica leaves taken around textile industry than in thosether plants taken from the same area, and in the same plantaken around cement factory also support this conclusion. Thebserved Cu concentrations in the studied plant leaves are incceptable limits.
. Conclusions
It has been demonstrated that the optimized technique cane used for the determination of ultratrace concentrations of

lanta
Psttfmob
fuibt3Tii
R
[[[[[[[
[
[
[
[[[[
[[25] M. Yaman, N. Cokol, Atom. Spectrosc. 25 (4) (2004) 185.[26] M. Yaman, Spectrosc. Lett. 34 (2001) 763.
G. Kaya, M. Yaman / Ta
b, Cd and Cu in analytical samples. The proposed method hasome advantages such as high speed, less risk of contamina-ion, low cost and easy manufacturing of the required quartzube. Although the achieved improvement is modest (7-foldor Pb, 13-fold for Cd and 3-fold for Cu), the modified onlineethod has much importance in comparison with the other
ffline enrichment techniques such as adsorption or extractionecause of its simplicity and instantly applicability.
Finally, the sensitivity between the FAAS and flameless AASor some elements such as lead and cadmium is bridged grad-ally via the atom trap in FAAS. In this study, the sensitivitymprovement, which has not been obtained so far by STAT, haseen achieved for Pb and Cd by using very simple modifica-ions in the STAT. The limits of quantitation were found to be0 ng mL−1 for Pb, 3 ng mL−1 for Cd and 30 ng mL−1 for Cu.he required volume of sample for this method is less in compar-
son with other enrichment methods; i.e., only 0.9 mL of solutions sufficient for three metal determinations.
eferences
[1] Sjs. Flora, J. Environ. Biol. 23 (1) (2002) 25.[2] G.F. Nordberg, Biometals 17 (5) (2004) 485.[3] IARC, Cadmium and cadmium compounds, in: IARC Monographs on the
Evaluation of Carcinogenic Risks to Humans, France, vol. 58, Beryllium,
Cadmium, Mercury, and Exposures in the Glass Manufacturing Industry,IARC, Lyon, 1993.[4] M. Yaman, Curr. Med. Chem. 13 (21) (2006) 2513.[5] A. Mulgrew, P. Williams, Biomonitoring of air quality using plants, Air
Hygiene Report No 10, Berlin, Germany, WHO CC, 165 pp., 2000.
[
[
75 (2008) 1127–1133 1133
[6] WHO (World Health Organization), Fifty-Third report of the JointFAO/WHO Expert Committee on Food Additives, WHO Technical ReportSeries 896, Geneva, Switzerland, 2000.
[7] M. de, G. Pereira, M.A.Z. Arruda, Microchim. Acta 141 (2003) 115.[8] H.M. Ortner, E. Bulska, U. Rohr, G. Schlemmer, S. Weinbruch, B. Welz,
Spectrochim. Acta B 57 (2002) 1835.[9] A.B. Volynsky, Spectrochim. Acta B 53 (12) (1998) 1607.10] B.F. Senkal, M. Ince, E. Yavuz, M. Yaman, Talanta 72 (2007) 962.11] M. Yaman, S. Gucer, Analyst 120 (1995) 101.12] M. Yaman, G. Kaya, Anal. Chim. Acta 540 (2005) 77.13] F.A. Aydin, M. Soylak, Talanta 72 (1) (2007) 187.14] H. Matusiewicz, Spectrochim. Acta B 52 (12) (1997) 1711.15] R.J. Watling, Anal. Chim. Acta 97 (1978) 395.16] A.A. Brown, D.J. Roberts, K.V. Kahokola, J. Anal. At. Spectrom. 2 (1987)
201.17] H. Matusiewicz, R. Sturgeon, V. Luong, K. Moffatt, Fresenius. J. Anal.
Chem. 340 (1991) 35.18] H.W. Sun, L.L. Yang, D.C. Zhang, J. Anal. At. Spectrom. 11 (1996)
265.19] D. Korkmaz, S. Kumser, N. Ertas, M. Mahmut, O.Y. Ataman, J. Anal. At.
Spectrom. 17 (2002) 1610.20] M. Yaman, I. Akdeniz, Anal. Sci. 20 (2004) 1363.21] M. Yaman, Anal. Biochem. 339 (2005) 1.22] M. Yaman, J. Anal. At. Spectrom. 14 (1999) 275.23] M. Yaman, Y. Dilgin, S. Gucer, Anal. Chim. Acta 410 (1–2) (2000)
119.24] M. Yaman, Y. Dilgin, Atom. Spectrosc. 23 (2) (2002) 59.
27] M. Singh, P. Goel, A.K. Singh, Environ. Monit. Assess. 107 (1–3) (2005)101.
28] B. Wolterbeek, Environ. Pollut. 120 (2002) 11.
Related Documents