econstor Make Your Publications Visible. A Service of zbw Leibniz-Informationszentrum Wirtschaft Leibniz Information Centre for Economics Tambunan, Tulus T. H. Working Paper Ongoing trade facilitation improvement: Its impact on export-oriented small and medium-sized enterprises in Indonesia ARTNeT Working Paper Series, No. 133 Provided in Cooperation with: Asia-Pacific Research and Training Network on Trade (ARTNeT), Bangkok Suggested Citation: Tambunan, Tulus T. H. (2013) : Ongoing trade facilitation improvement: Its impact on export-oriented small and medium-sized enterprises in Indonesia, ARTNeT Working Paper Series, No. 133, Asia-Pacific Research and Training Network on Trade (ARTNeT), Bangkok This Version is available at: http://hdl.handle.net/10419/103857 Standard-Nutzungsbedingungen: Die Dokumente auf EconStor dürfen zu eigenen wissenschaftlichen Zwecken und zum Privatgebrauch gespeichert und kopiert werden. Sie dürfen die Dokumente nicht für öffentliche oder kommerzielle Zwecke vervielfältigen, öffentlich ausstellen, öffentlich zugänglich machen, vertreiben oder anderweitig nutzen. Sofern die Verfasser die Dokumente unter Open-Content-Lizenzen (insbesondere CC-Lizenzen) zur Verfügung gestellt haben sollten, gelten abweichend von diesen Nutzungsbedingungen die in der dort genannten Lizenz gewährten Nutzungsrechte. Terms of use: Documents in EconStor may be saved and copied for your personal and scholarly purposes. You are not to copy documents for public or commercial purposes, to exhibit the documents publicly, to make them publicly available on the internet, or to distribute or otherwise use the documents in public. If the documents have been made available under an Open Content Licence (especially Creative Commons Licences), you may exercise further usage rights as specified in the indicated licence. www.econstor.eu

Welcome message from author
This document is posted to help you gain knowledge. Please leave a comment to let me know what you think about it! Share it to your friends and learn new things together.
Transcript

econstorMake Your Publications Visible.
A Service of
zbwLeibniz-InformationszentrumWirtschaftLeibniz Information Centrefor Economics
Tambunan, Tulus T. H.
Working Paper
Ongoing trade facilitation improvement: Its impact onexport-oriented small and medium-sized enterprisesin Indonesia
ARTNeT Working Paper Series, No. 133
Provided in Cooperation with:Asia-Pacific Research and Training Network on Trade (ARTNeT), Bangkok
Suggested Citation: Tambunan, Tulus T. H. (2013) : Ongoing trade facilitation improvement: Itsimpact on export-oriented small and medium-sized enterprises in Indonesia, ARTNeT WorkingPaper Series, No. 133, Asia-Pacific Research and Training Network on Trade (ARTNeT),Bangkok
This Version is available at:http://hdl.handle.net/10419/103857
Standard-Nutzungsbedingungen:
Die Dokumente auf EconStor dürfen zu eigenen wissenschaftlichenZwecken und zum Privatgebrauch gespeichert und kopiert werden.
Sie dürfen die Dokumente nicht für öffentliche oder kommerzielleZwecke vervielfältigen, öffentlich ausstellen, öffentlich zugänglichmachen, vertreiben oder anderweitig nutzen.
Sofern die Verfasser die Dokumente unter Open-Content-Lizenzen(insbesondere CC-Lizenzen) zur Verfügung gestellt haben sollten,gelten abweichend von diesen Nutzungsbedingungen die in der dortgenannten Lizenz gewährten Nutzungsrechte.
Terms of use:
Documents in EconStor may be saved and copied for yourpersonal and scholarly purposes.
You are not to copy documents for public or commercialpurposes, to exhibit the documents publicly, to make thempublicly available on the internet, or to distribute or otherwiseuse the documents in public.
If the documents have been made available under an OpenContent Licence (especially Creative Commons Licences), youmay exercise further usage rights as specified in the indicatedlicence.
www.econstor.eu
ASIA-PACIFIC RESEARCH AND TRAINING NETWORK ON TRADE
Working Paper NO. 133 | OCTOBER 2013
Ongoing trade facilitation improvement: Its impact on export-oriented small
and medium-sized enterprises in Indonesia
Tulus T. H. Tambunan
The Asia-Pacific Research and Training Network on Trade (ARTNeT) is an open regional network of research and academic institutions specializing in international trade policy and facilitation issues. IDRC, UNCTAD, UNDP, ESCAP and WTO, as core network partners, provide substantive and/or financial support to the network. The Trade and Investment Division of ESCAP, the regional branch of the United Nations for Asia and the Pacific, provides the Secretariat of the network and a direct regional link to trade policymakers and other international organizations. The ARTNeT Working Paper Series disseminates the findings of work in progress to encourage the exchange of ideas about trade issues. An objective of the series is to publish the findings quickly, even if the presentations are less than fully polished. ARTNeT working papers are available online at www.artnetontrade.org. All material in the working papers may be freely quoted or reprinted, but acknowledgment is requested, together with a copy of the publication containing the quotation or reprint. The use of the working papers for any commercial purpose, including resale, is prohibited. Disclaimer: The designations employed and the presentation of the material in this publication do not imply the expression of any opinion whatsoever on the part of the Secretariat of the United Nations concerning the legal status of any country, territory, city or area, or of its authorities, or concerning the delimitation of its frontiers or boundaries. Where the designation “country or area” appears, it covers countries, territories, cities or areas. Bibliographical and other references have, wherever possible, been verified. The United Nations bears no responsibility for the availability or functioning of URLs. The views expressed in this publication are those of the authors and do not necessarily reflect the views of the United Nations. The opinions, figures and estimates set forth in this publication are the responsibility of the authors, and should not necessarily be considered as reflecting the views or carrying the endorsement of the United Nations. Any errors are the responsibility of the authors. Mention of firm names and commercial products does not imply the endorsement of the United Nations.
© ARTNeT 2013
NO. 133 | OCTOBER 2013
Ongoing trade facilitation improvement: Its impact on export-oriented small and medium-
sized enterprises in Indonesia
Tulus T. H. Tambunan
WORKING PAPER ASIA-PACIFIC RESEARCH AND TRAINING NETWORK ON TRADE
Please cite this paper as: Tulus T. H. Tambunan, 2013, Ongoing trade facilitation improvement: Its impact on export-oriented small and medium-sized enterprises in Indonesia
ARTNeT Working Paper No. 133 , October 2013, Bangkok, ESCAP.
Available at www.artnetontrade.org.
Abstract: Trade facilitation refers to all measures that can be taken to facilitate cross-border
trade flows, but there is no standard formal definition of trade facilitation. This paper
examines whether export-oriented MSMEs have access to trade facilitation and how helpful
trade facilitation is in supporting exports by MSMEs. Data shows only a small proportion of
MSMEs export their products, and the paper makes recommendations on encouraging
export activities through increasing awareness and training of MSMEs regarding trade
facilitation information, and promotion of information communications technology.
JEL Classification: F13
Key words: Development, Indonesia, SME, Trade, Trade Facilitation
1
Contents
Introduction ................................................................................................................................ 2
1. Development of Indonesian MSMEs ...................................................................................... 4
3. Export performance ................................................................................................................ 8
4. Access by MSMEs to trade facilitation and its impact on their trade activities ......................... 9
5. Surveys: Findings and discussion .........................................................................................14
5.1. Sample profile ............................................................................................................. 14
5.2. Findings and discussion .............................................................................................. 16
5.2.1. Main constraints to exporting ............................................................................ 16
5. Percentage of total respondents by size and category of main constraint .............................17
5.2.2. Access to trade facilitation ............................................................................ 18
5.2.3. Government and private sector support ............................................................ 23
5.2.4. Policies with positive effects on exports by MSME ............................................ 25
Conclusion and policy recommendations ..................................................................................26
6.1. Increasing awareness among MSMEs ........................................................................ 28
6.2. Training on accessing trade facilitation information ..................................................... 28
6.3. Promotion of ICT ......................................................................................................... 28
References ...............................................................................................................................30
Annex .......................................................................................................................................32
2
Introduction
The study described in this chapter examines the effect of trade facilitation measures on
export-oriented micro, small and medium-sized enterprises (MSMEs) in Indonesia.1 While
trade facilitation frequently refers to all measures that can be taken to facilitate cross-border
trade flows, there is no standard formal definition of trade facilitation. In a broader sense of
the term, as stated in Damuri (2006), trade facilitation can be defined as any action that is
intended to reduce transaction costs that affect the international movement of goods,
services, investments and people. Trade facilitation also refers to policies and measures
aimed at easing trade costs by improving efficiency at each stage of the international trade
chain (e.g., Moïsé and others, 2011). The coverage of trade facilitation may include aspects
such as trade procedures, trade finance, market information, customs, regulatory bodies,
provisions for official control procedures applicable to import, export and transit provisions
related to transport and transport equipment, provisions related to the use of information and
communication technologies, logistics and infrastructure, among others. The study poses
two main research questions:
(a) Do export-oriented MSMEs have access to trade facilitation?
(b) How helpful is trade facilitation in supporting exports by MSMEs?
Availability of good trade facilitation and full access to the benefits of trade facilitation
measures are considered very important for MSMEs, which, in turn, generate employment,
produce basic goods for middle- and low-income households and contribute significantly to
the country’s gross domestic product (GDP). Data from the National Statistics Agency (BPS)
on MSMEs indicate that almost all of them (about 51 million units in total) are micro
enterprises (MIEs) (mainly self-employment) and small enterprises (SEs), and that the
owners and workers engaged in these largely family owned-enterprises are from the low-
income group (BPS, 2010). Due to their lack of capital, technology, access to wider markets
and skilled manpower, on average these labour-intensive enterprises have low levels of
productivity and income.
Improvement in MSME performance (e.g., productivity and export growth), especially MIEs
and SEs, may strongly contribute to poverty alleviation, as they often involve poor farming
communities or landless farm households. Empowerment of MIEs has indeed been
1 It uses the National Statistics Agency definition of MSMEs: (a) micro enterprises as production units/firms – 0 to 4 workers; small enterprises – 5 to 20 workers; medium enterprises – 21-99 workers; and large enterprises – 100 or more workers.
3
generally accepted as an important strategy for poverty alleviation (Harvie, 2003; Suryahadi
and others, 2010). One way to empower these enterprises is to support them through
exporting, as many MIEs are also involved directly or indirectly in export activities, mainly in
the handicrafts industry (BPS, 2010).
The study is based on:
(a) Desk research – academic literature on MSMEs, especially with regard to their
export performance and access to trade facilitation in Indonesia and other Asian
developing countries, 2 reports from the Government and various non-
governmental organizations (NGOs), and other publications on trade facilitation
and MSMEs’ access to trade facilitation in Indonesia;
(b) Secondary data analysis on MSMEs in Indonesia focusing on export-oriented
enterprises;
(c) Key informant/in-depth interviews (e.g., related local government officials, NGOs
assisting MSMEs in exporting);
(d) Field surveys in two clusters of export-oriented MSMEs with 30 producers in Solo
and 52 producers D. I. Yogyakarta as respondents. Both regions are located in
central Java. The respondents were selected randomly, based on the lists of
members provided by the local Chamber of Commerce (Kadinda). They were
interviewed face-to-face, using a semi-structured questionnaire comprising a list
of questions covering broad areas related to trade facilitation (see annex).
MSMEs as well as large enterprises (LEs) are considered in order to gain a
comparative picture regarding the research questions stated above.
2 Mainly through the World Bank and Asian Development Bank databases, and studies carried out, for example, in India and Sri Lanka for ARTNeT.
4
1. Development of Indonesian MSMEs
Historically, Indonesian MSMEs have always been the main players in domestic economic
activities, accounting for more than 99 per cent of all existing firms across sectors (table 1)
and providing employment for more than 90 per cent of the country’s total workforce (table
2), comprising mostly women and youths. The majority of MSMEs are micro- and small-
sized enterprises (MSEs), and within the MSEs the dominant enterprises in terms of number
are MIEs, or about 99 per cent of total MSEs. Many MIEs are established by poor
households or individuals who could not find better job opportunities elsewhere, as either
their primary or secondary (supplementary) source of income. If not all, at least the majority
of MIEs are operating in the informal sector (which means that the majority of MSMEs in
Indonesia are operating in the informal sector). Their presence in rural as well as urban
areas in Indonesia is often considered to be a result of current unemployment or poverty
problems, and not a reflection of entrepreneurship spirit (Tambunan, 2006, 2008, 2009(a)
and 2009(b).3
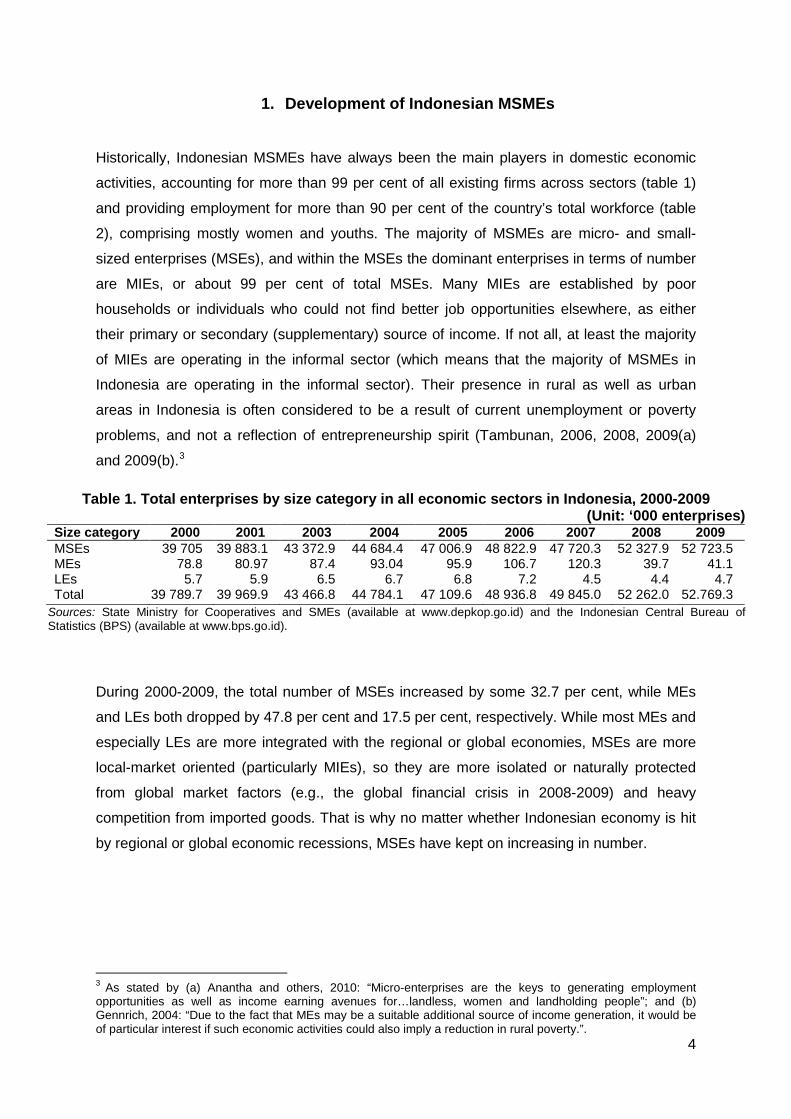
Table 1. Total enterprises by size category in all economic sectors in Indonesia, 2000-2009 (Unit: ‘000 enterprises)
Size category 2000 2001 2003 2004 2005 2006 2007 2008 2009 MSEs 39 705 39 883.1 43 372.9 44 684.4 47 006.9 48 822.9 47 720.3 52 327.9 52 723.5 MEs 78.8 80.97 87.4 93.04 95.9 106.7 120.3 39.7 41.1 LEs 5.7 5.9 6.5 6.7 6.8 7.2 4.5 4.4 4.7 Total 39 789.7 39 969.9 43 466.8 44 784.1 47 109.6 48 936.8 49 845.0 52 262.0 52.769.3
Sources: State Ministry for Cooperatives and SMEs (available at www.depkop.go.id) and the Indonesian Central Bureau of Statistics (BPS) (available at www.bps.go.id).
During 2000-2009, the total number of MSEs increased by some 32.7 per cent, while MEs
and LEs both dropped by 47.8 per cent and 17.5 per cent, respectively. While most MEs and
especially LEs are more integrated with the regional or global economies, MSEs are more
local-market oriented (particularly MIEs), so they are more isolated or naturally protected
from global market factors (e.g., the global financial crisis in 2008-2009) and heavy
competition from imported goods. That is why no matter whether Indonesian economy is hit
by regional or global economic recessions, MSEs have kept on increasing in number.
3 As stated by (a) Anantha and others, 2010: “Micro-enterprises are the keys to generating employment opportunities as well as income earning avenues for…landless, women and landholding people”; and (b) Gennrich, 2004: “Due to the fact that MEs may be a suitable additional source of income generation, it would be of particular interest if such economic activities could also imply a reduction in rural poverty.”.
5
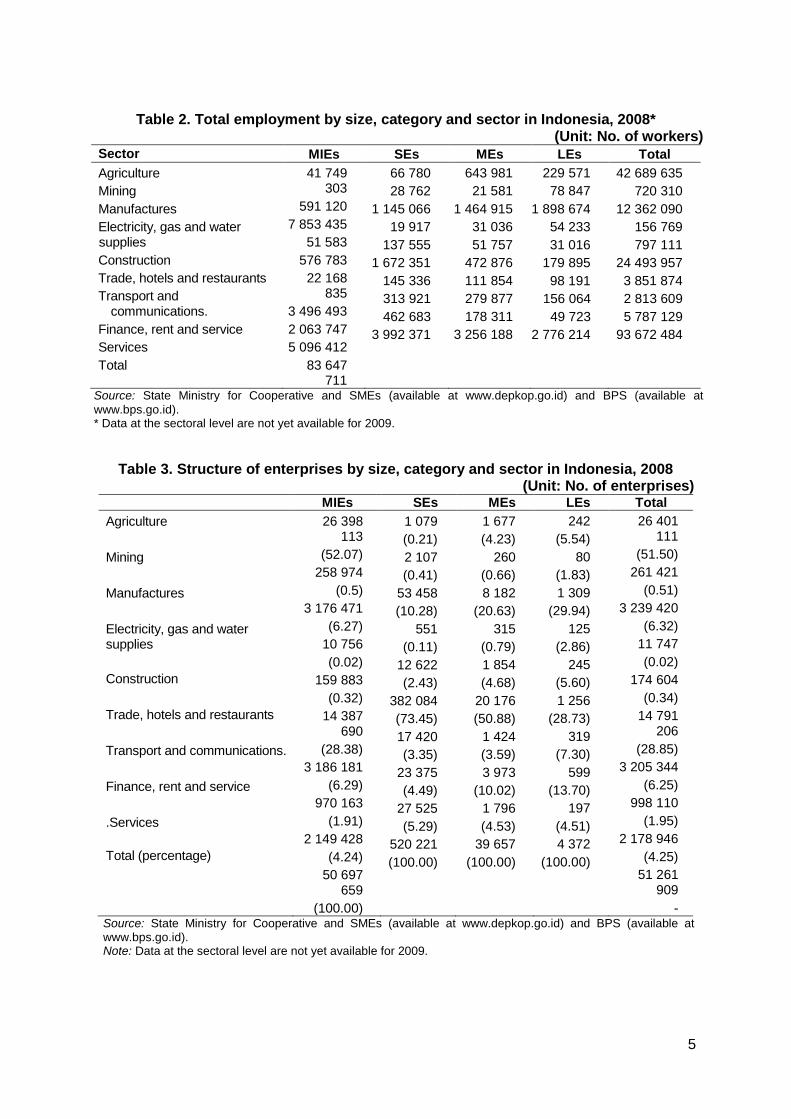
Table 2. Total employment by size, category and sector in Indonesia, 2008*
(Unit: No. of workers) Sector MIEs SEs MEs LEs Total Agriculture Mining Manufactures Electricity, gas and water supplies Construction Trade, hotels and restaurants Transport and
communications. Finance, rent and service Services Total
41 749 303
591 120 7 853 435
51 583 576 783
22 168 835
3 496 493 2 063 747 5 096 412
83 647 711
66 780 28 762
1 145 066 19 917
137 555 1 672 351
145 336 313 921 462 683
3 992 371
643 981 21 581
1 464 915 31 036 51 757
472 876 111 854 279 877 178 311
3 256 188
229 571 78 847
1 898 674 54 233 31 016
179 895 98 191
156 064 49 723
2 776 214
42 689 635 720 310
12 362 090 156 769 797 111
24 493 957 3 851 874 2 813 609 5 787 129
93 672 484
Source: State Ministry for Cooperative and SMEs (available at www.depkop.go.id) and BPS (available at www.bps.go.id). * Data at the sectoral level are not yet available for 2009.
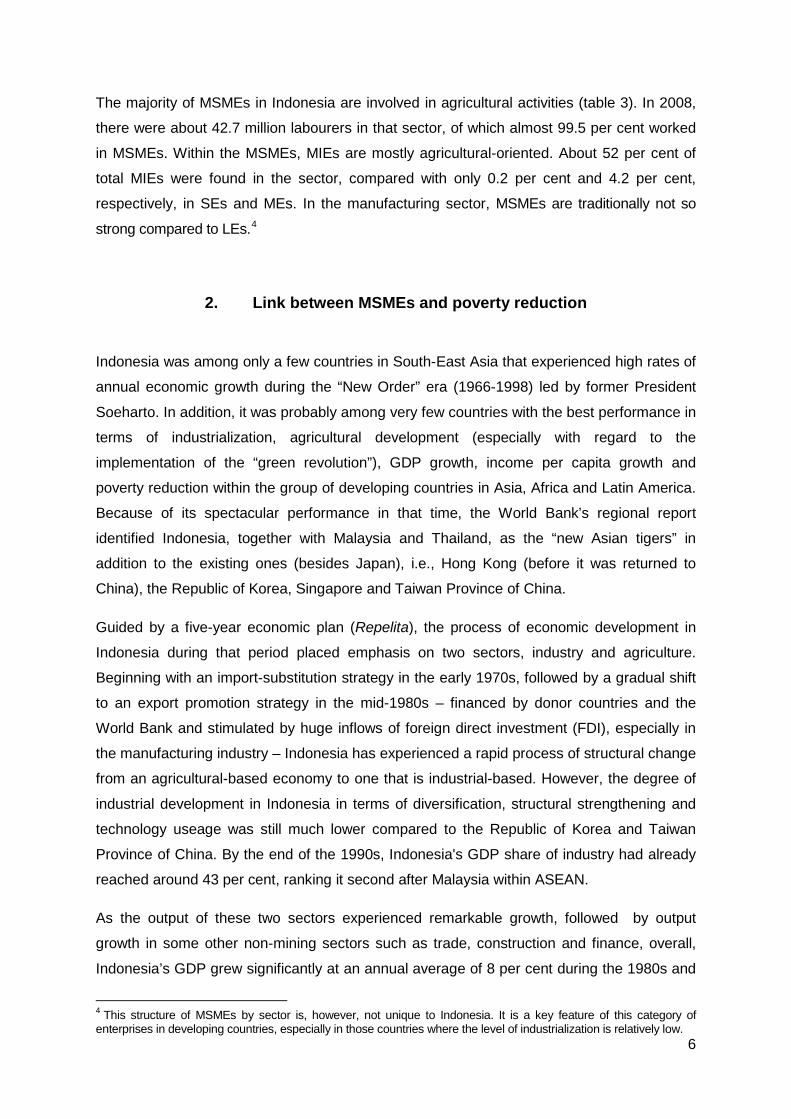
Table 3. Structure of enterprises by size, category and sector in Indonesia, 2008
(Unit: No. of enterprises) MIEs SEs MEs LEs Total
Agriculture Mining Manufactures Electricity, gas and water supplies Construction Trade, hotels and restaurants Transport and communications. Finance, rent and service .Services Total (percentage)
26 398 113
(52.07) 258 974
(0.5) 3 176 471
(6.27) 10 756 (0.02)
159 883 (0.32)
14 387 690
(28.38) 3 186 181
(6.29) 970 163
(1.91) 2 149 428
(4.24) 50 697
659 (100.00)
1 079 (0.21) 2 107 (0.41)
53 458 (10.28)
551 (0.11)
12 622 (2.43)
382 084 (73.45) 17 420 (3.35)
23 375 (4.49)
27 525 (5.29)
520 221 (100.00)
1 677 (4.23)
260 (0.66) 8 182
(20.63) 315
(0.79) 1 854 (4.68)
20 176 (50.88)
1 424 (3.59) 3 973
(10.02) 1 796 (4.53)
39 657 (100.00)
242 (5.54)
80 (1.83) 1 309
(29.94) 125
(2.86) 245
(5.60) 1 256
(28.73) 319
(7.30) 599
(13.70) 197
(4.51) 4 372
(100.00)
26 401 111
(51.50) 261 421
(0.51) 3 239 420
(6.32) 11 747 (0.02)
174 604 (0.34)
14 791 206
(28.85) 3 205 344
(6.25) 998 110
(1.95) 2 178 946
(4.25) 51 261
909 -
Source: State Ministry for Cooperative and SMEs (available at www.depkop.go.id) and BPS (available at www.bps.go.id). Note: Data at the sectoral level are not yet available for 2009.
6
The majority of MSMEs in Indonesia are involved in agricultural activities (table 3). In 2008,
there were about 42.7 million labourers in that sector, of which almost 99.5 per cent worked
in MSMEs. Within the MSMEs, MIEs are mostly agricultural-oriented. About 52 per cent of
total MIEs were found in the sector, compared with only 0.2 per cent and 4.2 per cent,
respectively, in SEs and MEs. In the manufacturing sector, MSMEs are traditionally not so
strong compared to LEs.4
2. Link between MSMEs and poverty reduction
Indonesia was among only a few countries in South-East Asia that experienced high rates of
annual economic growth during the “New Order” era (1966-1998) led by former President
Soeharto. In addition, it was probably among very few countries with the best performance in
terms of industrialization, agricultural development (especially with regard to the
implementation of the “green revolution”), GDP growth, income per capita growth and
poverty reduction within the group of developing countries in Asia, Africa and Latin America.
Because of its spectacular performance in that time, the World Bank’s regional report
identified Indonesia, together with Malaysia and Thailand, as the “new Asian tigers” in
addition to the existing ones (besides Japan), i.e., Hong Kong (before it was returned to
China), the Republic of Korea, Singapore and Taiwan Province of China.
Guided by a five-year economic plan (Repelita), the process of economic development in
Indonesia during that period placed emphasis on two sectors, industry and agriculture.
Beginning with an import-substitution strategy in the early 1970s, followed by a gradual shift
to an export promotion strategy in the mid-1980s – financed by donor countries and the
World Bank and stimulated by huge inflows of foreign direct investment (FDI), especially in
the manufacturing industry – Indonesia has experienced a rapid process of structural change
from an agricultural-based economy to one that is industrial-based. However, the degree of
industrial development in Indonesia in terms of diversification, structural strengthening and
technology useage was still much lower compared to the Republic of Korea and Taiwan
Province of China. By the end of the 1990s, Indonesia's GDP share of industry had already
reached around 43 per cent, ranking it second after Malaysia within ASEAN.
As the output of these two sectors experienced remarkable growth, followed by output
growth in some other non-mining sectors such as trade, construction and finance, overall,
Indonesia’s GDP grew significantly at an annual average of 8 per cent during the 1980s and
4 This structure of MSMEs by sector is, however, not unique to Indonesia. It is a key feature of this category of enterprises in developing countries, especially in those countries where the level of industrialization is relatively low.
7
up to 1997 with a peak of 9.9 per cent in 1990 Income per capita also increased steadily
from less than US$ 500 in 1970 (which placed Indonesia among the poorest countries in the
world at that time together with, for example, Bangladesh, Nepal and Sri Lanka) up to slightly
more than US$ 1,000 in 1996. After declining during the Asian financial crisis in 1997-1998,
it started to rise again in 1999. Since then, it has continued to increase and was expected to
reach more than US$ 2,500 in 2011.
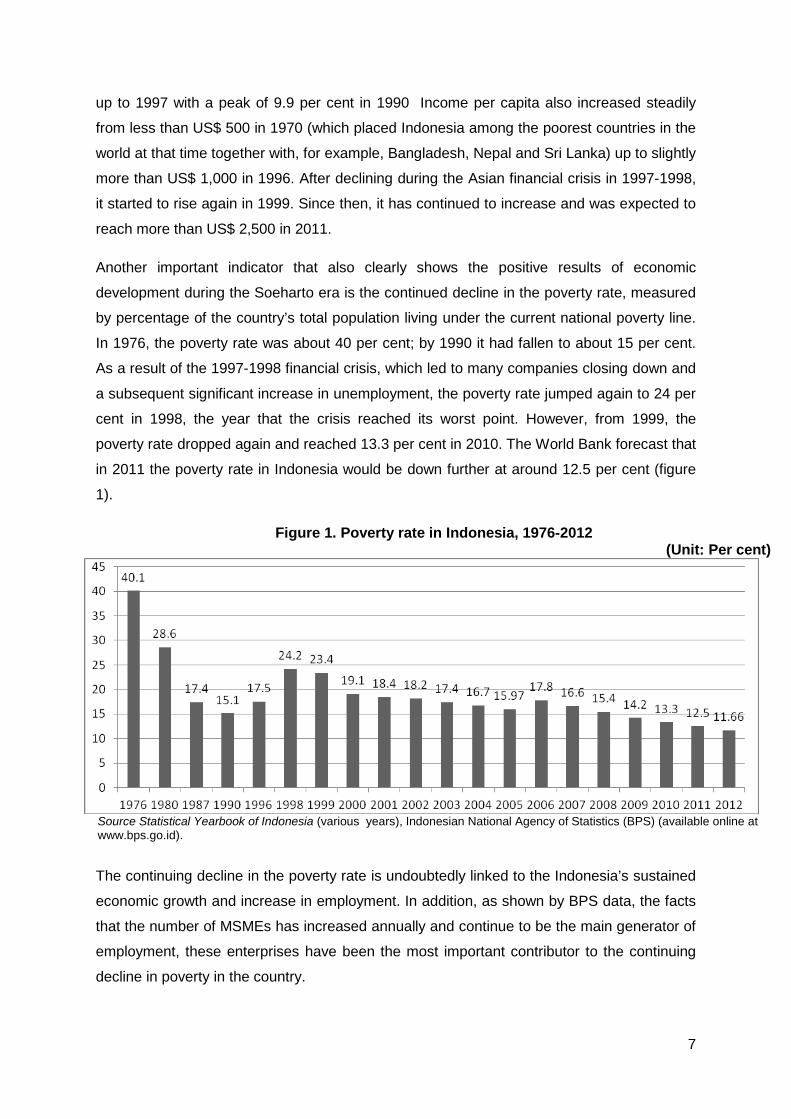
Another important indicator that also clearly shows the positive results of economic
development during the Soeharto era is the continued decline in the poverty rate, measured
by percentage of the country’s total population living under the current national poverty line.
In 1976, the poverty rate was about 40 per cent; by 1990 it had fallen to about 15 per cent.
As a result of the 1997-1998 financial crisis, which led to many companies closing down and
a subsequent significant increase in unemployment, the poverty rate jumped again to 24 per
cent in 1998, the year that the crisis reached its worst point. However, from 1999, the
poverty rate dropped again and reached 13.3 per cent in 2010. The World Bank forecast that
in 2011 the poverty rate in Indonesia would be down further at around 12.5 per cent (figure
1).
Figure 1. Poverty rate in Indonesia, 1976-2012 (Unit: Per cent)
Source Statistical Yearbook of Indonesia (various years), Indonesian National Agency of Statistics (BPS) (available online at www.bps.go.id).
The continuing decline in the poverty rate is undoubtedly linked to the Indonesia’s sustained
economic growth and increase in employment. In addition, as shown by BPS data, the facts
that the number of MSMEs has increased annually and continue to be the main generator of
employment, these enterprises have been the most important contributor to the continuing
decline in poverty in the country.
8
3. Export performance
Most of the MSMEs in Indonesia (as in developing economies in general) are domestic
market-oriented. In general, they lack: (a) technology and skilled workers, which prevents
them from producing highly competitive products that meet world standards; (b) information,
especially on market potential (including current changes in market demand/taste); (c) global
business strategies; and (d) capital for financing export activities. In Indonesia, as in other
developing countries, it is not uncommon (especially for MIEs and SEs) for direct
international trade to be too costly due to various aspects such as promotion, distribution,
communications, export licences, transportation and logistics. However, even if they are not
directly involved in international trade, MSMEs can be integrated into export supply chains
through the supply of components or semi-finished goods to export-oriented LEs. 5
Unfortunately, no national data are available on the involvement of Indonesian MSMEs in
export supply chains. However, many Indonesian MSMEs are believed to have forward
production linkages with exporting companies.
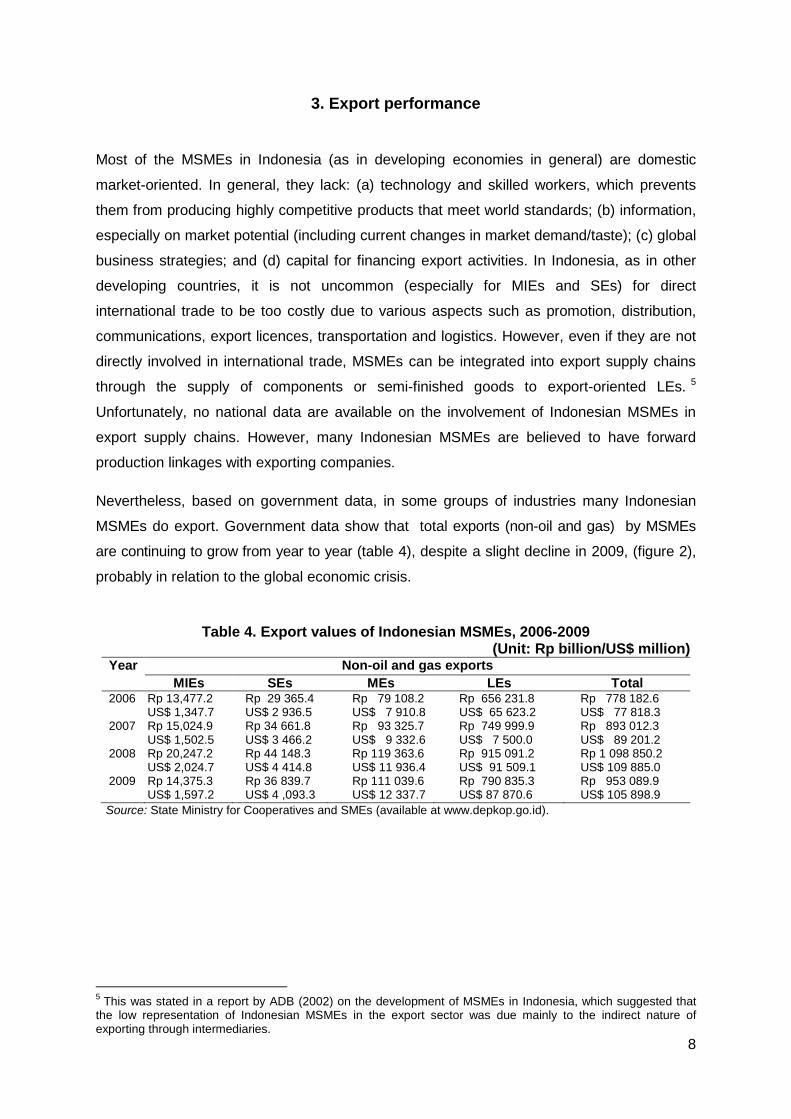
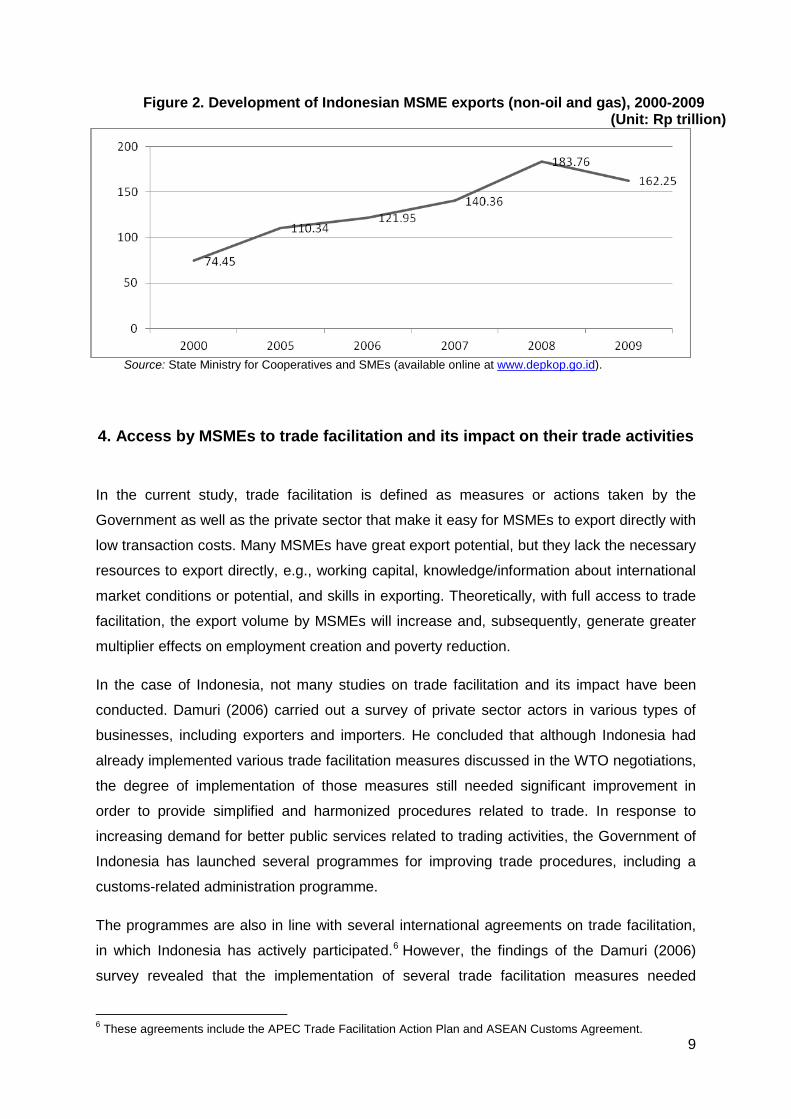
Nevertheless, based on government data, in some groups of industries many Indonesian
MSMEs do export. Government data show that total exports (non-oil and gas) by MSMEs
are continuing to grow from year to year (table 4), despite a slight decline in 2009, (figure 2),
probably in relation to the global economic crisis.
Table 4. Export values of Indonesian MSMEs, 2006-2009
(Unit: Rp billion/US$ million) Year Non-oil and gas exports
MIEs SEs MEs LEs Total 2006 2007 2008 2009
Rp 13,477.2 US$ 1,347.7 Rp 15,024.9 US$ 1,502.5 Rp 20,247.2 US$ 2,024.7 Rp 14,375.3 US$ 1,597.2
Rp 29 365.4 US$ 2 936.5 Rp 34 661.8 US$ 3 466.2 Rp 44 148.3 US$ 4 414.8 Rp 36 839.7 US$ 4 ,093.3
Rp 79 108.2 US$ 7 910.8 Rp 93 325.7 US$ 9 332.6 Rp 119 363.6 US$ 11 936.4 Rp 111 039.6 US$ 12 337.7
Rp 656 231.8 US$ 65 623.2 Rp 749 999.9 US$ 7 500.0 Rp 915 091.2 US$ 91 509.1 Rp 790 835.3 US$ 87 870.6
Rp 778 182.6 US$ 77 818.3 Rp 893 012.3 US$ 89 201.2 Rp 1 098 850.2 US$ 109 885.0 Rp 953 089.9 US$ 105 898.9
Source: State Ministry for Cooperatives and SMEs (available at www.depkop.go.id).
5 This was stated in a report by ADB (2002) on the development of MSMEs in Indonesia, which suggested that the low representation of Indonesian MSMEs in the export sector was due mainly to the indirect nature of exporting through intermediaries.
9
Figure 2. Development of Indonesian MSME exports (non-oil and gas), 2000-2009 (Unit: Rp trillion)
Source: State Ministry for Cooperatives and SMEs (available online at www.depkop.go.id).
4. Access by MSMEs to trade facilitation and its impact on their trade activities
In the current study, trade facilitation is defined as measures or actions taken by the
Government as well as the private sector that make it easy for MSMEs to export directly with
low transaction costs. Many MSMEs have great export potential, but they lack the necessary
resources to export directly, e.g., working capital, knowledge/information about international
market conditions or potential, and skills in exporting. Theoretically, with full access to trade
facilitation, the export volume by MSMEs will increase and, subsequently, generate greater
multiplier effects on employment creation and poverty reduction.
In the case of Indonesia, not many studies on trade facilitation and its impact have been
conducted. Damuri (2006) carried out a survey of private sector actors in various types of
businesses, including exporters and importers. He concluded that although Indonesia had
already implemented various trade facilitation measures discussed in the WTO negotiations,
the degree of implementation of those measures still needed significant improvement in
order to provide simplified and harmonized procedures related to trade. In response to
increasing demand for better public services related to trading activities, the Government of
Indonesia has launched several programmes for improving trade procedures, including a
customs-related administration programme.
The programmes are also in line with several international agreements on trade facilitation,
in which Indonesia has actively participated.6 However, the findings of the Damuri (2006)
survey revealed that the implementation of several trade facilitation measures needed
6 These agreements include the APEC Trade Facilitation Action Plan and ASEAN Customs Agreement.
10
significant improvement. While the availability of information related to trading activities has
shown significant progress, this remains the most problematic issue. Damuri also found that
many traders faced difficulties in meeting certain regulations and procedures based on new
regulations, as they were issued and implemented simultaneously, without any notification.
The lack of formal consultative mechanisms exacerbated the situation. Rampant illegal
conduct of officials was found to be eroding the competitiveness of Indonesian products.
Traders surveyed complained that improper conduct of trade-related officials had not only
increased costs, but also slowed down their activities, which could lead to the loss of
business opportunities and substantial market share.
Rahardhan and others (2008) studied the impact of trade facilitation on export activities in
Indonesia. They examined the impact of ASEAN trade facilitation on trade volumes of the
main important commodities from East Java. They conducted in-depth interviews with
exporting firms of all sizes as well as some key officials. The findings from the interviews
showed that from the perspective of the respondents, the most important trade facilities
were:
(a) Tariff barriers – the respondents said that that removing all problems related to
customs procedures, tariff differences in line with declining MFN tariffs,
administration procedures in completing all the required forms, and information
on the Common Effective Preferential Tariff (CEPT) scheme had the most
important effects;
(b) Non-tariff barriers – the issues related to import licences, technical regulations,
various extra taxes (including tax of foreign exchange transactions) and the
customs clearance procedure were highlighted as important impediments.
The most recent study, although not focusing on Indonesia, was made by Otsuki (2011) who
attempted to quantify the benefits of trade facilitation in ASEAN. He assessed the
performance and progress of the ASEAN economies in trade facilitation, and the effect of
improved trade facilitation on the region’s manufacturing trade. In a scenario of raising the
below-average countries halfway to the global average, he estimated ASEAN’s trade would
increase by US$99 billion, three-quarters of which would come from the region’s own
improvements. He also found that regulatory reforms (e.g., the enhancement of
transparency of trade-related regulations as well as ensuring law-abiding operations of the
regulatory authorities) to be the most effective ones.
Other important studies were carried out by Shepherd and Wilson (2009) in ASEAN, and by
ADB and ESCAP (2009) Trade flows in ASEAN were found to be particularly sensitive to
trade facilitation, especially with regard to transport infrastructure as well as information and
11
communications technology. The findings suggested that the region could make significant
economic gains from trade facilitation reform. Shepherd (2010) revealed two important facts.
First, trade costs in many APEC economies have declined significantly since the 2001
Shanghai Declaration, in which APEC economies committed to reduce trade costs by 5 per
cent over the following five years through tariff reductions and trade facilitation. The
performance of individual economies, however, has varied substantially, and some
economies are far below the Shanghai target. ASEAN member countries have also
experienced some declines in trade costs, but generally to a lesser extent than in APEC.
However, in both groups, tariff reductions have played an important role in reducing overall
trade costs. Progress on non-tariff trade costs has been much less impressive. This finding
raises serious questions as to the effectiveness of trade facilitation efforts in the APEC
region, which should be clearly focused on non-tariff trade costs or improvement of trade
facilitation (Shepherd, 2010).
Trade facilitation performance in Asia and the Pacific has improved with a reduction of (a)
the number of days involved needed to import and export and (b) other trade costs including
international transportation costs. However, the trade facilitation performance gap between
the APEC region and the world’s most developed economies remains wide. In addition,
national trade facilitation measures in many developing countries in Asia have often
inherently focused on facilitating imports and exports from and to developed countries, partly
because of the increasingly sophisticated requirements imposed by developed countries on
their trading partners as part of trade security initiatives. As such, trade facilitation concerns
at many land borders have remained unanswered.
Unfortunately, until now not many studies have been conducted specifically on access by
export-oriented MSMEs to trade facilitation and the resultant impact on their export volume
and costs in Indonesia. However, some official statements made by government agencies
may indirectly suggest that access to trade facilitation measures is still a serious constraint
for MSMEs. Trade finance is among the important trade facilitation measures, and recently
Bank Indonesia (BI) stated that 50 per cent of all MSMEs in Indonesia were still not served
by banks.7
Existing limited studies include Alavi (2009), who discussed the development of MSMEs in
Indonesia during the 2008-2009 global economic crisis and the importance of trade
facilitation, especially trade finance. However, the study was limited by the lack of strong
7 For additional details see http://ditjenpdn.kemendag. go.id/index.php/public/information/articles-detail/berita/30).
12
evidence as to whether these enterprises had easy access to trade facilitation and what had
been the impact on their performance or their survival ability in times of economic crisis.
A prior study by Tambunan (2009c) is probably the only serious attempt so far to examine
the impact of trade facilitation on export activities of MSMEs in Indonesia. He conducted a
survey of 39 export-oriented MSMEs in the wood furniture industry in Central Java in August
2009. His main argument regarding the basis for conducting his study was the fact that many
export-oriented MSMEs or those that had strong potential to become exporters could not
directly export by themselves, but had to go through a third party such as large-sized
exporting or trading companies. He highlighted two main reasons. First, a financial problem –
most MSMEs, especially MSEs, lack sufficient capital needed to pay all costs involved in export
activities. On the other hand, it is not easy for them to get sufficient support from banks or other
formal financing institutions. Second, the existence of institutional and business constraints
that MSMEs are unable solve because:
(a) They do not have direct access to export markets or no access to information on
export market opportunities and requirements;
(b) They are unable to adjust to rapid changes in export markets;
(c) High risks exist in payment and shipment;
(d) Delayed payments by importers. Small-sized exporters/producers cannot shoulder
such a burden as a daily cash flow is vital to their business;
(e) There is higher cost involved in direct export activities by MSMEs;
(f) They have no access to trade facilitation benefits.
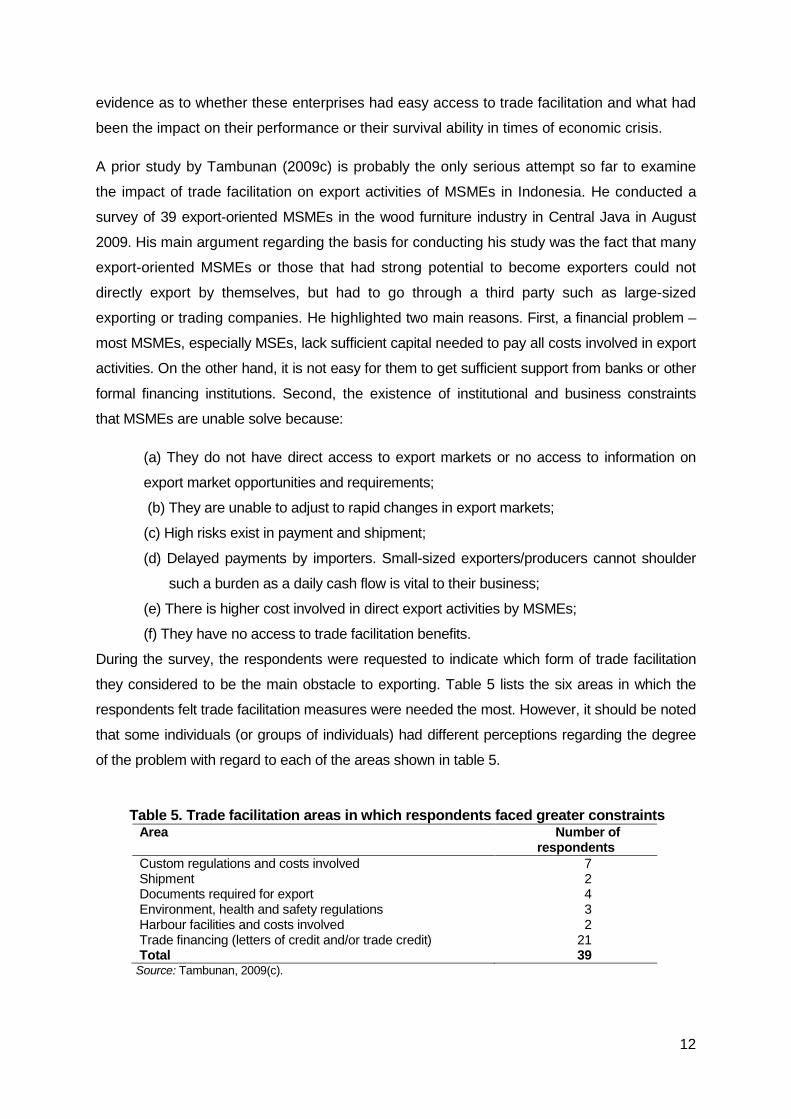
During the survey, the respondents were requested to indicate which form of trade facilitation
they considered to be the main obstacle to exporting. Table 5 lists the six areas in which the
respondents felt trade facilitation measures were needed the most. However, it should be noted
that some individuals (or groups of individuals) had different perceptions regarding the degree
of the problem with regard to each of the areas shown in table 5.
Table 5. Trade facilitation areas in which respondents faced greater constraints
Area Number of respondents
Custom regulations and costs involved Shipment Documents required for export Environment, health and safety regulations Harbour facilities and costs involved Trade financing (letters of credit and/or trade credit) Total
7 2 4 3 2
21 39
Source: Tambunan, 2009(c).
13
The findings of the survey indicate that a lack of access to trade financing was seen as a major
problem by the majority of the respondents. This finding is interesting due to the fact that many
banks in Indonesia have been making efforts to facilitate SMEs in trade. Apart from private
commercial banks, such as Bank International Indonesia and Standard Chartered Bank,
several state-owned banks such as Bank Mandiri, BRI, BNI and Bank Ekspor-Impor
Indonesia also provide trade facilities to MSMEs. The trade facilities include loans for
working capital, investment credit, letters of credit (L/C), foreign exchange lines, bank
guarantees, shipping guarantees, business management accounts for international trade
(current accounts with interest and integrated trade facility), loans against trust receipt
(LATR) , inward bills collection (IBC), invoice financing for suppliers (purchases), credit bills
negotiation (CBN) – clean and discrepant, pre-export financing, export bill collection (EBC).
Trade facilitation can benefit MSMEs directly as well as indirectly. Direct benefit refers to
those MSMEs that have access to trade facilitation; this not only lowers the cost of inputs
procurement (resulting in lower production costs and subsequently increased production by
MSMEs), but also leads to export growth among MSMEs as exporting is made easier and
cheaper. Indirect benefit refers to those MSMEs having no access to trade facilitation but
which are still able to benefit from existing trade facilitation through subcontracts and
piecemeal production with LEs. With access to trade facilitation, LE trading costs decline,
which is reflected in increased production. This may lead to higher demand for intermediate
goods or components produced by MSMEs, which means increased production by MSMEs.
The increase in exports by MSMEs as a result of their access to trade facilitation may also
provide benefits indirectly to other local MSMEs through greater demand for intermediate
goods or components by the former.
Although information on MSMEs having business/production linkages with LEs in Indonesia
is scarce, the automotive industry has enjoyed success in subcontracting activities between
large-scale automotive companies and MSMEs as subcontractors in the supply of
components and spare parts. In the export sector, only in a few industrial groups are the
business linkages between MSMEs and LEs relatively strong. This includes the furniture
industry, where MSMEs supply semi-finished goods to exporting LEs.
The above results of the analysis of expected benefits of trade facilitation for MSMEs can
also be applied both to MSMEs in the formal sector (MEs and, to a lesser extent, SEs) and
to those in the informal sector (mainly MIEs). Trade facilitation can be expected to have
different effects in these two categories – enterprises in the formal sector may have greater
access to trade facilitation than their counterparts operating in the informal sector. However,
trade facilitation may still provide indirect benefits to enterprises in the informal sector that
have business linkages with those in the formal sector with access to trade facilitation.
14
5. Surveys: Findings and discussion
This study, with its large sample from two regions of Indonesia, should be considered as an
attempt to increase the information available on the impact of trade facilitation improvement
in Indonesia. The study addresses the gaps by focusing more on access by MSMEs to trade
facilitation, their way of exporting (directly or indirectly) and the main constraints they face,
their perception of competition as a direct result of free trade agreements and the impact on
their exports.
5.1. Sample profile
Two field surveys on export-oriented MSMEs in two different locations/cities in Central Java
(Solo and D.I. Yogyakarta) were conducted for this study. The sample included LEs as a
comparison.8 The respondents surveyed totalled 82 producers comprising:
(a) Solo – 20 LEs and 10 MSMEs; (b) D.I. Yogyakarta – 3 LEs and 49 MSMEs.9
The respondents were selected randomly, based on the lists of export-oriented MSMEs and
LEs as members of the regional chamber of commerce and industry (CCI) in each of the two
regions. The total number of respondents differed between the regions because (a) the total
number of CCI members in Solo is not the same as in the CCI in D.I. Yogyakarta, and (b) the
number of members who were still exporting also varied between the two regions. As a
result, the samples of the two regions do not appear to be representative. However, the
survey results may clarify this issue.
The commodities produced and exported by the respondents range from wood/bamboo and
rattan furniture to clothing and handicrafts. Thus, they are all producers or firms in the
manufacturing industry. Among the surveyed LEs, the largest-sized respondent employs
more than 1,000 workers, and some LEs have more than one factory located in or around
Solo city. The smallest-sized respondent employs 100 wage-earning workers in Solo.
Among the surveyed MSMEs, the largest-sized respondent employs 86 workers; one
respondent was operating without wage-earning workers (a “self-employment unit”) while
8 The initial plan was to have more MSMEs than LEs as respondents in Solo. During the observations and the survey, it was found that some MSMEs were no longer exporting – in some cases, since many years previously – for various reasons, including difficulties in competing, a lack of capital to finance export activities (since getting financial support from the Government or credit from banks was difficult), high transportation/distribution costs and a lack of information. 9 The survey, which took place during May 2012, was conducted in collaboration with local chambers of commerce and industry (CCI). During the survey, focus group discussions with local government officials, some of the respondents and CCI officials were also conducted at the CCI offices during the same month.
15
many others have only two workers. The majority of the sampled MSMEs are from the MSE
category. The sample also includes a large number of women entrepreneurs.
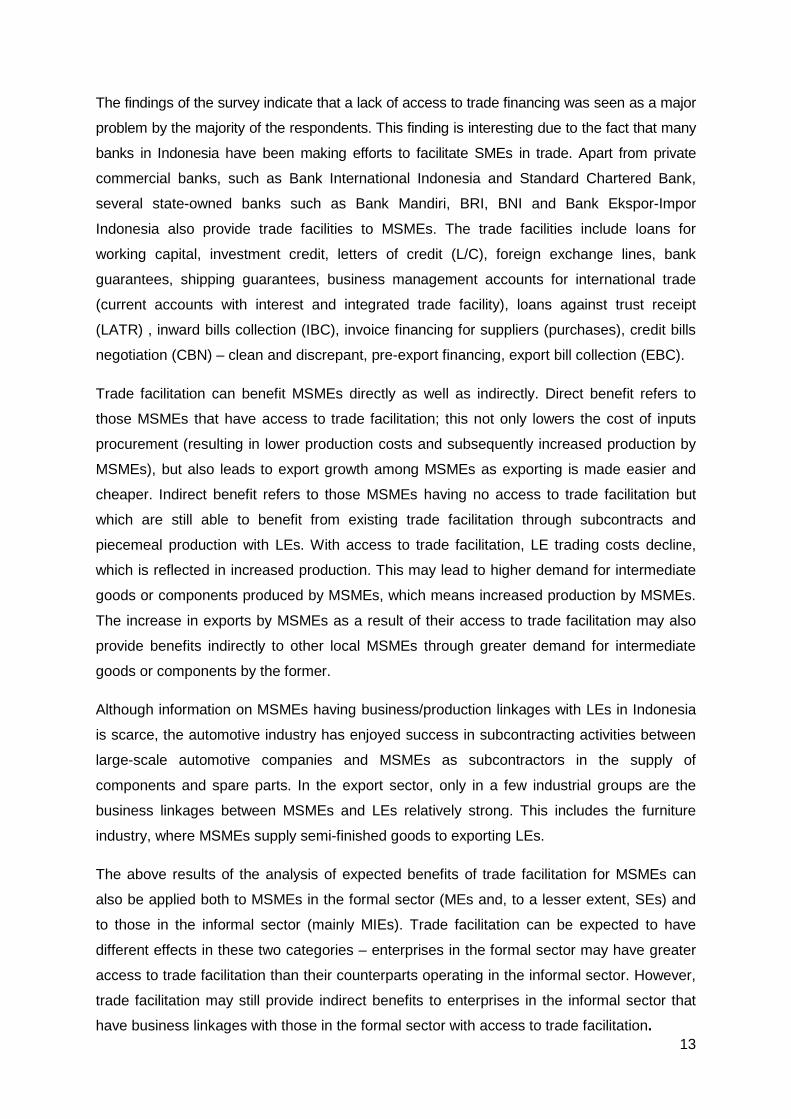
With regard to the degree of involvement in export activities, among the sampled firms the
survey found LEs to be more export-oriented, in the sense that there are more LEs than
MSMEs in the sample that export 100 per cent of their production output. As figure 3 shows,
about 21.7 per cent of the sampled LEs serve only foreign markets, while in the case of
MSMEs it is only 11.9 per cent. This finding is not surprising, however, as MSMEs in general
(especially MSEs) face greater difficulties than their larger counterparts in exporting due to
their lack of skills, information and capital. These are crucial inputs that all firms/producers
need, not only for actual exporting, but also to: (a) identify market opportunities; (b)
understand current market changes; (c) attain full knowledge of existing rules and
regulations related to export activities as well as regulations related to import activities in
countries of destination; and (d) undertake promotion and regional/global marketing
activities.
Figure 3. Market orientation of sample respondents
(Unit: Per cent)
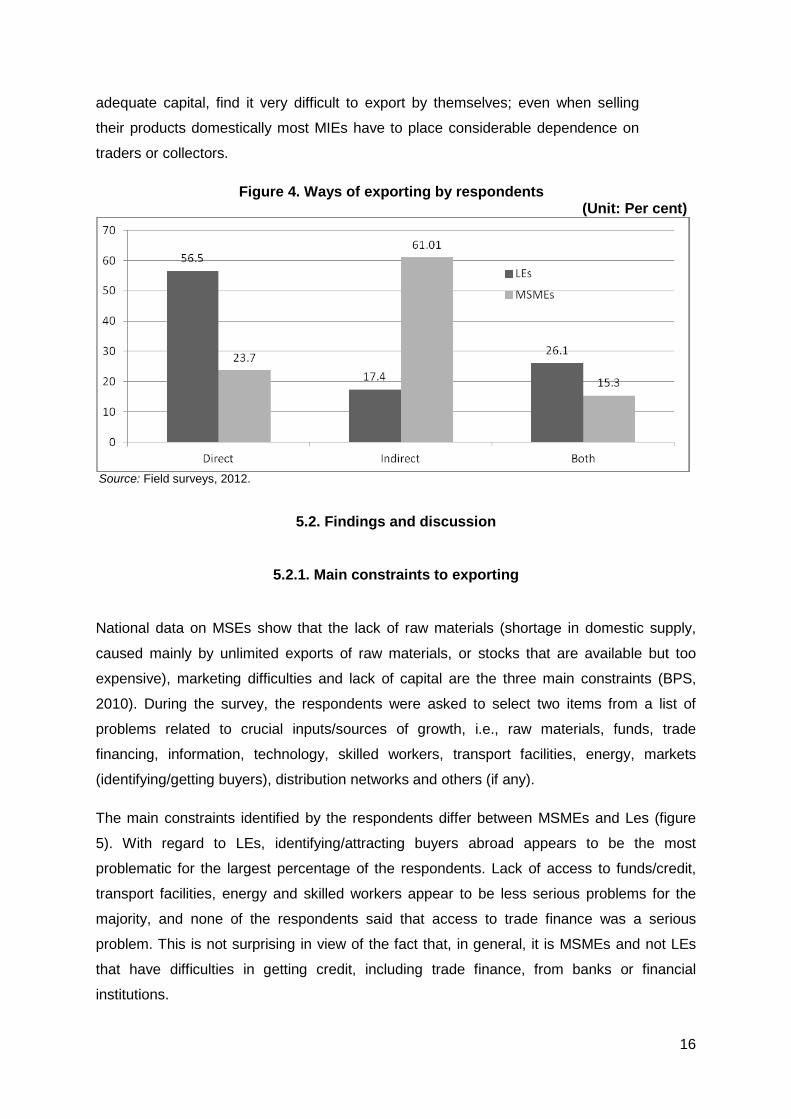
Source: Field surveys in Solo and D.I. Yogyakarta in 2012. The field surveys also revealed that more sample LEs than MSMEs exported
directly without the help of intermediate agents such as traders or trading
companies, or collectors. As figure 4 shows, 56.5 per cent of the surveyed LEs
export by themselves, compared with only 23.7 per cent of the sampled MSMEs.
The reason is the same as that mentioned above as MSMEs in general are not able
to export by themselves due to their lack of knowledge about regional/international
marketing, bargaining skills and other aspects directly related to export activities as
well as the necessary capital to carry out the whole exporting process, from
identifying potential buyers abroad and promotion, to export administration
procedures and shipping. MIEs in particular, which are mainly run by individuals
who are less-skilled with regard to international business aspects and which lack
16
adequate capital, find it very difficult to export by themselves; even when selling
their products domestically most MIEs have to place considerable dependence on
traders or collectors.
Figure 4. Ways of exporting by respondents (Unit: Per cent)
Source: Field surveys, 2012.
5.2. Findings and discussion
5.2.1. Main constraints to exporting
National data on MSEs show that the lack of raw materials (shortage in domestic supply,
caused mainly by unlimited exports of raw materials, or stocks that are available but too
expensive), marketing difficulties and lack of capital are the three main constraints (BPS,
2010). During the survey, the respondents were asked to select two items from a list of
problems related to crucial inputs/sources of growth, i.e., raw materials, funds, trade
financing, information, technology, skilled workers, transport facilities, energy, markets
(identifying/getting buyers), distribution networks and others (if any).
The main constraints identified by the respondents differ between MSMEs and Les (figure
5). With regard to LEs, identifying/attracting buyers abroad appears to be the most
problematic for the largest percentage of the respondents. Lack of access to funds/credit,
transport facilities, energy and skilled workers appear to be less serious problems for the
majority, and none of the respondents said that access to trade finance was a serious
problem. This is not surprising in view of the fact that, in general, it is MSMEs and not LEs
that have difficulties in getting credit, including trade finance, from banks or financial
institutions.
17
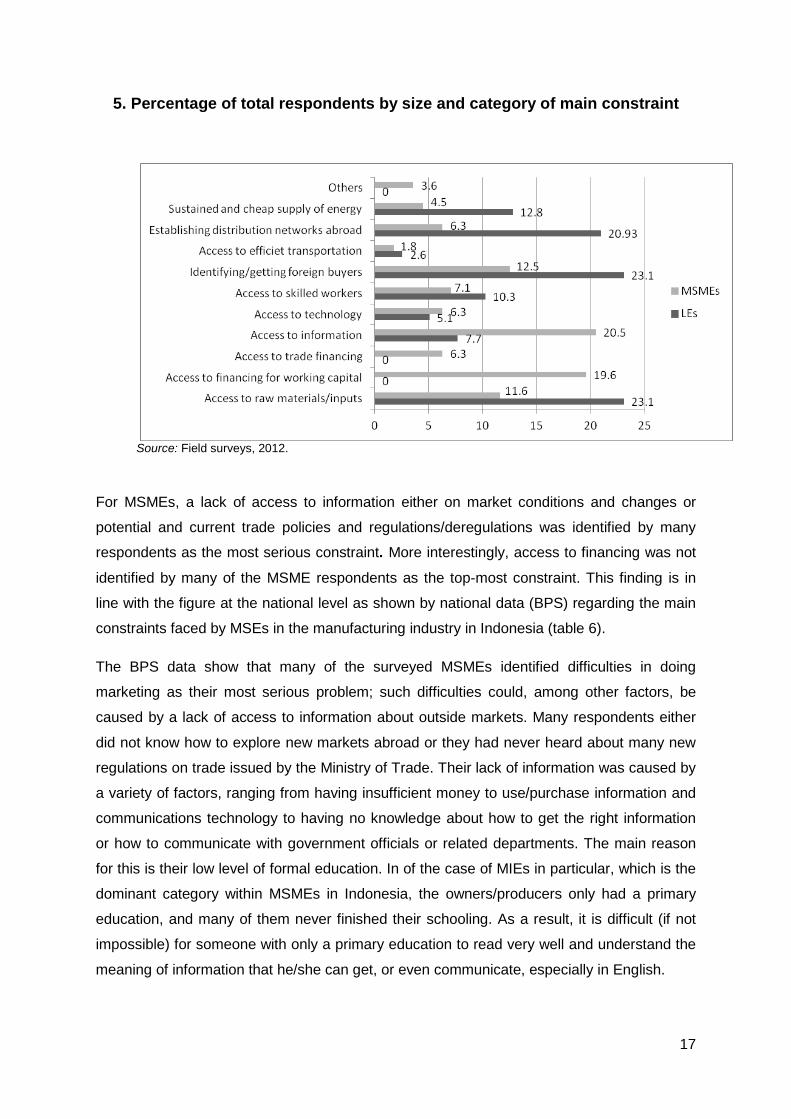
5. Percentage of total respondents by size and category of main constraint
Source: Field surveys, 2012.
For MSMEs, a lack of access to information either on market conditions and changes or
potential and current trade policies and regulations/deregulations was identified by many
respondents as the most serious constraint. More interestingly, access to financing was not
identified by many of the MSME respondents as the top-most constraint. This finding is in
line with the figure at the national level as shown by national data (BPS) regarding the main
constraints faced by MSEs in the manufacturing industry in Indonesia (table 6).
The BPS data show that many of the surveyed MSMEs identified difficulties in doing
marketing as their most serious problem; such difficulties could, among other factors, be
caused by a lack of access to information about outside markets. Many respondents either
did not know how to explore new markets abroad or they had never heard about many new
regulations on trade issued by the Ministry of Trade. Their lack of information was caused by
a variety of factors, ranging from having insufficient money to use/purchase information and
communications technology to having no knowledge about how to get the right information
or how to communicate with government officials or related departments. The main reason
for this is their low level of formal education. In of the case of MIEs in particular, which is the
dominant category within MSMEs in Indonesia, the owners/producers only had a primary
education, and many of them never finished their schooling. As a result, it is difficult (if not
impossible) for someone with only a primary education to read very well and understand the
meaning of information that he/she can get, or even communicate, especially in English.
18
One interesting finding during the field survey was that the majority of the respondents said
that they were not aware of the current government regulations that affected their export
activities or the current programmes initiated or designed by the Government specifically to
support exporters.
5.2.2. Access to trade facilitation
Undoubtedly, in this era of trade liberalization, the importance of trade facilitation is
increasing, especially in the areas of trade finance, trade insurance, information and testing
laboratories, which have become more crucial than ever before.
During the field surveys, the respondents were given a list of facilities/measures for making
international trading easier. The measures, which can be considered as trade facilitation,
included export and/or import financing, trade insurance, information, laboratories for quality
testing, storage before shipping, training on exporting, communications (e.g., telephone and
Internet), electricity supply and support for promotional activities. The respondents were
asked to answer “yes” or “no” to each of those facilities (see annex). If an answer was no,
the respondents were asked to give the main reason, e.g., because the procedure was too
complex or too expensive, because they did not know that a particular facility existed or
other reasons. The findings appear to suggest that LEs have better access to all trade
facilitation support that they need for their export activities compared to their smaller
counterparts.
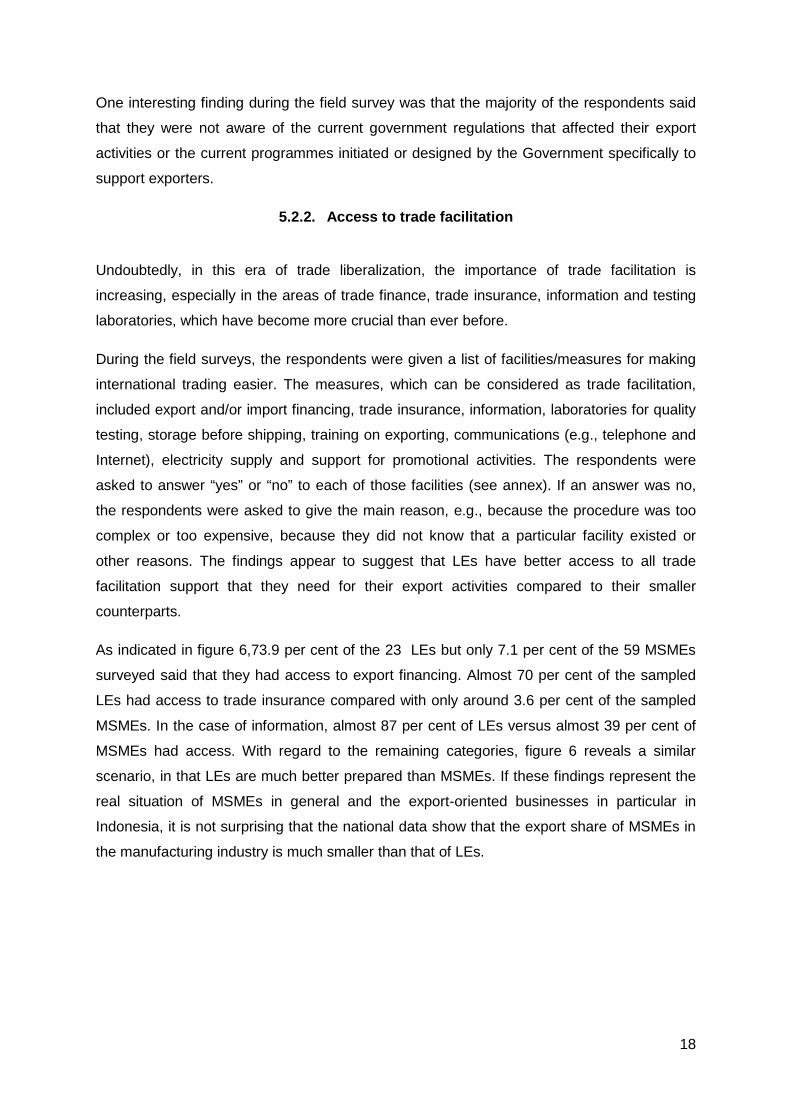
As indicated in figure 6,73.9 per cent of the 23 LEs but only 7.1 per cent of the 59 MSMEs
surveyed said that they had access to export financing. Almost 70 per cent of the sampled
LEs had access to trade insurance compared with only around 3.6 per cent of the sampled
MSMEs. In the case of information, almost 87 per cent of LEs versus almost 39 per cent of
MSMEs had access. With regard to the remaining categories, figure 6 reveals a similar
scenario, in that LEs are much better prepared than MSMEs. If these findings represent the
real situation of MSMEs in general and the export-oriented businesses in particular in
Indonesia, it is not surprising that the national data show that the export share of MSMEs in
the manufacturing industry is much smaller than that of LEs.
19
Figure 6. Percentage of respondents with access to selected trade facilitation measures (Unit: Per cent)
Source: Field surveys, 2012.
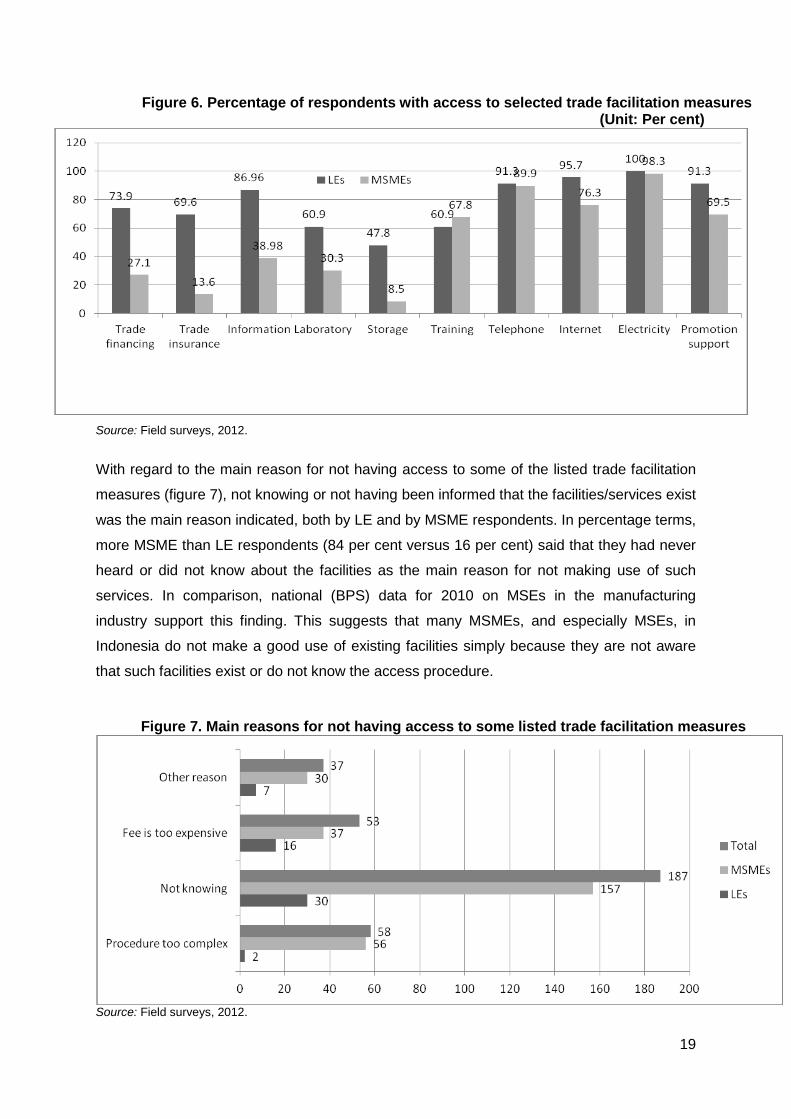
With regard to the main reason for not having access to some of the listed trade facilitation
measures (figure 7), not knowing or not having been informed that the facilities/services exist
was the main reason indicated, both by LE and by MSME respondents. In percentage terms,
more MSME than LE respondents (84 per cent versus 16 per cent) said that they had never
heard or did not know about the facilities as the main reason for not making use of such
services. In comparison, national (BPS) data for 2010 on MSEs in the manufacturing
industry support this finding. This suggests that many MSMEs, and especially MSEs, in
Indonesia do not make a good use of existing facilities simply because they are not aware
that such facilities exist or do not know the access procedure.
Figure 7. Main reasons for not having access to some listed trade facilitation measures
Source: Field surveys, 2012.
20
First, the data show that 2,172,753 out of total 2,732,724 MSEs surveyed by BPS did not
borrow money from banks or non-bank financial institutions, and around 17.5 per cent of
them said that not knowing the procedure was their main reason. Second, the data also
show that only 208,305 of the surveyed MSEs received business support. Of the remaining
1,964,448 MSEs that did not receive such support, 386,605 respondents said that although
they were aware that such services existed they did not know the procedure for obtaining it.
Having no knowledge at all about such services was the main reason for the other 1,489,106
respondents. Thus, for around 95.5 per cent of MSEs, the lack of information/knowledge was
the main reason for not receiving business support.
There are two possible reasons for this result – a lack of information from the government
side about the existence of particularly facilities and/or a lack of activeness on the part of the
producers in looking for information about facilities provided by the Government. In many
cases, owners of MSEs do not even know what type of support or facilities they really need
and which are good for their business performance. On the other hand, supporting facilities
for MSMEs introduced/provided by ministries often lack wide promotion/socialization. As a
result, only a small number of MSMEs – not just those located in Jakarta and other big cities
but also those whose owners have good connections or have built strong networks with
ministries – know about such facilities and have better opportunities to access them.
So far, the above findings and discussion suggest that not having access to information or
not being informed about existing trade facilitation appears to be a very serious problem for
many MSMEs. However, national data do not indicate that access to information is more
important than access to capital for those enterprises. Table 6 lists constraints facing
manufacturing MSEs in Indonesia. It shows no indication of a lack of information being a
serious problem, although marketing difficulties may be caused by the lack of information,
among other factors.
21
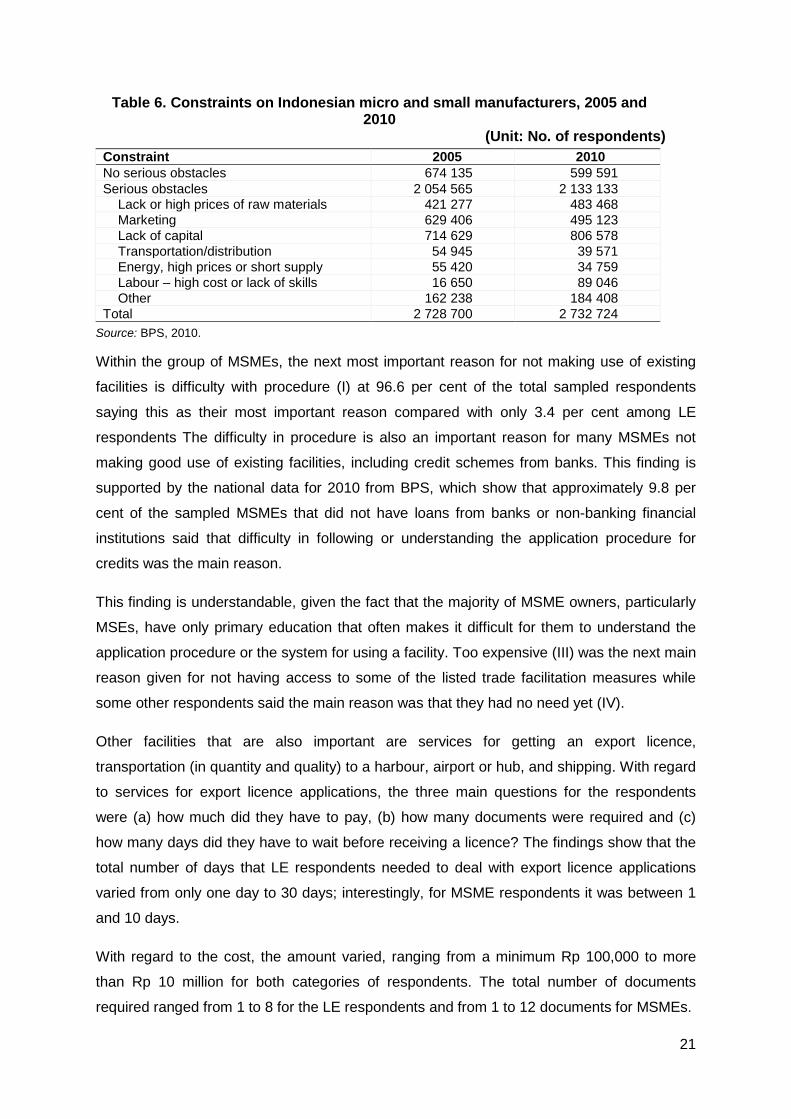
Table 6. Constraints on Indonesian micro and small manufacturers, 2005 and 2010
(Unit: No. of respondents) Constraint 2005 2010 No serious obstacles 674 135 599 591 Serious obstacles 2 054 565 2 133 133
Lack or high prices of raw materials 421 277 483 468 Marketing 629 406 495 123 Lack of capital 714 629 806 578 Transportation/distribution 54 945 39 571 Energy, high prices or short supply 55 420 34 759 Labour – high cost or lack of skills 16 650 89 046 Other 162 238 184 408
Total 2 728 700 2 732 724 Source: BPS, 2010.
Within the group of MSMEs, the next most important reason for not making use of existing
facilities is difficulty with procedure (I) at 96.6 per cent of the total sampled respondents
saying this as their most important reason compared with only 3.4 per cent among LE
respondents The difficulty in procedure is also an important reason for many MSMEs not
making good use of existing facilities, including credit schemes from banks. This finding is
supported by the national data for 2010 from BPS, which show that approximately 9.8 per
cent of the sampled MSMEs that did not have loans from banks or non-banking financial
institutions said that difficulty in following or understanding the application procedure for
credits was the main reason.
This finding is understandable, given the fact that the majority of MSME owners, particularly
MSEs, have only primary education that often makes it difficult for them to understand the
application procedure or the system for using a facility. Too expensive (III) was the next main
reason given for not having access to some of the listed trade facilitation measures while
some other respondents said the main reason was that they had no need yet (IV).
Other facilities that are also important are services for getting an export licence,
transportation (in quantity and quality) to a harbour, airport or hub, and shipping. With regard
to services for export licence applications, the three main questions for the respondents
were (a) how much did they have to pay, (b) how many documents were required and (c)
how many days did they have to wait before receiving a licence? The findings show that the
total number of days that LE respondents needed to deal with export licence applications
varied from only one day to 30 days; interestingly, for MSME respondents it was between 1
and 10 days.
With regard to the cost, the amount varied, ranging from a minimum Rp 100,000 to more
than Rp 10 million for both categories of respondents. The total number of documents
required ranged from 1 to 8 for the LE respondents and from 1 to 12 documents for MSMEs.
22
For a broader picture of this issue, the World Bank report, Doing Business, 2012 gives the
total days for exporting, i.e., starting from the final contractual agreement between the
exporter and the buyer (importer) in Indonesia, was 17 days, compared with APEC
(average) - 14 days, OECD - 10 days and the European Union - 11 days. The number of
documents required for exports from Indonesia was 4 days compared with APEC - 5, OECD
- 4 and the European Union - 0.5 days. The cost of exporting per container in Indonesia was
US$ 644 while for APEC it was US$ 836, OECD – US$ 1,032 and the European Union –
US$ 1,024.
One important aspect of trade facilitation improvement in Indonesia is related to
transportation and logistics. The key question for the respondents in that regard was whether
they found that it was easy and cheap to transport (including shipping) their products.
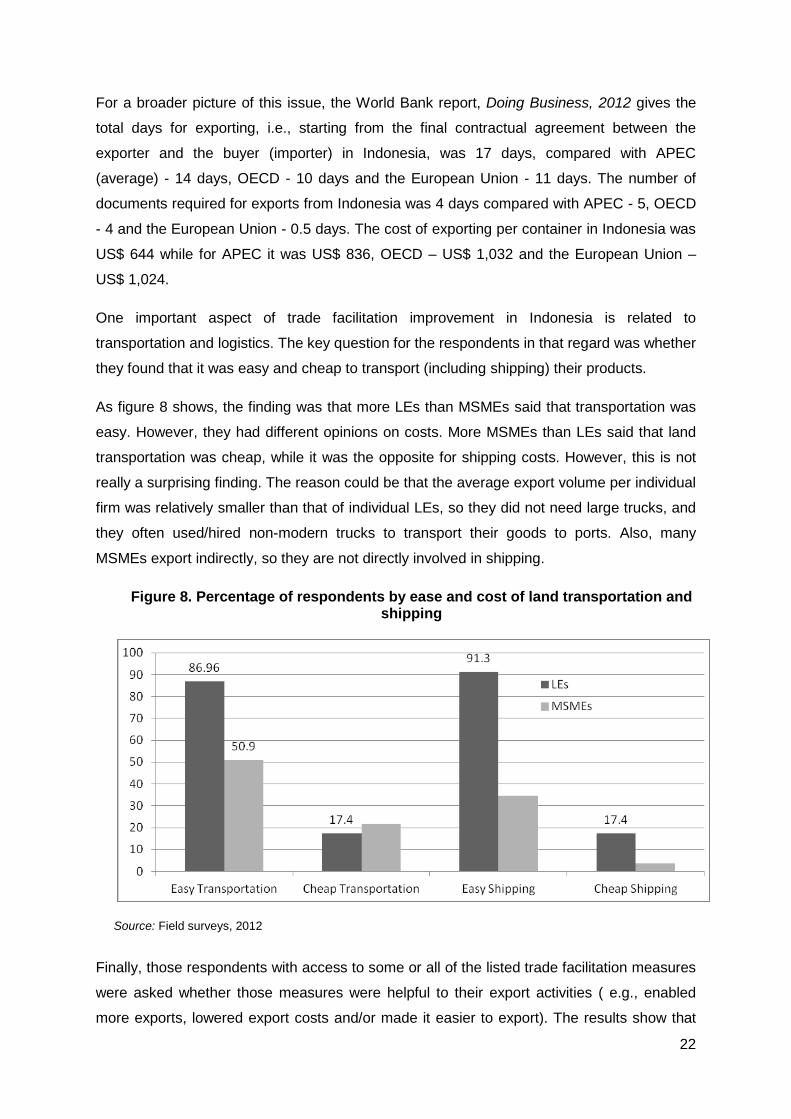
As figure 8 shows, the finding was that more LEs than MSMEs said that transportation was
easy. However, they had different opinions on costs. More MSMEs than LEs said that land
transportation was cheap, while it was the opposite for shipping costs. However, this is not
really a surprising finding. The reason could be that the average export volume per individual
firm was relatively smaller than that of individual LEs, so they did not need large trucks, and
they often used/hired non-modern trucks to transport their goods to ports. Also, many
MSMEs export indirectly, so they are not directly involved in shipping.
Figure 8. Percentage of respondents by ease and cost of land transportation and shipping
Source: Field surveys, 2012
Finally, those respondents with access to some or all of the listed trade facilitation measures
were asked whether those measures were helpful to their export activities ( e.g., enabled
more exports, lowered export costs and/or made it easier to export). The results show that
23
the almost 96 per cent of all LE respondents had access; in the case of MSMEs, 93 per cent
had access.
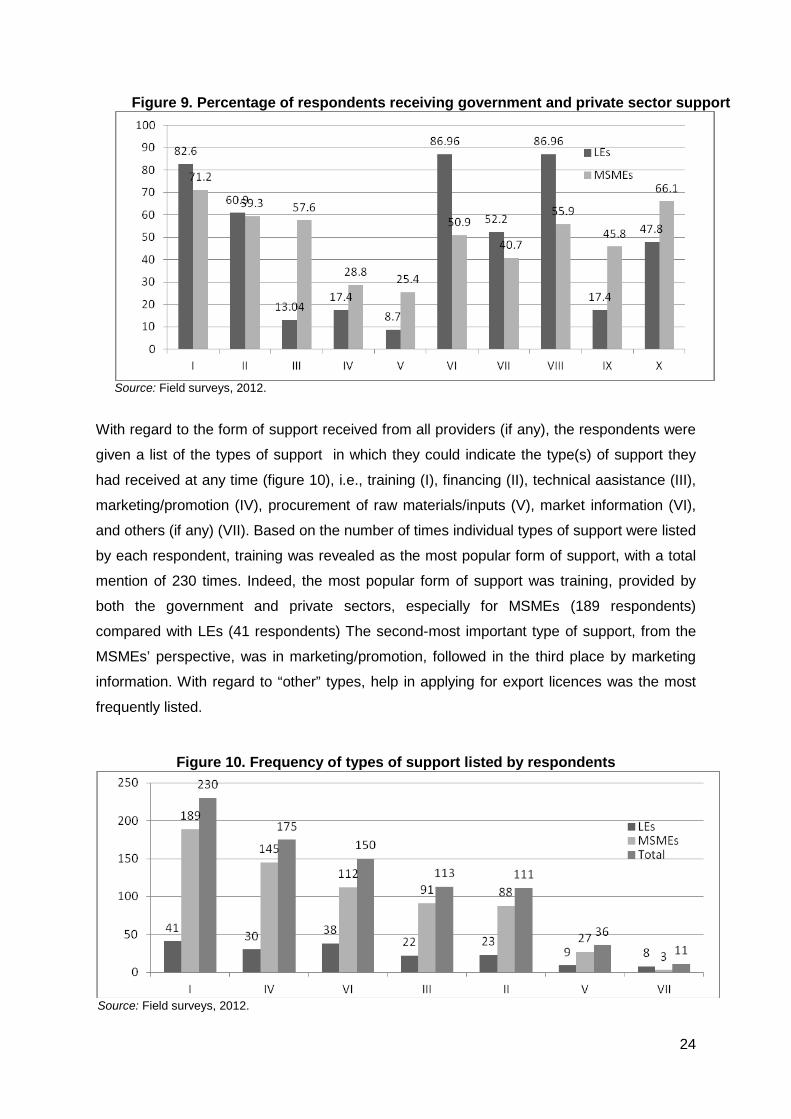
5.2.3. Government and private sector support
Trade facilitation measures may also include special measures provided by government
institutions and private organizations that support exporting by MSMEs (figure 9), i.e.,
departments/ministries of trade (I), industry (II), and cooperative and SMEs (III); R&D
institutes (IV); universities (V); chamber of commerce and industry (Kadin) (VI); business
associations (VII); banks and/or non-bank financial institutions (VIII); state-owned companies
(BUMN) (IX); and local government (Pemda) (X). The respondents were asked the following
question: Had they (ever) received support from these bodies and if so, in what form(s)?
At least three very interesting findings, as shown in figure 9, came out of the answers to that
question. First, in percentage terms, more respondents from MSMEs than from LEs had
received support or assistance from R&D institutes and universities. However, it is generally
expected that R&D institutes and universities will be more willing to collaborate with LEs
rather than with MSMEs (especially MSEs), for at least two main reasons: (a) it provides a
more profitable market in the long term (i.e., more demand opportunities from other LEs to
collaborate); and (b) LEs have sufficient capital to invest in such collaboration.
Second, Indonesian chambers of commerce and industry, and business associations,
especially at the regional/local levels, are supposed to play a key role in supporting MSMEs;
however, the survey indicated the opposite – there were more respondents from LEs who
enjoyed services/supports from these two private organizations.
Third, there were more respondents from LEs than from MSMEs who had received financial
support from banks or non-bank financial institutions. This may suggest that despite
government efforts to increase the role of financial institutions in supporting enterprises,
including the introduction some years ago of a special non-collateral-based credit scheme
known in Indonesia as kredit usaha rakyat (KUR), many MSMEs in the country still have no
access to financial institutions, especially commercial banks.
24
Figure 9. Percentage of respondents receiving government and private sector support
Source: Field surveys, 2012.
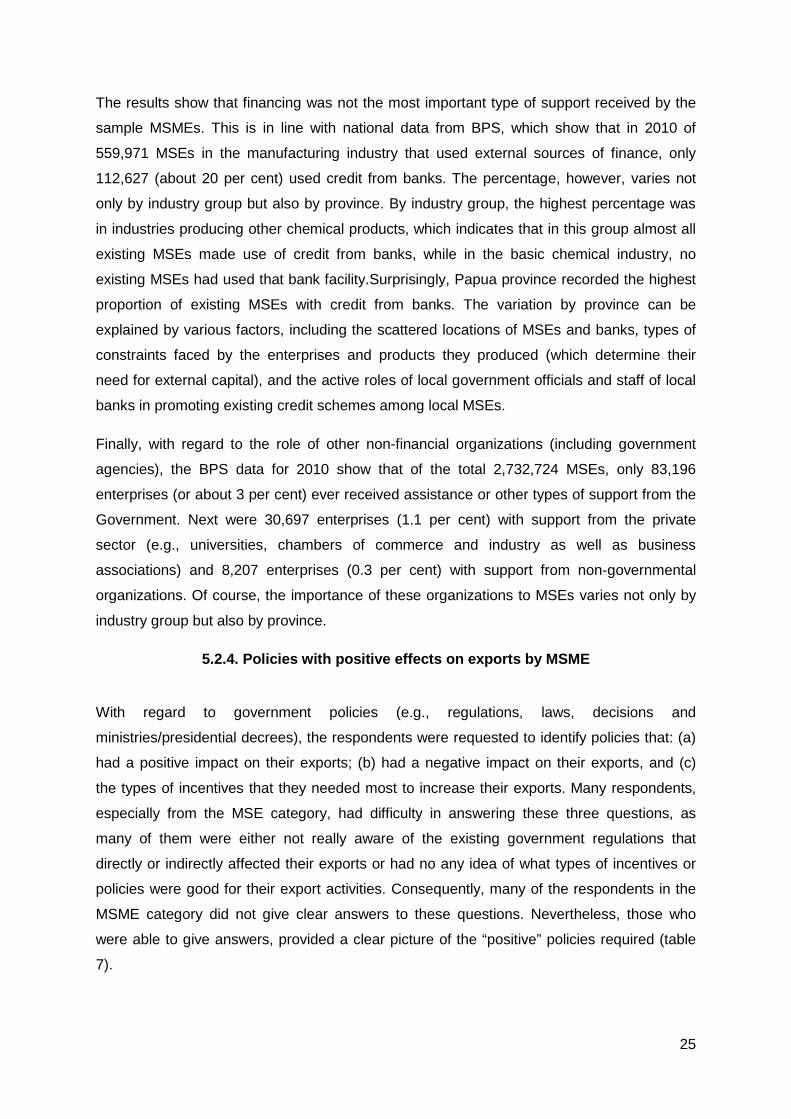
With regard to the form of support received from all providers (if any), the respondents were
given a list of the types of support in which they could indicate the type(s) of support they
had received at any time (figure 10), i.e., training (I), financing (II), technical aasistance (III),
marketing/promotion (IV), procurement of raw materials/inputs (V), market information (VI),
and others (if any) (VII). Based on the number of times individual types of support were listed
by each respondent, training was revealed as the most popular form of support, with a total
mention of 230 times. Indeed, the most popular form of support was training, provided by
both the government and private sectors, especially for MSMEs (189 respondents)
compared with LEs (41 respondents) The second-most important type of support, from the
MSMEs’ perspective, was in marketing/promotion, followed in the third place by marketing
information. With regard to “other” types, help in applying for export licences was the most
frequently listed.
Figure 10. Frequency of types of support listed by respondents
Source: Field surveys, 2012.
25
The results show that financing was not the most important type of support received by the
sample MSMEs. This is in line with national data from BPS, which show that in 2010 of
559,971 MSEs in the manufacturing industry that used external sources of finance, only
112,627 (about 20 per cent) used credit from banks. The percentage, however, varies not
only by industry group but also by province. By industry group, the highest percentage was
in industries producing other chemical products, which indicates that in this group almost all
existing MSEs made use of credit from banks, while in the basic chemical industry, no
existing MSEs had used that bank facility.Surprisingly, Papua province recorded the highest
proportion of existing MSEs with credit from banks. The variation by province can be
explained by various factors, including the scattered locations of MSEs and banks, types of
constraints faced by the enterprises and products they produced (which determine their
need for external capital), and the active roles of local government officials and staff of local
banks in promoting existing credit schemes among local MSEs.
Finally, with regard to the role of other non-financial organizations (including government
agencies), the BPS data for 2010 show that of the total 2,732,724 MSEs, only 83,196
enterprises (or about 3 per cent) ever received assistance or other types of support from the
Government. Next were 30,697 enterprises (1.1 per cent) with support from the private
sector (e.g., universities, chambers of commerce and industry as well as business
associations) and 8,207 enterprises (0.3 per cent) with support from non-governmental
organizations. Of course, the importance of these organizations to MSEs varies not only by
industry group but also by province.
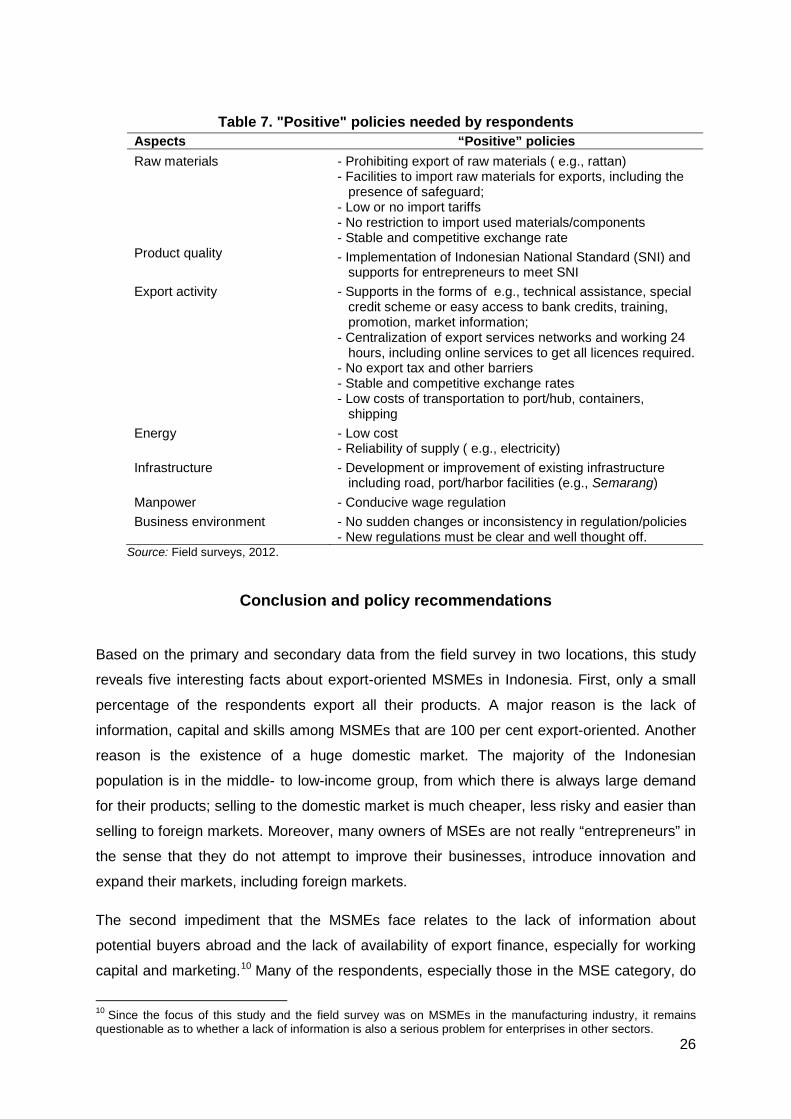
5.2.4. Policies with positive effects on exports by MSME
With regard to government policies (e.g., regulations, laws, decisions and
ministries/presidential decrees), the respondents were requested to identify policies that: (a)
had a positive impact on their exports; (b) had a negative impact on their exports, and (c)
the types of incentives that they needed most to increase their exports. Many respondents,
especially from the MSE category, had difficulty in answering these three questions, as
many of them were either not really aware of the existing government regulations that
directly or indirectly affected their exports or had no any idea of what types of incentives or
policies were good for their export activities. Consequently, many of the respondents in the
MSME category did not give clear answers to these questions. Nevertheless, those who
were able to give answers, provided a clear picture of the “positive” policies required (table
7).
26
Table 7. "Positive" policies needed by respondents
Aspects “Positive” policies Raw materials - Prohibiting export of raw materials ( e.g., rattan)
- Facilities to import raw materials for exports, including the presence of safeguard;
- Low or no import tariffs - No restriction to import used materials/components - Stable and competitive exchange rate
Product quality - Implementation of Indonesian National Standard (SNI) and supports for entrepreneurs to meet SNI
Export activity - Supports in the forms of e.g., technical assistance, special credit scheme or easy access to bank credits, training, promotion, market information;
- Centralization of export services networks and working 24 hours, including online services to get all licences required.
- No export tax and other barriers - Stable and competitive exchange rates - Low costs of transportation to port/hub, containers,
shipping Energy - Low cost
- Reliability of supply ( e.g., electricity) Infrastructure - Development or improvement of existing infrastructure
including road, port/harbor facilities (e.g., Semarang) Manpower - Conducive wage regulation Business environment - No sudden changes or inconsistency in regulation/policies
- New regulations must be clear and well thought off. Source: Field surveys, 2012.
Conclusion and policy recommendations
Based on the primary and secondary data from the field survey in two locations, this study
reveals five interesting facts about export-oriented MSMEs in Indonesia. First, only a small
percentage of the respondents export all their products. A major reason is the lack of
information, capital and skills among MSMEs that are 100 per cent export-oriented. Another
reason is the existence of a huge domestic market. The majority of the Indonesian
population is in the middle- to low-income group, from which there is always large demand
for their products; selling to the domestic market is much cheaper, less risky and easier than
selling to foreign markets. Moreover, many owners of MSEs are not really “entrepreneurs” in
the sense that they do not attempt to improve their businesses, introduce innovation and
expand their markets, including foreign markets.
The second impediment that the MSMEs face relates to the lack of information about
potential buyers abroad and the lack of availability of export finance, especially for working
capital and marketing.10 Many of the respondents, especially those in the MSE category, do
10 Since the focus of this study and the field survey was on MSMEs in the manufacturing industry, it remains questionable as to whether a lack of information is also a serious problem for enterprises in other sectors.
27
not have enough capital to explore export markets. The lack of information can be caused by
the poor skills of the owners or the lack of available information.
The third obstacle concerns their utilization of trade facilitation measures. As evident from
the survey, the LEs are better equipped than MSMEs to use such facilities. MSMEs are not
well-informed about the various existing trade facilitation measures and therefore are unable
to reap the benefits. This fact is supported by national data, which suggests that many
MSMEs, and especially MSEs, in Indonesia do not make good use of existing facilities
simply because they are not aware that such facilities exist or do not know the procedure for
accessing them.
The fourth interesting fact revealed by this study concerns the role of the Government, such
as the Ministry of Trade, the Ministry of Industry and the Ministry for Cooperative and SMEs,
as well as private organizations such as the Indonesian Chamber of Commerce and
Industry, business associations and commercial banks, in supporting MSMEs. It has been
found that not all of the MSMEs respondents had received government support (not even
from the Ministry for Cooperatives and SMEs) or private organizations. It is evident that
many government supported/initiated facilities, including trade facilitation, have yet to reach
many MSMEs in Indonesia, especially those located in rural or rather isolated regions. On
the contrary, more respondents from LEs than from MSMEs enjoyed support from these
private organizations. In addition, more respondents from LEs than from MSMEs had
received financial support from banks or non-bank financial institutions.
It is difficult to measure any correlation between access by MSMEs to trade facilitation
measures and the impact on their exports. However, the finding regarding the question of
whether or not the respondents were satisfied with the trade facilitation services they
received may suggest that trade facilitation services have had some positive effects on
exports of most of the respondents. The finding also suggests that although having access
to improved trade facilitation is important to MSMEs, ultimately their capability to increase
exports will also depend on whether they can meet other export requirements such as
having sufficient production capacity and the ability to innovate.
Based on the above findings, this study suggests that the following three policy measures
will be necessary for MSMEs to benefit from existing trade facilitation initiatives.
28
6.1. Increasing awareness among MSMEs
As the lack of awareness by MSMEs about trade facilitation measures is a major issue, the
most important policy measure should involve “reaching out to MSMEs”. As trade facilitation
generally concerns dealing with international trade, the Ministry of Trade should be made
responsible for the dissemination of information about existing trade facilitation measures
and how the measures will help in promoting exports. The Ministry for Cooperatives and
SMEs, as the leading department responsible for providing support to MSMEs or formulating
MSME policies, should also increase awareness about existing trade facilitation as well as
about other policies, regulations and international trade agreements.
Other facilities/programmes that would be important to MSMEs involved in international
trade transactions could be a specially-designed single portal that enables full links to
websites of all government departments and other stakeholders that are providing/initiating
trade facilitation measures and provides access to regular publications (e.g., newsletters and
bulletins). This single portal must be user-friendly and fully accessible, regularly updated,
and with interaction limited to requests for information on certain trade facilitation measures.
In doing so, the ministry should maintain close coordination with local government offices
and the private sector, especially chambers of commerce and related business associations.
With regard to trade facilitation initiatives in the context of ASEAN and APEC, the ministry
should maintain close coordination with the ASEAN Secretariat in Jakarta and the APEC
Secretariat in Singapore.
6.2. Training on accessing trade facilitation information
Each government department related to those sectors in which many MSMEs are carrying
out international trade transactions, and especially the Ministry of Industry, should provide
training for MSMEs, with or without cooperation from the private sector, on how to access
information about trade facilitation. The training should be coordinated by the Ministry for
Cooperatives and SME.
6.3. Promotion of ICT
Since MSMEs, especially MIEs, in Indonesia still have difficulties in accessing ICT or
adjusting their “traditional business approach” to “ICT-based modern business”, the
Government of Indonesia (in this case, the Ministry for Cooperatives and SMEs) should take
affirmative action, or introduce “positive discrimination” policies that tackle factors related to
the limitations resulting from their small size and other “inadequate” characteristics such as
29
low-educated owners and employees. They should also promote awareness of the
importance of using ICT to make it easy for them to integrate into ICT-based trade
facilitation. Affirmative action for MIEs should include (a) free, or at least low–cost, ICT
workshops and training, (b) technical assistance/consultation services during the adoption
process, (c) a special credit scheme with a low interest rate and simple administration
requirements for financing development of the ICT system in MIEs, and (d) low fees for e-
mail and Internet connection for a limited period for beginners.
30
References
ADB (2002). “Report and recommendations of the President to the Board of Directors on a proposed loan and technical assistance grant to the Republic of Indonesia for the Small and Medium Enterprise Export Development Project”, ADB RRP: INO 34331. Jakarta.
ADB and ESCAP (2009). Designing and Implementing Trade Facilitation in Asia and the Pacific. Asian Development Bank, Manila.
Alavi, H. (2009). “Promoting the development of SMEs in times of crisis: Trade facilitation and trade finance”, paper presented at the Regional Policy Forum on Trade Facilitation and SMEs in Times of Crisis, 20-22 May, Beijing.
Anantha K. H., S. P Wani and T. K. Sreedevi (2010). “Agriculture and allied micro-enterprise for livelihood opportunities”, International Crops Research Institute for the Semi-Arid Tropics, Andhra Pradesh, India. Available at http://oar.icrisat.org/3922/1/20._Agriculture_and_Allied_Micro-enterprise.pdf.
BPS (2010). Profil Industri Mikro dan Kecil 2010 (profile of micro- and small-sized industries). Badan Pusat Statistik (National Statistics Agency), Jakarta.
Damuri, Y. R. (2006). “An evaluation of the need for selected trade facilitation measures in Indonesia: Implications for the WTO negotiations on trade facilitation”, ARNeT Working Paper Series, No. 10, Asia-Pacific Research and Training Network on Trade. ESCAP, Bangkok.
Gennrich, N. (2004). “Factors influencing the adoption of microenterprises and their impact in rural Guatemala”, Experto Internacional En Desarrollo Rural, vol. 9, No. 17, Available at www.esan.edu.pe/paginas/pdf/Gennrich.pdf.
Harvie, C. (2003). “The contribution of micro-enterprises to economic recovery and poverty alleviation in East Asia", University of Wollongong Economic Working Paper Series WP 03-07. Australia.
Moïsé, E., T. Orliac and P. Minor (2011). “Trade facilitation indicators: The impact on trade costs”, Organisation for Economic Co-operation and Development Trade Policy Working Paper No. 118. Paris.
Otsuki, T. (2011). “Quantifying the benefits of trade facilitation in ASEAN”, OSIPP Discussion Paper DP-2011-E-006. Osaka University, Japan.
Rahardhan, P., A. Kusumaningrum and F. A. Rahman (2008). “Pengaruh ASEAN trade facilitation terhadap volume perdagangan produk unggulan Jawa Timur” (“Effect of ASEAN trade facilitation on the trade volume of favoured commodities from East Java”), study report, Bank IndonesiaSurabaya, Indonesia.
Shepherd, B. and J. S. Wilson (2009). “Trade facilitation in ASEAN member countries: Measuring progress and assessing priorities”, Journal of Asian Economics, vol. 20; pp. 367-383.
Shepherd, B. (2010). “Trade costs and facilitation in APEC and ASEAN: Delivering the goods”, MPRA Paper No. 21531. Munich Personal RePEc Archive. Available at http://mpra.ub.uni-muenchen.de/21531/.
Suryahadi, A., A. Yumna, U. R. Raya and D. Marbun (2010). “Review of the Government's poverty reduction strategies, policies, and programs in Indonesia”, Research Report, SMERU Research Institute. Jakarta.
31
Tambunan, Tulus T. H. (2009a). SMEs in Asian Developing Countries Palgrave Macmillan, London.
——— (2009b). Development of SMEs in ASEAN Countries. Readworthy Publications Ltd., New Delhi.
——— (2009c). “Facilitating small and medium enterprises in international trade (export): The case of Indonesia”, paper presented at the Asia-Pacific Trade Economists’ Conference on Trade-Led Growth in Times of Crisis, 2-4 November 2009, ESCAP, Bangkok.
——— (2008). “Development of rural manufacturing SME clusters in a developing country: The Indonesian case”, Journal of Rural Development, vol. 31, No. 2.
——— (2006). Development of Small and Medium Enterprises in Indonesia from the Asia-Pacific Perspective. LPFE-Usakti, Jakarta.
32
Annex
Survey questionnaire for export-oriented MSMEs in Solo and D.I. Yogjakarta
I. Profile 1. Name of company (if any): 2. Name of respondent: (Owner/manager) 3. Address of company: City: Province: 4. No. Tel/HP: 5. Year of establishment: 6. Number of fixed workers: persons
II. Marketing (place “X” in only one box per question)
1. Market area:
100 per cent domestic market 100 per cent foreign market Partly domestic market
2. Way of exporting:
Direct abroad Indirect via trader, trading company, others
Both direct and indirect ways
III. Main constraints (place “X” in only one box) 1. Having serious problems:
Yes No
2. Indicate only two serious constraints on exports (place “X” in only two boxes)
Easy access to raw materials/other inputs Easy access to fund/credit to financing working capital Easy access to trade financing Easy access to information on market, trade policy/regulation and others Easy access to technology Easy access to workers with high skills Identifying/getting potential buyers in abroad Easy access to efficient transportation facilities Establishing distribution networks abroad Sustained and cheap supply of energy
Others, if any (please specify):
33
IV. Trade facilitation services 1. Having access to: (a) Export financing from banks/other sources
Yes No If no, the main reasons (select only one box):
Procedure is too complex Do not know/never heard Expensive Other reasons
(b) Trade insurance Yes No If no, the main reasons (select only one box): Procedure is too complex Do not know/never heard Expensive Other reasons
(c) Information ( e.g., via website) on market, regulation etc. Yes No If no, the main reasons (select only one box): Procedure is too complex Do not know/never heard Expensive Other reasons
(d) Laboratories/quality test facilities Yes No If no, the main reasons (select only one box) Procedure is too complex Do not know/never heard Expensive Other reasons
(e) Storage facilities (e.g., in harbour) Yes No If no, the main reasons (select only one box): Procedure is too complex Do not know/never heard Expensive Other reasons
(f) Efficient transport facilities to harbour/airport Easy: Yes No
Cheap: Yes No
(g) Shipping facilities to abroad
34
Easy Yes No Total days to wait: days
Cheap Yes US$/ton No US$/ton
(h) Services for getting export licence Total days: Cost: Rp Total documents: items
(i) Services for getting import license for raw materials/inputs Total days: Cost: Rp Total documents: items
(j). Training facilities Yes No If no, the main reasons (select only one box): Procedure is too complex Do not know/never heard Expensive Other reasons
(k) Telephone facilities Yes No If no, the main reasons (select only one box): Procedure is too complex Do not know/never heard Expensive Other reasons
(l) Internet facilities Yes No If no, the main reasons (select only one box): Procedure is too complex Do not know/never heard Expensive Other reasons
(m) Electricity facilities Yes No If no, the main reasons (select only one box): Procedure is too complex Do not know/never heard Expensive Other reasons
(n) Promotion facilities Yes No If no, the main reasons (select only one box):
35
Procedure is too complex Do not know/never heard Expensive Other reasons
2. Are the TRADE FACILITATION services to which you have access helpful to your export activities?
Yes No
V. Impact of Free Trade Agreements
1. Do you feel competition with imported products in the past one decade has become heavier?
Yes No
2. With the increasingly imported products, your production/revenue in domestic market has Declined Not changed Increased
3. Do you feel competition with your products abroad in the past one decade has become heavier?
Yes No
4. In the past 10 years have your exports: Declined Increased Remained unchanged
VI. Role of institutions Are the following institutions very active/helpful in supporting your export activities?
TRADE DEPARTMENT Yes Not at all If yes, in what forms? (Can be more than one):
Training Financing Technical assistance Marketing/promotion Procurement of raw materials/inputs Market information Other
DEPARTMENT OF INDUSTRY Yes Not at all If yes, in what forms? (Can be more than one):
Training Financing Technical assistance Marketing/promotion
36
Procurement of raw materials/inputs Market information Other
DEPARTMENT OF COOPERATIVES AND SMES Yes Not at all If yes, in what forms? (Can be more than one):
Training Financing Technical assistance Marketing/promotion Procurement of raw materials/inputs Market information Other
R&D INSTITUTES Yes Not at all If yes, in what forms? (Can be more than one):
Training Financing Technical assistance Marketing/promotion Procurement of raw materials/inputs Market information Other
UNIVERSITIES Yes Not at all If yes, in what forms? (Can be more than one):
Training Financing Technical assistance Marketing/promotion Procurement of raw materials/inputs Market information Other
CHAMBER OF COMMERCE AND INDUSTRY (KADIN) Yes Not at all If yes, in what forms? (Can be more than one):
Training Financing Technical assistance Marketing/promotion Procurement of raw materials/inputs Market information Other
RELATED BUSINESS ASSOCIATIONS
Yes
37
Not at all If yes, in what forms? (Can be more than one):
Training Financing Technical assistance Marketing/promotion Procurement of raw materials/inputs Market information Other
BANK/NON-BANK FINANCIAL INSTITUTIONS Yes Not at all If yes, in what forms? (Can be more than one):
Training Financing Technical assistance Marketing/promotion Procurement of raw materials/inputs Market information Other
STATE-OWNED COMPANIES Yes Not at all If yes, in what forms? (Can be more than one):
Training Financing Technical assistance Marketing/promotion Procurement of raw materials/inputs Market information Other
LOCAL GOVERNMENT (PEMDA) Yes Not at all If yes, in what forms? (Can be more than one):
Training Financing Technical assistance Marketing/promotion Procurement of raw materials/inputs Market information
Other
VII. Policy impact 1. List several government policies ( e.g., regulations, laws, decisions and
ministries/presidential decrees) that have a positive impact on your export business:
2. List several policies (e.g., regulations, laws, decisions and ministries/presidential decrees) that have a negative impact on your export business:

38
3. What types of incentives do you need most to increase your exports?
ARTNeT Working Paper Series is available at www.artnetontrade.org
ARTNeT Secretariat
United Nations Economic and Social Commission
for Asia and the Pacific Trade and Investment Division
United Nations Building Rajadamnern Nok Avenue Bangkok 10200, Thailand
Tel: +66 (0)2-288-2251 Fax: +66(0)2-288-1027
Email: [email protected] Website: www.artnetontrade.org
Related Documents