1 Eastern Nile Technical Regional Office O O N N E E - - S S Y Y S S T T E E M M I I N N V V E E N N T T O O R R Y Y A A N N N N E E X X E E : T T E E K K E E Z Z E E - - S S E E T T I I T T E E - - A A T T B B A A R R A A S S U U B B - - B B A A S S I I N N June 2009 E E A A S S T T E E R R N N N N I I L L E E T T E E C C H H N N I I C C A A L L R R E E G G I I O O N N A A L L O O F F F F I I C C E E A A D D D D I I S S A A B B A A B B A A E E T T H H I I O O P P I I A A

Welcome message from author
This document is posted to help you gain knowledge. Please leave a comment to let me know what you think about it! Share it to your friends and learn new things together.
Transcript

1
Eastern Nile Technical Regional Office
OOONNNEEE---SSSYYYSSSTTTEEEMMM IIINNNVVVEEENNNTTTOOORRRYYY
AAANNNNNNEEEXXXEEE: TTTEEEKKKEEEZZZEEE---SSSEEETTTIIITTTEEE---AAATTTBBBAAARRRAAA SSSUUUBBB---BBBAAASSSIIINNN
June 2009
EEEAAASSSTTTEEERRRNNN NNN IIILLLEEE TTTEEECCCHHHNNNIIICCCAAALLL RRREEEGGGIIIOOONNNAAALLL OOOFFFFFFIIICCCEEE
AAADDDDDDIIISSS AAABBBAAABBBAAA
EEETTTHHHIIIOOOPPPIIIAAA

2
CCCOOONNNTTTEEENNNTTTSSS
INTRODUCTION ....................................................................................................... 6 QUICK OVERVIEW OF THE EASTERN NILE BASIN .............................................................. 7 1. GENERAL CHARACTERISTICS ............................................................................. 9 1.1. LOCATION OF THE SUB-BASIN ............................................................................................................... 9
1.2. ADMINISTRATIVE UNITS ......................................................................................................................... 9
1.3. TOPOGRAPHY ......................................................................................................................................... 9
1.4. CLIMATE ................................................................................................................................................ 12
1.4.1. General.................................................................................................... 12 1.4.2. Agro-climatic Zones ..................................................................................... 12 1.4.3. Rainfall .................................................................................................... 12 1.4.4. Temperature ............................................................................................. 15 1.4.5. Evaporation............................................................................................... 16 1.5. HUMIDITY .............................................................................................................................................. 18
2. SOCIO-ECONOMIC CHARACTERISTICS ..................................................................19 2.1. DEMOGRAPHIC CHARACTERISTICS ...................................................................................................... 19
2.1.1. Population ................................................................................................ 19 2.1.2. Ethnic groups............................................................................................. 24 2.1.3. Population growth rates ............................................................................... 19 2.1.4. Crude birth and death rates ........................................................................... 23 2.1.5. Population Density ...................................................................................... 20 2.1.6. Rural-urban divide ...................................................................................... 22 2.1.7. Sex ratios ................................................................................................. 22 2.1.8. Population age group ................................................................................... 23 2.1.9. Infant Mortality .......................................................................................... 24 2.1.10. Life Expectancy at Birth ............................................................................... 24
2.2. ACCESS TO SOCIAL INFRASTRUCTURE ................................................................................................ 25
2.2.1. Literacy and education ................................................................................. 25 2.2.2. Water and Sanitation ................................................................................... 26 2.2.3. Health Facilities ......................................................................................... 27
2.3. TRANSPORT AND COMMUNICATIONS .................................................................................................. 29
2.3.1. Roads ...................................................................................................... 29 2.3.2. Railways ................................................................................................... 31 2.4. ECONOMIC ACTIVITIES ......................................................................................................................... 31
2.4.1. Activity rate .............................................................................................. 31 2.4.2. Livelihood patterns ..................................................................................... 31 2.4.3. Unemployment rates ................................................................................... 32 2.5. AGRICULTURE AND PEOPLE................................................................................................................. 33
2.5.1. Main Agricultural land Use Systems .................................................................. 33
2.6. FORESTRY AND AGRO-FORESTRY........................................................................................................ 37
2.6.1. Forestry Contribution to the Economy .............................................................. 37 2.6.2. Agro-forestry ............................................................................................. 38 2.6.3. Mining ..................................................................................................... 38 2.6.4. Industrial and agricultural input pollution .......................................................... 39 2.6.5. Fishery .................................................................................................... 39 2.7. POVERTY PROFILE ................................................................................................................................ 39
2.7.1. Poverty measurements ................................................................................. 39 2.7.2. Welfare and Poverty .................................................................................... 40 2.7.3. Vulnerability indicators ................................................................................ 41 2.7.4. Food Aid as a Proxy Indicator of Poverty ........................................................... 41 2.7.5. Nutritional Status of the Basin Population .......................................................... 42 3. NATURAL RESOURCES AND ENVIRONMENTAL ISSUES ..............................................43
3
3.1. GEOLOGY .............................................................................................................................................. 43
3.2. SOILS ..................................................................................................................................................... 43
3.3. LAND USE LAND COVER ....................................................................................................................... 46
3.4. VEGETATION ......................................................................................................................................... 48
3.4.1. Vegetative types ........................................................................................ 48 3.4.2. Fuel wood ................................................................................................. 49 3.4.3. Industrial wood .......................................................................................... 49 3.4.4. Non-timber forest products ........................................................................... 49 3.5. WET LANDS ........................................................................................................................................... 49
3.6. WILD LIFE ............................................................................................................................................. 50
3.7. ECO-TOURISM ....................................................................................................................................... 50
3.8. LIVESTOCK ............................................................................................................................................ 50
3.9. FISHERIES .............................................................................................................................................. 54
3.10.MINERAL RESOURCES .......................................................................................................................... 54
3.11.MAJOR ENVIRONMENTAL ISSUES ........................................................................................................ 55
3.11.1. Water Quality ............................................................................................ 55 3.11.2. Industrial and agricultural input pollution .......................................................... 55 3.11.3. Water Related Diseases ................................................................................ 55 3.11.4. Soil Erosion & Land Degradation ...................................................................... 55 3.11.5. Pests and Weeds ......................................................................................... 57 4. HYDROLOGY AND WATER INFRASTRUCTURE ........................................................58
4.1. SURFACE HYDROLOGY ......................................................................................................................... 58
4.2. RUNOFF ................................................................................................................................................ 60
4.2.1. Tekeze at Embamadre.................................................................................. 60 4.2.2. Tekeze at Humera, Setit & Khasm-el-Girba Stations ............................................. 62 4.2.3. Tekeze/Atbara at Atbara .............................................................................. 63
4.3. INDICATIVE WATER BALANCE OF THE TEKEZE-SETIT-ATBARA SUB-BASIN ....................................... 65
4.4. GROUNDWATER .................................................................................................................................... 65
4.5. EXISTING WATER RESOURCES INFRASTRUCTURES ............................................................................. 66
4.5.1. Dams and Reservoirs .................................................................................... 66 4.5.2. Irrigation Infrastructure ................................................................................ 67 4.5.3. Hydropower Generation and Transmission ......................................................... 67 4.6. Identified Potential Water Resources Infrastructure ....................................................................... 67
5. ANNOTATED BIBLIOGRAPHY .............................................................................70 5.1. INTRODUCTION .................................................................................................................................... 70
5.2. REGULATORY REGIMES GOVERNING NATURAL RESOURCES .............................................................. 70
5.3. POPULATION CHARACTERISTICS ......................................................................................................... 71
5.4. EMPLOYMENT, OCCUPATION AND LIVELIHOODS ............................................................................... 72
5.5. SOCIAL AND PHYSICAL INFRASTRUCTURE .......................................................................................... 73
5.6. INEQUALITY, POVERTY, AND VULNERABILITY ................................................................................... 75
5.7. SOCIAL ORGANIZATION, CONFLICT AND CONFLICT MANAGEMENT .................................................. 76
5.8. DEVELOPMENT PROJECTS ................................................................................................................... 77
REFERENCES .........................................................................................................78

4
TTTAAABBBLLLEEESSS
Table 1: Total area of the Sub-basins ...................................................................... 7
Table 1.1: Tekeze-Setite-Atbara Administrative States/Regional States and their areas........... 9
Table 1.2: Major landforms of the Tekeze Sub-basin ..................................................... 10
Table 1.3: Tekeze-Setite-Atbara Sub-basin: Major Catchments ........................................ 59
Table 1.4: Agro-climatic Zones in Tekeze Sub-basin...................................................... 12
Table 1.5: Thermal Zones in Tekeze Sub-basin of Ethiopia (after DE Pauw, 1988) ................. 16
Table 2.1: Tekeze-Setite-Atbara Sub-basin: Population estimates, 2002 ............................. 19
Table 2.2: Rural and Urban Growth Rates, Tekeze-Setite-Atbara Sub-basin ......................... 20
Table 2.3: Crude birth and death rates, Tekeze-Setite-Atbara Sub-basin ............................ 23
Table 2.4: Sex ratios in TSA sub-basin states .............................................................. 22
Table 2.5: Age distribution of population, TSA sub-basin................................................ 23
Table 2.6: Infant mortality, Tekeze-Setite-Atbara Sub-basin ........................................... 24
Table 2.7: Life expectancy at birth, TSA sub-basin ....................................................... 24
Table 2.8: Tekeze-Setite-Atbara Sub-basin: Literacy and Primary School Enrolment .............. 25
Table 2.9: Main sources of drinking water, Tekeze-Setite-Atbara Sub-basin......................... 26
Table 2.10: Tekeze-Setite-Atbara Sub-basin: Access to Sanitation Facilities .......................... 27
Table 2.11: Health personnel per 100,000 population, Sudan ............................................ 28
Table 2.12: Length and density of roads, TSA sub-basin in Ethiopia .................................... 29
Table 2.13: Length and density of roads, TSA sub-basin in Ethiopia .................................... 29
Table 2.14: Main Agricultural Systems in the Tekeze-Atbara Sub-basin ................................ 34
Table 2.15: Poverty rates, Sudan states ...................................................................... 40
Table 2.16: Poverty rates in Ethiopia ......................................................................... 40
Table 3.1: Tekeze-Atbara Sub-basin: Dominant Soil Types - % of Area ................................ 43
Table 3.2: Tekeze-Atbara Sub-basin: Dominant Land Cover ............................................ 46
Table 3.3: Vegetation in the Tekeze Sub-basin ............................................................ 48
Table 4.1: Main Rivers of Tekeze Sub-basin ................................................................ 58
Table 4.2: Estimated river flows at national boundaries ................................................ 59
Table 4.3: Tekeze-Atbara Sub-basin: Areas of Third order catchments (km²) ....................... 60
Table 4.4: On-going small-scale irrigation development schemes in Tigray Region of Ethiopia .. 68
Table 4.5: On-going small-scale irrigation development schemes in Amhara Region of Ethiopia 68
5
FFFIIIGGGUUURRREEESSS
Figure 1.1: Tekeze-Setite-Atbara Sub-basin: Administrative Units .......................................... 6
Figure 1.2: Relief Map of Tekeze-Setite-Atbara Sub Basin ................................................... 11
Figure 1.3: Annual Rainfall Time Series at Khashm-el-Girba Station....................................... 13
Figure 1.4: Mean Monthly Rainfall, Abi-Adi Meteo Station, Ethiopia (1980-2, 1998-2003) ............. 13
Figure 1.5: Mean Monthly Rainfall, Lali-Bela Meteo Station, Ethiopia (1980-83,85,89,93,2000) ...... 14
Figure 1.6: Mean Monthly Rainfall, Khashim-el-Girba (1980-2000) ......................................... 14
Figure 1.7: Mean Annual Rainfall Spatial Distribution (Isohyets) map of the sub-basin ................ 15
Figure 1.8: Spatial Variation of PET in the TSA Sub-basin ................................................... 16
Figure 1.9: Spatial variation of temperature in the TSA sub-basin ......................................... 17
Figure: 2.1: Tekeze-Atbara Sub-basin: Population densities and distribution ............................ 21
Figure 2.2: Population Density in the Tekeze Watershed .................................................... 22
Figure 2.3: Primary school enrolment ratios in the TSA sub-basin, Ethiopia & Sudan .................. 26
Figure 2.4: Potential health coverage for health centres and health stations ........................... 28
Figure 2.5: Tekeze-Atbara Sub-basin: Road Network ........................................................ 30
Figure 2.6: Occupation in the Sub-basin ........................................................................ 31
Figure 2.7: Unemployment Proportion in the Sub-basin...................................................... 32
Figure 2.8: Tekeze-Atbara Sub-basin: Cropping Systems ..................................................... 35
Figure 2.9: Selected indicators of poverty in the Tekeze Basin............................................. 42
Figure 3.1: Tekeze-Atbara Sub-basin: Geology ................................................................ 44
Figure 3.2: Tekeze-Atbara Sub-basin: Dominant Soil Types ................................................. 45
Figure 3.3: Tekeze-Atbara Sub-basin: Dominant Land Cover ............................................... 47
Figure 3.4: Tekeze-Atbara Sub-basin: Cattle Densities ....................................................... 52
Figure 3.5: Tekeze-Setite-Atbara Sub-basin: Sheep and Goat densities ................................... 53
Figure 4.1: Annual Runoff Series, Tekeze River at Embamadere station .................................. 61
Figure 4.2: Mean monthly runoff, Tekeze River at Embamadere Station (1976-2000) .................. 61
Figure 4.3: Runoff Seasonal Distribution & Variability, Tekeze River at Humera Station (1980-90) . 62
Figure 4.4: Annual Runoff Series for Tekeze River at Humera Station..................................... 62
Figure 4.5: Annual Runoff Series of the TSA Sub-basin to the Main Nile at Atbara Station ............ 63
Figure 4.6: Runoff Seasonal Distribution & Variability, Tekeze River at Atbara Station (1903-82) ... 64
Figure 4.7: Indicative Water Balance for Tekeze-Setite-Atbara Sub-basin ............................... 65

6
IIINNNTTTRRROOODDDUUUCCCTTTIIIOOONNN TTTOOO TTTHHHEEE OOONNNEEE SSSYYYSSSTTTEEEMMM IIINNNVVVEEENNNTTTOOORRRYYY
EEEAAASSSTTTEEERRRNNN NNN IIILLLEEE SSSUUUBBBSSSIIIDDDIIIAAARRRYYY AAACCCTTTIIIOOONNN PPPRRROOOGGGRRRAAAMMMMMMEEE::: The Eastern Nile Technical Regional Office (ENTRO) is an organization meant to plan and implement the ENSAP (Eastern Nile Subsidiary Action Program) in the three Eastern Nile Basin (ENB) countries of Egypt, Ethiopia and Sudan. ENSAP seeks to realize the NBI Shared Vision for the Eastern Nile region aimed at reducing poverty, foster economic growth and the reversal of environmental degradation.
OOONNNEEE SSSYYYSSSTTTEEEMMM IIINNNVVVEEENNNTTTOOORRRYYY: To support its multipurpose development objectives, ENTRO began an exercise in 2006 to create a One System Inventory (OSI) to support the planning of the Joint Multipurpose Program (JMP). The OSI was to be a regional knowledge base across the three EN countries, initially focused on three themes, water resources, socio-economic and environmental issues. This information was expected to be useful for decision-makers and senior program and project coordinators at ENTRO to write terms of reference for new studies in the Inception Phase of the JMP and to aid the literature survey of these studies.
OOOSSSIII DDDEEEVVVEEELLLOOOPPPMMMEEENNNTTT PPPRRROOOCCCEEESSSSSS: The process of development of the OSI is as follows:
� NNNaaatttiiiooonnnaaalll rrreeepppooorrrtttsss::: National consultants were appointed in 2005 to collect information but found it quite difficult to access national information. They submitted their reports in 2006, comprising all the information they were able to gather till then.
� TTThhheeemmmaaatttiiiccc rrreeepppooorrrtttsss::: These national reports were compiled into three thematic reports, each reporting on the situation in four transboundary sub-basins, namely, the Baro-Akobo-Sobat-White Nile Sub-basin, the Abbay-Blue Nile Sub-basin, the Tekeze-Setit-Atbara Sub-basin and the Main Nile Sub-basin.
� TTTrrraaannnsss---bbbooouuunnndddaaarrryyy sssuuubbb---bbbaaasssiiinnn rrreeepppooorrrtttsss::: In Septemebr 2007, these thematic reports were compiled by an international consultant into four multiple-theme reports, divided according to trans-boundary sub-basins, to present issues ‘without national borders’.
� RRReeegggiiiooonnnaaalll WWWooorrrkkkssshhhoooppp::: The four sub-basin reports were presented in a Regional Workshop in Addis Ababa in November 2007 and several comments were received by country teams that reviewed the reports. The atmosphere in this regional meeting was quite positive and country teams acknowledged the usefulness of the information-gathering and sharing exercise of the OSI.
� RRReeevvviiissseeeddd OOOuuutttpppuuutttsss::: Summaries of the four sub-basin reports were prepared in early 2008 and sent along with the more detailed Annexes to the three country ENSAP Teams by mid 2008 to receive corrected versions of information that were found to be incorrect or out-dated in the review done during the Regional Workshop. A CD kit was also prepared to demonstrate the interactive presentation of key data tables and maps.
� CCCooouuunnntttrrryyy mmmeeeeeetttiiinnngggsss::: Meetings were organized with the country ENSAP teams in May 2009 to review and update the information in the Summaries, Annexes and CD kit. These country meetings were extremely positive and there was considerable willingness among the three countries to share all available and up-to-date information. However, time was too short for them to do much beyond providing feedback that some OSI data and information was incorrect and needed to be updated.
OOOTTTHHHEEERRR IIINNNIIITTTIIIAAATTTIIIVVVEEESSS AAANNNDDD FFFUUUTTTUUURRREEE PPPLLLAAANNNSSS::: The OSI was meant to be a small initiative to support the JMP. ENTRO subsequently initiated Eastern Nile Water Resources Planning Model (ENWRPM) Project, and began building an information database to feed and validate this model. Thereafter, the Nile Basin Initiative (NBI) initiated the Decision Support System (DSS) and a basin-wide information collection and model building exercise. Both used OSI information. It is expected that the OSI will be handed over to the ENWRPM Project.
7
QQQUUUIIICCCKKK OOOVVVEEERRRVVVIIIEEEWWW OOOFFF TTTHHHEEE EEEAAASSSTTTEEERRRNNN NNNIIILLLEEE BBBAAASSSIIINNN
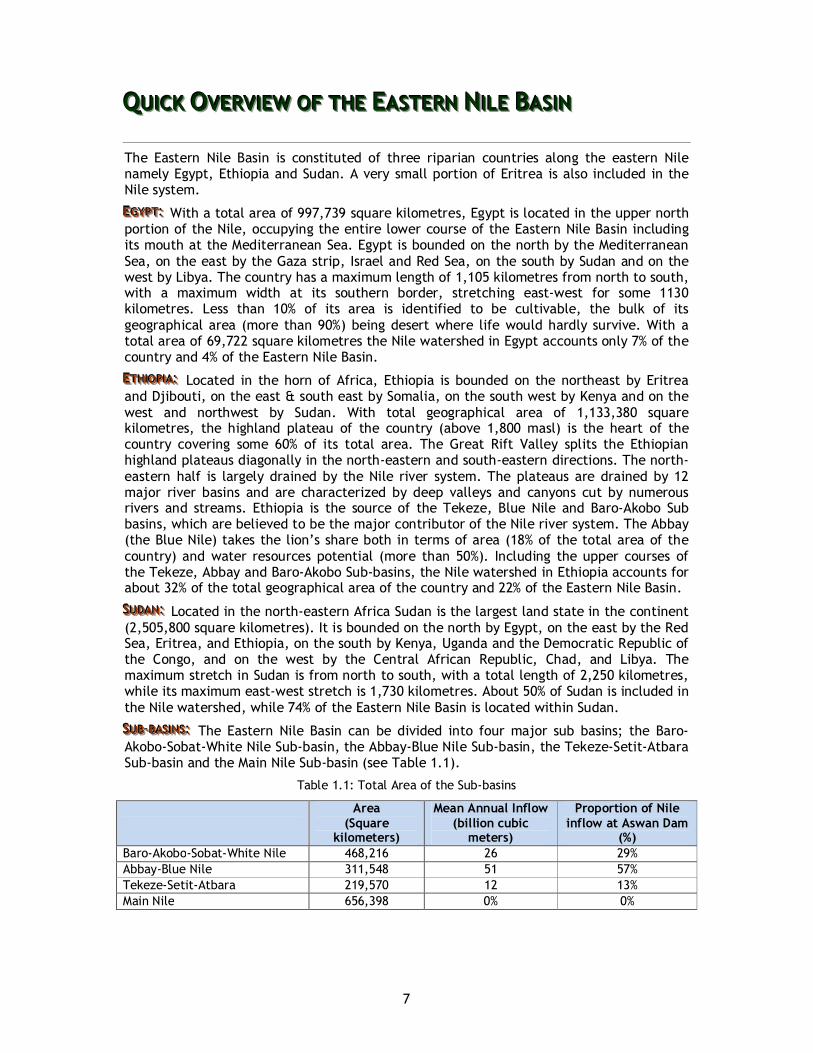
The Eastern Nile Basin is constituted of three riparian countries along the eastern Nile namely Egypt, Ethiopia and Sudan. A very small portion of Eritrea is also included in the Nile system.
EEEGGGYYYPPPTTT::: With a total area of 997,739 square kilometres, Egypt is located in the upper north portion of the Nile, occupying the entire lower course of the Eastern Nile Basin including its mouth at the Mediterranean Sea. Egypt is bounded on the north by the Mediterranean Sea, on the east by the Gaza strip, Israel and Red Sea, on the south by Sudan and on the west by Libya. The country has a maximum length of 1,105 kilometres from north to south, with a maximum width at its southern border, stretching east-west for some 1130 kilometres. Less than 10% of its area is identified to be cultivable, the bulk of its geographical area (more than 90%) being desert where life would hardly survive. With a total area of 69,722 square kilometres the Nile watershed in Egypt accounts only 7% of the country and 4% of the Eastern Nile Basin.
EEETTTHHHIIIOOOPPPIIIAAA::: Located in the horn of Africa, Ethiopia is bounded on the northeast by Eritrea and Djibouti, on the east & south east by Somalia, on the south west by Kenya and on the west and northwest by Sudan. With total geographical area of 1,133,380 square kilometres, the highland plateau of the country (above 1,800 masl) is the heart of the country covering some 60% of its total area. The Great Rift Valley splits the Ethiopian highland plateaus diagonally in the north-eastern and south-eastern directions. The north-eastern half is largely drained by the Nile river system. The plateaus are drained by 12 major river basins and are characterized by deep valleys and canyons cut by numerous rivers and streams. Ethiopia is the source of the Tekeze, Blue Nile and Baro-Akobo Sub basins, which are believed to be the major contributor of the Nile river system. The Abbay (the Blue Nile) takes the lion’s share both in terms of area (18% of the total area of the country) and water resources potential (more than 50%). Including the upper courses of the Tekeze, Abbay and Baro-Akobo Sub-basins, the Nile watershed in Ethiopia accounts for about 32% of the total geographical area of the country and 22% of the Eastern Nile Basin.
SSSUUUDDDAAANNN ::: Located in the north-eastern Africa Sudan is the largest land state in the continent (2,505,800 square kilometres). It is bounded on the north by Egypt, on the east by the Red Sea, Eritrea, and Ethiopia, on the south by Kenya, Uganda and the Democratic Republic of the Congo, and on the west by the Central African Republic, Chad, and Libya. The maximum stretch in Sudan is from north to south, with a total length of 2,250 kilometres, while its maximum east-west stretch is 1,730 kilometres. About 50% of Sudan is included in the Nile watershed, while 74% of the Eastern Nile Basin is located within Sudan.
SSSUUUBBB---BBBAAASSSIIINNNSSS::: The Eastern Nile Basin can be divided into four major sub basins; the Baro-Akobo-Sobat-White Nile Sub-basin, the Abbay-Blue Nile Sub-basin, the Tekeze-Setit-Atbara Sub-basin and the Main Nile Sub-basin (see Table 1.1).
Table 1.1: Total Area of the Sub-basins
Area
(Square kilometers)
Mean Annual Inflow (billion cubic meters)
Proportion of Nile inflow at Aswan Dam
(%)
Baro-Akobo-Sobat-White Nile 468,216 26 29%
Abbay-Blue Nile 311,548 51 57%
Tekeze-Setit-Atbara 219,570 12 13%
Main Nile 656,398 0% 0%

8
TTTHHHIIISSS AAANNNNNNEEEXXXEEE contains information on the Tekeze-Setit-Atbara Sub Basin and is part of the four annexes that support the summary OSI report prepared by ENTRO.
Figure 1.1: Tekeze-Setite-Atbara Sub-basin: Locatiton Map
Source: Sudan: ENTRO GIS data base: Ethiopia WBISPP GIS database
9
1. GENERAL CHARACTERISTICS
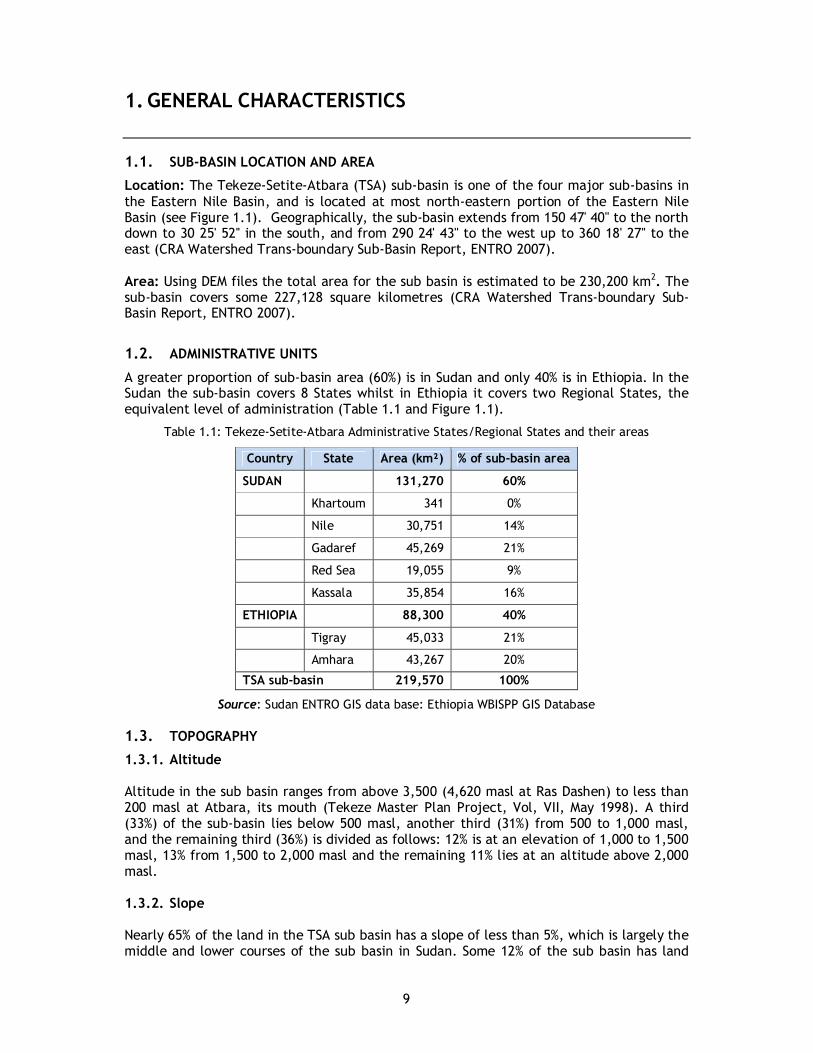
1.1. SUB-BASIN LOCATION AND AREA Location: The Tekeze-Setite-Atbara (TSA) sub-basin is one of the four major sub-basins in the Eastern Nile Basin, and is located at most north-eastern portion of the Eastern Nile Basin (see Figure 1.1). Geographically, the sub-basin extends from 150 47' 40'' to the north down to 30 25' 52'' in the south, and from 290 24' 43'' to the west up to 360 18' 27'' to the east (CRA Watershed Trans-boundary Sub-Basin Report, ENTRO 2007). Area: Using DEM files the total area for the sub basin is estimated to be 230,200 km2. The sub-basin covers some 227,128 square kilometres (CRA Watershed Trans-boundary Sub-Basin Report, ENTRO 2007).
1.2. ADMINISTRATIVE UNITS A greater proportion of sub-basin area (60%) is in Sudan and only 40% is in Ethiopia. In the Sudan the sub-basin covers 8 States whilst in Ethiopia it covers two Regional States, the equivalent level of administration (Table 1.1 and Figure 1.1).
Table 1.1: Tekeze-Setite-Atbara Administrative States/Regional States and their areas
Country State Area (km²) % of sub-basin area
SUDAN 131,270 60%
Khartoum 341 0%
Nile 30,751 14%
Gadaref 45,269 21%
Red Sea 19,055 9%
Kassala 35,854 16%
ETHIOPIA 88,300 40%
Tigray 45,033 21%
Amhara 43,267 20%
TSA sub-basin 219,570 100%
Source: Sudan ENTRO GIS data base: Ethiopia WBISPP GIS Database
1.3. TOPOGRAPHY 1.3.1. Altitude Altitude in the sub basin ranges from above 3,500 (4,620 masl at Ras Dashen) to less than 200 masl at Atbara, its mouth (Tekeze Master Plan Project, Vol, VII, May 1998). A third (33%) of the sub-basin lies below 500 masl, another third (31%) from 500 to 1,000 masl, and the remaining third (36%) is divided as follows: 12% is at an elevation of 1,000 to 1,500 masl, 13% from 1,500 to 2,000 masl and the remaining 11% lies at an altitude above 2,000 masl. 1.3.2. Slope Nearly 65% of the land in the TSA sub basin has a slope of less than 5%, which is largely the middle and lower courses of the sub basin in Sudan. Some 12% of the sub basin has land

10
slope ranging from 5 - 10%, while 9% of the area has land slope ranging from 10% to 15% (Table 1.2). The remaining portion of the sub basin is characterized to have land slope of greater than 15%.
Table 1.2: Major landforms of the Tekeze Sub-basin
Major Landform % of Area
Level land 16%
Sloping land 14%
Steep land 52%
Composite landforms 18%
Source: FAO Land and terrain database
1.3.3. Relief and landforms
Relief: Two main landscape units are observed in the TSA sub-basin: A mountainous relief that extents in Ethiopia and Eritrea and a flat piedmont starting close to the Ethiopian border and extending across the Sudanese portion.
� Mountainous relief: The incised nature of the Tekeze River in the Ethiopian highlands mirrors that of the Abay River. However, the altitude ranges are smaller within the Tekeze Basin and the drainage pattern is more dendritic. The Tekeze Basin is also characterized by the presence of isolated volcano necks that contrast sharply with the surrounding undulating relief. The upper reaches of the basin are surrounded by mountain ranges with a maximum altitude of 4,600 masl at the mountain of Ancua, part of the Ras Dashan system. Plateaus and benches terminate in steeply dissected escarpments, where resistant strata have been broken down by geological erosion. Extremely rugged topography exists where the highlands are cut into a number of blocks by deeply incised gorges of the Tekeze River and its tributaries.
� Flat piedmont: In the Ethiopian and Sudan Lowlands the topography is almost flat or slightly undulating becoming increasingly more undulating to the east. The elevation of the lowlands varies between 500 and 1500 masl. The lowland region between the Atbara River and the Blue Nile is occupied by the Butana Plains. Given the extent of the lowlands, in proportion with the mountainous relief, most of the sub-basin is characterized by slopes lower than 2.5 percent (Figure 1.2).
Major Landforms: The Tekeze Sub-basin as whole is characterized by the dominance of steep land and more than 50% of the basin has slope gradient of over 30%. The dominant landform in the basin is steep hilly land, with which one third of the basin is covered. The lowland (30% of the watershed) is flat in slope with uniform topography, and the highlands are vested with undulating, irregular and non-uniform topography.
Sloping land (gradients 8-30%) covers about 14% and level land (<8%) about 16%. The composite landforms, which combine two or more major landforms, cover 18% of the basin. Really flat land (<2% gradient) occurs in only 5% of the basin (OSI Environment Synthesis report, p. 17).

11
Figure 1.2: Relief Map of Tekeze-Setite-Atbara Sub Basin
Source: ENTRO OSI database Raw data source: The Shuttle Radar Topography Mission (SRTM) 90m DEM

12
1.4. CLIMATE 1.4.1. General Climatic types: According to Thornthwaite classification that characterized area climate based on moisture index, which is defined based on annual rainfall, and annual potential evapotranspiration (PET), the Tekeze-Setite-Atbara Sub-basin is identified to have four climatic zones, (i) moist sub humid, largely prevails in high altitude areas (>2,500 masl) of the northern highland massive of Ethiopia; (ii) dry sub humid, identified to be in the central part of the upper course of the sub basin covering very small portion of the area as in the highland plateaus of Wegera in north Gondar, (iii) semi-arid, virtually covering large proportions (more than 80%) of the upper course of the sub basin, and (iv) arid climate that prevails in the low-lying (<500 masl) areas of the middle and lower courses of the sub basin in Sudan.
Agro-climatic Zones: Based on the temperature of the area, four basic climatic (thermal) and 14 agro-climatic zones (with different dependable growing periods) can be delineated in the sub basin (Table 1.4). The kolla zone is subdivided into three agro climatic zones, the Weyna Dega and the Dega thermal zones each into four and the Wurch into two zones.
Table 1.4: Agro-climatic Zones in Tekeze Sub-basin
Agro-climatological
zone
Thermal zone
Rainfall (mm/yr)
Potential evapo-transpiration (mm/yr)
Dependable length of growing period
(months)
% of basin
K1
Kolla
500 – 800 1800 – 2300 3 9%
K2 600 -1100 1500 – 1700 2.3 6%
K3 700 - 1500 1500 - 2200 3.5 27%
WD1
Weyna Dega
500 – 800 1500 – 1700 2 – 3 21%
WD2 700 – 1100 1400 – 1900 3 – 3.5 8%
WD3 700 – 1000 1300 – 1700 3 – 3.5 13%
WD4 1000 - 1500
1400 - 1700 3.5 - 5 3%
D1
Dega
400 – 600 1400 – 1500 2 – 3 1%
D2 500 – 700 1400 – 1500 2 – 3 1%
D3 700 – 1000 1600 – 1800 3 – 3.5 5%
D4 700 - 1400 1300 - 1700 3.5 - 5 4%
W1 Wurch
700 – 1000 1400 – 1500 3 – 3.5 1%
W2 800 - 1500 1000 - 1700 3.5 - 5 1%
HW High
Wurch 900 - 1300 1000 - 1500 3.5 – 5 0.1%
Source: Ministry of Water Resources (Ethiopia) quoted in OSI Environment Report (p. 18)
1.4.2. Rainfall Spatial variation in rainfall: Mean annual rainfall in the Tekeze-Setite-Atbara Sub-basin is substantially lower than the Baro-Akobo and Blue Nile Sub-basins. Mean annual rainfall varies from above 2000 mm in the upper courses of the Baro-Akobo-Sobat-White Nile sub-basin to above 1500 mm in the upper course of Blue Nile. But it is only 1,000 mm in the northern highlands of the Tekeze watershed, and 675 mm at Mekelle station, located in the upper course of the Tekeze-watershed. It is only 700 mm at Humera station (at the

13
Ethio- Sudan border) in the middle course, less than 400 mm at El-Girba station (in Sudan) and only 20 mm at the Atbara station, at the mouth of the sub basin (Figures 1.3 – 1.7).
Figure 1.3: Annual Rainfall Time Series at Khashm-el-Girba Station
543.90
33.2041.80
417.10
222.09
0.00
100.00
200.00
300.00
400.00
500.00
600.00
1981 1982 1983 1984 1985 1986 1987 1988 1989 1990 1991 1992 1993 1994 1995 1996 1997 1998 1999 2000
Recording Periods (years)
Annual R
ain
fall (m
m)
Annual
Mean Annual
Source: OSI Synthesis report on water resource related issues Raw data source: Sudan Meteorological Authority
Figure 1.4: Mean Monthly Rainfall, Abi-Adi Meteo Station, Ethiopia (1980-2, 1998-2003)
0.0
50.0
100.0
150.0
200.0
250.0
300.0
350.0
400.0
450.0
500.0
Growing Periods (months)
Mean M
onth
ly R
F (
mm
) &
CV
(%
)
Mean Monthly RF(mm)
Mean Monthly RF(mm) 1.7 4.9 16.1 29.4 54.5 74.4 451.6 379.3 108.6 12.4 3.5 0.9
Jan Feb Mar Apr May Jun Jul Aug Sep Oct Nov Dec
Source: OSI Synthesis report on water resource related issues Raw data source: Ethiopian Meteorological Agency

14
Figure 1.5: Mean Monthly Rainfall, Lali-Bela Meteo Station, Ethiopia (1980-83,85,89,93,2000) Upper Course of Tekeze Setite Atbara
0.0
50.0
100.0
150.0
200.0
250.0
300.0
350.0
400.0
450.0
500.0
Growing Periods (months)
Mea
n M
onth
ly R
F (
mm
) &
CV
(%
) Mean Monthly RF(mm)
Mean Monthly RF(mm) 5.8 18.7 47.9 204.8 35.2 40.1 406.7 232.7 49.5 19.2 12.6 4.1
Jan Feb Mar Apr May Jun Jul Aug Sep Oct Nov Dec
Source: OSI Synthesis report on water resource related issues Raw data source: Ethiopian Meteorological Agency
Figure 1.6: Mean Monthly Rainfall, Khashim-el-Girba (1980-2000)
0.00
10.00
20.00
30.00
40.00
50.00
60.00
70.00
80.00
90.00
100.00
Seasons (months)
Mean M
onth
ly R
F(m
m)/VI(%
)
Mean 0.17 0.01 0.00 2.69 12.75 20.81 52.78 87.60 41.01 5.92 0.94 0.00
JAN FEB MAR APR MAY JUN JUL AUG SEP OCT NOV DEC
Source: OSI Synthesis report on water resource related issues Raw data source: Sudan Meteorological Authority
Wet and dry seasons: As in the Blue Nile and Baro-Akobo-Sobat-WN Sub-basins, features of climate such as wet and dry periods are governed by the movement of ITCZ & the sun and altitude. As it is indicated in section 4.1.2, moisture content and length of wet periods are limited in this sub basin compared to the Blue Nile and Baro-Akobo-Sobat-WN Sub-basins. The horizontal variation indicates that wet period in the upper course of this sub basin is confined to two months extending from June/July to July/August only. In the middle and lower course of the sub basin the dry period is dominant as a result of vast Sahara Desert.

15
1.4.3. Temperature Mean annual temperature: Temperature in the highland plateaus of the sub basin is pleasant where mean annual air temperature not exceeding 20o C. Large proportion of this highland plateau exhibits mean annual temperature of 18ºC. In the western low-lying area of the sub basin, around the border, mean annual temperature is in the order of 25ºC. Further in the downstream reach of the sub basin, around the Girba reservoir and in its immediate upstream reach, mean annual temperature is observed to be 30ºC. In the lower course, at Atbara, the mouth of the sub basin, temperature exceeds 30ºC.
Maximum and minimum temperature: Minimum monthly temperature occur in the December – February period and range in the basin between 3 and 210C, while maximum mean monthly values occur in March – April and range between 19 and 430C.
Figure 1.7: Mean Annual Rainfall Spatial Distribution (Isohyets) map of the sub-basin
Source: ENTRO OSI database Raw data source: Ethiopia: Ethiopian Meteorological Agency, Sudan: Meteorological Authority,
Ministry of Aviation, Sudan, 2006

16
Table 1.5: Thermal Zones in Tekeze Sub-basin of Ethiopia (after DE Pauw, 1988)
Traditional Name of Zone Temperature range Altitude range
T1 Bereha when dry Lower Kolla >27.5 <500
T2 (Upper) Kolla 27.5 – 21 500 - 1500
T3 Weyna Dega 21 – 16 1500 – 2300
T4 Dega 16 – 12 2300 – 3000
T5 Wurch 12 – 7.5 3000 – 3700
T6 High Wurch <7.5 >3700
Source: Ministry of Water Resources (Ethiopia)
1.4.4. Evaporation Mean annual potential evapo-transpiration (PE) follows similar trend as that of temperature. It is well below 2,000 mm per annum in the highland plateaus of the sub basin and accounts only 2.5% of the sub basin. PE exceeds 2,000 mm in the valleys of these highland plateaus. The low-lying area (below 1,500 masl) located at the foot of the highland plateaus in the western face, up until the border and a little beyond experiences mean annual PE that ranges from 2,000 mm to 3000 mm and covers some 40% of the sub basin. Further in the Sudan lowland area until the Girba reservoir, PE is observed to exceed 5,000 mm and covers 30% of the sub basin.1 In the lower reach of the sub basin and at Atbara, the mouth of the sub basin, PE is observed to rise up to 6,000 mm.
Figure 1.8: Spatial Variation of PET in the TSA Sub-basin
1493 15201753
5431
0
1000
2000
3000
4000
5000
6000
Mekele Lalibela Endaselassie Khasm-el-Girba
Station
Mean A
nnual E
vap (
mm
) Mean Annual Evap(mm)
Source: EN OSI Synthesis report on water resource related issues
1 This jump seems illogical and the figures need to be checked.

17
Figure 1.9: Spatial variation of temperature in the TSA sub-basin
Source: ENTRO OSI database
[Raw data source; Ethiopia: Ethiopian Meteorological Agency, Sudan: Meteorological Authority, Ministry of Aviation, Sudan, 2006]

18
1.5. HUMIDITY Mean annual relative humidity: Nearly 80% of the sub basin has a mean annual relative humidity of less than 55%, of which nearly 30% has a relative humidity of less than 40%. Only 20% of the sub basin, in the highland plateaus of the Simian (North) mountains of Ethiopia, has a relative humidity of more than 55%.

19
2. SOCIO-ECONOMIC CHARACTERISTICS
2.1. DEMOGRAPHIC CHARACTERISTICS 2.1.1. Population estimates As the Tekeze-Atbara Sub-basin crosses two national boundaries (Ethiopia and Sudan), its population is made up of two groups: One group inhabits the upper reaches of the Tekeze River and the other group occupies the lower portion of the sub basin. The first group lives in Ethiopia, mainly in Amhara and Tigray regional states while the second group lives in the Sudan (OSI Socioeconomic synthesis report, p.131)
Data compiled from the Population and Housing Census of Ethiopia (1994) and The Sudanese National Census Bulletins give an estimated basin population of 12.2 million on the Ethiopian side (based on population estimates for 2000) and 4.271 million on the Sudanese portion of the basin (OSI Socioeconomic synthesis report, p.131).2 This makes the sub basin the least populated region of the four sub basins of the Nile River, after the Main Nile, the Baro-Akobo-Setit-White Nile and Abbay-Blue Nile Sub-basins.
Another estimate is based on the LandScan 2002 Global Population Database developed by Oak Ridge National Laboratory (ORNL) of the United States, which provides 2002 population estimates on a 1 km grid. This was then clipped by the State and Regional State boundaries within the sub-basin to provide population estimates within the sub-basin by State/Regional state. National census estimates of the rural-urban distribution were used to provide estimates of total rural and urban populations. Using this correction, total population of the sub-basin is estimated to be 8.47 million, some 75% of which lives in Ethiopia, while Kassala and Gederef States in Sudan have the highest populations (Table 2.1).
Table 2.1: Tekeze-Setite-Atbara Sub-basin: Population estimates, 2002
State Total population % of sub-basin total
Sudan 2,147,281 25%
Gaderef 665,368 8%
Kassala 1,208,216 14%
Nahr Al-Neil 222,968 3%
Red Sea 50,729 1%
Ethiopia 6,325,639 75%
Amhara 2,850,528 34%
Tigray 3,475,111 41%
Sub-basin 8,472,920 100%
Sources: Ethiopia: CSA, 1999. Sudan: UN Population Fund & Sudan Central Bureau of Statistics (2002). Population densities: Land Scan 2002 Global Population Database developed by Oak Ridge National Laboratory (from Watershed Management CRA Sub-basin Report, 2007)
Note: These are not the full State populations as many states are "clipped" by sub-basin boundaries.
2.1.2. Population growth rates The population growth rate from 1984 to 1994 was 2.6 in the Ethiopian side of the sub-basin and 2.5 on the Sudanese side. The urban population growth rates are substantially larger than rural rates in all states, but those in Sudan are higher than in Ethiopia (Table
2 This data needs to be checked against the latest available national statistics.
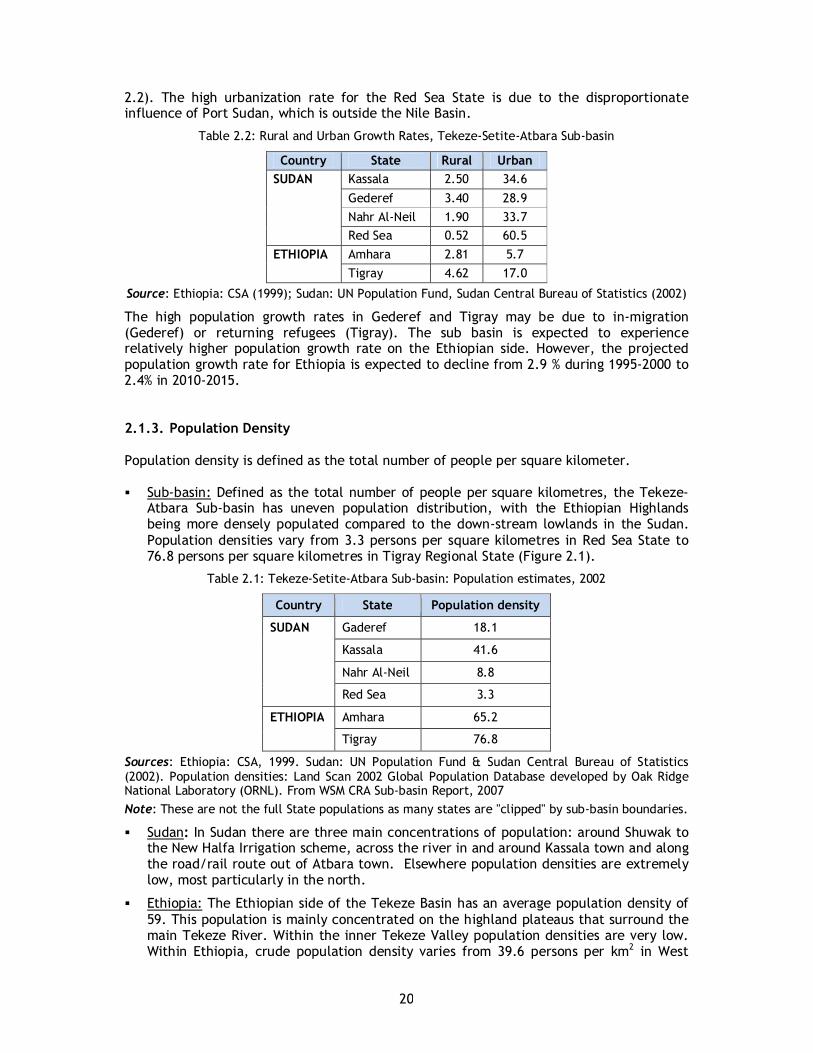
20
2.2). The high urbanization rate for the Red Sea State is due to the disproportionate influence of Port Sudan, which is outside the Nile Basin.
Table 2.2: Rural and Urban Growth Rates, Tekeze-Setite-Atbara Sub-basin
Country State Rural Urban
SUDAN Kassala 2.50 34.6
Gederef 3.40 28.9
Nahr Al-Neil 1.90 33.7
Red Sea 0.52 60.5
ETHIOPIA Amhara 2.81 5.7
Tigray 4.62 17.0
Source: Ethiopia: CSA (1999); Sudan: UN Population Fund, Sudan Central Bureau of Statistics (2002)
The high population growth rates in Gederef and Tigray may be due to in-migration (Gederef) or returning refugees (Tigray). The sub basin is expected to experience relatively higher population growth rate on the Ethiopian side. However, the projected population growth rate for Ethiopia is expected to decline from 2.9 % during 1995-2000 to 2.4% in 2010-2015. 2.1.3. Population Density Population density is defined as the total number of people per square kilometer. � Sub-basin: Defined as the total number of people per square kilometres, the Tekeze-
Atbara Sub-basin has uneven population distribution, with the Ethiopian Highlands being more densely populated compared to the down-stream lowlands in the Sudan. Population densities vary from 3.3 persons per square kilometres in Red Sea State to 76.8 persons per square kilometres in Tigray Regional State (Figure 2.1).
Table 2.1: Tekeze-Setite-Atbara Sub-basin: Population estimates, 2002
Country State Population density
SUDAN Gaderef 18.1
Kassala 41.6
Nahr Al-Neil 8.8
Red Sea 3.3
ETHIOPIA Amhara 65.2
Tigray 76.8
Sources: Ethiopia: CSA, 1999. Sudan: UN Population Fund & Sudan Central Bureau of Statistics (2002). Population densities: Land Scan 2002 Global Population Database developed by Oak Ridge National Laboratory (ORNL). From WSM CRA Sub-basin Report, 2007
Note: These are not the full State populations as many states are "clipped" by sub-basin boundaries.
� Sudan: In Sudan there are three main concentrations of population: around Shuwak to the New Halfa Irrigation scheme, across the river in and around Kassala town and along the road/rail route out of Atbara town. Elsewhere population densities are extremely low, most particularly in the north.
� Ethiopia: The Ethiopian side of the Tekeze Basin has an average population density of 59. This population is mainly concentrated on the highland plateaus that surround the main Tekeze River. Within the inner Tekeze Valley population densities are very low. Within Ethiopia, crude population density varies from 39.6 persons per km2 in West

21
Tigray to 147.4 persons per km2 in South Wollo of the Amhara regional state (Figure 2.2).
Figure: 2.1: Tekeze-Atbara Sub-basin: Population densities and distribution
Source: LandScan 2002 Global Population Database developed by Oak Ridge National Laboratory

22
Figure 2.2: Population Density in the Ethiopian part of the TSA Sub-basin
020406080
100120140160180
W. T
igra
y
C. T
igra
y
E. T
igra
y
S. T
igra
y
N. G
onde
r
S. G
onde
r
N. W
ello
S. W
ello
Zones
Po
pula
tion
Den
sity
1994 2000 2005
Source: Ethiopia: CSA (1999)
2.1.4. Rural-urban divide Overall 83 per cent of the Sub-basin's population is rural. The highest urban proportion is found in Kassala State closely followed by Nahr Al-Neil State.
Table 2.1: Tekeze-Setite-Atbara Sub-basin: Population estimates, 2002
State Total population Rural population Urban population Rural %
Sudan 2,147,281 1,444,255 471,416 67%
Gaderef 665,368 473,077 136,719 71%
Kassala 1,208,216 790,173 273,400 65%
Nahr Al-Neil 222,968 147,828 49,818 66%
Red Sea 50,729 33,177 11,479 65%
Ethiopia 6,325,639 5,575,019 641,506 88%
Amhara 2,850,528 2,689,437 151,987 94%
Tigray 3,475,111 2,885,582 489,519 83%
Sub-basin 8,472,920 7,019,274 1,112,922 83%
Sources: Ethiopia: CSA, 1999. Sudan: UN Population Fund & Sudan Central Bureau of Statistics (2002). Population densities: Land Scan 2002 Global Population Database developed by Oak Ridge
National Laboratory (ORNL). From WSM CRA Sub-basin Report, 2007
Note: These are not the full State populations as many states are "clipped" by sub-basin boundaries.
2.1.5. Sex ratios The sex ratio on the Ethiopian side is at parity (that is 100 males per 100 females) whereas on the Sudanese side there is a slight excess of males over females (i.e., 103 males per 100 females). There are, however, variations across the states (Table 2.4).
Table 2.4: Sex ratios in TSA sub-basin states
Country State Females: Males
SUDAN Kassala 98.2
Gederef 105.3
Nahr Al-Neil 97.6
Red Sea 116.1

23
Country State Females: Males
ETHIOPIA (Rural) Amhara 99.9
Tigray 97.1
Source: Ethiopia: CSA (1999); Sudan: UN Population Fund, Sudan Central Bureau of Statistics (2002)
The high male-female ratio for Red Sea State is due to the disproportionate influence of Port Sudan, which is outside the Nile Basin. 2.1.6. Crude birth and death rates The crude birth rates are around three times the crude death rates in all the states of the sub-basin, and are fairly similar across the states of Sudan and Ethiopia with the exception of Gederef, which has the highest crude birth rates (Table 2.3).
Table 2.3: Crude birth and death rates, Tekeze-Setite-Atbara Sub-basin
Country State Crude Birth Rate Crude Death Rate
SUDAN Kassala 37.8 10.5
Gederef 40.3 11.7
Nahr Al-Neil 34.0 10.8
Red Sea 34.7 9.7
ETHIOPIA Amhara 36.6 10.9
Tigray 37.5 11.8
Source: Ethiopia: CSA (1999); Sudan: UN Population Fund, Sudan Central Bureau of Statistics (2002)
2.1.7. Population age group Age- wise, the population throughout the sub basin tends to be dominated by a pyramidal structure that is characteristics of most developing countries having large width at the base (indicating the predominance of the relatively younger persons under the age of 15) and gradual reduction of population concentration from middle through the uppermost section of the pyramid, signalling higher child dependency ratio. Old persons (aged 65+ in Ethiopia and 60+ in Sudan) account 8 % of the basin population on the Ethiopia side and 4.5 % on the Sudanese side (Table 2.5).
Table 2.5: Age distribution of population, TSA sub-basin
State Below 15 Above 60
SUDAN 4.5%
Kassala 41.8% 4.2%
Gederef 43.1% 3.7%
Nahr Al-Neil 41.0% 5.3%
Red Sea 38.5% 4.3%
ETHIOPIA* 8%*
Amhara 43.3% 6.0%
Tigray 44.2% 6.3%
Note: 65+ in Ethiopia
Source: Ethiopia: CSA (1999); Sudan: UN Population Fund, Sudan Central Bureau of Statistics (2002)

24
2.1.8. Infant Mortality Although the Tekeze-Atbara Basin population generally seems to experience higher rates of infant mortality, the Ethiopian side appears to be even higher (with Tigray region having in 1994 an infant mortality rate of 123 per 1000 live births) than the Sudanese side, which is somewhere around 112 deaths per 1000 live births in 1993. There are, however, regional variations (Table 2.6).
Table 2.6: Infant mortality, TSA sub-basin
Country State Deaths per 1000 live births
Male Female Total
SUDAN Kassala 107 96
Gederef 135 122
Nahr Al-Neil 108 90
Red Sea 95 88
ETHIOPIA Amhara 83
Tigray 90
Source: Ethiopia: CSA (1999); Sudan: UN Population Fund, Sudan Central Bureau of Statistics (2002)
2.1.9. Life Expectancy at Birth Life expectancy is higher in Sudan than Ethiopia, and higher for females than males in both countries (Table 2.7).
Table 2.7: Life expectancy at birth, TSA sub-basin
Parameter Males Females
Ethiopia 48.2 – 49.6 51.1 – 52.2
Sudan 54 56
Source: Ethiopia: CSA (1999); Sudan: UN Population Fund, Sudan Central Bureau of Statistics (2002)
2.1.10. Ethnic groups A number of ethnic groups occupy the basin. The Ethiopian portion of the basin is predominantly inhabited by the Amharas and the Tigreans, in their respective regions, although there are also other smaller ethnic groups including Kemant, Kunama, Saho, Agew and Oromo. The lower reaches of the basin in Sudan is settled by diverse population groups including Al Gaalyin, Al Rubatab, Al Merafab, Al Omerab, Al Fadiniya and Almanasir in Nahr Elnil state; Beja, Hadandwa, Bani Amir, immigrant Nigerian tribe, resettled Nubians and some Eritrean refugees in Kassala state, and the pastoral Shukrya, the sedentary Habanya and the nomadic Beni Amir in Gadarif state (OSI Water Synthesis report, p. 153)

25
2.2. ACCESS TO SOCIAL INFRASTRUCTURE 2.2.1. Literacy and education � Sub-basin: The data, in general, show that more than half of the youngster population
who should be in school is not attending primary school. However, enrolment at secondary school level is very low in most of the basin regions, especially on the Ethiopian side where three-fourth of the population eligible for secondary education is engaged in different household activities. This indicates that the role of education in promoting development among the residents of the basin is still minimal. This might be due to lack of access to secondary education or due to the prevailing poverty preventing families from sending their children to school (OSI Socioeconomic synthesis report, p.137).
� Sudan: There are significant differences in literacy and primary school enrolment rates between Nile State and the others, with the former considerably above the sub-basin average (Table 2.8).3 The rates range from 61 % in El-Gedaraf state to 75 % in Kasala and 98 % in Nahr El-Neil states (OSI Socioeconomic synthesis report, p.137). Female literacy rates are however below those for males everywhere.
Table 2.8: Tekeze-Setite-Atbara Sub-basin: Literacy and Primary School Enrolment
State Literacy Rates > 15 years Population
6-13yrs Total Primary
school enrolment %
Enrolment Average Male Female
SUDAN
Kassala 44.7 52.9 35.8 274,713 103,131 37.5
Gederef 55.6 72.9 38.4 311,547 142,313 45.7
Nahr Al-Neil 65.2 75.0 56.6 186,851 147,477 78.9
Red Sea 47.9 54.5 40.1 154,210 69,290 44.9
ETHIOPIA
Amhara 17.8 23.5 12.1 16,528,724 10,542,015 64.0
Tigray 20.5 27.8 13.6 5,749,924 3,378,386 59.0
SUB-BASIN 23,205,969 14,382,612 62.0
Sources: Sudan: UN Population Fund & Sudan Central Bureau of Statistics (2002); Ethiopia: World Bank (2004)
� Ethiopia: The Tekeze area on the Ethiopian side has low school primary and secondary enrolment ratios compared to the Sudanese portion of the basin, where basic education coverage for both boys and girls are higher (Figure 2.3). In Tigray and Amhara states of Ethiopia, the net enrolment rates at primary level in 2004 was 43% and 33% for males and 51% and 37% for females respectively.
3 Primary net enrolment ratio is the number of children (7-12 years) currently attending primary school divided by the total number of children in that age group. Similarly, secondary net enrolment ratio is the proportion of children aged 13-18 attending secondary school (grade 7-12) divided by the total number of children in that age group.

26
Figure 2.3: Primary school enrolment ratios in the TSA sub-basin, Ethiopia & Sudan
Figure: Primary School enrolment ratios for the basin
population, Ethiopia (2004) and Sudan (2002-2003)
0
10
20
30
40
50
60
70
80
90
100
Tigray Amhara Nahr Elnil Kasala Elgadarif
Male
Female
Source: Ethiopia: CSA (1999); Sudan: UN Population Fund, Sudan Central Bureau of Statistics (2002)
2.2.2. Water Supply � Sub-basin: The WHO standard of 20 litres a day per person is rarely met in the sub-
basin because of water shortage or the cost of provision (Abdalla A.A. Ahmed et al., 2005).
� Sudan: In Sudan the Nile State is well above the national average with respect to access to piped water, unlike other states (Tables 2.9).
� Ethiopia: Only a minority of Ethiopians has an access to potable water (National Water Development Report for Ethiopia, 2004). Urban areas receive better water supply service than rural. According to the 1994 second National CSA survey, only 24% of the housing units in the country used a safe source of water, 14% through piped (tap) water, 10% from protected and springs. The rest, 76% of the country’s population used “unsafe” water, such as from unprotected springs and wells or directly from rivers (Table 2.9).
Table 2.9: Main sources of drinking water, Tekeze-Setite-Atbara Sub-basin
SUDAN Piped into Dwelling
Public tap
Deep Well/ pump
Dug Well/ Bucket
River/ canal
Rain- water
Others Not
Stated
Kassala 22.6 16 21 6.4 23.1 1.5 8.7 0.8
Gederef 12.6 18.8 27.7 13.9 13.8 9.4 3.6 0.2
Nahr Al-Neil 42.3 3.7 12.2 13.5 24.7 -- 3.4 0.2
Red Sea 25.6 18.3 28.3 25.8 1.5 -- 0.5 --
ETHIOPIA Tap Protected well
or spring Unprotected Well or spring
River/Lake /pond
Not
Stated
Amhara 9.1 12.3 41.9 36.3 0.3
Tigray 13.8 7.4 36.3 41.9 0.5
Sources: Sudan: UN Population Fund & Sudan Central Bureau of Statistics (2002); Ethiopia: World Bank (2004)
In 1994 over 40 million people had no access to safe drinking water and in 1998 the number had risen to 46 million people or 77% of the population (OSI Water Synthesis report, p. 160). In 2001, of the two Tekeze Basin regional states, the basin population

27
in Tigray (34.1%) seems to enjoy better access to safe drinking water compared to Amhara (30.7%) or even in comparison to the national water supply coverage, which is 30.9%. In the 2004 Welfare Monitoring Survey conducted by the CSA, more than 50 % of the population in Tigray has access to safe drinking water. However, the safe drinking water supply situation in Amhara region has not improved over the period, 2001-2004.
2.2.3. Sanitation � Ethiopia: Around 60% of the population in the Ethiopian states of Amhara and Tigray
reported not having access to sanitation facilities (Table 2.10). Of those who had access, pit latrines were most prevalent in both countries, followed by flush toilets. There was hardly any difference between the 61% that reported no access in Amhara and the 60% from Tigray, but a larger proportion of the population in Amhara reported using pit latrines, and a larger proportion from Tigray reported using flush latrines.
Table 2.10: Tekeze-Setite-Atbara Sub-basin: Access to Sanitation Facilities
SUDAN Flush to Sewage System
Flush to septic tank
Traditional pit latrine
Soak pit
Others Missing No
facilities
Kassala -- 11.6 34.3 1.2 0.3 0.5 52.0
Gederef -- 5 31.7 3.1 0 0 60.1
Nahr Al-Nil -- 12.3 72.6 0.7 0.7 0.1 13.5
Red Sea -- 20.9 26.1 4.2 0.7 0.2 47.9
ETHIOPIA Private
Flush
Shared
Flush
Private
Pit
Shared
Pit
Not
stated
No
facilities
Amhara 1.6 1.2 18.2 16.4 1.2 61.4
Tigray 2.4 2.6 9.8 13.8 1.4 60.0
Sources: Sudan: UN Population Fund & Sudan Central Bureau of Statistics, 2002; Ethiopia: World Bank, 2004.
� Sudan: The proportion of population without access to sanitation facilities ranged from 13.5% (Nahr Al-Nil) to 60% (Gederef) Within the Sudanese states, the Nahr Al-Nil state reported the largest access to sanitation facilities (73% using traditional pit latrines and 12% pour flush) and Gederef had the poorest performance followed by Kassala and Red sea states.
2.2.4. Health Facilities Health posts, centres and clinics
� Ethiopia: There are 393 health posts and clinics in Tigray Region while there are 1461 in Amhara Region. There are few health centres and hospitals in each of the regions located in the Tekeze River Basin. Only 15 hospitals and 48 health centres are located in Tigray Region while there are 18 hospitals and 126 health services respectively in Tigray and Amhara Regions. Though private sector involvement in the health sector is important to enhance the quality and coverage of health services, very few private clinics and health centres are available in the two regions located in the Tekeze River Basin. According to the health information compiled by the MOH, there are 31 private clinics in Tigray and 304 in Amhara region.

28
Hospital beds
� Ethiopia: Hospitals in the regions are also equipped with limited hospital beds and specialized staff. Only 1256 beds are available in hospitals found in Tigray while 1505 beds are found in hospitals of Amhara regions.
Figure 2.4: Potential health coverage for health centres and health stations
0
20
40
60
80
100
120
Tigray Amhara NationalREGION MOH, 2005
Pe
rce
nta
ge
Health Centers & Health Stations Health Centers, Health Stations & Health Posts
Source: MOH, Government of Ethiopia (2005)
Health coverage rate � Ethiopia: The MOH calculates health coverage rate on the basis of the number of
health facilities (i.e. health centres, health stations and health posts) and the expected catchments areas in each of the administrative units (MOH, 2005). The health coverage in Tigray region is relatively higher than in the Amhara region. This indicates that there is a serious problem in promoting health services through the country without even considering its quality. If access to health is required for all population living in each and every corner of the basin, one needs to work hard to build more health facilities in Amhara Region besides ensuring the quality of services in all of the two regions.
� Sudan: The Sudan side of the Tekeze-Atbara Basin population seems to enjoy a relatively better coverage of health services (Table 2.11).
Table 2.11: Health personnel per 100,000 population, Sudan
Health personnel per 100,000 population Nahr Elnil Kasala Elgadarif
Specialists 2.3 1.5 1.2
Dentists 1.2 0.2 0.2
Doctors 14.0 5.3 6.5
Technicians 8.5 3.7 5.7
Medical assistants 38.1 22.9 12.8
Nurses 84.3 54.8 48.9
Public health officers 1.4 1.6 1.2
Midwifery 42.9 39.9 32.9
Source: MOH, Government of Ethiopia (2005)

29
Ratio of population to health professionals
� Ethiopia: Another indicator of access to health is the ratio of population to available health professionals that include physicians, health officers, nurses, environmental health workers and health extension workers. The number of population per physician for Tigray region is 54,844 and 142,184 for Amhara region, showing great disparity between regions. At national level the ratio of population per physician is 29,777. The number of people to be served by a physician in the two regions located in the Tekeze Basin is far from being close to the standard of 10,000 people per physician set by the World Health Organization.
2.3. TRANSPORT AND COMMUNICATIONS 2.3.1. Roads The road and rail network in the entire sub-basin is mapped in Figure 2.5. The country-specific details are given below.
Ethiopia: Only one asphalted road, crossing the north-eastern upper portion of the basin stretching south-wards to Addis Ababa, connects the sub-basin with the rest of the country. Further down in the west there are all-weather gravel roads connecting Tigray region in the north and Amhara region in the south of the basin, while an all-weather gravel road connects parts of north-western Ethiopia with that of south-eastern Sudan allowing movement of goods (fuel and agricultural products) and people between the two countries. Less than half (42%) of the rural households in each of Tigray and Amhara regions are living less than five kilometres away from an all weather road (CSA, 2004, Welfare Monitoring Survey). Within Ethiopia because of the extreme dissection of the highlands by the Tekeze River and its tributaries, road infrastructure is not well developed, possibly because road construction and vehicle running costs are high. All-weather roads are confined to the ridges and plateaus between the deeply incised rivers, and the Tekeze has only two road crossings (Table 2.12).
Table 2.12: Length and density of roads, TSA sub-basin in Ethiopia
Type of Road Road Length (Km) Road Density (Km/1,000km²)
All weather 2,780 32
Dry weather 1,171 13
Total 3,951 46
The length of all-weather roads in the Ethiopian side of the sub-basin is significantly greater than dry-weather roads, but this may only be a reflection of the degree to which dry weather roads have been mapped (Table 2.13).
Table 2.13: Length and density of roads, TSA sub-basin in Ethiopia
Type of Road Road Density (Km/1,000km²)
Tigray 44
Amhara 46
Ethiopia 31
Sudan: The Sudanese side of the basin is better served with road infrastructure. There is one all-season road connecting the basin (Nahr Elnil state) with Khartoum. Within Sudan there are two primary (asphalt) roads (1) Khartoum to Port Sudan and (2) from Atbara to Haiya (under construction) and one all-weather secondary road. Other roads are generally in poor condition and on the clay plains often impassable during the rains.

30
Ethiopia and Sudan: There is one major road linkage between Ethiopia and Sudan within the Tekeze-Atbara Sub-basin through Metema from Gonder to Gederef on the main Khartoum to Port Said road. However, the Gonder to Humera Road in Ethiopia could easily be linked to the main Khartoum-Port Said road at Showak in Sudan. However, the road between the two countries needs to be upgraded to asphalt in order to increase movement of population and goods across the Tekeze Basin and make the region a trading centre for both Ethiopia and Sudan.
The sub-basin: In terms of accessibility to all-weather roads some 39 per cent of the Sub-basin area is further than 15 kilometres, which compares with 45 per cent for the Abbay Sub-basin and 63 percent for the Baro-Akobo Sub-basin. The areas of inaccessibility are located in the upper Tekeze Sub-basin and in the western Lowlands.
Figure 2.5: Tekeze-Atbara Sub-basin: Road Network
Source: FAO Africover Project

31
2.3.2. Railways Sudan, Atbara town is the centre of railways and there are so many railways connecting the state with other regions. In fact the railways in Sudan is the oldest on the continent and the longest, extending for more than 4,570 kilometres and together with the branch lines constitute some 5,500 kilometres.
Ethiopia, The basin population lives far off from the only 517 kilometres railway line serving eastern part of the country, the Addis Ababa-Djibouti railway line.
2.4. ECONOMIC ACTIVITIES 2.4.1. Activity rates Activity rate is defined as the proportion of the total economically active (employed plus unemployed) population to the total working age population. Accordingly, the basin states of Amhara, and Tigray in Ethiopia respectively have an activity rate of 76.6%, and 71.4%; whereas in Sudan the two basin states of Nahr Elnil and Kassala have male activity rate of 67.5% and 74.1% respectively. This indicates that the overwhelming majority of the economically active population is engaged in some form of livelihood activities.
2.4.2. Livelihood patterns According to the 1999 National Labour Force Survey, the service sector accommodates nearly three-fifth of the urban employed population for each of the regions. About 14% & 20% of the urban working population of Tigray and Amhara regions, respectively, is subsumed by the manufacturing sector (the second highest) while agriculture employs 11.8% of the Tigray urban residents and 11.4% of the Amhara’s urban employed population. Employment opportunity in the public administration is slightly higher (6.2%) in the Tigray while it is 6.0% in Amhara region (OSI Water Synthesis report, p. 156)
Figure 2.6: Occupation in the Sub-basin
0
10
20
30
40
50
60
70
Fully on
Agriculture
Partially on
Agriculture
None Agriculture
Occupation
Co
vera
ge (
%)
Amhara Tigray
Source: 1999 National Labour Force Survey Ethiopia
The basin population depends for its livelihood on the natural endowments of land and water and other associated resources (such forestry and fishing) provided by the basin and its environs. Generally, crop production and livestock herding are the two most dominant economic activities along the basin. Information compiled from the 2001/02 Agricultural Census of Ethiopia showed that for the basin states of Amhara and Tigray a combination of crop and livestock holding (nearly about three-fourth) constitutes the primary source of

32
livelihood, followed by crop only farming (about one-fifth of the holding) and livestock only holding (about 3% and 3% for Tigray and Amhara regions respectively). The Sudanese inhabitants in the lower bank of Tekeze-Atbara Basin are also engaged in crop cultivation using Atbara River.
'The dominance of sedentary agriculture in the basin area implies that crop farming is more important as a source of livelihood than pastoral production. A smaller proportion of ‘only livestock’ holdings is also an indicator of few pastoral population in the basin, though there is a substantial pastoral population (about 10 % in Sudan) engaged primarily in animal husbandry. In Ethiopia, regional level analysis shows that pastoralism as a way of life is very minimal in the Amhara region compared to Tigray region. A greater proportion of the population living in South and East Tigray are engaged in cattle herding and this supports the view of the relative nomadic character of the population living there.
The contribution of mechanized agriculture to employment creation in the area is very limited, mainly concentrated around Humera in Ethiopia and near Atbara River in Sudan. Most of the farms are undertaking crop production (for example, sesame and cotton in Ethiopia; wheat, beans, durra and vegetables in Sudan) and provide important source of supplementary cash income for the basin population by serving as important destinations for seasonal labour migration within and beyond the basin. Overall, with the exception of the Sudanese portion of the Tekeze-Atbara areas where there are a good number of industrial activities especially in Nahr Elnil state where the famous Portland Cement Factory in Atbara town and the Shendi and Norab Textile Factories are located, the basin population has very limited access to employment in the service and industrial sectors.
2.4.3. Unemployment rates In Ethiopia, the two basin states of Amhara and Tigray have unemployment rate (defined as the proportion of the unemployed population to the economically active population) of 7.7% and 6.1%, respectively. However, the Sudanese side of the Tekeze-Atbara Basin appears to experience relatively higher unemployment rate ranging from 10.5 in Nahr Elnil state to 23.9 % in Kassala state (Figure 2.7).
Figure 2.7: Unemployment Proportion in the Sub-basin
7.76.1
10.5
23.9
0
5
10
15
20
25
30
Amhara Tigray Nehr Elnil Kassala
States/Region
Unem
plo
ym
ent
Covera
ge(%
)
Unemplyment (%)
Source: 1999 National Labour Force Survey Ethiopia

33
2.5. AGRICULTURE AND PEOPLE 2.5.1. Main Agricultural land Use Systems The main agricultural land use systems in the Tekeze-Atbara Sub-basin in Sudan and Ethiopia are relatively distinct except along the international border where the ago-environment in one case and cultural affinities in another have given rise to very similar systems. Nevertheless, three broad systems can be identified: (i) rainfed cropping, (ii) irrigated cropping and (iii) extensive livestock production (with minor cropping). Differences in the scale of operations, tenure type and to a lesser extent cropping patterns give rise to a number of recognizable sub-categories (Table 2.14).

34
Table 2.14: Main Agricultural Systems in the Tekeze-Atbara Sub-basin
Category Scale of operations Tenure type Main Components Location
RAINFED CROPPING
Small-scale traditional; sedentary
State land: Individual & communal use rights
Cropping (Cereals, pulses, oil seeds) Small Livestock holdings (Communal grazing, crop residues)
Ethiopia: Highlands
Small-scale traditional; shifting – bush fallowing
State land: Individual & communal use rights
Cropping (cereals, pulses): Small livestock holdings (Communal grazing, crop residues)
Ethiopia & Sudan: Lowlands
Small-scale traditional: Run-off cropping/ water harvesting
State land: Individual & communal use rights
Sorghum, Millet (Oennisetum typhoides), okra, karkadeh, water melonlubia, seseme.
Sudan: Kassala, eastern "Border" area.
Large-scale: Semi-mechanized
State land: Medium-term Leases
Cropping (Sorghum, cotton, sesame) Ethiopia & Sudan: Lowlands
IRRIGATED CROPPING
Small schemes
Small-scale operations (< 1.0ha) Gravity:
State Land: Individual use rights additional to rainfed land
Cropping (cereals, vegetables) Ethiopian Highlands
Small-Moderate Schemes: Small-scale operations:
State Land: Individual use rights: Individual leases & sub-leases
Geroof recession cropping + supplementary gravity irrigation: Groundwater from matara: Date Palm
Lower Atbara, Sudan
Large scheme: small-scale operations (<40 feddans) Gravity
State land: Individual long-term leases. Some freehold
Cropping: Cotton, Sorghum, wheat Small-livestock holdings
Sudan: New Halfa and Gash Schemes
Large scheme: large-scale operations
State land Cropping: Sugar Sudan: New Halfa Sugar Scheme
LIVESTOCK
Small-scale: Extensive Pastoral Transhumant
State land: Communal use (grazing & water rights)
Cattle, small-ruminants Sudan
Small-scale: Extensive Agro-pastoral Transhumant- sedentary
State land: Communal use (grazing & water rights)
Cattle, small-ruminants Small-scale cropping
Sudan

35
Rainfed cropping operates at the traditional small-scale and the large and semi-mechanized scale (Figure 2.8).
Figure 2.8: Tekeze-Atbara Sub-basin: Cropping Systems
Source: FAO Africover Sudan (2002) & WBISPP-MARD (2001 -2003)

36
In Ethiopia household cropland area is generally less than two hectares and often located on two or more plots of differing land-soil types. Cultivation is undertaken with oxen using the tine plough (maresha). The main crops are teff, sorghum and maize at lower altitudes with wheat and barley taking their place at higher altitudes. Livestock are an important component of the farming system. After millennia of cropping, soils are at a very low level of fertility.
Traditional small-scale cropping is on State land in both Sudan and Ethiopia. However, households have individual use rights for cropping and communal use rights for grazing and fuel wood collection. Mixed cropping and livestock production are the main production components. In the Highlands cropping is sedentary whilst in the lowlands it incorporates bush fallowing and shifting cultivation. In both the highland and lowland systems use of improved inputs (chemical fertilizer and seeds) is low.
In Sudan close to the Atbara and scattered elsewhere are areas of smallholder rainfed cultivation. These are generally less than 10 feddans (4.0 ha) in size. Cultivation is often undertaken using hired tractors. They cover approximately 0.079 million feddans (33,180 ha.) within the Atbara Sub-basin. Many are Lahawin pastoralists who lost the livestock in the droughts of the 1980's or felt that they had better claim land before other groups (e.g. the Falleta) did so (Morton, 1988). Bush fallowing is practiced to restore soil fertility and reduce weed infestation (particularly striga).
On the plains east and west of the Gash Delta in the "Border Area" and extending southwards onto the Butana Plains agro-pastoralists, sedentarized former pastoralists (mainly Beja but increasingly Rashyda peoples) and recent immigrants from West Africa use a number of run-off farming techniques (van Dijk & Mohamed, 1993, Critchley et al., 1988). The plains are cut by some 30 large khors and many small khors draining to the Gash River. Land preparation is generally manual with some use of tractors near Kassala. The main crop is sorghum, with millet, karkadeh, lubia and sesame with okra and watermelon as cash crops. Two techniques are recognized: traditional water harvesting and wild flooding. The former include run-off manipulation by U-shaped earth bunds or teras and brushwood panels or libish. Catchment:cultivated area ratios are generally above 2:1. In wild flooding no water is harvested, instead after the flood the land is planted directly.
Conversely, the large-scale semi-mechanized systems are under state lease-hold tenure (25 years leases) and a number of cultural operations (ploughing, harrowing and seeding) are mechanized. Nevertheless, the use of improved inputs (fertilizer, seed) is minimal.
There are a number of sub-categories of irrigated cropping. A convenient division can be made firstly between large and small schemes. In Ethiopia there are no large schemes but in Sudan there are two. The small schemes include both traditional and modern small schemes in Ethiopia. The large schemes are divided those with large and those with small-scale operations (not possible to separate out in Map 13 because of the small areas of the latter). The large scheme with large scale operations is in Sudan and is under sugar cane production (located in the New Halfa Scheme).
The two major schemes in Sudan in the sub-category are the New Halfa Irrigation Scheme and the Gash Flood Irrigation Scheme. The New Halfa Scheme is located below the Kashm el Girba dam totalling some 447,000 feddans (190,000 ha). The scheme was set up partly to resettle 7,000 Halfawi families who had been displaced by the rising waters of Lake Nasser/Nubia. In addition there were 20,000 local families. In 1970/71 the area under crops was 330,000 feddans but by 1982 had reduced to 145,000 feddans due to problems of siltation and loss of irrigation storage in the Kashm el Girba dam. Many families in the scheme retain a stake in pastoralism beyond the scheme and have mixed herds of cattle, small stock and camels (Babiker Abbas, 1997). During the dry season the animals feed of

37
crop residues from the irrigation scheme and in the wet season the animals are moved to the Butana Plains.
Around Kassala in the Gash Delta is a large but variable area of flash flood irrigation. The floods average 88 days (Kirkby, 2001). Water is diverted into canals and so to large level areas known as "misgas". On the northern end of the Eastern Gash a different tyre of irrigation is found using pumped well water, mainly for vegetables and fruit trees. Originally small in number, they have increased substantially, and now use motorized pumps. Originally the scheme produced cotton, but now sorghum dominates with castor, sunflower and ground nuts. Vegetables are an increasingly important crop on the four large commercial farms in the northern delta. Many of the Hadendowa and Rashaida are still camel pastoralists or agro-pastoralist and in the wet season graze their animals north and west of the Gash delta. There is a similar area of flood irrigation to the northeast in the Tokar Delta, but this scheme does not have the canals of the Gash Delta.
The small irrigated gravity schemes in the Ethiopian Highlands comprise both traditional and modern schemes. Traditional irrigation has a long antiquity in Ethiopia and generally uses local materials (wood and stone), whilst the modern schemes generally use cement and brick for the main structures. Farmers have use rights to cropping in the same way as their rainfed land. Plots are small (< 1.0 ha). The main crops are cereals and vegetables.
Along the Lower Atbara geroof recession cropping is practiced on about 120,000 feddans (50,400 ha) on both sides of the river. Cultivators are both private investors and local communities. However, smaller releases from the Kashm el Girba Dam have had a serious impact on water levels. Farmers were previously able to obtain two crops but can now only manage one crop. The MIWR are constructing canals to supplement water supply during low flows. Locally irrigation from groundwater from matara wells for date palm.
Above the dam are extensive areas of semi-mechanized rainfed farms that stretch over into the Blue Nile Sub-basin. The area within the Atbara Sub-basin is 2.00 million feddans (840,000 ha). However, a proportion of this has been abandoned. The main crops grown are sorghum and sesame. An ILO/UNHCR Study (1984) estimated that 70 per cent was outside demarcated schemes. The lease-holders are predominantly merchants from Gederif, Khartoum and the north, but also include some wealthy pastoralists, particularly from the Shukriya and Dubania tribes.
In the rainfed small-scale systems and on the large irrigation schemes livestock are an important component and livelihood strategy despite the small number per household. They provide additional sources of income and thus help to spread the risks associated with rain-fed cropping. In the highlands they are a valuable source of soil nutrients and in fuelwood scare areas of fuel. In Sudan dung is not used as farmers believe they are a source of weeds (Kibreab, 1996).
2.6. FORESTRY AND AGRO-FORESTRY 2.6.1. Forestry Contribution to the Economy In Sudan in the Sub-basin approximately 8.8 million cubic meters of wood fuel and charcoal (per capita consumption of 1.4 meters) are consumed forming about 80 per cent of the total energy consumption. An unknown quantity of charcoal is exported from the central parts of the Sub-basin to Khartoum. Woodlands provide all building materials in rural areas. They constitute 33 per cent of the livestock feed as browse. They also provide a number of non-timber forest products the most important of which is Gum Arabic.
In addition to these products the woodlands give a number of services which have no direct monetary values such as environmental protection, increase in crop production,

38
conservation of soil fertility, biodiversity, protection of cultural heritage, forming habitat for wildlife and eco-tourism attraction.
The situation in Ethiopia is not dissimilar to that in Sudan. In Ethiopia in the Baro-Akobo Sub-basin some 7.95 million cubic metres per year of fuelwood and charcoal (wood equivalent) are consumed as fuel forming about 65 per cent of domestic energy consumption. Browse is of little importance in the Ethiopian Highland livestock systems. The official figures for timber production do not include timber and poles produced and used outside the official marketing structures, in particular, for domestic use in rural areas.
2.6.2. Agro-forestry In Sudan the main components of agro-forestry are the harvesting of Gum Arabic and browse for livestock as mentioned above. The Gum Arabic Belt (GAB) in the Baro-Sobat-White Nile Sub-basin comprises the major part of the low rainfall woodland savannah zone extending from the border with Ethiopia to North Kordofan on clay soils east of the White Nile and sandy soils to the west.
There is a distinct difference between the clay and the sand provenances of Acacia senegal in terms of their water-use efficiency and gum yield (Raddad & Luukkanen, 2006). The clay provenances were distinctly superior to the sand provenances in all traits studied especially in their basal diameter and crown width. The clay provenances are adapted for fast growth rates and high biomass and gum productivity.
There are a number of direct (production) and indirect (environmental) benefits accruing to gum production (Barbier, 1990). In terms of direct benefits the trees provides fodder for cattle, sheep, goats and camels. Older trees (i.e. 15 years or more) that no longer produce good quality gum are often cut for fuelwood and for charcoal production. In terms of indirect benefits the deep tap root and its extensive lateral root system means that it assists in reducing soil erosion and water runoff and for stabilizing soils. Because of its leguminous characteristics the tree fixes nitrogen, which encourages grass growth for grazing by livestock. The trees can act as wind breaks and can assist in the stabilization of shifting sand and moving dunes.
Seasonal labourers from other parts of the country migrate to the Gum Arabic Belt (GAB) seeking employment and thus its production system supports and extends livelihood strategies.
Currently, Gum Arabic production is unstable due to climatic factors and marketing policies, in particular the ban on private companies exporting unprocessed Gum Arabic. The floor prices paid by the government-owned Gum Arabic Corporation as a percent of export prices (f.o.b. Port Sudan) declined from 70 per cent in 1994 to only 21 per cent 2000/2001 (World Bank (2004). In 1990-1992 the government temporarily waived controls and the per cent of export price rocketed to 160 per cent! The gum Arabic plays an important role as major source of foreign exchange, accounting for 13.6 per cent of the annual export income excluding petroleum.
In Ethiopia agro-forestry takes the form of coffee growing under shade. Some on-farm Eucalyptus planting is taking place in the Kaficho-Shakiso Zone where the forest has largely been cleared. In other Highland areas considerable numbers of indigenous trees remain in and around cropland.
2.6.3. Mining There are project proposals for exploration activities to be undertaken in the north east of the basin near Hawzen. Similar activities are currently being undertaken in the northwest prospecting area. The environmental impacts of mining will depend on the type of mining, the chemical processes used and the characteristics of the location. In addition, land

39
taken by the mine, potential negative impacts include depletion of water resources due to over extraction, pollution of water and soil, degradation of landscape, subsidence, dust and noise.
2.6.4. Industrial and agricultural input pollution These include air pollution in Mekelle from the cement factory, water pollution from the newly constructed Sheba Tannery and the dyeing factories of Tigray.
2.6.5. Fishery Overview: In the Tekeze Basin, river fishery is not well developed. The rugged natures of the landscape together with the seasonal flow of many streams make it difficult to develop this sector in the highlands. In the lowlands, some of the rivers and streams flow all year round and there is potential to increase fish production.
Important commercial fish species: According to the results of the livestock and fisheries survey conducted in the basin and the data gathered at the Bureaus of Agriculture and Rural Development in Mekelle and Gonder, the important commercial fish species in Tekeze River Basin are: Oreochromis niloticus, African catfish, Clarias gariepinus, Barbus, barbus intermedius, other Barbus species, and Bagrus docmac. Other species found in the basin presently have no economic value.
Fishing livelihoods: Most people living along the river courses do fish at some time during the year. The small catches of the basin by the fishermen are normally consumed or sold in fresh form. Preservation methods used are sun drying and some times salting. The types of fishing gear that are used in the basin include rod and hook, poisonous plants, cast nets and occasionally small gill nets.
Fish catch: In the upper and mid reaches of the river basin, occasional and part-time fishermen produce 4 kg to 1,000 kg of fish per year (the lower figures are applying to the catches of occasional fishermen). Fish catches with local fishing materials are between 20 and 60 kg/yr. Gill net catches are in order of 1,000 kg/yr. In the lower course of the sub basin, fishing is a part-time and full-time occupation. The fish catches are higher (up to 3,000 kg/yr) than those of the highland fishermen, but still insignificant due to the primitive nature of the fishing gear.
Fisheries yield potential: Due to inadequate information on riverine fisheries, the yield potential can only be obtained by extrapolation. Based on that, a production potential of 40 – 60 kg per hectare per year is estimated for the lower reaches of the Tekeze River Basin and about 200 kg per hectare per year for the upper course.
2.7. POVERTY PROFILE 2.7.1. Poverty measurements Basin-level: The JAM (2005) defined the poverty rate in Sudan as the proportion below 40 per cent of an economic status index based on asset ownership. Unfortunately the index is not defined. The poverty line in Ethiopia is set using a basket of food items sufficient to provide 2,200 kcals per adult per day which, together with a non-food component, represents Ebirr 1,070 in 1995/96 prices. Clearly, the two measures used in Sudan and Egypt are not directly comparable. The published poverty rates in Ethiopia are lower than those in the Sudan. This has been noted in the Sudan Joint Assessment Mission (JAM) Report. It appears that the difference is likely to be more a question of difference in methodologies and definitions, than actual differences in poverty rates.
Poverty estimates in Sudan: Poverty rates are estimated to be 40 – 70% in general (Table 2.15). Interestingly, the relative rating of poverty follows that of the provision of social facilities such as education and water. Thus Red Sea State has the highest rates of

40
poverty and lowest rates of facility provision; Nahr el-Neil State has the lowest poverty rates and highest rates of facility provision; and Gaderef and Kassala States in–between.
Table 2.15: Poverty rates, Sudan states
State Lower bound Upper bound
Kassala 41% 60%
Gadaref 41% 60%
Nahr el-Neil 21% 40%
Red Sea 61% 70%
Source: JAM (2005)
Poverty estimates in Ethiopia: The poverty rates for the two regional States in Ethiopia quoted by the Sustainable Development and Poverty Reduction Programme (FDRE-MOFED, 2002), show much higher levels in Tigray than Amhara (Table 2.16).
Table 2.16: Poverty rates in Ethiopia
State Rural poverty rate Urban poverty rate Total poverty rate
Amhara 32% 35% 32%
Tigray 52% 65% 54%
Source: FDRE-MOFED (2002)
Trends in poverty in Ethiopia: In both Regional States rural rates have declined between 1995 and 2000, whilst urban rates had increased.
Trends in poverty in Sudan: No data is available on poverty trends in Sudan.
2.7.2. Welfare and Poverty A good deal of poverty-focused research has been carried out in different parts of the Tekeze River Basin. Review of existing literature on the subject reveals that there is an important wealth of information made available especially through household and community studies undertaken/sponsored by the Ethiopian Economic Association (EEA), Forum for Social Studies (FSS), Institute of Development research (IDR), and other NGO and donor-agencies.
Some studies carried out on poverty situation in the area (Dessalegn, 2003; Yared, 2003) indicate that rural poverty has been increasing in ‘severity and magnitude for the last fifty years mainly due to population growth, lack of access to productive assets, crop failures and the like. As a result of this, the ‘prevalence of poverty and destitution has reached “unacceptably high level in Ethiopia”. According to the results of the Welfare and Monitoring Survey conducted by the Central Statistical Authority, 47.5% of all rural households are believed to be poor (CSA, 2004).
Poverty and destitution have been also studied from livelihood perspective, in which both were understood as ‘states of livelihood deprivation differing in degree’. For instance, Dessalegn (2003) examined the transition from poverty to destitution using data on frequency of famine, declining food consumption, and increasing malnutrition and associated health status. Based on the results of such a study, it is possible to argue that destitution as a ‘down ward slide from poverty’ has been increasing in all aspects of the Ethiopian population. Currently the destitute are expected to constitutes no less than a third of the Ethiopian rural household population.

41
2.7.3. Vulnerability indicators A policy study conducted by the Institute of Development Studies (IDS, 2002) in Wollo also revealed that the incidence of destitution has dramatically increased in the 1990s, while the number of households who were ‘doing well’ has decreased on the contrary. This agrees with other study findings (Aklilu and Dessalegn 2000) that indicated “an upward trend in poverty and a down ward trend in well-being. The view that there has been a substantial increase in the proportion of destitute households in Ethiopia has also been supported by other studies conducted by Devereux, Sharp and Yared (2002) and Ministry of Economic Development and Cooperation (2000).
The vulnerability-poverty nexus has been also studied from different perspectives, including ecological and social dimensions. A study conducted by Dessalegn (2003), for instance, revealed that peasant vulnerability is the outcome of a relentless ecological stress and large-scale degradation of environmental resources. Accordingly, peasants in Wollo and Wag Hamra remained to be one of the poorest in the country due to virulent and repeated famine and drought in the area. The people living in the area are identified as those who often suffer from sever food insecurity as ecological vulnerability continues to depress crop and livestock production.
Similarly, Dessalegn (2003) argues that virulent famine has been the most important causal factor for household/community impoverishment and vulnerability in the major part of the Abbay River Basin. According to him, most of the households in Wollo and the Northeast did not yet recover from the ‘abject poverty they were thrown into by the famine of mid- 1980s’. He further states: “The millions of peasants who become vulnerable to food shortage each year … are in large measure, the victims of harvest failures” (ibid), which are induced by natural hazards. This implies that the increasing livelihood vulnerability among farming households appear to increase the extent of rural poverty, and the situation is in a position to continue affecting a large proportion of the population residing in the basin area.
Available data on poverty and vulnerability also show that there is a strong link between poverty and gender, age as well as other characteristics of the population living in the Tekeze River Basin. For instance, Yared (2002) indicates that female-headed households make up a large proportion of the poorest and most vulnerable households in rural areas of North Shewa and South Wollo. He also argues that the living conditions and asset possession of young people is significantly lower as compared to their parents at same age in the past. Furthermore, a study conducted by the Institute of Development Studies (2002) revealed that 13.8% of the households of the study area in Wollo are destitute, while a greater proportion of them belong to female-headed households and households headed by old men. These households are identified as victims of poverty mainly due to shortage of labour power to engage in productive activities.
2.7.4. Food Aid as a Proxy Indicator of Poverty The poverty situation of the basin population on the Ethiopian side can be also assessed food aid as an indirect measure of poverty. According to the 2004 Welfare Monitoring survey, 31.9% and 30.5% of households respectively in the Tigray and Amhara regions were suffering from food shortage over the last 12 months prior to the survey date.
Unpublished data from DPPC (2000) also shows that quite a large proportion of rural population in Tigray (36.1%) and Amhara (26.4%) regions were believed to require food aid. This implies that the demand for food among rural population is a direct reflection of population pressure that could be manifested through population density in square kilometres in each of the administrative zones. More importantly, the decline for food aid in 2005, the year known for good harvest due to sufficient rain, is an indicator of the impact of climate on production of rain-fed agriculture

42
2.7.5. Nutritional Status of the Basin Population The proportion of child malnutrition is often taken as another indirect measure of the socio-economic status of the population. Verifying this argument, the Central Statistical Authority (2004: 39) indicates, “Children are chosen for the purpose of anthropometric analysis for they are more susceptible to nutritional deficiencies, which could be an indication of lower welfare status of households”. Based on the results of the Welfare Monitoring Survey findings located in the rural parts of the basin area, the proportion of wasted, stunted and under-weight is provided in Figure. Accordingly, both regions have higher percentage of stunted and underweight children though there is variation between the regions. The lowest stunted proportion is observed in Tigray (47.9% in 2005), but 56.6 % is observed in Amhara Region in the same years indicating that vulnerability among children is high in the Amhara region.
Assessment of the poverty situation in the basin area has also showed that wealth and poverty are not distributed equally among various social groups. For instance, farmland is concentrated in the hands of the older generation than the young (CSA, 2003) and the plough farming system continued to marginalize females from the management of the land, even if their right to use the land is preserved upon divorce or death of their husbands. The chances of being poor or destitute are greater for certain segments of the population basically due to socio-economic differentials among residents of the area. It is, therefore, possible to argue that the likelihood to fall into poverty and the capability to avoid or move out of poverty varies according to someone’s position in the prevailing social structure. It is, thus, important to identify who is poor and vulnerable in terms of gender, age, household type, occupation, ethnicity/religion and other socio-economic characteristics within the context of the river basin.
Figure 2.9: Selected indicators of poverty in the Tekeze Basin

43
3. NATURAL RESOURCES AND ENVIRONMENTAL ISSUES
3.1. GEOLOGY
The geology of Tekeze-Atbara Sub-basin can be summarized as follows: the southern portion is composed of basic to ultrabasic rocks, mainly basalts, while the northern portion is composed of various layers of sedimentary rocks (including sandstones, shales and limestones), as well as metamorphic rocks, such as gneisses and marble.
The lowlands include older Basement Complex rocks, the Nubian Sandstones, Tertiary unconsolidated sediments and Recent superficial wind blown sands. The Nubian Sandstones are located in the northwest corner and uncomfortably overlie the Basement Complex rocks and comprise mainly sandstones, siltstones and conglomerates. Given the incised nature of the Tekeze drainage network in the highlands of Ethiopia, the sedimentary and metamorphic rocks are often exposed below the basalts.
3.2. SOILS
Leptosols (28% of the area) are developed cover most of the Ethiopian highlands whilst Luvisols (26% of the area) are found on the shallower footslopes of the Highlands and the flat slopes of the lower Atbara valley towards the Main Nile. Cambisols are ranked third in terms of area (17%) and are mainly found in the middle Atbara valley with isolated pockets in the Ethiopian Highlands.
Vertisols are found on the flat interfluves between the Setit and Atbara Rivers in Sudan. These are black heavy cracking clays. Fluvisols are found along the floodplains of the Atbara River. Arenosols with derived from on cover sands are found in the lower parts of the Atbara Valley together with shallow Regosols.
Table 3.1: Tekeze-Atbara Sub-basin: Dominant Soil Types - % of Area
Soil Type % Area
Leptosol 27.7%
Luvisol 25.5%
Cambisol 17.4%
Vertisol 17.0%
Fluvisol 5.3%
Arenosol 2.5%
Regosol 2.2%
Nitisol 1.4%
Lixisol 0.9%
Calcisol 0.1%
Source: FAO, 1998 "Soil and Terrain Database for Northeast Africa

44
Figure 3.1: Tekeze-Atbara Sub-basin: Geology
Source: FAO Classification

45
Figure 3.2: Tekeze-Atbara Sub-basin: Dominant Soil Types
Source: FAO Classification

46
3.3. LAND USE LAND COVER
The dominant land cover is given in Table 3.2 and mapped in Figure 3.3.
Table 3.2: Tekeze-Atbara Sub-basin: Dominant Land Cover
Landcover Type Area (ha) % Total
Grassland 7,689,019 38.4%
Shrubland 4,826,757 24.1%
Bare Soil, Sand 2,400,560 12.0%
Rainfed Crops: Highland: Smallholder 2,043,194 10.2%
Rainfed Crops: Semi-mechanized 841,803 4.2%
Woodland 724,944 3.6%
Rock 634,320 3.2%
Rainfed Crops: Lowland: Smallholder 513,238 2.6%
Irrigated Crops 242,817 1.2%
Water, Reservoir 51,336 0.3%
Settlement, Refugee Camp 46,293 0.2%
Forest 11,636 0.1%
Swamp, wetland 87 0.0%
The northern region, where isohyets are lower than 75 mm/yr, is generally characterized by desert or semi-desert conditions. In this region there is little or no vegetation except along wadis with a high watertable. Occasional years of very good rainfall can transform areas of desert into valuable grazing areas known as “gizzu”.
Between the 75 and about 250 mm isohyets “Semi-desert Scrub” is the most prevalent vegetation type, and comprises a varying mixture of grasses and herbs, generally with a variable scatter of shrubs up to 4 meters high interspersed with bare earth.
Grasses are mainly annuals in Sudan. Heavy grazing and low rainfall ensures that there is insufficient dry matter for annual fires. In years of low rainfall and heavy grazing there can be an almost complete failure of annual plant growth.
South-eastwards, from the 250 mm to the 360 mm isohyet, the vegetation type becomes “Semi-desert Grassland”. Much of this vegetation is now covered by the Gezira and Managil Irrigation Schemes. On the heavy alkaline clay soils the natural vegetation is grassland without trees or shrubs.
Between the 360 mm and 570 mm isohyets on the heavy clays grassland merges into A. mellifera thornland. Above 570 mm to the border with Ethiopia there is increasing dominance by A. seyal in association with Balanites aegyptiaca. A. senegal is retained for gum arabic harvesting whilst A. seyal is used for charcoal production. B. aegyptiaca becomes increasing prevalent because it is fire resistant. The lowlands located in Ethiopia are mainly covered by shrublands. This land cover type is also observed in the dissected highlands around the upper head of Tekeze River in the south-east.
Cultivated lands are well distributed over the upstream region of Tekeze-Atbara Sub-basin. A higher percentage is observed in the north and the high plateau that reaches to Lake Tana. Woodlands are mainly located in the south-west part of the lowlands. Barelands (rock and bare soil) are scattered in the highlands, with a higher concentration within the gorge of Tekeze River, as well as within the central mountainous ridge. Forests and afro-alpine vegetation represent less than 1 % of Tekeze Basin.
Below the Kashm el Girba dam is the New Halfa irrigation scheme totalling some 190,000 ha (447,000 feddans). Above the dam are extensive areas of semi-mechanized farms.

47
Figure 3.3: Tekeze-Atbara Sub-basin: Dominant Land Cover
Source: FAO Classification
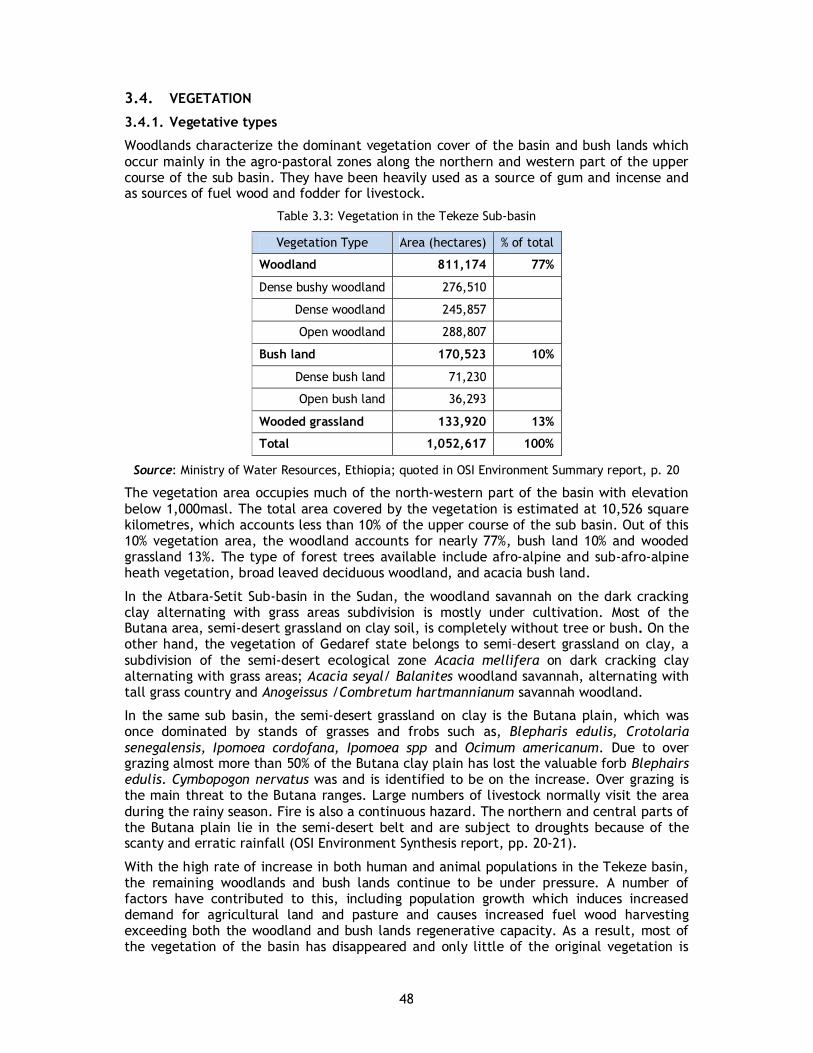
48
3.4. VEGETATION
3.4.1. Vegetative types
Woodlands characterize the dominant vegetation cover of the basin and bush lands which occur mainly in the agro-pastoral zones along the northern and western part of the upper course of the sub basin. They have been heavily used as a source of gum and incense and as sources of fuel wood and fodder for livestock.
Table 3.3: Vegetation in the Tekeze Sub-basin
Vegetation Type Area (hectares) % of total
Woodland 811,174 77%
Dense bushy woodland 276,510
Dense woodland 245,857
Open woodland 288,807
Bush land 170,523 10%
Dense bush land 71,230
Open bush land 36,293
Wooded grassland 133,920 13%
Total 1,052,617 100%
Source: Ministry of Water Resources, Ethiopia; quoted in OSI Environment Summary report, p. 20
The vegetation area occupies much of the north-western part of the basin with elevation below 1,000masl. The total area covered by the vegetation is estimated at 10,526 square kilometres, which accounts less than 10% of the upper course of the sub basin. Out of this 10% vegetation area, the woodland accounts for nearly 77%, bush land 10% and wooded grassland 13%. The type of forest trees available include afro-alpine and sub-afro-alpine heath vegetation, broad leaved deciduous woodland, and acacia bush land.
In the Atbara-Setit Sub-basin in the Sudan, the woodland savannah on the dark cracking clay alternating with grass areas subdivision is mostly under cultivation. Most of the Butana area, semi-desert grassland on clay soil, is completely without tree or bush. On the other hand, the vegetation of Gedaref state belongs to semi–desert grassland on clay, a subdivision of the semi-desert ecological zone Acacia mellifera on dark cracking clay alternating with grass areas; Acacia seyal/ Balanites woodland savannah, alternating with tall grass country and Anogeissus /Combretum hartmannianum savannah woodland.
In the same sub basin, the semi-desert grassland on clay is the Butana plain, which was once dominated by stands of grasses and frobs such as, Blepharis edulis, Crotolaria senegalensis, Ipomoea cordofana, Ipomoea spp and Ocimum americanum. Due to over grazing almost more than 50% of the Butana clay plain has lost the valuable forb Blephairs edulis. Cymbopogon nervatus was and is identified to be on the increase. Over grazing is the main threat to the Butana ranges. Large numbers of livestock normally visit the area during the rainy season. Fire is also a continuous hazard. The northern and central parts of the Butana plain lie in the semi-desert belt and are subject to droughts because of the scanty and erratic rainfall (OSI Environment Synthesis report, pp. 20-21).
With the high rate of increase in both human and animal populations in the Tekeze basin, the remaining woodlands and bush lands continue to be under pressure. A number of factors have contributed to this, including population growth which induces increased demand for agricultural land and pasture and causes increased fuel wood harvesting exceeding both the woodland and bush lands regenerative capacity. As a result, most of the vegetation of the basin has disappeared and only little of the original vegetation is
49
evident. It is only the lowland woodland and bush lands in the western and northern part of the upper course of the sub basin, which are nearer to climax.
3.4.2. Fuel wood
The National Capital State and the Gezeira State in the sub basin are the highest fuelwood consuming areas in the Sudan, with annual consumption estimated at 2,670,700 metres and 1,661,870 cubic metres respectively, which collectively constitutes 32% of the total consumption in the Sudan (OSI Water Synthesis Report, Forest Land, p. 139). From a household survey conducted in the highland parts of the sub basin, 98% of the farmers indicated that there is a shortage of forest product. This brought a corresponding reduction in the application of dung to enrich the soil organic content. The demand for wood to meet the basic needs exceeds the available supply. The wood supply comes from trees around homestead and farmland, natural woodland and bush lands.
3.4.3. Industrial wood
The basin has an acute shortage of industrial wood, which is being imported from other parts of the country. There is no industrial plantation established in the basin for current and future consumption.
3.4.4. Non-timber forest products
� Incense and gum: The collection and export of incense has been carried out for centuries. The lowland environment has the best potential for producing naturally obtained gum exudates from Acacia Senegal and incense from Boswellia papyrifera. The Tekeze Basin in Ethiopia is one among the potential areas and has a long tradition of exploiting natural gum and incense. High potential of Acacia Senegal is evident around Humera and Sheraro. Boswellia papyrifera is also dominant in the Welkait and Sheraro Woredas. The central part of the basin is virtually cleared of vegetation cover.
� Beekeeping: Apiculture or beekeeping is one of the sustainable agricultural sub-sectors which many rural farming communities practice and from which they derive food security and income. Basic biotic resources indispensable for the development of apiculture are honey plants, honeybee colonies, climate and water. As the basin has lost most of its bee keeping potential due to natural and human factors, it falls under moderate and low potential areas. However, some potential areas have been identified in relation to their surplus annual honey production. The honey yield largely depends on the availability of surplus bee forage, the prevailing weather conditions and type and size of the hives. When conditions are favorable, 2-20 kg of crude honey (honey mixed with beeswax, pollen, dead bees, etc.) has been reported to be harvested from a traditional hive and 12-31 kg from modern hives per annum. The total honey production of the basin is estimated at 2,018 tons per annum, which is some 8.2 % of the national honey production.
� Beeswax: Beeswax collection is unknown to all beekeepers in the basin. Honey is sold without further processing and if consumed, the beeswax is unused. As a result, data for beeswax production could not be obtained. But, 8-10 % of the total honey yield from a traditional hive is calculated to be beeswax. With modern hives, the ratio is 1-2 %. At the minimum percentages, a total of 200 tons of beeswax could be produced in the basin per annum.
3.5. WET LANDS
The sub-basin has no significant wetland in its system

50
3.6. WILD LIFE
Among the numerous wildlife in the upper part of the Eastern Nile Sub-basin, the Walia Ibex, "Key Kebero" (Ethiopian wolf), and the Gelada Baboon, Menelik's Bush Buck and the Mountain Nyala, are the major ones in the Semien National Park of Ethiopia, which is located in the upper course of the Tekeze-Setite-Atbara Sub-basin. Increased population pressure resulting an increased demand for agricultural land and grazing area, and hunting are among the major problems that put the life of wildlife in danger. The Walia Ibex is endemic to Ethiopia and it is an endangered species, with very few numbers available in the park.
The other problem is encroachment and destruction of wildlife habitats in the Simien Mountains, Shiraro-Qafta Wildlife reserve and wildlife habitats around Humera. Encroachment of Simien Mountains is likely to be more acceleratede than due to the construction of road through the conservation area. The current gold prospecting activities around Sheraro-Qafta may identify suitable extraction sites in or close to the reserve. Labour camps are likely to fell trees for fuel and hunt game for food. Deforestation to make way for irrigation is being carried out by numerous small farmers around the Humera area forcing elephants and other large mammals to migrate to other areas.
The Tekeze River Basin has been a focal point of the Ethiopian Wildlife Conservation Organization (EWCO) due to the presence of Simien Mountains National Park. The ecosystem of the Simien Mountains National Park is unique for its scenery, endemicity and genetic importance of the plants and animals that occupy the habitat. Sheraro - Kafta Wildlife Reserve has a substantial potential for wildlife management, as far as the reserve is less utilized by livestock
The basic problem identified is lack of wildlife database for the basin covering such aspects as distribution, status and movement. Such information requires time and manpower. As wildlife, particularly wild animals are under constant change of distribution and status; the gathering of information requires at least two seasons. Without such a database, wildlife management proposals remain somewhat speculative.
3.7. ECO-TOURISM
The main international tourist attraction in Ethiopia is in the Tekeze sub basin, which is the so-called historic route, a circuit that includes Lake Tana and Gonder (Just outside the basin), Lalibela, Mekele and Axum. This is the best-known and most visited part of Ethiopia by international tourists. The Simien Mountain National Park is another major asset in the sub basin, too (OSI Environment Synthesis Report, p. 24).
However, as the number of visitors to Lalibela increases due to the opening of the airstrip and new road, the pressure on the already non-extent sanitation grows. The foundations of the rock-hewn churches are being eroded by urine. Historic relics are largely unprotected from visiting tourists. Some items in Lalibela and other rock-hewn churches and museums in Axum have been stolen. There is a risk that current proposals for new industries, mines and dam sites may lead to constructions close to cultural heritage sites, possibly causing deterioration.
3.8. LIVESTOCK
Small-scale mixed farming system is dominant in the whole upper course portion of the Tekeze-Setite-Atbara Sub-basin. It accounts for more than 97% of the farm households in this upper course of the sub-basin. Although the proportion of farmers in the whole basin is low, in the lowlands of the northwest of the basin, there are farmers who own cattle and goats in large numbers and who depend totally on livestock production.

51
The Tekeze River Basin cattle are predominantly of zebu type. Five breeds have been identified: Barka (locally called Begait); Arado; Fogera; The Raya-Azebo (locally called Harmo); and Abyssinian short horned zebu. There are also cross-breeds of Holstein-Friesian and locals used for milk production in urban areas. The proportion of oxen (bulls plus castrates) and cows in the total herd is 27% and 31%, respectively.
The primary feed source in the Tekeze River Basin is natural pasture. Crop aftermath is also extensively used. The farmers in many parts of the Dega and Weyna Dega areas collect crop residues to feed primarily to oxen and lacting cows during the dry period. Opuntia ficus (prickly pear cactus), locally called “belese”, serves in the eastern and Southern Zones of Tigray both as human food and livestock feed during normal crop seasons and in case of feed deficits. Since it contains about 90% moisture, it is also utilized as source of water for animals during the dry period. The feed supply from all sources declines in quantity, nutritive value and palatability starting from October and remains very low until the rain starts.
The total dry matter supply in the basin is 20% above the annual maintenance requirement of the grazing animals. The nutrient requirement in terms of energy and portion components, however, shows a deficit of 31% and 3%, respectively.
The extensive livestock production systems are distinguished (i) by the inclusion or not of some rainfed or residual moisture crop production, and (ii) the preponderance of cattle or of camels. The reliance on crop production may in fact change in both the short and long-term due to the high variability of rainfall. Over the past two decades many households have and are still making the transition from pastoralism to agro-pastoralism to sedentarized crop cultivation and vice versa as household and external conditions change. These changes in household production systems are the result of the massive losses in household and community livestock assets during the drought of the early 1980's exacerbated by the increasingly loss of wet season grazing areas and water resources from the big expansion of large-scale semi-mechanized farms during the 1980’s and 90’s. With the restoration of exports to Middle East livestock production makes a significant contribution to the agricultural GDP.
The mainly camel extensive livestock systems are mainly located in the arid and semi-raid northern parts of the Sub-basin although they move their herds southwards as far as the Butana Plains. Babiker Abbas (1995) in a survey of camel herding and ecology identified 4 main types of camel herding strategies based on herd size, feeding strategy, owner's occupation, camel uses and marketing. The first type comprised those herds belong to a single owner, keeping a small number of camels (mean 12 animals) depending mainly on trees and bushes in the riverine areas of the gash, Atbara and Main Nile. Herds are mainly males and are kept for transportation.
The second type comprises large herds (mean 80 camels) belonging to a group of traders or cultivators (mainly Bawadra and Rashaida peoples) who hire one or more keepers. These herd the animals widely across North-eastern Sudan and come to the eastern Butana during the rainy season. A third type is the herds belong to a single owner who is a true transhumant pastoralist graze only on natural browse and pasture. Herd sizes are variable (20 to 2,100 with a mean of 62 camels). The herds use the Butana Plains in the wet season returning in the dry season to their homelands along the Atbara River (Kawahla, Shukryia, Lahawine, Arakakiyeen and Masalamyia) or along the Gash River or to Red Sea Hills (Rashaida)
Data from the FAO Livestock Atlas for Africa are used to derived Map 14 and 15 to show the distribution of cattle, sheep and goats. Unfortunately, the FAO Data does not include camels, which are the most important livestock type in the northern parts of the Sub-basin, although the distribution of sheep mirrors their distribution in the north to some extent.

52
The high densities of cattle in the Ethiopian Highlands and low densities in the Lowlands are readily apparent. In Sudan densities are relatively high along the upper Gash and Atbara as far as the New Halfa and Gash irrigation Schemes, where many irrigating households have substantial livestock holdings. Densities are also relatively higher in the northwest in the Butana Plains.
The distribution of sheep and goats is very different. Sheep are well distributed across the whole Sub-basin, and are well represented even in the north where cattle and goats are absent. Overall densities of sheep are nearly everywhere higher than goats. In Sudan they are the preferred animal for export to the Middle Eastern countries.
Figure 3.4: Tekeze-Atbara Sub-basin: Cattle Densities
Source: FAO (2003)

53
Figure 3.5: Tekeze-Setite-Atbara Sub-basin: Sheep and Goat densities
Source: FAO (2003)

54
3.9. FISHERIES
� Major commercial fish species: According to the Livestock and Fisheries Survey conducted in the basin and the data gathered at the Bureaus of Agriculture and Rural Development in Mekelle and Gonder, the important commercial fish species in Tekeze River Basin are: Oreochromis niloticus, African catfish, Clarias gariepinus, Barbus, barbus intermedius, other Barbus species, and Bagrus docmac. Other species found in the basin presently have no economic value.
� Fishing livelihoods: Most people living along the river courses do fish some time during the year. The small catches of the basin by the fishermen are normally consumed or sold in fresh form. The preservation methods used are sun drying and some times salting. The types of fishing gear that are used in the basin include rod and hook, poisonous plants, cast nets and occasionally small gill nets.
� Fish production: In the upper and mid reaches of the river basin, occasional and part-time fishermen produce 4 kilograms to 1,000 kilograms of fish per year (the lower figures apply to the catches of occasional fishermen). Fish catches with local fishing materials are between 20 and 60 kilograms per year. Gill net catches are in order of 1,000 kilograms per year. In the lower course of the Sub-basin, fishing is a part-time and full-time occupation. The fish catches are higher (up to 3,000 kilograms per year) than those of the highland fishermen, but still insignificant due to the primitive nature of the fishing gear.
� Fish production potential: In the Tekeze Basin, river fishery is not well developed. The rugged natures of the landscape together with the seasonal flow of many streams make it difficult to develop this sector in the highlands. In the lowlands, some of the rivers and streams flow all year round and there is potential to increase fish production. Due to inadequate information on riverine fisheries, the yield potential can only be obtained by extrapolation Based on that, a production potential of 40 – 60 kilogram per hectare per year can be estimated for the lower reaches of the Tekeze River Basin and about 200 kiogram per hectare per year for the upper course.
3.10. MINERAL RESOURCES
In the Tekeze Sub-basin, placer gold is being recovered from numerous small panning sites. It is estimated that several hundred kilograms of gold are recovered annually using this labour intensive method. Resources of gold, which could be exploited by mechanized mining very probably, exist; exploration is needed to indicate which of the known gold occurrences could be profitably mined. Marble and limestone are being quarried from localities south of Adwa and north of Mekele.
There are project proposals for exploration activities to be undertaken in the north east of the basin near Hawzen. Similar activities are currently being undertaken in the northwest prospecting area. The environmental impacts of mining will depend on the type of mining, the chemical processes used and the characteristics of the location. In addition, land taken by the mine, potential negative impacts include depletion of water resources due to over extraction, pollution of water and soil, degradation of landscape, subsidence, dust and noise.

55
3.11. MAJOR ENVIRONMENTAL ISSUES
3.11.1. Water Quality
Except for its high sediment load, water quality, especially away from urban centres is suitable for most uses.
3.11.2. Industrial and agricultural input pollution
These include air pollution in Mekelle from the cement factory, water pollution from the newly constructed Sheba Tannery and the dyeing factories of Tigray.
3.11.3. Water Related Diseases
In the upper course of the sub-basin (largely confined in Ethiopia) four major vector-borne diseases, notably malaria, intestinal schistosomiasis, visceral leishmaniasis (VL) and onchocerciasis are confirmed as being endemic and pose a major challenge to socio-economic development effort in the area. The incidence of malaria and schistosomiasis will increase in areas of ongoing micro-dam construction. Most major settlements in the basin have non-extent or inadequate drinking water supply systems. Sanitation is also inadequate, piped drinking water should be boiled for use.
Mekelle already has a water quality problem due to the chemical composition of the aquifer rocks. At present Lalibela has severe water shortage with daily water cuts. The existing residential areas have few latrines. People defecate on the hills surrounding the town. This has resulted in the pollution of the land underneath the rock-hewn churches in the valley. Sample taken from the churches foundations show evidence of erosion with urine concentrations.
3.11.4. Soil Erosion & Land Degradation
Land degradation refers to degradation of soils and natural vegetation, resulting in a disrupted hydrological equilibrium. Erosion and/or land degradation is generally recognized as the main environmental problem in the Tekeze Sub-basin in particular in the highlands. Land degradation is virtually caused and/or accelerated due to two important factors; human and natural factors and it is related not only to the geographic distribution of natural resources but also to the historical pattern of land use.
Of the natural conditions/factors, two general features have caused high erosion hazards since ages are (1) the erosive character of the rainfall pattern, and (2) the predominantly steep relief in most of the sub-basin areas.
The high erosion is related to the high intensity of rain storms, causing damage particularly at the onset of rainy season when soils are least protected against the impact of rain. Erosion hazard turns in to actual erosion if the protective vegetation cover is depleted.
Development of habitation and land use pattern and related depletion of vegetation resources and land degradation, historically, have different levels as seen from the national and sub-basin/regional perspectives. At the sub-basin/regional level, for longer period of time(it exists even at the present) habitation in the highlands was more preferable than in the lowlands, owing to the highlands having more favourable climate and less suffering from endemic diseases like malaria. Population increase, which has resulted in an increased demand for cultivation land, which in turn has caused massive destruction of forest land and biomass. This has accelerated land degradation in the sub-basin. Sever scarcity of woodlands in the highlands and being as one of the outstanding characteristics for the lowlands today is the reflection of the then mentioned historical habitation pattern in the sub-basin. On the other hand when seen at the national/basin level, largely in the upper course, land degradation, historically, has spread from north to

56
south. The northern highlands of the upper course of EN Basin indeed shows a state of sever degradation as compare to the highlands in the southern portion of the upper course of the EN Basin, which could be the combined effect of longer lasting pressure on resources in a more fragile (drier) environment. In the northern portion originally, the highland plateau was covered by Juniperus, Olea, and Cordia, alternating with mixture of Acacia-Andropogon savannas, and by edaphic grasslands and swamps in flat valley bottoms. By centuries of continuous abuse, these lush conditions have been converted into the almost barren plateau which exists today, where forest and natural woodland is virtually confined to small areas around churches and holy places, and destructive high winds blow over the bare lands.
As seen at the local level in the sub-basins, settlement and cultivation have first concentrated in highland plains, on plateaus and on gentle foot-slopes, all sites with suitable fertile soils and low erosion hazards. Sustained usage of land resources was possible because of the relative abundance of fertile soils and the possibilities of shifting cultivation and fallow periods being sufficiently long to allow regeneration of soil productivity. Fuel and timber were available in abundance and could be collected from the direct surroundings. With gradually increasing population, both the possibility of shifting cultivation within areas of low erosion hazard and the length of fallow periods have decreased. At present, highland plateaus and plains are fully under cultivation (or grasslands and are completely deforested. Fuel and timber have to be collected from other areas with a much higher erosion hazard, notably, steep hill sides and valley sides bordering plateau.
Soil degradation in terms of fertility loss and erosion has come into the picture in the process and decrease in productivity could be compensated for by expansion of the cultivated land area and by increasing management inputs such as weeding and more frequent cultivation/ploughing. Consequently, initially low but gradually increasing land degradation rates, i e. in the form of erosion, probably remained unnoticed.
Factors underlying land degradation: In the Tekeze Basin, food production, livestock feed and fuel requirements put competing demands on scarce and vegetation resources. The Tekeze Basin has been a process of gradual degradation of land and vegetation under population pressure and inadequate management of natural resources. An analysis of scarcity and degradation of resources in the studied 42 PAs showed that pressure on resource is strong or critical in 31 PAs and low or moderate in 11 PAs. Most of the latter are situated in the western lowlands of the basin. (OSI Water Synthesis Report, Forest Land, p. 146)
Two important phenomena must have been the main causes for crossing critical thresholds of natural regeneration of resources: (1) the increasing demand for land that has forced the farmers to expand cultivation onto steeper land being much more susceptible to erosion; and (2) the increasing demand for fuel and timber, which has caused large scale deforestation at a rate increasing beyond natural regeneration and the indiscriminate cutting has long been coupled with very little replacement effort.
Shortage of land has also had its repercussion on livestock husbandries. Most of the suitable land is reserved for crop production. Grazing of cattle is limited to hydromorphic valley bottom lands to marginal deforested hill slopes and to a limited number of enclosures within the cropland reserved for grazing.
Land degradation in the Tekeze Watershed is distinguished between physical, chemical and biological soil degradations, water and wind erosion, and mass movement (Barber, 1984). Chemical degradation refers to the leaching and removal of nutrients and the buildup of toxicity other than those due to excess salts. Physical degradation includes those processes which adversely affects soil physical properties such as infiltration rate, structural stability, root penetrability and permeability. Biological degradation refers to

57
processes which accelerate humus mineralization rates, and reflect the moisture/temperature regimes of the environment and land use practices.
Water erosion in the form of sheet, rill and gully erosion is the most intensive and widespread form of land degradation and also recognized as the main environmental issues in the sub-basin. Rill and gully erosions are more spectacular because more evident features are formed during much shorter periods, generally during one season, and even as a result of one exceptional rain storm or a few storms at short intervals.
Stream bank erosion is one of the striking features of the land degradation in the sub-basin. By far the greatest majority of natural drainage routes in the areas are actively eroding. Highly variable rainfall (high hydrologic variability, due to sever environmental degradation) that produces seasonal high peak river flows exceeding the channel capacity of the drainage routes; destroy the protective role of vegetation. Intensive deforestation actions within the watershed, that causes the depletion of riverine forest or bushes also eliminates the protective capacity of vegetations, is the other factor enhancing stream bank erosion in the watershed.
Above all land topography plays important role for land degradation in the watershed. Nearly 30% of the upper course of the Sub-basin is identified to have land slope exceeding 30% and about 25% has land slope that ranges from 15% to 30%. Due to cultivable land shortage resulting from land degradation and population pressure, these steeply sloping areas are intensively cultivated, aggravating land degradation events in the Sub-basin. Research activities in soil loss are rare in the Sub-basin. Very few attempts indicate soil loss in the watershed ranges from 17 tones/ha per year to 33tone/ha per year. Landownstreamoil degradation in the watershed has caused an average loss of 3% in agricultural produces (Tekeze Master Plan Studies, May 1998).
3.11.5. Pests and Weeds
Regular crop yield loss caused by various pests such as weeds, diseases, insects, rodents and birds are common. The existing weed control measures are limited to hand weeding, commonly performed quite late after crop emergence. Farmers do not use herbicides. Single weeding is the common practice in all cereals, except teff, which gets more attention. Diseases such as rust, smut, scald and blotch are reported to cause damage to various crops, virtually no measures are taken by peasant farmers to control these diseases. Insects are the major pests in the area. They cause a substantial damage on different crops. However, only a very limited number of farmers use Malathion in order to control insect pests like armyworm and grasshoppers. Due to inadequate and/or delayed supply and poor technical know-how of farmers, the present efficiency of pesticide use by peasant farmers is quite low.

58
4. HYDROLOGY AND WATER INFRASTRUCTURE
4.1. SURFACE HYDROLOGY General description: The Tekeze-Atbara Sub-basin comprises two major catchments covering the Ethiopia north-western highlands (Tekeze River-basin) and the Sudanese south-eastern lowlands (Atbara River Basin). This sub basin, like the other sub basins of the Eastern Nile, originates from the Ethiopian highlands north of Lake Tana and flows westward into the Sudan joining the Nile as its last tributary at the town of Atbara. The Tekeze River Basin includes the River Tekeze (610 kilometres length and 68,751 square kilometres basin area), the River Angereb (220 kilometres length and 14,750 square kilometres basin area) and the River Goang (130 kilometres length and 6500 sq. km basin area) (TBIDMPP, 1998; quoted by Hussein and Yared, 2003). (OSI Socioeconomic synthesis report, p.130)
Sub-basin area: The Tekeze-Atbara Sub-basin covers an area of 227,128 sqaure kilometers (including the Mereb-Gash basin). This sub-basin extends from the north-western Ethiopia to the lowlands of Sudan, meeting the Main Nile approximately 285 kilometres downstream of Khartoum.
River system: In Ethiopia, the Tekeze River travels more than 750 kilometres from its source near Lake Ashange to the border with Sudan. In Sudan the river extends another 575 kilometres in a north-westerly direction. The sub basin contributes an estimated 6.5% of the Nile River flow and the chemical quality of surface water is excellent, both for drinking and irrigation. The three main rivers and their tributaries in the Tekeze Sub-basin are in Table 4.1.
Table 4.1: Main Rivers of Tekeze Sub-basin
River Basin Major River Major Tributary River
Tekeze Tekeze Zamra, Tserare, Gheba and Worie, Insia and Zarema
Angereb Angereb Kaza
Goang Goang Gendua
Source: Ministry of Water Resources (Ethiopia)
Influencing areas: The Tekeze Sub-basin consists of three main influencing areas: (1) Tekeze up to Humera, which is an area of 63,376 square kilometres (of which 4,070 square kilometres in Eritrea); (2) Angereb up to Abderafi, an area of 13,327 square kilometres and (3) Goang up to Metema, which is an area of 6,694 square kilometres.
Drainage: Drainage in to Sudan is 3,113 square kilometres, of which 90 square kilometres in Eritrea. The total area is 86,510 square kilometres and 82,350 square kilometres without Eritrea. Compared with the drainage network in Ethiopia, the Sudanese portion of the Tekeze-Atbara Watershed is characterized by a very low density of watercourses except in the south-west along the Blue Nile watershed where there are numerous intermittent khor channels.
River flows at boundaries: Estimated river flows at the boundaries are given in Table 4.2

59
Table 4.2: Estimated river flows at national boundaries
Tekeze (Humera) 5,875 Million cubic metres
Angereb (Abderafi) 1,454 Million cubic metres
Goang (Meterna) 862 Million cubic metres
Total 8,191 Million cubic metres
Major rivers and tributaries: The Tekeze-Setite-Atbara Sub-basin has three major rivers originating from the central north and north western highland plateaus of Ethiopia: (1) the river called Tekeze in Ethiopia and Setite in Sudan, (2) the river Angereb, and (3) the river called Goang in Ethiopia and Atbara in Sudan. From its source, a spring around Lalibela in North Wollo region in Ethiopia, the Tekeze River traverses a distance of about 750 km to the Ethio-Sudan border.
The major tributaries of Tekeze that originates from the north-western highlands of Ethiopia are the Zarima, Tserare, Gheba, Wori and Mena. In the highland portions of the watershed, the river bed slope is higher (>1.5%), which gradually decreases to 0.3% in the lowlands of Ethiopia and further reduces to less than 0.1% in the Sudan lowlands.
Angereb River starts in the Wegera (north Gondar) highland plateau that rises at an altitude of above 2,500 masl as part of the north-western highlands of Ethiopia and flows down to 700 masl at the Ethio-Sudan border, which further descends down to less than 500 masl at its 162 mouth in the Sudan. At the Ethio-Sudan border it covers an area of 13,300 square kilometres. It starts in the Wegera highland plateau in North Gonder that lies at an altitude of above 2,500 masl and traverses to the west for 220 km at the border at an altitude of about 500 masl. The river bed runs at an average slope of 1.3%. The Kaza River is the major tributary joining Angereb close to the border. The watershed area of Goang River at the border is reported to be 6,700 square kilometres. It starts in the north-western highland plateaus of Ethiopia near Chilga that rises at an altitude of above 2000 masl and flows to the west for about 130 km at the border. In the Sudan it is named as Atbara.
The Tekeze-Setite-Atbara total sub basin area at Atbara is estimated at 230,000 square kilometres indicating about 40% of the basin lies within the Ethiopia border. Tekeze at Embamadre (upper course of the sub basin), Tekeze at Humera, Atbara at Khasm-el-Girba and Atbara at Atbara are important nodes in the sub basin where flow measurement is made.
Table 1.3: Tekeze-Setite-Atbara Sub-basin: Major Catchments
3rd Order Catchment Area (km²) % of total Sub-basin area
Main Nile Junction 5,357 2%
Eastern Khors 23,117 10%
Northwestern Khors 4,339 2%
Western Khors 14,381 6%
Mereb-Gash 32,567 14%
Lower Main Atbara 23,853 11%
Upper Main Atbara 23,780 10%
Upper Atbara 30,908 14%
Tekeze-Setit 68,827 30%
TOTAL 227,128
Source: Basin boundaries: Ethiopia MWR (Addis Ababa) and Sudan: Visual interpretation (from CRA Transboundary Report, 2007)

60
Contribution to the Nile System: The sub-basin is estimated to contribute about 12 billion cubic metres of water every year to the Nile system at Atbara.
Watersheds: The Tekeze-Setite watershed starts in the central north highland plateaus of Ethiopia at an altitude of above 3,000 masl and descending down to Humera less than an altitude of 800 masl at the Ethio-Sudan border, which also goes down to less than 500 masl at its mouth in the Sudan. At Ethio-Sudan border, this watershed covers an area of 63,375 square kilometres of which 4,214 square kilometres are in Eritrea. The Tekeze River has the Ras Dashen mountain chain (4,620 masl) in its watershed. About 70% of the area in Ethiopia lies in the highland (above 1,500 masl) and some 40% of its watershed is reported to have an altitude of above 2,000 masl (Tekeze Master Plan Project, Vol, VII, May 1998).
Watersheds: The sub-basin can be sub-divided into nine 3rd order and 69 6th order watersheds using the Pfafstetter system based on the topology of the drainage network and the drainage area (Verdin, 1997), and data from the USGS/EROS gtopo30 HYDRO1k data set published by UNEP/DEWA/Grid (Table 4.3).
Table 4.3: Tekeze-Atbara Sub-basin: Areas of Third order catchments (km²)
3rd Order Catchment Area (km2) % of total Sub-basin area
Main Nile Junction 5,357 2%
Eastern Khors 23,117 10%
Northwestern Khors 4,339 2%
Western Khors 14,381 6%
Mereb-Gash 32,567 14%
Lower Main Atbara 23,853 11%
Upper Main Atbara 23,780 10%
Upper Atbara 30,908 14%
Tekeze-Setit 68,827 30%
227,128
Source: Basin boundaries: USGS/gtopo30/HYDRO30
4.2. RUNOFF 4.2.1. Tekeze at Embamadre This watershed covers the highland portion of the Tekeze Watershed (70%) at Humera/border. Flow records from 1980 to 2000 show that the mean annual flow at this node averages 5.40 bm3, and accounts for 45% of the sub-basin flow at Atbara. Hydrologic variability for the wet period is 50% and for the dry period it exceeds 100%, while it is 36% for the annual series (Figure 4.1). This highly pronounced hydrologic variability (compared to the Blue Nile sub-basin) has a considerable impact on water investment downstream.

61
Figure 4.1: Annual Runoff Series, Tekeze River at Embamadere station
7434.19
2525.67
10345.72
2432.54
9250.17
5412.67
0.00
1000.00
2000.00
3000.00
4000.00
5000.00
6000.00
7000.00
8000.00
9000.00
10000.00
11000.00
1967
1969
1971
1973
1975
1977
1979
1981
1983
1985
1987
1989
1995
1997
Recording Periods (Years)
Annua
l F
low
(m
cm
)Annual Total (mcm)
Mean Annual(mcm)
Source: Ethiopian Ministry of water resources
Also, rainfall variability in this area of the sub-basin is quite high with the annual series being greater than 35% and being more than 70% in the sowing season (Table 4.2).
Figure 4.2: Mean monthly runoff, Tekeze River at Embamadere Station (1976-2000)
14
2
147
12
7
13
8
95
73
54
37 59 107
13
3
13
4
0
500
1000
1500
2000
2500
3000
JAN FEB MAR APR MAY JUN JULY AUG SEP OCT NOV DEC
Seasons (months)
Mea
n M
on
thly
Flo
w (
mcm
0
VI(%)
Mean monthly (mcm)
Source: Ethiopian Ministry of water resources

62
4.2.2. Tekeze at Humera, Setit & Khasm-el-Girba Stations Flow measurement has been run at the Khasm-el Gurba station since 1960. The mean annual flow for eleven years averages 5.12 bm3, at 28% hydrologic variability of the annual series (Figure 4.3). The Tekeze Integrated Master Plan Project (Vol-VII, May 1998) estimates the flow at Humera for years 1981 to 1986 to average 5.16 bm3 with a hydrologic variability of 28% for the annual series (Table 4.3).
Figure 4.3 Runoff Seasonal Distribution & Variability, Tekeze River at Humera Station (1980-90) 1
47
16
7
13
9
74
79 96
57
49 62 81 12
2
20
5
0
500
1000
1500
2000
2500
3000
JAN FEB MAR APR MAY JUN JULY AUG SEP OCT NOV DEC
Season (months)
Me
an
Mo
nth
ly F
low
(m
cm
) VI(%)
Mean Monthly Flow (mcm)
Source: Ethiopian Ministry of water resources
Figures for 1980 (8.1 bm3) and 1981 (7.9 bm3) stand out from the other years (1982-90), which average 4.5 bm3 and, as a result, the mean flow for 1982-90 is lower than the average. Hydrologic variability for seasonal flow is considerably high, averaging 66% in the wet season (June-September) and more than 100% in the dry season (Figure 4.4).
Figure 4.4: Annual Runoff Series for Tekeze River at Humera Station
4418.88
8051.57
4077.46
5118
0
1000
2000
3000
4000
5000
6000
7000
8000
9000
1980 1981 1982 1983 1984 1985 1986 1987 1988 1989 1990
Recording Period (Years)
Annual Flo
w (m
cm
)
Annual Total (mcm)
Mean Annual (mcm)
Source: Ethiopian Ministry of water resources
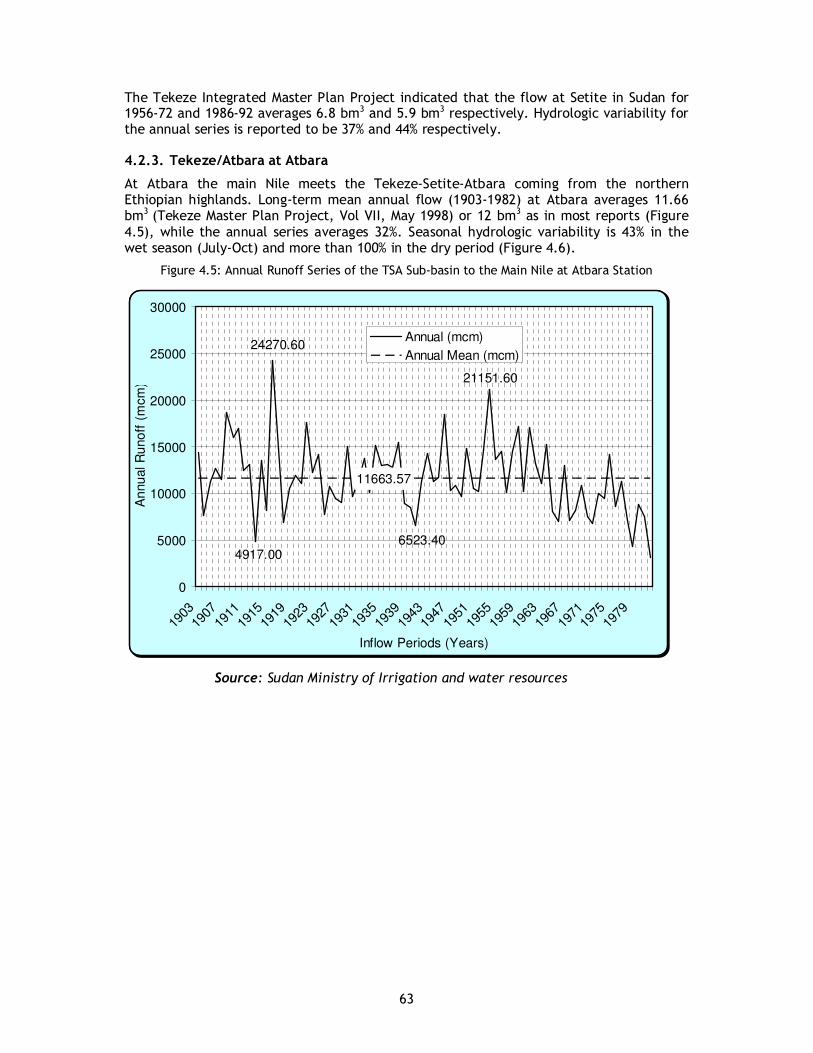
63
The Tekeze Integrated Master Plan Project indicated that the flow at Setite in Sudan for 1956-72 and 1986-92 averages 6.8 bm3 and 5.9 bm3 respectively. Hydrologic variability for the annual series is reported to be 37% and 44% respectively.
4.2.3. Tekeze/Atbara at Atbara At Atbara the main Nile meets the Tekeze-Setite-Atbara coming from the northern Ethiopian highlands. Long-term mean annual flow (1903-1982) at Atbara averages 11.66 bm3 (Tekeze Master Plan Project, Vol VII, May 1998) or 12 bm3 as in most reports (Figure 4.5), while the annual series averages 32%. Seasonal hydrologic variability is 43% in the wet season (July-Oct) and more than 100% in the dry period (Figure 4.6).
Figure 4.5: Annual Runoff Series of the TSA Sub-basin to the Main Nile at Atbara Station
4917.006523.40
21151.60
24270.60
11663.57
0
5000
10000
15000
20000
25000
30000
1903
1907
1911
1915
1919
1923
1927
1931
1935
1939
1943
1947
1951
1955
1959
1963
1967
1971
1975
1979
Inflow Periods (Years)
An
nu
al R
uno
ff (
mcm
)
Annual (mcm)
Annual Mean (mcm)
Source: Sudan Ministry of Irrigation and water resources

64
Figure 4.6: Runoff Seasonal Distribution & Variability, Tekeze River at Atbara Station (1903-82)
156
265
401 567
369
165
45
31
42
53 77
94
0
500
1000
1500
2000
2500
3000
3500
4000
4500
5000
5500
6000
Jan Feb Mar Apr May Jun Jul Aug Sep Oct Nov Dec
Seasons (months)
Month
ly M
ean F
low (m
cm
)/VI(%
)
VI(%)
Mean Monthly Flow (mcm)
Source: Sudan Ministry of Irrigation and water resources
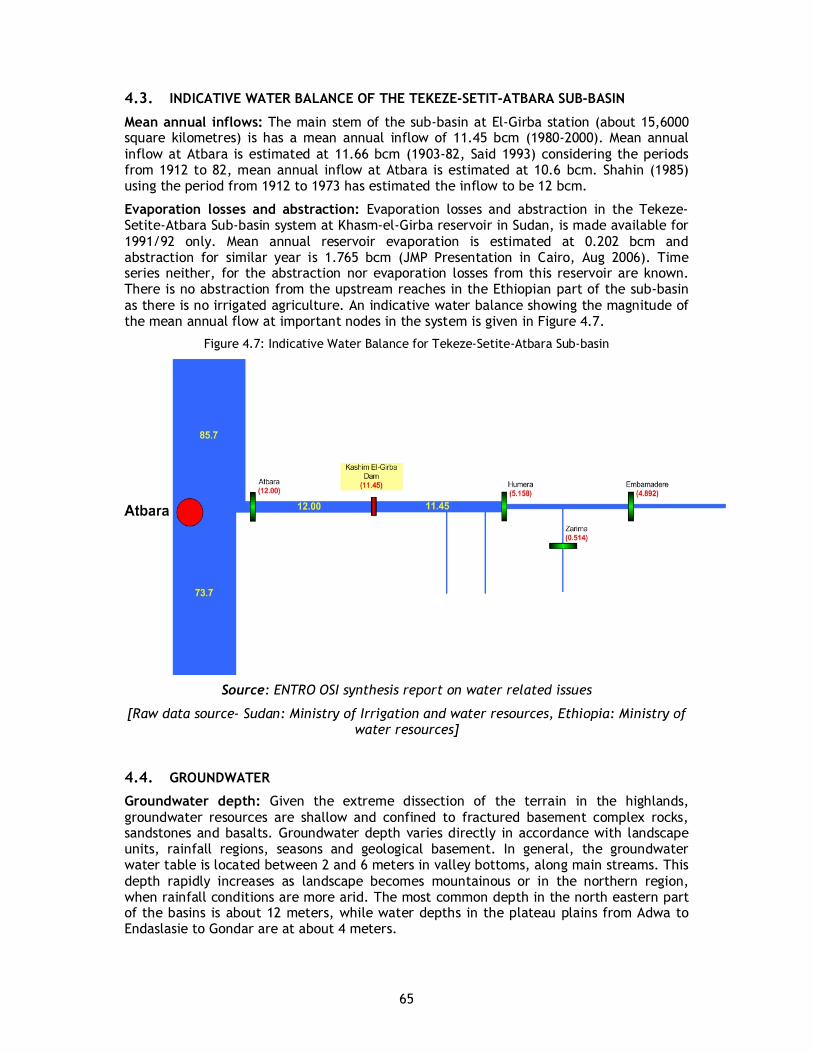
65
4.3. INDICATIVE WATER BALANCE OF THE TEKEZE-SETIT-ATBARA SUB-BASIN Mean annual inflows: The main stem of the sub-basin at El-Girba station (about 15,6000 square kilometres) is has a mean annual inflow of 11.45 bcm (1980-2000). Mean annual inflow at Atbara is estimated at 11.66 bcm (1903-82, Said 1993) considering the periods from 1912 to 82, mean annual inflow at Atbara is estimated at 10.6 bcm. Shahin (1985) using the period from 1912 to 1973 has estimated the inflow to be 12 bcm.
Evaporation losses and abstraction: Evaporation losses and abstraction in the Tekeze-Setite-Atbara Sub-basin system at Khasm-el-Girba reservoir in Sudan, is made available for 1991/92 only. Mean annual reservoir evaporation is estimated at 0.202 bcm and abstraction for similar year is 1.765 bcm (JMP Presentation in Cairo, Aug 2006). Time series neither, for the abstraction nor evaporation losses from this reservoir are known. There is no abstraction from the upstream reaches in the Ethiopian part of the sub-basin as there is no irrigated agriculture. An indicative water balance showing the magnitude of the mean annual flow at important nodes in the system is given in Figure 4.7.
Figure 4.7: Indicative Water Balance for Tekeze-Setite-Atbara Sub-basin
Source: ENTRO OSI synthesis report on water related issues
[Raw data source- Sudan: Ministry of Irrigation and water resources, Ethiopia: Ministry of water resources]
4.4. GROUNDWATER Groundwater depth: Given the extreme dissection of the terrain in the highlands, groundwater resources are shallow and confined to fractured basement complex rocks, sandstones and basalts. Groundwater depth varies directly in accordance with landscape units, rainfall regions, seasons and geological basement. In general, the groundwater water table is located between 2 and 6 meters in valley bottoms, along main streams. This depth rapidly increases as landscape becomes mountainous or in the northern region, when rainfall conditions are more arid. The most common depth in the north eastern part of the basins is about 12 meters, while water depths in the plateau plains from Adwa to Endaslasie to Gondar are at about 4 meters.

66
Storage capacity: Water yields in these basins range from 0.1 to 10 l/s, with mean values of about 2.6 l/s. The absence of uniform permeable sediments extending over large areas implies that extensive good aquifers do not exist in the basins of the Tekeze, Angereb and Goang Rivers. Instead, exploitable groundwater occurrence is limited to isolated areas where groundwater potential may be the result of faulted and fractured zones in the rocks and weathered rocks. About 70 % of the total area of the basins is covered by non-porous volcanic and Precambrian rocks. The remaining part consists of Mesozoic limestones, shales and sandstones of Antalo group and Jurassic Adigrat sandstone. Only some minor Quaternary alluvium exists in the western lowlands. Except for the Quaternary alluvium and tuff deposits, the storage and transport of the groundwater in all these rocks is limited and restricted to the faults, fracture joints and fissures. This means that water is transported not through primary porosity (as this is already filled up with cement of silica, calcium or other minerals), but through tectonic and karst features, broken dykes and dolerites. In the Lowlands a quantitative assessment of groundwater in the Showak area give a storage capacity of the upper Nubian aquifer as 840 million cubic metres and the safe yield is estimated at 8.4 million m3. In the second major aquifer located in the Neogene-Recent Deposits ("Unconsolidated Sediments" in Map 4) 1km away from the banks of the Setit and Atbara Rivers the storage capacity is estimated at 222 million m3 and the safe yield of 11.2 million cubic metres.
Water Point Inventory: An extensive Water Point Inventory (WPI) has been carried out in the basin, during which discharge –draw down data have been collected. Based on of this inventory, it can be stated that the basin has aquifers/formations with very low productivities except high and medium productive areas concentrated around Mekele and Hagere Selam (Agula Shale, Antalo Limestone and Tertiary Dolerite formation). The WPI included 720 water points, out of an estimated 1,000. It is assumed that an average of 2.69 l/sec is extracted from each well during 8 hours per day; then the total extraction per year is 28 Mm3, a fraction of the total annual recharge from rainfall, estimated to be at least 2,500 Mm3. if a safe extraction factor of 15% is adopted, 375 mm3 can be extracted in the basin annually.
Ground water quality: The quality of ground water is usually better than surface water. Groundwater is to be found everywhere in the sub basin, but the art of locating a productive well site is to strike a groundwater bearing and conveying fracture system. Results of the water point inventory indicate that most wells (77 %) have only one water entry (fault or fracture) in the borehole from where water is pumped. Such entries are not easy to find. Exceptions are the limestones near Mekele, which have a well-developed system of fissures (dissolved pathways). The quality of this water is not very good. Other good locations are areas near large (dry) riverbeds (bank infiltration). If no groundwater can be found, surface water runoff is the only alternative
4.5. EXISTING WATER RESOURCES INFRASTRUCTURES 4.5.1. Dams and Reservoirs The Khasm-el-Girba located downstream of the Angereb-Goang-Tekeze confluence in Sudan is the only existing reservoir in the Tekeze-Setite-Atbara system. The dam was built in 1966 in the Atbara main stem at initial storage capacity of 1,300 mcm.
The watershed of Atbara at this station is estimated at 230,000 square kilometres with mean annual inflow of 11.65 bm3. The Girba reservoir is built for irrigation and hydropower purposes. By the year 1992 the storage capacity was reduced to 560 mcm Sudan OSI water Component Report, May, 2006), the balance (740 mcm, 57% of its entire capacity) being filled with sediment, indicating mean annual sediment inflow to the reservoir is in the order of 28.5 mcm.

67
4.5.2. Irrigation Infrastructure New Halfa scheme (146,138 ha) and New Halfa sugar scheme (22,569 ha) are the two large scale irrigation projects in the sub-basin both fed from the El-Girba reservoir in Sudan (Water Watch, August, 2006). Current irrigation practice in the upstream reach of the system is almost non-existent.
4.5.3. Hydropower Generation and Transmission Currently only Girba Dam in Sudan has hydropower plant in the system with installed capacity of 12.5 MW. In the upper course no existing hydropower plant is available.
4.6. Identified Potential Water Resources Infrastructure Hydropower Potential: The upper course of the Tekeze-Setite-Atbara Sub-basin, by virtue of its topography, has considerable hydropower potential. Rivers are quite steep and some have deep gorges, which make ideal dam sites. However, high dams and large reservoirs are required to produce sufficient firm power. The total potentially generated firm energy of the basin is 4,117 GWh/year (OSI Water synthesis report, pp. 21-22). During the master plan studies of the Tekeze Basin in Ethiopia, the hydropower potential of this sub-watershed was estimated at 8,970 GWH/year. From the total potential, eleven hydropower sites are identified, located in the main stem (eight) and three major tributaries , namely Tserare, Angereb and Goang Sub-watersheds. Out of these identified projects only three are found eligible for the master plan level investigations, all located on the main stem of the Tekeze River. These three dams, TK-04A, TK-04B and TK-05 (under construction currently), are designed for installed capacities of 168 MW, 85 MW and 203 MW respectively (Tekeze Master Plan Study, May 1998). TK-05 is planned to be commissioned by the year 2009.
Irrigation: In the Tekeze Sub-basin, large-scale irrigation potential created by impounding water in large dam in the lower reaches of the river has been calculated on the bases of data on mean annual regulated flow from reservoirs in the Tekeze, Angereb and Goang/Gendua Rivers.
� Tekeze 152,700 ha � Angereb 23,200 ha � Goang/Gendua 13,600 ha
Total 189,500 ha
The major part, 82% of the basin, is not suitable for irrigation. In the first place, because of a too high slope gradient (s), this is the most limiting factor for this land use, accounting for 73% of the basin. The other problems are the rooting conditions, which are limiting for crop growth and for drainage of the irrigated lands. This limitation accounts for 68% of the basin.
About 5% of the Tekeze Sub-basin is highly suitable for irrigated agriculture. Most of the suitable areas are found in the western lowlands, but also they occur around Shiraro and Arbaya. Moderately and marginally suitable lands cover 12% of the sub basin. It should be mentioned here that the availability of water is not taken into account. These moderate and marginally suitable lands can be found in the western lowlands, east of Adi Ramets, near Shiraro and north of Mekele. If water is available, some small-scale irrigated agriculture can be practised in these regions.
The Tekeze Sub-basin has the potential to expand and develop irrigated agriculture. Small-scale schemes are appropriate for peasant farming, medium-and large-scale schemes for (commercial) agricultural undertakings and enterprising settlers. Large

68
investment and high level of technical knowledge will be important inputs. Traditional irrigation needs to be expanded and supported to play its role in crop production.
Irrigated agriculture potential at the foothills of the Ethiopian highland plateaus is significant. Projects identified during the master plan (Tekeze Master Plan study, May 1998) study indicate the low-lying area of the Humera Plain has a potential of more than 200,000 hectares for irrigated agriculture development. Furthermore, in the lower reach of the system (in the Sudan) land potential for expansion is significant (though it is not reported in the OSI water component of Sudan. Irrigated agriculture potential in this upper course of the sub-basin is estimated at 300,000 hectares Potential for irrigated agriculture development in the downstream reach is significantly high.
If enough sites for micro-dams in the upper and middle catchments can be found; 1,500 dams each storing one million cubic metres have been foreseen. These can provide supplementary irrigation on a small-scale basis to 450,000 hectares of cropland in the wet season and to 112,500 hectares in the dry season. The reconnaissance soil survey cannot confirm whether suitable land in such amounts is available. However, estimate of the SAERT and SAERAR projects indicate that the above figures are not out of range of reality.
Table 4.4: On-going small-scale irrigation development schemes in Tigray Region of Ethiopia
Zone District Scheme Ha Stage Responsibility
South Adi Gudom Kuiha
Gum 30 Arato
100 100
Construction SAERT SAERT
East Wonberta Agula
Era Wukro
100 100
Construction SAERT
Central
Lailay Maychew Tembien Worie-leke
Abergelle
Mai Neguse Adha Seguha
Agbe
100
100 30
30
Construction
Operational Construction
SAERT
REST REST
West Adi daero Enda Mariam 30 Construction SAERT
Source: Agronomy survey 1995
Table 4.5: On-going small-scale irrigation development schemes in Amhara Region of Ethiopia
Zone District Scheme Ha Stage Responsibility
Wag Hemra Sekota May Lomi Mahabere Genet
50 60
Construction SAERT SAERT
North Gonder Belesa Zana Atelkaina
65 50
Feasibility SAERT
Source: Agronomy survey 1995
Regarding large-scale irrigation, three projects have been proposed:
• Humera, with a gross (net) irrigable area of 50,500 (42,965) ha;
• Angereb, with a gross (net) irrigable area of 13,592 (11,561) ha;
• Metema, with a gross (net) irrigable area of 19,276 (16,385) ha
Priority crops for irrigation are potato, lentil, bean, onion and vegetables in the highlands; chickpea, vegetables and fruit trees in mid-altitudes; sesame, cotton, groundnut, sugar cane and vegetables in the lowlands. Cereals as barley, wheat, maize and sorghum may be grown, preferably under supplementary irrigation, but they may not give large enough returns to be economical.

69
Currently, irrigated agriculture in the sub basin has not yet been developed. The existing practice is entirely dependent on traditional irrigation (diversion and spate) systems, which have both limited area coverage and low yield levels.
The existing irrigation practices are dominated by traditional and inefficient practices and both area coverage and productivity are at low levels. The current area coverage is not more than 10,000 hectares; as virtually no external inputs and improved water management practices are adopted by the farmers. Recently, encouraging efforts on irrigation development have been made in both regions. However, due to inadequate planning and inefficient implementation, irrigation has hardly been started even in several completed irrigation schemes.
Water demand: In 1995, water demand in urban areas was estimated at 35 lcd and in rural areas at 20 lcd. With the improvement of the water supply infrastructure, these figures have been estimated in the year 2030 to increase to 60 lcd in urban and30 lcd in rural areas. Total demand in 1995 is 37 Mm3 (1.2 m3/s) and in 2030 173 Mm3 (5.5 m3/s), figures that are small compared to the total outflow of the basin of 8,191 Mm3 (260 m3/s) also when an estimated 30% for non-domestic uses is added (OSI Water synthesis report, pp. 21-22).
Potential uses: With construction of dams and reservoirs (with heights over 15 metres), water resources of the sub basin may have a potential for irrigation, drinking water supply and hydropower generation. Less likely purposes in the Tekeze Sub-basin are fishing, tourism and navigation.
70
5. ANNOTATED BIBLIOGRAPHY
5.1. INTRODUCTION
The purpose of this list is to provide an overview of some of the sources of social, hydrological and environmental data for the Tekeze-Atbara Sub-basin of the Eastern Nile. These data sources have been used for a wide array of purposes by a wide array of government, private and university entities. Thus the use of any secondary material should be approached from a user-beware perspective. While some of the works have been consulted in the preparation of this inventory on the socio-economic theme, the list is not exhaustive and there no doubt exists sources that have not been included. However the list does include some of the most recent references on the Ethiopian side of the 'sub-basin population. Reference materials on the on the Sudanese portion of the sub-basin is very scanty and future research should be able to fill the existing gap.
Most of the references listed here can be accessed from government, private and university institutions of the respective sub-basin countries, namely Ethiopia, and Sudan. Some data sets (national population census reports) can be available in soft copies or a few are on-line resources. Users are advised to contact the relevant/ affiliate institutions where the data is likely to be stored or housed. The listed references are organized into the following categories: institution/regulatory regimes, population characteristics, occupation and employment, social and physical infrastructure. Each category is preceded by a brief description of the nature of information contained under the listed annotated bibliographies.
5.2. REGULATORY REGIMES GOVERNING NATURAL RESOURCES
The works listed below cover information on different land tenure regimes and also recent attempts to reform land tenure regimes.
Amhara National Regional State (2000). Proclamation Issued to Determine the Administration and Use of Rural Land in the Region. Proclamation No 46/2000 Zikre Hig. Bahir Dar.
Bauer, Dun (1973). Land Leadership and Legitimacy among Inderta Tigray of Ethiopia. Rochester, University of Rochester (Ph.D. Thesis)
Bruce J. W. (1976) Land Reform Planning and Indigenous Communal Tenures. A Case Study the Tenure “Chiguraf-gwoses" in Tigray, Ethiopia. Madiso, University of Wisconsin (PhD Thesis)
Dejen Negassa (2001) The Implementation of State Policy on Land Pressure and Intra-Household Relation: The Case of South Wollo. MA Thesis in Social Anthropology, AAU.
HOBEN, Allan (1966). Land Tenure and Social Mobility among the Amhara, Conference III, 1966 (69-87).
Mitiku Haile, Eyasu Yazew and Gimay Tesfaye (2001) Land Tenure and Plot Size: Determination Issue in Small Scale Development in Tigray, North Ethiopia. Paper presented at a Workshop of Current Issue on Land Tenure in Ethiopia, Addis Ababa, Ethiopia April 6-7,2001
Tigray National Regional State [1997]. Proclamation to Define Land Use of Tigray National Regional State. Proclamation No 23/1989 (EC), Neghrit Gazeta. Mekale.

71
5.3. POPULATION CHARACTERISTICS
The following sources provide information on population size and distribution by age and sex at regional levels classified by rural and urban place of residence, total population of urban and rural areas (by Awrajas, weredas and kebele or Peasant Associations) actual and projected distribution of population size by age, sex and place of residence. These reports also contain sex ratios by five-year age groups for urban and rural areas at regional level for the year 1984 and by different religious groups. These reports also contain number of deaths by sex and age group, crude death rates, age specific death rates by sex and urban and rural place of residence at regional level for the year 1984. Abridged life table, children dead and surviving, estimates of infant and childhood mortality levels along with implied life expectancy derived using different methods are also provided in the reports.
The reports also contain population size and distribution by age and sex at regional, zonal, wereda and kebelel levels classifies by rural and urban place of residence for the year 1994. The reports indicate actual and projected population size on the basis of the census enumeration. These reports also contain sex ratios by five-year age groups and place of residence at regional level for the year 1999. The reports also provide projected population size for each of the years during 1995 to 2030 for total population classified by sex and place of residence. Projected population by five-year age group is also provided for 1995 to 2000 every year, but every five years then after.
Some of the reports contain numerical and percentage distribution of major ethnic groups (10,000 population or more) and religion affiliations by age, sex and place of residence at regional, zonal and wereda levels and some of the towns with large population size. The reports also contain level of migration by sex and place of residence, stream of in- and out- migration rates by place of residence and sex. It also presents forms of migration by sex and place of origin for the year 1984. Information, however, is available at the then administrative region level.
Office of the Population and Housing Census Commission (1990). Population and Housing Census 1984. Analytical Report on Gonder Region, Central Statistical Authority: Addis Ababa.
Office of the Population and Housing Census Commission (1990). Population and Housing Census 1984. Analytical Report on Tigray Region, Central Statistical Authority: Addis Ababa.
Office of the Population and Housing Census Commission (1990). Population and Housing Census 1984. Analytical Report on Wello Region, Central Statistical Authority: Addis Ababa.
CSA (1996). The 1994 Population and Housing Census of Ethiopia. Results for Tigray Region. Vol I: Part I. Statistical Report, Central Statistical Authority: Addis Ababa, pp 13-26.
CSA (1995). The 1994 Population and Housing Census of Ethiopia. Results for Amhara Region. Vol. I. Statistical Report, Central Statistical Authority: Addis Ababa, pp 11-16.
CSA (1998). The 1994 Population and Housing Census of Ethiopia. Results for Tigray Region. Vol. II. Analytical Report, Central Statistical Authority: Addis Ababa.
CSA (1999). The 1994 Population and Housing Census of Ethiopia. Results for Amhara Region. Vol. II. Analytical Report, Central Statistical Authority: Addis Ababa.
CSO (1976 to 1984)
CSA (1985 to 2004). Statistical Abstract – Ethiopia, Central Statistical Authority: Addis Ababa.

72
CSA (2000). Analytical Report on The 1999 National Labour Force Survey, Central Statistical Authority: Addis Ababa.
CSA (2002). Ethiopia Child Labour Survey Report, Central Statistical Authority: Addis Ababa.
CSA (2004). Report on Urban Bi-Annual Employment Unemployment Survey October 2003 1st Year Round 1, Central Statistical Authority: Addis Ababa.
CSA (2004). Report on Urban Bi-Annual Employment Unemployment Survey October 2003 1st Year Round 2, Central Statistical Authority: Addis Ababa.
CSA(2000) Ethiopia Demographic and Health Survey 2000, Central Statistical Authority: Addis Ababa.
5.4. EMPLOYMENT, OCCUPATION AND LIVELIHOODS
These reports contain the distribution of working age population by economic participation status and activity rates, unemployed population and unemployment rates by age group and sex at regional level and major urban centres. The reports also present numerical and percentage distribution of employed and unemployed persons and reasons for not engaging in the labour force by sex and place of residence at regional levels and some of the major urban towns for the year 1984. The reports also contain employment status, occupation and industrial characteristics of the employed people by educational level; and the age as well sex characteristics of the unemployed population.
The reports also contain major occupational and industrial distribution of the economically active population in Ethiopia including skilled and unskilled labour in agriculture, livestock, hunting and fishing, as well as jobs taken as primary activity by sex, age group and place of residence at regional level for the year1994. The reports also contain minor occupational and industrial distribution of the economically active population by sex and place of residence at regional level.
Also some of the reports contain the type of holding (mixed, crop only and livestock only) of agricultural holders by sex and place of residence at regional, zonal and wereda level for the year 2001/01. The reports also show working status and reasons for not working among the population in the agricultural households by sex and place of residence. They also show employment status and type of working by sex and place of residence regional, zonal and wereda level
Office of the Population and Housing Census Commission (1990). Population and Housing Census 1984. Analytical Report on Gonder Region, Central Statistical Authority: Addis Ababa.
Office of the Population and Housing Census Commission (1990). Population and Housing Census 1984. Analytical Report on Wello Region, Central Statistical Authority: Addis Ababa.
Office of the Population and Housing Census Commission (1990). Population and Housing Census 1984. Analytical Report on Tigray Region, Central Authority: Addis Ababa.
CSA (1996). The 1994 Population and Housing Census of Ethiopia. Results for Amhara Region. Vol I: Part III. Statistical Report, Central Statistical Authority: Addis Ababa, pp 279-299.
CSA (1995). The 1994 Population and Housing Census of Ethiopia. Results for Tigray Region. Vol. I. Statistical Report, Central Statistical Authority: Addis Ababa.

73
CSA (1998). The 1994 Population and Housing Census of Ethiopia. Results for Tigray. Vol. II. Analytical Report, Central Statistical Authority: Addis Ababa.
CSA (1999). The 1994 Population and Housing Census of Ethiopia. Results for Amhara Region. Vol. II. Analytical Report, Central Statistical Authority: Addis Ababa.
CSA (1999). Statistical Report on The 1999 National Labour Force Survey, Central Statistical Authority: Addis Ababa.
CSA (2000). Ethiopia Demographic and Health Survey 2000. Central Statistical Authority: Addis Ababa.
CSA (2000). Analytical Report on the 1999 National Labour Force Survey, Central Statistical Authority: Addis Ababa.
CSA(2003) Ethiopian Agricultural Sample Enumeration, 2001/02 Result for Amhara Region, Statistical Report on Socio-Economic Characteristics of the Population in Agricultural Household, Land Use, Area and Production of Crops, Part I. Central Statistical Office, Addis Ababa.
CSA(2003) Ethiopian Agricultural Sample Enumeration, 2001/02 Result for Tigray Region, Statistical Report on Socio-Economic Characteristics of the Population in Agricultural Household, Land Use, Area and Production of Crops, Farm Management Practice, Livestock and Farm Implement. Central Statistical Office, Addis Ababa.
5.5. SOCIAL AND PHYSICAL INFRASTRUCTURE
These reports contain level of literacy and school attendance status distribution, gross and net enrolment rates by sex and place of residence at regional and zonal levels for the year 1994. The reports also contain the distribution of those currently attending school by age, sex, grade and place of residence and also show school progression at regional level by sex and place of residence. Age-sex specific enrolment rates as well as gross and net enrolment rates are also given by place of residence at regional level for the year 1984. The reports also show percentage distribution of population by literacy status, and highest grade completed across sex and place of residence at regional and zonal levels.
The reports also provide the total number of hospitals, health centres, and clinics; as well as total number of medical personnel at regional level. The reports also contain distribution of households according to distance to the nearest health facilities (health post, clinic, health centre, hospital and pre/post natal care), use of health facilities and reason for not using health facilities by place of residence at regional level for the year 2004. Distribution of households according to level of access to source of drinking water, toilet facility and method of waste disposal in rural areas at regional level and some selected urban centres for the year 1996 is also provided in the reports. Besides, limited data is available on access to roads, credit and markets infrastructure as well as extension services
CSO (1985) Rural Labour Force Survey, 1981-1982, Statistical Bulletin 51, Central Statistical Office, Addis Ababa
CSO (1992) Rural Labour Force Survey, 1987/88, Statistical Bulletin 108, Central Statistical Office, Addis Ababa
Office of the Population and Housing Census Commission (1990). Population and Housing Census 1984. Analytical Report on Tigray Region, Central Statistical Authority: Addis Ababa.

74
Office of the Population and Housing Census Commission (1990). Population and Housing Census 1984. Analytical Report on Gonder Region, Central Statistical Authority: Addis Ababa.
Office of the Population and Housing Census Commission (1990). Population and Housing Census 1984. Analytical Report on Wello Region, Central Statistical Authority: Addis Ababa.
CSA (1996). The 1994 Population and Housing Census of Ethiopia. Results for Tigray Region. Vol I: Part III. Statistical Report, Central Statistical Authority: Addis Ababa, pp 10-158.
CSA (1995). The 1994 Population and Housing Census of Ethiopia. Results for Amhara Region. Vol. I. Statistical Report, Central Statistical Authority: Addis Ababa.
CSA (1998). The 1994 Population and Housing Census of Ethiopia. Results for Tigray Region. Vol. II. Analytical Report, Central Statistical Authority: Addis Ababa.
CSA (1999). The 1994 Population and Housing Census of Ethiopia. Results for Amhara Region. Vol. II. Analytical Report, Central Statistical Authority: Addis Ababa.
CSA(2000) Ethiopia Demographic and Health Survey 2000, Central Statistical Authority: Addis Ababa.
CSA (1999). Statistical Report on ‘The 1999 National Labour Force Survey’, Central Statistical Authority: Addis Ababa.
CSA (2000). Analytical Report on The 1999 National Labour Force Survey, Central Statistical Authority: Addis Ababa.
CSA(2003) Ethiopian Agricultural Sample Enumeration, 2001/02 Result for Amhara Region, Statistical Report on Socio-Economic Characteristics of the Population in Agricultural Household, Land Use, Area and Production of Crops, Farm Management Practice, Livestock and Farm Implement. Central Statistical Office, Addis Ababa.
CSA(2003) Ethiopian Agricultural Sample Enumeration, 2001/02 Result for Tigray Region, Statistical Report on Socio-Economic Characteristics of the Population in Agricultural Household. Central Statistical Office, Addis Ababa.
CSA(1996) Report on the Year 1996 Welfare Monitoring Survey, Volume I. Statistical Bulletin 205, Central Statistical Authority, Addis Ababa, pp 51-73.
CSA(1998) Report on the 1998 Welfare Monitoring Survey, Statistical Bulletin 224, Central Statistical Authority, Addis Ababa, pp 91-122.
CSA(2000)Report on the 2000 Welfare Monitoring Survey, Statistical Bulletin 259, Central Statistical Authority, Addis Ababa. pp 201-247
CSA (2004). Welfare Monitoring Survey, Statistical Report on Basic Population Characteristics: Education, Health, Nutritional Status and Child Care. Statistical Bulletin 339-B, Central Statistical Authority, Addis Ababa.
CSA(2003-2004) Report on Urban Bi-Annual Employment Unemployment Survey Round 1( 2003) and Round 2(2004), Central Statistical Authority: Addis Ababa.
CSO (1976 to 1984) and CSA (1985 to 2004). Statistical Abstract - Ethiopia. Central Statistical Authority: Addis Ababa.
CSA (2004)Welfare Monitoring Survey, Statistical Report. Indicators on Living Standards, Accessibility, Household Assets, Food Security and HIV/AIDS. Statistical Bulletin 339-C, Central Statistical Authority, Addis Ababa, pp 123-131, 150-161

75
5.6. INEQUALITY, POVERTY, AND VULNERABILITY
The following references cover issues of social inequality, poverty and vulnerability of the Tekeze-Atbara Sub-basin.
Abraham Molla (2004) Factors Affecting Reproductive Right of Women in Enebssie Sarr Midir District, Amhara Region. MA thesis in Demography. AAU.
Alemtsehay Aberra (2002) Household Structure and Coping Strategies Under Food Stress in Saese Tseade Emba Wereda, Tigray Region. MA in Demography AAU. [IESLibrary].
Ambachew Legesse (1998). Demographic Response to Household Food Insecurity in North Wollo. MA the submitted to AAU in Demography.
Asmelash W/Mariam (1995) The Effects of Land Reform, War and Famine on Peasant Social Organization: A study of Village Level Dynamic in Central Tigray (1974-1995). MA in Social Anthropology, AAU. [SOSA Library].
Bauer, Dan (1997). Household and Society in Ethiopia: An Economic and Social Analysis of Tigray Social Principles and Household Organization, East Lansing, African Studies
Bendz, M. and P.A. Molin (1988): Trees Grow in Wollo. Ethiopian Red Cross Society Mission Report, Rural Development consultants Ab, Vaxjo, Sulldu.
CSA(2000). Ethiopia Demographic and Health Survey 2000. Central Statistical Authority: Addis Ababa.
CSA(1996). Report on the 1996 Welfare Monitoring Survey. Statistical Bulletin 205, Central Statistical Authority, Addis Ababa, pp 82-87.
CSA(1998). Report on the 1998 Welfare Monitoring Survey. Statistical Bulletin 205, Central Statistical Authority, Addis Ababa, pp 82-87.
CSA(2000). Report on the 2000 Welfare Monitoring Survey, Volume I Statistical Bulletin 259, Central Statistical Authority, Addis Ababa. pp 287-293
CSA(2005). Report on the 2004 Welfare Monitoring Survey, Volume I Statistical Bulletin 259, Central Statistical Authority, Addis Ababa. pp 287-293
Dessalegn Rahmato 1987. Famine and Survival Strategies: A Case Study from North-eastern Ethiopia. Addis Ababa: Addis Ababa University (Food and Famine Monograph, No.1). IES Library.
Dessalegn Rahimato (2003). Some Aspects of Poverty in Ethiopia. Three selected papers. Paper by Desallegn Rehamato, Meheret Ayenew and Aklilu Kidanu Edited by Dessalegn Rahamato. FSS Studies on Poverty No.1
Donal Crummey (1997). Deforestation in Wollo: Process or Illusion. IDR Proceeding No. 17,1997.
Fekadu Begna (1990) Land and the Peasantly in Northern Wollo 1941-1974. Yajju, Rayya and Qobbo Awraja. MA Thesis in History, AAU.
Fisheha Begashaw Environmental Degradation Hazards: The Expereince of North Western Planning Region. In Proceedings of Third Social Science Seminar held in Nathareth Oct, 27-29,1978. [IDR Library] Report No.7. 1987
Fitsum Hagos, John Pender and Nega Gebreselassie (1999) Land Degradation in Highlands of Tigray and Strategies for Sustainable Socio-Economic. Policy Research Working Paper No. 25
Hirut Bekele (2000). Natural Resource Degradation and the Predicament of Rural Woman: The case of Bugna Wereda, North Wollo. MA. Thesis in Regional and Local Development Studies, AAU.

76
Kinfe Abreha (1999) Women Migration Status, Health and Use of Family Planning Services: A Case Study in Three Weredas of Tigray. MA in Demography. AAU. [IES Library].
Kiros Gebre Egziabeher (1995) Gender and Rural Production in Tigray (1974-1995). MA Thesis is Social Anthropology, AAU.
Mekasha Belete (2000) Some Factors Affecting Female Pupils’ Participation and Academic Performance in Primary Education in Amhara. MA in Curriculum and Instruction, AAU.
Mulualem Tesema (1998) Gender Bias Analysis of Primary School Text Book of Amhara Region. MA in Curriculum and Instruction, AAU.
Poluha, E, (1990) Risks, Trees and Security: A Baseline Study of Beddedo, A Peasant Association in Wollo, Ethiopia working paper 111, revised, Swedish University of Agricultural Science, International Rural Development Centre-IDRC-UPPSALA.
Poluha, E, (1990) Risks, Trees and Security: A Baseline Study of Beddedo, A Peasant Association in Wollo, Ethiopia working paper 111, revised, Swedish University of Agricultural Science, International Rural Development Centre-IDRC-UPPSALA.
Shewandagne Belete, et al, 1977. Famine in Ethiopia. A Study of Shelter Population in the Wollo Region. Journal of Tropical Paediatric and Environmental Child Health 23 (1): 15-22
Tesfaye Teklu and Tesfaye Tafese (...) Poverty and Environmental Conflict. FSS Studies on Poverty. No.4.
Tilaye Kassahun (1997). Gender Specific Investigation into the Problems of High School Dropouts in the Amhara Region. MA Thesis submitted to AAU.
Yared Amare (2003) Destitution in Rural Ethiopia. FSS Studies on Poverty No.3 362.5 FSP/3 (Community and HH studies in Wag Hamra and South Wollo)
Yonas Tefesse, Aberra Ambaye and Zewdie W/Michael (1997). Nutritional Blindness in Tigray Region, Northern Ethiopia. pp.157-162.
5.7. SOCIAL ORGANIZATION, CONFLICT AND CONFLICT MANAGEMENT
The following annotated publications and research studies could also serve as important sources of data required to assess various aspects of poverty and vulnerability among the sub-basin population.
Demeke Argaw (2005). Co-operation and Conflict management Mechanism among Peoples of Kalu, North East of Ethiopia. MA Thesis Social Anthropology, AAU.
Kelemework Tafere (2000) The Social Function of Demor: An Indigenous Institution of Conflict Resolution among the Wajirat People in South Tigray. MA Thesis in Social Anthropology, AAU.
Tarekegn Gebreyesus Kaba (2005). Change and Continuity in the Traditional Institutions and Mechanisms of Local Governance and Conflict Resolution among the Wejerat: An Ethnographical Analysis.
Yohannes Berhanu (2005). Conflict and Conflict Resolution among the Chihera (Micro-Level Studies from Six Village in North Gondor). MA in Social Anthropology, AAU

77
5.8. DEVELOPMENT PROJECTS
Most of the works listed below provide information on recent government and non-government efforts to introduce development programs in and around the sub-basin areas and cover issues of resettlement, villagization, extension program, irrigation projects, household food security. Most of the works are research reports and academic papers produced in the form of theses or dissertations.

78
REFERENCES
Alula Abate, Tegegn Teka, Bayu Chana, Admassu Gebeyehu, Kassu Kinde [1993]. Evolution of the Impact of UNICEF Assisted Water Supply Projects in Bale Haraghe, Shewa, Wollo. Ethio Program Cycle 1980-1993 Memo 243 p Addis Ababa. IDR Research Report
Araya Gebru, et.al. (1995). Situation of Literacy Programs in Tigray unpublished research report (Tigrigna), Mekele. TREB .
BOANR (2002). Dedebit Credit and Saving Institution 2001 Annual Report.
CRA (2007), ‘Baro-Akobo-Sobat-White Nile Sub-Basin Trans-boundary Report’, Watershed Management Cooperative Regional Assessment, ENTRO.
Dessalegn Rahmato (1997). Environment and Conservation in Wollo Before the Revolution. IDR Proc No 17.
Desselegh Rhmato (1999). Water resource Development in Ethiopia: Issues of Sustainability and Participation. FSS Discussion Paper No. 1
Dessalegn Rahimato (2003). Resettlement in Ethiopia: The Tragedy of Population Relocation in the 1980s. FSS Discussion Paper No 11.
Fassil G.Kiros (1979)- A Critical Evaluation of Family Planning Prescription for Rural Wollo and Tigray. Ethiopian Journal of Development Research Vol 3. No.1. [IDR Library].
Fantahun Ayele (1994) NGOs Relief Operation in Wollo 1973-1986 MA Thesis in History, AAU.
Fekede Tsegaye (1990). Technical and Managerial Aspect of Environmental and Health Impact Assessment of Water Resource Projects. The Ethiopian experience Ethiopian Journal of Health Research 4(1): 65-68. (Special article).
Fitsum Hagos, John Pender and Nega Gebreselassie (1999) Land Degradation in Highlands of Tigray and Strategies for Sustainable Socio-Economic. Policy Research Working Paper No. 25.
Gebrekidan WoldeGebriel (2001). A study of Local Participation in the Implementation of Primary School Improvement Project in Tigray. MA. in Educational Planning and Management, AAU. [IES Library.
Hasselblat, G. 1973. The Wollo Settlement Plan A/ Basheer 2(3): 143-154.
Hailu Araya (2001). Processes of Soil Erosion and Aspects of Community based Soil conservation in Grahutsa-Korin Water Shade in Eastern Tigray. MA in Geography, AAU.
Hendrie, Barbera (1997) Managing Famine Disaster: Popular Participation in Tigray: Eritrean Studies Vol. 1, No.1
Kidane Tekele (1998) Utilization of Health Service in the Regional State of Tigray. MA Thesis in Human Resource Economic, AAU. [IES Library].
Ministry of Education (1990). Basic Education in Ethiopia: Challenges and Prospects We Want to Learn, MOE. AA. Policy Related (Library Study), UNESCO.
Ministry of Water Resource (2001]. Irrigation Development strategy (component of the water sector development strategy).
Mintesinot Bahiru [2002) Assessment and Optimization of Traditional Irrigation of Verfisols in North Ethiopia. The case study at Gumselasa Microdam using maize as an indictor crop. PhD Thesis, University of Gent
Mored (2003b) Voluntary Resettlement Program (A close to improved land). Vol. II AA. (FSS Library).
Mulualem Bassie (2001). Institutional and Administrative Capacity for Development: The Case of Benishangul Gumz National Regional State Efforts, Problems and Prospects. MA Thesis in Regional and Local Development Studies, AAU

79
Mulugeta Tassew (1999). Training and Agricultural Technology Adoption in Resource Poor Area of North Wollo: The Case of Meket Woroda. MA Thesis in Economic Policy Analysis, AAU. [IES Library].
Relief Society of Tigray (REST) (2001). Farming Systems, Resource Management and Household Coping Strategies in Northern Ethiopia, Report of Social and Agro-ecological Baseline Survey Study in the Southern and Eastern Zone of Tigray Region.
Tigray Region Education Bureau (1998). Quality of Education in Tigray: Survey Research.
Todd Crawford and Habteab Degnew (1992). Reforestation Program in Tigre and Wello Proviences. IDR Research Report No.1. Addis Ababa. Unpublished memo.
Tsegabirhan Weldegeorgis (1999) Estimating Willingness to Pay for Irrigation water: On Contingent Valuation Case Study of Small Scale Irrigation in Tigray. MA Thesis in Economics. AAU.
UNDP, ECA (FAU-FCA), TDA and Regional Government of Tigray (1994) Project Document Sustainable Agriculture and Environmental Rehabilitation in Tigray. SAERT Vol.1
Woldeab Teshome (2003) Irrigation Practice, State Intervention and Farmers. Life-Worlds in Drought Prone Tigray, Ethiopia.
Related Documents