The major task of proteomics consists of qualitative and quantitative analysis of proteins in a biological sam ple [1]. The approach based on a combination of protein separation by means of twodimensional gel elec trophoresis (2DE) followed by subsequent identification of proteins by peptide mass fingerprint (PMF) has been developed in proteomic studies for more than 10 years. The peptide mass fingerprint characterizes the spectrum of products of tryptic hydrolysis of proteins in gels (pro tein spots are excised from the gel) obtained by means of matrixassisted laser desorption timeofflight mass spec trometry (MALDITOFMS). The resulting peptide mass spectra are then used for protein identification using programs for search in databases of decoded genomes [2 6]. However, the procedure of 2DE is poorly applicable for membrane proteins, which are basically insoluble under conditions required for isoelectrofocusing [7, 8]. Recently, a new proteomic strategy has been developed. Membrane (e.g. microsomal) proteins are separated by onedimensional gel electrophoresis (1DE). The latter has evident advantage because membrane proteins are ISSN 00062979, Biochemistry (Moscow), 2009, Vol. 74, No. 2, pp. 153161. © Pleiades Publishing, Ltd., 2009. Original Russian Text © A. V. Lisitsa, N. A. Petushkova, I. P. Nikitin, V. G. Zgoda, I. I. Karuzina, S. A. Moshkovskii, O. V. Larina, O. G. Skipenko, L. O. Polyschuk, H. Thiele, A. I. Archakov, 2009, published in Biokhimiya, 2009, Vol. 74, No. 2, pp. 190200. Originally published in Biochemistry (Moscow) OnLine Papers in Press, as Manuscript BM08186, December 28, 2008. 153 Abbreviations: 1DE, onedimensional gel electrophoresis; 2DE, twodimensional gel electrophoresis; 1DPM, onedimension al proteomic maps; HLMG, human liver microsomal ghosts; LCMS/MS, liquid chromatography electrospray ionization tandem mass spectrometry; MALDITOFMS, matrixassisted laser desorption timeofflight mass spectrometry; MS, mass spectrometry; PMF, peptide mass fingerprint. * To whom correspondence should be addressed. OneDimensional Proteomic Mapping of Human Liver Cytochromes P450 A. V. Lisitsa 1 , N. A. Petushkova 1 *, I. P. Nikitin 1 , V. G. Zgoda 1 , I. I. Karuzina 1 , S. A. Moshkovskii 1 , O. V. Larina 1 , O. G. Skipenko 2 , L. O. Polyschuk 2 , H. Thiele 3 , and A. I. Archakov 1 1 Orekhovich Institute of Biomedical Chemistry, Russian Academy of Medical Sciences, ul. Pogodinskaya 10, 119121 Moscow, Russia; fax: (495) 2450857; Email: [email protected] 2 National Research Center of Surgery, Russian Academy of Medical Sciences, Abrikosovsky Pereulok 2, 119992 Moscow, Russia 3 Bruker Daltonik GmbH, Fahrenheitstrasse 4, Bremen, 28359 Germany; Email: [email protected] Received May 29, 2008 Revision received June 18, 2008 Abstract—A method for constructing onedimensional proteomic maps (1DPM) based on mass spectrometric identifica tion of proteins from adjacent slices of onedimensional electrophoregram has been developed. For the proteomic mapping, gel lanes were sectioned into slices less than 0.2 mm thick and each slice was subjected to enzymatic hydrolysis. The result ant mixture of peptide fragments was analyzed by matrixassisted laser desorption timeofflight mass spectrometry (MALDITOF) and liquid chromatography electrospray ionization tandem mass spectrometry (LCMS/MS). Proteins were identified by the mass spectra obtained. Data on peptide fragments and corresponding identified proteins were pre sented as a 1DPM. Proteomic maps were constructed by assigning individual proteins to gel slices based on number of matching peptides in a corresponding MSdata. On 1DPM of human liver microsomal fraction, 18 proteins were identi fied in the region of 4065 kDa. These included 12 membrane proteins belonging to the superfamily of cytochromes P450. Pooling of mass spectrometric data, obtained from several adjacent gel slices (molecular zooming) increased sequence cov erage of CYP2A (cytochrome P450 family 2A). The maximal coverage of 66% significantly exceeded the level of 48% that could be obtained using one (even the most informative) slice. This method can be applied to the proteomic profiling of membranebound proteins. DOI: 10.1134/S0006297909020059 Key words: proteomics, onedimensional gel electrophoresis, molecular zooming, mass spectrometry, membranebound protein identification

Welcome message from author
This document is posted to help you gain knowledge. Please leave a comment to let me know what you think about it! Share it to your friends and learn new things together.
Transcript
The major task of proteomics consists of qualitative
and quantitative analysis of proteins in a biological sam�
ple [1]. The approach based on a combination of protein
separation by means of two�dimensional gel elec�
trophoresis (2DE) followed by subsequent identification
of proteins by peptide mass fingerprint (PMF) has been
developed in proteomic studies for more than 10 years.
The peptide mass fingerprint characterizes the spectrum
of products of tryptic hydrolysis of proteins in gels (pro�
tein spots are excised from the gel) obtained by means of
matrix�assisted laser desorption time�of�flight mass spec�
trometry (MALDI�TOF�MS). The resulting peptide
mass spectra are then used for protein identification using
programs for search in databases of decoded genomes [2�
6]. However, the procedure of 2DE is poorly applicable
for membrane proteins, which are basically insoluble
under conditions required for isoelectrofocusing [7, 8].
Recently, a new proteomic strategy has been developed.
Membrane (e.g. microsomal) proteins are separated by
one�dimensional gel electrophoresis (1DE). The latter
has evident advantage because membrane proteins are
ISSN 0006�2979, Biochemistry (Moscow), 2009, Vol. 74, No. 2, pp. 153�161. © Pleiades Publishing, Ltd., 2009.
Original Russian Text © A. V. Lisitsa, N. A. Petushkova, I. P. Nikitin, V. G. Zgoda, I. I. Karuzina, S. A. Moshkovskii, O. V. Larina, O. G. Skipenko, L. O. Polyschuk,
H. Thiele, A. I. Archakov, 2009, published in Biokhimiya, 2009, Vol. 74, No. 2, pp. 190�200.
Originally published in Biochemistry (Moscow) On�Line Papers in Press, as Manuscript BM08�186, December 28, 2008.
153
Abbreviations: 1DE, one�dimensional gel electrophoresis; 2DE,
two�dimensional gel electrophoresis; 1D�PM, one�dimension�
al proteomic maps; HLMG, human liver microsomal ghosts;
LC�MS/MS, liquid chromatography electrospray ionization
tandem mass spectrometry; MALDI�TOF�MS, matrix�assisted
laser desorption time�of�flight mass spectrometry; MS, mass
spectrometry; PMF, peptide mass fingerprint.
* To whom correspondence should be addressed.
One�Dimensional Proteomic Mappingof Human Liver Cytochromes P450
A. V. Lisitsa1, N. A. Petushkova1*, I. P. Nikitin1,V. G. Zgoda1, I. I. Karuzina1, S. A. Moshkovskii1, O. V. Larina1,
O. G. Skipenko2, L. O. Polyschuk2, H. Thiele3, and A. I. Archakov1
1Orekhovich Institute of Biomedical Chemistry, Russian Academy of Medical Sciences, ul. Pogodinskaya 10,
119121 Moscow, Russia; fax: (495) 245�0857; E�mail: [email protected] Research Center of Surgery, Russian Academy of Medical Sciences,
Abrikosovsky Pereulok 2, 119992 Moscow, Russia3Bruker Daltonik GmbH, Fahrenheitstrasse 4, Bremen, 28359 Germany; E�mail: [email protected]
Received May 29, 2008
Revision received June 18, 2008
Abstract—A method for constructing one�dimensional proteomic maps (1D�PM) based on mass spectrometric identifica�
tion of proteins from adjacent slices of one�dimensional electrophoregram has been developed. For the proteomic mapping,
gel lanes were sectioned into slices less than 0.2 mm thick and each slice was subjected to enzymatic hydrolysis. The result�
ant mixture of peptide fragments was analyzed by matrix�assisted laser desorption time�of�flight mass spectrometry
(MALDI�TOF) and liquid chromatography electrospray ionization tandem mass spectrometry (LC�MS/MS). Proteins
were identified by the mass spectra obtained. Data on peptide fragments and corresponding identified proteins were pre�
sented as a 1D�PM. Proteomic maps were constructed by assigning individual proteins to gel slices based on number of
matching peptides in a corresponding MS�data. On 1D�PM of human liver microsomal fraction, 18 proteins were identi�
fied in the region of 40�65 kDa. These included 12 membrane proteins belonging to the superfamily of cytochromes P450.
Pooling of mass spectrometric data, obtained from several adjacent gel slices (molecular zooming) increased sequence cov�
erage of CYP2A (cytochrome P450 family 2A). The maximal coverage of 66% significantly exceeded the level of 48% that
could be obtained using one (even the most informative) slice. This method can be applied to the proteomic profiling of
membrane�bound proteins.
DOI: 10.1134/S0006297909020059
Key words: proteomics, one�dimensional gel electrophoresis, molecular zooming, mass spectrometry, membrane�bound
protein identification
154 LISITSA et al.
BIOCHEMISTRY (Moscow) Vol. 74 No. 2 2009
soluble in a buffer with SDS and the degree of protein
separation allows identifying up to 20 proteins per gel
segment [8�10]. A gel lane is then sectioned into segments
(16 × 3 mm), each of which is subjected to tryptic hydrol�
ysis, and the resulting mixture of peptide fragments is
then analyzed by mass spectrometry (MS).
A new generation of proteomic methods for analysis
of biomolecules is based on mass spectrometry with elec�
trospray ionization of an analyzed sample [11]. Inventory
of proteomes, including those containing membrane pro�
teins, employs combination of the methods of one�
dimensional electrophoresis (1DE) and high perform�
ance liquid chromatography coupled to a mass detector
based on an ion trap (LC�MS/MS) [8�10, 12].
Although using the method of 1DE it is possible to
separate proteins simultaneously on several lanes of a
1DE gel, its resolution capacity is lower than that of 2DE
because of complexity of a protein mixture used for
analysis [13]. For treatment of large massifs of mass spec�
trometric information obtained during protein separation
by 1DE, the following approach has been proposed: a gel
lane is sectioned into overlapping slices and protein pro�
files refer to types of tissue, gel number, or slice position
on the gel [13]. Using the two latter modes of data treat�
ment, it is possible to take into consideration systemic
errors and to isolate significant areas on the 1DE gel.
In this study, we have investigated the possibility of
1DE proteomic mapping (1DE�PM) based on mass spec�
trometry data obtained using various segments of one�
dimensional electrophoregrams. Using this approach, we
have separated a complex protein mixture and represent�
ed each components of this mixture as a separate protein
profile [14]. The superfamily of cytochromes P450
(CYPs), particularly, enzymes of CYP2A subfamily of
human liver microsomes, were chosen as the research
object for several reasons. Enzyme immunoassay revealed
that (using tissue samples sufficient for proteomic studies)
more than 20 CYPs are expressed by human liver [15] and
the following forms represent 70% of the total amount of
this heme protein: 1A2, 2A6, 2B6, 2C8/9/18/19, 2D6,
2E1, and 3A4/5 [15]. Members of CYP2A superfamily
are the most abundant among them (these CYPs repre�
sent 30% of the total amount of cytochromes P450). In a
practical aspect, cytochromes P450 of these families are
especially interesting because they are involved in metab�
olism of more than 60% of all drugs. Hepatic
cytochromes P450 are hydrophobic membrane proteins
that precipitate at the stage of isoelectrofocusing in
attempts to separate them by 2DE [16]. During separa�
tion by means of 1DE, all forms of cytochrome P450 are
positioned within a rather narrow gel region [16] because
many forms share significant similarity in amino acid
sequence [17] and have basically identical molecular
masses.
Using one�dimensional proteomic mapping, it was
possible to refer mass spectrometric data to protein
localization of the lane of a 1D gel. The principle of 1D�
PM is based on scaling of a gel lane by molecular masses
or peptide sequences of the separated proteins. The
region of the electrophoregram lane (40�65 kDa corre�
sponding to molecular masses of CYPs) was sequentially
sectioned into 40 slices, and each slice was then subject�
ed to trypsinolysis and MS analysis. The use of matrix�
assisted and electrospray methods of peptide ionization
provided additional advantages to the one�dimensional
mapping.
MATERIALS AND METHODS
Materials. The following reagents were used in this
study: phenylmethylsulfonyl fluoride, 2,5�dihydroben�
zoic acid, Tris, EDTA, NADPH, dithionite, trypsin, and
sodium deoxycholate from Sigma�Aldrich (USA); ace�
tonitrile and trifluoroacetic acid from ICN (USA);
Coomassie Brilliant Blue G�250 from Fluka (Germany);
mercaptoethanol, dithiothreitol, SDS, glycerol,
Bromophenol Blue, and ammonium bicarbonate from
Acros Organics (USA). Other reagents of chemically pure
and pure for analysis grades were produced by domestic
suppliers.
Morphologically unchanged pieces of human liver
obtained by resection during surgical treatment of liver
were used as the material for this study. Four samples (of
8�10 g) were obtained from the Department of
Pathological Anatomy, Russian Research Center for
Surgery, Russian Academy of Medical Sciences. Human
liver microsomes were isolated from the surgical material
within 30 min after excision by differential centrifugation.
Additionally purified preparations of microsomal mem�
branes (ghosts) were obtained as described previously
[18]. Protein was determined by the method of Bradford
[19] using bovine serum albumin as a standard.
Electrophoresis of proteins of human liver microsomalghosts (HLMG). For separation of proteins by 1DE,
HLMG samples (20 µg of protein) were diluted with
buffer containing 0.06 M Tris�HCl, pH 6.8, 10% glycerol,
2% SDS, mercaptoethanol, and Bromophenol Blue used
at a ratio 1 : 10 (v/v). Proteins were separated using a
Mini�Protean III Cell (Bio�Rad, USA). After protein
separation by mass, the gels were stained with Coomassie
Brilliant Blue as described earlier [20].
Tryptic hydrolysis of proteins in polyacrylamide gelstained with Coomassie Brilliant Blue G�250 was carried
out as described earlier [20]. The region of the gel lane of
40�65 kDa (molecular masses of cytochromes P450) was
initially frozen and then sectioned into thin (about
0.2 mm) slices using a manual microtome. Each slice
(about 40 in total for the selected range of molecular
masses; Fig. 1, a and b) was then treated as an independ�
ent sample. These slices were washed with water three
times and then were destained by incubating in a mixture
PROTEOME MAPPING OF CYTOCHROMES P450 155
BIOCHEMISTRY (Moscow) Vol. 74 No. 2 2009
containing 50% acetonitrile (v/v) in 100 mM ammonium
bicarbonate, pH 8.9, at 56°C for 20 min and then in 100%
acetonitrile for 20 min. After acetonitrile removal, gels
were dried and treated with 5�8 µl of trypsin solution
(25 ng/µl of modified trypsin in 50 mM ammonium
bicarbonate) (depending on initial size of the gel slice) at
37°C for 12 h. After trypsinolysis, a 15�µl aliquot of mix�
ture containing 5% acetonitrile in water and 0.5% formic
acid was added and the solution of peptides layered over
the gel was taken for mass spectrometric analysis.
Time�of�flight mass spectrometry. A mixture of pro�
teolytic peptides extracted from gel (0.3 µl) was mixed
with an equal volume of α�cyano�4�hydroxycinnamic
acid (a saturated solution prepared using 0.5% trifluo�
roacetic in 50% aqueous acetonitrile, which was then
diluted 2�fold). The resulting mixture was applied on five
positions of a mass spectrometry AnchorChip target
(Bruker Daltonics, Germany) and dried in air.
Mass spectra were recorded in the reflex mode using
an accelerating voltage of 25 kV on a Bruker Ultraflex
spectrometer (Bruker Daltonics) equipped with the
delayed extraction system Bruker PANTM. Resulting
spectra were processed using the Bruker FlexAnalysis 2.2
software and the SNAP option as the peak detection algo�
rithm. The mass spectra were treated in the data ware�
housing and bioinformatics information system
ProteinScape v.1.2 (Bruker Daltonics) using the 200 most
intense peaks. Proteins were identified by peptide mass
fingerprint (PMF) databases search using the Mascot
(Matrix Science, USA) and ProFound (Proteometrix,
USA) programs. The accuracy of mass detection MH+
was 0.2 Da assuming the possibility of methionine oxida�
tion and modification of cysteine residues by acrylamide.
The range of allowable protein masses was 40�100 kDa
(for ProFound). The search employed the NCBI database
(http://www.ncbi.nlm.nih.gov/sites/gquery).
Liquid chromatography electrospray ionization tan�dem mass spectrometry (LC�MS/MS) was carried out
using a nanoflow high performance liquid chromatogra�
phy coupled with an Agilent 1100 SL Series MSD Trap
ion�trap (Agilent Technologies, USA). Chromatographic
separation of peptides was achieved by means of a linear
gradient (5�80%) of acetonitrile in 0.1% formic acid (for
40�60 min) at the flow rate of 2 nl/min using a 180 µm
capillary column. Detection employed an ion�trap in the
range of m/z 200�1800. Proteins were identified by data�
base search using Mascot and the following search
parameters: accuracy of determination of mass peptide
ions ±1.5 Da, possibility of methionine oxidation and
modification of cysteine residues by acrylamide.
Proteome mapping. One�dimensional proteome
maps of HLMG proteins were analyzed using the
1D�ZOOMER software (http://projects.ibmh.msk.su/
oldzoomer/projects/hlm2004/guest.pl) by treating more
than 200 time�of�flight and 60 chromato�mass spectra.
The proteome map contained proteins reliably identified
by the search systems. The 1D�PM is presented as a table
that consists of horizontal rows (each of which corre�
sponds to one protein or a group of proteins) and
columns representing the sequential number of the
excised slice of the gel (Table 1). Values in the cells
reflected either peak number in the fingerprint of peptide
masses coinciding with the list of masses for theoretical
proteolysis of a particular protein (the PMF�index in the
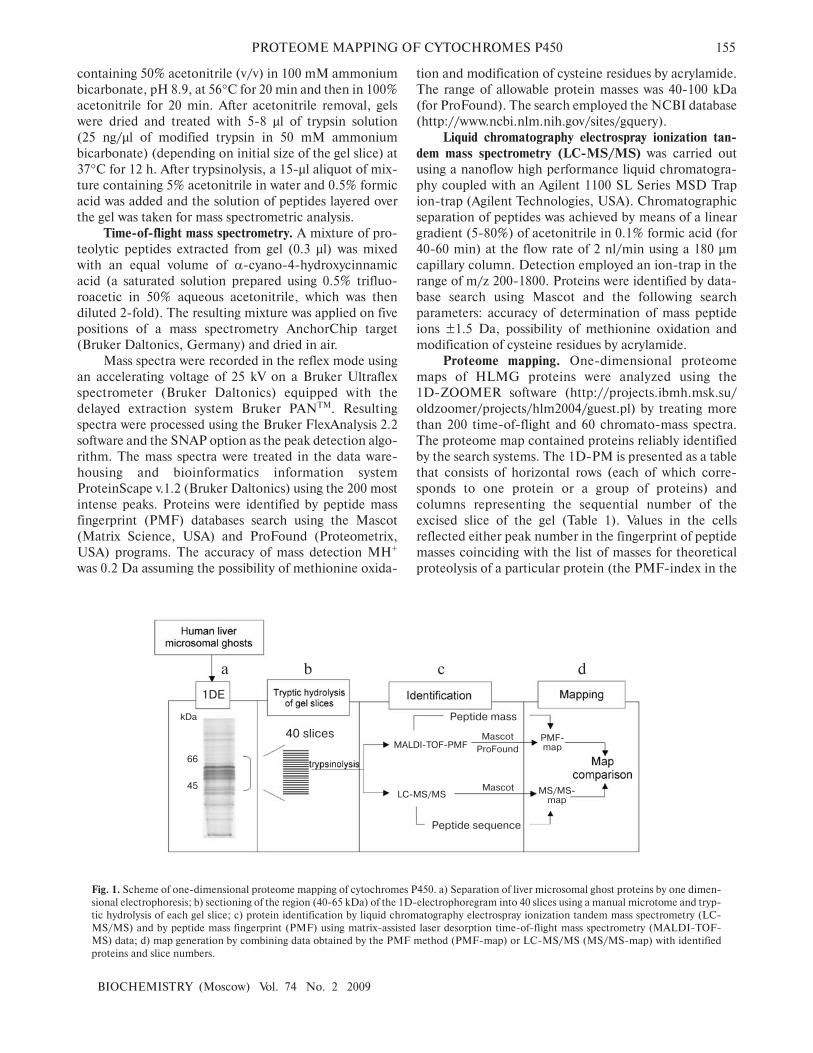
Fig. 1. Scheme of one�dimensional proteome mapping of cytochromes P450. a) Separation of liver microsomal ghost proteins by one dimen�
sional electrophoresis; b) sectioning of the region (40�65 kDa) of the 1D�electrophoregram into 40 slices using a manual microtome and tryp�
tic hydrolysis of each gel slice; c) protein identification by liquid chromatography electrospray ionization tandem mass spectrometry (LC�
MS/MS) and by peptide mass fingerprint (PMF) using matrix�assisted laser desorption time�of�flight mass spectrometry (MALDI�TOF�
MS) data; d) map generation by combining data obtained by the PMF method (PMF�map) or LC�MS/MS (MS/MS�map) with identified
proteins and slice numbers.
a b c d
1DE
kDa
66
45
40 slicesMALDI�TOF�PMF
LC�MS/MS
MascotProFound
Mascot
PMF�map
MS/MS�map
Peptide mass
Peptide sequence
156 LISITSA et al.
BIOCHEMISTRY (Moscow) Vol. 74 No. 2 2009
case of MALDI�TOF mass spectrometry) or the number
of peptide sequences related to these proteins (the
MS/MS�index in the case of tandem spectrometry).
Thus, the index values in a cell reflected degree of protein
concordance with the mass spectrum obtained from a
particular gel slice.
RESULTS
Proteomic mapping of human liver microsomal ghosts.One�dimensional proteomic maps were generated for
four samples of HLMG using protein separation in poly�
acrylamide gel. Depending on sample and electrophoret�
ic conditions, 13�19 separate protein bands were recog�
nized after gel staining (Fig. 1a). The region of 40�65 kDa
demonstrated the most intensive staining, where 2�3
main wide bands and several minor bands were recog�
nized. Positioning of each protein on the polyacrylamide
gel was determined by sectioning of this region of the gel
(Fig. 1b) into thin slices (0.2 mm) and concordance MS�
data for this protein with the slice number. Each gel slice
was analyzed by MALDI�TOF and LC�MS/MS (Fig.
1c). Searching a sequence database using mass spectro�
metry data resulted in identification of 14 various forms of
cytochrome P450. In addition, we identified flavin
monooxygenase, ATP�synthase, epoxide hydrolase,
actin, carboxylesterase, and UDP�glycosyltransferase.
The four latter proteins were detected in all HLMG sam�
ples, and in subsequent experiments they served as mark�
ers for detection of cytochrome P450 localization on 1D�
PM.
For protein identification in gel slices, we used two
mass spectrometric methods. This results in two types of
mass spectrometric data (MS�data). In the case of
MALDI�TOF, results represented peptide fingerprints,
which we defined as PMF�data. In the case of LC�
MS/MS, the MS/MS data included a set of peptide
sequences identified by mass spectra of secondary peptide
fragmentation. For 1D peptide mapping, we have used
protein abundance index [22]; this is a quantitative char�
acteristics reflecting concordance between MS�data on
each slice and an identified protein. For example, in
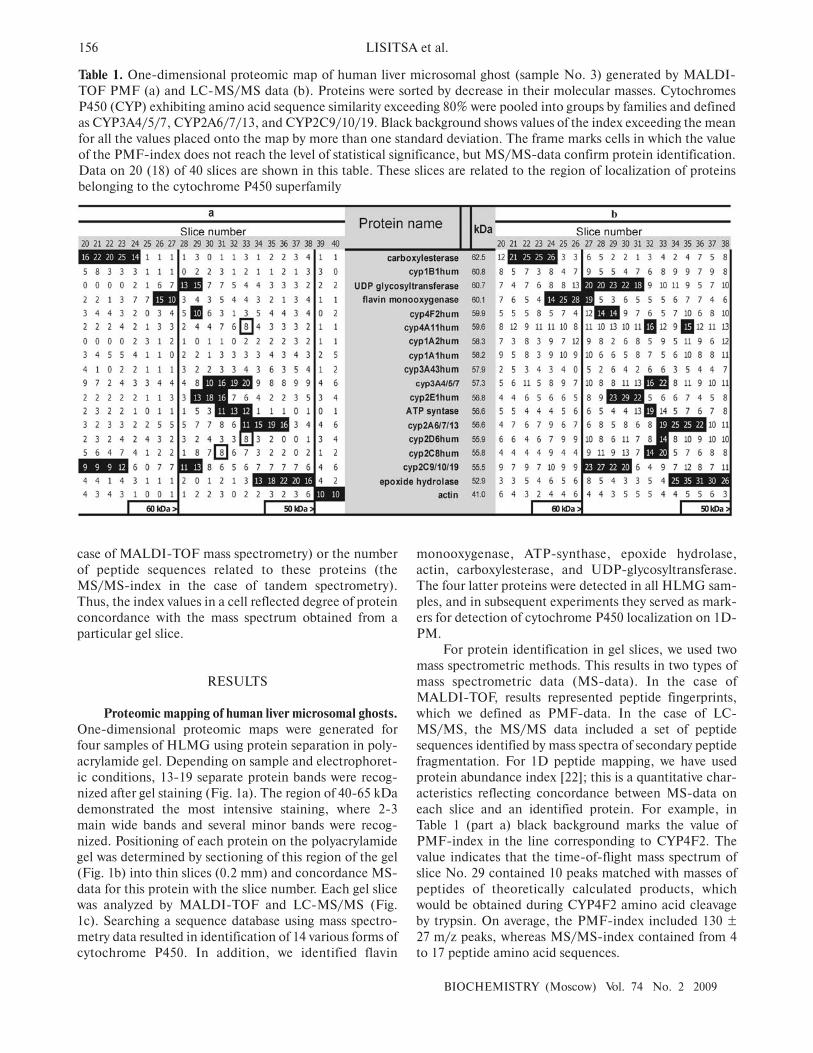
Table 1 (part a) black background marks the value of
PMF�index in the line corresponding to CYP4F2. The
value indicates that the time�of�flight mass spectrum of
slice No. 29 contained 10 peaks matched with masses of
peptides of theoretically calculated products, which
would be obtained during CYP4F2 amino acid cleavage
by trypsin. On average, the PMF�index included 130 ±
27 m/z peaks, whereas MS/MS�index contained from 4
to 17 peptide amino acid sequences.
Table 1. One�dimensional proteomic map of human liver microsomal ghost (sample No. 3) generated by MALDI�
TOF PMF (a) and LC�MS/MS data (b). Proteins were sorted by decrease in their molecular masses. Cytochromes
P450 (CYP) exhibiting amino acid sequence similarity exceeding 80% were pooled into groups by families and defined
as CYP3A4/5/7, CYP2A6/7/13, and CYP2C9/10/19. Black background shows values of the index exceeding the mean
for all the values placed onto the map by more than one standard deviation. The frame marks cells in which the value
of the PMF�index does not reach the level of statistical significance, but MS/MS�data confirm protein identification.
Data on 20 (18) of 40 slices are shown in this table. These slices are related to the region of localization of proteins
belonging to the cytochrome P450 superfamily
PROTEOME MAPPING OF CYTOCHROMES P450 157
BIOCHEMISTRY (Moscow) Vol. 74 No. 2 2009
During one�dimensional protein mapping, names
of identified proteins were placed in the lines of the mid�
dle part of the table depending on the decrease in their
molecular masses (Table 1). In the table cells (intersects
of gel slice number and protein name), the index value
determining concordance between MS�data and a par�
ticular protein is indicated. In accordance with the two
types of mass spectrometry methods (Fig. 1, c and d),
two 1D�PMs were generated for each HLMG sample:
the PMF�map (Table 1a) and MS/MS�map (Table 1b).
Both types of 1D�PM were characterized by unequivocal
distribution of the protein index in gel slices. For exam�
ple, in the case of epoxide hydrolase (see Table 1a) the
first, significantly differing from the background level,
PMF�index appeared in slice No. 34, then this index
gradually increased, reached the maximal value for this
protein in slices No. 36 and 37, and then gradually
decreased in subsequent gel slices. Similar dependence
on the gel slice number was also observed in the case of
the MS/MS�index (Table 1b): the latter reached high
values for epoxide hydrolase in the slices No. 33�38.
Table 1 also shows that high values of the index marked
with black background are located in diagonal cells of the
1D�PM.
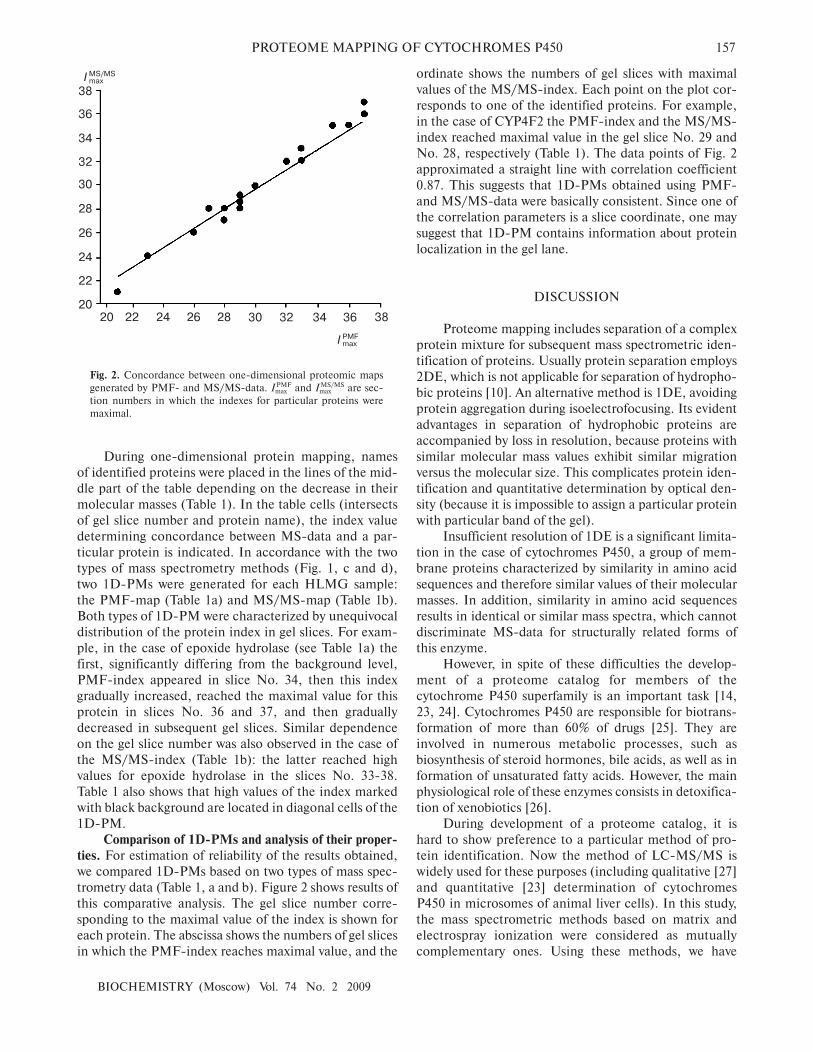
Comparison of 1D�PMs and analysis of their proper�ties. For estimation of reliability of the results obtained,
we compared 1D�PMs based on two types of mass spec�
trometry data (Table 1, a and b). Figure 2 shows results of
this comparative analysis. The gel slice number corre�
sponding to the maximal value of the index is shown for
each protein. The abscissa shows the numbers of gel slices
in which the PMF�index reaches maximal value, and the
ordinate shows the numbers of gel slices with maximal
values of the MS/MS�index. Each point on the plot cor�
responds to one of the identified proteins. For example,
in the case of CYP4F2 the PMF�index and the MS/MS�
index reached maximal value in the gel slice No. 29 and
No. 28, respectively (Table 1). The data points of Fig. 2
approximated a straight line with correlation coefficient
0.87. This suggests that 1D�PMs obtained using PMF�
and MS/MS�data were basically consistent. Since one of
the correlation parameters is a slice coordinate, one may
suggest that 1D�PM contains information about protein
localization in the gel lane.
DISCUSSION
Proteome mapping includes separation of a complex
protein mixture for subsequent mass spectrometric iden�
tification of proteins. Usually protein separation employs
2DE, which is not applicable for separation of hydropho�
bic proteins [10]. An alternative method is 1DE, avoiding
protein aggregation during isoelectrofocusing. Its evident
advantages in separation of hydrophobic proteins are
accompanied by loss in resolution, because proteins with
similar molecular mass values exhibit similar migration
versus the molecular size. This complicates protein iden�
tification and quantitative determination by optical den�
sity (because it is impossible to assign a particular protein
with particular band of the gel).
Insufficient resolution of 1DE is a significant limita�
tion in the case of cytochromes P450, a group of mem�
brane proteins characterized by similarity in amino acid
sequences and therefore similar values of their molecular
masses. In addition, similarity in amino acid sequences
results in identical or similar mass spectra, which cannot
discriminate MS�data for structurally related forms of
this enzyme.
However, in spite of these difficulties the develop�
ment of a proteome catalog for members of the
cytochrome P450 superfamily is an important task [14,
23, 24]. Cytochromes P450 are responsible for biotrans�
formation of more than 60% of drugs [25]. They are
involved in numerous metabolic processes, such as
biosynthesis of steroid hormones, bile acids, as well as in
formation of unsaturated fatty acids. However, the main
physiological role of these enzymes consists in detoxifica�
tion of xenobiotics [26].
During development of a proteome catalog, it is
hard to show preference to a particular method of pro�
tein identification. Now the method of LC�MS/MS is
widely used for these purposes (including qualitative [27]
and quantitative [23] determination of cytochromes
P450 in microsomes of animal liver cells). In this study,
the mass spectrometric methods based on matrix and
electrospray ionization were considered as mutually
complementary ones. Using these methods, we have
Fig. 2. Concordance between one�dimensional proteomic maps
generated by PMF� and MS/MS�data. ImaxPMF and Imax
MS/MS are sec�
tion numbers in which the indexes for particular proteins were
maximal.
36
34
32
30
20
38
22 24 26 28 38
I maxMS/MS
26
24
22
20
28
I maxPMF
30 32 34 36
158 LISITSA et al.
BIOCHEMISTRY (Moscow) Vol. 74 No. 2 2009
analyzed the proteome profile of cytochrome P450 in
human liver microsomes. Profiling employed the method
of 1D�PM [14], which can be considered as a variant of
molecular zooming of a gel fragment. Using one�dimen�
sional mapping, we proposed to obtain information on
protein localization in a gel and to determine qualitative
and quantitative composition of the analyzed sample. On a
1D�PM (Table 1) we put proteins identified by mass spec�
tral search in the database of known sequences by means
of standard programs Mascot (www.matrixscience.com)
and Profound (prowl.rockefeller.edu) for MALDI�TOF
spectra or only Mascot for LC�MS/MS spectra (Fig. 1).
Sequential processing of slices resulted in detection and
identification of hydrophobic HLMG proteins. In the
analyzed gel region corresponding to molecular masses of
40�66 kDa, we identified 18 microsomal membrane pro�
teins. The identified proteins were positioned in the 1D�
PM by the decrease in the molecular mass as shown in
Table 1 for one of the samples (similar results were
obtained for the other three HLMG samples).
In addition to cytochromes P450 (forms 1A1, 1A2,
1B1, 2A6/7/13, 2E1, 2C8, 2C9/10/19, 2D6, 3A4/5/7,
3A43, 4A11, 4F2), this region of the gel lane contained
other proteins: epoxide hydrolase, actin, carboxyl�
esterase, and UDP�glycosyltransferase. These proteins
were detected in all samples of human liver and were used
as “markers” for determination of molecular masses of
proteins on the proteomic map. Table 1 shows that the gel
region containing cytochromes P450 on the upper side is
limited by carboxylesterase (62.5 kDa) and UDP�glyco�
syltransferase (60.7 kDa), and on the lower side it is lim�
ited by epoxide hydrolase (52.9 kDa) and actin
(41.0 kDa). The protein identification was statistically
significant (by both peptide mass fingerprint and
MS/MS�spectra). The numbers of gel slices in which the
index of these protein markers reached the highest values
allowed assigning the 1D�PM region of molecular masses
from 60 to 50 kDa. On a 1D�PM within these limits,
there were 11 slices in which all identified forms of
cytochrome P450 were positioned (Table 1). Table 1
shows that the highest values of the MS�index were also
high (versus other cells in the row) in some adjacent gel
slices. For example, in the row of Table 1 defined as
CYP2E1 high index values were observed in slices No. 29�
31 (Table 1b).
At the initial stage of 1D�PM analysis the highly
homologous forms of cytochromes P450 were pooled into
three groups: CYP2A6/7/13, CYP2C9/10/19, and
CYP3A4/5/7. Amino acid sequence identity exceeded
80% in these groups (http://projects.ibmh.msk.su/cpk),
and so the maximal index values corresponding to these
proteins were found in one gel slice.
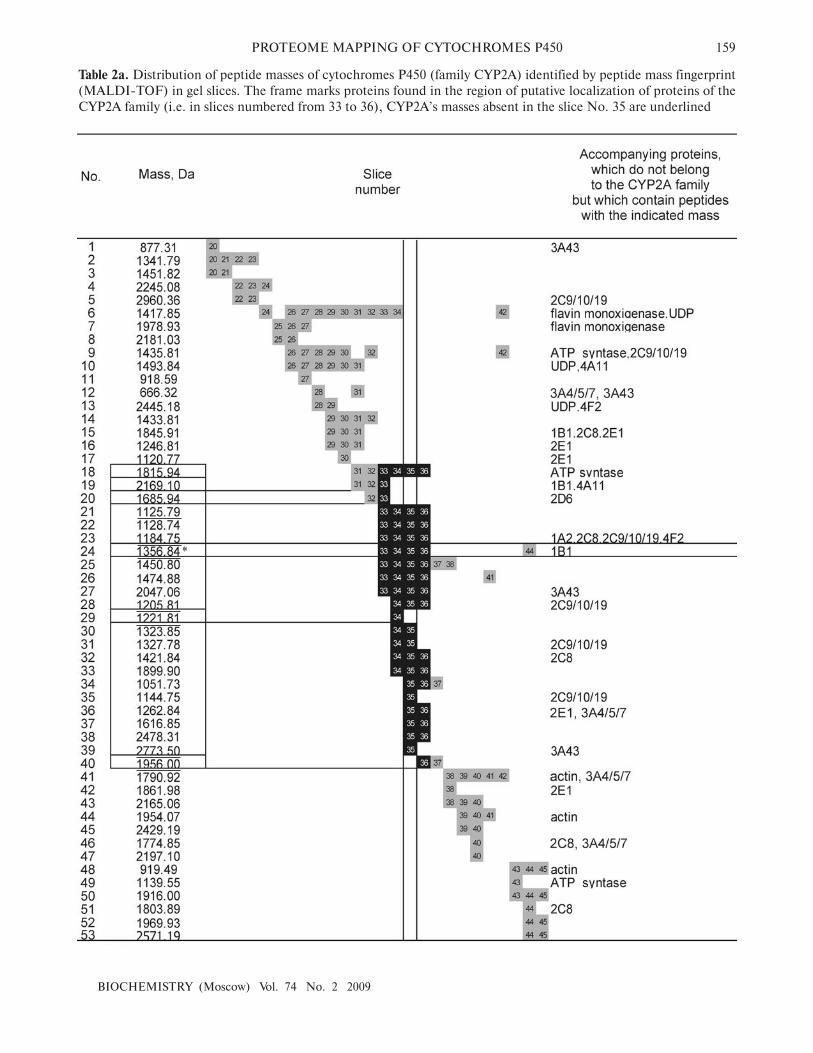
Integration of MS�data obtained using several adja�
cent slices increased amino acid coverage of a protein
localized in these slices. Table 2 (a and b) shows an exam�
ple of such integration for cytochromes P450 family
CYP2A. The rows of Table 2a contain information on
mass peptide fragments, and the rows of Table 2b show
indentified peptide sequences. Table columns correspond
to numbers of gel slices. Background indicates a number
of gel slice in which a particular peptide (or its molecular
mass) was detected. Table 2 shows that the largest number
of peptides was found in gel slice No. 35. Data of peptide
mass fingerprints (Table 2a) were not specific for the
CYP2A family. For example, the mass of 1356.84 (No.
24, Table 2) marked with an asterisk is typical not only for
proteolytic products of sequences of the CYP2A family,
but also for cytochrome CYP1B1. In the columns
“Accompanying proteins” of Table 2, such “degenerate”
masses are marked with the note that they do not belong
to the family of CYP2A proteins. In contrast with the
molecular mass values, peptide sequences are more spe�
cific with respect to the CYP2A family. Table 2b shows
that LC�MS/MS�identified peptides longer than seven
amino acid residues were detected only in proteins of the
CYP2A family. Peptides specific for CYP2A were detect�
ed in gel slices No. 33�36, whereas shorter nonspecific
peptides (No. 76�89, Table 2b) were basically detected in
all analyzed slices.
Data of Table 2 show that integration of the MS�data
from adjacent slices increases sequence coverage of par�
ticular proteins. The column of Table 2a corresponding to
slice No. 35 contained the most peptide masses assigned
to proteins of the CYP2A family; however, four
mass/charge values (2169.10, 1685.94, 1221.81, and
1956.00 Da) were not found. They were found in adjacent
slices numbered 33, 34, and 36. Integration of informa�
tion obtained from slices 33�36 resulted in 50% coverage,
whereas in the most informative slice No. 35 the coverage
level was 38%.
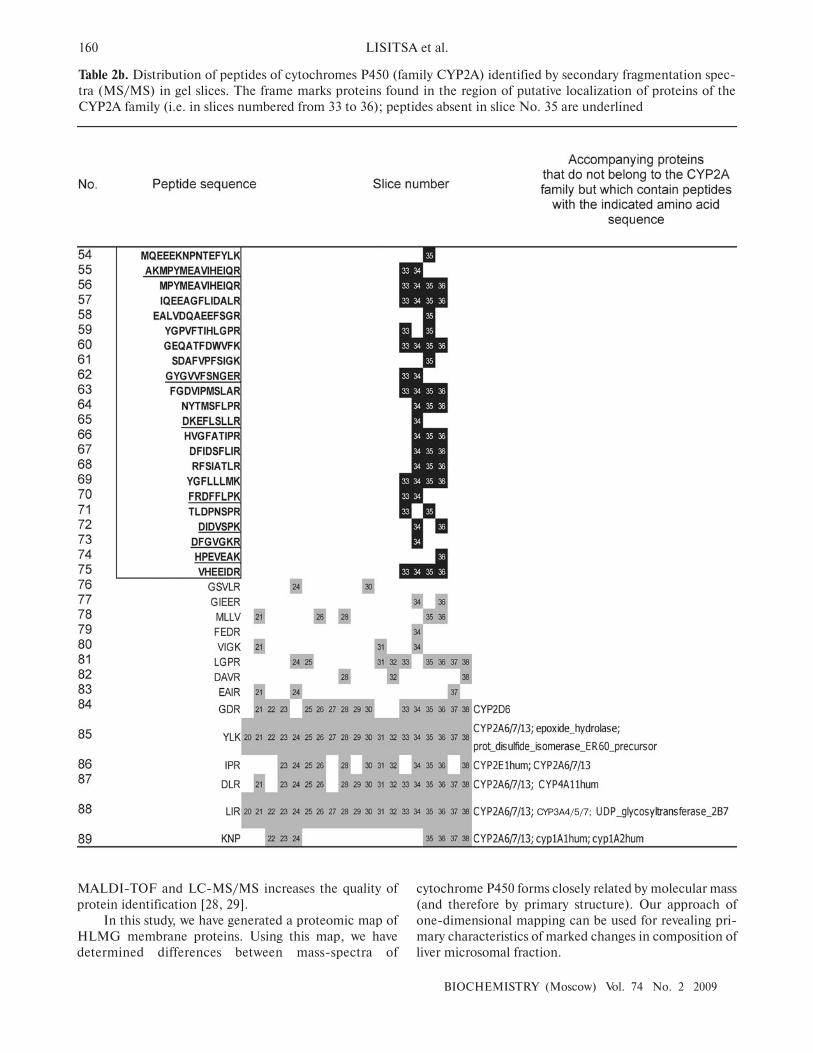
A similar situation was also observed for the MS/MS
data (Table 2b). For example, slice No. 35 did not con�
tain seven peptides included in Table 2b under the num�
bers 55, 62, 65, 70, 72, 73, and 74. Inclusion of these
peptides from the adjacent slices numbered 33, 34, and
36 resulted in the increase of sequence coverage from
30% (for slice No. 35) to 35%. In general, integration of
PMF� and MS/MS�data from the slices numbered 33�36
increased the sequence coverage up to 66%; this signifi�
cantly exceeds the level of 48% obtained using the single
most informative slice No. 35. Similar results were also
obtained by Lim et al. [28]; combining two mass spectro�
metric methods they obtained 70% level of sequence
coverage. For other analyzed liver microsomal samples
integration of the MS�data from adjacent slices also
increased sequence coverage of CYP2A (average value
12 ± 5%).
In some cases peptides identified by peptide mass
fingerprint did not overlap (partially or totally) with pep�
tides ionized in the electrospray. The MALDI�TOF
method revealed peptides that were not identified by
MS/MS�spectra. Thus, combined use of the methods
PROTEOME MAPPING OF CYTOCHROMES P450 159
BIOCHEMISTRY (Moscow) Vol. 74 No. 2 2009
Table 2a. Distribution of peptide masses of cytochromes P450 (family CYP2A) identified by peptide mass fingerprint
(MALDI�TOF) in gel slices. The frame marks proteins found in the region of putative localization of proteins of the
CYP2A family (i.e. in slices numbered from 33 to 36), CYP2A’s masses absent in the slice No. 35 are underlined
160 LISITSA et al.
BIOCHEMISTRY (Moscow) Vol. 74 No. 2 2009
MALDI�TOF and LC�MS/MS increases the quality of
protein identification [28, 29].
In this study, we have generated a proteomic map of
HLMG membrane proteins. Using this map, we have
determined differences between mass�spectra of
cytochrome P450 forms closely related by molecular mass
(and therefore by primary structure). Our approach of
one�dimensional mapping can be used for revealing pri�
mary characteristics of marked changes in composition of
liver microsomal fraction.
Table 2b. Distribution of peptides of cytochromes P450 (family CYP2A) identified by secondary fragmentation spec�
tra (MS/MS) in gel slices. The frame marks proteins found in the region of putative localization of proteins of the
CYP2A family (i.e. in slices numbered from 33 to 36); peptides absent in slice No. 35 are underlined
CYP3A4/5/7;
PROTEOME MAPPING OF CYTOCHROMES P450 161
BIOCHEMISTRY (Moscow) Vol. 74 No. 2 2009
This work was supported by the Russian Federal
Agency for Science and Innovations (contract
02.512.11.2105).
REFERENCES
1. Halligan, B. D., Slyper, R. Y., Twigger, S. N., Hicks, W.,
Olivier, M., and Green, A. S. (2005) J. Am. Soc. Mass
Spectrom., 16, 302�306.
2. Hufnagel, P., and Rabus, R. (2006) J. Mol. Microbiol.
Biotechnol., 11, 53�81.
3. Lubec, G., Afjehi�Sadat, L., Yang, J.�W., and John, J. P. P.
(2005) Progr. Neurobiol., 77, 90�127.
4. Afjehi�Sadat, L., Shin, J.�H., Felizardo, M., Lee, K.,
Slavc, I., and Lubec, G. (2005) Biochim. Biophys. Acta,
1747, 67�80.
5. Damodaran, S., Dlugos, C. A., Wood, T. D., and Rabin, R.
A. (2006) Eur. J. Pharm., 547, 75�82.
6. Chen, Y., Kwon, S. W., Kim, S. C., and Zhao, Y. (2005) J.
Proteome Res., 4, 998�1005.
7. Zuo, X., Echan, L., Hembach, P., Tang, H. Y., Speicher, K.
D., Santoli, D., and Speicher, D. W. (2001) Electrophoresis,
22, 1603�1615.
8. Xiong, Y., Chalmers, M. J., Gao, F. P., Cross, T. A., and
Marshall, A. G. (2005) J. Proteome Res., 4, 855�861.
9. Wang, Y., Al�Gaart, A., Seibert, C., Sharif, A., Lane, C., and
Griffiths, W. J. (2006) Biochem. Soc. Trans., 34, 1246�1251.
10. Simpson, R. J., Connolly, L. M., Eddes, J. S., Pereira, J. J.,
Moritz, R. L., and Reid, G. E. (2000) Electrophoresis, 21,
1707�1732.
11. Link, A. J., Eng, J., Schieltz, D., Carmack, E., Mize, G.,
Morris, G., Garvik, B., and Yates III, J. R. (1999) Nature
Biotechnol., 17, 676�682.
12. Nisar, S., Lane, C. S., and Wilderspin, A. F. (2004) Drug
Metab. Dispos., 32, 382�386.
13. Supek, F., Peharec, P., Krsnik�Rasol, M., and Smuc, T.
(2008) Proteomics, 8, 28�32.
14. Petushkova, N. A., Kanaeva, I. P., Lisitsa, A. V.,
Sheremetyeva, G. F., Zgoda, V. G., Samenkova, N. F.,
Karuzina, I. I., and Archakov, A. I. (2006) Toxicology in
vitro, 20, 966�974.
15. Anzenbacher, P., and Anzenbacherova, E. (2001) Cell. Mol.
Life Sci., 58, 737�747.
16. Kanaeva, I. P., Petushkova, N. A., Lisitsa, A. V., Lokhov, P.
G., Zgoda, V. G., Karuzina, I. I., and Archakov, A. I.
(2005) Toxicology in vitro, 19, 805�812.
17. Nelson, D. R., Koymans, L., Kamataki, T., Stegeman, J.
J., Feyereisen, R., Waxman, D. J., Waterman, M. R.,
Gotoh, O., Coon, M. J., and Estabrook, R. W. (1996)
Pharmacogenetics, 6, 1�42.
18. Archakov, A. I., Bachmanova, G. I., Blinder, L. V.,
Zhikhareva, V. O., Nanaeva, I. P., Karyakin, A. V.,
Karuzina, I. I., Khaitlina, S. Z., Borovyagin, V. L., and
Galuschenko, I. V. (1977) Biokhimiya, 42, 100�112.
19. Bradford, M. M. (1976) Anal. Biochem., 72, 248�254.
20. Neuhoff, V., Arold, N., Taube, D., and Ehrhardt, W. (1988)
Electrophoresis, 9, 255�262.
21. Shevchenko, A., Wilm, M., Vorm, O., and Mann, M.
(1996) Anal. Chem., 68, 850�858.
22. Ishihama, Y., Oda, Y., Tabata, T., Sato, T., Nagasu, T.,
Rappsilber, J., and Mann, M. (2005) Mol. Cell. Proteomics,
4, 1265�1272.
23. Lane, C. S., Nisar, S., and Griffiths, W. J. (2004) Eur. J.
Cancer, 40, 2127�2134.
24. Galeva, N., and Alterman, M. (2002) Proteomics, 2, 713�
722.
25. Ingelman�Sundberg, M., and Rodriguez�Antona, C.
(2005) Philos. Trans. R. Soc. Lond. B Biol. Sci., 360, 1563�
1570.
26. Archakov, A. I., and Bachmanova, G. I. (1990) in
Cytochrome P450 and Active Oxygen, Taylor and Francis,
London�New York, pp. 1�81.
27. Nisar, S., Lane, C. S., Wilderspin, A. F., Welham, K. J.,
Griffiths, W. J., and Patterson, L. H. (2004) Drug. Metab.
Dispos., 32, 382�386.
28. Lim, H., Eng, J., and Yates, J. R. (2003) J. Am. Soc. Mass
Spectrom., 14, 957�970.
29. Zhu, K., Kim, J., Yoo, C., Miller, F. R., and Lubman, D.
M. (2003) Anal. Biochem., 75, 6209�6217.

Related Documents