The distribution of Rusty Blackbirds on their wintering grounds: Potential hotpots and habitat associations Brian S. Evans, Powell, L.L., and Greenberg, R. AOU 2014

Welcome message from author
This document is posted to help you gain knowledge. Please leave a comment to let me know what you think about it! Share it to your friends and learn new things together.
Transcript

The distribution of Rusty Blackbirds on their wintering grounds: Potential hotpots and habitat associations
Brian S. Evans, Powell, L.L., and Greenberg, R. AOU 2014

1) Goal: Predict hot spots for large flocks of Rusty Blackbirds
2) Habitat distribution modeling: The pros and cons of the MaxEnt approach
3) Methods (Model development)
4) Methods (output) and results
Overview

1) How does prevalence vary by flock size? 2) Do different flock sizes represent different
ecological niches? 3) Which environmental variables best predict
the distribution of Rusty Blackbird flocks? 4) Did the Rusty Blackbird Blitz provide
improved predictions of habitat suitability?
Research questions

• MaxEnt or occupancy models? The trouble with 0’s • MaxEnt limitations:
– Models distribution in realized niche space (hot spots?) – Models tend to be overfit
• Interaction and quadratic terms – Models may be heavily influenced by sampling bias – Observations are spatially autocorrelated
Methods: Distribution modeling overview

• Data collected from RUBL Blitz and eBird
• Subset to Blitz months (Jan-Feb) and flock size classes.
• Extracted to 4 km resolution grid
Model building: observational data

Model building: Environmental data
• Land cover: US GAP Analysis Project, 30 m resolution – Reclassified into classes
considered predictive of RUBL distribution
– Aggregated to a grain size of 4 km
• Climate: precipitation (ppt) and minimum temperature (tmin): US PRISM, 4 km resolution

Model building/processing example: Black Belt Alabama Reclassified land cover Binary land cover, floodplain Proportional land cover
Maximum entropy model output: Probability of habitat suitability

Model building: “Overcoming” bias and model overfitting
• Sampling bias: – Background points
generated from non-RUBL observations with eBird from Jan-Feb of sampled years.
• Model overfitting – Interactions and quadratic
terms added individually prior to modeling
– AIC used for selection of beta parameter

Model building

Does prevalence of suitable habitats vary by flock size?

Does prevalence of suitable habitats vary by flock size?
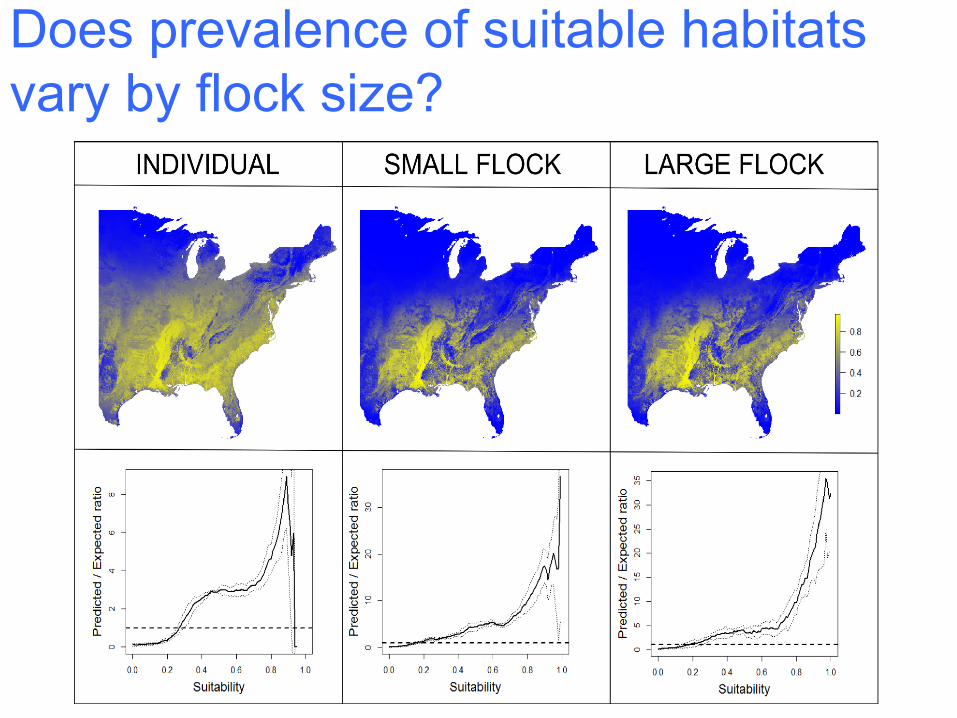
Does prevalence of suitable habitats vary by flock size?


Do different flock sizes occupy different realized niche space?
(Warren 2008)

Variable Percent contribution
Tmin 53.4 Floodplain 22.6 Row crop 5.1
PPT 4.8 Pasture 2.8
Variable Percent contribution
Tmin 62.6 Floodplain 12
PPT 5.9 Row crop 5.4 Pasture 3.6
Variable Percent contribution
Tmin 69.3 Floodplain 7.9 Row crop 5.2
PPT 5.0 Pasture 2.4
Which environmental variables contribute the most to habitat suitability for individual, small flock, and large flock observations?
Individual observations
Small flock observations
Large flock observations

Which environmental variables contribute the most to habitat suitability for individual, small flock, and large flock observations?

Which environmental variables contribute the most to habitat suitability for individual, small flock, and large flock observations?
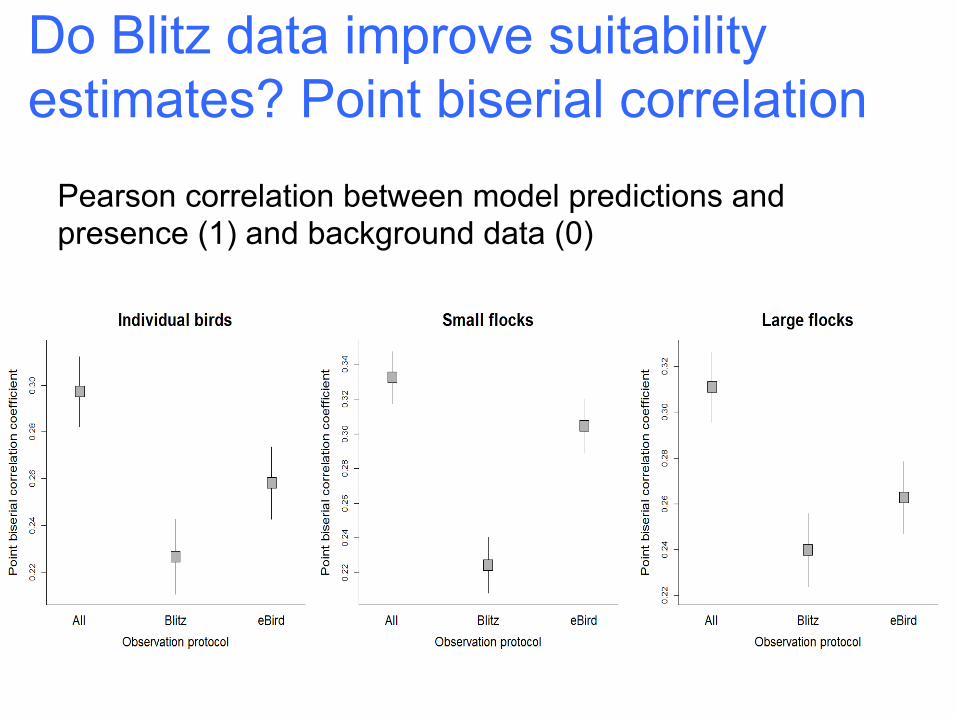
Do Blitz data improve suitability estimates? Point biserial correlation
Pearson correlation between model predictions and presence (1) and background data (0)

Conclusions 1) Prevalence decreases with increasing flock size but was similar for small and large flocks.
2) Realized ecological niches differed across flock size classes.
3) Minimum temperature and floodplain forest were most predictive of the RUBL distributions across flock size classes.
4) For large flock and individual sightings, Blitz data improved suitability estimates.
Related Documents