Abstract — The main purpose of this paper is to extend the reasons why linear equation systems, under the appropriate conditions, must be solved by their graph-based representation. Such representation in the solution of systems of linear equations is an efficient alternative to the matrix representation. Among its benefits we have the sparse management of the information of the system in question in a natural way, and as will be explained in this document, it gives rise to active and non-active regions that if they are attacked in the traditional way through i.e. matrix, the algorithms developed will be inefficient. This type of systems appears naturally in problems of nonlinear programming and therefore its knowledge and especially application can make the solution of a Nonlinear Programming problem more efficient. Index Terms— Linear Equation Systems, Graphs, Optimization, Lagrange Multipliers, Linear Constraints. I. INTRODUCTION HE main purpose of this paper is to extend the reasons why linear equation systems (SEL), under the appropriate conditions, must be solved by their graph-based representation. Such representation in the solution of systems of linear equations is an efficient alternative to the matrix representation. Among its benefits we have the dispersed management of the information of the system in question in a natural way, and as will be explained in this document, it gives rise to active and non-active regions that if they are attacked in the traditional way through the matrices, the algorithms developed will be inefficient. This type of systems appears naturally in nonlinear programming (NLP) problems and therefore their knowledge and especially application can make the solution of a NLP more efficient. This paper is organized as follows: Section II gives a review of the work related to this document, then in Section III the Gaussian elimination is thoroughly analyzed. In Section IV, the SELs are related to the optimization methods for NLP. Next, in section V, these methods are exemplified with the problem of economic dispatch. Finally in section VI, some conclusions of the work presented here are given. Manuscript received July 20, 2017; revised August 5, 2017. This work was supported by the Universidad Michoacana de San Nicolás de Hidalgo. Jaime Cerda is with the Universidad Michoacana de San Nicolás de Hidalgo, Morelia, MX (Phone: +52 443 1826246; e-mail: [email protected]). Jose Alberto Ávalos is with the Universidad Michoacana de San Nicolás de Hidalgo, Morelia,. MX II. RELATED WORK Graph-based methods have been developed as an efficient alternative to the SELs solution. In this section we will refer to some of these contributions that the authors have developed. In [1] an algorithm is presented to make clusters of electrical circuits in order to perform qualitative analysis in its operation. Also [2] and [3] present some techniques for regrouping to extend the model in [1] to support topological changes in qualitative analysis. In [4] some techniques are presented for qualitative reasoning tasks in circuits under fault conditions. In [5] methodologies are presented for the efficient modeling of linear circuits in qualitative reasoning tasks. [6] presents an algorithm that allows to dimension the height of the graphs generated by the clustering algorithms. In [7] theoretical elements are given for the scope of the tasks of qualitative reasoning in electrical circuits. [8] presents a methodology to decentralize a power system based on graphs while [9] introduces an agent-based simulator to solve the electric power market whose underlying model is based on graphs and its decentralization. In [10] the formal model of the simulator mentioned above is presented. Finally, [11] provides techniques for the manipulation of graphs to solve the economic dispatch without the need to use slack variables. III. THE GAUSSIAN ELIMINATION Generally the Gaussian elimination is learned as an operation in which we eliminate a variable of our system replacing the remaining elements of the matrix using the eliminated elements. When such elimination is done by means of graphics, a new world of interpretations and possibilities open up to make the solution process more efficient. In general we know that sparse methods are the way to go when we have sparse matrices. Some methods of elimination are based on the degree of the nodes to determine the order of elimination and some more go beyond by simulating some eliminations to decide which is the best way to go. Little has been done to take advantage of the sparsity apart from the aforementioned. Figure 1 shows a matrix representing a sparse system and therefore the underlying matrix is sparse. On the Use of Graphs to Efficiently Solve Optimization Problems J. Cerda, A. Avalos T Proceedings of the World Congress on Engineering and Computer Science 2017 Vol I WCECS 2017, October 25-27, 2017, San Francisco, USA ISBN: 978-988-14047-5-6 ISSN: 2078-0958 (Print); ISSN: 2078-0966 (Online) WCECS 2017

Welcome message from author
This document is posted to help you gain knowledge. Please leave a comment to let me know what you think about it! Share it to your friends and learn new things together.
Transcript
Abstract — The main purpose of this paper is to extend the
reasons why linear equation systems, under the appropriate conditions, must be solved by their graph-based representation. Such representation in the solution of systems of linear equations is an efficient alternative to the matrix representation. Among its benefits we have the sparse management of the information of the system in question in a natural way, and as will be explained in this document, it gives rise to active and non-active regions that if they are attacked in the traditional way through i.e. matrix, the algorithms developed will be inefficient. This type of systems appears naturally in problems of nonlinear programming and therefore its knowledge and especially application can make the solution of a Nonlinear Programming problem more efficient.
Index Terms— Linear Equation Systems, Graphs, Optimization, Lagrange Multipliers, Linear Constraints.
I. INTRODUCTION HE main purpose of this paper is to extend the
reasons why linear equation systems (SEL), under the appropriate conditions, must be solved by their graph-based representation. Such representation in the solution of systems of linear equations is an efficient alternative to the matrix representation. Among its benefits we have the dispersed management of the information of the system in question in a natural way, and as will be explained in this document, it gives rise to active and non-active regions that if they are attacked in the traditional way through the matrices, the algorithms developed will be inefficient. This type of systems appears naturally in nonlinear programming (NLP) problems and therefore their knowledge and especially application can make the solution of a NLP more efficient.
This paper is organized as follows: Section II gives a
review of the work related to this document, then in Section III the Gaussian elimination is thoroughly analyzed. In Section IV, the SELs are related to the optimization methods for NLP. Next, in section V, these methods are exemplified with the problem of economic dispatch. Finally in section VI, some conclusions of the work presented here are given.
Manuscript received July 20, 2017; revised August 5, 2017. This work was supported by the Universidad Michoacana de San Nicolás de Hidalgo. Jaime Cerda is with the Universidad Michoacana de San Nicolás de Hidalgo, Morelia, MX (Phone: +52 443 1826246; e-mail: [email protected]). Jose Alberto Ávalos is with the Universidad Michoacana de San Nicolás de Hidalgo, Morelia,. MX
II. RELATED WORK Graph-based methods have been developed as an efficient
alternative to the SELs solution. In this section we will refer to some of these contributions that the authors have developed. In [1] an algorithm is presented to make clusters of electrical circuits in order to perform qualitative analysis in its operation. Also [2] and [3] present some techniques for regrouping to extend the model in [1] to support topological changes in qualitative analysis. In [4] some techniques are presented for qualitative reasoning tasks in circuits under fault conditions. In [5] methodologies are presented for the efficient modeling of linear circuits in qualitative reasoning tasks. [6] presents an algorithm that allows to dimension the height of the graphs generated by the clustering algorithms. In [7] theoretical elements are given for the scope of the tasks of qualitative reasoning in electrical circuits. [8] presents a methodology to decentralize a power system based on graphs while [9] introduces an agent-based simulator to solve the electric power market whose underlying model is based on graphs and its decentralization. In [10] the formal model of the simulator mentioned above is presented. Finally, [11] provides techniques for the manipulation of graphs to solve the economic dispatch without the need to use slack variables.
III. THE GAUSSIAN ELIMINATION Generally the Gaussian elimination is learned as an
operation in which we eliminate a variable of our system replacing the remaining elements of the matrix using the eliminated elements. When such elimination is done by means of graphics, a new world of interpretations and possibilities open up to make the solution process more efficient. In general we know that sparse methods are the way to go when we have sparse matrices. Some methods of elimination are based on the degree of the nodes to determine the order of elimination and some more go beyond by simulating some eliminations to decide which is the best way to go. Little has been done to take advantage of the sparsity apart from the aforementioned. Figure 1 shows a matrix representing a sparse system and therefore the underlying matrix is sparse.
On the Use of Graphs to Efficiently Solve Optimization Problems
J. Cerda, A. Avalos
T
Proceedings of the World Congress on Engineering and Computer Science 2017 Vol I WCECS 2017, October 25-27, 2017, San Francisco, USA
ISBN: 978-988-14047-5-6 ISSN: 2078-0958 (Print); ISSN: 2078-0966 (Online)
WCECS 2017

Figure 1 A sparse linear equations system a) Matrix Representation b) Graph-based representation
A. Gaussian Elimination and its Graph-based Interpretation.
Figure 2, presents the effect of the matrix-based Gaussian
elimination when applied to node 1. As we can see two elements are created (the ones in red) and two others are modified (the two in dark gray) while four elements are eliminated (those in light gray).
Figure 2 Matrix representation - a) Before elimination b) After elimination
Figure 3, presents the effect of the graph-based Gaussian elimination when applied to node 1. As we can see two links are created (the ones in red) and two others are modified (the two in dark gray) while four links are eliminated (those in light gray).
Figure 3 Graph representation - a) Before elimination b) After elimination
B. A SEL graph representation
Figure 4 represents a graph-based equation. The value of the white semicircle, xi, is the variable whose value we want to know, the gray semicircle element, aii, is the coefficient of the variable of which we want to know its value i.e. the element of the diagonal of the row i of the matrix, the element associated to the link bi is the element of the right side of the equation. The arcs aij are the different coefficients of row i of the matrix, the coefficient j indicates the variable xj to which the coefficient is associated.
Figure 4 A Graph-based equation representation
C. THE GAUSSIAN ELEMINATION: THREE SPECIAL CASES
In this section three special cases of Gaussian elimination will be analyzed, two are markedly popular in the world of electric circuits and the third will be the reduction that allows to carry out efficient calculations.
1) Y-∆ Reduction
In the star mesh reduction, the node to be removed is connected to three nodes, so upon being removed, interconnections will be generated between such nodes, i.e. Up to three elements will be generated, as illustrated in Figure 5.
Figure 5 Y-∆ Reduction
2) Series Reduction
In the series reduction, the node to be removed is
connected to two other nodes, so when it is removed, interconnections will be generated between such nodes, i.e. up to one element will be generated, as illustrated in Figure 6.
Figure 6 Series Reduction
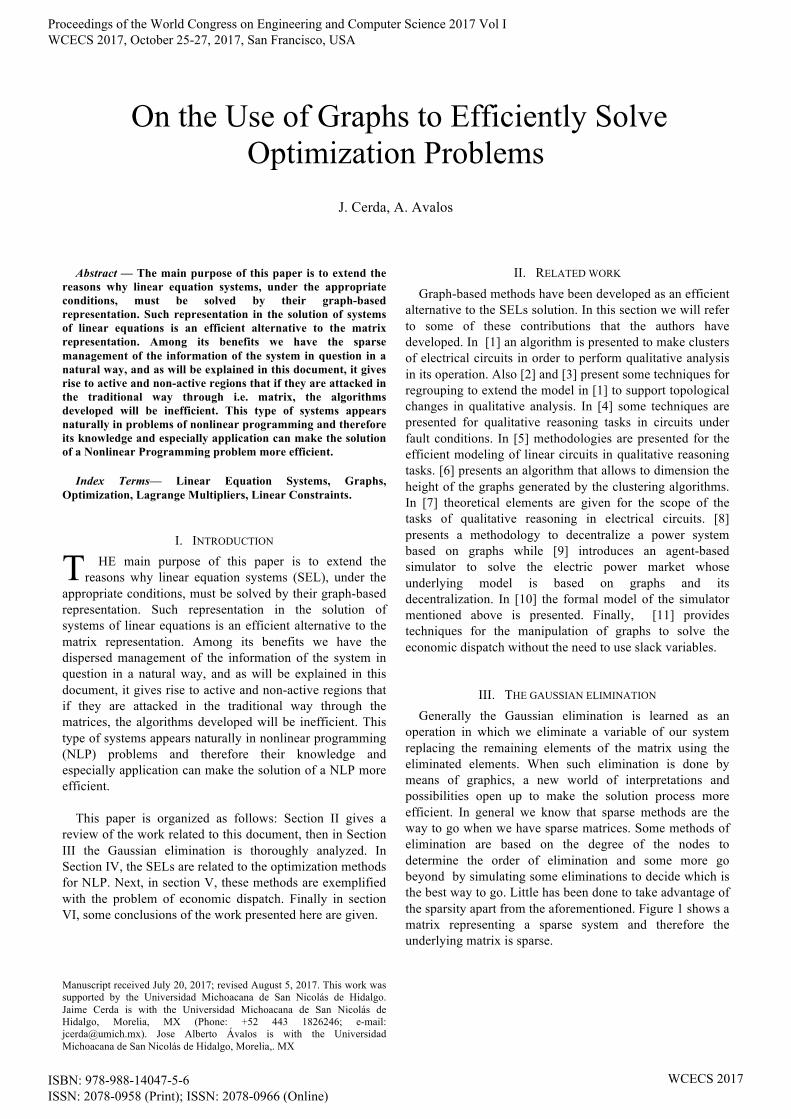
3) Hanging Node Reduction
The reduction of a node that is only connected to another
node is the part that in several contributions has resulted in algorithms more efficient in the process of solution of the SELs, since no new elements in such reduction are generated, as it is illustrated in Fig. 7.
Proceedings of the World Congress on Engineering and Computer Science 2017 Vol I WCECS 2017, October 25-27, 2017, San Francisco, USA
ISBN: 978-988-14047-5-6 ISSN: 2078-0958 (Print); ISSN: 2078-0966 (Online)
WCECS 2017
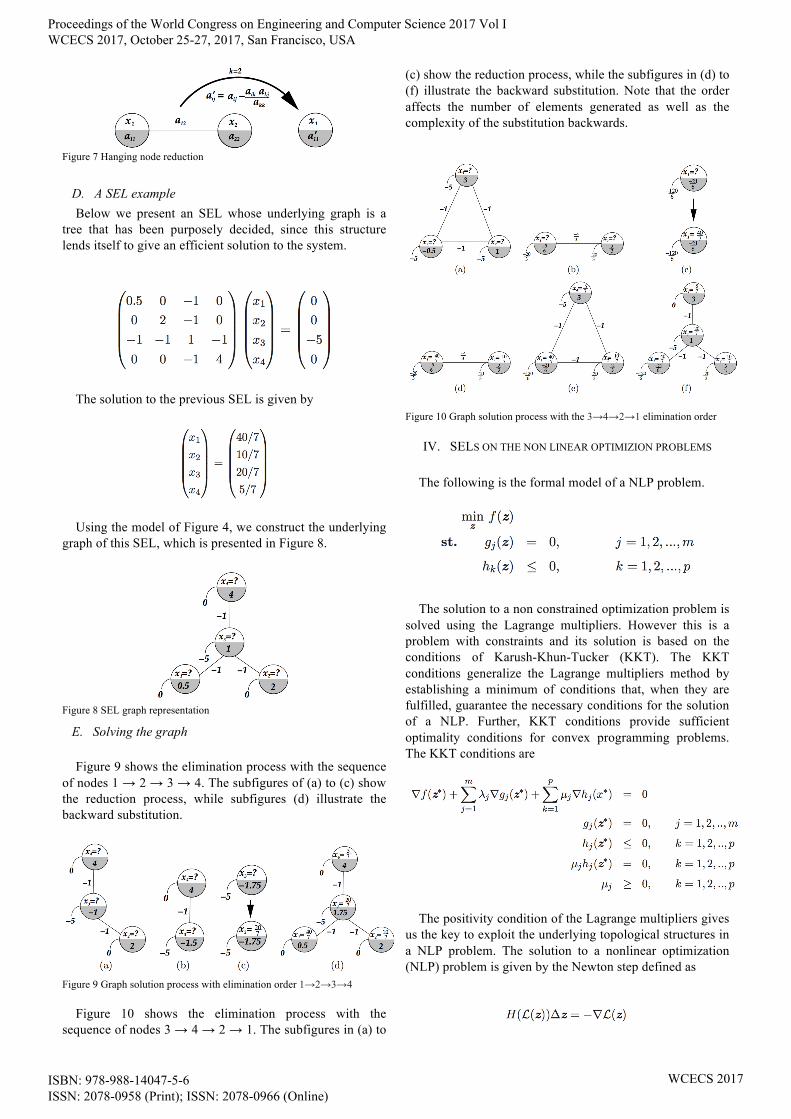
Figure 7 Hanging node reduction
D. A SEL example Below we present an SEL whose underlying graph is a
tree that has been purposely decided, since this structure lends itself to give an efficient solution to the system.
The solution to the previous SEL is given by
Using the model of Figure 4, we construct the underlying graph of this SEL, which is presented in Figure 8.
Figure 8 SEL graph representation
E. Solving the graph
Figure 9 shows the elimination process with the sequence of nodes 1 → 2 → 3 → 4. The subfigures of (a) to (c) show the reduction process, while subfigures (d) illustrate the backward substitution.
Figure 9 Graph solution process with elimination order 1→2→3→4
Figure 10 shows the elimination process with the sequence of nodes 3 → 4 → 2 → 1. The subfigures in (a) to
(c) show the reduction process, while the subfigures in (d) to (f) illustrate the backward substitution. Note that the order affects the number of elements generated as well as the complexity of the substitution backwards.
Figure 10 Graph solution process with the 3→4→2→1 elimination order
IV. SELS ON THE NON LINEAR OPTIMIZION PROBLEMS
The following is the formal model of a NLP problem.
The solution to a non constrained optimization problem is solved using the Lagrange multipliers. However this is a problem with constraints and its solution is based on the conditions of Karush-Khun-Tucker (KKT). The KKT conditions generalize the Lagrange multipliers method by establishing a minimum of conditions that, when they are fulfilled, guarantee the necessary conditions for the solution of a NLP. Further, KKT conditions provide sufficient optimality conditions for convex programming problems. The KKT conditions are
The positivity condition of the Lagrange multipliers gives us the key to exploit the underlying topological structures in a NLP problem. The solution to a nonlinear optimization (NLP) problem is given by the Newton step defined as
Proceedings of the World Congress on Engineering and Computer Science 2017 Vol I WCECS 2017, October 25-27, 2017, San Francisco, USA
ISBN: 978-988-14047-5-6 ISSN: 2078-0958 (Print); ISSN: 2078-0966 (Online)
WCECS 2017

We can see that it is a SEL when the parameters and variables of the system are instantiated in this equation.
V. SOLVING THE ECONOMICAL DISPATCH PROBLEM
We apply Newton's step to the problem of economic dispatch described by the following system (Wollenber & wood1996)
Figure 11 A one node and three generators system
whose production models for the generators are expressed by a quadratic form equation
The data for this system are given in Table I
TABLE I. TEST SYSTEM DATA
The graphs representing these data are given in Figure 12
FIGURE 12. Production function graphs
The optimization problem to solve is given by
The Lagrangian of this problem and the parts involving
Newton's passage are given in Table II.
TABLE II. NEWTON STEP COMPONENTS
Following the procedure of section II, we can derive the graph of this system, which is illustrated by Figure 12. Note that the elements connecting the lower layers of the graph are taken into account only if this is necessary, for this case in particular, we will consider them if the corresponding Lagrange multiplier is positive. This is a big difference, since in the case of the matrix formulation, it would be necessary to enter the corresponding rows and columns when the associated Lagrange multiplier is positive and if not, delete the corresponding row and column. This entails a considerable computational effort. This is what we have called conditional sparse patterns, which so far has not been taken into account.
FIGURE 13 A The Economical Dispatch Problem Graph
Representation By applying the solution method described in section
III.C to the previous graph we obtain the illustrated in Fig.
Proceedings of the World Congress on Engineering and Computer Science 2017 Vol I WCECS 2017, October 25-27, 2017, San Francisco, USA
ISBN: 978-988-14047-5-6 ISSN: 2078-0958 (Print); ISSN: 2078-0966 (Online)
WCECS 2017
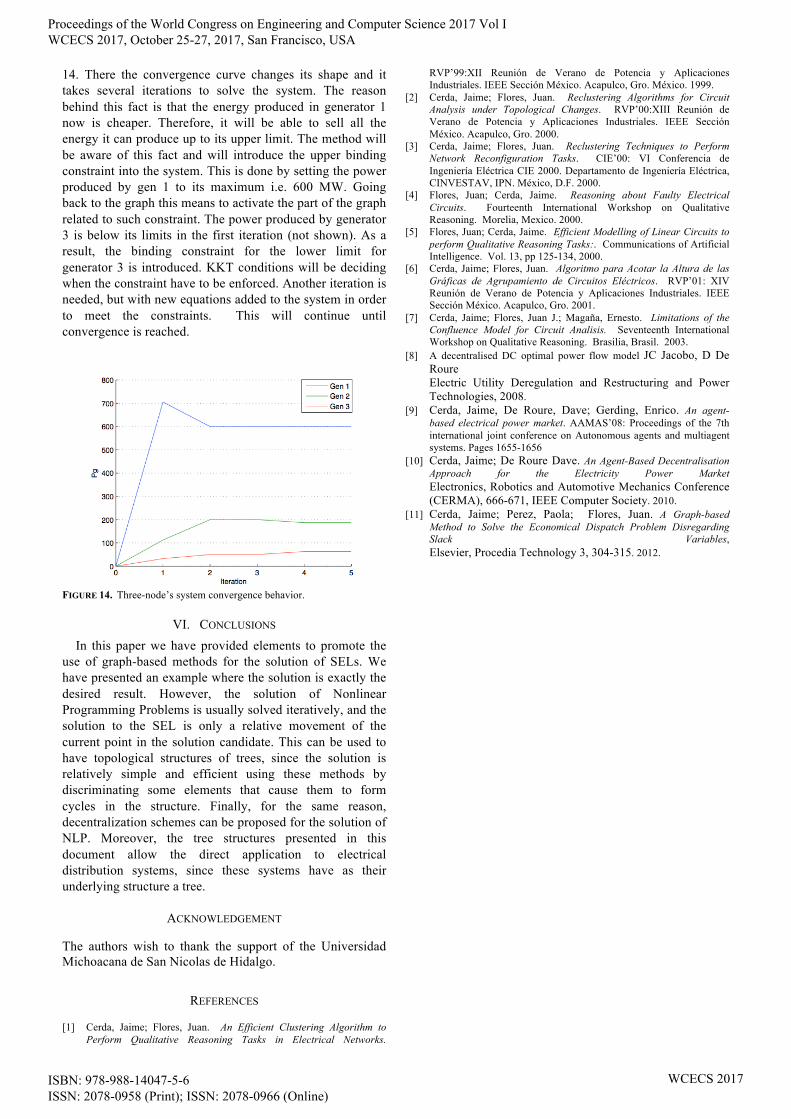
14. There the convergence curve changes its shape and it takes several iterations to solve the system. The reason behind this fact is that the energy produced in generator 1 now is cheaper. Therefore, it will be able to sell all the energy it can produce up to its upper limit. The method will be aware of this fact and will introduce the upper binding constraint into the system. This is done by setting the power produced by gen 1 to its maximum i.e. 600 MW. Going back to the graph this means to activate the part of the graph related to such constraint. The power produced by generator 3 is below its limits in the first iteration (not shown). As a result, the binding constraint for the lower limit for generator 3 is introduced. KKT conditions will be deciding when the constraint have to be enforced. Another iteration is needed, but with new equations added to the system in order to meet the constraints. This will continue until convergence is reached.
FIGURE 14. Three-node’s system convergence behavior.
VI. CONCLUSIONS In this paper we have provided elements to promote the
use of graph-based methods for the solution of SELs. We have presented an example where the solution is exactly the desired result. However, the solution of Nonlinear Programming Problems is usually solved iteratively, and the solution to the SEL is only a relative movement of the current point in the solution candidate. This can be used to have topological structures of trees, since the solution is relatively simple and efficient using these methods by discriminating some elements that cause them to form cycles in the structure. Finally, for the same reason, decentralization schemes can be proposed for the solution of NLP. Moreover, the tree structures presented in this document allow the direct application to electrical distribution systems, since these systems have as their underlying structure a tree.
ACKNOWLEDGEMENT
The authors wish to thank the support of the Universidad Michoacana de San Nicolas de Hidalgo.
REFERENCES
[1] Cerda, Jaime; Flores, Juan. An Efficient Clustering Algorithm to Perform Qualitative Reasoning Tasks in Electrical Networks.
RVP’99:XII Reunión de Verano de Potencia y Aplicaciones Industriales. IEEE Sección México. Acapulco, Gro. México. 1999.
[2] Cerda, Jaime; Flores, Juan. Reclustering Algorithms for Circuit Analysis under Topological Changes. RVP’00:XIII Reunión de Verano de Potencia y Aplicaciones Industriales. IEEE Sección México. Acapulco, Gro. 2000.
[3] Cerda, Jaime; Flores, Juan. Reclustering Techniques to Perform Network Reconfiguration Tasks. CIE’00: VI Conferencia de Ingeniería Eléctrica CIE 2000. Departamento de Ingeniería Eléctrica, CINVESTAV, IPN. México, D.F. 2000.
[4] Flores, Juan; Cerda, Jaime. Reasoning about Faulty Electrical Circuits. Fourteenth International Workshop on Qualitative Reasoning. Morelia, Mexico. 2000.
[5] Flores, Juan; Cerda, Jaime. Efficient Modelling of Linear Circuits to perform Qualitative Reasoning Tasks:. Communications of Artificial Intelligence. Vol. 13, pp 125-134, 2000.
[6] Cerda, Jaime; Flores, Juan. Algoritmo para Acotar la Altura de las Gráficas de Agrupamiento de Circuitos Eléctricos. RVP’01: XIV Reunión de Verano de Potencia y Aplicaciones Industriales. IEEE Sección México. Acapulco, Gro. 2001.
[7] Cerda, Jaime; Flores, Juan J.; Magaña, Ernesto. Limitations of the Confluence Model for Circuit Analisis. Seventeenth International Workshop on Qualitative Reasoning. Brasilia, Brasil. 2003.
[8] A decentralised DC optimal power flow model JC Jacobo, D De Roure Electric Utility Deregulation and Restructuring and Power Technologies, 2008.
[9] Cerda, Jaime, De Roure, Dave; Gerding, Enrico. An agent-based electrical power market. AAMAS’08: Proceedings of the 7th international joint conference on Autonomous agents and multiagent systems. Pages 1655-1656
[10] Cerda, Jaime; De Roure Dave. An Agent-Based Decentralisation Approach for the Electricity Power Market Electronics, Robotics and Automotive Mechanics Conference (CERMA), 666-671, IEEE Computer Society. 2010.
[11] Cerda, Jaime; Perez, Paola; Flores, Juan. A Graph-based Method to Solve the Economical Dispatch Problem Disregarding Slack Variables, Elsevier, Procedia Technology 3, 304-315. 2012.
Proceedings of the World Congress on Engineering and Computer Science 2017 Vol I WCECS 2017, October 25-27, 2017, San Francisco, USA
ISBN: 978-988-14047-5-6 ISSN: 2078-0958 (Print); ISSN: 2078-0966 (Online)
WCECS 2017
Related Documents


