Energy and Buildings 35 (2003) 997–1008 On the thermal behaviour of roof-mounted radiant barriers under tropical and humid climatic conditions: modelling and empirical validation Frédéric Miranville ∗ , Harry Boyer, Thierry Mara, François Garde Laboratoire de Génie Industriel, University of Reunion Island, 40 Avenue de Soweto, 97 410 Saint-Pierre, France Received 7 January 2003; received in revised form 15 February 2003; accepted 16 March 2003 Abstract This paper deals with the empirical validation of a building thermal model, which includes a roof-mounted radiant barrier. We first present the thermal model, developed with a building simulation code prototype, the objective being to increase understanding of the thermal phenomena that govern the behaviour of the whole building. We then describe the experimental test cell, with emphasis on the details of the roof. A sensitivity analysis technique is applied to the model which shows that convective heat transfer is of great importance for the dry-air temperature of the roof air layer. The origin of the disagreement between measurements and model predictions is then identified as being due to one of the convective heat transfer coefficients. Once this is modified the agreement is found to be acceptable. © 2003 Elsevier Science B.V. All rights reserved. Keywords: Radiant barriers; Building thermal simulation; Model validation; Sensitivity analysis 1. Overall context and methodology In hot climates, action must be taken against solar heating to improve thermal comfort in buildings, and to minimise the need for active cooling, which is responsible for heavy electricity consumption. When used widely, particularly in an enclosed context, active cooling results in significant pro- duction constraints. Solar energy affects the whole building, but in particular the roof, because this surface is the most exposed to the sun. Therefore, if we wish to reduce the energetic contribution from the roof, several solutions are possible, one of which is thermal insulation. Mass insulation is generally used and feature very low thermal conductivity, of the order of 0.05 W m −1 K −1 . Therefore, they reduce heat transfer due to conduction. Mineral wool and expanded foam (polyurethane and polystyrene) are examples. Nevertheless, this type of thermal insulation do not reduce thermal radiation, which is a non-negligible form of heat transfer, particularly in the case of roofs which feature air layers. Devices which help to reduce heat transfer due to radiation are known under the generic name ‘Radiant Barrier Systems’, or RBS. ∗ Corresponding author. Tel.: +33-262-96-28-96; fax: +33-262-96-28-99. E-mail address: [email protected] (F. Miranville). 1.1. Description of the RBS The RBS are thin membranes, the faces of which are covered by a material with very low emissivity, which gives them a polished and therefore reflective appearance. Such surfaces release very little thermal radiation compared to the surfaces typically used in buildings. They also reflect much of the incident longwave radiation, and in this way significantly reduce the radiation heat transfer across the wall into which they have been inserted. 1.2. Literature review There have been many international studies of RBS pub- lished, with the following subjects: • assessment of energetic performance, • effect of location on energetic performance, • effect of the rate and type of ventilation on energetic per- formance, • effect of settling dust on energetic performance, • effect of humidity on energetic performance. Most of these studies come from the USA and for the most part consider an attic, either ventilated or not, featur- ing nominal thermal insulation using mineral wool, charac- terised by a thermal resistance R [1,2]. These studies aim to assess the effect of adding an RBS to such a device, by 0378-7788/$ – see front matter © 2003 Elsevier Science B.V. All rights reserved. doi:10.1016/S0378-7788(03)00035-5

Welcome message from author
This document is posted to help you gain knowledge. Please leave a comment to let me know what you think about it! Share it to your friends and learn new things together.
Transcript
Energy and Buildings 35 (2003) 997–1008
On the thermal behaviour of roof-mounted radiant barriers under tropicaland humid climatic conditions: modelling and empirical validation
Frédéric Miranville∗, Harry Boyer, Thierry Mara, François GardeLaboratoire de Génie Industriel, University of Reunion Island, 40 Avenue de Soweto, 97 410 Saint-Pierre, France
Received 7 January 2003; received in revised form 15 February 2003; accepted 16 March 2003
Abstract
This paper deals with the empirical validation of a building thermal model, which includes a roof-mounted radiant barrier. We firstpresent the thermal model, developed with a building simulation code prototype, the objective being to increase understanding of thethermal phenomena that govern the behaviour of the whole building. We then describe the experimental test cell, with emphasis on thedetails of the roof. A sensitivity analysis technique is applied to the model which shows that convective heat transfer is of great importancefor the dry-air temperature of the roof air layer. The origin of the disagreement between measurements and model predictions is thenidentified as being due to one of the convective heat transfer coefficients. Once this is modified the agreement is found to be acceptable.© 2003 Elsevier Science B.V. All rights reserved.
Keywords:Radiant barriers; Building thermal simulation; Model validation; Sensitivity analysis
1. Overall context and methodology
In hot climates, action must be taken against solar heatingto improve thermal comfort in buildings, and to minimisethe need for active cooling, which is responsible for heavyelectricity consumption. When used widely, particularly inan enclosed context, active cooling results in significant pro-duction constraints.
Solar energy affects the whole building, but in particularthe roof, because this surface is the most exposed to the sun.Therefore, if we wish to reduce the energetic contributionfrom the roof, several solutions are possible, one of whichis thermal insulation.
Mass insulation is generally used and feature very lowthermal conductivity, of the order of 0.05 W m−1 K−1.Therefore, they reduce heat transfer due to conduction.Mineral wool and expanded foam (polyurethane andpolystyrene) are examples.
Nevertheless, this type of thermal insulation do not reducethermal radiation, which is a non-negligible form of heattransfer, particularly in the case of roofs which feature airlayers. Devices which help to reduce heat transfer due toradiation are known under the generic name ‘Radiant BarrierSystems’, or RBS.
∗ Corresponding author. Tel.:+33-262-96-28-96;fax: +33-262-96-28-99.E-mail address:[email protected] (F. Miranville).
1.1. Description of the RBS
The RBS are thin membranes, the faces of which arecovered by a material with very low emissivity, which givesthem a polished and therefore reflective appearance. Suchsurfaces release very little thermal radiation compared tothe surfaces typically used in buildings. They also reflectmuch of the incident longwave radiation, and in this waysignificantly reduce the radiation heat transfer across thewall into which they have been inserted.
1.2. Literature review
There have been many international studies of RBS pub-lished, with the following subjects:
• assessment of energetic performance,• effect of location on energetic performance,• effect of the rate and type of ventilation on energetic per-
formance,• effect of settling dust on energetic performance,• effect of humidity on energetic performance.
Most of these studies come from the USA and for themost part consider an attic, either ventilated or not, featur-ing nominal thermal insulation using mineral wool, charac-terised by a thermal resistanceR [1,2]. These studies aimto assess the effect of adding an RBS to such a device, by
0378-7788/$ – see front matter © 2003 Elsevier Science B.V. All rights reserved.doi:10.1016/S0378-7788(03)00035-5

998 F. Miranville et al. / Energy and Buildings 35 (2003) 997–1008
Table 1The different attributes of the attic models
Models Fairey Wilkes Winiarski Medina Petrie Moujaes
Conduction: steady state � � �Conduction: transient state � � �Convection: mixed, correlations � � � � � �Radiation: infinite parallel planes �Radiation: radiosity method � � � � �Humidity: sorption/desorption of materials � � �Takes into account effect of rafter radiation �Takes into account effect of air stratification � � �Takes into account effect of air distribution duct � �
analysing the factors listed above and the relevant thermalphenomena.
The following conclusions can be drawn from these ex-perimental studies conducted in the field:
• It is difficult to calculate the thermal resistance of the attic(in the steady state) when an RBS is installed in additionto existing thermal insulation; in fact, depending on thenominal thermal resistance of the attic, the measured ef-fective thermal resistance is found to be double or eventriple of the calculated one[3].
The results concerning the effect of ventilation condi-tions on the global behaviour of an attic with an RBS aremixed. Indeed, there are two conflicting views:
• The first claims that the attic plus RBS ventilation has animportant effect on the global thermal performance. AnRBS/ventilation synergy has been cited as explaining whythe coupling of an RBS and ventilation can give muchbetter thermal behaviour than the same attic without anRBS; further, it has been claimed that the improvementin performance due to ventilation has a threshold, beyondwhich the improvement is insignificant.
• The second maintains that neither the conditions, nor thetype of ventilation are significant factors in the globalperformance of the attic, the differences in performanceobserved being very small.
As far as the location of the RBS is concerned, all thestudies have shown that placing the RBS above the existingmass thermal insulation gives improved performance. How-ever, all the authors also recognise that this position is themost vulnerable to collecting dust, and to the associated de-terioration in performance[4].
Finally, studies of humidity problems have shown that inclimates with an average relative humidity of about 50%,attics with an RBS do not tend to deteriorate. However, theauthors have reservations and it is preferable to treat eachcase individually to take into account the particular climaticconditions of each site[5].
Turning to the theoretical studies, there have been manyattempts to model attics incorporating an RBS; nevertheless,these models remain at the macro-volume level, using energybalance equations.
To provide a synthesis, the different attributes of thesemodels are summarised inTable 1.
More detailed models in two or three dimensions, usingfinite elements or finite volumes, have been developed, butthey are rare; most modelling work uses the elements listedin Table 1.
1.3. The French context
The use of reflecting insulation technology, which datesback about 20 years, is more recent in France than inthe English-speaking countries. However, its inclusion inbuildings has revealed a major difference in its application.International studies show that the RBS is in general imple-mented in the attic, in addition to a classic existing form ofinsulation. The position which is considered most effectivefor the RBS, is on the floor of the attic.
In France, the usual set-up is to have an RBS insertedbetween the roof covering and the ceiling, without using anyclassic insulation. The RBS is therefore installed on its own,the air layers being built-in to the roof framework. Such anarrangement is the cause of coupled heat transfers, whichare unlike those which dominate in attics. It would thereforebe useful to develop a methodology to describe the energeticbehaviour of such an interface.
In a humid tropical climate, such as in Reunion Island,the contribution from solar energy is important. Further, theroof coverings in Reunion are often made from corrugatediron, which reaches high temperatures during the summer.But the energy radiated by a material is all the greater whenits temperature is high, which is why the RBS principle isso applicable to these roofs.
1.4. Methodology
There are two main areas of interest concerning RBS inFrance. The first, which is essentially about regulations, isdue to the lack of familiarity with the thermal characteristicsof RBS, in particular their performance under field condi-tions. The second, which is technical in nature, is connectedto international work, and involves the study of the thermalbehaviour of a given system, which includes an RBS.
These two issues can be studied by combining experimen-tal and theoretical work, leading to a reliable representationof the physical behaviour of a complex interface involvingan RBS, and to the calculation of its energetic performance.

F. Miranville et al. / Energy and Buildings 35 (2003) 997–1008 999
In fact, the experimental set-up which requires a represen-tation of the thermal performance can also give, providingappropriate equipment is available, the necessary data tocheck hypotheses and theoretical results from mathemati-cal models. The approach which we propose brings togetherexperimentation and modelling into an empirical validationexercise.
The technical problem of an RBS is to do with its physi-cal behaviour in a complex interface. In fact, the insertion ofan RBS into a complex roofing or a vertical wall, introducesphysical phenomena which must be properly taken into ac-count in order to assess the effect of adding such a deviceto an interface.
Our response to these technical issues is based on a simu-lation code, which provides a dedicated modelling environ-ment. In this way, we have been able to study the physicalbehaviour of a standard roof including an RBS.
The simulation code must take into account all the physi-cal phenomena for a typical standard roofing configuration.Thus, this stage of the modelling should include on the onehand the expressions describing the physical phenomena,and on the other hand the specific issues connected to theinstallation of an RBS in a roof. In fact, roofing frameworksgenerally incorporate galvanised steel rafters, which resultin significant thermal effects, with non-negligible impact onthe global energetic behaviour of the system.
In addition, a validation procedure for the models devel-oped should be put together in order to check the validity ofthe hypotheses and the modelling choices made.
2. Modelling of a complex standard roof whichincludes an RBS
2.1. Introduction
The simulation code developed in the theoretical part ofour methodology is a prototype of building simulation soft-ware, developed with the Matlab environment. However,specific changes have been made to allow the simulationof complex interfaces with an RBS. The changes affect themodels of radiation and convection, taking care to keep amulti-model approach. The radiosity method is thereforeused for the longwave radiation heat transfer, and the con-vective heat transfer from the air layers can be describedusing non-dimensional correlations, or of the typehci =a �Tn + b.
Before starting the modelling, we will describe the roofingcomplex which we have studied.
2.2. Description of the roof
We have chosen a standard roofing including an RBS,installed according to current practice. This configurationrepresents a realistic situation, incorporating in particulardetails like the roofing framework. Further, the insertion of
Fig. 1. Section view of the roofing.
an RBS requires air layers, which in practise are made byfitting spacers, often made from parts of the roof frameworkitself.
In the section shown inFig. 1, one can see the geometricdetails of our roof. It is composed of a corrugated coveringmade of galvanised steel (both sides are varnished dark blue),an RBS and a ceiling made of plasterboard. The frameworkincludes rafters with a C-shaped profile and galvanised steelspacers on the lower face of the RBS. The lateral faces aremade of dark-coloured galvanised steel sheets, except for thelower part of the roofing, for which the exterior separatingface is made of an unpainted C-shaped panel. The roof isinclined at 20◦ to the horizontal, which is the angle mostfrequently encountered.
2.3. Modelling of the roof
Our modelling is intended to allow us to understand thephysical behaviour of the interface. Having little informationat the start of the study, the model must be as detailed aspossible, so that all the physical phenomena are taken intoaccount. We note first of all that the system shown inFig. 1will involve coupled heat transfers.
Further, we are using a model based on a building simu-lation code. Purely for the description of the complex inter-face, we need eight thermal zones (four upper transversal airlayers and four lower longitudinal air layers, being faithfulto the installation characteristics).
However, given on the one hand numerical constraints,due to among other things calculation time and on the otherhand the need to validate the model, it is preferable to op-timise the number of zones. For the upper thermal zones inparticular, for which the lateral faces are made from pan-els of the roofing framework, a coupled heat transfer mustbe used, because of its predictable importance for the lowerzone temperatures.
Further, the small dimensions of the lower air layers,which are 1.6 cm thick, suggests that it should be possibleto replace their four zones by a single zone.
There are several reasons for thinking this:
• The air volumes are separated by spacers made from thingalvanised steel, which are good heat conductors; as a
1000 F. Miranville et al. / Energy and Buildings 35 (2003) 997–1008
consequence, the thermal conditions on each side of thefaces of the air layers are very similar.
• The upper elements of the lower air layer are princi-pally composed of aluminium, in particular on their faces(RBS); but as aluminium is an excellent heat conductor,the temperature across the lower face should be uniform.
• Given the small dimensions of the lateral separating wallof the lower air layer, it is likely that variations in theclimate will have a very small effect on the air volumesconcerned.
In addition, our case is supported by the physical phe-nomena, as, given the presence of an RBS, the radiation heattransfers from the lower air layers will be minimised, and inthis case, only the conductive and convective heat transferswill govern the air volume behaviour. Also, the convectiveheat transfer, because of the chosen configuration (whichresembles an air gap heated from above), are likely to besmall. Thus, if only laminar convection has an important ef-fect, we can expect homogeneous behaviour.
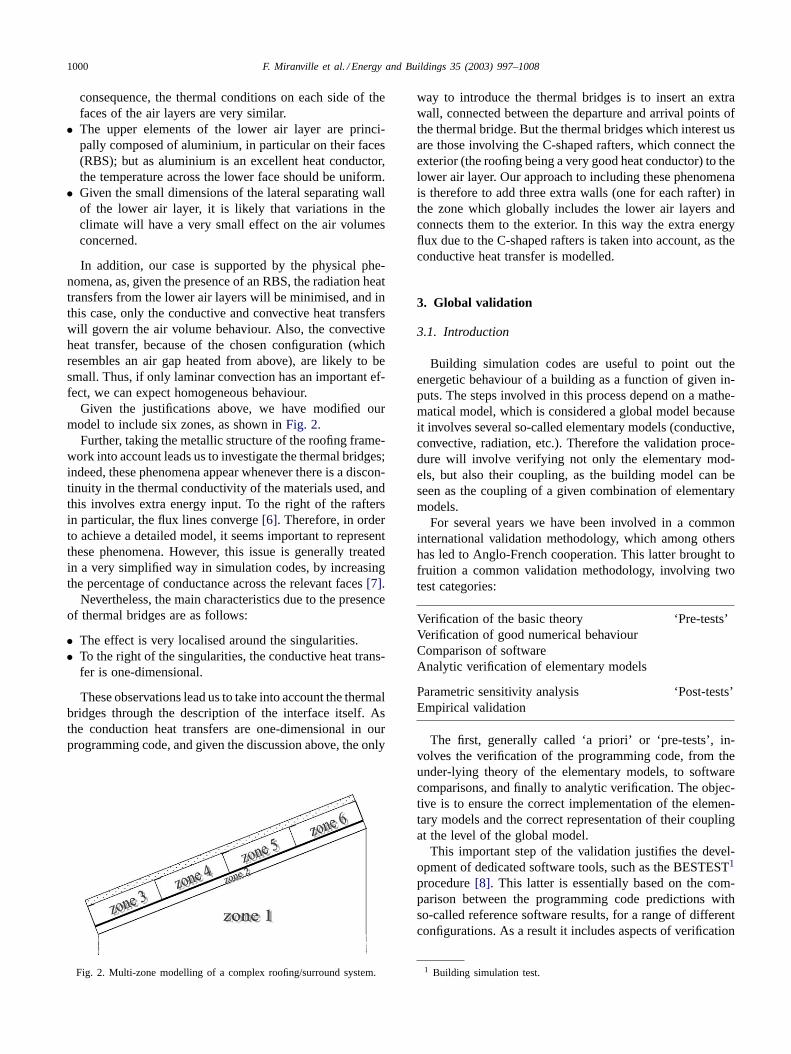
Given the justifications above, we have modified ourmodel to include six zones, as shown inFig. 2.
Further, taking the metallic structure of the roofing frame-work into account leads us to investigate the thermal bridges;indeed, these phenomena appear whenever there is a discon-tinuity in the thermal conductivity of the materials used, andthis involves extra energy input. To the right of the raftersin particular, the flux lines converge[6]. Therefore, in orderto achieve a detailed model, it seems important to representthese phenomena. However, this issue is generally treatedin a very simplified way in simulation codes, by increasingthe percentage of conductance across the relevant faces[7].
Nevertheless, the main characteristics due to the presenceof thermal bridges are as follows:
• The effect is very localised around the singularities.• To the right of the singularities, the conductive heat trans-
fer is one-dimensional.
These observations lead us to take into account the thermalbridges through the description of the interface itself. Asthe conduction heat transfers are one-dimensional in ourprogramming code, and given the discussion above, the only
Fig. 2. Multi-zone modelling of a complex roofing/surround system.
way to introduce the thermal bridges is to insert an extrawall, connected between the departure and arrival points ofthe thermal bridge. But the thermal bridges which interest usare those involving the C-shaped rafters, which connect theexterior (the roofing being a very good heat conductor) to thelower air layer. Our approach to including these phenomenais therefore to add three extra walls (one for each rafter) inthe zone which globally includes the lower air layers andconnects them to the exterior. In this way the extra energyflux due to the C-shaped rafters is taken into account, as theconductive heat transfer is modelled.
3. Global validation
3.1. Introduction
Building simulation codes are useful to point out theenergetic behaviour of a building as a function of given in-puts. The steps involved in this process depend on a mathe-matical model, which is considered a global model becauseit involves several so-called elementary models (conductive,convective, radiation, etc.). Therefore the validation proce-dure will involve verifying not only the elementary mod-els, but also their coupling, as the building model can beseen as the coupling of a given combination of elementarymodels.
For several years we have been involved in a commoninternational validation methodology, which among othershas led to Anglo-French cooperation. This latter brought tofruition a common validation methodology, involving twotest categories:
Verification of the basic theory ‘Pre-tests’Verification of good numerical behaviourComparison of softwareAnalytic verification of elementary models
Parametric sensitivity analysis ‘Post-tests’Empirical validation
The first, generally called ‘a priori’ or ‘pre-tests’, in-volves the verification of the programming code, from theunder-lying theory of the elementary models, to softwarecomparisons, and finally to analytic verification. The objec-tive is to ensure the correct implementation of the elemen-tary models and the correct representation of their couplingat the level of the global model.
This important step of the validation justifies the devel-opment of dedicated software tools, such as the BESTEST1
procedure[8]. This latter is essentially based on the com-parison between the programming code predictions withso-called reference software results, for a range of differentconfigurations. As a result it includes aspects of verification
1 Building simulation test.

F. Miranville et al. / Energy and Buildings 35 (2003) 997–1008 1001
of correct numerical behaviour and of cross-software com-parison, and allows us to compare the program to similartools. If the results compare well with those found dur-ing this procedure, the programming code is consideredacceptable.
The second part of the methodology validation, known asthe ‘a posteriori’ or ‘post-tests’, involves two main steps, theparametric sensitivity analysis and, most important, the em-pirical validation. This second step is fundamental, becauseit compares the program’s predictions with the physical re-ality of the phenomena, using measurements. It therefore re-quires an experiment to be set-up, with the aim of obtaininghigh quality measurements.
The sensitivity analysis of the model consists of findingthe set of parameters with most influence on a particularoutput. It is also used when seeking the cause of any differ-ence between the model and measurements, and allows usto focus this search on a restricted set of parameters, whichcontrol the output considered.
Further, the empirical validation methodology is a func-tion of the given objective and of the type of model under co-nsideration; in our case, the empirical validation must allowus to demonstrate the correct thermal behaviour of the build-ing envelope, in particular at the level of the roofing com-plex. This objective has led us to a particular methodology.
3.2. Empirical validation methodology
The fact that we are interested in a building envelopedescribed in such a way that it can be integrated into aprogramming code as a multi-zone model, results in a char-acteristic which must be taken into account in the runningof the empirical validation. Simply imposing a validity cri-terion on the interior dry-air temperature is not sufficient,because this criterion on its own does not guarantee thecorrect thermal behaviour of the global model.
In addition, the multi-zone aspect raises the question ofinter-zone coupling. Indeed, the model that we have pro-posed includes six thermal zones and it therefore seemsinteresting to deduce a classification of these zones as afunction of effect on the global temperature regime of themodel.
The validity criterion of our model must therefore takeinto account this characteristic, and our methodology in-cludes a stage for calculating the inter-zone couplings. Forthis, it is advantageous to use a method which our team havenamed ‘forcing’, which involves the possibility of imposingfor some given temperature nodes a series of values, onefor each time-step, which can be found from experiments[9]. We are therefore able to bring the boundary conditionsclose to the elementary models to be tested, in order to findany possible error in the modelling. ‘Forcing’ is also usefulfor the calculation of the inter-zone couplings which interestus. Indeed, for this it suffices to impose the measurementsmade on the experimental equipment, on the inter-zonalfaces.
3.3. Description of the experimental equipment
In this part we describe the ‘LGI’ cell, which is the ex-perimental device we used for the empirical validation. Wegive a description of its construction and the associated in-strumentation.
3.3.1. Structural descriptionThe LGI experimental cell has an interior volume of about
29.8 m3 and therefore resembles a typical room such as abedroom or an office. It has a modular structure, whichmeans that with the same cell we can study different con-figurations and phenomena. The walls are movable for thisreason. It is representative of a small dwelling, and featuresopaque, vertical walls, with blind-type windows, a glass doorand a roofing complex including an RBS. The details of thearrangement of these elements are given inTable 2.
It is equipped with a standard roof, including an RBS,placed according to the manufacturers’ specifications. In ad-dition, it includes a glass door (with upper and lower panes)and an aluminium blind, as shown inFig. 3.
The test cell is orientated facing north. The corrugatedcovering is a dark colour, which allows the development ofan extreme input from the roof. The cell is also equipped withmechanical ventilation and split-system air conditioning. Forthe empirical validation stage, the window panes in the doorwere masked, as were those of the blind.
3.3.2. Instrumentation and measurement sequenceThe LGI cell is equipped with about 50 sensors, if we
only consider those connected with the passive behaviour.These sensors are spread over the whole experimental de-vice, partly in the body of the cell and partly in the roofingcomplex.
3.3.2.1. Instrumentation of the body of the cell.The bodyof the cell contains heat sensors on each of its faces (north,south, east and west, inside and outside) and the interior airis measured at three different heights for dry-air temperatureand black globe, in order to assess the stratification of theair.
Fig. 3. The LGI cell.

1002 F. Miranville et al. / Energy and Buildings 35 (2003) 997–1008
Table 2Details of the construction of the LGI cell
Element Composition Remark(s)
Opaque vertical walls Sandwich board, 80 mm thick cement–fibre/polyurethane/cement–fibreWindow Aluminium frame, 8 mm clear glass Blind-type, 0.8 m× 0.8 mGlass door Aluminium frame, 8 mm clear glass Glass in upper and lower parts, 0.7 m× 2.2 mRoofing complex Corrugated galvanised steel/air layer of 100 mm
thick/RBS of 8 mm thickness/air layer of 16 mmthick/plasterboard of 8 mm thick (inclination 20◦)
RBS composed of aluminium faces and apolyethylene interface
Floor Concrete slabs of thickness 80 mm on 60 mm thick polystyrene
Further, temperature sensors have been inserted in theconcrete slabs supporting the cell, which gives informationon the boundary conditions from the ground.
All the temperatures are measured by T-type thermocou-ples, stuck to the surfaces in the case of surface tempera-ture measurement, inserted into aluminium cylinders for airtemperatures, and contained in a black globe for the blackglobe temperatures. For further details on the placement ofsensors and the associated errors, see[10].
3.3.2.2. Instrumentation of the roofing complex.The roof-ing complex was subjected to detailed instrumentation, in-volving temperature measurements on the surface of the roofcovering, on the RBS and on the ceiling, as well as on therafters making up the roof framework. The dry-air and blackglobe temperatures of the air layers were also measured, andflux-meters allowed us to find the thermal flux across theroof, the RBS and the ceiling. The positioning and types ofsensors used are shown inFig. 4.
All the thermocouples were calibrated at the site; the othersensors were calibrated at the factory. Further, the absoluteerror of the thermocouples was estimated to be±0.5◦C.According to their manufacturer, the flux-meters involve arelative error of 5%.
The set of sensors are connected to a datalogger, locatedin the cell. The measurements are made automatically every15 min and are sent back to a micro-computer in the controlroom on a daily basis.
Fig. 4. Locations and types of sensors in the roofing complex of the LGIcell.
3.4. Setting up the empirical validation
3.4.1. Preliminary activitiesAs the model is composed of six thermal zones, our valid-
ity criterion will concern the dry-air temperatures, denoted,respectively,Tai,1, Tai,2, . . . , Tai,6 for the zones 1–6. Thesegive global convective heat transfers in the zones and, givenour situation which includes air layers for which the radi-ation heat transfer is minimised, constitute reliable validityindicators.
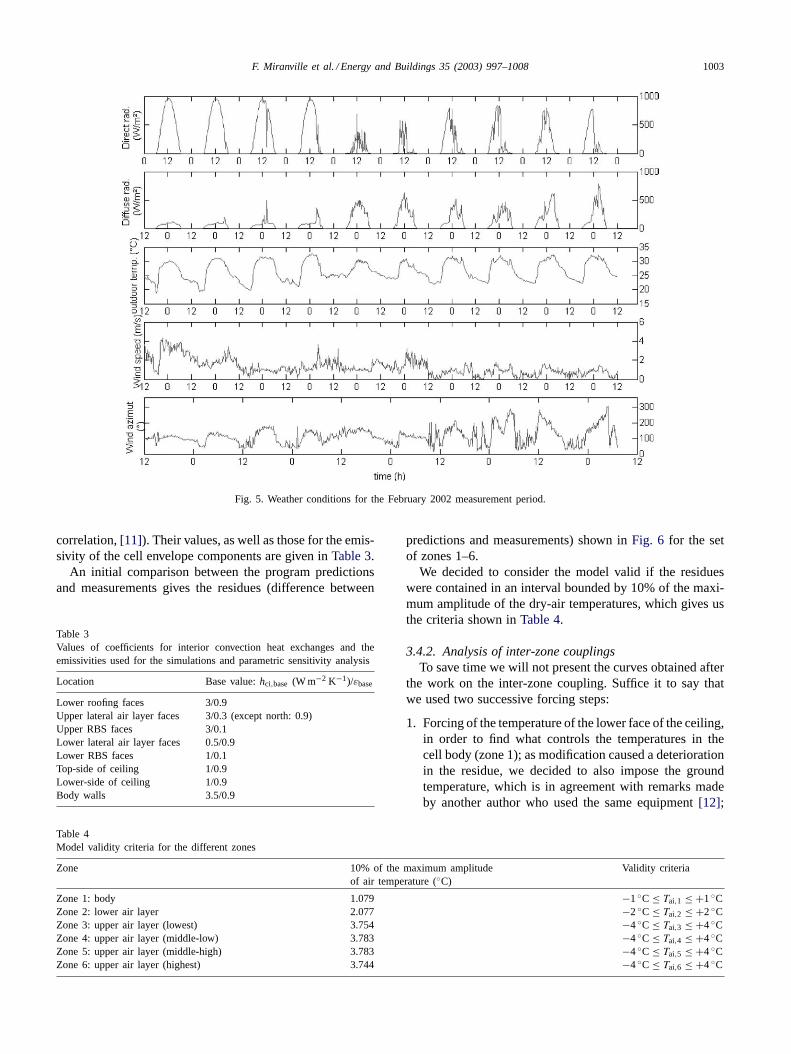
The role played by the solar protection being most impor-tant in a humid tropical climate during the summer, we chosean experimental sequence typical of the hot season. It in-volved 10 days in February 2002, during which the weatherwas quite typical.Fig. 5 shows the weather conditions, thatis the direct and diffuse radiation, the exterior air tempera-ture/relative humidity and the wind-speed and direction.
The period began with four sunny days, with strongradiation reaching approximately 950 W m−2; two verycloudy days followed, with weak direct radiation of about400 W m−2 maximum. The period finished with 4 days ofsunny intervals, with strong direct radiation in the mornings,but weaker in the afternoons.
As for the outside air temperature, it varied between 29and 33◦C over the entire experimental period. The relativehumidity developed in a distinct way, the first 4 days havinglight humidity with a greater level during the following days.
The wind conditions were also quite variable, with moder-ate wind-speed the first day, up to about 4 m s−1, followed by5 days of light wind, typically 1.5 m s−1, and finally 4 daysof very light wind, on average 0.5 m s−1. We note that thereis a good correlation between the wind-speed and direction(the reference, 0◦, is for a northerly wind), with the sec-tor east/south-east (Trade Winds) for moderate wind-speedsand the sector west/south-west (breezes) for light winds.
Our mathematical model incorporates the modelling as-sumptions necessary for building simulation codes; thus,conduction is one-dimensional in the walls and the air vol-umes have homogeneous thermo-physical properties (theydo not depend on temperature). The convective heat trans-fers in the air layers must, however, be represented usingsimple models, largely because of the parametric sensitiv-ity analysis. It is for this reason that we were careful to findconstant values to introduce into the model, at the beginningusing a simulation based on the initial correlation (the heat
F. Miranville et al. / Energy and Buildings 35 (2003) 997–1008 1003
Fig. 5. Weather conditions for the February 2002 measurement period.
correlation,[11]). Their values, as well as those for the emis-sivity of the cell envelope components are given inTable 3.
An initial comparison between the program predictionsand measurements gives the residues (difference between
Table 3Values of coefficients for interior convection heat exchanges and theemissivities used for the simulations and parametric sensitivity analysis
Location Base value:hci,base (W m−2 K−1)/εbase
Lower roofing faces 3/0.9Upper lateral air layer faces 3/0.3 (except north: 0.9)Upper RBS faces 3/0.1Lower lateral air layer faces 0.5/0.9Lower RBS faces 1/0.1Top-side of ceiling 1/0.9Lower-side of ceiling 1/0.9Body walls 3.5/0.9
Table 4Model validity criteria for the different zones
Zone 10% of the maximum amplitudeof air temperature (◦C)
Validity criteria
Zone 1: body 1.079 −1◦C ≤ Tai,1 ≤ +1◦CZone 2: lower air layer 2.077 −2 ◦C ≤ Tai,2 ≤ +2 ◦CZone 3: upper air layer (lowest) 3.754 −4◦C ≤ Tai,3 ≤ +4◦CZone 4: upper air layer (middle-low) 3.783 −4◦C ≤ Tai,4 ≤ +4◦CZone 5: upper air layer (middle-high) 3.783 −4◦C ≤ Tai,5 ≤ +4◦CZone 6: upper air layer (highest) 3.744 −4◦C ≤ Tai,6 ≤ +4◦C
predictions and measurements) shown inFig. 6 for the setof zones 1–6.
We decided to consider the model valid if the residueswere contained in an interval bounded by 10% of the maxi-mum amplitude of the dry-air temperatures, which gives usthe criteria shown inTable 4.
3.4.2. Analysis of inter-zone couplingsTo save time we will not present the curves obtained after
the work on the inter-zone coupling. Suffice it to say thatwe used two successive forcing steps:
1. Forcing of the temperature of the lower face of the ceiling,in order to find what controls the temperatures in thecell body (zone 1); as modification caused a deteriorationin the residue, we decided to also impose the groundtemperature, which is in agreement with remarks madeby another author who used the same equipment[12];

1004 F. Miranville et al. / Energy and Buildings 35 (2003) 997–1008
Fig. 6. Residues (measurements-model) of dry-air temperatures for the zones 1–6.
the residue obtained showed a satisfactory improvement,the amplitude of the variation being of the order of 1◦C.
2. Forcing of the lower face of the RBS, with the aim, asabove, of finding what controls the temperatures on thelower air layer; this modification having no effect on theair temperature of the air layer, we therefore imposedsimultaneously the temperatures on the lower face of theRBS and on the upper face of the ceiling. Paradoxically,no effect was observed on the air temperature of the lowerair layer.
These two observations emphasise the important effect ofthe ground and the need to improve the determination ofthe heat transfers from the lower air layer. This latter beingthe location of mainly convective heat transfers, the RBSminimising the radiative part, it seems necessary to improvetheir representation. In order to confirm these hypotheses, itseems evident that a sensitivity analysis is required.
3.4.3. Parametric sensitivity analysisIn this part we cover the sensitivity analysis for our model,
taking into account the preceding remarks, in particular con-cerning the lack of certainty about the convective heat trans-fers in the air layers.
The method used resembles the FAST method (FastFourier Amplitude Transform), and it allows us to determinethe most influential parameters on one or several outputsfrom a model for variations around some base value. Theprocedure is analogous to a design of experiments, with
the particular characteristic of a sinusoidal sample of theparameters around their base values. The interested readeris referred to[13,14].
As a first step, it is convenient to define the variation inter-vals for the different parameters, which are normally givenas a percentage variation around a base value. The main phe-nomena under a roofing complex being the convection heattransfers in the air layers, because of the reduction in radia-tion heat transfers by the RBS, it seems sensible to give theinterior heat exchange coefficients due to convection of theair layers, and to the RBS emissivities, variations of 50%around their base values (the other parameters having a per-centage variation of 10%).
All the thermo-physical, radiation, geometric and con-vection properties of the faces are taken into account bythe analysis, which gives a total of 687 parameters. As themethod requires more than twice the number of parametersin simulations, 1375 simulations were necessary. Given thecalculation time, we limited the analysis to the first 4 daysof the measurement period. We note that as a result, theconclusions of the study are only applicable to the periodconsidered.
For the air temperature in zone 1, that is the cell body, themost influential parameters are listed inTable 5. We havelisted them by order of importance over the whole 4-dayperiod used for the analysis.
It therefore appears that only these few factors affect theair temperature in the test cell body. Their identification re-quires some comment; indeed, we may wonder about the

F. Miranville et al. / Energy and Buildings 35 (2003) 997–1008 1005
Table 5The most influential parameters for the air temperature in zone 1, in orderof importance
Order of importance Parameter
1 Azimuth of the west wall2 Inclination of the door3 Convection heat exchange coefficient
of the upper side of the ceiling4 Thickness/mass/thermal capacity of the ground
inclusion of the azimuth of the west wall and the inclina-tion of the door. In the case of the first, this is due to theinfluence of the wind direction on the exterior convectionexchange coefficient. In fact, as the program automaticallycalculates the wall position (exposed to or protected fromthe wind) at each time-step, the resultant modification tothe value of the external heat exchange convection coeffi-cient (which takes two different values according to the po-sition of the wall) has a significant effect on the interior airtemperature.
The inclusion of the door inclination is because it is theleast insulated element of the cell (the body is composed ofan assembly of cement–fibre and polyurethane, whereas thedoor includes window panes, masked by boards). As a result,modifying its inclination can have a large effect on the airtemperature, the conditions being summery with sunshinemainly from the north.
It is therefore interesting to note that the remaining param-eters are related to the ground of the cell body (the groundbeing the principal inertia of the cell) or more precisely to itsthermal capacity (ρeCp), and to the convection heat trans-fer in the lower air layer, which fits our conclusions afterfinding the inter-zone coupling.
For the air temperature of the lower air layer, the importantparameters are given inTable 6.
The results confirm the remarks above. For this output,we can see that the most influential parameters are the upperconvection heat exchange coefficient for the ceiling, and itssurface. Thus, it seems that the convection flux through theceiling is highlighted by the method. The convection heatexchange coefficients of the RBS lower faces also appear,but their influence is less important.
For the upper air layer temperature, the parameters whichwere identified are given inTable 7.
Table 6The most influential parameters for the air temperature in zone 2
Order ofimportance
Parameter
1 Upper convection heat exchange coefficient for ceiling2 Surface of the ceiling3 Lower heat exchange coefficients of the RBS, zones 4/54 Lower heat exchange coefficients of the RBS, zones 3/65 Absorptivity of the roof, zones 4/56 Absorptivity of the roof, zones 3/6
Table 7The most influential parameters for the air temperature in zone 5
Order of importance Parameter
1 Absorptivity of the roof2 Lower heat exchange coefficient for the roof3 Azimuth of the roof4 Upper heat exchange coefficient of the RBS5 Lower emissivity of the RBS6 Upper emissivity of the RBS
In this case, the most important parameter is naturally thesolar absorption coefficient. This is followed by the heat ex-change coefficient for the lower face of the roof, its azimuthand the exchange coefficient for the upper face of the RBS.The emissivities of the RBS also play a role, but to a lesserextent than the convection heat transfers.
The parameters that we have identified illustrate the im-portance of ground-related effects (through the thermal iner-tia) and of convection heat transfers through the roofing com-plex (via convection flux across the ceiling) for the globalthermal behaviour of the cell.
Now that the important phase of identifying the most in-fluential parameters has been completed, we can proceed tothe calibration of our model. Let us not forget that, takinginto account the results above, the ground temperature isheld at the measured value, the focus of our study being theRBS.
3.4.4. Model calibrationThe objective of the model calibration phase is to deter-
mine the value(s) of the parameter(s) identified during theparametric sensitivity analysis and supposed to be responsi-ble for the errors. In our case, we are going to concentrateon the lower air layer, by trying to improve in particularthe heat exchange coefficient for the upper side of the ceil-ing. We have recognised, thanks to the parametric sensitivityanalysis results, its important effect on the air temperatureof the lower air layer, which in any case is also responsiblefor the greatest residue.
In order to better represent these convective heat transfers,through the convective heat exchange coefficients, we intendto determine a set of acceptable values. For this, rather thanusing an optimisation procedure (for which the processingtime in our code would have been prohibitive), we proceededusing two stages:
1. Completion of a design of experimentsWe followed a full factorial design using five parame-
ters (the four convective heat exchange coefficients of thelower faces of the RBS and that of the upper side of theceiling) while considering the following levels (startingwith values found in the literature):
• Heat exchange coefficients of the lower faces of theRBS:{0.2, 0.6, 1}.
• Heat exchange coefficient of the upper side of the ceil-ing: {1, 1.4, 1.8, 2.2, 2.6, 3}.
1006 F. Miranville et al. / Energy and Buildings 35 (2003) 997–1008
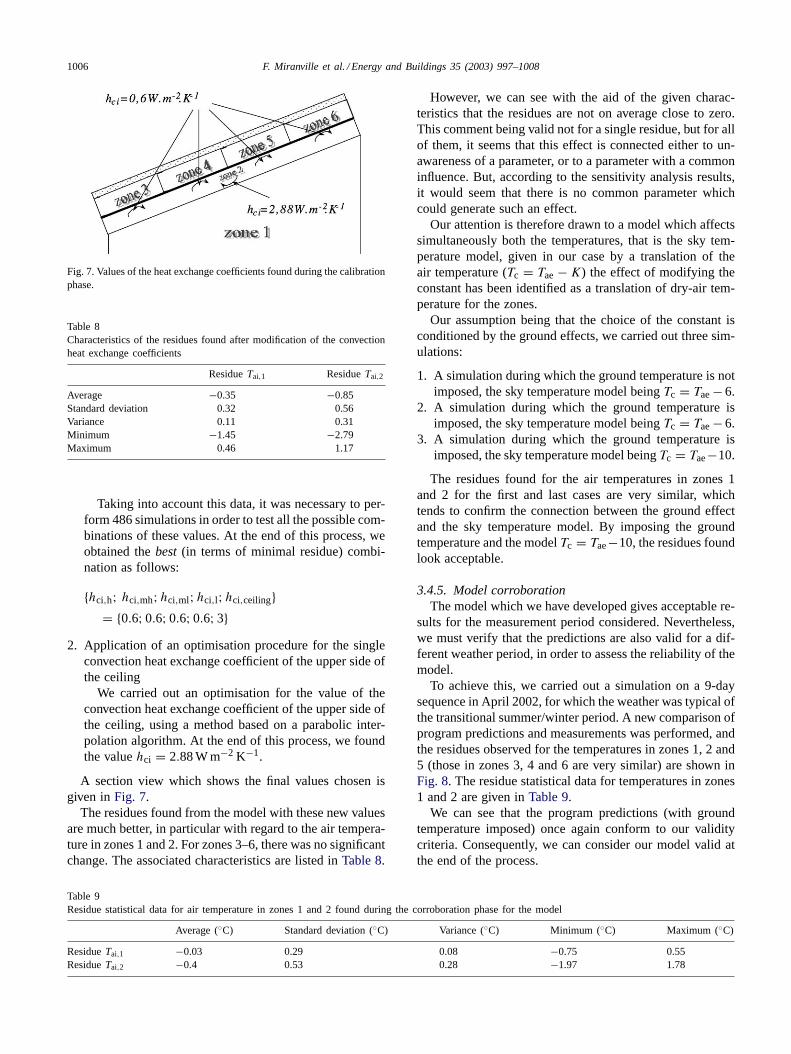
Fig. 7. Values of the heat exchange coefficients found during the calibrationphase.
Table 8Characteristics of the residues found after modification of the convectionheat exchange coefficients
ResidueTai,1 ResidueTai,2
Average −0.35 −0.85Standard deviation 0.32 0.56Variance 0.11 0.31Minimum −1.45 −2.79Maximum 0.46 1.17
Taking into account this data, it was necessary to per-form 486 simulations in order to test all the possible com-binations of these values. At the end of this process, weobtained thebest(in terms of minimal residue) combi-nation as follows:
{hci,h; hci,mh; hci,ml; hci,l; hci,ceiling}= {0.6; 0.6; 0.6; 0.6; 3}
2. Application of an optimisation procedure for the singleconvection heat exchange coefficient of the upper side ofthe ceiling
We carried out an optimisation for the value of theconvection heat exchange coefficient of the upper side ofthe ceiling, using a method based on a parabolic inter-polation algorithm. At the end of this process, we foundthe valuehci = 2.88 W m−2 K−1.
A section view which shows the final values chosen isgiven inFig. 7.
The residues found from the model with these new valuesare much better, in particular with regard to the air tempera-ture in zones 1 and 2. For zones 3–6, there was no significantchange. The associated characteristics are listed inTable 8.
Table 9Residue statistical data for air temperature in zones 1 and 2 found during the corroboration phase for the model
Average (◦C) Standard deviation (◦C) Variance (◦C) Minimum (◦C) Maximum (◦C)
ResidueTai,1 −0.03 0.29 0.08 −0.75 0.55ResidueTai,2 −0.4 0.53 0.28 −1.97 1.78
However, we can see with the aid of the given charac-teristics that the residues are not on average close to zero.This comment being valid not for a single residue, but for allof them, it seems that this effect is connected either to un-awareness of a parameter, or to a parameter with a commoninfluence. But, according to the sensitivity analysis results,it would seem that there is no common parameter whichcould generate such an effect.
Our attention is therefore drawn to a model which affectssimultaneously both the temperatures, that is the sky tem-perature model, given in our case by a translation of theair temperature (Tc = Tae− K) the effect of modifying theconstant has been identified as a translation of dry-air tem-perature for the zones.
Our assumption being that the choice of the constant isconditioned by the ground effects, we carried out three sim-ulations:
1. A simulation during which the ground temperature is notimposed, the sky temperature model beingTc = Tae− 6.
2. A simulation during which the ground temperature isimposed, the sky temperature model beingTc = Tae− 6.
3. A simulation during which the ground temperature isimposed, the sky temperature model beingTc = Tae−10.
The residues found for the air temperatures in zones 1and 2 for the first and last cases are very similar, whichtends to confirm the connection between the ground effectand the sky temperature model. By imposing the groundtemperature and the modelTc = Tae−10, the residues foundlook acceptable.
3.4.5. Model corroborationThe model which we have developed gives acceptable re-
sults for the measurement period considered. Nevertheless,we must verify that the predictions are also valid for a dif-ferent weather period, in order to assess the reliability of themodel.
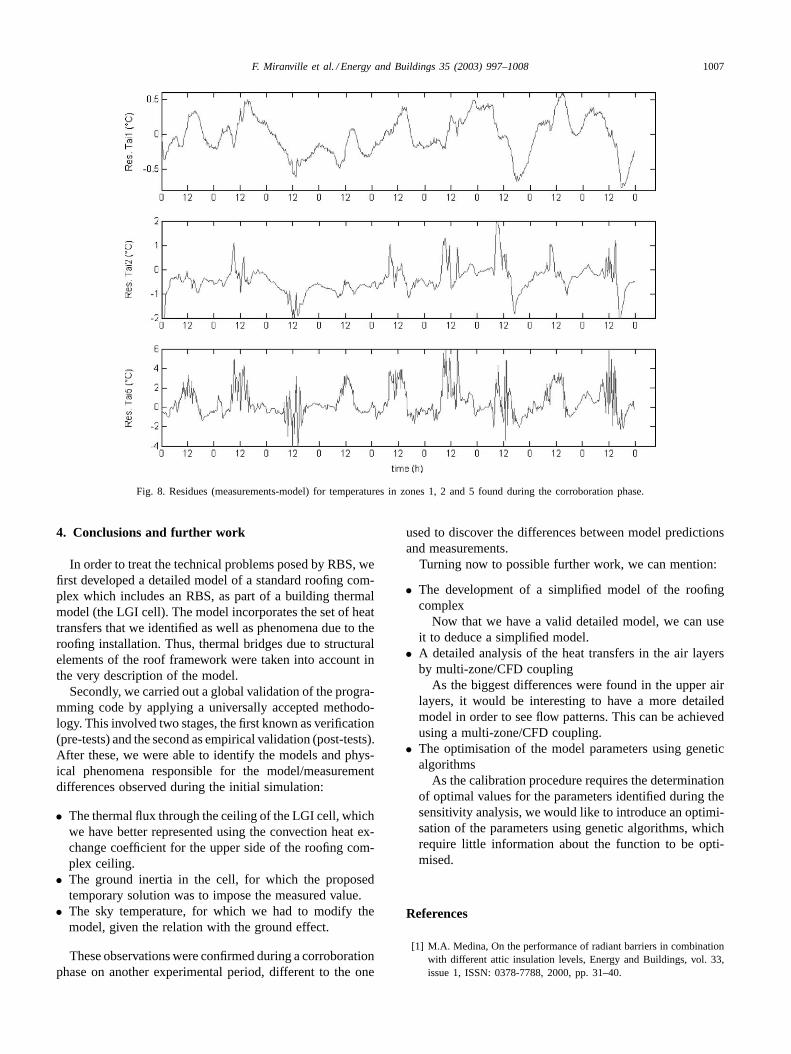
To achieve this, we carried out a simulation on a 9-daysequence in April 2002, for which the weather was typical ofthe transitional summer/winter period. A new comparison ofprogram predictions and measurements was performed, andthe residues observed for the temperatures in zones 1, 2 and5 (those in zones 3, 4 and 6 are very similar) are shown inFig. 8. The residue statistical data for temperatures in zones1 and 2 are given inTable 9.
We can see that the program predictions (with groundtemperature imposed) once again conform to our validitycriteria. Consequently, we can consider our model valid atthe end of the process.
F. Miranville et al. / Energy and Buildings 35 (2003) 997–1008 1007
Fig. 8. Residues (measurements-model) for temperatures in zones 1, 2 and 5 found during the corroboration phase.
4. Conclusions and further work
In order to treat the technical problems posed by RBS, wefirst developed a detailed model of a standard roofing com-plex which includes an RBS, as part of a building thermalmodel (the LGI cell). The model incorporates the set of heattransfers that we identified as well as phenomena due to theroofing installation. Thus, thermal bridges due to structuralelements of the roof framework were taken into account inthe very description of the model.
Secondly, we carried out a global validation of the progra-mming code by applying a universally accepted methodo-logy. This involved two stages, the first known as verification(pre-tests) and the second as empirical validation (post-tests).After these, we were able to identify the models and phys-ical phenomena responsible for the model/measurementdifferences observed during the initial simulation:
• The thermal flux through the ceiling of the LGI cell, whichwe have better represented using the convection heat ex-change coefficient for the upper side of the roofing com-plex ceiling.
• The ground inertia in the cell, for which the proposedtemporary solution was to impose the measured value.
• The sky temperature, for which we had to modify themodel, given the relation with the ground effect.
These observations were confirmed during a corroborationphase on another experimental period, different to the one
used to discover the differences between model predictionsand measurements.
Turning now to possible further work, we can mention:
• The development of a simplified model of the roofingcomplex
Now that we have a valid detailed model, we can useit to deduce a simplified model.
• A detailed analysis of the heat transfers in the air layersby multi-zone/CFD coupling
As the biggest differences were found in the upper airlayers, it would be interesting to have a more detailedmodel in order to see flow patterns. This can be achievedusing a multi-zone/CFD coupling.
• The optimisation of the model parameters using geneticalgorithms
As the calibration procedure requires the determinationof optimal values for the parameters identified during thesensitivity analysis, we would like to introduce an optimi-sation of the parameters using genetic algorithms, whichrequire little information about the function to be opti-mised.
References
[1] M.A. Medina, On the performance of radiant barriers in combinationwith different attic insulation levels, Energy and Buildings, vol. 33,issue 1, ISSN: 0378-7788, 2000, pp. 31–40.
1008 F. Miranville et al. / Energy and Buildings 35 (2003) 997–1008
[2] H.R. Al-Asmar, B.W. Jones, D.K. Matteson, Experimental eval-uation of attic radiant barriers (RP-577), ASHRAE Transactions,ASHRAE Inc., Faxon Finder, vol. 102, issue 1, ISSN: 0001-2505,1996, pp. 297–306.
[3] P. Fairey, The measured side-by-side performance of attic radiant bar-rier systems in hot and humid climates, in: Proceedings of the Nine-teenth International Thermal Conductivity Conference, Cookville,Tenn., 1985, pp. 481–496.
[4] J.A. Hall, Performance testing of radiant barriers, in: Proceedingsof the Third Annual Symposium on Improving Building EnergyEfficiency in Hot and Humid Climates, Arlington, Texas, 1985, pp55–77.
[5] W.P. Levins, M.A. Karnitz, J.A. Hall, Moisture measurements inresidential attics containing radiant barriers—final report, Oak RidgeNational Lab., TN, Energy Div. EPRI-CU-6495, 1989.
[6] F. Allard, Etude des ponts thermiques des parois de batiment enrégime variable des températures, Ph.D. Thesis, INSA-Lyon Scientificand Technical University, 1978, p. 241.
[7] J. Brau, J.J. Roux, G. Krauss, Cahier des algorithmes du logicielCODYBA, AFME, Paris, 1992, p. 59.
[8] R.D. Judkoff, J.S. Neymark, A procedure for testing the ability ofwhole building energy simulation programs to thermally model the
building fabric, Journal of Solar Energy Engineering, Transactionsof ASME 117 (1995) 7–15.
[9] H. Boyer, P. Lauret, A. Younes, A. Bastide, T. Mara, D’un code desimulation thermique du batiment à l’observation d’état: présentationde deux applications, in: Proceedings of the Vth CIFQ Conference,Lyon, May 2001.
[10] F. Miranville, Mise en place d’une plate-forme expérimentale—réalisation et instrumentation d’un dispositif de caractérisationd’isolants minces réfléchissants, Dissertation, University of La Réu-nion, 1999.
[11] R. Fauconnier, A. Grelat, Thermique de l’habitat: bases de lamodélisation thermique, Annales de l’ I.T.B.T.P. 395 (1981) 123–138.
[12] T. Mara, Contribution à la validation globale d’un logiciel de simula-tion thermo-aéraulique du batiment: proposition de nouveaux outilsd’aide à la validation, Ph.D. Thesis, University of La Réunion, 2000.
[13] T. Mara, F. Garde, H. Boyer, M. Mamode, Empirical validation ofthe thermal model of a passive solar test cell, Energy and Buildings1320 (2000) 1–11.
[14] T. Mara, H. Boyer, F. Garde, Parametric sensitivity analysis of testcell thermal model using spectral analysis, ASME Journal of SolarEnergy Engineering 124 (2002) 237–242.
Related Documents