”On the sensitivity of Building Performance to the Urban Heat Island Effect” By Adil Rasheed, Darren Robinson, Alain Clappier

”On the sensitivity of Building Performance to the Urban Heat Island Effect” By Adil Rasheed, Darren Robinson, Alain Clappier.
Jan 02, 2016
Welcome message from author
This document is posted to help you gain knowledge. Please leave a comment to let me know what you think about it! Share it to your friends and learn new things together.
Transcript

”On the sensitivity of Building Performance to the Urban Heat
Island Effect”By
Adil Rasheed, Darren Robinson, Alain Clappier

Overview
• Problem statement• Model Description• Case Study• Results• Conclusion• Future Work
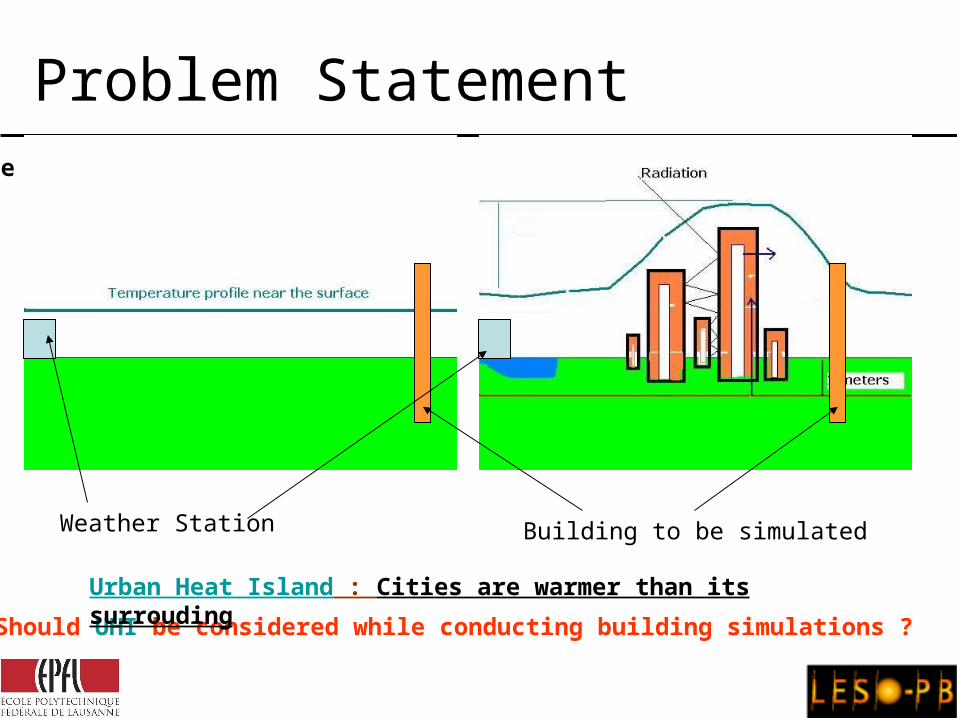
Problem Statement
Weather Station Building to be simulated
Current practice Reality
Should UHI be considered while conducting building simulations ?
Urban Heat Island : Cities are warmer than its surrouding
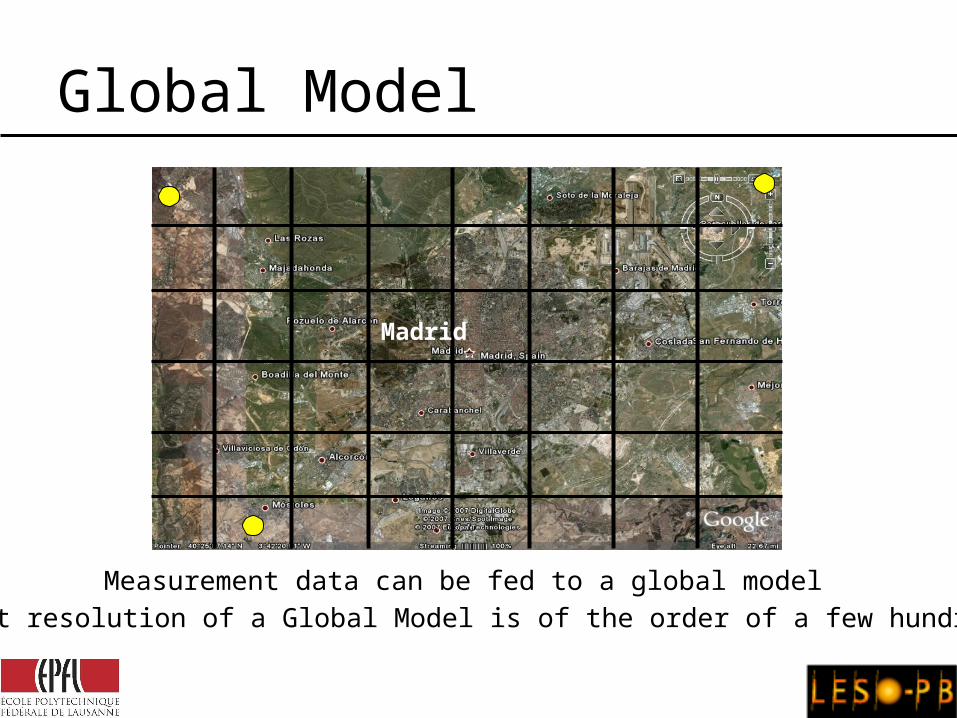
Global Model
But resolution of a Global Model is of the order of a few hundred Km
Measurement data can be fed to a global model
Madrid
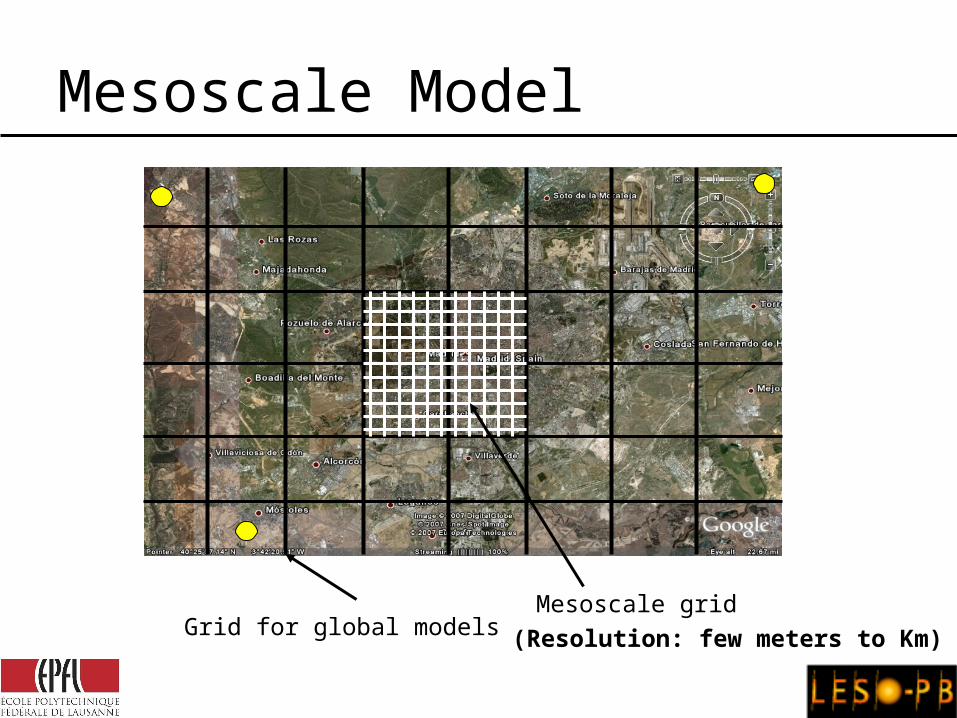
Grid for global modelsMesoscale grid
Mesoscale Model
(Resolution: few meters to Km)
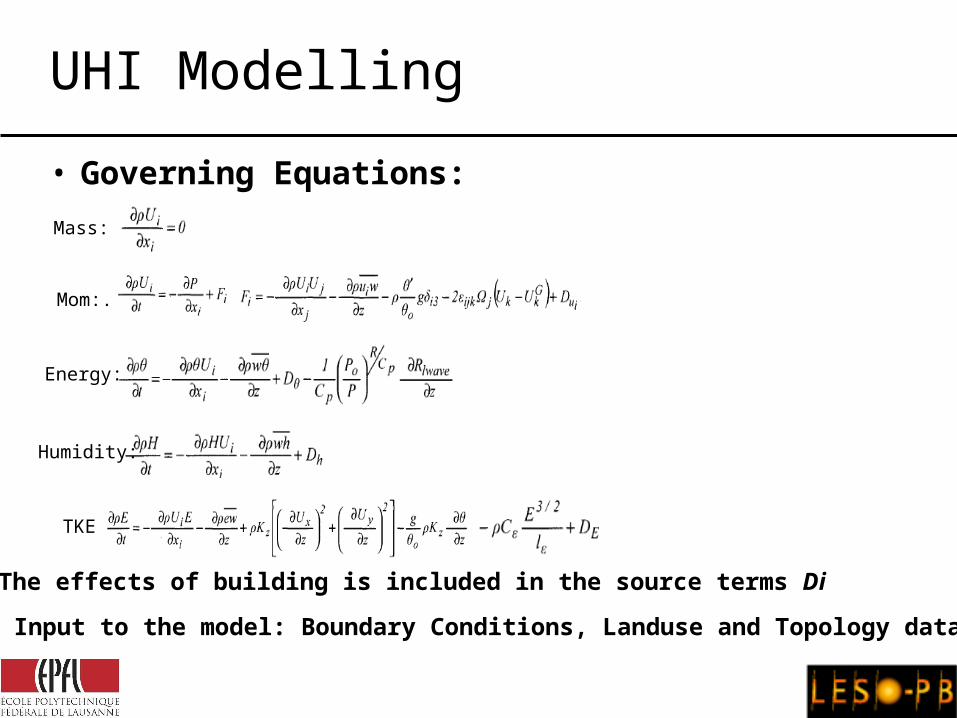
UHI Modelling
• Governing Equations:
Mass:
Mom:.
Energy:
Humidity:
TKE
The effects of building is included in the source terms Di
Input to the model: Boundary Conditions, Landuse and Topology data
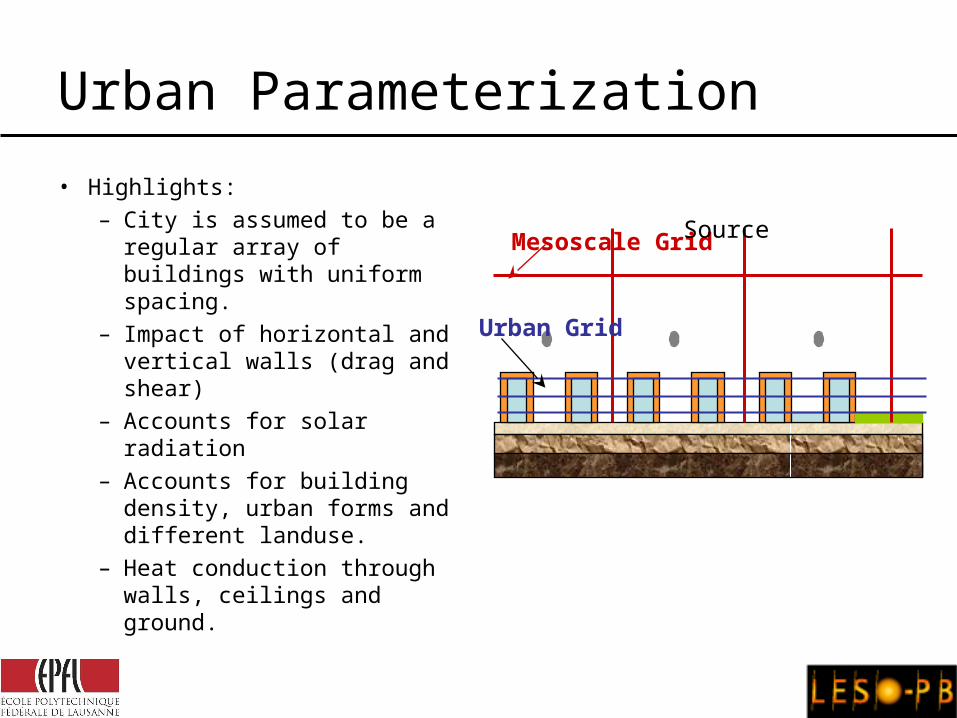
Urban Parameterization
• Highlights:– City is assumed to be a
regular array of buildings with uniform spacing.
– Impact of horizontal and vertical walls (drag and shear)
– Accounts for solar radiation– Accounts for building
density, urban forms and different landuse.
– Heat conduction through walls, ceilings and ground.
Urban Grid
Mesoscale GridSource
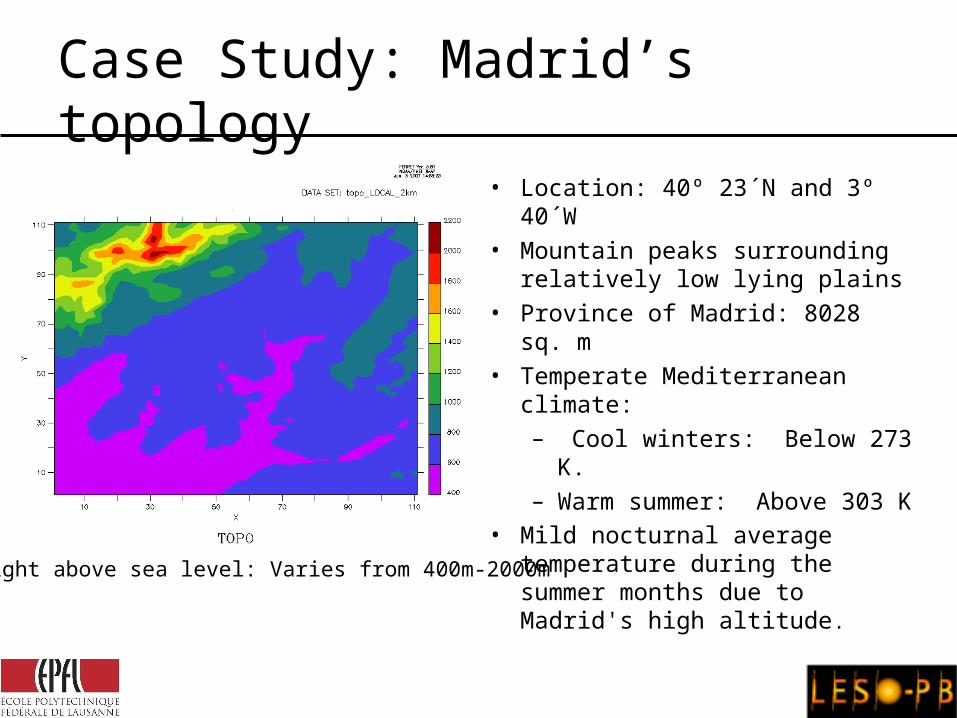
Case Study: Madrid’s topology
• Location: 40º 23´N and 3º 40´W• Mountain peaks surrounding
relatively low lying plains• Province of Madrid: 8028 sq. m• Temperate Mediterranean
climate:– Cool winters: Below 273 K. – Warm summer: Above 303 K
• Mild nocturnal average temperature during the summer months due to Madrid's high altitude.Height above sea level: Varies from 400m-2000m

Land Distribution: % Rural
• Largest city of Spain• Third most populous city in EU• Densely urbanized city center:
100% urban area.• City surrounded by rural area.
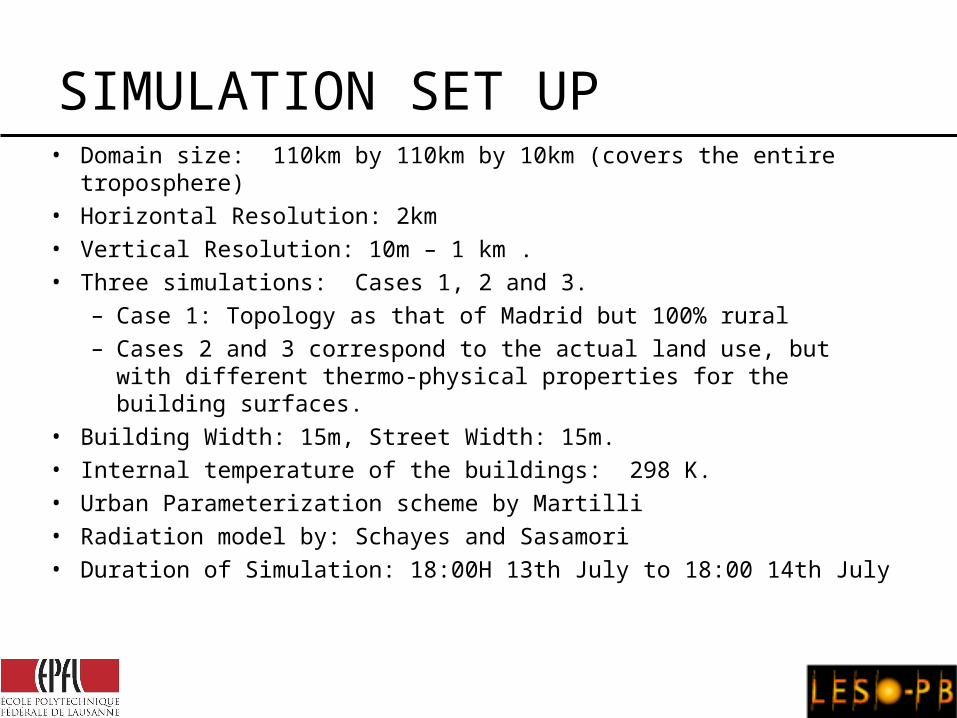
SIMULATION SET UP• Domain size: 110km by 110km by 10km (covers the entire
troposphere)• Horizontal Resolution: 2km• Vertical Resolution: 10m – 1 km .• Three simulations: Cases 1, 2 and 3.
– Case 1: Topology as that of Madrid but 100% rural– Cases 2 and 3 correspond to the actual land use, but with
different thermo-physical properties for the building surfaces.• Building Width: 15m, Street Width: 15m. • Internal temperature of the buildings: 298 K.• Urban Parameterization scheme by Martilli• Radiation model by: Schayes and Sasamori• Duration of Simulation: 18:00H 13th July to 18:00 14th July
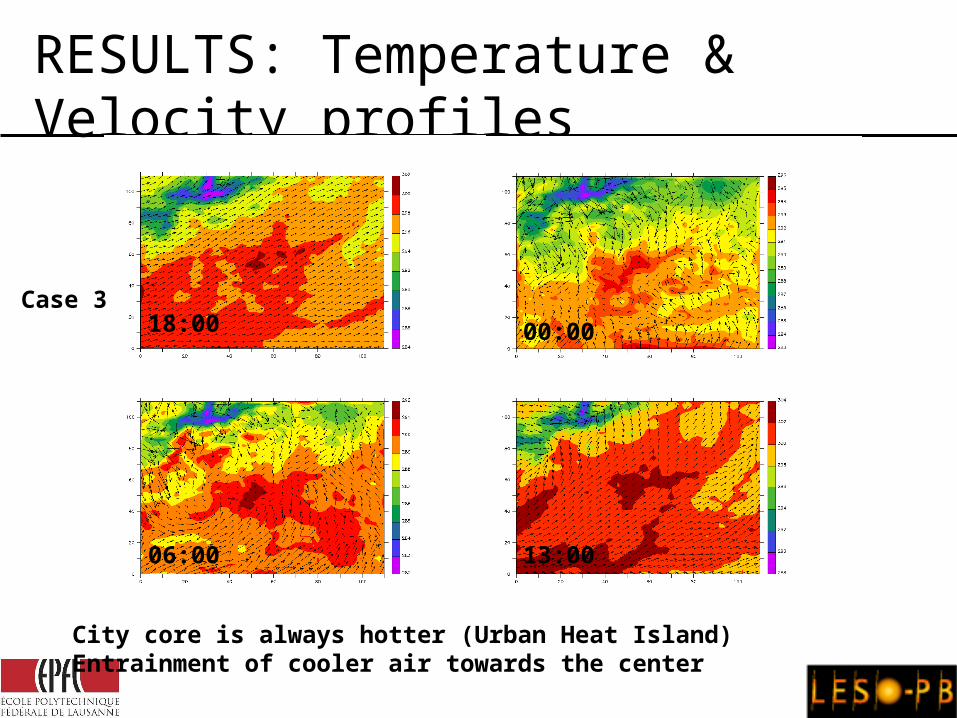
RESULTS: Temperature & Velocity profiles
18:00 00:00
06:00 13:00
City core is always hotter (Urban Heat Island)Entrainment of cooler air towards the center
Case 3

RESULTS: Cooling Load
Cooling Load:
C is total building conductance (W.K-1) DDc are the cooling degree-days η Boiler Efficiency
324 10 /Q DD C
,( )
24
i j baset
T TDD
Base Temperature: 291 K
Linear relation between energy demand and cooling load.
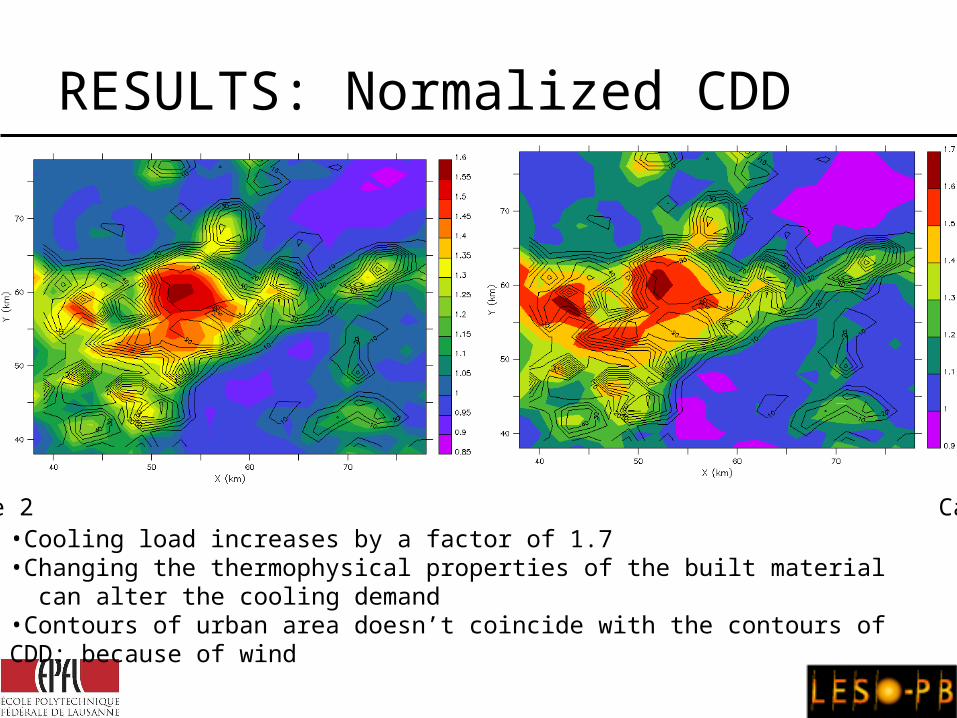
RESULTS: Normalized CDD
•Cooling load increases by a factor of 1.7•Changing the thermophysical properties of the built material can alter the cooling demand•Contours of urban area doesn’t coincide with the contours of CDD: because of wind
Case 2 Case 3

Conclusion• Urban Heat Island should be
considered during Building Energy Analysis
• Thermophysical and radiometric properties of the built material may play a very important role in designing an energy efficient city.
• Development of plume: Can be used for “natural scavenging” of the city
Future Work
• Validation of the basic assumptions in Urban Parameterization.
• Development of better Urban Canopy Model for better representation of the buildings and canopies.
• Inclusion of more sophisticated Building Modules in the Mesoscale Model.
• Finally to study the effects of changing various thermophysical and radiometric properties.
Acknowledgement
• The financial support received for this work from national research programme 54 of the Swiss National Science Foundation is gratefully acknowledged.
• Many thanks also to Alberto Martilli for providing the data required for the simulation.

Related Documents