ON THE ROAD TO ENERGY EFFICIENCY: EXPERIENCE AND FUTURE OUTLOOK Researching energy efficiency practices among Russian companies Free State of Saxony Russia Sustainable Energy Finance Program International Finance Corporation 43143 Public Disclosure Authorized Public Disclosure Authorized Public Disclosure Authorized Public Disclosure Authorized

On the road to energy efficiency: experience and future outlook
Mar 28, 2016
Researching energy efficiency practices among Russian companies (2006)
Welcome message from author
This document is posted to help you gain knowledge. Please leave a comment to let me know what you think about it! Share it to your friends and learn new things together.
Transcript
�
ON THE ROAD TO ENERGY EFFICIENCY: EXPERIENCE AND FUTURE OUTLOOK Researching energy efficiency practices among Russian companies
Free State of Saxony
Russia Sustainable Energy Finance Program International Finance Corporation
43143
Pub
lic D
iscl
osur
e A
utho
rized
Pub
lic D
iscl
osur
e A
utho
rized
Pub
lic D
iscl
osur
e A
utho
rized
Pub
lic D
iscl
osur
e A
utho
rized

�

�
MAIN CONCLUSIONS .................................................................................................4
1. INTRODUCTION ......................................................................................................7
�.�. Economic preconditions for the research ..........................................................................7
�.�. Research characteristics .................................................................................................................8
�.�. Research relevance ........................................................................................................................�0
2. ENERGY EffICIENCY POTENTIAL .................................................................. 13
3. CURRENT ENERGY EffICIENCY PRACTICES ................................................... 18
�.�. Strategy .................................................................................................................................................�8
�.�. From small to large ........................................................................................................................�0
�.�. Industrial and regional trends in energy efficiency development .................��
4. ORGANIZING ENERGY EffICIENCY PROGRAMS ......................................... 27
4.�. Organizing energy efficiency efficiency programs: current practices ............................................................................................................................�7
4.�. The action plan ...............................................................................................................................�8
4.�. Tracking energy usage .................................................................................................................�0
5. PROJECT fINANCING .......................................................................................... 31
5.�. Macroeconomic preconditions ............................................................................................��
5.�. Investment potential for modernization ..........................................................................��
5.�. Estimating company demand for financing .................................................................��
5.4. Expected payback periods .......................................................................................................�7
5.5. Financing future energy efficiency projects ..................................................................�9
6. RESULTS AND RECOMMENDATIONS ............................................................... 40
6.�. Success factors for energy efficiency projects .............................................................40
6.�. Consumption curves ....................................................................................................................4�
APPENDIX 1. Consumption curves by industry ...........................................................................4�
APPENDIX 2. Overview of energy efficiency projects by industry ..................................45
APPENDIX 3. Overview of energy efficiency projects by region ......................................47
APPENDIX 4. The volume of obsolete equipment by industry ..........................................49
CONTENTS

4
Russia ranks among the largest energy consumers in the world. Russian industrial companies use a much higher volume of energy for production than similar companies in other countries. This situation, combined with increased rates for electricity, gas and other resources, is generating much more interest in energy efficiency – 90% of the companies that were surveyed are already involved in projects in this area. However, companies are underestimating the opportunities and benefits of increased energy efficiency.
Company managers take an overly conservative view when it comes to assessing savings potential. Based on their estimates, they might be able to save just 8-�0%, when in fact they could actually reduce energy resource consumption by �0-�0%.
Due to a lack of cooperation between senior management and technical energy service personnel, promising projects that require considerable investment may be overlooked. Management teams are not always capable of correctly assessing the technical aspects or savings potential, while energy specialists often do not have a full understanding of a company’s development and financing strategy.
Managers primarily turn their attention to a company’s total energy expenses, rather than the share thereof in net costs, despite the fact that reducing the share of energy costs in total net production costs can give the company a competitive edge.
Company managers tend to underestimate the importance of a systemic approach to energy efficiency. Yet having a thorough and comprehensive energy efficiency program can help a company realize a greater number of projects and enjoy more success by using the most effective and cost-efficient routes.
MAIN CONCLUSIONS
Main conclusionsOn the road to energy efficiency: experience and future outlook

5
Main conclusionsOn the road to energy efficiency: experience and future outlook
Companies are not active enough when it comes to adopting proven energy efficiency measures. There is an entire set of measures commonly referred to as “good energy efficiency practices.” However, these “good practices,” such as insulation of buildings and installation of energy efficient lighting, are still not very popular in Russia.
Companies do not fully utilize efficient organizational means – such as motivating managers via results-based bonuses – to put energy efficiency programs into place.
Effective practices for tracking energy costs have certainly not developed everywhere. Most companies still do not keep records at a production zone level, and instead track the energy consumption of the company as a whole. This makes it more difficult to quickly analyze the energy consumption dynamics of a company’s highest-consumption manufacturing processes, or to evaluate the effects of introducing energy efficiency measures.
Nearly two-thirds of all enterprises claim that a lack of funds hinders them from carrying out projects in energy efficiency. However, only one out of every four companies sought outside financing, regardless of the fact that many banks and leasing companies already provide short- and long-term (�-5 years) financing, and 90% of the companies that sought external financing received it.
Since companies generally do not want to borrow funds, many valuable projects are left on the back burners. Furthermore, when a project is carried out, the long-term savings outweigh the costs of securing outside financing.
Company managers can achieve optimal results in energy efficiency if they take into account the following success factors:

6
The goal of this report is to generate interest among entrepreneurs in particular and the business community in general about the rational usage of energy resources, and to encourage investment in energy efficiency projects. This report contains useful information for entrepreneurs and managers, which we hope will help increase the success rate of programs aimed at increasing energy efficiency in the real sector.
This study was conducted in �006 under the International Finance Corporation’s Russia Sustainable Energy Finance Program. This program is dedicated to becoming a catalyst for Russia’s energy efficiency market and encouraging the collaboration of companies, financial institutions and suppliers of equipment and services on this market. For more information, visit www.ifc.org/russia/energyefficiency.
Key success factors for energy efficiency programs
Main conclusionsOn the road to energy efficiency: experience and future outlook
POTENTIAL & STRATEGY
ORGANIZATION
fINANCING
Calculate the ROI
Recognize the benefits of securing outside financing
Announce the situation on the financial market, including the availability of long-term funds
7
8
9
Have a comprehensive action plan for energy efficiency
Appoint employees to supervise the project, award bonuses for project completion, get management involved, get technical and financial services involved
Keep detailed records of energy expenses at a departmental level or for the production divisions that have the highest levels of energy consumption
4
5
6
Realistic estimate of energy efficiency potential
A development strategy will help determine energy demands
A step-by-step program: start with cost-efficient measures and gradually move to more capital-intensive measures
1
2
3

7
1.1. ECONOMIC PRECONDITIONS FOR THE RESEARCH
Increasing efficient energy use is one of the top priorities for the Russian economy over the next 5-�0 years for two reasons: first, high levels of energy consumption lower the competitiveness of Russian production on the domestic and foreign markets, and second, energy efficiency is one of the most important elements of ensuring the country’s energy security.
The Russian economy’s low level of energy efficiency is a major obstacle for economic growth. According to information from the International Energy Agency, Russia’s energy consumption per GDP is �� times higher than that of Germany, 6 times higher than in Canada, and 4 times higher than in Poland.� Closing this gap would mean both saving money for some companies and also increasing competitiveness among Russian manufacturers as a whole.
1. INTRODUCTION
� The International Energy Agency, �005. These numbers were reported as GDP calculations in nominal terms. Energy consumption per GDP calculated at par with Russia’s purchasing power came to � times higher than in Germany and �.8 times higher than in Canada.
1. IntroductionOn the road to energy efficiency: experience and future outlook
The Russian economy is one of the largest in the world in terms of energy consumption
Russia consumes nearly 6% of all of the
world’s energy
figure 1. COMPARING ENERGY CONSUMPTION PER GDP AND TOTAL ENERGY CONSUMPTION
Energy consumption per GDP in
countries, kWh/$ (2002)
Ukraine 24,3
23,3
6,2
3,9
3,6
2,6
Russia
Kazakhstan
Poland
Canada
Brazil
US
World
2,6
3,7
Ukraine 1 542
7 440
580
1 089
3 031
2 247
Russia
Kazakhstan
Poland
Canada
Brazil
US
World
26 526
123 034
Total energy consumption in the economy,
TWh
Source: International Energy Agency, �006
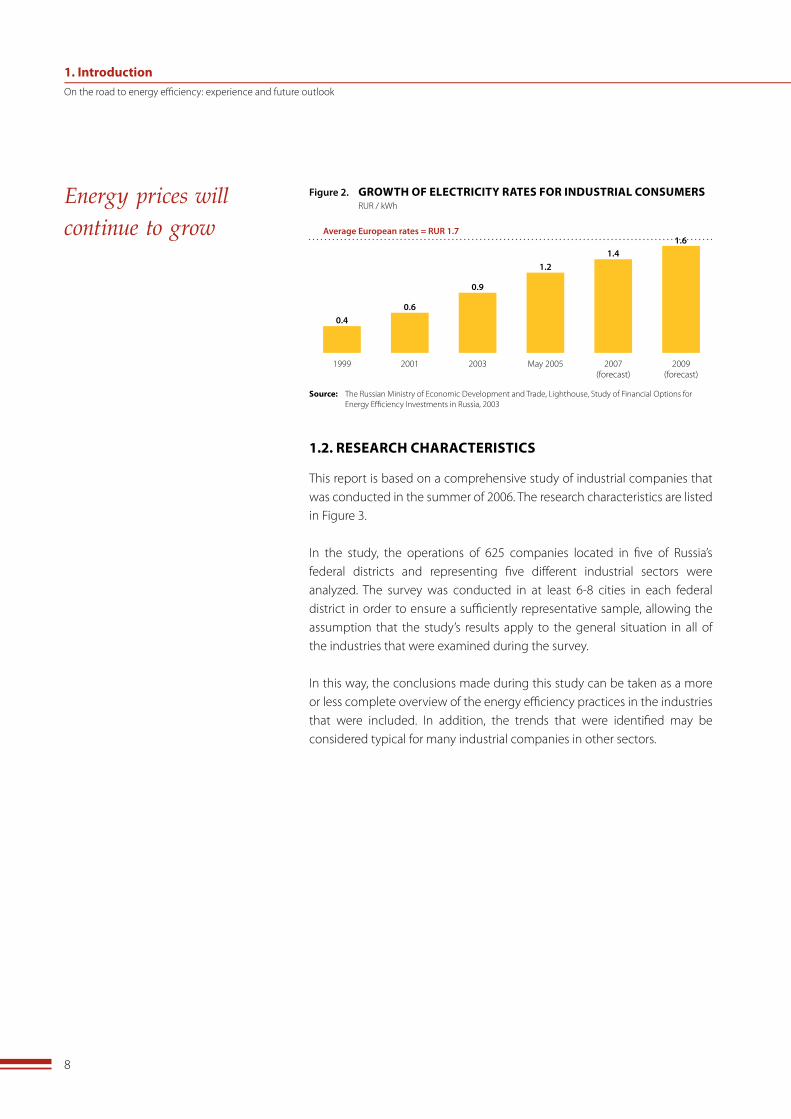
Furthermore, over the past 5-6 years, energy prices have been rising steadily. In �999-�005, average electricity rates for industrial consumers increased three times over. The Ministry for Economic Development and Trade has forecast that energy costs will continue to increase until �009, when prices are expected to reach a level close to average European rates. Combined with today’s high energy consumption levels, energy expenses could deal a major blow to the competitive position of Russian manufacturers.
8
Energy prices will continue to grow
�999
figure 2. GROwTH OF ELECTRICITY RATES FOR INDUSTRIAL CONSUMERS RUR / kWh
0.4
Source: The Russian Ministry of Economic Development and Trade, Lighthouse, Study of Financial Options for Energy Efficiency Investments in Russia, �00�
�00� �00� May �005 �007 (forecast)
�009 (forecast)
0.6
0.9
1.21.4
Average European rates = RUR 1.71.6
1.2. RESEARCH CHARACTERISTICS
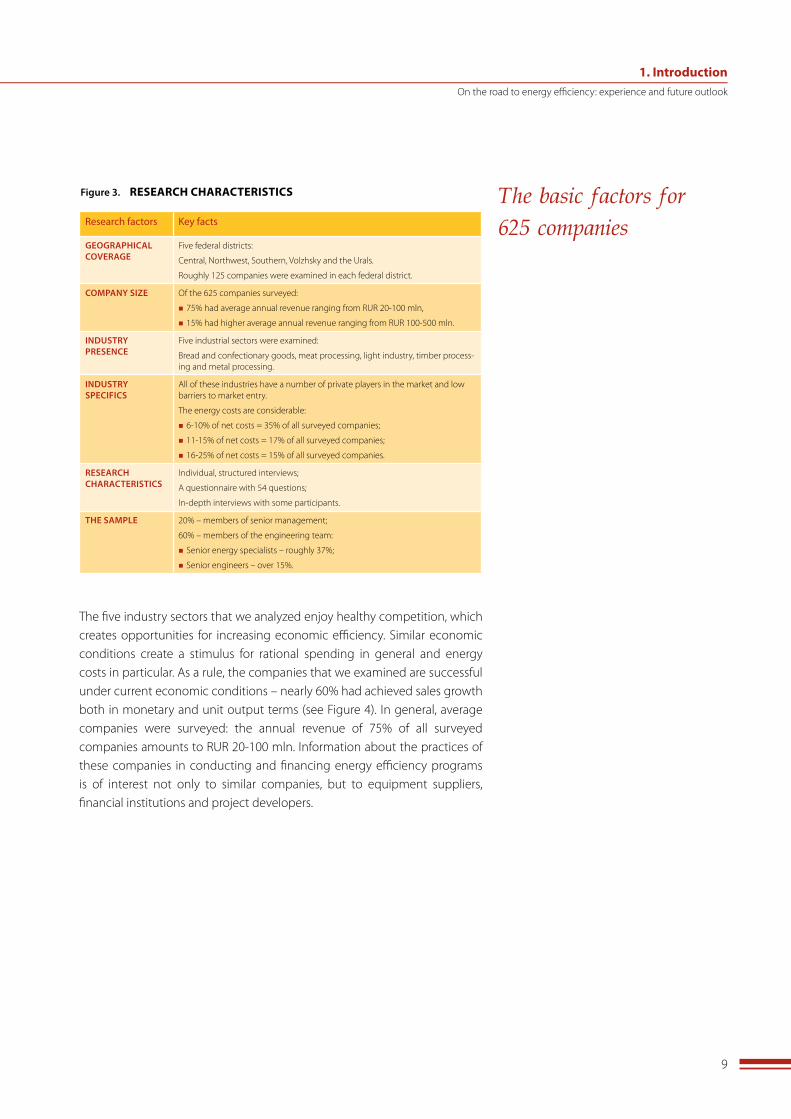
This report is based on a comprehensive study of industrial companies that was conducted in the summer of �006. The research characteristics are listed in Figure �.
In the study, the operations of 6�5 companies located in five of Russia’s federal districts and representing five different industrial sectors were analyzed. The survey was conducted in at least 6-8 cities in each federal district in order to ensure a sufficiently representative sample, allowing the assumption that the study’s results apply to the general situation in all of the industries that were examined during the survey.
In this way, the conclusions made during this study can be taken as a more or less complete overview of the energy efficiency practices in the industries that were included. In addition, the trends that were identified may be considered typical for many industrial companies in other sectors.
1. IntroductionOn the road to energy efficiency: experience and future outlook
9
The basic factors for 625 companies
figure 3. RESEARCH CHARACTERISTICS
Research factors Key facts
GEOGRAPhICAL COvERAGE
Five federal districts:
Central, Northwest, Southern, Volzhsky and the Urals.
Roughly ��5 companies were examined in each federal district.
COMPANY SIZE Of the 6�5 companies surveyed:
n 75% had average annual revenue ranging from RUR �0-�00 mln,
n �5% had higher average annual revenue ranging from RUR �00-500 mln.
INDUSTRY PRESENCE
Five industrial sectors were examined:
Bread and confectionary goods, meat processing, light industry, timber process-ing and metal processing.
INDUSTRY SPECIfICS
All of these industries have a number of private players in the market and low barriers to market entry.
The energy costs are considerable:
n 6-�0% of net costs = �5% of all surveyed companies;
n ��-�5% of net costs = �7% of all surveyed companies;
n �6-�5% of net costs = �5% of all surveyed companies.
RESEARCh ChARACTERISTICS
Individual, structured interviews;
A questionnaire with 54 questions;
In-depth interviews with some participants.
ThE SAMPLE �0% – members of senior management;
60% – members of the engineering team:
n Senior energy specialists – roughly �7%;
n Senior engineers – over �5%.
The five industry sectors that we analyzed enjoy healthy competition, which creates opportunities for increasing economic efficiency. Similar economic conditions create a stimulus for rational spending in general and energy costs in particular. As a rule, the companies that we examined are successful under current economic conditions – nearly 60% had achieved sales growth both in monetary and unit output terms (see Figure 4). In general, average companies were surveyed: the annual revenue of 75% of all surveyed companies amounts to RUR �0-�00 mln. Information about the practices of these companies in conducting and financing energy efficiency programs is of interest not only to similar companies, but to equipment suppliers, financial institutions and project developers.
1. IntroductionOn the road to energy efficiency: experience and future outlook

�0
Economically successful companies took part in the survey
Units
figure 4. ECONOMIC STANDING OF SURVEYED COMPANIES Percentage of respondents
How have your company’s sales changed in 2005 compared to 2004?
Monetary terms
58%
23%
19% 16%
22%
62% 55%
23%
10%
12% Increased > 30%
Increased by 30%
Increased by 20%
Increased by 10%
increased decreasedno changes
Despite the fact that more and more attention is being devoted to ensuring energy security and energy efficiency in Russia today, there is not enough open-source information available about energy consumption or the current practices of Russian companies in energy efficiency. This study of energy saving practices and financing opportunities for projects in energy efficiency is the first of its kind in Russia.
Increasing energy efficiency became a major priority for other countries during the energy crisis of the �970s, when rate hikes led to the need to rethink qualitatively energy efficiency policies in many industrial sectors.
This study is clearly very important today, as energy rates continue to climb and the energy capacity deficit continues to grow in Russia, as it will help expand market players’ knowledge of the possibilities of energy efficiency.
1.3. RESEARCH RELEVANCE
More and more Russian companies that have run into problems such as high costs or insufficient energy resources are now trying to streamline their energy consumption. The management teams of 85% of the companies that were surveyed believe that increasing energy efficiency is important for business development.
In �005, the surveyed companies consumed a cumulative total of roughly ��5 trillion kWh of energy.� Their combined energy expenses came to an approximate annual total of RUR 5.6 bln. Almost 70% of all energy is consumed by companies in which management teams rate the importance of energy efficiency as high.
� The volumes of various energy resources have been included as total measured units using a scaling ratio.
1. IntroductionOn the road to energy efficiency: experience and future outlook

��
85% of surveyed companies say improving energy efficiency is important
yes
Is improving energy efficiency an important issue for your company’s development
today?
figure 5. THE RELEVANCE OF IMPROVING ENERGY EFFICIENCY Percentage of respondents
Energy costs are high
Reducing energy costs as a percentage of total costs would increase competitiveness
Reliable and uninterrupted energy supply
Our equipment is very outdated and inefficient
Energy consumption is on the rise and limits production growth
It is difficult to increase energy limits
58%
41%
26%
21%
18%
14%
Why?
53% 32%
probably probably not no
11% 4%
We compared the percentage of energy expenses in total net production costs and total energy costs in an attempt to identify which of these factors motivates managers to initiate energy efficiency programs to the greatest extent. The line in Figure 6 illustrates the average percentage of energy costs in total net costs, and the columns show the average total energy expenses. These figures are the averaged numbers of company responses to the question: “Is improving energy efficiency an important issue for your company’s development today?”
As seen in the chart, there are no major differences in the percentage of energy expenses in total net costs among those who believe that improving energy efficiency is important and those who do not. Total energy costs of companies that believe energy efficiency is a very important issue these days are almost 4 times greater than the total energy expenses of companies that are not interested in energy efficiency.
Consequently, we can see that managers are primarily concerned with their company’s total energy costs rather than the percentage of energy costs in the total cost structure, despite the fact that the share of costs is what determines a company’s competitive position when it comes to energy expenses.
1. IntroductionOn the road to energy efficiency: experience and future outlook

��
What is more important: the percentage of net costs, or total expenses?
figure 6. THE PERCENTAGE OF NET COSTS VS. TOTAL ENERGY COSTS
Surv
eyed
com
pani
es’ a
nnua
l ene
rgy
co
sts,
RU
R bl
n
The
shar
e of
ene
rgy
cost
s in
tota
l net
co
sts
(%)
9.9 8.7 7.7
�5
Yes
2.5
Probably Probably not
�0
0
�5%
�0%
0%
5 5%
No
14% 14%
10%
13%
Is improving energy efficiency an important issue for your company’s development
today?
This report is the first attempt to analyze the process of implementing energy efficiency programs that are already in place or being put in place at successful, mid-sized industrial companies. The report addresses the following issues: which energy efficiency measures are currently being taken, how companies approach the organization and financing of energy efficiency projects, and which factors are typical for the industries and regions included in the study.
Company managers will be able to find information about how companies similar to their own rate the energy efficiency potential for their production (Chapter �) and about which development trends in energy efficiency exist in different industries and regions (Chapter �). The report also includes information about the organizational and managerial methods that help implement energy efficiency measures (Chapter 4) and describes current practices in financing energy efficiency, in addition to revealing the opportunities and advantages of securing external financing for projects in energy efficiency (Chapter 5). Chapter 6 discusses the success factors on the road to energy efficiency, and contains descriptions of certain methods that managers may find helpful.
1. IntroductionOn the road to energy efficiency: experience and future outlook

��
It is clear that in order to launch a program aimed at increasing energy efficiency, upper management first needs to recognize the problem and understand the possible benefits of energy efficiency. As our study shows, energy consumption is an issue that is important to managers today. Many of them believe they have a solid understanding of their company’s energy costs, and even more managers believe that they know what they need to do in order to make their companies more energy efficient (Fig. 7).
2. ENERGY EFFICIENCY POTENTIAL
Managers believe they are well informed as to energy costs and ways to reduce them
figure 7. MANAGER AwARENESS Percentage of respondents
No idea
Know approximately
Solid idea of expenses
Know exact figures
Are not informed at all
Are poorly informed
Are informed of general facts
Are rather well informed
How well do members of upper management understand the
company’s energy costs?
38%
34%
21%
7%
How well informed are members of upper management about
opportunities to increase energy efficiency?
4%
37%
47%
12%
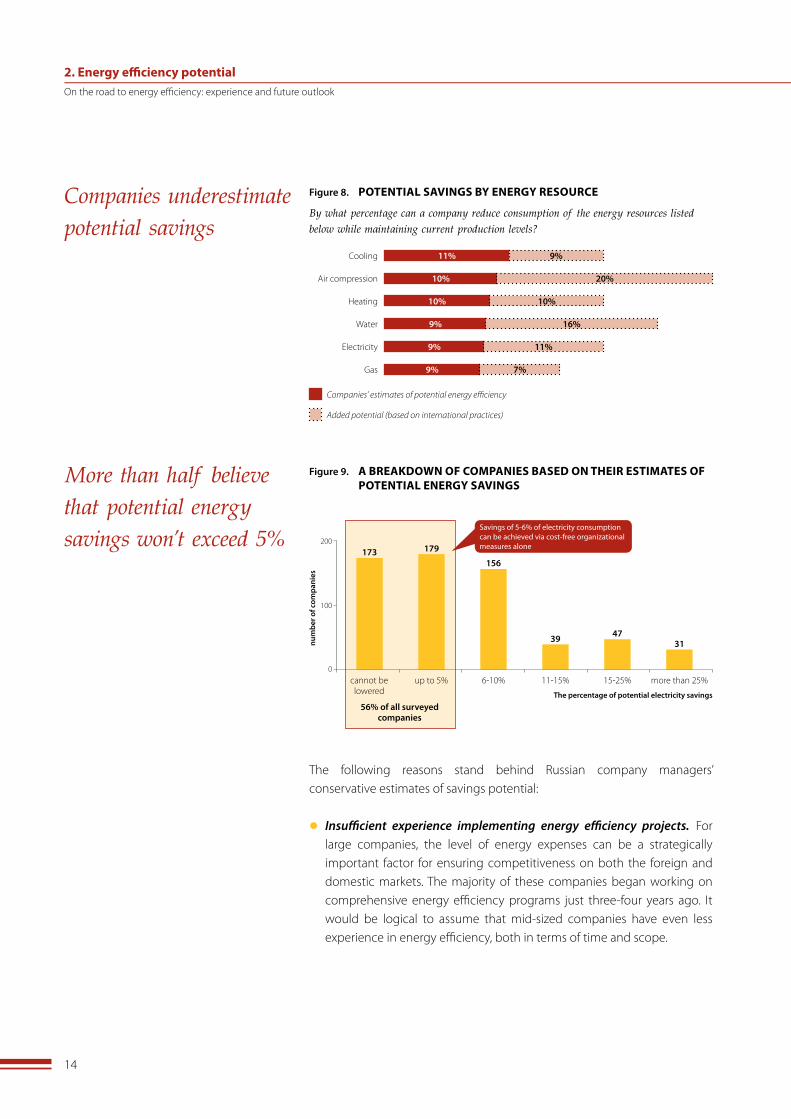
It is especially important that many company managers both recognize the advantages of energy efficiency and have a good idea of the amount of potential savings. However, the overwhelming majority of companies surveyed gave conservative estimates when asked about savings potential: an average of 8-�0% for different energy resources. According to international practice, in Great Britain for example, savings are much higher at approximately �0% for cooling, up to �0% for air compression and �0-40% for water expenses.
A more detailed review of the survey results on possible savings in electricity costs (Fig. 9) illustrates that nearly one-fourth of the managers we surveyed do not believe that the level of their electricity consumption can be reduced. Nearly �0% of respondents are confident that their electricity efficiency potential is just �-5% of their company’s consumption. But experience shows that successfully implemented energy efficiency programs result in electricity savings of 5-6% from the introduction of cost-free organizational measures alone.
2. Energy efficiency potentialOn the road to energy efficiency: experience and future outlook
�4
Companies underestimate potential savings
By what percentage can a company reduce consumption of the energy resources listed
below while maintaining current production levels?
figure 8. POTENTIAL SAVINGS BY ENERGY RESOURCE
Cooling
Air compression
Heating
Water
Electricity
Gas
11%
10%
10%
9%
9%
9%
9%
20%
10%
16%
11%
7%
Companies’ estimates of potential energy efficiency
Added potential (based on international practices)
The following reasons stand behind Russian company managers’ conservative estimates of savings potential:
l Insufficient experience implementing energy efficiency projects. For large companies, the level of energy expenses can be a strategically important factor for ensuring competitiveness on both the foreign and domestic markets. The majority of these companies began working on comprehensive energy efficiency programs just three-four years ago. It would be logical to assume that mid-sized companies have even less experience in energy efficiency, both in terms of time and scope.
More than half believe that potential energy savings won’t exceed 5%
figure 9. A BREAKDOwN OF COMPANIES BASED ON THEIR ESTIMATES OF POTENTIAL ENERGY SAVINGS
173 179
156
�00
cannot be lowered
39 4731
up to 5% 6-�0% ��-�5% �5-�5% more than �5%
num
ber o
f com
pani
es
�00
0
The percentage of potential electricity savings
56% of all surveyed companies
Savings of 5-6% of electricity consumption can be achieved via cost-free organizational measures alone
2. Energy efficiency potentialOn the road to energy efficiency: experience and future outlook

�5
l Inefficient interaction between senior management and technical energy service specialists. Increasing energy efficiency lies at the crossroads of general company development and energy supply. Technical specialists often do not take part in preparing a company’s strategic development plans, capital expense plans or other important measures that lay the foundation for economizing energy use. Today`s energy service managers primarily consider the measures that are in their zones of responsibility, which are first and foremost organizational issues related to energy supply for production and energy equipment repair – not energy efficiency. A chief energy expert’s zone of responsibility rarely includes providing economic grounds for energy efficiency programs. On the other hand, financial experts cannot competently assess which measures are required to increase energy efficiency, the volume of required investment or determine what the return will be on various measures. Often, this lack of coordination means that highly beneficial projects that require major investments end up outside the field of vision of energy service management and company management as a whole, which in turn lowers energy efficiency potential.
l The absence of an energy service department or qualified personnel at many mid-sized companies. Mid-sized companies often do not have the financial resources to invest in a separate, specialized energy service department, while functions such as energy consumption control and the implementation of energy efficiency projects are not delegated to senior engineering staff or production personnel. Only 47% of surveyed companies have a special staff unit or division responsible for the development and implementation of energy efficiency measures.
l Limited access to information about international and national energy efficiency experience.
International experience shows that actual achieved savings exceed expectations by 5-�0% of total energy consumption. This level of savings is usually achieved after introducing a series of measures during the initial low-cost stage. As a rule, intensifying and expanding energy efficiency programs lead to even bigger results. The comparative macroeconomic figures shown for energy capacities in Figure � show that modern companies in other countries are more than twice as efficient in producing one production unit.
2. Energy efficiency potentialOn the road to energy efficiency: experience and future outlook
�6
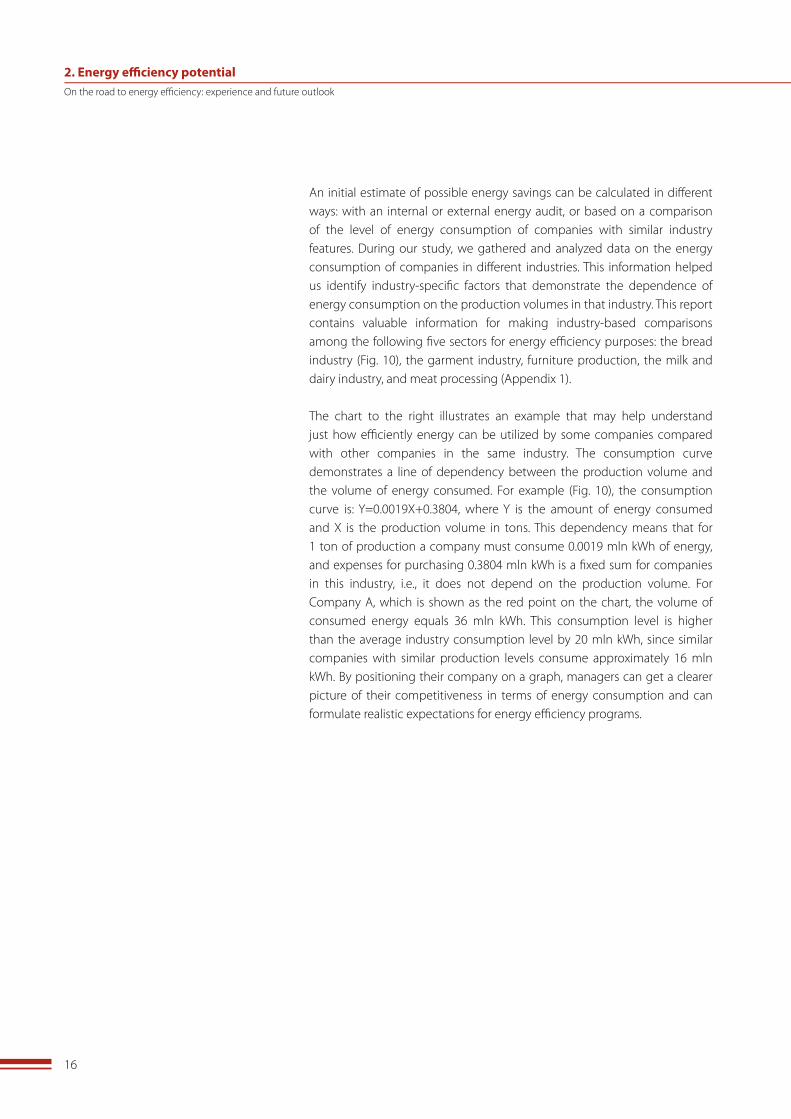
An initial estimate of possible energy savings can be calculated in different ways: with an internal or external energy audit, or based on a comparison of the level of energy consumption of companies with similar industry features. During our study, we gathered and analyzed data on the energy consumption of companies in different industries. This information helped us identify industry-specific factors that demonstrate the dependence of energy consumption on the production volumes in that industry. This report contains valuable information for making industry-based comparisons among the following five sectors for energy efficiency purposes: the bread industry (Fig. �0), the garment industry, furniture production, the milk and dairy industry, and meat processing (Appendix �).
The chart to the right illustrates an example that may help understand just how efficiently energy can be utilized by some companies compared with other companies in the same industry. The consumption curve demonstrates a line of dependency between the production volume and the volume of energy consumed. For example (Fig. �0), the consumption curve is: Y=0.00�9X+0.�804, where Y is the amount of energy consumed and X is the production volume in tons. This dependency means that for � ton of production a company must consume 0.00�9 mln kWh of energy, and expenses for purchasing 0.�804 mln kWh is a fixed sum for companies in this industry, i.e., it does not depend on the production volume. For Company A, which is shown as the red point on the chart, the volume of consumed energy equals �6 mln kWh. This consumption level is higher than the average industry consumption level by �0 mln kWh, since similar companies with similar production levels consume approximately �6 mln kWh. By positioning their company on a graph, managers can get a clearer picture of their competitiveness in terms of energy consumption and can formulate realistic expectations for energy efficiency programs.
2. Energy efficiency potentialOn the road to energy efficiency: experience and future outlook

�7
Consumption curves can help determine a company’s competitiveness in terms of energy efficiency
figure 10. THE CONSUMPTION CURVE FOR THE BREAD INDUSTRY
Tota
l ene
rgy
cons
umpt
ion,
mln
kW
h
Annual production output, tons
0 �00005000 �5000
�0
�0
�0
50
60
0
y = 0.0019x + 0.3804R2 = 0.7872
�0000
40
Estimated savings potential for Company A: 36-16 = 20 mln kWh
Company A consumes 36 mln kWh and produces 8500 tons
Comparing the energy consumption of different companies with an industry curve does not provide a definitive estimate of savings potential. Over time, as energy efficiency programs are introduced in companies within an industry, that industry’s consumption curve will progressively move downward, reflecting the increased energy efficiency and its gradual alignment with global practices. This is why this method for estimating savings potential by industry consumption curves can only provide a picture of the short-term. In order to get a more complete picture of energy savings potential, one can apply both international experience and the experience of Russian companies that have been implementing energy efficiency projects over the past several years.
Based on the information provided above, one can draw the conclusion that the forecast figures for energy saving shown in Figure 8 are achievable, but understated: they reflect the general tendency of Russian companies to underestimate their energy cost reduction potential.
2. Energy efficiency potentialOn the road to energy efficiency: experience and future outlook

�8
3.1. STRATEGY
At first glance, the connection between energy efficiency and a company’s strategy may not be very clear. However, when developing a strategic plan, figures such as net costs, production volume and production capacity play a major role, as does the level of capital investment in upgrading production in the years to come. When plans to upgrade technological capacities and economize energy use are not aligned with the company strategy, it could result in major spending errors and the failure to meet all planned production volume targets. This potential risk may be successfully overcome if management puts a step-by-step plan into place to modernize production with respect to technology and energy. This plan must apply known parameters for production expenses and output (Fig. ��).
3.CURRENT ENERGY EFFICIENCY PRACTICES
A development strategy will determine energy consumption
figure 11. THE CONNECTION BETwEEN A COMPANY STRATEGY AND ENERGY CONSUMPTION PROJECTS A step-by-step look
Launching a modernization and energy efficiency program
n Design measures to reach the required targets
n Calculate the program deadlines and stages
n Forecast new net cost levels once energy
consumption is lowered
Calculating production
n Necessary capacity numbers
n Consumption of each type of energy resource
n Investment needs for technological and energy
equipment
Strategic planning 2-3 years ahead
n Determine production volumes
n Project net costs
n Utilize production capacity
n Decide whether to expand production
One very important factor when launching an energy efficiency program is preparing the best-possible plan for replacing outdated energy equipment, which was often installed more than �5 years ago (Fig. ��). Obsolete energy equipment, especially boilers, tend to have excessively large capacities that are simply not required by companies any longer. Outdated equipment can present a real obstacle to the development of modern production. As we will see further, the modernization of this equipment is the ultimate goal of a number of many large-scale projects, and the expenses of this modernization represent a considerable part of a company’s total expenses for energy efficiency projects.
3. Current energy efficiency practicesOn the road to energy efficiency: experience and future outlook

�9
Working with obsolete equipment, be it manufacturing equipment or energy equipment, does not require any major capital investment. However, it often results in breakages, and, consequently, delays the entire production process. Technical maintenance for this kind of equipment can be quite costly. Many believe that delaying investments for new equipment will save money in the long run, but that is not the case.
There is a high percentage of obsolete equipment
figure 12. OBSOLETE ENERGY EQUIPMENT
Ventilation systems
Compressors
Circulation cooling systems
Pumps
Electric circuits / electric motors
Heat exchangers
The percentage of companies operating energy equipment that is more than 10 years old
Boiler equipment
Combined heat and power units
Frequency-controlled circuits
Refrigeration unit
Infrared heaters
59%
59%
57%
57%
56%
56%
55%
54%
51%
50%
50%
0% 60%�0% 40%
more than 25 years16–25 years11–15 yearsEquipment in use for:
percentage of respondents
3. Current energy efficiency practicesOn the road to energy efficiency: experience and future outlook
Inset 1. THE BURDEN OF EXCESS ENERGY CAPACITY
The Bogorodsky Chrome Leathers Factory, located in the Nizhegorod region, is a typical Russian light industry enterprise. The factory was built in the 1970s and uses a good deal of equipment designed in an era when energy and fuel were provided to companies practically free of charge. But under today’s market economy conditions, inefficient energy consumption can be an obstacle for companies like Bogorodsky.
Energy consumption costs amount to RUR 20 mln per year. Despite high production quality, excessive energy costs have a negative effect on the company’s competitiveness. According to the factory director:
«…the boiler we have now is meant to provide heating and hot water for a company producing 190 million square decimeters of leather each year. Today our company’s output is about 50 million dm2, which means we’re only using 25% of the capacity. Moreover, the boiler provides heat for a small district with a population of up to 10,000. In other words, today we have a very large boiler that we really don’t need at all, and we would like to figure out what volume of heating we do need so that we can install the kind of heating equipment that would literally pay for itself, not eat up our budget. Right now our gas costs have reached 50% of manufacturing costs.»

�0
3.2. FROM SMALL TO LARGE
As a rule, companies begin to work on energy efficiency projects as part of a larger-scale project to modernize both manufacturing and energy equipment. The need to launch an energy efficiency program most often arises when company management recognizes the actual level of energy expenses while planning or calculating net production costs. It is then that management sets a goal to find low-cost and time-efficient energy saving methods. This is the first step. One good example of first-stage measures is the elimination of various types of energy leaks and introduction of other organizational measures to reduce heating and lighting usage at unused premises.
In general, subsequent projects branch out into several different areas and the tasks at hand become more complex. The goals in the first stage are to achieve more flexible management and control of energy costs. The next step involves replacing power-hungry manufacturing equipment with more efficient equipment, which often requires considerable investments. The most significant effect in energy saving is often achieved when the modernization of key production equipment is accompanied by a calculation of required energy, and streamlining the company’s energy consumption in general.
During this study we discovered that nearly 90% of the companies that were surveyed are taking measures towards more efficient energy use. On average, one company is currently working on three energy efficiency projects, and more than half of the companies surveyed (5�%) are working on two to four projects. One in every four companies is working on more than five projects.
3. Current energy efficiency practicesOn the road to energy efficiency: experience and future outlook
Inset 2. A COMPANY’S FIRST STEPS IN IMPLEMENTING AN ENERGY EFFICIENCY PROGRAM
The Zavolzhsky Motor Factory (ZMF) began to tackle energy efficiency in 2003, when factory experts developed and launched a comprehensive energy efficiency program that included measures to streamline the planning and metering systems and initiate other energy efficiency measures. The first step included a set of 170 measures, 150 of which were cost-free or organizational. These measures put things into order and instantly resulted in energy savings of 5-6%. First, the company improved the lighting system for departments and other premises – they began to clean the lights and glass sidings and changed the lighting fixtures in meeting rooms. Second, they made improvements to the heating system and introduced a new regular climate control regime. Furthermore, the company dedicated a great deal of attention to the performance of compressors. ZMF managed to set up the compressors based on an improved schedule and fixed air leaks. These measures cost very little, and resulted in considerable savings.
Source: The Industrial Information Bulletin, No.4/�006
��
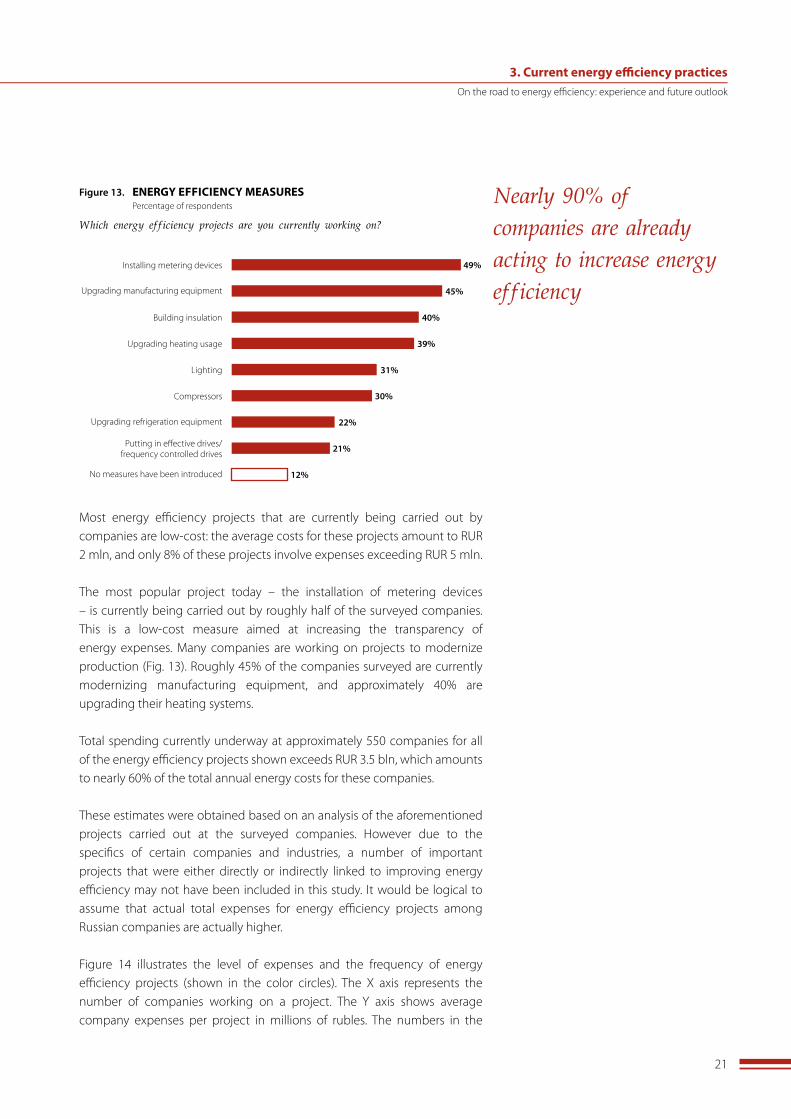
Nearly 90% of companies are already acting to increase energy efficiency
Which energy efficiency projects are you currently working on?
Installing metering devices
Upgrading manufacturing equipment
Building insulation
Upgrading heating usage
Lighting
Compressors
figure 13. ENERGY EFFICIENCY MEASURES Percentage of respondents
49%
45%
40%
39%
31%
30%
Upgrading refrigeration equipment
Putting in effective drives/frequency controlled drives
No measures have been introduced
22%
21%
12%
Most energy efficiency projects that are currently being carried out by companies are low-cost: the average costs for these projects amount to RUR � mln, and only 8% of these projects involve expenses exceeding RUR 5 mln.
The most popular project today – the installation of metering devices – is currently being carried out by roughly half of the surveyed companies. This is a low-cost measure aimed at increasing the transparency of energy expenses. Many companies are working on projects to modernize production (Fig. ��). Roughly 45% of the companies surveyed are currently modernizing manufacturing equipment, and approximately 40% are upgrading their heating systems.
Total spending currently underway at approximately 550 companies for all of the energy efficiency projects shown exceeds RUR �.5 bln, which amounts to nearly 60% of the total annual energy costs for these companies.
These estimates were obtained based on an analysis of the aforementioned projects carried out at the surveyed companies. However due to the specifics of certain companies and industries, a number of important projects that were either directly or indirectly linked to improving energy efficiency may not have been included in this study. It would be logical to assume that actual total expenses for energy efficiency projects among Russian companies are actually higher.
Figure �4 illustrates the level of expenses and the frequency of energy efficiency projects (shown in the color circles). The X axis represents the number of companies working on a project. The Y axis shows average company expenses per project in millions of rubles. The numbers in the
3. Current energy efficiency practicesOn the road to energy efficiency: experience and future outlook

��
circles show the total expenses for all companies in the sample that have worked on this project in �004–�005 or where the project is currently underway. The projects are represented by circles that are distributed in four quadrants depending on their frequency and average company cost. For example, this chart shows that the most popular project is aimed at upgrading manufacturing equipment (45% of companies are working on this project), which also has the highest average cost. That is why this project has been placed in the first quadrant. It is also clear that overall expenses for projects aimed at modernizing manufacturing equipment amount to RUR �7�� mln.
Measures to align companies with “best practices” are not popular enough
figure 14. PROJECT COST & PREVALENCE
Типы проектов:
Updating manufacturing equipment
Updating refrigeration equipment
Building insulation
Installing metering devices
Upgrading heating system
Effective drives / frequency controlled drives
Lighting
Compressors
Installing an automated energy metering and control system
The total project costs for all companies (RUR, mln)
Percentage of companies working on these projects
Aver
age
proj
ect
cost
s
�0% 60%
� mln
Least popular low-budget projects
Most popular high-budget project
372143
204
7146
173137
1711
625
47
As Figure �4 shows, the most prevalent low-cost projects are aimed at installing metering devices (49% of all companies surveyed). The most expensive project, taken on by just �4% of all companies, involves automated metering and controls, while total expenses for these types of projects are more or less the same. Furthermore, putting in frequency controlled drives, a comparatively small project that shows results quickly, was carried out by just one in every five companies. Other measures such as insulating buildings and installing efficient lighting fixtures – which can be done at any factory – are carried out by relatively few companies.
These measures are often referred to as “best practices” in energy efficiency, and the effectiveness of these measures has been proven both in other countries and within Russia. However, average companies are currently not sufficiently active in introducing these kinds of energy efficiency measures.
3. Current energy efficiency practicesOn the road to energy efficiency: experience and future outlook

��
The meat and dairy sector is the leader in terms of the number of projects
figure 15. THE NUMBER OF ENERGY EFFICIENCY PROJECTS BY INDUSTRY
312
500
Timber industry
Num
ber o
f pro
ject
s
�00
0Light industry Bread and
confectionaryMetal processing
and machine buildingMeat and dairy
346382
454485
�00
400
�00
94%93%88%85%83%
% of companies in the industry taking part in a project number of projects completed
3.3. INDUSTRY AND REGIONAL TRENDS IN THE DEVELOPMENT OF ENERGY EFFICIENCY
As we have mentioned above, a total of 6�5 companies representing five different industries and five federal districts took part in this survey. Based on an adequately representative sample of companies by industry and by region, we have attempted to identify the main industry and regional trends in the development of energy efficiency in Russia.
Industry TrendsWe should first note that during the study, no major differences were found among the different industries in terms of the following factors:
l the relevance of energy efficiency
l the extent to which management is informed of energy saving possibilities
l estimated opportunities to improve energy consumption
l estimated savings potential
l ROI for energy efficiency programs
Figure �5 shows the differences between the industries in terms of the number of completed energy efficiency projects. All of the companies in metal processing, machine building and the meat and dairy industry are carrying out some kind of energy efficiency projects. In general, companies in the timber industry demonstrate a lower level of activity in energy efficiency (Fig. �5). Companies in the meat and dairy sector are working on �.5 times more projects than companies in the timber industry.
3. Current energy efficiency practicesOn the road to energy efficiency: experience and future outlook

�4
The metal processing industry is actively investing in energy efficiency
figure 16. TOTAL COSTS BY INDUSTRY
160
�000
Light industry
Tota
l pro
ject
cos
ts (R
UR,
mln
)800
0Bread &
confectionary
154
162
550��00
�600
400
1451969646458294
230 382
233
668
410
199
total costs for upgrading heating systems
total costs for other projects
total costs for upgrading manufacturing equipment
360
Timber Metal processing and machine
building
Meat and dairy
Appendix � includes charts that illustrate the costs of different kinds of energy efficiency projects and their prevalence in the given industries that were examined. They give a good idea of the differences between total project costs by industry and the types of projects that are most typical for each industry. The following features were noted:
l The modernization of manufacturing equipment and heating systems is widespread among all of the industries: roughly 50% to 75% of all energy saving costs are targeted at this project category.
l The prevalence of projects to modernize refrigeration equipment and compressor systems varies strongly from industry to industry. Refrigeration equipment is being upgraded proactively in the meat and dairy sector as well as in the bread and confectionary industry, while these types of projects are barely present in the other industries. Projects to upgrade compressor systems are the most prevalent in metal-processing and machine building as well as in meat and dairy.
l Light industry has the lowest total costs for energy efficiency projects. Furthermore, the percentage of projects with a budget over RUR 5 mln is just �%.
In order to evaluate the differences among industries, we asked companies: what is the most important incentive to initiate energy efficiency projects? In the machine building and metal processing sector, this incentive turned out to be obsolete equipment. For the meat and dairy industry, the driving factor was the high level of energy costs – a typical company in this sector will easily spend 50% more than the average among all five industries.
3. Current energy efficiency practicesOn the road to energy efficiency: experience and future outlook
�5
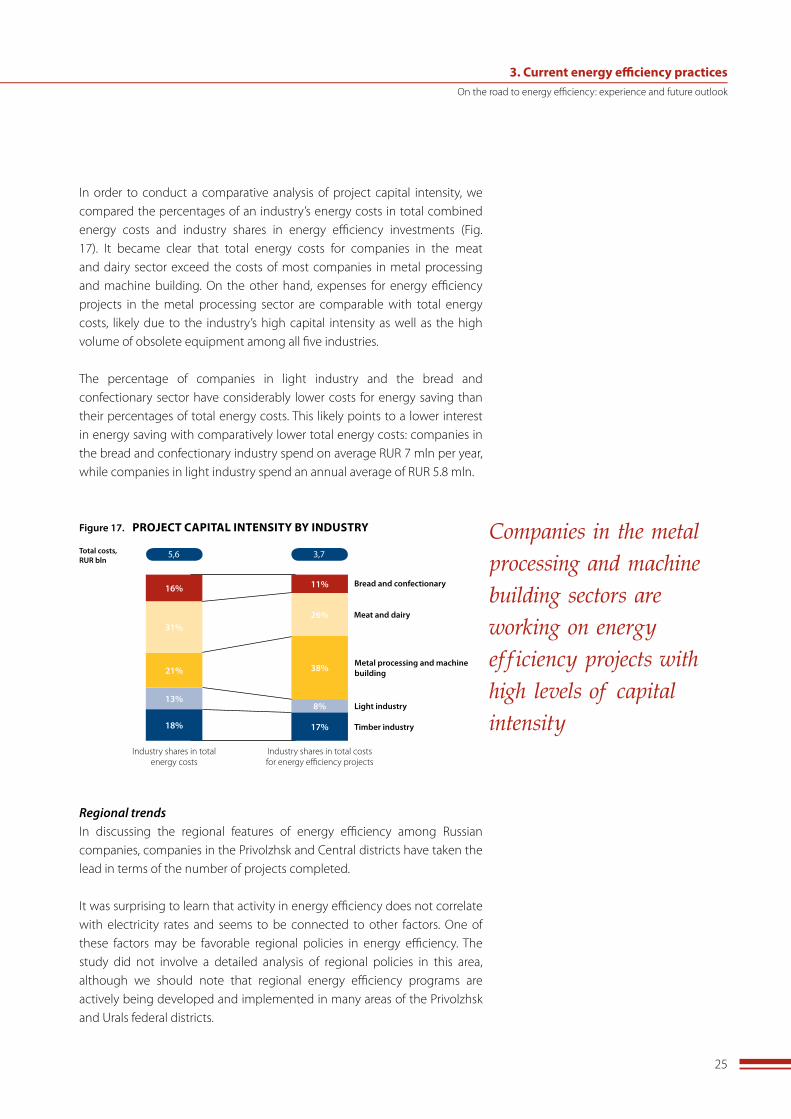
Companies in the metal processing and machine building sectors are working on energy efficiency projects with high levels of capital intensity
figure 17. PROJECT CAPITAL INTENSITY BY INDUSTRY
Bread and confectionary
Meat and dairy
Metal processing and machine building
Timber industry
Industry shares in total energy costs
18%
21%
31%
16%
Industry shares in total costs for energy efficiency projects
11%
38%
8%
26%
Light industry
17%
13%
3,75,6Total costs, RUR bln
In order to conduct a comparative analysis of project capital intensity, we compared the percentages of an industry’s energy costs in total combined energy costs and industry shares in energy efficiency investments (Fig. �7). It became clear that total energy costs for companies in the meat and dairy sector exceed the costs of most companies in metal processing and machine building. On the other hand, expenses for energy efficiency projects in the metal processing sector are comparable with total energy costs, likely due to the industry’s high capital intensity as well as the high volume of obsolete equipment among all five industries.
The percentage of companies in light industry and the bread and confectionary sector have considerably lower costs for energy saving than their percentages of total energy costs. This likely points to a lower interest in energy saving with comparatively lower total energy costs: companies in the bread and confectionary industry spend on average RUR 7 mln per year, while companies in light industry spend an annual average of RUR 5.8 mln.
Regional trendsIn discussing the regional features of energy efficiency among Russian companies, companies in the Privolzhsk and Central districts have taken the lead in terms of the number of projects completed.
It was surprising to learn that activity in energy efficiency does not correlate with electricity rates and seems to be connected to other factors. One of these factors may be favorable regional policies in energy efficiency. The study did not involve a detailed analysis of regional policies in this area, although we should note that regional energy efficiency programs are actively being developed and implemented in many areas of the Privolzhsk and Urals federal districts.
3. Current energy efficiency practicesOn the road to energy efficiency: experience and future outlook

�6
Increased rates are not enough
figure 19. RATES AND THE AVERAGE NUMBER OF ENERGY EFFICIENCY PROJECTS PER COMPANY, BY INDUSTRY
Electricity rates, kopecks per kWh
2,6
Nizhegorod region
143
124
102
108
111
111
111
112
113
118
Stavropolsk Krai
Samara region
Volgograd region
Chelyabinsk region
Sverdlovsk region
Novgorod region
Perm region
Leningrad region
St. Petersburg
Krasnodar Krai
3,2
3,1
2,8
3,4
3,3
3,4
4
3,8
2,3
3,1
The average number of projects per company
120
Information about rates was obtained from federal Rate Service Order No. 337-E/5 (August 2, 2005).
The number of completed projects does not correlate to average energy rates
figure 18. THE NUMBER OF ENERGY EFFICIENCY PROJECTS BY REGION
345 363 407
500
Northwest
413 451
Southern Central Privolzhsk
Tota
l num
ber o
f pro
ject
s (c
olum
ns)
�00
0 Elec
tric
ity
rate
s, k
opec
ks p
er k
Wh(1
) (the
lin
e an
d nu
mbe
rs)
�60
80
0
�00
�0040
��0
Urals
400
121 117 121 102 114
(1) The average weighed rate per the number of respondents by industry. Information about rates was obtained from Federal Rate Service Order No. 337-E/5 (August 2, 2005).
This more detailed review across different regions confirms our conclusion that rate hikes are not sufficient to push a company towards taking a more active stance when it comes to introducing energy efficiency measures. For example, in Krasnodar Krai, where rates are relatively high, the average number of projects per company is the lowest. In Nizhegorod region, the rates are much lower than average rates across all of Russia and yet many companies are actively involved in energy efficiency programs.
3. Current energy efficiency practicesOn the road to energy efficiency: experience and future outlook

�7
Companies are not making sufficient use of organizational factors
the plan has been prepared and is being implemented
Does the company have a plan to increase energy efficiency? If so, to what degree is this plan being implemented?
figure 20. IMPLEMENTING ENERGY EFFICIENCY PROJECTS: ORGANIZATIONAL FACTORS
Percentage of respondents
There is an employee or a division responsible for preparing and implementing measures
The company’s strategy or policy has a section on increasing energy efficiency
There are fines for irrational energy use
Bonuses are awarded for achieving savings
51%
22%
18%
16%
The most popular methods used to implement energy efficiency plans and measures:
31%
there is no plan but other measures are being taken
there is no plan, or a plan is not being carried out don’t know
54% 14%
Using bonuses to motivate employees to save energy is highly undervalued. Bonuses are a very effective tool for implementing programs, as demonstrated by international experience and examples in Russian companies.
�00%50%0%
percentage of respondents
4.1. ORGANIZING ENERGY EFFICIENCY PROGRAMS: CURRENT PRACTICES
For an energy efficiency program to succeed, it is crucial that managers have the proper expectations about the size of investments and the effects of the program. It is also highly important to draw up a detailed plan of action. As described in Chapter � of this report, many Russian companies believe that lowering costs is one way to increase competitiveness. We were able to identify a number of key organizational factors without which companies would have a very difficult time achieving their goals to lower energy consumption.
4. ORGANIZING ENERGY EFFICIENCY PROGRAMS
4. Organizing energy efficiency programsOn the road to energy efficiency: experience and future outlook
�8
The experiences of companies that have successfully carried out energy efficiency programs show that having an employee or division responsible for energy efficiency is often not enough. The company also needs to involve senior management in the planning process and set goals for the energy efficiency program as well as investment provisions.
The data show that only half of the companies have determined a structure outlining the person responsible for designing and implementing energy efficiency measures. Energy efficiency plans are only carried out at ��% of the companies that were surveyed, and only �6% of companies apply incentives programs for those who contribute to achieving targeted savings.
The experiences of companies that have achieved successful results in energy efficiency show that their success was achieved via a step-by-step program, the appointment of employees responsible for carrying out the program with the participation of key divisions, and an incentives program for achieving energy saving targets.
4.2. THE ACTION PLAN
Ensuring control over project deadlines and expenses presumes the existence of a well-developed energy efficiency program. As we have already mentioned in Chapter �, many companies carry out several energy efficiency projects at once: two to four on average (only �4% of all surveyed companies were able to carry out more – Fig. ��).
A deeper analysis shows that the companies that have comprehensive energy efficiency programs are involved with over four energy efficiency projects. Meanwhile, the companies working on energy efficiency measures that are not reinforced in a clear-cut program are generally limited to two or three projects. The difference between project management opportunities become especially clear when it comes to more complex measures, such as modernizing manufacturing equipment, heating systems and compressors. Among the companies that are working on an energy efficiency program,
4. Organizing energy efficiency programsOn the road to energy efficiency: experience and future outlook
Inset 3. THE KEYS TO SUCCESS: ORGANIZATION
«…In order to ensure the success of an energy efficiency project, it is important to set goals, secure management support, establish a control system for implementation and operation, and ensure a transparent incentives program for participating employees.
Any energy efficiency project should begin with organizing energy metering. Companies can achieve up to 5% in savings just by streamlining control in this area…»
Source: The Industrial Information Bulletin, No.4/�006

�9
Having a clear plan can help a company complete more projects
figure 22. IMPLEMENTING MEASURES BASED ON AN ACTION PLAN Percentage of respondents
Modernization of manufacturing equipment
Upgrading refrigeration units
Installing metering devices
Upgrading the heating system
Lighting
Compressors
23%12%
42%28%
36%31%
28%19%
49%39%
58%51%
25%22%
49%39%
Automated records and management system
Efficient drives / frequency controlled drives
percentage of companies without an action plan, where certain efforts are being made
percentage of companies with an action plan that is being carried out
Not many companies carry out more than five projects
figure 21. THE NUMBER OF PROJECTS PER COMPANY
11%
16%
� project
6% 5%Num
ber o
f com
pani
es, %
� projects � projects 4 projects 5 projects 6 projects 7 projects more than 8 projects
4%
13%
24%
9%
24% of companies surveyed
�0%
0%
�0%
�0%
nearly one-half are currently upgrading manufacturing equipment, while the percentage of those working on modernization programs without a clear-cut program is noticeably lower (�9%). Having a clear plan provides companies with the opportunity to carry out more projects that are in general more complex. This trend is illustrated in Figure ��.
Furthermore, the average size of projects carried out by companies that have a comprehensive energy efficiency plan is considerably larger than those who do not have a plan. For example, expenses for upgrading heating systems for companies that are working in line with an action plan amount to RUR �.8 mln, which is 56% higher than the average for all surveyed companies (RUR �.5 mln). Projects that aim to optimize compressor systems
4. Organizing energy efficiency programsOn the road to energy efficiency: experience and future outlook
�0
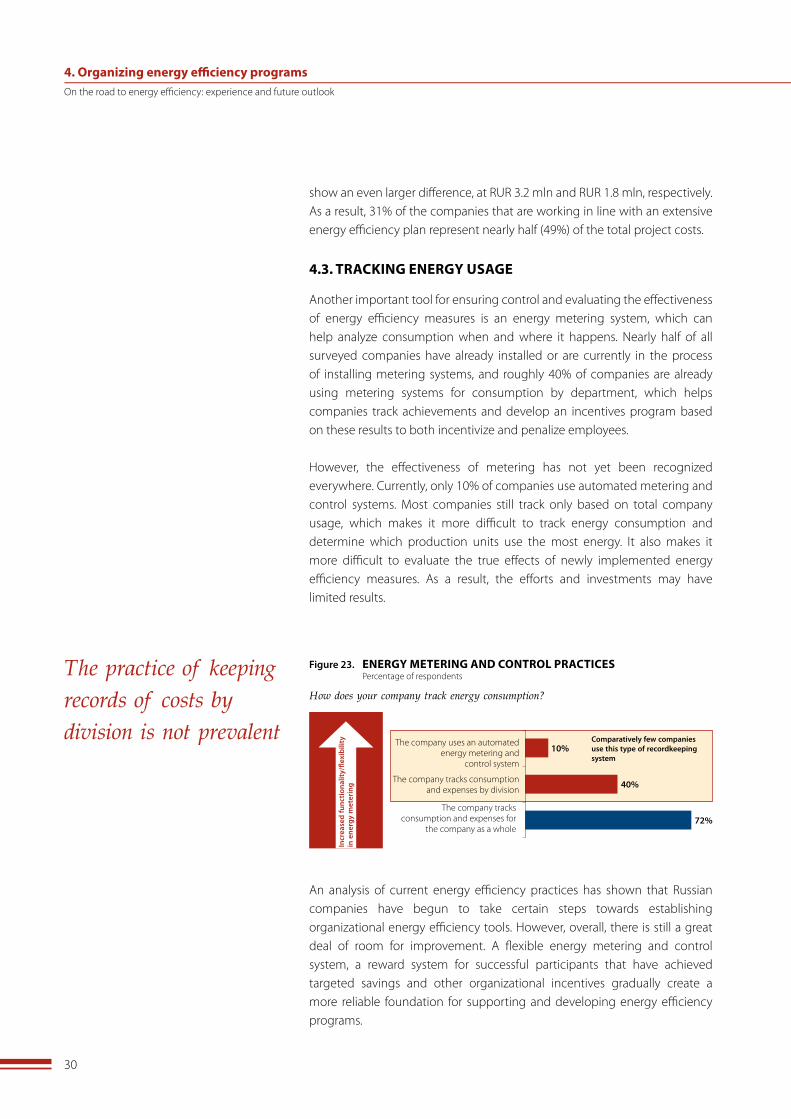
The practice of keeping records of costs by division is not prevalent
figure 23. ENERGY METERING AND CONTROL PRACTICES Percentage of respondents
How does your company track energy consumption?
Incr
ease
d fu
nctio
nalit
y/fle
xibi
lity
in
ene
rgy
met
erin
g
10%The company uses an automated
energy metering andcontrol system
72%
40%The company tracks consumption and expenses by division
The company tracks consumption and expenses for
the company as a whole
Comparatively few companies use this type of recordkeeping system
show an even larger difference, at RUR �.� mln and RUR �.8 mln, respectively. As a result, ��% of the companies that are working in line with an extensive energy efficiency plan represent nearly half (49%) of the total project costs.
4.3. TRACKING ENERGY USAGE
Another important tool for ensuring control and evaluating the effectiveness of energy efficiency measures is an energy metering system, which can help analyze consumption when and where it happens. Nearly half of all surveyed companies have already installed or are currently in the process of installing metering systems, and roughly 40% of companies are already using metering systems for consumption by department, which helps companies track achievements and develop an incentives program based on these results to both incentivize and penalize employees.
However, the effectiveness of metering has not yet been recognized everywhere. Currently, only �0% of companies use automated metering and control systems. Most companies still track only based on total company usage, which makes it more difficult to track energy consumption and determine which production units use the most energy. It also makes it more difficult to evaluate the true effects of newly implemented energy efficiency measures. As a result, the efforts and investments may have limited results.
An analysis of current energy efficiency practices has shown that Russian companies have begun to take certain steps towards establishing organizational energy efficiency tools. However, overall, there is still a great deal of room for improvement. A flexible energy metering and control system, a reward system for successful participants that have achieved targeted savings and other organizational incentives gradually create a more reliable foundation for supporting and developing energy efficiency programs.
4. Organizing energy efficiency programsOn the road to energy efficiency: experience and future outlook

��
figure 24. DYNAMICS OF THE CORPORATE LENDING MARKET RUR, trillion.
loans with tenors of 3 years or less
loans with tenors of 3 years or more
60
�0000
�00�
�0
40
8,7
46,8
5,4
37,4
3,9
27,620,015,0
9,6
�00� �004�00� �005 �006 (forecast)
36,5%
35,6%
CAGR ’00-’06
5,5
Source: Central Bank of Russia
Corporate lending market growth has expanded financing options
5.1. MACROECONOMIC PRECONDITIONS
The cornerstone in preparing an energy efficiency project is the presence of a company’s own financial means or the ability to secure outside financing for a program.
Over the past few years, the growth of the Russian economy and the development of financial markets have led to increased competition among banks on the lending market. Five years ago, it was very difficult for a company to secure outside financing quickly (a great deal of preparatory work was required, and credit procedures were very time consuming). Today, however, banks are trying to make the loan process as simple and speedy as possible, and a wide range of loans are now being offered. In addition to corporate lending, other types of long-term financing options are also growing.
5. PROJECT FINANCING
5.2. INVESTMENT POTENTIAL FOR MODERNIZATION
At present the total energy efficiency project expenses of the companies we surveyed amount to nearly RUR �.5-4 bln. Our study shows that managers expect these expenses to increase �5-�0% over the next two-three years. As a result, the total volume of planned investments in upgrading energy and high-consumption manufacturing equipment in the mid-term amounts to RUR 4.5-5 bln. As noted above, the metal processing and machine building industry will be among the top spenders. The volume of financing in this industry makes up nearly �0-�5% of the planned volume of financing for all five surveyed industries. Small and mid-sized projects of up to RUR �0 mln each will play a major role (over �0%) in company expenses for energy saving.
5. Project financingOn the road to energy efficiency: experience and future outlook
��
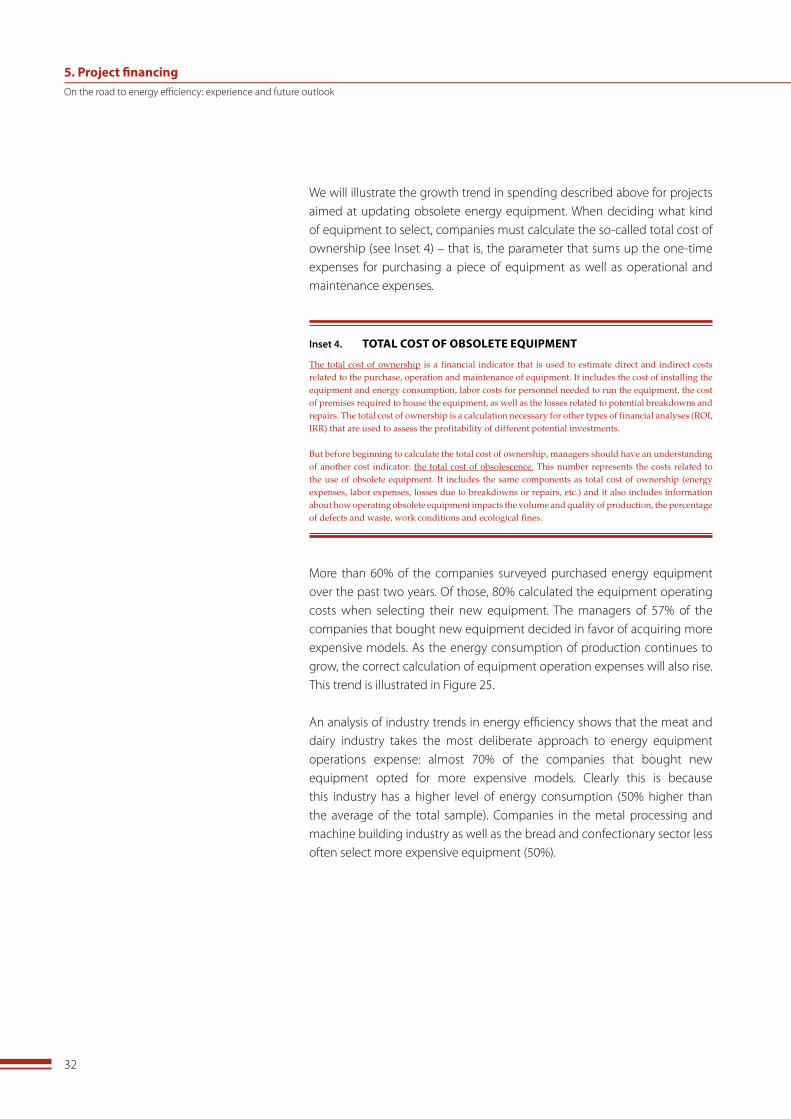
We will illustrate the growth trend in spending described above for projects aimed at updating obsolete energy equipment. When deciding what kind of equipment to select, companies must calculate the so-called total cost of ownership (see Inset 4) – that is, the parameter that sums up the one-time expenses for purchasing a piece of equipment as well as operational and maintenance expenses.
More than 60% of the companies surveyed purchased energy equipment over the past two years. Of those, 80% calculated the equipment operating costs when selecting their new equipment. The managers of 57% of the companies that bought new equipment decided in favor of acquiring more expensive models. As the energy consumption of production continues to grow, the correct calculation of equipment operation expenses will also rise. This trend is illustrated in Figure �5.
An analysis of industry trends in energy efficiency shows that the meat and dairy industry takes the most deliberate approach to energy equipment operations expense: almost 70% of the companies that bought new equipment opted for more expensive models. Clearly this is because this industry has a higher level of energy consumption (50% higher than the average of the total sample). Companies in the metal processing and machine building industry as well as the bread and confectionary sector less often select more expensive equipment (50%).
5. Project financingOn the road to energy efficiency: experience and future outlook
Inset 4. TOTAL COST OF OBSOLETE EQUIPMENT
The total cost of ownership is a financial indicator that is used to estimate direct and indirect costs related to the purchase, operation and maintenance of equipment. It includes the cost of installing the equipment and energy consumption, labor costs for personnel needed to run the equipment, the cost of premises required to house the equipment, as well as the losses related to potential breakdowns and repairs. The total cost of ownership is a calculation necessary for other types of financial analyses (ROI, IRR) that are used to assess the profitability of different potential investments.
But before beginning to calculate the total cost of ownership, managers should have an understanding of another cost indicator: the total cost of obsolescence. This number represents the costs related to the use of obsolete equipment. It includes the same components as total cost of ownership (energy expenses, labor expenses, losses due to breakdowns or repairs, etc.) and it also includes information about how operating obsolete equipment impacts the volume and quality of production, the percentage of defects and waste, work conditions and ecological fines.

��
What difficulties have you experienced in implementing energy efficiency projects?
Insufficient funds
Difficulties in securing financing for energy efficiency projects
Need to obtain permits / consent from government bodies
Difficulty in assessing the effects of the project
Reducing the energy consumption limit
figure 26. PROJECT DIFFICULTIES Percentage of respondents
64%
18%
24%
23%
16%
13%
Technical problems during implementation 6%
financial difficulties organizational difficulties technical difficulties
Lack of experience in developing these types of projects
Insufficient funds is a major obstacle
Companies now consider equipment operating costs when selecting new equipment
figure 25. CALCULATING EQUIPMENT OPERATIONS COSTS
If your company purchased energy equipment in 2004-2005, did you take equipment operating costs into account?
Did consider equipment operations costs and bought more expensive equipment
Did consider equipment operations costs and bought less expensive equipment
Did not consider equipment operations costs
47%
25%
27%
Low energy consumption
Moderate energy consumption
19%
22%
59%
High energy consumption
65%
16%
19%
Perc
enta
ge o
f res
pond
ents
that
bo
ught
new
equ
ipm
ent
The level of energy consumption of manufacturing equipment
5.3. ESTIMATING COMPANY DEMAND FOR FINANCING
Our research shows that many industries do have an appetite for financing energy efficiency projects. More than 60% of companies believe that insufficient funds is the key obstacle hampering energy efficiency projects (Fig. �6). In the next two-three years, the companies that were surveyed plan to secure outside financing for nearly 40-50% of their total costs for energy efficiency projects.
5. Project financingOn the road to energy efficiency: experience and future outlook

�4
However, companies avoid approaching banks and leasing companies for outside financing for energy efficiency projects despite the fact that ROI time frames for these projects now coincide with loan horizons. Only every fourth company has applied for outside financing, and nearly 90% of them were successfully granted loans (Fig. �7).
Most energy efficiency projects that are carried out today are low-budget with short-term returns. It is no surprise that companies prefer to finance these with their own capital. Furthermore, the small number of companies turning to banks may be related to the conservative estimated benefits from energy saving, lack of organizational experience in carrying out these kinds of projects, and inefficient support from a company’s technical services personnel and/or financial services.
On the other hand, financial institutions prefer to lend funds for projects that are meant to increase production capacities, not reducing expenses. Neither banks nor leasing companies have fully developed lending for energy efficiency projects as a separate banking product.
Only 24% have applied for loans
…and 89% were approved
figure 27. APPLYING FOR AND RECEIVING LOANS Percentage of respondents
No
No
Did your company apply for a loan with a bank to finance an energy
efficiency project in �005?
24%
76%
Did your company receive outside financing for these purposes?
11%
89%
Yes
Yes
Reasons against considering outside financing include high interest rates and sufficient funds (Fig. �8).
5. Project financingOn the road to energy efficiency: experience and future outlook
�5
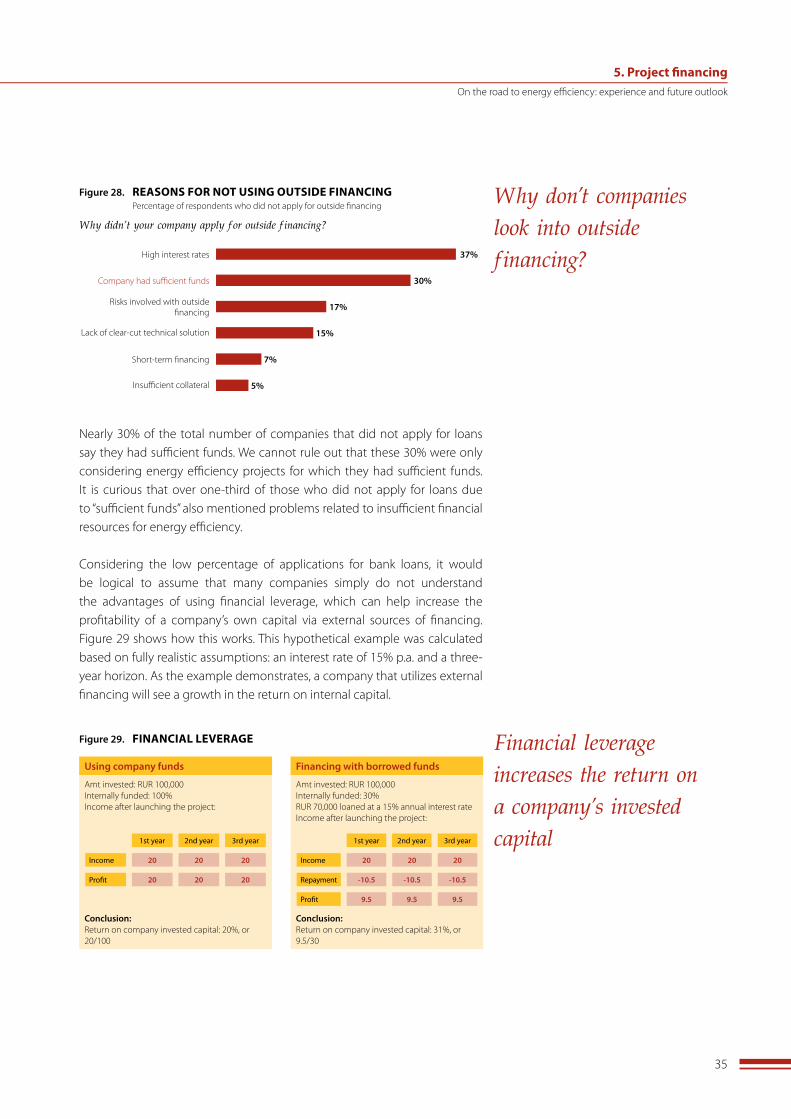
Financial leverage increases the return on a company’s invested capital
figure 29. FINANCIAL LEVERAGE
Using company funds
Amt invested: RUR �00,000Internally funded: �00%Income after launching the project:
Conclusion:Return on company invested capital: �0%, or �0/�00
financing with borrowed funds
Amt invested: RUR �00,000Internally funded: �0%RUR 70,000 loaned at a �5% annual interest rateIncome after launching the project:
Conclusion:Return on company invested capital: ��%, or 9.5/�0
Income
1st year 2nd year 3rd year
Income
Profit 20 20 20
20 20 20
Repayment
Profit 9.5 9.5 9.5
-10.5 -10.5 -10.5
20 20 20
1st year 2nd year 3rd year
Why didn’t your company apply for outside financing?
High interest rates
Company had sufficient funds
Risks involved with outside financing
Lack of clear-cut technical solution
Short-term financing
Insufficient collateral
figure 28. REASONS FOR NOT USING OUTSIDE FINANCING Percentage of respondents who did not apply for outside financing
37%
30%
17%
15%
7%
5%
Why don’t companies look into outside financing?
Nearly �0% of the total number of companies that did not apply for loans say they had sufficient funds. We cannot rule out that these �0% were only considering energy efficiency projects for which they had sufficient funds. It is curious that over one-third of those who did not apply for loans due to “sufficient funds” also mentioned problems related to insufficient financial resources for energy efficiency.
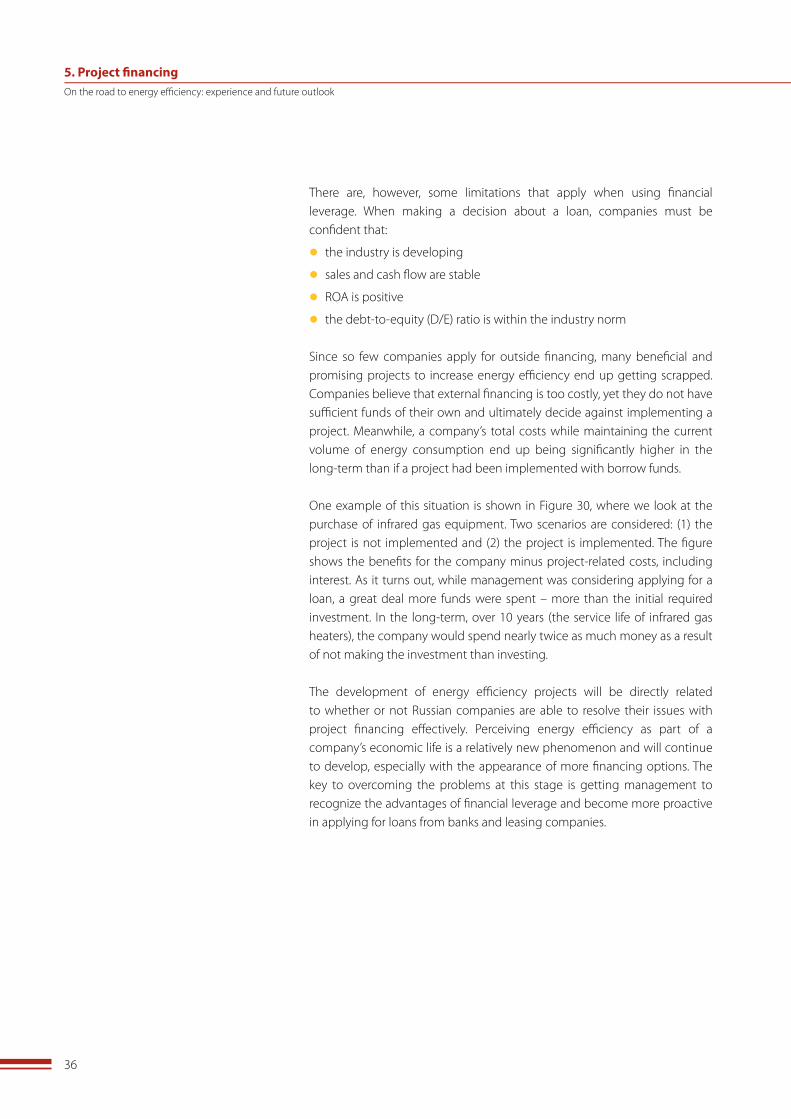
Considering the low percentage of applications for bank loans, it would be logical to assume that many companies simply do not understand the advantages of using financial leverage, which can help increase the profitability of a company’s own capital via external sources of financing. Figure �9 shows how this works. This hypothetical example was calculated based on fully realistic assumptions: an interest rate of �5% p.a. and a three-year horizon. As the example demonstrates, a company that utilizes external financing will see a growth in the return on internal capital.
5. Project financingOn the road to energy efficiency: experience and future outlook
�6
There are, however, some limitations that apply when using financial leverage. When making a decision about a loan, companies must be confident that:
l the industry is developing
l sales and cash flow are stable
l ROA is positive
l the debt-to-equity (D/E) ratio is within the industry norm
Since so few companies apply for outside financing, many beneficial and promising projects to increase energy efficiency end up getting scrapped. Companies believe that external financing is too costly, yet they do not have sufficient funds of their own and ultimately decide against implementing a project. Meanwhile, a company’s total costs while maintaining the current volume of energy consumption end up being significantly higher in the long-term than if a project had been implemented with borrow funds.
One example of this situation is shown in Figure �0, where we look at the purchase of infrared gas equipment. Two scenarios are considered: (�) the project is not implemented and (�) the project is implemented. The figure shows the benefits for the company minus project-related costs, including interest. As it turns out, while management was considering applying for a loan, a great deal more funds were spent – more than the initial required investment. In the long-term, over �0 years (the service life of infrared gas heaters), the company would spend nearly twice as much money as a result of not making the investment than investing.
The development of energy efficiency projects will be directly related to whether or not Russian companies are able to resolve their issues with project financing effectively. Perceiving energy efficiency as part of a company’s economic life is a relatively new phenomenon and will continue to develop, especially with the appearance of more financing options. The key to overcoming the problems at this stage is getting management to recognize the advantages of financial leverage and become more proactive in applying for loans from banks and leasing companies.
5. Project financingOn the road to energy efficiency: experience and future outlook

�7
Valuable projects may be bypassed
figure 30. AN EXAMPLE IN PROJECT FINANCING FOR ENERGY EFFICIENCY
Investment opportunity
Infrared gas equipment valued at RUR 4.� mln was purchased by a mechanical factory in order to update its heating and repair divisions
It helped reduce heating costs from RUR �.� mln to RUR 0.7 mln thanks to flexible temperature control in heated areas and heat supply depending on the time of day
External financing was required for this project, and the project was postponed over five years
However after a careful analysis of costs, including loan and interest repayment, the results of the project and the ROI, management decided to apply for a loan
Considering the five-year planning horizon, the company’s expenses are higher if they do not implement the project than if they do
Calculations with horizons of five and 10 years
SCENARIO #2: The project is carried out with a three-year bank loan
n One-time equipment costs: RUR 4.� mlnn Annual costs of RUR 0.7 mlnn The �5% interest on the loan comes to RUR �.9
mln over three years
Expenses over five years: RUR 9.6 mln
Expenses over 10 years: RUR 11.7 mln
SCENARIO #1: The project is not carried out
Annual expenses amount to RUR �.� mln
Expenses over five years: RUR 10.5 mln
Expenses over 10 years: RUR 21 mln
5.4. PAYBACK PERIODS
As we have already mentioned, measures to increase energy efficiency have different budgets and, correspondingly, different savings potential. When deciding which projects to include in an energy efficiency program, the management teams of just 45% of all surveyed companies consider return on investment time frames. Roughly �5% of companies sometimes analyze ROI, but not systematically. Almost one-third of companies surveyed did not examine ROI for their key projects. It is possible that this lack of prevalance of calculating the payback period may explain the low level of company activity in implementing energy efficiency projects.
It should be noted that projects that involve larger investments do not necessarily have a longer-term payback. For example, the simple payback period on projects to update process equipment averages �6 months. Process equipment modernization projects are carried out by 45% of the companies that were surveyed. Other, relatively more expensive projects, such as upgrading heating and compressor systems, also have a relatively short-term payback close to two years.
5. Project financingOn the road to energy efficiency: experience and future outlook
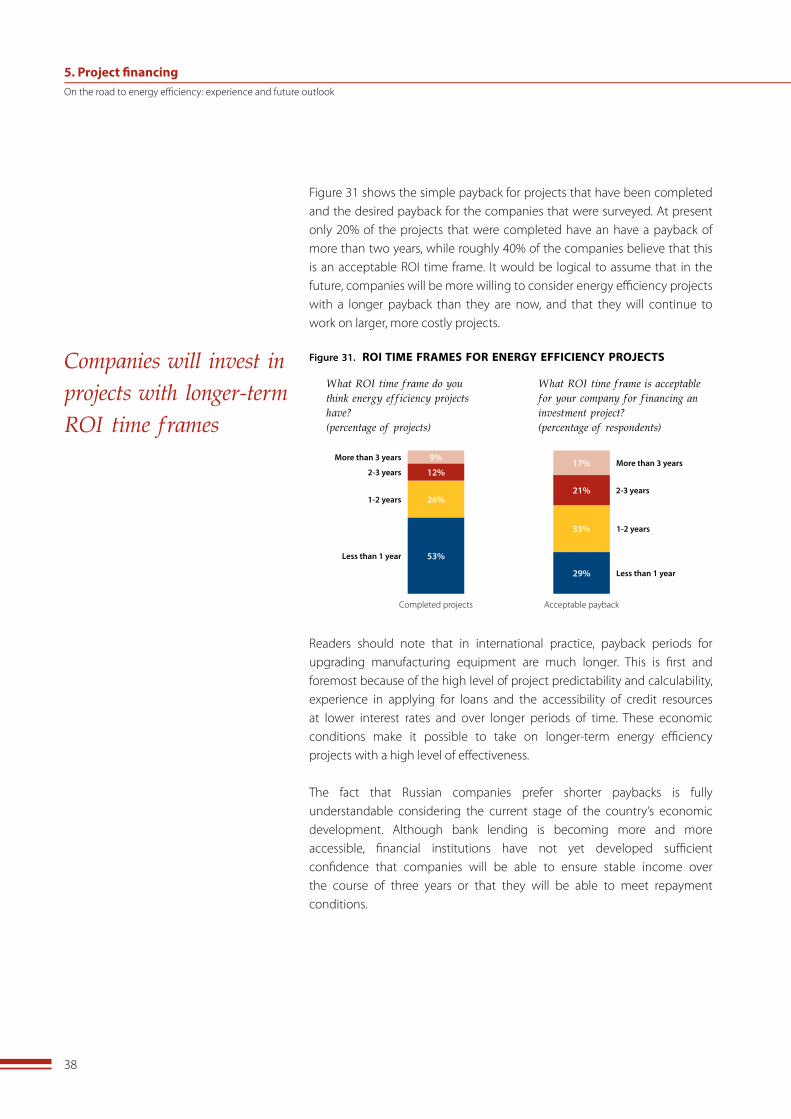
�8
Figure �� shows the simple payback for projects that have been completed and the desired payback for the companies that were surveyed. At present only �0% of the projects that were completed have an have a payback of more than two years, while roughly 40% of the companies believe that this is an acceptable ROI time frame. It would be logical to assume that in the future, companies will be more willing to consider energy efficiency projects with a longer payback than they are now, and that they will continue to work on larger, more costly projects.
Companies will invest in projects with longer-term ROI time frames
figure 31. ROI TIME FRAMES FOR ENERGY EFFICIENCY PROJECTS
More than 3 years
2-3 years
1-2 years
Less than 1 year
More than 3 years
2-3 years
1-2 years
Less than 1 year
Completed projects
53%
26%
12%
9%
Acceptable payback
17%
33%
29%
21%
What ROI time frame is acceptable for your company for financing an investment project? (percentage of respondents)
What ROI time frame do you think energy efficiency projects have? (percentage of projects)
Readers should note that in international practice, payback periods for upgrading manufacturing equipment are much longer. This is first and foremost because of the high level of project predictability and calculability, experience in applying for loans and the accessibility of credit resources at lower interest rates and over longer periods of time. These economic conditions make it possible to take on longer-term energy efficiency projects with a high level of effectiveness.
The fact that Russian companies prefer shorter paybacks is fully understandable considering the current stage of the country’s economic development. Although bank lending is becoming more and more accessible, financial institutions have not yet developed sufficient confidence that companies will be able to ensure stable income over the course of three years or that they will be able to meet repayment conditions.
5. Project financingOn the road to energy efficiency: experience and future outlook
�9
5.5. FINANCING FUTURE ENERGY EFFICIENCY PROJECTS
As stated earlier, the companies that took part in this survey currently spend more than RUR �.5 bln on various projects aimed at increasing energy efficiency, which is roughly 60% of their total cumulative energy costs. In the next two-three years, these total expenses will amount to RUR 4.5-5 bln. Nearly �4% of the companies that were surveyed applied for a loan from a bank or leasing company in �005.
Another no less important component for building effective project financing policies is the ratio between expected savings and the repayment term. Overall, management teams make rather ambitious plans when it comes to ROI time frames. This is determined by conditions in the country as well as the repayment terms for the kinds of loans that these companies might consider.
It is difficult to claim objectively that repayment conditions for loans that Russian companies receive for energy efficiency projects are very short-term. As we noted above, 7% of respondents say that short-term repayment is one of the reasons why they do not apply for outside financing. If we take a closer look at the companies that have secured loans for energy efficiency projects, we see that �0-�5% of the loans have repayment terms of either three years or longer. A comparison of the ROI time frames for these projects and the loan repayment terms shows that the companies are trying to limit the ROI time frames themselves in order to accelerate loan repayment. Nearly 50% of the respondents who intend to take out a loan want to use the loan for a project that involves an ROI time frame that is longer than the loan repayment term. This demonstrates that companies are basically ready to take on potential financial risks related to difficulties in future operations, and sometimes do not decide to carry out valuable projects with longer-term ROI time frames since they do not fully understand external financing opportunities.
Managers may be advised to adopt a more flexible approach for taking advantage of today’s opportunities on the financial market. The better informed management is about the full range of external financing opportunities and their related advantages, the more successful and beneficial the energy efficiency projects they carry out will be.
5. Project financingOn the road to energy efficiency: experience and future outlook

40
6.1. SUCCESS FACTORS FOR ENERGY EFFICIENCY PROJECTS
Based on the results of this study, international experience and the experience of successful Russian companies, we can name several key success factors for energy efficiency programs.
6. RESULTS AND RECOMMENDATIONS
Key success factors for energy efficiency programs
figure 32. KEY SUCCESS FACTORS FOR ENERGY EFFICIENCY PROJECTS
Factor Current situation for companies
Wh
AT T
O D
O?
A realistic estimate of savings potential
Savings estimates are conservative
A development strategy determines energy needs
Energy saving measures are often not aligned with companies’ development strategies
A step-by-step program that moves from low-cost measures to more capital intensive phases
Most projects are low-cost with short ROI time frames
hO
W T
O O
RGA
NIZ
E IT
? A comprehensive action plan for energy efficiency
Companies carry out different measures, but not comprehensive programs, which lowers the effectiveness and the scope of the projects
Employees in charge of energy efficiency, a bonus-based incentives program and management involvement
Not all companies have employees or divisions responsible for energy efficiency, and bonuses are awarded very rarely
Detailed metering of energy consumption at a departmental level
This factor is rarely seen, which deprives management of a tool to analyze and manage spending
hO
W T
O f
INA
NCE
IT?
A calculation of ROI Companies calculate ROI less than 50% of the time
Recognition of the opportunities and benefits of securing external financing
Managers avoid loans, especially long-term loans, which leads to projects being postponed
Keeping informed of the situation on the financial market, including long-term investments
Awareness levels are low; only one-fourth of companies have applied for a loan
1
2
3
4
5
6
7
8
9
If a company’s management has already recognized the need to introduce an energy efficiency program, it needs to find the correct answers to the following questions before getting started: what exactly does the company need to do, how will it organize the process and how will it finance the projects? The answers to these questions will naturally be different for each specific situation, but trends and information outlined in this report will be helpful for most companies.
6. Results and recommendationsOn the road to energy efficiency: experience and future outlook

4�
l What exactly does the company need to do? The first step is a realistic estimate of a company’s savings potential,
which can be done either with an internal or external audit of energy consumption, as well as comparing the levels of energy consumption for production with peer companies using an industry consumption curve. Companies should also identify the required volume of energy with respect to the company’s general development strategy and plans for upgrading manufacturing equipment. This analysis will provide an opportunity to compile a list of possible measures to increase energy efficiency, both low-cost and capital intensive steps. The next step is to identify priorities and carry out the plan.
l How will the company organize the process? Efficient organization of energy efficiency programs requires a
comprehensive plan with detailed control over the different parts of the plan. The lack of an action plan will have a negative effect on a company’s ability to achieve successful results in many different areas of energy saving. A transparent incentives system for employees who are involved in energy efficiency and proper recordkeeping practices for energy expenses are also fundamental elements of effective organization.
l How will the company finance the projects? Calculating the return on investment is an important element in initiating
any project, especially if the project requires external financing. The practice of applying for loans for energy efficiency projects is not yet sufficiently widespread among Russian companies, although banks are now offering more and more opportunities in this area.
6.2. CONSUMPTION CURVES
As we already mentioned in Chapter �, during this survey we were able to establish a tool for positioning the energy consumption of companies. This allows us to compare the energy efficiency of companies in one industry. We have gathered information about the production volumes, output and the energy consumption level required to support these production levels in various sub sectors. Intra-sector differentiation is needed because the specifics of production dictate certain requirements for the way in which energy is consumed and at what volumes it is consumed. Neglecting to consider these aspects may result in incorrect conclusions.
6. Results and recommendationsOn the road to energy efficiency: experience and future outlook

4�
We have attempted to identify the mathematical patterns between production volumes and energy consumption and build consumption curves that will illustrate the dependency of the amount of energy consumed on a production volume within sub sectors. Knowledge of the energy consumption function in the respective sub sector may be useful to managers in order to understand and evaluate just how efficiently their companies are using energy. The curves in Appendix � are indicative of the situation, as in many cases the number of observations is insufficient or the R� indicator is too low. Companies are encouraged to work with their industry associations to gather, analyze and distribute more representative comparative data on the use of energy resources.
This may be a useful tool for companies with similar lines of business. Only a simple calculation is needed: companies need to calculate the energy consumption of their companies and the total number of goods produced (in pieces or by tons) and then mark their location with the corresponding coordinates on the axes shown in the charts (Appendix �, by industry).
If your company’s point on the chart is:
l lower than the industry curve: your company’s energy efficiency is higher than the industry average;
l higher than the industry curve: your company likely needs to take measures to improve energy efficiency;
l on the industry curve: this means that your company’s energy efficiency coincides with the industry average.
6. Results and recommendationsOn the road to energy efficiency: experience and future outlook

4�
CONSUMPTION CURVES BY INDUSTRY
The curves below are indicative of trends rather than representative as, in many cases, the number of observations was insufficient, or the R� indicator was too low. Companies are encouraged to work with their industry associations to gather, analyze and distribute more representative comparative data on the use of energy resources.
APPENDIX 1
Light industry (garments): 9 companies
Tota
l ene
rgy
cons
umpt
ion,
mln
s of
kW
h
figure 2. LIGHT INDUSTRY
Annual production volume, thousands of pieces
0 500�00 �00 400
5
�0
�5
�0
�5
�0
�5
0
y = 0.0413x-0.5915
R2 = 0.6704
�00
The furniture industry: 9 companies
figure 1. THE FURNITURE INDUSTRY
Tota
l ene
rgy
cons
umpt
ion,
mln
s of
kW
h
Annual production volume, thousands of pieces
0 �05 �0 �5
�
�
�
4
5
6
7
8
0
y = 0.077x + 1.753
R2 = 0.0566
Appendix 1On the road to energy efficiency: experience and future outlook

44
The meat processing industry: 11 companies
Tota
l ene
rgy
cons
umpt
ion,
mln
s of
kW
h
figure 4. THE MEAT PROCESSING INDUSTRY
Annual production volume, thousands of pieces
0 ��00�00 900
�
�
�
4
5
0
y = 0.0016x + 0.3321
R2 = 0.7872
600
The dairy sector: 16 companies
Tota
l ene
rgy
cons
umpt
ion,
mln
s of
kW
h
figure 3. THE DAIRY SECTOR
Annual production volume, thousands of pieces
0 �0�0 �0
�0
�0
50
60
70
80
90
0
y = 0.9158x + 17.914
R2 = 0.1239
�0
40
Appendix 1On the road to energy efficiency: experience and future outlook

45
The timber processing industry
figure 1. THE wOOD PROCESSING INDUSTRY
Type of project:
Least popular projects with low costs
Upgrading heating systems
Effective frequency controlled drives
Installing automated systems of metering and managing energy use
Upgrading manufacturing equipment
Building insulation
Installation of metering systems
Lighting
Compressors
Most popular projects with high capital intensity
total project expenses for all companies (RUR, mln)
Percentage of companies implementing these projects
Aver
age
proj
ect
expe
nses
�0% 60%
RUR � mln
28
25
11
7
45
49
382
103
47
Light industry
Least popular projects with low costs
Most popular projects with high capital intensity
17
figure 2. LIGHT INDUSTRY
Type of project:
Compressors
Lighting
Effective frequency controlled drives
Upgrading heating systems
Installation of metering systems
Building insulation
Upgrading refrigeration equipment
Upgrading manufacturing equipment
Installing automated systems of metering and managing energy use
total project expenses for all companies (RUR, mln)
Percentage of companies implementing these projects
Aver
age
proj
ect
expe
nses
�0% 60%
RUR � mln46
149 22 32
72
62
47
12
AN OVERVIEw OF ENERGY EFFICIENCY PROJECTS BY INDUSTRY
APPENDIX 2
Appendix 2On the road to energy efficiency: experience and future outlook
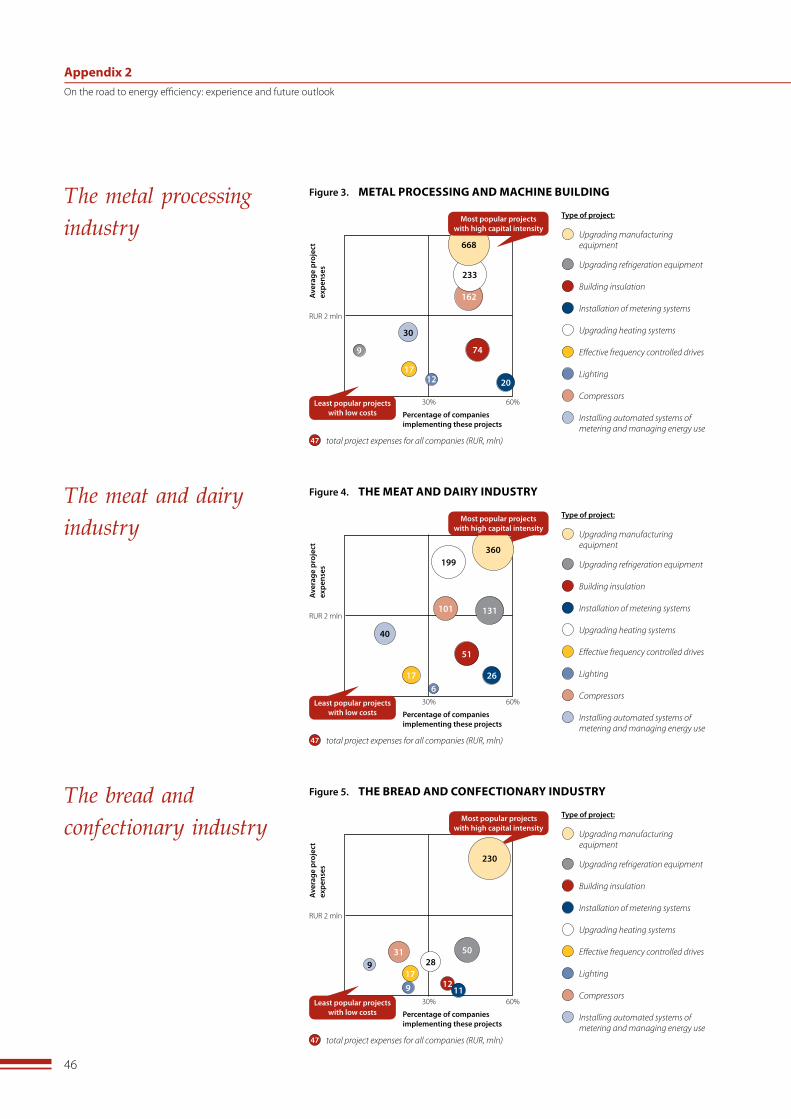
46
Least popular projects with low costs
9
The bread and confectionary industry
figure 5. THE BREAD AND CONFECTIONARY INDUSTRY
Type of project:
Compressors
Lighting
Effective frequency controlled drives
Upgrading heating systems
Installation of metering systems
Building insulation
Upgrading refrigeration equipment
Upgrading manufacturing equipment
Installing automated systems of metering and managing energy use
total project expenses for all companies (RUR, mln)
Percentage of companies implementing these projects
Aver
age
proj
ect
expe
nses
�0% 60%
RUR � mln
Most popular projects with high capital intensity
31 50
1712
11
230
28
47
9
Least popular projects with low costs
40
The meat and dairy industry
figure 4. THE MEAT AND DAIRY INDUSTRY
Type of project:
Compressors
Lighting
Effective frequency controlled drives
Upgrading heating systems
Installation of metering systems
Building insulation
Upgrading refrigeration equipment
Upgrading manufacturing equipment
Installing automated systems of metering and managing energy use
total project expenses for all companies (RUR, mln)
Percentage of companies implementing these projects
Aver
age
proj
ect
expe
nses
�0% 60%
RUR � mln
Most popular projects with high capital intensity
101 131
17
51
26
360199
47
6
Appendix 2On the road to energy efficiency: experience and future outlook
Least popular projects with low costs
30
The metal processing industry
figure 3. METAL PROCESSING AND MACHINE BUILDING
Type of project:
Compressors
Lighting
Effective frequency controlled drives
Upgrading heating systems
Installation of metering systems
Building insulation
Upgrading refrigeration equipment
Upgrading manufacturing equipment
Installing automated systems of metering and managing energy use
total project expenses for all companies (RUR, mln)
Percentage of companies implementing these projects
Aver
age
proj
ect
expe
nses
�0% 60%
RUR � mln
162
9
17
74
20
668
233
47
12
Most popular projects with high capital intensity

47
The Northwest Region
17
figure 2. THE NORTHwEST REGION
Type of project:
Compressors
Lighting
Effective frequency controlled drives
Upgrading heating systems
Installation of metering systems
Building insulation
Upgrading refrigeration equipment
Upgrading manufacturing equipment
Installing automated systems of metering and managing energy use
total project expenses for all companies (RUR, mln)
Percentage of companies implementing these projects
Aver
age
proj
ect
expe
nses
�0% 60%Least popular projects with low costs
RUR � mln
Most popular projects with high capital intensity
46
56
11 16
723
158
47
4
33
The Central Region
25
figure 1. THE CENTRAL REGION
Type of project:
Compressors
Lighting
Effective frequency controlled drives
Upgrading heating systems
Installation of metering systems
Building insulation
Upgrading refrigeration equipment
Upgrading manufacturing equipment
Least popular projects with low costs Installing automated systems of
metering and managing energy usetotal project expenses for all companies (RUR, mln)
Percentage of companies implementing these projects
Aver
age
proj
ect
expe
nses
�0% 60%
RUR � mln
Most popular projects with high capital intensity
35
34
735
343
154
47
1920
AN OVERVIEw OF ENERGY EFFICIENCY PROJECTS BY REGION
APPENDIX 3
Appendix 3On the road to energy efficiency: experience and future outlook

48
4
Least popular projects with low costs
The Urals Region figure 5. THE URALS REGION
Type of project:
Compressors
Lighting
Effective frequency controlled drives
Upgrading heating systems
Installation of metering systems
Building insulation
Upgrading refrigeration equipment
Upgrading manufacturing equipment
Installing automated systems of metering and control of energy use
total project expenses for all companies (RUR, mln)
Percentage of companies implementing these projects
Aver
age
proj
ect
expe
nses
�0% 60%
RUR � mln
Most popular projects with high capital intensity
48
15
46
177
83
47
528
191
Least popular projects with low costs
35
The Privolzhsk Region figure 4. THE PRIVOLZHSK REGION
Type of project:
Compressors
Lighting
Effective frequency controlled drives
Upgrading heating systems
Installation of metering systems
Building insulation
Upgrading refrigeration equipment
Upgrading manufacturing equipment
Installing automated systems of metering and control of energy use
total project expenses for all companies (RUR, mln)
Percentage of companies implementing these projects
Aver
age
proj
ect
expe
nses
�0% 60%
RUR � mln
Most popular projects with high capital intensity
2821 27
363
164
47
526
67
Least popular projects with low costs
62
The Southern Region figure 3. THE SOUTHERN REGION
Type of project:
Compressors
Lighting
Effective frequency controlled drives
Upgrading heating systems
Installation of metering systems
Building insulation
Upgrading refrigeration equipment
Upgrading manufacturing equipment
Installing automated systems of metering and control of energy use
(47) total project expenses for all companies (RUR, mln)
Percentage of companies implementing these projects
Aver
age
proj
ect
expe
nses
�0% 60%
RUR � mln
Most popular projects with high capital intensity
39
17
49
105
66
47
1329
34
Appendix 3On the road to energy efficiency: experience and future outlook

49
The volume of obsolete equipment in the timber processing industry
figure 1. THE TIMBER PROCESSING INDUSTRY
Boiler equipment
Variable speed drives
Compressors
Ventilation systems
Pumps
Electrical drives / motors
The percentage of companies operating energy equipment over 10 years old
The percentage of respondents using equipment
Heat exchangers
44%
43%
42%
40%
40%
39%
32%
43%
27%
43%
36%
42%
36%
24%
0% 60%�0% 40%
over 25from 16 to 25from 11 to 15Years equipment in operation
The volume of obsolete equipment in light industry
figure 2. LIGHT INDUSTRY
Electrical drives / motors
Boiler equipment
Pumps
Heat exchangers
Compressors
Ventilation systems
The percentage of companies operating energy equipment over 10 years old
The percentage of respondents using equipment
Re-circulating water cooling systems
75%
73%
72%
71%
69%
69%
68%
32%
15%
34%
21%
17%
over 25from 16 to 25from 11 to 15Years equipment in operation
26%
41%
0% 80%�0% 60%40%
THE VOLUME OF OBSOLETE EQUIPMENT BY INDUSTRY
APPENDIX 4
Appendix 4On the road to energy efficiency: experience and future outlook

50
The volume of obsolete equipment in the metal processing and machine building sector
figure 3. THE METAL PROCESSING AND MACHINE BUILDING SECTOR
Ventilation systems
Boiler equipment
Compressors
Pumps
Re-circulating water cooling systems
Heat exchangers
The percentage of companies operating energy equipment over 10 years old
The percentage of respondents using equipment
68%
67%
67%
66%
65%
65%
64%
50%
51%
43%
34%
52%
55%
58%
0% 80%�0% 60%40%
63% 26%
Electrical drives / motors
Variable speed drives
over 25from 16 to 25 from 11 to 15 Years equipment in operation
The volume of obsolete equipment in the meat and dairy industry
figure 4. THE MEAT AND DAIRY INDUSTRY
Compressors
Heat exchangers
Pumps
Boiler equipment
Refrigerators
Electrical drives / motors
The percentage of companies operating energy equipment over 10 years old
The percentage of respondents using equipment
52%
51%
51%
50%
50%
50%
49%
70%
76%
75%
77%
83%
74%
70%
0% 60%�0% 40%
47% 53%
Ventilation systems
Re-circulating water cooling systems
42% 36%Variable speed drives
from 11 to 15 over 25from 16 to 25 Years equipment in operation
The volume of obsolete equipment in the bread and confectionary industry
figure 5. THE BREAD AND CONFECTIONARY INDUSTRY
Re-circulating water cooling systems
Compressors
Variable speed drives
Pumps
Electrical drives / motors
Heat exchangers
The percentage of companies operating energy equipment over 10 years old
The percentage of respondents using equipment
67%
63%
61%
60%
59%
58%
58%
34%
89%
65%
90%
88%
53%
66%
0% 80%�0% 40%
57% 98%
Ventilation systems
Boiler equipment
57% 83%Refrigerators
over 25from 16 to 25 from 11 to 15 Years equipment in operation
60%
Appendix 4On the road to energy efficiency: experience and future outlook

5�
IFC’s Russia Sustainable Energy Finance Program
The International Finance Corporation (IFC) has accumulated vast experience in financing energy efficiency worldwide, including in Eastern Europe. The IFC has designed a special sustainable energy finance program for Russia as well. The program is meant to serve as a catalyst for the Russian energy efficiency market and encourage the active involvement of Russian companies, financial institutions and suppliers of equipment and services on this market. Under this program, the IFC will grant long-term (up to five-year) credit lines and partial guarantees to Russian banks and leasing companies which, in turn, will finance specific projects in energy efficiency. Our experts also provide technical, legal and financial consulting support for companies at all stages in project implementation.
The technical support program is financed by the Global Ecological Fund (GEF), the International Finance Corporation’s Fund for the Sustainable Development of Financial Markets, the Danish Environmental Protection Agency, the Finnish Ministries of Foreign Affairs and Industry and Trade, and the government of the Free State of Saxony.
Expert support includes:
l consulting for technical issues connected to identifying energy savings potential and an assessment of specific project risks;
l financial consulting, transaction structuring, financial project modeling aimed at estimating the economic efficiency of energy conservation, estimating financial risks, and providing assistance in preparing all required documents for loan applications with a bank or a leasing company;
l legal support: consulting regarding the legal structure of transactions and legislative requirements;
l informational support: provision of analytical information about different market segments, as well as about potential partners and equipment suppliers.
Projects that meet the following criteria are eligible for our program:
l the project is aimed at significantly increasing a company’s energy efficiency;
l the borrower or lessee is a privately owned company in which the government directly or indirectly holds interest of 49% or less (project financing in the municipal sector is a possibility if the bank or leasing company consents to take on the risks associated with financing a specific project);
l the ROI time frame does not exceed five years;
l the project involves installing equipment that has been tested and has been proven to be energy efficient. This applies to both Russian-made and imported equipment. All general industry equipment is eligible, such as manufacturing equipment that is specific to certain industries. Technologies for using renewable sources of energy and cogeneration will also be considered.
If your company is interested in increasing energy efficiency and has already selected an initial project in this area, you may receive project consultation. To start, you must prepare a description of the project, which should include the following information:
l a brief description of the company;
l an outline of the situation in the market specific to how it may affect the project’s outlook;
l the proposed technical solution(s);
l base financial aspects of the project (the size of the project, the required financing, expected savings and the ROI time frame).

5�
Related Documents