arXiv:astro-ph/0505384v1 18 May 2005 To be published to Astrophysical Journal On the relevance of the Tremaine-Weinberg method applied to Hα velocity field.Pattern speeds determination in M100 (NGC 4321). Olivier Hernandez D´ epartement de physique and Observatoire du mont M´ egantic, Universit´ e de Montr´ eal, C.P. 6128, Succ. centre ville,Montr´ eal, Qu´ ebec, Canada. H3C 3J7 [email protected] Herv´ e Wozniak Centre de Recherche Astronomique de Lyon, 9 avenue Charles Andr´ e, F-69561 Lyon, France [email protected] Claude Carignan D´ epartement de physique and Observatoire du mont M´ egantic, Universit´ e de Montr´ eal, C.P. 6128, Succ. centre ville, Montr´ eal, Qu´ ebec, Canada. H3C 3J7 [email protected] Philippe Amram Observatoire Astrophysique Marseille Provence, Laboratoire d’Astrophysique de Marseille,2 Place Le Verrier, F–13248 Marseille Cedex 04, France [email protected] Laurent Chemin D´ epartement de physique and Observatoire du mont M´ egantic, Universit´ e de Montr´ eal, C.P. 6128, Succ. centre ville,Montr´ eal, Qu´ ebec, Canada. H3C 3J7 [email protected] and Olivier Daigle D´ epartement de physique and Observatoire du mont M´ egantic, Universit´ e de Montr´ eal, C.P. 6128, Succ. centre ville,Montr´ eal, Qu´ ebec, Canada. H3C 3J7 [email protected] ABSTRACT The relevance of the Tremaine-Weinberg (TW) method is tested to measure the bar, spiral and inner structure pattern speeds using a gaseous velocity field. The TW method is applied to

Welcome message from author
This document is posted to help you gain knowledge. Please leave a comment to let me know what you think about it! Share it to your friends and learn new things together.
Transcript
arX
iv:a
stro
-ph/
0505
384v
1 1
8 M
ay 2
005
To be published to Astrophysical Journal
On the relevance of the Tremaine-Weinberg method applied to Hα velocity
field.Pattern speeds determination in M100 (NGC 4321).
Olivier Hernandez
Departement de physique and Observatoire du mont Megantic, Universite de Montreal, C.P. 6128, Succ.
centre ville,Montreal, Quebec, Canada. H3C 3J7
Herve Wozniak
Centre de Recherche Astronomique de Lyon, 9 avenue Charles Andre, F-69561 Lyon, France
Claude Carignan
Departement de physique and Observatoire du mont Megantic, Universite de Montreal, C.P. 6128, Succ.
centre ville, Montreal, Quebec, Canada. H3C 3J7
Philippe Amram
Observatoire Astrophysique Marseille Provence, Laboratoire d’Astrophysique de Marseille,2 Place Le
Verrier, F–13248 Marseille Cedex 04, France
Laurent Chemin
Departement de physique and Observatoire du mont Megantic, Universite de Montreal, C.P. 6128, Succ.
centre ville,Montreal, Quebec, Canada. H3C 3J7
and
Olivier Daigle
Departement de physique and Observatoire du mont Megantic, Universite de Montreal, C.P. 6128, Succ.
centre ville,Montreal, Quebec, Canada. H3C 3J7
ABSTRACT
The relevance of the Tremaine-Weinberg (TW) method is tested to measure the bar, spiral
and inner structure pattern speeds using a gaseous velocity field. The TW method is applied to
– 2 –
various simulated barred galaxies in order to demonstrate its validity in seven different configura-
tions, including star formation or/and dark matter halo. The reliability of the different physical
processes involved and of the various observational parameters are also tested. The simulations
show that the TW method could be applied to the gaseous velocity fields to get a good estimate
of the bar pattern speed, under the condition that regions of shocks are avoided and measure-
ments are confined to regions where the gaseous bar is well formed. We successfully apply the
TW method to the Hα velocity field of the Virgo Cluster Galaxy M100 (NGC 4321) and derive
pattern speeds of 55± 5 kms−1 kpc−1 for the nuclear structure, 30± 2 km s−1 kpc−1 for the bar
and 20± 1 km s−1 kpc−1 for the spiral pattern, in full agreement with published determinations
using the same method or alternative ones.
Subject headings: galaxies: individual NGC 4321 — galaxies: kinematics and dynamics —
galaxies: bar and spiral — methods: numerical — galaxies: fundamental parameters (masses)
— techniques: interferometric
1. Introduction
The presence of a barred structure appears to be a common attribute of disk galaxies. Roughly 30% of
spiral galaxies are strongly barred in the optical (de Vaucouleurs 1963) while another 25% are weakly barred.
Evidences that bars in spirals are more obvious in the near-infrared (NIR) than in the visible go back to
Hackwell & Schweizer (1983). More recent surveys in the NIR have shown that up to 75% of high surface
brightness galaxies may have a more or less strong bar (e.g. Knapen, Shlosman & Peletier 2000; Eskridge et
al. 2000). Strong bars are nearly twice as prevalent in the NIR than in the optical. The high frequency of
occurence of bars means that they are long-lived attributes of disk systems. While bars should be destroyed
rapidly, it is tought that continuous accretion produces multi-phase bars (Bournaud & Combes 2002) .
The fact that bars may contain a large mass fraction of the disk suggests that they are a fundamental
component of the mass distribution in spiral galaxies. Since their kinematics is different from the one of the
more or less axisymmetric disk, it is important to model them properly to derive, as accurately as possible,
the overall mass distribution. This is especially important since bars are in the inner parts of disk systems
which is the region where the free parameters of the mass models are best constrained (Blais-Ouellette et al.
1999, 2004; Blais-Ouellette, Amram & Carignan 2001). The parameters of mass models are not constrained
by the flat part but by the rising part of rotation curves (RC).
The determination of the bar pattern speed (Ωp) in spiral galaxies is one of the most important kine-
matical parameters since it drives a large part of their evolution (e.g. Block et al. 2004). It is essential for
understanding the so-called dark matter problem and, more generally, the structure of spiral galaxy halos.
A determination of the bar pattern speed and other non-axisymmetric and asymmetric structures is
important for a number of reasons:
• Orbital calculations show that a bar can only be built self-consistently if it lies entirely within its
corotation radius; the point at which the bar pattern rotates at the same speed as a star on a circular
orbit at that radius (Contopoulos 1980). Further studies using hydrodynamical simulations have shown
that the corotation radius has to lie in the interval of 1.2±0.2 length of the semi-major bar axis
(Athanassoula 1992a).
– 3 –
• Bars may initiate spiral density waves (e.g. Toomre 1969) and stellar rings (e.g. Buta 1986). A clear
determination of the corotation may give insight on the nature of density waves and on the energy and
angular momentum exchanges between the bar and the disk (Sellwood 1985; Masset & Tagger 1997).
• Stellar bars may provide a means to transport gas towards the nuclear regions of galaxies by inducing
gravitational torques (Block et al. 2002) and fuel nuclear starbursts or active galactic nuclei (e.g.
Kormendy 1982). The transfer of material (inflow or outflow) may be linked to the pattern speed
(Athanassoula 1992b).
• Bars may drive the secular evolution of bulges, by triggering nuclear starbursts and by kinematic
heating of the inner disk (e.g. Combes et al. 1990). The bar pattern speed depends critically on the
relative bulge mass and the disk scale-length (e.g. Combes & Elmegreen 1993).
• Bars’ pattern speeds may help to discriminate (Noguchi 2004) between spontaneous bars (large Ωp)
and tidal bars (small Ωp).
• Bars may introduce errors in determining the mass distribution of spiral galaxies from their rotation
curves. Indeed, non-circular motions are usually azimuthally averaged and may have for consequence
to shallow the shape of the inner regions of the RCs (e.g. Swaters et al. 2003). These non-circular
motions must be modeled properly and taken out from the observed kinematics in order to retrieve
the true circular kinematics which trace the mass distribution.
• Strongly barred galaxies may have maximal (or nearly maximal) disks. The absence of slow bars
may require maximum disks, which transfer very little angular momentum to the low density halos
(Debattista & Sellwood 1998). Alternatively, the strongest bars and higher pattern speeds may be
found in sub-maximum disks where the amount of angular momentum exchanged by resonant particles
between the disk and the halo has been the largest (Athanassoula 2003). Bars are often associated
with rings (e.g., Buta 1995) and may require a maximal disk for stability (e.g. Quillen & Frogel 1997).
The TW method is described in Sect. 2, tests on numerical simulations are presented in Sect. 3, the
case of M100 is examined in Sect. 4 and the discussion and conclusions are given in Sect. 5 and 6.
2. Description of the Method
Bar pattern speeds of spirals are determined by identifying theoretically predicted resonances (Lindblad
resonances, corotation) with periodic motions of the stars and gas (extracted from the RC). The determina-
tion of bar pattern speeds relies on observational methods or, alternatively, on matching numerical models
(N-body + SPH codes, see next section) to the observed velocity fields. A number of reviews describing
these methods in detail can be found (e.g. Teuben 2002).
Two methods, somewhat indirect, are based on the identification of morphological features associated
with resonance radii (measuring the inner resonance 4:1, Elmegreen, Elmegreen & Montenegro 1992; or
alternatively, measuring the sign inversion of the radial streaming motions across corotation, Canzian 1993).
Theoretical evidences argue that the corotation radius lies just beyond the end of the bar (e.g. pioneer work
of Contopoulos 1980). Based on this result, many bar pattern speeds have been estimated (see a compilation
in Elmegreen et al. 1996).
A more direct model independent method, not relying on any particular theory of density waves, is due
to Tremaine & Weinberg (1984, hereafter TW). The pattern speed is determined from two observationally
– 4 –
accessible quantities: the luminosity-weighted mean velocities and the luminosity-weighted mean densities
throughout the disk of the galaxy. In the plane of the sky, X is the coordinate along the major axis of
the galaxy, Y along the minor axis and VLOS(X,Y) the line of sight velocity. < XY > is the luminosity-
weighted mean X-position integrated along a strip parallel to the X-axis at Y coordinate, < VLOS,Y > is the
luminosity-weighted mean velocity along the X-axis at Y coordinate. Thus,
Ωp sin i =
∫ ∞
−∞Σ(x, y, t)Vy(x, y, t) dx
∫ ∞
−∞Σ(x, y, t)x(y, t) dx
=< VLOS,Y >
< XY >,
where Ωp is the pattern speed and Σ is the surface density of the component.
The underlying assumption is therefore that the density is proportional to intensity. Therefore, a
corollary statement is that disks must be close to maximum in the inner parts for the method to work. The
TW method also requires a tracer population that satisfies the continuity equation (no significant creation
or destruction of matter over an orbit). It may be the case for the stellar population, even if, in reality,
the continuity equation is never strictly satisfied because of the continuous star formation. Nevertheless,
old stars may survive many passage through the pattern. As long as the star formation efficiency is low,
conversion of gas into stars (and vice versa through winds and supernovae) can be ignored
For these reasons, the TW method has preferentially been applied to early-type bars using starlight and
absorption-line kinematics from long-slit spectra: NGC936 (Kent 1987; Kent & Glaudell 1989; Merrifield &
Kuijken, 1995); NGC4596 (Gerssen, Kuijken & Merrifield 1999); NGC1023 (Debattista, Corsini & Aguerri
2002); NGC7079 (Debattista & Williams 2001); ESO 139-G009, IC874, NGC1308, NGC1440 and NGC3412
(Aguerri, Debattista & Corsini 2003); NGC271, NGC1358, ESO 281-31, NGC3992 (Gerssen, Kuiken &
Merrifield 2003).
Application of the TW method to gaseous phases is complicated especially since the method assumes
that the disk component obeys the continuity equation and that the relation between the emission and its
surface density is linear (or can be modeled). Atomic hydrogen and molecular gas will not obey the continuity
equation, because of the conversion of gas between the three phases (molecular, atomic and ionized) and
because the star formation timescales are shorter than the orbital timescales. However, Zimmer, Rand, &
McGraw (2004) and Rand & Wallin (2004) have argued that, in galaxies in which either the H I or H2
everywhere dominates the large majority of the ISM, the conversion processes can be neglected and the TW
method applied.
Pattern speeds using the TW method were recently derived using H I for M 81 by Westpfahl (1998)
and for NGC 2915 by Bureau et al (1999). Using CO observations, pattern speeds were also determined in
galaxies with molecule-dominated ISMs for M51, M83, and N6946 by Zimmer, Rand, & McGraw (2004) and
for NGC1068, NGC3627, NGC4321 (M100), NGC4414, NGC4736 and NGC4826 (from the BIMA SONG
survey) by Rand & Wallin (2004).
Gas in its ionized phase will never dominate the ISM; the equation of continuity for the ionized gas
will never be satisfied on an orbital period and the Hα luminosity is not supposed to trace the mass. HII
regions are bright ionized regions surrounding massive and hot newborn O and B stars. The OB stars have
main-sequence lifetime of only a few 106 years, HII regions are furthermore short-lived gas clouds (which only
exist during the lifetime of their ionizing OB stars) embedded in a star-forming region in a molecular cloud.
A given HII region, associated to its parent stars, cannot survive to a typical galactic rotation of 108 years.
Nevertheless, HII regions and OB stars have not enough time to wander far from their parent molecular cloud
and are, if we neglect the expansion processes, a tracer of the molecular gas density. Moreover, < VLOS,Y >
– 5 –
determined from Hα, is an as good tracer as any of the galactic potential well (as it is the case when deriving
a RC).
It is true to say that the application of the TW method to Hα may apparently violate several of the TW
conditions. However, we suppose that, to first order, the continuity equation is satisfied, but only for very
short times (≪ orbital period), we neglect the internal kinematics of HII regions and we suppose that the
luminosity-weighted mean X-position integrated along a strip parallel to the X-axis, < XY >, is a valuable
indicator of the mean mass distribution.
Preliminary results on the determination of bar pattern speeds using HII regions were already presented
for NGC2903, NGC3359, NGC4321 (M100), NGC5194 and NGC6946 (Hernandez et al. 2004).
3. Tests on Numerical Simulations
The TW method will be applied to simulated barred galaxies in order to demonstrate its validity and
to understand its sensitivity to various observational parameters.
3.1. Description of the simulations
3.1.1. The codes
This section will describe the techniques used to perform self-consistent simulations including stars, gas
and star formation. In order to check for model and/or code dependent results, two significantly different
numerical schemes were applied for the computation of the forces.
A particle–mesh N-body code was used which includes stars, gas and recipes to simulate star formation
(SF). The broad outlines of the code are the following: the gravitational forces are computed with a particle–
mesh method using a 3D polar grid with (NR, Nφ, NZ) = (31, 32, 64) active cells (Pfenniger & Friedly 1993),
the hydrodynamical equations are solved using the SPH technique (Benz 1990) and the star formation
process is based on Toomre’s criterion for the radial instability of gaseous discs (see Friedli & Benz 1995,
Michel-Dansac & Wozniak 2004 for more details). When star formation is active, the radiative cooling of
the gas has been computed assuming solar metallicity.
When an extended live dark matter component was added, our computations were performed with
GADGET, a tree-based N-body+SPH code developed by Springel, Yoshida & White (2001). An adaptative
time step was used, based on the dynamical time and limited by the Courant condition (Springel, Yoshida
& White 2001).
3.1.2. Initial conditions
For all the simulations, an initial stellar population is setup to reproduce a disc galaxy with an already
formed bulge. These particles form the ‘old population’ as opposed to particles created during the evolution
(‘new population’) for simulations with star formation switched on.
For all runs, the initial positions and velocities of the stellar particles are drawn from a superposition of
two axisymmetric Miyamoto-Nagai discs (Miyamoto & Nagai 1975) of mass respectively 1010 and 1011M⊙ ,
– 6 –
of scale lengths respectively 1 and 3.5 kpc and common scale height of 0.5 kpc. Velocity dispersion are
computed solving numerically the Jeans equations. Runs numbered “2” have 5 times more particles than
those numbered “1” (cf. Table 1) For runs with a dissipative component (SG1 SF1, SF2, Ha and Hb), the
gas is represented by 50 000 particles for a total mass of 1010M⊙ distributed in a disc of scale length 3 kpc.
For Run SG1 the gas is kept isothermal while, when the star formation is switched on, a cooling function is
assumed for a solar metallicity and the energy conservation equation is solved at each step (Michel-Dansac
& Wozniak 2004).
For the sake of comparison, we have also computed pure N-body models (Run S1, S2), i.e. without gas
and star formation. The total mass is the same mass than the total initial mass of the visible components
of runs SF1, SF2, Ha and Hb. Of course, because of star formation, the stellar mass increases for runs SF1
and SF2 while it remains constant for all other runs. These runs tell us what should be the evolution of the
stellar mass and kinematical properties in the absence of any dissipative component.
Apart from the number of stellar particles (1.1 ×10⁶ particles), the setup of the stellar and gas distribu-
tions of runs Ha and Hb are similar to the other runs. Run Ha and Hb include an additional dark halo made
of 2.2 ×10⁶ live particles distributed in a Plummer sphere of scalelength 50 kpc and of mass respectively
2.42 and 6.46 ×10¹¹M⊙ . As our intention is to check the robustness of our results against the presence of
the massive dark halo, a Plummer sphere is a simple but sufficient description of the halo. The setup of
velocities and velocity dispersions is made consistent with the dark matter distribution.
3.1.3. Typical evolution of the models
For all runs without star formation, the initial disc quickly develops a typical strong bar and a spiral
structure both in the stellar and the gaseous components. The gravity torques due to the bar and the spiral
structure drive the gas inwards and the angular momentum outwards. The mass distribution is reorganized
even for the old stellar population; this gas inflow occurs on a rather short timescale. The bar can be
unambiguously determined (in size and position-angle) after 300 Myr. For runs with star formation, the
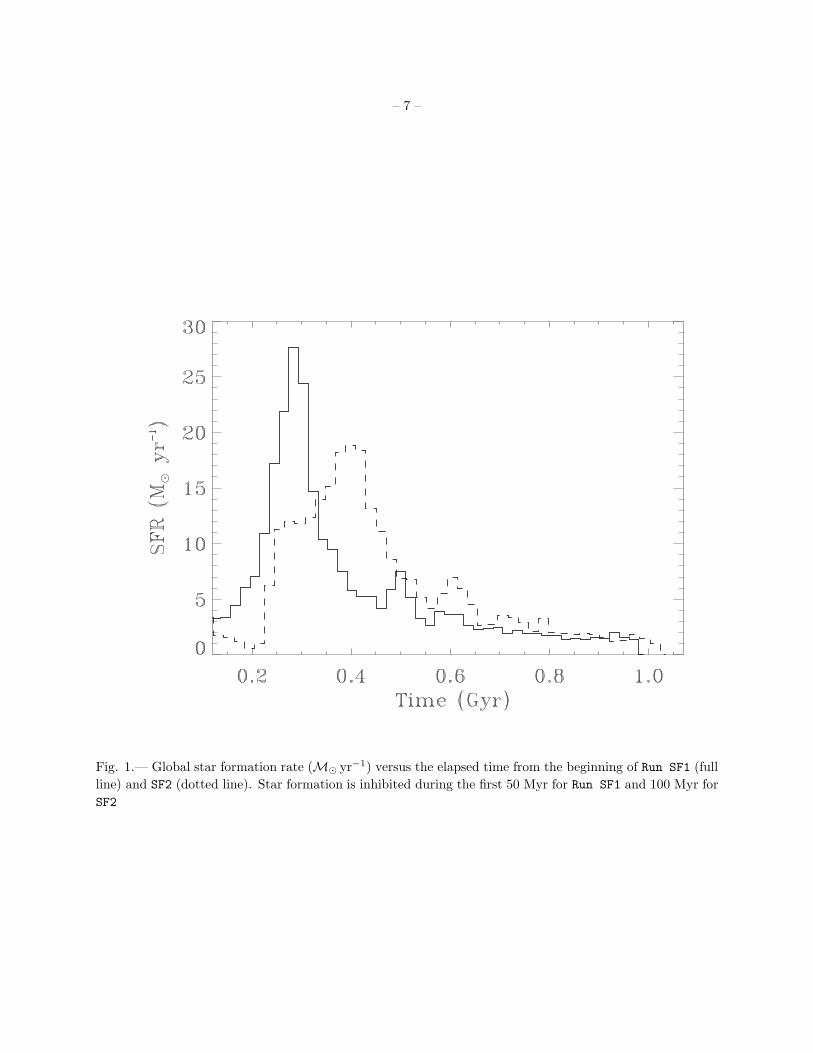
global Star Formation Rate (SFR) is displayed in Figure 1. For Run SF1 three SFR maxima occur around
0.3, 0.5 and 0.6 Gyr. For Run SF2, star formation is inhibited during the first 0.1 Gyr in order to delay the
SFR peak. Thus two main SFR peaks occur at t ∼ 0.4 and ∼ 0.6 Gyr. The SFR reaches 19–28 M⊙ yr−1.
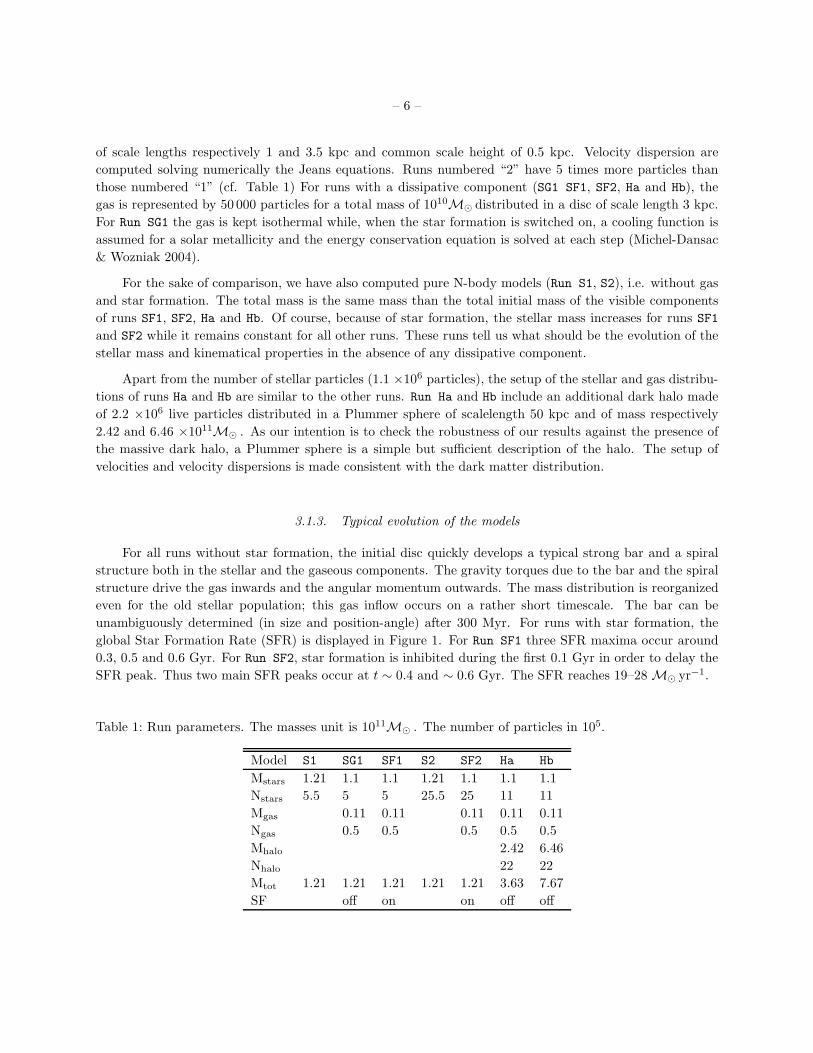
Table 1: Run parameters. The masses unit is 1011M⊙ . The number of particles in 105.
Model S1 SG1 SF1 S2 SF2 Ha Hb
Mstars 1.21 1.1 1.1 1.21 1.1 1.1 1.1
Nstars 5.5 5 5 25.5 25 11 11
Mgas 0.11 0.11 0.11 0.11 0.11
Ngas 0.5 0.5 0.5 0.5 0.5
Mhalo 2.42 6.46
Nhalo 22 22
Mtot 1.21 1.21 1.21 1.21 1.21 3.63 7.67
SF off on on off off
– 7 –
Fig. 1.— Global star formation rate (M⊙ yr−1) versus the elapsed time from the beginning of Run SF1 (full
line) and SF2 (dotted line). Star formation is inhibited during the first 50 Myr for Run SF1 and 100 Myr for
SF2
– 8 –
For t . 300 Myr, the bar and a bi-symmetric spiral structure spontaneously form as for the runs without
star formation. The gravitational torques on the gas by the bar and the spiral arms create several regions of
very high gas density in which star formation is ignited. As shown in previous works, during the first Myrs
the SF is not homogeneously distributed over the whole disc but is mainly concentrated along the bar major
axis and along the spiral arms. After ∼ 1 Gyr a nuclear gas disk is formed from the accumulation of gas in
the centre and new stars are actively formed only in this region. The secondary SFR peaks are the result
of the gas inflow towards the central regions of the disc. Indeed, such inflow is not stationary, but rather
proceeds by burst.
Runs Ha and Hb are stabilized by a live massive dark matter halo. The formation of the bar is slightly
delayed by 0.1 Gyr for Run Ha but after 1 Gyr this run looks like Run SG1. For Run Hb the bar appears after
≈ 1.5 Gyr. Both runs develop a bar and a spiral structure. Run Hb develops an additional inner ring inside
the corotation, which is typical of the interaction of disc particles with the halo ones (cf. Athanassoula &
Misiriotis 2002).
3.2. Application of the TW method
The TW method was applied in an automated way since we are dealing with numerical simulations.
Particle positions and velocities have been projected to an inclination of 45 . Particles have also been
rotated so that the projected position-angle of the bar with respect to the line of nodes (PAbar) lies between
30 and 50 . These are optimal values for a best estimate of Ωp (Merrifield & Kuijken 1995). For each
component (stellar or gas particles), two (X,Y) frames are computed, one for the mass integrated along the
LOS, another for VLOS . The field-of-view is limited to the projected bar length (between 2 and 5 kpc). The
spatial resolution is 200 pc. The process is repeated for each available snapshots from t = 0 to t = 1 Gyr
(2 Gyr in the case of Run Hb).
The mass-weighted line-of-sight velocity < VLOS,Y > and the mass-weighted position coordinate, <
XY > are computed for each values of Y . Each Y position thus acts as a long slit. A linear fit between
< VLOS,Y > and < XY > is made using a robust least square algorithm. Since, we exactly know the line-of-
nodes position-angle and the inclination angle, the slope determination of the < VLOS,Y > versus < XY >
relationship is the only source of errors on Ωp. Finally we obtain two estimates of Ωp, one using the stellar
component Ωsp, another with the gas component Ωg
p.
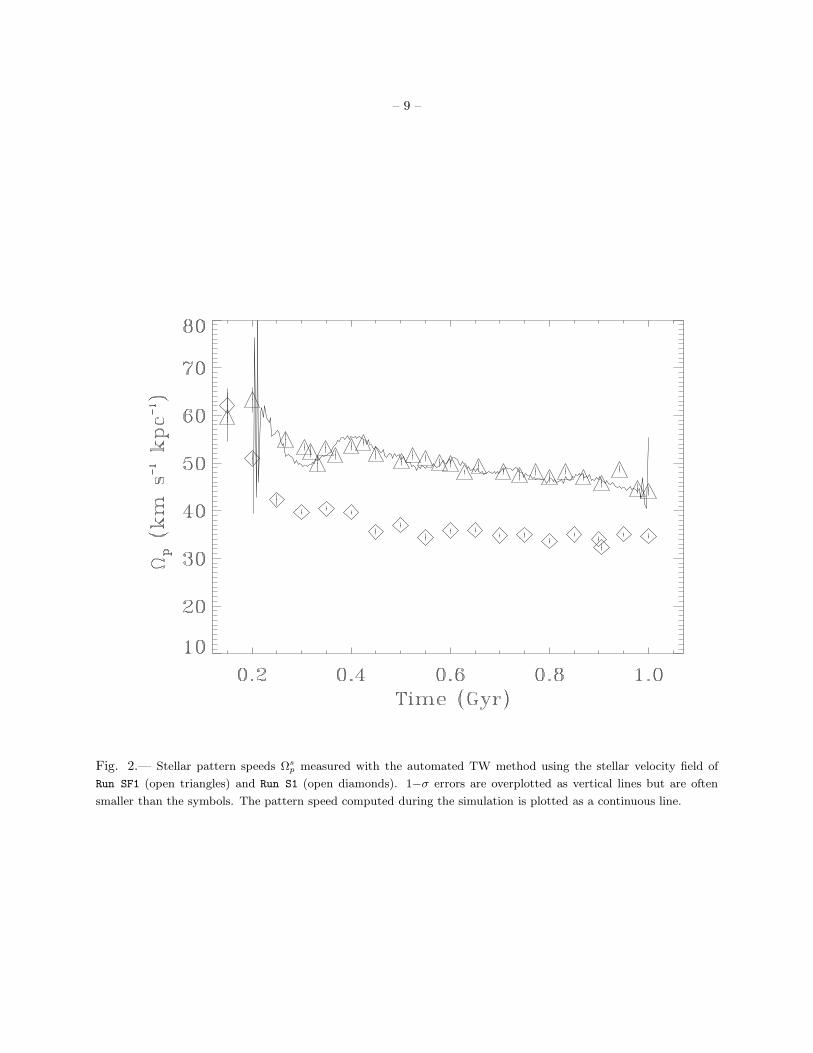
First, we have tested our method on the stellar velocity field of Run SF1 (cf. Fig. 2). The values of Ωsp
are very similar to those directly computed with the bar position-angles determined every Myr during the
computation of the simulations. Thus, we confirm that the TW method is a very efficient tool to determine
the bar pattern speed in numerical simulations.
In the case of Run S1, a pure N-body simulation without gas and star formation but with the same
total initial mass than Run SF1, the bar rotates slower than for Run SF1. This effect is obviously due to a
completely different evolution of mass transfers. Indeed, for Run SF1, the gas inflow towards the center is
quick enough to sustain the bar pattern speed at a high value when the bar appears (∼ 0.2 Gyr for Run SF1).
The new stellar population created during the gas inflow remains inside the corotation, increasing the stellar
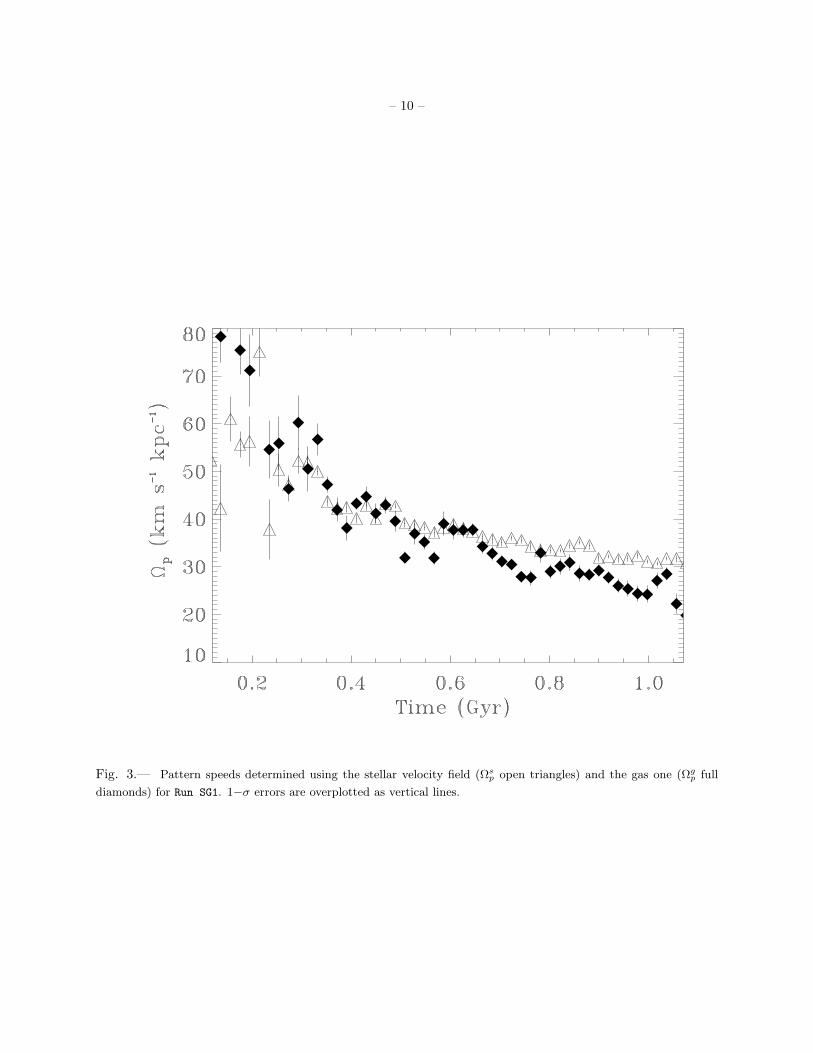
mass. As for the observations (cf. Sect. 4.3), the velocity field of the gaseous component was also used to
compute < VLOS,Y >. Fig. 3 shows the results obtained with Run SG1 . For this run, star formation was
switched off. Once the bar had settled in (t & 0.25 Gyr), and strong shocks had faded away, Ωsp and Ωg
p give
similar estimations of the pattern speed. Indeed, in absence of strong shocks, the gas velocity field is close
– 9 –
Fig. 2.— Stellar pattern speeds Ωs
p measured with the automated TW method using the stellar velocity field of
Run SF1 (open triangles) and Run S1 (open diamonds). 1−σ errors are overplotted as vertical lines but are often
smaller than the symbols. The pattern speed computed during the simulation is plotted as a continuous line.
– 10 –
Fig. 3.— Pattern speeds determined using the stellar velocity field (Ωs
p open triangles) and the gas one (Ωg
p full
diamonds) for Run SG1. 1−σ errors are overplotted as vertical lines.
– 11 –
to the stellar one, at least in the central region of the bar. Thus, on real data, it is mandatory to avoid to
include any region of strong shocks in the computation of < VLOS,Y >.
For t & 0.6 Gyr, Ωgp gives lower values than Ωs
p. This bias can be removed by a careful selection
of the regions where the LOS velocities and mass densities are measured. Indeed, a careful inspection of
the projected mass density and velocity fields shows that the gaseous bar could be sometimes significantly
shorter than the stellar one. Since the automated TW method inconveniently selects some regions outside
the gaseous bar, this leads to an underestimation of the bar pattern speed. Thus, the application of the TW
method to observational gas velocity fields needs a careful selection of slit, parallel to the major axis in the
< VLOS,Y >-< XY > fit. The idea of the method is not to mask parts of the galaxy but to remove points
from the < VLOS,Y >-< XY > fit using the curve < YX >-< XY > to break down to degeneracy of the
< VLOS,Y >-< XY > fit. In that way, parts of the galaxy are NEVER masked and we NEVER violate the
basic assumption of the method. In order to clearly select the regions of the galaxy used to apply the TW to
determine one pattern speed, one must select the correct slits along which the integral from minus infinity
to infinity (or at least from one border of the field to the other) will be done to respect the basic assumption
of the TW method.
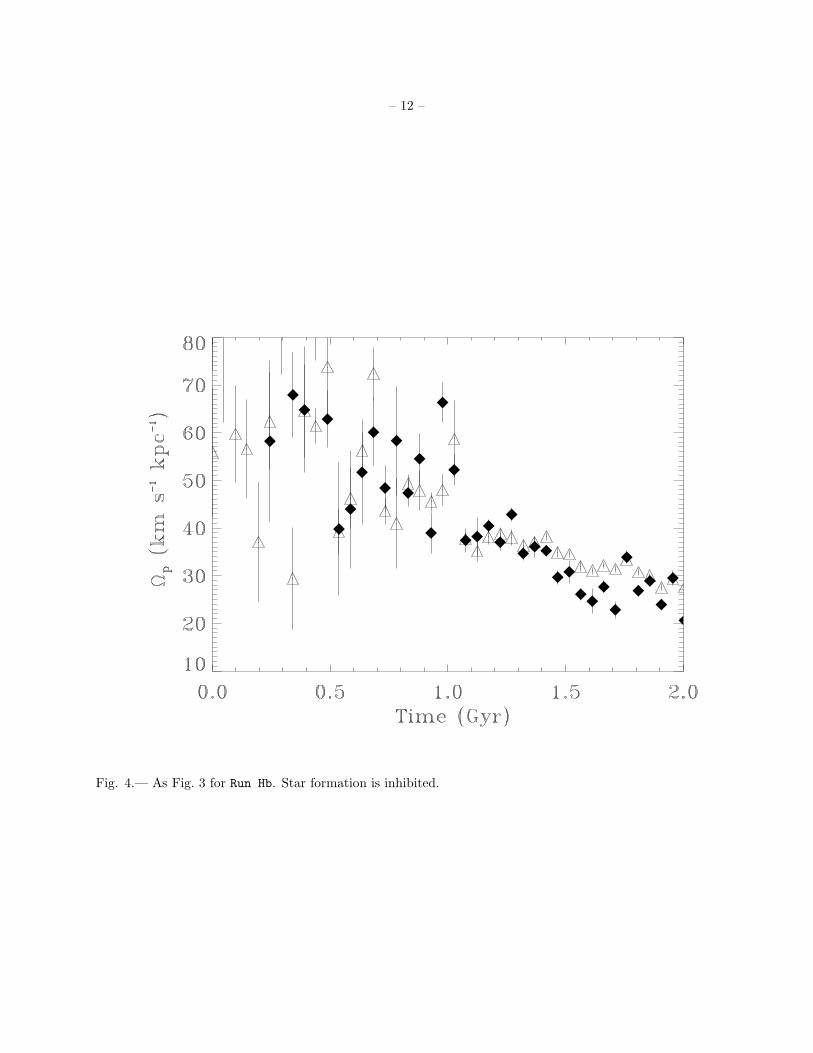
A living dark halo does not change significantly the results. As expected, the gravitational interaction
made by a low mass dark halo (Run Ha) does not change much the bar pattern speed. In the case of Run Hb
(Fig. 4), once the bar is formed, Ωgp can be a good estimator of Ωp on condition that the gaseous inner ring
is excluded from the measurements. Otherwise, Ωgp is biased towards lower values. When star formation is
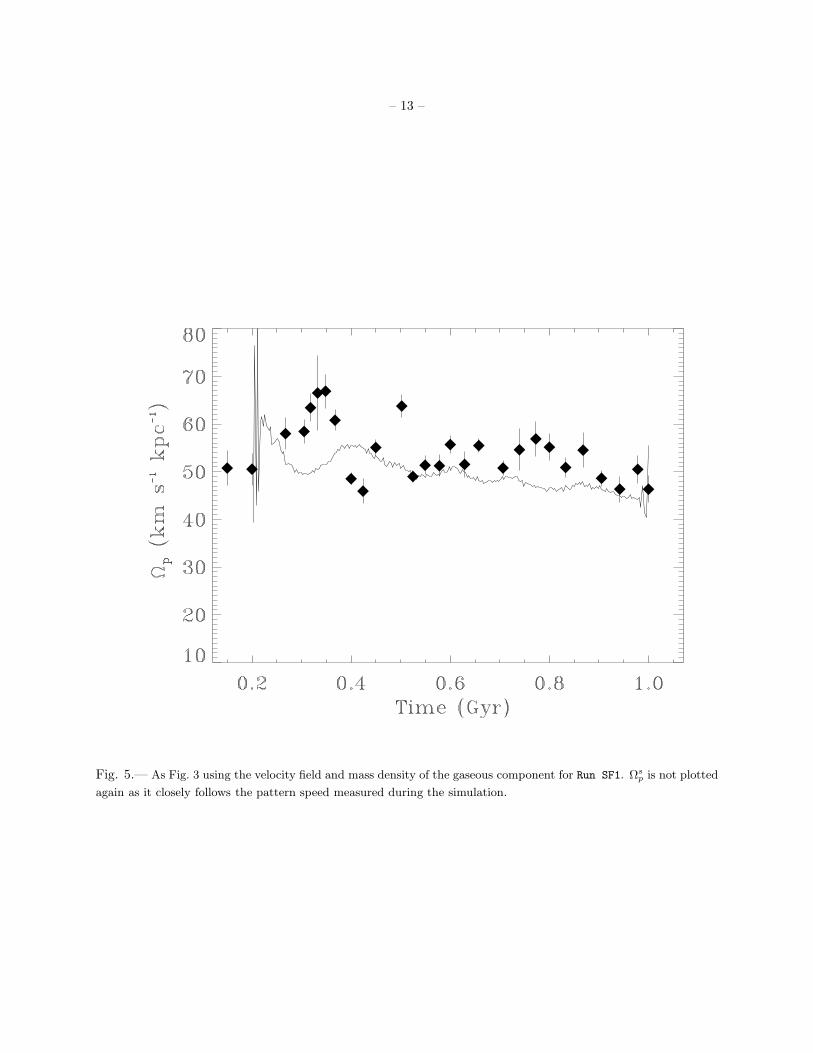
switched on, the TW method applied to the gaseous component is less accurate (Fig. 5). Indeed, Ωgp slightly
overestimates the real bar pattern speed, especially when the SFR is high (& 5 M⊙ yr−1). The reason for
this behaviour is indirectly linked to the star formation process. Indeed, the main source of errors is the
presence of strong and persistent gradient in the gaseous velocity fields. These regions of high density are
obviously the privileged sites of stellar formation. Since the mass distribution is completely different from
Run SG1 because of the new stellar population, shocks regularly occur, especially in the inner region of the
bar where the gas inflow is stopped. Finally, when most of the gas has been consumed by star formation
(i.e. t & 0.9 Gyr), its velocity field tends to be like the stellar one, leading to better estimates of Ω.
However, the discrepancies between Ωsp and Ωg
p remain within ±10 kms−1 kpc−1. Thus the TW method
could be applied to the gaseous velocity fields to get a rough estimated of the bar pattern speed, under the
condition that regions of shocks are avoided (slits passing through those regions are not taken into account
in the final < VLOS,Y >-< XY > fit) and measurements are confined to regions where the gaseous bar is well
formed. All our results have been checked with Run S2, the same simulation than Run SF1 but with 5 times
more particles. The SFR history is different (cf. Fig. 2) from Run SF1 but we reach the same conclusions.
We have also applied the same method as the one used with real data (cf. Sect. 4.3). Such method uses an
adaptive spatial smoothing algorithm based on the Voronoi tesselation to produce maps of mass and velocity
fields. We do not show the results here since they are very similar to the automated TW method.
4. The Case of M100 (NGC 4321)
4.1. General description of M100
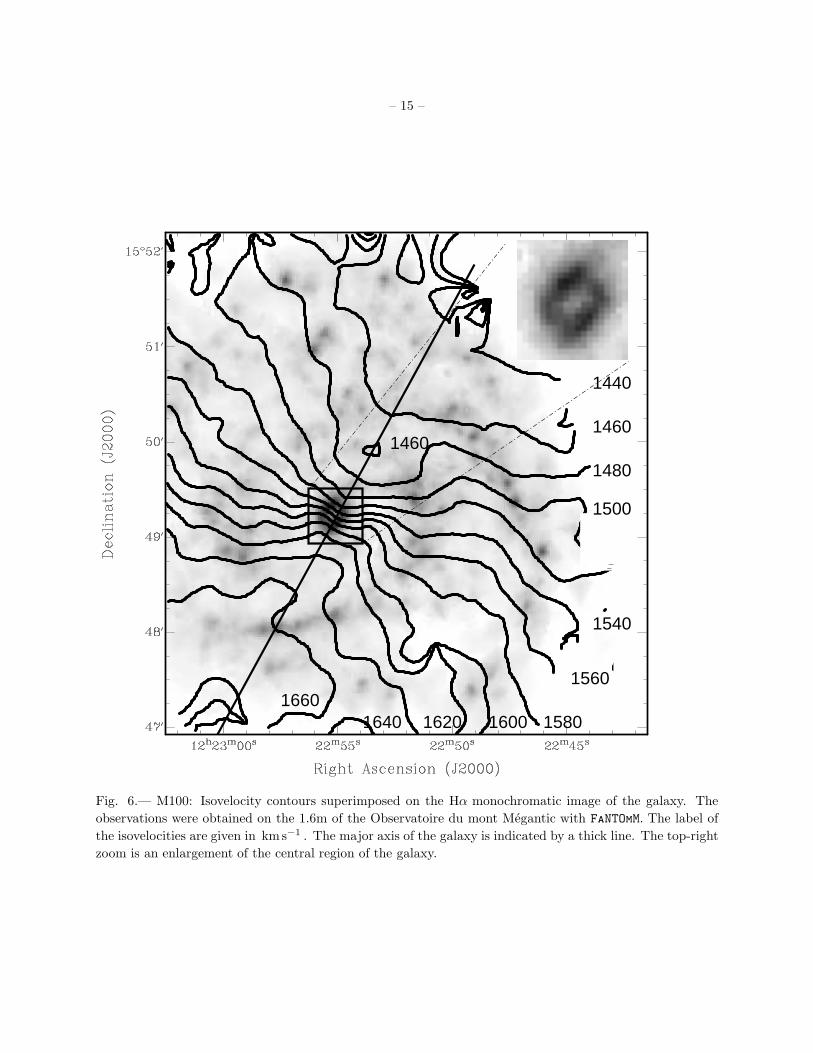
M100 (NGC 4321, VCC 596) is one of the most studied object among the nearby barred spirals. The main
parameters of M100 can be found in Table 2 and its Hα velocity field is shown in Figure 6, superimposed on
the Hα monochromatic image. This grand-design SAB(s)bc galaxy lies in the Virgo galaxy cluster, projected
– 12 –
Fig. 4.— As Fig. 3 for Run Hb. Star formation is inhibited.
– 13 –
Fig. 5.— As Fig. 3 using the velocity field and mass density of the gaseous component for Run SF1. Ωs
p is not plotted
again as it closely follows the pattern speed measured during the simulation.
– 14 –
at ∼ 1.1 Mpc from M87 in the cluster core and has two apparent dwarf companions, VCC 608 and VCC 634,
which are only at 24 and 28 kpc respectively (in projection) from its nucleus. M100 shows a small bulge,
two prominent symmetric spiral arms lying within a more complex spiral structure and two diffuse stellar
extensions to the North and South. The northern extension appears to end close to VCC 608. Classical dust
lanes are observed throughout the whole disk along the spiral arms and the leading sides of the weak bar.
The galaxy has been frequently mapped in the Hα emission-line using high-resolution Fabry-Perot in-
terferometry (Arsenault, Roy & Boulesteix 1990; Cepa & Beckman 1990; Knapen et al. 1995; Canzian &
Allen 1997; Knapen et al. 2000), in the molecular CO emission-line (Canzian 1990, Sakamoto et al. 1995,
Rand 1995, Garcia-Burillo et al. 1998, Helfer et al. 2003) and in the 21-cm HI emission-line (Cayatte et al.
1990, Knapen et al. 1993). The HI disk is almost totally confined within the optical one but with a slight
lopsideness towards the SW (Knapen et al. 1993). This asymmetry could be either due to ram pressure
stripping by the Virgo intra-cluster medium or to a tidal perturbation from a companion. The H I , CO
and Hα velocity fields show kinematic disturbances such as streaming motions along the spiral arms and a
central S-shape distortion of the iso-velocity contours along the bar axis.
The circumnuclear region (CNR) of M100 has particularly received a great deal of attention in multi-
wavelength observations because of the presence of an enhanced star formation region as a four-armed
Hα ring-like structure and a CO spiral-like structure (e.g. Sakamoto et al. 1995; Knapen et al. 2000).
Both the ionized and molecular gas components extend up to R ∼ 20′′ and show a central peak of emission
centered on the galactic nucleus. However, the location of gas intensity maxima in the Hα ring and in the CO
nuclear spiral arms do not coincide with the Hα peaks located more inward than those of the CO emission.
A lower limit to the CNR total molecular mass is ∼ 2×10⁹ M⊙ , as inferred from the CO integrated intensity
(Sakamoto et al. 1995). The kinematics of the Hα nuclear ring shows non-circular motions and the Hα RC
steeply rises in the innermost 2′′ (160 pc), reaching a velocity of 150 km s−1 (Knapen et al. 2000).
The origin of the CNR SF-region is supposed to be due to gas accumulation in the vicinity of the
inner Lindblad resonances of the disk with density waves induced by the bar potential (Knapen et al. 1995;
Sakamoto et al. 1995; Sempere et al. 1995). Hence, the determination of the pattern speed Ωp of the
large-scale bar of M100 (or reciprocally of the corotation radius) has become a crucial imperative in order
to understand the role of resonances in the evolution of the galaxy. A value of Ωp within the range ∼ 20-40
km s−1 kpc−1 has thus emerged from several observational methods and theoretical models (see Table 5).
The presence or absence of a secondary bar in the nuclear region remains an open question. On one
hand, some numerical simulations need two nested bars rotating at significantly different pattern-speeds to
explain the CNR gaseous morphology (Garcia-Burillo et al. 1998). In this framework, the secondary nuclear
bar rotates about seven times faster than the large-scale primary bar, having its corotation region near the
inner Lindblad resonances of the primary bar. However, other simulations require a nuclear bar that would
rotate only three times faster than the large scale one (Wada, Sakamoto & Minezaki 1998). On the other
hand, Knapen et al. (2000) claimed that only a single R ∼ 60′′ large-scale bar is observed in M100 by
means of numerical models and isophotal analysis of NIR images which show an almost perfect alignment
of the isophotes in the innermost and external parts of the bar. Their simulations predict that the nuclear
structure, which was formed from a single-barred potential, corotates with the bar. Hence, the use of the
TW method should in principle help to resolve this question.
– 15 –
1460
1440
1460
1480
1520
1540
1560
1600162016401660
1580
1500
Fig. 6.— M100: Isovelocity contours superimposed on the Hα monochromatic image of the galaxy. The
observations were obtained on the 1.6m of the Observatoire du mont Megantic with FaNTOmM. The label of
the isovelocities are given in kms−1 . The major axis of the galaxy is indicated by a thick line. The top-right
zoom is an enlargement of the central region of the galaxy.
– 16 –
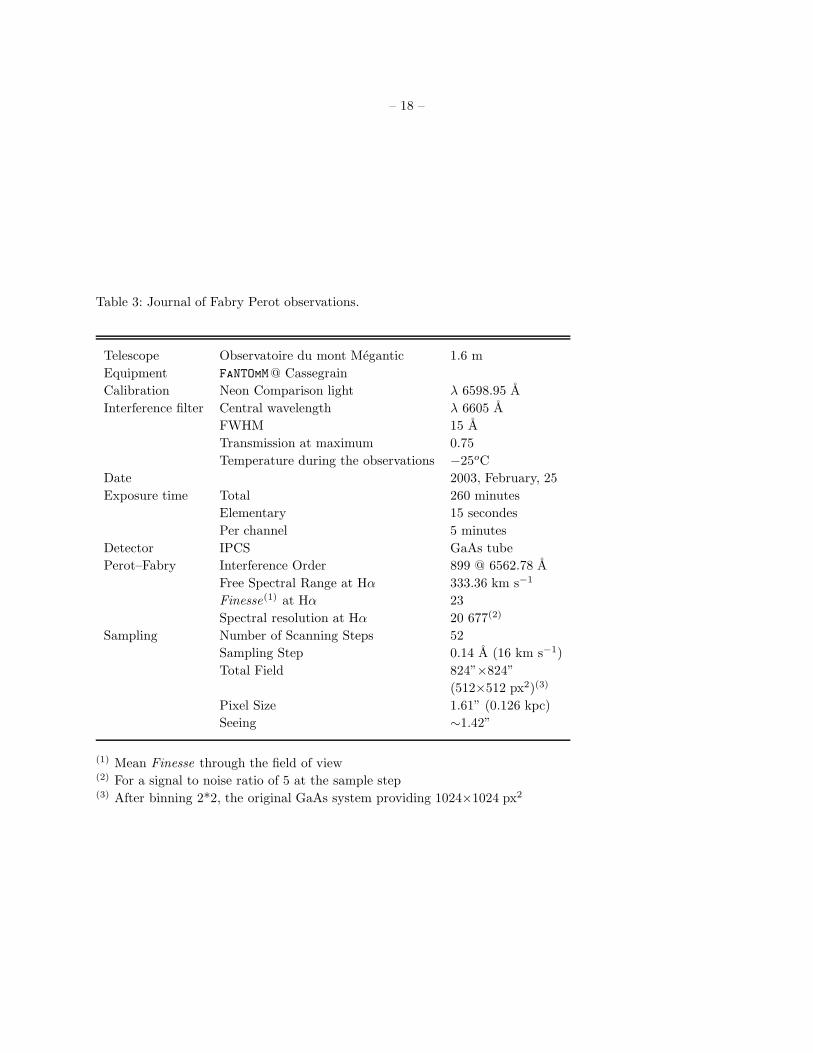
4.2. New Fabry-Perot Observations.
New observations of M100 were obtained in February 2003 with the Fabry Perot instrument FaNTOmM1
(Hernandez et al. 2003) on the mont Megantic Observatory (OMM) 1.6m telescope in the frame of a new large
observational program of barred galaxies (BHαBAR sample: Hernandez, et al. 2005). FaNTOmM is composed of
a focal reducer (bringing the original f/8 focal ratio of the Cassegrain focus to f/2), a scanning Fabry-Perot
and an Image Photon Counting System (IPCS) based on a new technology GaAs amplifier tube which has
a high quantum efficiency (Gach et al. 2002). The journal of the observations and the observational set up
is given in Table 3.
The reduction of the data cubes was performed using the package ADHOCw (Boulesteix, 2004) rewritten
with large improvements under the IDL package. The signal measured along the scanning sequence was
separated into two parts: (1) an almost constant level produced by the continuum light in a narrow passband
around Hα (image not shown) and (2) a varying part produced by the Hα line (referred hereafter as the
monochromatic map).
In order to increase the signal-to-noise ratio, an adaptive spatial smoothing based on the Voronoi
tesselations method (Daigle et al. 2005b, Cappellari & Copin 2002) and applied to the 3D data cubes
(Daigle et al. 2005b) was used to produce the monochromatic images and the velocity fields. The strong OH
night sky lines passing through the filter were reconstructed into a cube and subtracted from the galaxy’s
spectrum. The wavelength calibration was obtained by scanning the narrow Ne 6599 A line under the same
conditions as the observations. The velocities measured relative to the systemic velocity are very accurate,
with an error of a fraction of a channel width (< 3 km s−1) over the whole field. Details on the observations
and on the data reduction will be given in forthcoming papers (Hernandez et al. 2005; Daigle et al. 2005b).
The position angle (PA), inclination, systemic velocity and rotation center (Xcen, Ycen) have been
calculated using ROTCUR provided by the Gipsy package and Karma to construct the Position-Velocity
plot (Hernandez et al. 2005). The fit was performed using a robust χ2 model and the central regions of
the velocity field were masked to avoid contamination due to the bar. Debattista (2003) has shown that
the TW measurements of bar pattern speeds are sensitive to errors in the PA of the disc. 2D velocity fields
of extended galaxies allow an accurate determination of the PA, reducing the errors when using the TW
method.
4.3. Results.
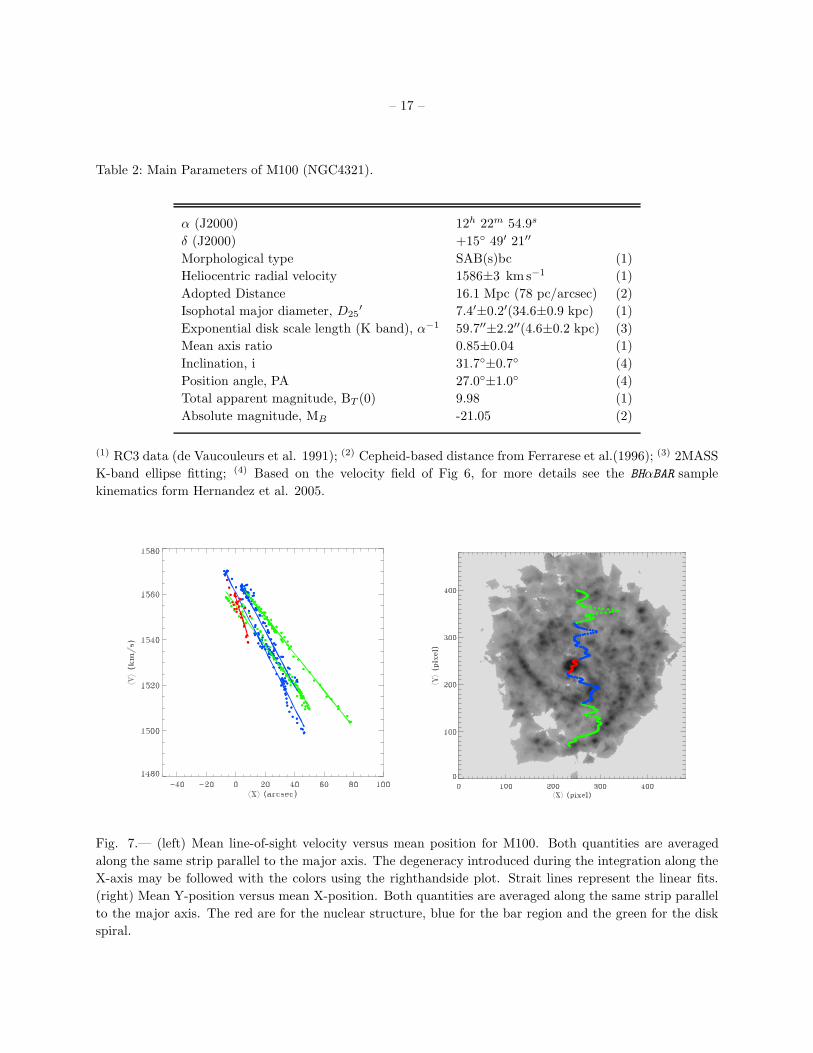
In Figure 7 (left), the intensity-weighted line-of-sight velocity < VLOS,Y > is plotted versus the intensity-
weighted position coordinate, < XY >. The Hα velocity field and the Hα monochromatic image have been
used to measure < VLOS,Y > and < XY >. The degeneracy introduced during the calculation of < XY >
(integration along the X-axis) may be followed on Figure 7 (right) which gives the position of < XY >. For
instance, the red dots in the center of the galaxy correspond to < YX > located near the nuclear structure.
The blue ones stresses the bar region, and the green ones the disk structure.
Corsini, Debattista & Aguerri (2003) and Rand & Wallin (2004) show that the TW method can be
used to determine multiple Ωp . If more than one pattern is present for a given aperture (as in e.g., the
1FaNTOmM (for Fabry-Perot de Nouvelle Technologie pour l’Observatoire du mont Megantic) was developed by the Labora-
toire d’Astrophysique Experimentale (LAE, Montreal), http://www.astro.umontreal.ca/fantomm
– 17 –
Table 2: Main Parameters of M100 (NGC4321).
α (J2000) 12h 22m 54.9s
δ (J2000) +15 49′ 21′′
Morphological type SAB(s)bc (1)
Heliocentric radial velocity 1586±3 km s−1 (1)
Adopted Distance 16.1 Mpc (78 pc/arcsec) (2)
Isophotal major diameter, D25′ 7.4′±0.2′(34.6±0.9 kpc) (1)
Exponential disk scale length (K band), α−1 59.7′′±2.2′′(4.6±0.2 kpc) (3)
Mean axis ratio 0.85±0.04 (1)
Inclination, i 31.7±0.7 (4)
Position angle, PA 27.0±1.0 (4)
Total apparent magnitude, BT (0) 9.98 (1)
Absolute magnitude, MB -21.05 (2)
(1) RC3 data (de Vaucouleurs et al. 1991); (2) Cepheid-based distance from Ferrarese et al.(1996); (3) 2MASS
K-band ellipse fitting; (4) Based on the velocity field of Fig 6, for more details see the BHαBAR sample
kinematics form Hernandez et al. 2005.
Fig. 7.— (left) Mean line-of-sight velocity versus mean position for M100. Both quantities are averaged
along the same strip parallel to the major axis. The degeneracy introduced during the integration along the
X-axis may be followed with the colors using the righthandside plot. Strait lines represent the linear fits.
(right) Mean Y-position versus mean X-position. Both quantities are averaged along the same strip parallel
to the major axis. The red are for the nuclear structure, blue for the bar region and the green for the disk
spiral.
– 18 –
Table 3: Journal of Fabry Perot observations.
Telescope Observatoire du mont Megantic 1.6 m
Equipment FaNTOmM@ Cassegrain
Calibration Neon Comparison light λ 6598.95 A
Interference filter Central wavelength λ 6605 A
FWHM 15 A
Transmission at maximum 0.75
Temperature during the observations −25oC
Date 2003, February, 25
Exposure time Total 260 minutes
Elementary 15 secondes
Per channel 5 minutes
Detector IPCS GaAs tube
Perot–Fabry Interference Order 899 @ 6562.78 A
Free Spectral Range at Hα 333.36 km s−1
Finesse(1) at Hα 23
Spectral resolution at Hα 20 677(2)
Sampling Number of Scanning Steps 52
Sampling Step 0.14 A (16 km s−1)
Total Field 824”×824”
(512×512 px2)(3)
Pixel Size 1.61” (0.126 kpc)
Seeing ∼1.42”
(1) Mean Finesse through the field of view(2) For a signal to noise ratio of 5 at the sample step(3) After binning 2*2, the original GaAs system providing 1024×1024 px2
– 19 –
bar-within-bar models of Friedli & Martinet 1993), Ωp will have contributions from the various patterns.
Both < XY >,< YX > and < VLOS,Y >-< XY > plots are used to select the appropriate slits with regard
to the galaxy region to clearly identify the pattern of the selected wave. A robust fit is then done on each
series of points to calculate the pattern speed of each waves. In the case of M100, Figure 7 (left) shows
the distribution of points when the TW is used over the galaxy with slits parallel to the major axis and
from +/- infinity (i.e. in the limits of the field of view) while Figure 7 (right) shows the < XY >,< YX >
plot superimposed with the Hα image to help us disentangle clearly the different pattern speeds. Using the
assumptions of section 3.2 to select the correct slit to calculate the appropriate pattern speed, a robust χ2
linear fit is then performed on the three series of points (blue, green, red).
Ωp of the bar is found to be 30.3±1.8 km s−1 kpc−1. The distance has been chosen such that we can
compare with Ωp from other sources. The error calculation takes into account the error on the inclination,
on the mean line of sight velocity, on the mean position along the line of nodes and on the PA. The errors
are computed from the tilted ring models. Table 5 presents the results of the TW method applied to M100.
All the pattern speeds are scaled to our inclination of 31.7 and distance of 16.1 Mpc.
5. Discussion.
5.1. Multiple Pattern Speeds.
The pattern speed of the spiral arms may differ from that of the bar (e.g. Sellwood & Sparke 1988;
Sellwood 1993; Rautiainen & Salo 1999). Different scenarii may explain the connection between bar and
spiral arms: (a) corotating bar and spiral arms; (b) independent bar and spiral arms possessing different
pattern speeds connected by non-linear mode coupling.
(a) In some cases, the bar and the spiral structure are clearly corotating: (i) the spiral arms start from
the ends of the bar (e.g. NGC 1365); (ii) the fraction of grand design spirals is higher in early type barred
galaxies as compared to non-barred ones (this may be the case also for late type barred galaxies, e.g. NGC
157); (iii) the size of the two armed spiral in galaxies correlates with the size of the bar (e.g. Elmegreen &
Elmegreen 1989, 1995); (iv) the response to an analytic bar potential is a bar driven spiral (e.g. Sanders &
Huntley 1976); (v) the outer rings usually correspond to the outer Lindblad resonance in barred galaxies (e.g.
Buta 1995). Considering this scenario (a), it is hard to explain (i) multi-armed barred galaxies (e.g. ESO
566-24); (ii) spiral arms which do not start from the ends of the bar; (iii) flocculent barred galaxies (Buta
1995); (iv) the absence of rings in many barred galaxies (Sellwood & Wilkinson 1993). These observations
may be explained if bars and spiral arms are either independent features or non-linearly coupled as it could
be the case for instance in galaxies like NGC 1068, NGC 1398, NGC 1566, NGC 2273.
(b) Bars and spiral arms may be independent features and have different pattern speeds (e.g. simulations
by Sellwood 1985; Sellwood & Sparke 1988). Bar and spiral have different pattern speeds connected by a
non-linear mode coupling (Tagger et al. 1987; Masset & Tagger 1997; Rautiainen & Salo 1999). In this
scenario, the corotation of the bar and the inner Lindblad resonance of the spiral overlap in radius, which
results in a transfer of energy and angular momentum between the modes. Several simultaneous spiral modes
can also coexist in the disk, even overlapping in radius. These galaxies have inner spiral (corotating with the
bar) and outer spiral with a separate and lower pattern speed (Rautiainen & Salo 1999). On the other hand,
mode coupling may be stronger when the halo contribution to the rotation curve is large (e.g. Debattista &
Sellwood 1998; Rautiainen & Salo 1999). Gnedin, Goodman & Frei (1995) have shown that a gravitational
angular-momentum flux, or torque, can be measured directly from the mass distribution in spirals. These
– 20 –
authors have carried out this measurement for M100 and concluded that the spiral structure seen in M100
may not be typical of its past or its future. These torques depend not on the pattern speed or permanence
of the arms but only on the non-axisymmetric mass distribution.
In addition to the main bar component, many nuclear bars have been observed (e.g. Buta & Crocker
1993; Wozniak et al. 1995; Friedli et al. 1996). At least some of these small scale bars have higher pattern
speeds than the main bar (Friedli & Martinet 1993) and inner bar formed before the main bar (Rautiainen
& Salo 1999). In the case of M100, the nuclear bar has a fast pattern (Ωp =160 km s−1 kpc−1; Garcia-
Burillo et al. 1998) and is decoupled from the slow pattern of the outer bar+spiral (Ωp=23 km s−1 kpc−1;
Garcia-Burillo et al., 1998). Solutions based on a single pattern hypothesis for the whole disk cannot fit
the observed molecular gas response and fail to account for the relation between other stellar and gaseous
tracers (Garcia-Burillo et al. 1998).
From deep surface photometry in the K band obtained for 54 normal spiral galaxies, Grosbøl, Patsis &
Pompei (2004) found in several cases that bars are significantly offseted compared to the starting points of
the main spiral pattern. This indicates that bar and spiral have different pattern speeds.
5.2. M100: Comparison with other studies.
The number of barred galaxies that have been observed to date using the TW method, mainly SB0
galaxies, is too small to ascertain unequivocally whether centrally concentrated dark matter haloes are truly
absent in barred galaxies.
• In the stellar dynamical theory, the spiral arm amplitudes oscillate because of differential crowding
near and between wave-orbit resonances. Three cycles of such oscillations have been found in B and
I-band by Elmegreen & Elmegreen (1989). Using R25 = D25/2 =3′.42 (de Vaucouleur et al. 1976),
these authors supposed that the inner gap located at 0.35 × R25 is the ”+4 : 1” resonance. Thus,
power law extrapolation of the RC of M100 (extracted from Rubin et al. 1980, where V (R) = rα with
α = 0.1 for Rubin et al. instead of α = 0.35, for this present study) locates the corotation at 0.6×R25,
the OLR at 1.1×R25 and the ILR at 0.13×R25. With a corotation at 0.6×R25, the pattern speed is
21 km s−1 kpc−1 (scaled to the same distance of 16.1 Mpc).
• The corotation resonance has been found within the range 101-128 arcsec (see Table 4) from the
Hα kinematics of the gas (Canzian et al. 1993).
• Garcia-Burillo et al. (1994) discussed two different methods to measure the pattern speeds. Firstly,
using CO observations, they were seeking for the detection of the change of sign of the radial streaming
motions, as predicted by the theory, when going beyond the corotation. They found no change of sign
in the radial streaming motions. Therefore, according to the observed kinematics, they inferred that
the whole inner spiral structure is located inside corotation. Secondly, they made numerical simulations
of the molecular cloud hydrodynamics and compared the gas response with the spiral structure seen in
the optical and CO observations. Their best fit solution lead to Ωp = 25km s−1 kpc−1 (scaled to our
distance and inclination), implying that corotation lies at a radius approximately equal to 110 arcsec.
This value, based on a global fit of the spiral using numerical simulations, gives a much more trusty
determination for the corotation but is in clear contradiction with the observational determination
quoted above that places corotation at the outer disk.
– 21 –
• Two different methods to derive the pattern speed have also been used by Sempere et al. (1995).
The first method, based on the change of sign of the radial streaming motions beyond the corotation
(Canzian 1993) lead to Ωp = 25kms−1 kpc−1, that locates corotation in the middle of the disc (8-11
kpc i.e. 82”-113”). The second method, involving hydrodynamic numerical simulations of the molecular
cloud in a potential derived from an R-band image of the galaxy lead to Ωp ≃ 25 km s−1 kpc−1. This
validates the picture where the stellar bar ends within the corotation and the outer spiral lies outside
the corotation.
• Rand (1995) estimates a value lower than 37 kms−1 kpc−1 by identifying the CR with the location
where no tangential streaming is observed when the CO arm crosses the major axis.
• Wada et al. (1998) compared CO observations by Sakamoto et al. (1995) with a two-dimensional hy-
drodynamical and analytical bar model. Their best model agrees well with Knapen et al. (2000) about
the double ILR, and with M100 having a single stellar bar with a pattern speed of 69 km s−1 kpc−1
(in excellent agreement with 70 km s−1 kpc−1 found in Knapen et al.).
• Garc-Burillo et al. (1998) claimed that two bars rotate at different angular speeds. The present study
indicates clearly that the inner structure has a different pattern speed from the bar but it can not
determinate precisely the pattern speed of the secondary bar.
• Knapen et al. (2000) studied the circumnuclear starburst region of M100 and concluded that both
morphology and kinematics require the presence of a double inner Lindblad resonance in order to
explain the observed twisting of the near-infrared isophotes and the gas velocity field. The results of
Knapen et al. (2000) are different from those of Garc-Burillo et al.(1998).
• Using this empirical relationship and deprojected bar, Sheth et al. (2002) measured a bar pattern
speed of 35 km s−1 kpc−1 on the CO rotation curve of M100 by Das et al. (2001).
• Rand & Wallin (2004) applied the TW method of pattern speed determination to CO emission (Sempere
& Garcia-Burillo 1997). They assumed this galaxy is molecule-dominated and found that the method
is insensitive to the bar pattern speed because the bar is nearly parallel to the major axis. They
found a spiral pattern speed of 28±5 km s−1 kpc−1. Nevertheless, these authors found that the spiral
pattern speed found agrees with previous estimates of the bar pattern speed, suggesting that these two
structures are parts of a single pattern.
• Corsini et al (2004) measured the bar pattern speed using the TW method. They compared the value
with recent high-resolution N-body simulations of bars in cosmologically-motivated dark matter halos
(Valenzuela & Klypin 2003), and concluded that the bars are not located inside centrally concentrated
halos and that N-body models produce slower bars than observed. We found the corotation of M100
at the radius RCR (r=94”) and the outer Lindblad resonance OLR (r=145”). If we conjecture that
the end of the bar and the OLR match, thus M100 is in the forbidden area of their plot.
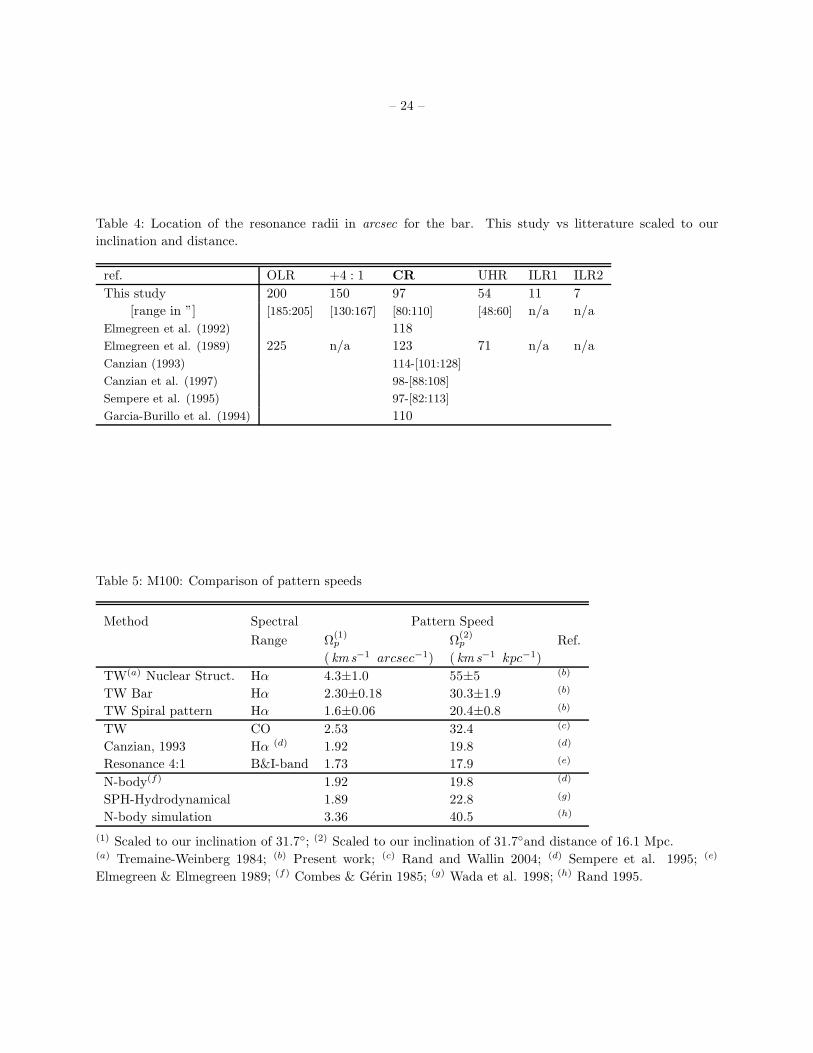
Table 4 presents the location of resonances for all the previous resonances of the bar. The comparison
with the present study is very consistent, especially for the bar corotation radius (CR).
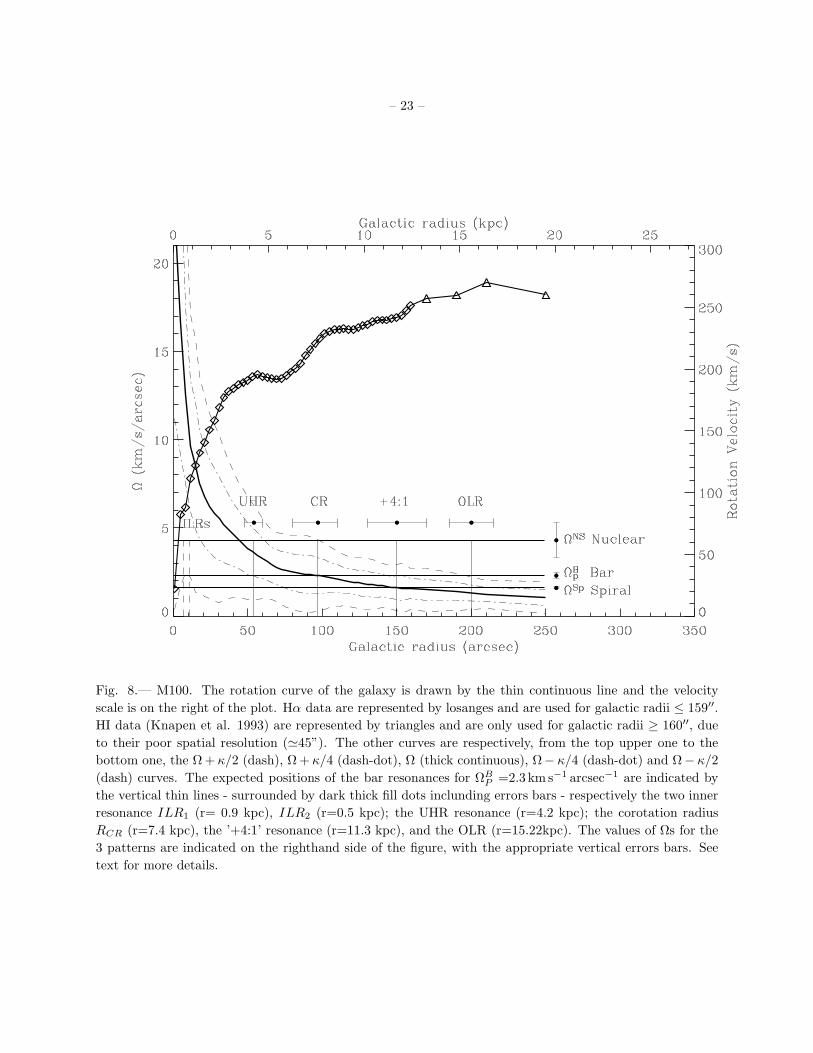
Figure 8 presents the rotation curve of M100, the curve Ω(R), where R is the galactic radius, with the
position of the resonances using Hα data obtained with FaNTOmM and HI data extracted from Knapen et
al. (1993). The other curves are respectively, from the top to the bottom, the Ω + κ/2 (dash), Ω + κ/4
(dash-dot), Ω (thick continuous), Ω − κ/4 (dash-dot) and Ω − κ/2 (dash) curves. The solid horizontal lines
– 22 –
represent respectively, from the top to the bottom, ΩNS from the nuclear structure, ΩBp from the bar and
ΩSp from the spiral pattern derived from the TW method using Hα. 1± σ errors, on the three Ω are drawn
in the lower righthandside of the graph. For the bar, these errors are reported in terms of radii to determine
the range of resonance radii.
Fig. 8 gives a clear evidence that the ’+4:1’ resonance of the bar, located in the middle of the disc, is
very close to the corotation of the spiral. Beyond this radius (≈ 11− 12 kpc) the spiral arms vanish. This is
a rather unexpected result since, in the case of a single pattern speed, it has been shown that 1) a massive
self-gravitating spiral lies between the ILR and the UHR and 2) in presence of a bar which fixes the pattern
speed, a perturbative (i.e. non self-gravitating) spiral structure lies between the corotation and the OLR.
However, all these results have been obtained with the linear theory of density waves.
Since the original simulations of Sellwood (1985) and the theoretical explanations of Tagger et al. (1987)
and Sygnet et al. (1988), the non-linear coupling of density waves has been recognized as an efficient coupling
mechanism between large scale morphological features such as bars and spiral arms. In most cases of non-
linear coupling reported so far, waves are coupled thanks to the coincidence of the bar corotation and the
spiral ILR. The coupling of two m = 2 modes generates two beat waves of modes m = 0 and m = 4. It has
been showed that such coincidence of resonances is the most efficient configuration for energy and momentum
transfers because the beat waves also have a Lindblad resonance at the same radius. The coupling between
a ’+4:1’ resonance and a corotation is not forbidden even if it seems to be a less favourable configuration.
The theory of non-linear coupling allows however the existence of others kinds of coupling: Rautinainen &
Salo (1999) reported a case of coupling between the bar corotation and the spiral ultra harmonic resonance
(UHR or ’−4:1’).
If we disregard the error on ΩIS of the structure inside the circum-nuclear ring, we could be tempted
to see another resonances overlap between the OLR of the nuclear structure and the bar corotation. This
location is indeed associated with an abrupt change of the pitch angle of the spiral arms. However, the
inaccurate location of the resonances due to the error on ΩIS prevents us to draw any definite conclusion on
a possible coupling.
Another noteworthy property must be emphasized: the three different pattern speeds could be related
by ΩSp + ΩBp ≈ ΩIS
p . The non-linear coupling of two density waves predict such a relationship between the
two initial waves and the beat waves. But, in our case, the nuclear structure cannot be considered as a
beat wave resulting from the interaction of the bar and the spiral structure since it has neither the right
location nor the right azimuthal wave number m. Thus, a complete understanding of M100 certainly needs
the development of a model based of the non-linear coupling of three density waves, which is outside the
scope of this paper.
6. Conclusions.
High spectral and spatial resolution Hα monochromatic image and Hα velocity field have been presented
in order to study the multiple pattern speeds of M100 using the Tremaine-Weinberg method. At the same
time, the TW method has been tested on various numerical simulations to test its relevance. The main
conclusions are the following:
• The TW method can be applied to the gaseous velocity fields to get the bar pattern speed, under
the condition that regions of shocks are avoided and measurements are confined to regions where the
– 23 –
Fig. 8.— M100. The rotation curve of the galaxy is drawn by the thin continuous line and the velocity
scale is on the right of the plot. Hα data are represented by losanges and are used for galactic radii ≤ 159′′.
HI data (Knapen et al. 1993) are represented by triangles and are only used for galactic radii ≥ 160′′, due
to their poor spatial resolution (≃45”). The other curves are respectively, from the top upper one to the
bottom one, the Ω + κ/2 (dash), Ω + κ/4 (dash-dot), Ω (thick continuous), Ω− κ/4 (dash-dot) and Ω− κ/2
(dash) curves. The expected positions of the bar resonances for ΩBP =2.3 km s−1 arcsec−1 are indicated by
the vertical thin lines - surrounded by dark thick fill dots inclunding errors bars - respectively the two inner
resonance ILR1 (r= 0.9 kpc), ILR2 (r=0.5 kpc); the UHR resonance (r=4.2 kpc); the corotation radius
RCR (r=7.4 kpc), the ’+4:1’ resonance (r=11.3 kpc), and the OLR (r=15.22kpc). The values of Ωs for the
3 patterns are indicated on the righthand side of the figure, with the appropriate vertical errors bars. See
text for more details.
– 24 –
Table 4: Location of the resonance radii in arcsec for the bar. This study vs litterature scaled to our
inclination and distance.
ref. OLR +4 : 1 CR UHR ILR1 ILR2
This study 200 150 97 54 11 7
[range in ”] [185:205] [130:167] [80:110] [48:60] n/a n/a
Elmegreen et al. (1992) 118
Elmegreen et al. (1989) 225 n/a 123 71 n/a n/a
Canzian (1993) 114-[101:128]
Canzian et al. (1997) 98-[88:108]
Sempere et al. (1995) 97-[82:113]
Garcia-Burillo et al. (1994) 110
Table 5: M100: Comparison of pattern speeds
Method Spectral Pattern Speed
Range Ω(1)p Ω
(2)p Ref.
( km s−1 arcsec−1) ( km s−1 kpc−1)
TW(a) Nuclear Struct. Hα 4.3±1.0 55±5 (b)
TW Bar Hα 2.30±0.18 30.3±1.9 (b)
TW Spiral pattern Hα 1.6±0.06 20.4±0.8 (b)
TW CO 2.53 32.4 (c)
Canzian, 1993 Hα (d) 1.92 19.8 (d)
Resonance 4:1 B&I-band 1.73 17.9 (e)
N-body(f) 1.92 19.8 (d)
SPH-Hydrodynamical 1.89 22.8 (g)
N-body simulation 3.36 40.5 (h)
(1) Scaled to our inclination of 31.7; (2) Scaled to our inclination of 31.7and distance of 16.1 Mpc.(a) Tremaine-Weinberg 1984; (b) Present work; (c) Rand and Wallin 2004; (d) Sempere et al. 1995; (e)
Elmegreen & Elmegreen 1989; (f) Combes & Gerin 1985; (g) Wada et al. 1998; (h) Rand 1995.
– 25 –
gaseous bar is well formed.
• The application of the TW method to gas velocity fields needs a careful selection of the region included
in the < VLOS,Y >-< XY > fit.
• A living dark halo does not change significantly the results.
• When star formation is switched on, the TW method applied to the gaseous component is less accurate.
The main source of errors is the presence of strong and persistent gradient in the gaseous velocity fields.
• The TW method provides clear information about multiple pattern speeds.
• M100 has been analyzed using the TW method. Three pattern speeds are clearly seen and measured
with a good precision compared to other studies. Errors on the PA and the inclination have been
minimized due to the nature of the two dimensional velocity maps, improving the relevance of the
results obtained for the three pattern speeds.
• A coupling between resonance the ’+4:1’ of the bar and the corotation of the spiral is found and are in
agreement with the theory of non linear coupling of spiral modes. The coupling is not forbidden even
if it seems to be a less favourable configuration. The theory of non-linear coupling allows however the
existence of others kinds of coupling as reported by Rautinainen & Salo (1999).
• A restriction for a more accurate determination of the different radii and resonnaces comes from the
intrinsic nature of M100. The central bar distorts the spiral arm structure and the corotation is not a
narrow, but a relatively extended region.
REFERENCES
Aguerri, J. A. L., Debattista, V. P., & Corsini, E. M. 2003, MNRAS, 338, 465
Amram, P., Boulesteix, J., Georgelin, Y. M., Laval, A., Le Coarer, E., Marcelin, M., & Rosado, M. 1991,
The Messenger, 64, 44
Arsenault, R., Roy, J.-R., & Boulesteix, J. 1990, A&A, 234, 23
Athanassoula, E. 1992a, MNRAS, 259, 328.
Athanassoula, E. 1992b, MNRAS, 259, 345.
Athanassoula, E. 2003, in Revista Mexicana de Astronomia y Astrofisica Conference Series, 28–29
Athanassoula, E. & Misiriotis, A. 2002, MNRAS, 330, 35
Beckman, J. E., Peletier, R. F., Knapen, J. H.,Corradi, R. L. M., & Gentet, L. J. 1996, AJ, 467, 175
Benz, W. 1990, Numerical Modelling of Nonlinear Stellar Pulsations Problems and Prospects, 269
Blais-Ouellette, S., Amram, P., Carignan, C.,& Swaters, R. 2004, A&A, 420, 147
Blais-Ouellette, S., Amram, P., & Carignan, C. 2001,AJ, 121, 1952
Blais-Ouellette, S., Carignan, C.,Amram, P., & Cote, S. 1999, AJ, 118, 2123
– 26 –
Block, D. L., Bournaud, F.,Combes, F., Puerari, I., & Buta, R. 2002, A&A, 394, 35
Block, D. L., Buta, R., Knapen, J. H., Elmegreen, D. M., Elmegreen, B. G., & Puerari, I. 2004, AJ, 128, 183
Boulesteix, 2004, http://www-obs.cnrs-mrs.fr/adhoc/adhocw.htm
Bournaud, F. & Combes, F. 2002, A&A, 392, 83
Bureau, M., Freeman, K. C., Pfitzner, D. W.,& Meurer, G. R. 1999, AJ, 118, 2158
Buta, R. 1986, ApJS, 61, 609
—. 1995, ApJS, 96, 39
Buta R., Crocker D.A 1993, AJ105, 1344
Canzian, B. 1990, Ph.D. Thesis, California Inst. of Tech.,Pasadena
Canzian B. 1993, ApJ, 414, 487
Canzian, B., & Allen R. J. 1997, ApJ, 479, 723
Cappellari, M., & Copin, Y. 2002, in Galaxies: The Third Dimension, ASP Conf. Ser., 282, 515
Cayatte, V., van Gorkom, J. H., Balkowski, C.,& Kotanyi, C. 1990, AJ, 100, 604
Cepa, J., & Beckman, J. E. 1990, A&AS, 83, 211
Combes, F., Debbasch, F., Friedli, D., & Pfenniger, D. 1990, A&A, 233, 82
Combes, F. & Elmegreen, B. G. 1993, A&A, 271, 391
Combes, F. & Gerin, M. 1985, A&A, 150, 327
Contopoulos, G. 1980, A&A, 81, 198
Corsini, E. M., Aguerri, J. A. L., & Debattista, V. P. 2004, IAU Symposium, 220, 271
Corsini, E. M., Debattista, V. P., & Aguerri, J. A. L. 2003, ApJ, 599, L29
Daigle, O., Carignan, C., Amram, P., Balkowski, C., Hernandez, O., Kennicutt, R. C. et al. 2005, submitted
to MNRAS
Daigle, O., Carignan, C., Hernandez, O. & Amram, P. 2005, submitted to MNRAS
Das, M., Teuben, P. J., Vogel, S. N., Harris, A., Regan, M. W., Sheth, K., Helfer, T. T., & Thornley, M. D.
2001, Bulletin of the American Astronomical Society, 33, 1391
Debattista, V. P. 2003, MNRAS, 342, 1194
Debattista, V. P., Corsini, E. M., & Aguerri, J. A. L. 2002, MNRAS, 332, 65
Debattista, V. P. & Sellwood, J. A. 1998, ApJ, 493, L5
Debattista, V. P., & Williams, T. B. 2001, in Galaxy Disks and Disk Galaxies, ASP Conf. Ser., 230, 553
de Vaucouleurs, G. 1963, ApJ, 8, 31
– 27 –
de Vaucouleurs, G., de Vaucouleurs, A., & Corwin, H. G. 1976, 2nd reference catalogue of bright galaxies
containing information on 4364 galaxies with reference to papers published between 1964 and 1975
(University of Texas Monographs in Astronomy, Austin: University of Texas Press, 1976)
de Vaucouleurs, G., de Vaucouleurs, A., Corwin, H. G., Buta, R. J., Paturel, G., & Fouque, P. 1991, Volume
1-3, XII, 2069 pp. 7 figs.. Springer-Verlag Berlin Heidelberg New York
Elmegreen B.G., Elmegreen D.M. 1989, ApJ 342, 677
Elmegreen D.M., Elmegreen B.G. 1995, ApJ 445, 591
Elmegreen B. G., Elmegreen, D. M., Chromey, F. R., Hasselbacher, D. A., & Bissell, B. A. 1996, AJ, 111,
2233
Elmegreen B. G., Elmegreen, & D. M., Montenegro L. 1992, ApJS, 79, 37
Eskridge, P. B., Frogel, J. A., Pogge, R. W., Quillen, A. C., Davies, R.L., DePoy, D.L., Houdashelt, M. L.,
Kuchinski, L. E., Ramirez, S. V., Sellgren, K., Terndrup, D. M., & Tiede, G. P. 2000, AJ, 119, 536
Ferrarese, L., Freedman, W. L., Hill, R. J., Saha, A., Madore, B.F., Kennicutt, R. C., Stetson, P. B., Ford,
H. C., Graham, J. A., Hoessel, J.G. et al. 1996, ApJ, 464, 568
Friedli, D., & Benz, W. 1995, A&A, 301, 649
Friedli D., Martinet L. 1993, A&A 277, 27
Friedli D., Wozniak H., Rieke M., Martinet L., Bratschi P. 1996, A&AS 118, 461
Gach, J. L., Hernandez, O., Boulesteix, J., Amram, P., Boissin, O., Carignan, C., Garrido, O., Marcelin, M.,
Ostlin, G., Plana, H., & Rampazzo, R. 2002, PASP, 114, 1043
Garcia-Burillo S., Combes F., & Gerin M. 1993, A&A, 274, 148
Garcia-Burillo, S. and Sempere, M. J. and Combes, F. 1994, A&A, 287, 419
Garcia-Burillo, S., Sempere, M. J., Combes, F., & Neri, R. 1998, A&A, 333, 864
Gerssen, J., Kuijken, K., & Merrifield, M.R. 2003, MNRAS, 345, 261
Gerssen, J., Kuiken, K., & Merrifield, M. R. 1999, MNRAS, 306, 926
Gnedin, O. Y. and Goodman, J. and Frei, Z. 1995, AJ, 110, 1105
Grosbøl, P., Patsis, P. A. & Pompei, E. 2004, A&A, 423, 849
Hackwell, J. A., & Schweizer, F. 1983, ApJ, 265, 643
Helfer T. T., Thornley, M. D., Regan, M. W., Wong, T., Sheth, K., Vogel, S. N., Blitz, L.,& Bock, D. C.-J.
2003, ApJS, 145, 259
Hernandez, O., Carignan, C., Amram P., & Daigle, O., 2004, in Penetrating Bars through Masks of Cosmic
Dust: The Hubble Tuning Fork Strikes a New Note, eds D. L. Block, K. C. Freeman, I. Puerari, R.
Groess, E. K. Block (Kluwer: Dordrecht), in press
Hernandez, O., Carignan, C., Amram P., Chemin, L, & Daigle, O. 2005, MNRAS, accepted astroph/0504393
– 28 –
Hernandez, O., Gach, J., Carignan, C., & Boulesteix, J. 2003, Proc. SPIE, 4841, 1472
Kennicutt, R.C. 1998, ARA&A, 36, 189
Kent, S. M. 1987, AJ, 93, 1062
Kent, S. M., & Glaudell, G. 1989, AJ, 98, 1588
Knapen, J. H., Beckman, J. E., Heller, H. C.,Shlosman, I., & de Jong, R. S. 1995, ApJ, 454, 623
Knapen, J. H., Cepa, J., Beckman, J. E., Soledad del Rio, M., & Pedlar, A. 1993, ApJ, 416, 563
Knapen, J. H., Shlosman, I., Heller, H. C., Rand R. J., Beckman, J. E., & Rozas M. 2000, ApJ, 528, 219
Knapen, J. H., Shlosman, I., & Peletier, R. F. 2000, ApJ, 265, 643
Kormendy, J. 1982, ApJ, 257, 75
Masset, F., & Tagger, M. 1997, A&A, 322, 442
Merrifield, M. R. & Kuijken, K. 1995, MNRAS, 274, 933
Michel-Dansac, L. & Wozniak, H. 2004, A&A, 421, 863
Miyamoto, M. & Nagai, R. 1975, PASJ, 27, 533
Noguchi, M. 2004, in Penetrating Bars through Masks of Cosmic Dust: The Hubble Tuning Fork Strikes a
New Note, eds D. L. Block, K. C. Freeman, I. Puerari, R. Groess, E. K. Block (Kluwer: Dordrecht),
in press
Pfenniger, D., & Friedli, D. 1993, A&A, 270, 561
Quillen, A. C., Frogel, J. A. 1997, ApJ, 487, 603
Rand, R. J. 1995, AJ, 109, 2444
Rand, R. J., & Wallin, J. F. 2004, ApJ, 614, 142
Rautiainen, P. & Salo, H. 1999, A&A, 348, 737
Rubin, V. C., Thonnard, N., & Ford, W. K. 1980, ApJ, 238, 471
Sakamoto, K., Okumura, S., Minezaki, T., Kobayashi, Y., & Wada, K. 1995, AJ, 110, 2075
Sanders R.H., Huntley J.M. 1976, ApJ 209, 53
Sellwood, J.A. 1985, MNRAS, 217, 127
Sellwood, J.A. 1993, PASP, 105, 648
Sellwood, J.A., Wilkinson A. 1993, Reports on Progress in Physics 56, 173
Sellwood, J.A., Sparke, L.S. 1988, MNRAS 231, 25
Sempere, M. J., Garcia-Burillo, S., Combes, F., & Knapen J. H. 1995, A&A, 296,45
Sempere, M. J., & Garcia-Burillo, S. 1997, A&A, 325, 769
– 29 –
Sheth, K., Vogel, S. N., Regan, M. W., Teuben, P. J., Harris, A. I., & Thornley, M. D. 2002, AJ, 124, 2581
Springel, V., Yoshida, N., & White, S. D. M. 2001, New Astronomy, 6, 79
Swaters, R. A., Madore, B. F., van den Bosch, F. C.& Balcells, M. 2003, ApJ, 583, 732
Sygnet, J. F., Tagger, M., Athanassoula, E., & Pellat, R. 1988, MNRAS, 232, 733
Tagger M., Sygnet J.F., Athanassoula E., Pellat R. 1987, ApJ 318, L43
Teuben, P. J. 2002, in Disks of Galaxies: Kinematics, Dynamics and Perturbations, eds E. Athanassoula, A.
Bosma, and R. Mujica, ASP Conf. Proc. (San Francisco: ASP), 275, 217
Toomre, A. 1969, ApJ, 158, 899
Tremaine S., & Weinberg M. D. 1984, ApJ, 282, L5
Valenzuela, O.,& Klypin, A. 2003, MNRAS, 345, 406
Wada, K., Sakamoto, K., & Minezaki, T. 1998, ApJ, 494, 236
Westpfahl, D. J. 1998, ApJS, 115, 203
Wozniak H., Friedli D., Martinet L., Martin P., Bratschi P. 1995, A&AS 111, 115
Zimmer P., Rand R. J., & McGraw, J. T. 2004, ApJ, 607, 285
This preprint was prepared with the AAS LATEX macros v5.2.
Related Documents