On The Organization Of Human T Cell Receptor Loci. Amir A. Toor MD, 1 Abdullah A. Toor, 2 Masoud H. Manjili PhD, DVM. 3 1 Bone Marrow Transplant Program, Department of Internal Medicine, and 3 Department of Microbiology and Immunology, Virginia Commonwealth University, Richmond, VA; 2 Deep Run High School, Glen Allen, VA. * Address correspondence to: Amir A. Toor, MD, Associate Professor of Medicine, Massey Cancer Center, Virginia Commonwealth University, E-mail: [email protected], Phone: 804-828-4360. 1300 E Marshall St., PO box 980157, Richmond, VA 23298 Key Words: T cell receptors, gene segments, self-similarity, periodic functions, logarithmic scaling, interference Word count: Abstract 327; Manuscript 6174; Figures 6; Supplementary Tables 2; Supplementary Figures 2

Welcome message from author
This document is posted to help you gain knowledge. Please leave a comment to let me know what you think about it! Share it to your friends and learn new things together.
Transcript
On The Organization Of Human T Cell Receptor Loci.
Amir A. Toor MD, 1 Abdullah A. Toor, 2 Masoud H. Manjili PhD, DVM. 3
1 Bone Marrow Transplant Program, Department of Internal Medicine, and 3 Department of
Microbiology and Immunology, Virginia Commonwealth University, Richmond, VA; 2 Deep Run High
School, Glen Allen, VA.
* Address correspondence to: Amir A. Toor, MD, Associate Professor of Medicine, Massey Cancer
Center, Virginia Commonwealth University, E-mail: [email protected], Phone: 804-828-4360. 1300 E
Marshall St., PO box 980157, Richmond, VA 23298
Key Words: T cell receptors, gene segments, self-similarity, periodic functions, logarithmic scaling,
interference
Word count: Abstract 327; Manuscript 6174;
Figures 6; Supplementary Tables 2; Supplementary Figures 2

On the organization of T cell receptor loci. Toor A, Toor A, Manjili M. 2
Abstract.
The human T cell repertoire is complex and is generated by the rearrangement of variable (V), diversity
(D) and joining (J) segments on the T cell receptor (TCR) loci. The T cell repertoire demonstrates self-
similarity in terms clonal frequencies when defined by V, D and J gene segment usage; therefore to
determine whether the structural ordering of these gene segments on the TCR loci contributes to the
observed clonal frequencies, the TCR loci were examined for self-similarity and periodicity in terms of
gene segment organization. Logarithmic transformation of numeric sequence order demonstrated that
the V and J gene segments for both T cell receptor α (TRA) and β (TRB) loci were arranged in a self-
similar manner when the spacing between the adjacent segments was considered as a function of the size
of the neighboring gene segment, with an average fractal dimension of ~1.5. The ratio of genomic
distance between either the J (in TRA) or D (in TRB) segments and successive V segments on these loci
declined logarithmically with a slope of similar magnitude. Accounting for the gene segments occurring
on helical DNA molecules in a logarithmic distribution, sine and cosine functions of the log transformed
angular coordinates of the start and stop nucleotides of successive TCR gene segments showed an
ordered progression from the 5’ to the 3’ end of the locus, supporting a log-periodic organization. T cell
clonal frequencies, based on V and J segment usage, from three normal stem cell donors were plotted
against the V and J segment on TRB locus and demonstrated a periodic distribution. We hypothesize
that this quasi-periodic variation in gene-segment representation in the T cell clonal repertoire may be
influenced by the location of the gene segments on the periodic-logarithmically scaled TCR loci.
Interactions between the two strands of DNA in the double helix may influence the probability of gene
segment usage by means of either constructive or destructive interference resulting from the
superposition of the two helices.

On the organization of T cell receptor loci. Toor A, Toor A, Manjili M. 3
Introduction
T cells are central to the normal execution of adaptive immunity, allowing identification of a multitude
of pathogens and transformed cells encountered in an organism’s lifetime. T cells accomplish this task
by recognizing peptide-MHC complexes by means of hetero-dimeric T cell receptors (TCRs) expressed
on their surface. The TCR serve the primary antigen recognition function in adaptive immune responses.
TCRs are comprised of either, an alpha and a beta chain (TCR αβ) in the majority of T cells, or less
frequently, gamma and delta chains (TCR γδ). [1] The ability of the human T cells to recognize a vast
array of pathogens and initiate specific adaptive immune responses depends on the versatility of the
TCR, which is generated by recombination of specific variable (V), diversity (D) and joining (J)
segments in the case of TCR β, and unique V and J segments for TCR α, δ and γ. Complementarity
determining regions (CDR) are the most variable part of the TCR and complement an antigen-major
histocompatibility complex’s shape. The CDR is divided into 3 regions termed CDR1-3, and of these
CDR1 and CDR2 are coded for entirely by the V segment, whereas CDR3 incorporates a part of the V
segment and the entire D and J segments for TCR β and parts of the V and J segments for TCR α. CDR3
is the most variable region and interacts with the target oligo-peptide lodged in the antigen binding
groove of the HLA molecule of an antigen presenting cell [2]. The germ line TCR β locus on
chromosome 7q34 has two constant, two D, fourteen J and sixty-four V gene segments, which are
recombined during T cell development to yield numerous VDJ recombined T cell clones; likewise, TCR
α locus on chromosome 14q11 has one constant, sixty-one J and fifty-four V segments [3]. Further
variability and antigen recognition capacity is introduced by nucleotide insertion (NI) in the recombined
TCR α and β VDJ sequences. This generates a vast T cell repertoire, yielding in excess of a trillion
potential TCRαβ combinations capable of reacting to non-self (and self) peptides. Since the advent of
next generation sequencing (NGS) techniques, the TCR repertoire, as expressed by TCR β clonal
frequency has revealed that the T cell repertoire in healthy individuals is complex with thousands of
clones in each individual spanning a spectrum of high and low frequencies [4, 5].
T cells have a fundamental role in clinical medicine, especially in cancer therapeutics. As an example,
clinical outcomes following stem cell transplantation (SCT) are closely associated with T cell
reconstitution, both from the standpoint of infection control and control of malignancy [6,7]. A detailed
examination of transplant outcomes in the context of immune reconstitution suggests that the T cell
recovery is a dynamic and ordered progression of events, which follows mathematically quantifiable
rules. In other words, T cell reconstitution over time following SCT may be considered as a dynamical

On the organization of T cell receptor loci. Toor A, Toor A, Manjili M. 4
system, where each of the successive states of the system (T cell repertoire complexity) when plotted as
a function of time can be described mathematically as a non-random process [8, 9]. Consistent with this
hypothesis, T cell repertoire has been shown to posses a fractal self-similar organization with respect to
TCR gene segment usage [10].
Clinical outcomes following SCT have been studied using probability theory, assuming that the
outcomes are inherently random within specific constraints, such as, HLA-matching and intensity of
immunosuppression. However, the dynamical system model of immune reconstitution implies that T cell
repertoire generation, and thus clinical outcomes tied to it, is not a stochastic process but a
mathematically definable one. Since the T cell repertoire is dependent on the clones generated by TCR
gene rearrangement, it may be postulated that the TCR locus may exhibit organizational features
reflected in the resulting T cell repertoire. It has been observed that the T cell clonal repertoire follows
power laws and demonstrates self-similarity across scales of measurement, which are features of
fractals. Fractal geometry represents iterating functions, which result in structures demonstrating
organizational self-similarity across scales of magnitude. Mathematically, self-similarity is characterized
by the logarithm of magnitude of a parameter (y) maintaining a relatively constant ratio to the logarithm
of a scaling factor value (x), this ratio is termed fractal-dimension (FD) [11]. FD takes on non-integer
values between the classical Euclidean integer dimensional values. Self-similarity is a structural motif
widely observed in nature, albeit on a limited scale, such as in the branching patterns of trees, or of
vascular and neuronal networks in animals [12, 13, 14, 15]. Fractal organization has also been described
in terms of molecular folding of DNA, and in nucleotide distribution in the genome [16, 17, 18, 19]. In
such instances fractal dimension explains the complex structural organization of natural objects. A
germ-line linear strand of DNA such as the TCR locus, rearranged to yield new complex patterns, may
be similarly considered. In this case the recombination of TCR V, D and J segments, and NI lends
complexity to the rearranged locus compared to its native state. The resulting T cell repertoire with its
many unique T cell clones may then be considered to have a fractal organization, if the frequency of T
cell clones with unique D, DJ, VDJ and VDJ(+NI) segments are considered sequentially at an increasing
level of clonal definition. Using such analyses the T cell repertoire appears highly ordered with respect
to TCR β VDJ gene segment usage demonstrating self-similarity (in terms of clonal frequency) at
multiple levels of clonal definition. When the number of TCR segments used to define a clone is used as
the scaling factor, a consistent fractal dimension value of 1.6, 1.5 and 1.4 is observed across normal stem
cell donors when TCR clone families bearing unique J, VJ and VJ+NI are evaluated [10]. It stands to

On the organization of T cell receptor loci. Toor A, Toor A, Manjili M. 5
reason that the TCR loci which generate this T cell clonal diversity should be organized in a similar
manner to result in a repertoire so ordered.
The universal constants π and e have a role in defining the fractal dimension of the T cell repertoire,
which would then imply that the TCR locus may be arranged in conformity with these constants, and
posses self-similarity as well as periodic characteristics. An inspection of the known sequence of the
TCR loci with attention to V and J gene segment size and spacing supports this notion. In this paper, an
examination of the TCR α and β loci, in light of e and π is presented supporting the hypothesis that TCR
locus organization may influence T cell repertoire. The findings reported here support the hypothesis
that the T cell repertoire is not a randomly generated set of T cell clones, rather it is the result of a
deterministic process dependent on TCR gene segment distribution on the individual loci.
Methods.
Human T cell receptor loci
Data on the TCR α/δ (TRA) and β (TRB) loci were obtained from the NCBI, using the public database,
(http://www.ncbi.nlm.nih.gov/nuccore/114841177?report=graph;
http://www.ncbi.nlm.nih.gov/nuccore/99345462?report=graph) (Supplementary Tables 1 and 2). The
graphic format, with locus identification was utilized. Data examined included the position of the initial
(start) and final (stop) nucleotides of all the TCR gene segments, beginning from the 5’ end of the locus
and going to the 3’ end. Segment length was taken from the NCBI data-base, and spacing between
consecutive segments was calculated by taking the difference between the numeric value of the final
nucleotide or base pair (xf) position of a gene segment and the initial nucleotide position (xi) of the
following segment (Supplementary table 1 and 2). In the ensuing calculations, numeric data were either
considered without any modification or transformed to natural logarithms to eliminate the effect of
relative magnitude between the variables being examined, and also to allow comparisons across
different scales, e.g. segment size in hundreds or tens of nucleotides versus inter-segment spacing in the
thousands or hundreds of nucleotides respectively. Microsoft Excel (version 14.2.5) software was used
to perform various calculations presented in this paper.
Gene Segment Distribution on the TCR Locus
On the organization of T cell receptor loci. Toor A, Toor A, Manjili M. 6
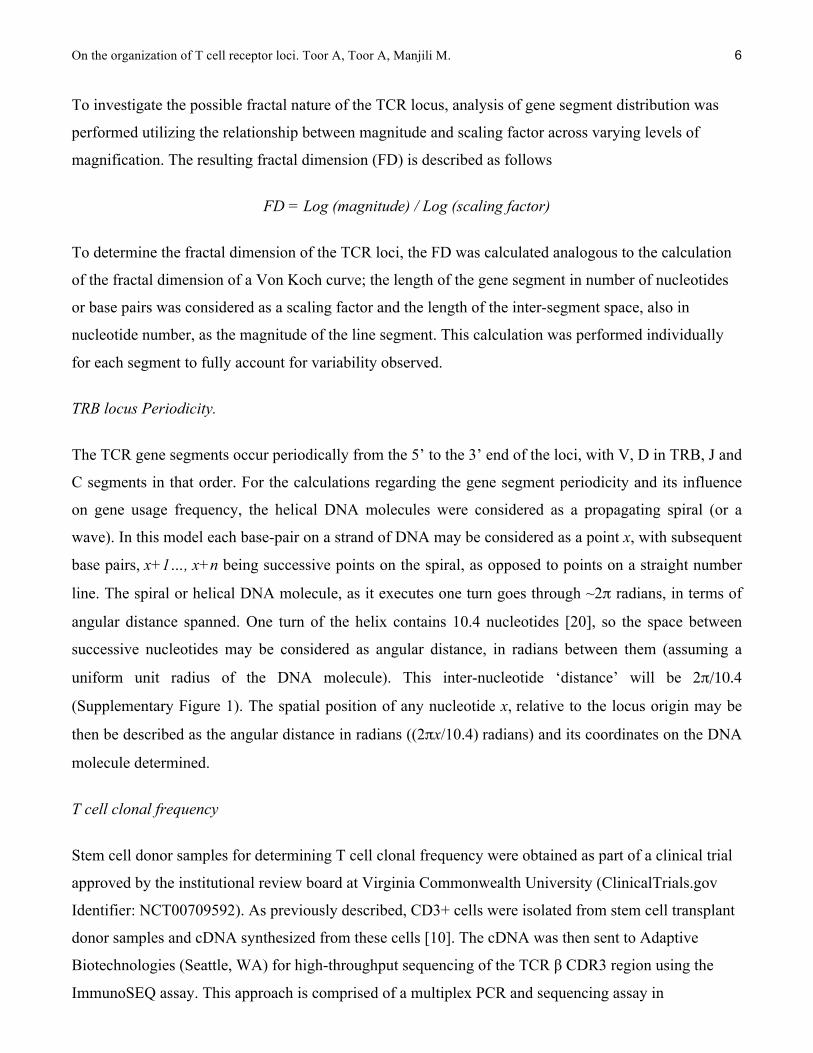
To investigate the possible fractal nature of the TCR locus, analysis of gene segment distribution was
performed utilizing the relationship between magnitude and scaling factor across varying levels of
magnification. The resulting fractal dimension (FD) is described as follows
FD = Log (magnitude) / Log (scaling factor)
To determine the fractal dimension of the TCR loci, the FD was calculated analogous to the calculation
of the fractal dimension of a Von Koch curve; the length of the gene segment in number of nucleotides
or base pairs was considered as a scaling factor and the length of the inter-segment space, also in
nucleotide number, as the magnitude of the line segment. This calculation was performed individually
for each segment to fully account for variability observed.
TRB locus Periodicity.
The TCR gene segments occur periodically from the 5’ to the 3’ end of the loci, with V, D in TRB, J and
C segments in that order. For the calculations regarding the gene segment periodicity and its influence
on gene usage frequency, the helical DNA molecules were considered as a propagating spiral (or a
wave). In this model each base-pair on a strand of DNA may be considered as a point x, with subsequent
base pairs, x+1…, x+n being successive points on the spiral, as opposed to points on a straight number
line. The spiral or helical DNA molecule, as it executes one turn goes through ~2π radians, in terms of
angular distance spanned. One turn of the helix contains 10.4 nucleotides [20], so the space between
successive nucleotides may be considered as angular distance, in radians between them (assuming a
uniform unit radius of the DNA molecule). This inter-nucleotide ‘distance’ will be 2π/10.4
(Supplementary Figure 1). The spatial position of any nucleotide x, relative to the locus origin may be
then be described as the angular distance in radians ((2πx/10.4) radians) and its coordinates on the DNA
molecule determined.
T cell clonal frequency
Stem cell donor samples for determining T cell clonal frequency were obtained as part of a clinical trial
approved by the institutional review board at Virginia Commonwealth University (ClinicalTrials.gov
Identifier: NCT00709592). As previously described, CD3+ cells were isolated from stem cell transplant
donor samples and cDNA synthesized from these cells [10]. The cDNA was then sent to Adaptive
Biotechnologies (Seattle, WA) for high-throughput sequencing of the TCR β CDR3 region using the
ImmunoSEQ assay. This approach is comprised of a multiplex PCR and sequencing assay in

On the organization of T cell receptor loci. Toor A, Toor A, Manjili M. 7
combination with algorithmic methods to produce approximately 1,000,000 TCR β CDR3 sequences per
sample [21]. The assay utilized 52 forward primers for the Vβ gene segment and 13 reverse primers for
the Jβ segment, to generate a 60 base pair fragment capable of identifying the entire unique VDJ
combination [22]. Amplicons were then sequenced using the Illumina HiSeq platform, and data was
analyzed using the ImmunoSEQ analyzer set of tools. This approach enables direct sequencing of a
significant fraction of the TCR repertoire as well as permitting estimation of the relative frequency of
each CDR3 region in the population.
Results.
Self-similarity of the TCR loci
Sequences of the TCR α/δ (TRA) and β (TRB) loci were examined and the position of the initial (start)
and final (stop) nucleotides of the TCR gene segments, beginning from the 5’ end of the locus and going
to the 3’ end were recorded. Segment length was taken from the NCBI data-base, and spacing between
consecutive segments was calculated (Supplementary Tables 1 and 2). Self-similarity across the T cell
receptor α and β loci was first examined by deriving the fractal dimension of these loci. To accomplish
this, the spacing of all the V and J segments across the α/δ and β loci was determined, in numbers of
nucleotides along the DNA molecule, and the natural logarithms of these values calculated. Given the
relative uniformity of sizes (in nucleotides) for the V and J gene segments, these were considered as a
scaling parameter for determining the fractal dimension of the TCR loci (FD-TCR). The sizes of
neighboring segments and intersegment spaces were used in the FD-TCR calculations to avoid bias. The
following formula was used
FD-TCR = Log (Intron length following nth TCR seg.) / Log (Length nth TCR seg.) … [1]
Relatively consistent values of FD-TCR were observed across the distribution of the V and J segments
for both the TCR α and β loci (Figure 1), when the calculated fractal dimensions were plotted across the
loci. This indicates that when viewed on a logarithmic scale there is uniformity in the distribution of
gene segments both within and between the different TCR loci, a hallmark of self-similar systems. The
average FD-TCR of the TRB V and J segments were 1.4±0.1 and 1.3±0.2 respectively. Corresponding
values for TRA locus were 1.5±0.1 and 1.7±0.1, for the V and J segments. The self-similarity across the
TRA locus may also be seen when the spacing between successive gene segments is plotted from the 5’
to 3’ end in a circular area graph (Figure 2). The two halves of the figure are similar in appearance and

On the organization of T cell receptor loci. Toor A, Toor A, Manjili M. 8
are symmetric, except for the spacing between TRA-J segments being an order of magnitude lower
when compared with TRA-V segments. Notably, oscillation around a central value is observed in these
graphics, suggesting that periodic variation is present in the measured parameters. Despite this
variability, the narrow distribution of the FD-TCR values was consistent with self-similarity in the
organization across the V and J segments of the two TCR loci examined. This implies that the size of the
interval between successive T cell gene segments is proportional to the size of the gene segment. It may
be postulated that this phenomenon exerts an influence on the order of TCR gene rearrangement,
specifically the Dβ to Jβ and DJβ or Jα to Vβ or Vα recombination.
In calculating FD-TCR, the D and C segments were not considered because of their infrequent and non-
periodic occurrence, as well as their being, interspersed between other loci. However, notably their size
followed fixed proportion to the sizes of J and V segments respectively, such that D segments were ~1/3
to 1/4 the size of J, and the C segments were approximately 3 times the length of the V segments.
Similarly the TCR-γ locus was also not evaluated because of the small number of gene segments,
however, it is to be noted that the gene segment length was similar to the TRA and TRB loci.
Logarithmic Distribution of V segments with respect to D and J segments
During T cell receptor recombination, the J and the D segments in TRA and TRB loci respectively, are
recombined with the V segments. The distribution of V segments in the TRA and TRB loci was
therefore examined relative to the position of the J and the D loci respectively, to discern if any
organizational order was evident. The relative position of V loci was calculated with respect to the two
D loci for TRB, and selected J loci for TRA, by the using a formula considering the 5’-initial nucleotide
positions (xi) of the D or J gene segments, and the final, 3’ nucleotide position of the V segments (xf)
from the origin of the locus
Relative recombination distance Vn = xi-D or J segment / xf nth V segment …… [2]
Relative recombination distance (RRD) demonstrated a consistent proportionality in the distribution of
V segments across both TRA and TRB loci. When RRD for successive TRB V loci was plotted in order
of occurrence on the locus, the value declined as a logarithmic function of V segment rank, with a slope
of 1.6 for the TRB locus (Figure 3A) and ~1.3 for the TRA locus (Figure 3B & 3C), values very close to
the FD-TCR. These calculations demonstrate that the V segments are spaced from their respective D and
J segments in a logarithmically proportional manner. This is consistent with the self-similar nature of the
On the organization of T cell receptor loci. Toor A, Toor A, Manjili M. 9
TCR loci as seen in the preceding calculations and also validates the notion that the distribution of
various gene segments on the TRA and TRB loci is not random, but rather follows a mathematically
determined order, apparent when logarithmic transformation is used.
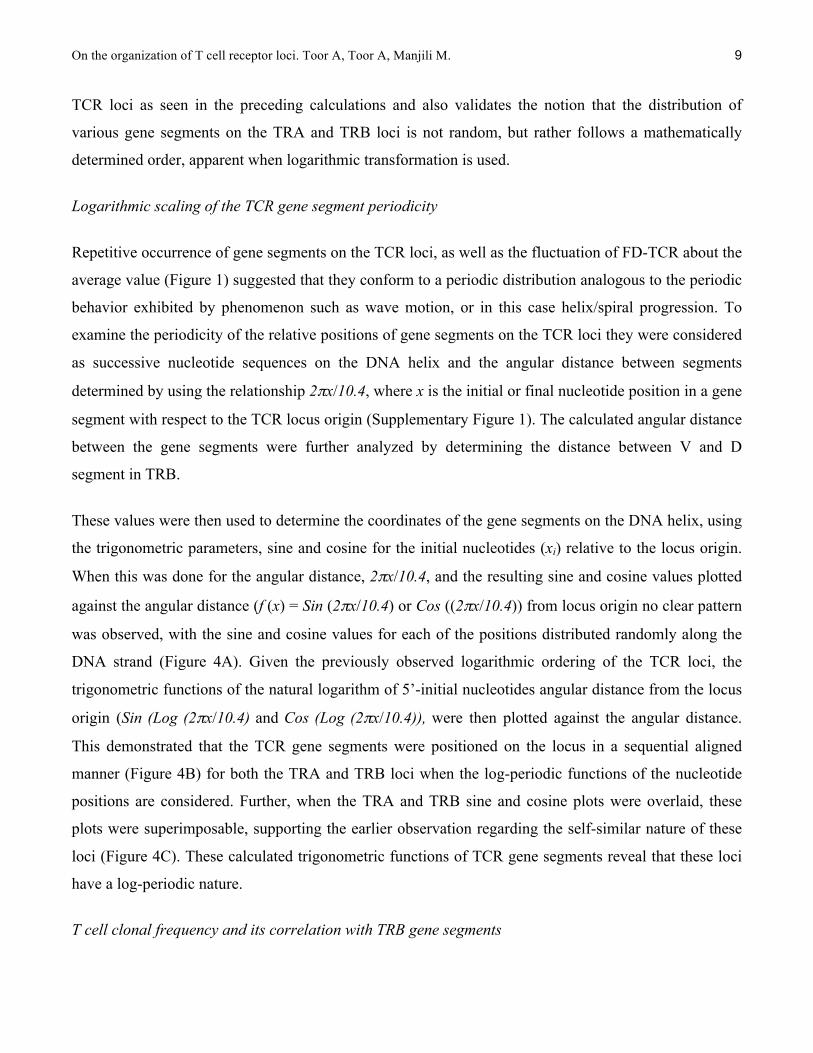
Logarithmic scaling of the TCR gene segment periodicity
Repetitive occurrence of gene segments on the TCR loci, as well as the fluctuation of FD-TCR about the
average value (Figure 1) suggested that they conform to a periodic distribution analogous to the periodic
behavior exhibited by phenomenon such as wave motion, or in this case helix/spiral progression. To
examine the periodicity of the relative positions of gene segments on the TCR loci they were considered
as successive nucleotide sequences on the DNA helix and the angular distance between segments
determined by using the relationship 2πx/10.4, where x is the initial or final nucleotide position in a gene
segment with respect to the TCR locus origin (Supplementary Figure 1). The calculated angular distance
between the gene segments were further analyzed by determining the distance between V and D
segment in TRB.
These values were then used to determine the coordinates of the gene segments on the DNA helix, using
the trigonometric parameters, sine and cosine for the initial nucleotides (xi) relative to the locus origin.
When this was done for the angular distance, 2πx/10.4, and the resulting sine and cosine values plotted
against the angular distance (f (x) = Sin (2πx/10.4) or Cos ((2πx/10.4)) from locus origin no clear pattern
was observed, with the sine and cosine values for each of the positions distributed randomly along the
DNA strand (Figure 4A). Given the previously observed logarithmic ordering of the TCR loci, the
trigonometric functions of the natural logarithm of 5’-initial nucleotides angular distance from the locus
origin (Sin (Log (2πx/10.4) and Cos (Log (2πx/10.4)), were then plotted against the angular distance.
This demonstrated that the TCR gene segments were positioned on the locus in a sequential aligned
manner (Figure 4B) for both the TRA and TRB loci when the log-periodic functions of the nucleotide
positions are considered. Further, when the TRA and TRB sine and cosine plots were overlaid, these
plots were superimposable, supporting the earlier observation regarding the self-similar nature of these
loci (Figure 4C). These calculated trigonometric functions of TCR gene segments reveal that these loci
have a log-periodic nature.
T cell clonal frequency and its correlation with TRB gene segments

On the organization of T cell receptor loci. Toor A, Toor A, Manjili M. 10
The periodic nature of the TCR gene segments on the locus from an evolutionary standpoint may be the
result of TCR locus generation being an iterative process, which would be a logical conclusion given its
role in adaptive immunity of an organism. To determine whether the periodicity of the TCR loci was
reflected in the T cell clonal frequency, high throughput TRB sequencing data from 3 normal stem cell
transplant donors was used. Clonal frequency for unique TRB V and TRB J segments was plotted
against the angular distance (in radians) between the 5’ initial-nucleotide (2πxi / 10.4) of the TRB-D1 (&
TRB-D2) and the 3’ final-nucleotide (2πxf / 10.4) of the V segments or the 5’ start nucleotide of the J
segments. The T cell clonal frequency varied as a quasi-periodic function of the angular distance
between both TRB-D1 and D2 and the successive TRB-V segments, oscillating between high and low
clonal frequency values (Figure 5A). For the TRB-V clonal families, the peaks of clonal frequency
occurred approximately every 50,000-60,000 radians going in the 5’ direction from the D loci. Further,
the two J segment bearing areas of the TRB locus were approximately 5000 radians apart (in the 3’
direction) and demonstrated oscillating clonal frequency (Figure 5B). This finding was consistent
between unrelated stem cell donors, demonstrating very high expression levels for some loci,
intermediate for others and low or no expression in others (Supplementary Figure 2). This may be
interpreted as TCR gene V segment functional recombination probability amplitudes oscillating between
0 (no recombination) and 1 (very frequent recombination resulting in high clonal frequency) across the
locus.
Discussion.
The germ-line genomic T cell receptor (and immunoglobulin) loci have the unique characteristic in that
these can undergo DNA double strand break and recombination resulting in VDJ rearrangement which
results in the generation of numerous unique T cell clones with the ability to identify the wide array of
antigens. In recent years new insights have been gained into the mechanism of this very ordered
sequence of DNA rearrangement. This process results in a very large repertoire of immune effectors,
which is employed therapeutically in modalities such as SCT. Clinical outcomes following
transplantation in particular, and immune therapies in general have been modeled as stochastic
processes. However, recently a dynamical system model for immunological responses has been
proposed. This model postulates that immune responses are not stochastic, but are predictable and
accurately quantifiable as they evolve over time. In support of this, T cell repertoire has been recognized
as possessing characteristics of self-similar systems, and following power law distributions. If the T cell
repertoire is non-random and describable in mathematical terms, it is logical that T cell gene

On the organization of T cell receptor loci. Toor A, Toor A, Manjili M. 11
rearrangement contributes to the emergence of this order. This would imply that the TCR locus
organization lends itself to a mathematically quantifiable gene rearrangement process. In this
manuscript, quantitative uniformities are explored across the TCR loci, and their potential role in
shaping the T cell repertoire investigated.
T cell receptor rearrangement is a strictly ordered process, with the sequence of recombinatorial events
governed by a numeric, so-called ‘12/23 rule’. Considering the example of the T cell receptor β, the V,
D and J segments are flanked by conserved sequences called recombination signal sequences (RSS),
comprised of a heptameric and a nonameric sequence, which are interposed by either a 12 (RSS-12) or a
23 (RSS-23) base pair sequence. VDJ rearrangement is brought about by recombinase-activating gene-1
(RAG-1) and RAG-2 protein complexes, which always bring together segments with a RSS 12 with a
segment flanked by a RSS-23, not otherwise. Considering the TRB; Dβ segments are flanked by the
RSS sequences on both sides (5’, RSS-12 and 3’, RSS-23), Jβ segments on the 5’ end (RSS-12) and Vβ
segments on the 3’ end (RSS-23) [23]. In the series of events set off during T cell development, initially
a Dβ segment rearranges with one of the Jβ segments, then, the combined DJβ joins with a specific Vβ
segment to result in VDJβ rearrangement, yielding a unique T cell clone. Similar considerations hold for
TCRα, where Jα recombines with Vα, with the additional possibility of locus editing such that
alternative 5’ Vα may be rearranged to an alternative 3` Jα segment at a later time [24]. As elegant as
this system is, it does not completely explain either, how the order of recombination is determined or
what determines the variability in the use of various TCR gene segments encountered in the T cell
repertoire; for instance, why does the Dβ RSS-23 preferentially rearrange with Jβ RSS-12, and not the
Dβ RSS-12 with the Vβ RSS-23, and, why are clones with TRB V5-1 encountered much more
frequently than TRB V5-4 in the normal T cell repertoire? Further, in the TRD (TCR-δ) locus
rearrangement under normal circumstances there is strict regulation such that TRA and TRD segments
do not recombine with each other, despite the TRD locus being nested within the TRA locus. However,
when a TRA-Jα segment is ectopically introduced in the TRD locus at the TRD-Dδ segment position,
rearrangement of this ectopic TRA-J with TRD-V segments occurs, demonstrating that locus position,
rather than the actual sequence may have a deterministic role in the order of recombination [25]. This
raises the question of whether there are further structural motifs on the DNA molecule, which determine
the order of recombination. It is this question, that the log-periodic nature of the TCR locus elucidated
in our analysis may help answer.

On the organization of T cell receptor loci. Toor A, Toor A, Manjili M. 12
In nature there is a tendency for organizational patterns to be repeated over different scales of
measurement and for such patterns to be observed across different systems. Fractal organization in the
VDJ segment usage in the T cell repertoire of normal individuals has been observed with the diversity,
joining and variable gene segment usage defining a virtual 'structure' that results from recombination of
the T cell β receptor locus [10, 26, 27]. With this background the proportions between the V and J
segment size and inter-segment intron lengths were examined relative to each other and were found to
be similar. It is likely that the proportional distribution of V and J segment size and spacing between
individual segments (fractal organization) in this instance serves to order the ensuing rearrangement
process. In essence, the V segments are similar in their organization to the J segment, and from an
evolutionary standpoint the V segment sequence represents a logarithmically magnified version of the J
segment sequence. This may explain why in the order of gene segment rearrangement, Dβ to Jβ and DJβ
or Jα to Vβ/α segments, RAG complexes are always directed from the shorter, closely spaced J
segments to the longer, more dispersed V segments, such that the reverse does not transpire in the course
of normal recombination. Further, the logarithmic scaling implies that the distribution of these size-
ordered segments is always similar in their respective sections of the TCR locus, which ensures that
RAG complexes do not have to ‘scan’ an entire sequence of nucleotides to randomly encounter a coding
segment, but can potentially align with relevant segments, skipping over given lengths of intronic
material. This would then provide an additional mechanism to complement the 12/23 rule, and to ensure
fidelity of recombination. Presumably the epigenetic mechanisms such as RAG2 interacting with
methylated of histone3-K4, further facilitates the navigation along the TCR loci to make the process a
model of efficiency. Conformational changes in the locus, which bring V segments in apposition to J
segments, may also be dictated by the logarithmic relationship. This hypothesis, if true, suggests that the
origin of the fractal organization of the T cell repertoire is within the arrangement of the TCR loci
resulting in an ordered recombination process. The log-periodic nature of other fractal phenomenon
encountered in nature supports this postulate [28, 29].
High-throughput sequencing of TRB has demonstrated a differential representation of the different gene
segments in the T cell clonal repertoire, indicating that some sequences are used at a higher frequency
than others [3, 4, 10]. This has been observed for TCRγ as well as TCRβ and has been seen for both J
and V segments [30]. This recombination bias affects both in-frame and out-of-frame recombined
sequences, suggesting that it is not a consequence of thymic selection, nor HLA restriction, rather is a
result of recombinatorial usage bias, or ranking of various segments. Figure 4, demonstrates this
phenomenon, and it is also reflected in the power law distribution of the final T cell clonal distribution

On the organization of T cell receptor loci. Toor A, Toor A, Manjili M. 13
observed. The relationship between TCR locus organization and segment selection in this rearrangement
process and its impact on the T cell repertoire generation has been a focus of intensive study in the
recent years. Recently a biophysical model describing yeast chromosome conformation has been applied
to the murine TCR β−D and -J segment and the derived model based on ‘genomic distance’ between
these segments has partially recapitulated the observed bias in J segment usage [31]. This strengthens
the notion that chromatin conformation has a formative role in the T cell repertoire generation.
Regardless of the mechanism of recombination it has become obvious that the T cell repertoire that
emerges has a ‘biased’ VDJ segment usage, with certain segments being used more frequently than
others. This suggests that these segments may be more efficiently rearranged resulting in their over
representation in the repertoire and vice versa. Could this in part, be a function of the intrinsic position
of the segment on the DNA strand versus being entirely determined by extrinsic factors, such as
epigenetic influence and segment localization on the chromosome?
Given the emergence of the constant π in the equations describing the fractal nature of the T cell
repertoire in normal stem cell donors and the periodic nature of TCR gene segments on the TCR locus,
their relative positions were examined using trigonometric functions to account for the helical nature of
DNA. Similarity was observed in the relative location of the V, D and J segments across the TRA and
TRB loci when they were examined using logarithmic scaling, with increasingly complex waveforms
observed as higher order harmonics were evaluated (data not shown). There are several important
implications of this observation. First, analogous to the phenomenon of superposition (constructive or
destructive interference) observed in the mechanical and electromagnetic waves, one may consider that
relative position of a particular segment, reflected by the sine and cosine functions and angular distance
from the rearranging segment (Dβ or Jα), may influence its usage in repertoire generation resulting in
the periodic distribution of the V and J segment usage in T cell clones when the locus is interrogated
from the 5` to 3` end. Essentially, this means that using analytic techniques such as Fourier’s series,
probability amplitudes may be determined for the various gene segments on the TCR loci based on their
positions. It may be very likely that the recombination is most frequent for gene segments that occur at a
certain ‘harmonic’ frequency. As an example in the data presented the TRB-V segment clonal frequency
appears to oscillate with a wavelength of ~50-60,000 radians from the TRB-D segment. It may be
speculated that the gene segment distribution periods represent optimal energy distribution for
recombination to occur on the long helical DNA molecule, analogous to the interference phenomenon
encountered in wave mechanics. This is plausible because the DNA double helices may represent two
superposed waves, and the gene segment location may lend itself to either constructive or destructive
On the organization of T cell receptor loci. Toor A, Toor A, Manjili M. 14
interference, impacting the interaction with RAG genes and recombination potential. This would in turn
determine the probability amplitude of that gene segment being represented in the final T cell clonal
repertoire (Figure 6).
In this hypothetical paper we demonstrate that the TCR loci have an iterative, logarithmically scaled
periodic nature when the gene segment distribution is considered. This means that with minimal
genomic material an organism may efficiently generate a vast receptor array, protecting the organism
from populations of antigenically diverse pathogens it is likely to encounter in its lifetime. Secondly,
nature has a tendency to be conservative in terms of using the same basic processes with minor variation
in different settings to generate variability observed. The data presented here make it possible to
consider variations in DNA expression as a partial function of the wave-mechanical properties of the
DNA double helix. Further it may be postulated that if self-similarity is true for the distribution of gene
segments within a locus than it is likely to be true for the genome as a whole, and the distribution of
exons and introns in the genome may be similarly considered. The expression of these genes may then
be determined by the sum of the harmonics of the relevant genes and be predictable using Fourier
analysis. This work demonstrates that the T cell receptor loci, and by extension the T cell receptor
repertoire is not an accident of nature, a result of random mutations, rather it is a mathematically ordered
iterative process. In essence evolution of the immune system conferring a survival advantage to
organisms in higher order phyla. These findings strengthen the argument that immune responses, such as
following SCT represents an example of an ordered dynamical systems and not a stochastic process.
On the organization of T cell receptor loci. Toor A, Toor A, Manjili M. 15
Acknowledgments: The authors gratefully acknowledge Ms. Kassi Avent, and Ms. Jennifer Berrie for
technical help in performing the high throughput TRB DNA sequencing. The TRB sequencing was
performed by Adaptive biotechnologies, Seattle, WA. Mr. Abdullah Toor collected the data and did
most of the calculations reported in the paper. Dr. Amir Toor developed the idea and wrote the paper, as
well as performing some of the calculations. Dr. Masoud Manjili supervised the TRB sequencing and
critically reviewed the manuscript.

On the organization of T cell receptor loci. Toor A, Toor A, Manjili M. 16
Figures:
Figure 1. TCR α (TRA) and β (TRB) fractal dimension calculated for each variable and joining segment
[Formula 1]. Values at each point are plotted along the nucleotide positions on the locus. TCR δ region on the
TRA locus is excluded, as are the D and C segments for the TRB locus.
0"
0.5"
1"
1.5"
2"
2.5"
91557" 214,638" 354,936" 515,043" 651,174"Consecu(ve*TCR*V*and*J*gene*segment*posi(ons*bp*
TRA*&*TRB*fractal*dimension*
TRA"
TRB"

On the organization of T cell receptor loci. Toor A, Toor A, Manjili M. 17
Figure 2. Relative position of the first nucleotide of each TRA gene segment from the 3’ end (blue area) of the
locus plotted against spacing (red area) following that TCR gene segments (Y-axis, Log10-scale). This
demonstrates self-similarity in the gene segment size and spacing distribution across the V (right) and J (left) loci,
with the two halves of the figure demonstrating symmetry. Log scale used.
1"
10"
100"
1,000"
10,000"
100,000"
1,000,000"
1"3" 5"
7"9"
11"
13"
15"
17"
19"
21"
23"
25"
27"
29"
31"
33"
35"
37"
39"
41"
43"
45"
47"
49"
51"53"
55"57"
59"61"63"65"67"69"
71"73"
75"
77"
79"
81"
83"
85"
87"
89"
91"
93"
95"
97"
99"
101"
103"
105"
107"
109"
111"
113"115"
117"119" 121" 123"
V J

On the organization of T cell receptor loci. Toor A, Toor A, Manjili M. 18
Figure 3. Relative recombination spacing [formula 2] for successive TRB-V segments with TRB-D1(A). Spacing for each V segment plotted in succession starting from V1 to V29. V30 excluded because of its location 3` to the D segments. (B & C) RRS for each of the 40 TRA-V segments with the first (B) and last (C) J segment.
A
y"="$1.636ln(x)"+"7.9179"R²"="0.98829"
0"
1"
2"
3"
4"
5"
6"
7"
8"
9"
0" 10" 20" 30" 40" 50" 60" 70"
Rela%v
e'recombina
%on'spacing'
TRB'V'segments'5''8'3''
B
y"="$1.361ln(x)"+"6.536"R²"="0.97172"
0"
1"
2"
3"
4"
5"
6"
7"
8"
0" 10" 20" 30" 40" 50" 60"
RRS#TR
A&J1&
TRA&V&segments&5'#3'&
C
y"="$1.272ln(x)"+"6.1101"R²"="0.97172"
0"
1"
2"
3"
4"
5"
6"
7"
8"
0" 10" 20" 30" 40" 50" 60"
RRS#TR
A&J61&
TRA&V&segments&5''&

On the organization of T cell receptor loci. Toor A, Toor A, Manjili M. 19
Figure 4. Logarithmic ordering of periodic TRB gene segments. (A) Sine (blue diamonds) and cosine functions (red) of TRB gene segment 5’ initial nucleotide’s angular distance from locus origin (5’ end) plotted across the TCR loci. (B) Sine (orange diamonds for TRB; blue for TRA) and cosine functions (blue for TRB; red for TRA) of the natural logarithm of TRB gene segment 5’ first nucleotide and TRA 3’ last nucleotide angular distance from locus origin (5’ end) plotted across the TCR loci. (C) TRA and TRB sine and cosine coordinates superimposed, demonstrating self-similarity across the two loci. A
!1.5%
!1.0%
!0.5%
0.0%
0.5%
1.0%
1.5%
0.0% 50000.0% 100000.0% 150000.0% 200000.0% 250000.0% 300000.0% 350000.0% 400000.0% 450000.0%
Cos/Sin(of(TRB
(gen
e(segm
ents(
TRB(locus(
B
!1.5%
!1%
!0.5%
0%
0.5%
1%
1.5%
0.0% 50000.0% 100000.0% 150000.0% 200000.0% 250000.0% 300000.0% 350000.0% 400000.0% 450000.0%
Sin/Co
s(Gen
e(Segm
ents(
TRB(locus(5'63'(
!1.5%
!1%
!0.5%
0%
0.5%
1%
1.5%
0.0% 100000.0% 200000.0% 300000.0% 400000.0% 500000.0% 600000.0% 700000.0%
Sin/Co
s(Gen
e(Segm
ents(
TRA(locus(5'63'(
C.
!1.5%
!1%
!0.5%
0%
0.5%
1%
1.5%
0.0% 100000.0% 200000.0% 300000.0% 400000.0% 500000.0% 600000.0% 700000.0%Sin/Co
s(
TRA/TRB(loci(

On the organization of T cell receptor loci. Toor A, Toor A, Manjili M. 20
Figure 5. T cell clonal frequency as a periodic function of the V and J gene segment positions on the TRB locus. (A) TRB-V clonal frequency demonstrates quasi-periodicity (irregular) as a function of angular distance between TRB-D1 and successive TRB-V segments from V29 to V1. This represents periodic fluctuation in functional recombination probability amplitude across the locus. (B) TRB-J clonal frequency as a function of the angular distance between TRB-D1 and successive TRB-J segments. Both X and Y-axis magnitude different by approximately an order of magnitude (one-log) between the two graphs. A
0"
200,000"
400,000"
600,000"
800,000"
1,000,000"
1,200,000"
1,400,000"
1,600,000"
1,800,000"
0.0" 50000.0" 100000.0" 150000.0" 200000.0" 250000.0" 300000.0" 350000.0"
TRB$V&clon
al&freq
uency&(cop
y&nu
mbe
r)&
Angular&spacing&TRB&D1$TRB&V&segments&(radians)&&
B
0"
500000"
1000000"
1500000"
2000000"
2500000"
3000000"
3500000"
'7000.0" '6000.0" '5000.0" '4000.0" '3000.0" '2000.0" '1000.0" 0.0"
TRB$J&clona
l&frequ
ency&(cop
y&nu
mbe
r)&
Angular&spacing&TRB&D1$TRB&J&segments&(radians)&

On the organization of T cell receptor loci. Toor A, Toor A, Manjili M. 21
Figure 6. A model depicting T cell receptor organization and its influence on gene segment recombination probability. TCR V segments are separated by long intervals, J segments by shorter intervals (dashed lines); the ratio of log segment length to log spacing is approximately ~1.4 for V segments and ~1.3 for J segments. Relative interval between successive V segments and the J segments in the TRA locus (top blue curve), declines logarithmically with a slope of ~1.3. Sine and cosine function value of the start nucleotides of each V segment extrapolated to the sense (green) and antisense (blue) DNA strands, demonstrate that the gene segments are accurately aligned once the logarithmic organization is accounted for. Hypothetically the segment location on the two DNA helices being in-phase or out-of-phase may impact the energetics of DNA-RAG enzyme interaction and thus the probability amplitude (orange line, going from 0 to 1) for gene segment recombination analogous to wave interference phenomenon. In the model depicted, V1 location on the two helices is out of phase, V2 is partially in phase and V3 is completely in phase. Closely clustered together J segments are more likely to be in phase.
J V
1
3 2
1
2
5’ 3’
1
0.5
0
5’ 3’

On the organization of T cell receptor loci. Toor A, Toor A, Manjili M. 22
Supplementary Table 1. TRB locus. Source: http://www.ncbi.nlm.nih.gov/nuccore/114841177?report=graph
Gene$segment Size$of$gene$segment Start$position End$postion Relative$position$from$locus$end Spacing$between$segmentsV1* 450 91557 92,006 575,783 N/AV2 435 93,552 93,986 573,788 1,546V3J1 460 101,150 101,609 566190 7,164V4J1 454 105,774 106,227 561566 4,165V5J1 470 113,622 114,091 553718 7,395V6J1 433 120,903 121,335 546437 6,812V7J1* 489 124,764 125,252 542576 3,429V4J2 454 138,078 138,531 529262 12,826V6J2 433 141,898 142,330 525442 3,367V3J2* 460 151,879 152,338 515461 9,549V4J3 454 155,338 155,791 512002 3,000V6J3 433 163,579 164,011 503761 7,788V7J2 497 167,212 167,708 500128 3,201V8J1* 287 173,318 173,604 494022 5,610V5J2* 441 187,166 187,606 480174 13,562V6J4 435 195,522 195,956 471818 7,916V7J3 457 199,093 199,549 468247 3,137V8J2* 461 200,895 201,355 466445 1,346V5J3* 467 203,911 204,377 463429 2,556V9 475 206,647 207,121 460693 2,270V10J1 450 214,638 215,087 452702 7,517V11J1 478 222,397 222,874 444943 7,310V12J1* 443 229,930 230,372 437410 7,056V10J2 450 239,704 240,153 427636 9,332V11J2 439 248,664 249,102 418676 8,511V12J2* 443 255,591 256,033 411749 6,489V6J5 436 265,721 266,156 401619 9,688V7J4 462 269,879 270,340 397461 3,723V5J4 465 277,826 278,290 389514 7,486V6J6 433 284,296 284,728 383044 6,006V7J5* 472 288,811 289,282 378529 4,083V5J5 465 297,271 297,735 370069 7,989V6J7* 433 302,579 303,011 364761 4,844V7J6 493 306,894 307,386 360446 3,883V5J6 466 314,783 315,248 352557 7,397V6J8 429 322,095 322,523 345245 6,847V7J7 502 326,337 326,838 341003 3,814V5J7 467 334,800 335,266 332540 7,962V6J9 432 342,106 342,537 325234 6,840V7J8 484 346,720 347,203 320620 4,183V5J8 467 354,936 355,402 312404 7,733V7J9 473 364,137 364,609 303203 8,735V13 484 370,656 371,139 296684 6,047V10J3 450 379,068 379,517 288272 7,929V11J3 438 389,716 390,153 277624 10,199V12J3 447 395,318 395,764 272022 5,165V12J4 447 398,641 399,087 268699 2,877V12J5 447 415,832 416,278 251508 16,745V14 433 422,775 423,207 244565 6,497V15 469 427,850 428,318 239490 4,643V16* 454 432,859 433,312 234481 4,541V17 735 436,475 437,209 230865 3,163V18 619 450,546 451,164 216794 13,337V19 476 453,806 454,281 213534 2,642V20J1 673 461,476 462,148 205864 7,195V21J1* 468 471,659 472,126 195681 9,511V22J1* 451 476,480 476,930 190860 4,354V23J1* 504 480,699 481,202 186641 3,769V24J1 477 490,040 490,516 177300 8,838V25J1 468 504,415 504,882 162925 13,899VA* 455 515,043 515,497 152297 10,161V26* 485 529,336 529,820 138004 13,839VB* 541 545,032 545,572 122308 15,212V27 473 549,038 549,510 118302 3,466V28 481 554,328 554,808 113012 4,818V29J1 614 573,946 574,559 93394 19,138D1 12 640,268 640,279 27,072 65,709J1J1 48 640,935 640,982 26,405 656J1J2 48 641,072 641,119 26,268 90J1J3 50 641,685 641,734 25,655 566J1J4 51 642,280 642,330 25,060 546J1J5 50 642,553 642,602 24,787 223J1J6 53 643,043 643,095 24,297 441C1 1,448 645,749 647,196 21,591 2,654D2 16 649,760 649,775 17,580 2,564J2J1 50 650,420 650,469 16,920 645J2J2 51 650,615 650,665 16,725 146J2J2P* 46 650,752 650,797 16,588 87J2J3 49 650,902 650,950 16,438 105J2J4 50 651,053 651,102 16,287 103J2J5 120 651,174 651,293 16,166 72J2J6 81 651,266 651,346 16,074 J27J2J7 47 651,511 651,557 15,829 165C2 1,489 655,095 656,583 12,245 3,538V30 701 666,640 667,340 700 10,057

On the organization of T cell receptor loci. Toor A, Toor A, Manjili M. 23
Supplementary table 2. TRA locus. Source: http://www.ncbi.nlm.nih.gov/nuccore/99345462?report=graph
Gene$segment Size$of$gene$segment Start$position End$postion Relative$position$from$locus$end Spacing$between$segmentsV1<1 703 145,152 145,854 931,014 N/AV1<2 614 166,288 166,901 909,878 20,434V2 513 235,649 236,161 840,517 68,748V3 433 247,231 247,663 828,935 11,070V4 764 259,596 260,359 816,570 11,933V5$ 516 272,569 273,084 803,597 12,210V6 528 291,888 292,415 784,278 18,804V7 511 306,305 306,815 769,861 13,890V8<1 468 320,686 321,153 755,480 13,871V9<1 637 334,647 335,283 741,519 13,494V10 568 348,767 349,334 727,399 13,484V11* 532 352,787 353,318 723,379 3,453V12<1 532 364,520 365,051 711,646 11,202V8<2 460 370,039 370,498 706,127 4,988V8<3 449 375,830 376,278 700,336 5,332V13<1 504 392,138 392,641 684,028 15,860V12<2 544 411,234 411,777 664,932 18,593V8<4 477 417,836 418,312 658,330 6,059V8<5* 1,522 426,352 427,873 649,814 8,040V13<2 499 441,528 442,026 634,638 13,655V14DV4 514 447,409 447,922 628,757 5,383V9<2 480 464,464 464,943 611,702 16,542V15* 544 473,429 473,972 602,737 8,486V12<3 555 488,831 489,385 587,335 14,859V8<6 442 502,014 502,455 574,152 12,629V16 443 513,830 514,272 562,336 11,375V17 483 521,020 521,502 555,146 6,748V18 463 526,545 527,007 549,621 5,043V19 553 530,963 531,515 545,203 3,956V20 491 564,004 564,494 512,162 32,489V21 536 575,875 576,410 500,291 11,381V22 519 594,048 594,566 482,118 17,638V23DV6 510 609,824 610,333 466,342 15,258DV1 570 619,422 619,991 371,242 9,089V24 504 628,715 629,218 447,451 8,724V25 609 635,471 636,079 440,695 6,253V26<1 759 646,580 647,338 429,586 10,501V8<7 482 655,610 656,091 420,556 8,272V27 542 671,141 671,682 405,025 15,050V28* 560 678,107 678,666 398,059 6,425V30 560 691,420 691,979 384,746 12,754V31* 592 700,265 700,856 375,901 8,286V32* 500 708,553 709,052 367,613 7,697V33* 557 713,147 713,703 363,019 4,095V26<2 786 725,572 726,357 350,594 11,869V34 596 730,525 731,120 345,641 4,168V35 580 744,887 745,466 331,279 13,767V37* 1,425 788,727 790,151 287,439 43,261V38<1 593 794,949 795,541 281,217 4,798V39 500 827,034 827,533 249,132 31,493V40 430 838,017 838,446 238,149 10,484V41 504 843,715 844,218 232,451 5,269DV2 497 946,632 947,128 44,032 102,414DD1 8 962,634 962,641 28,030 15,506DD2 9 963,094 963,102 27,570 453DD3 13 973,200 973,212 17,464 10,098DJ1 51 974,176 974,226 16,488 964DJ4$ 48 979,336 979,383 11,328 5,110DJ2 54 980,776 980,829 9,888 1,393DJ3 59 983,185 983,243 7,479 2,356DC 3,664 987,001 990,664 3,663 3,758DV3 574 993,128 993,701 <2,464 2,464J61 60 999,401 999,460 76,765 5,700J60* 57 1,000,391 1,000,447 75,775 931J59 54 1,000,638 1,000,691 75,528 191J58 63 1,001,791 1,001,853 74,375 1,100J57 63 1,002,956 1,003,018 73,210 1,103J56 62 1,003,605 1,003,666 72,561 587J55* 57 1,005,781 1,005,837 70,385 2,115J54 60 1,006,371 1,006,430 69,795 534J53 66 1,007,088 1,007,153 69,078 658J52 69 1,010,311 1,010,379 65,855 3,158J51 63 1,011,266 1,011,328 64,900 887J50 60 1,012,676 1,012,735 63,490 1,348J49 56 1,013,571 1,013,626 62,595 836J48 63 1,014,574 1,014,636 61,592 948J47 57 1,016,933 1,016,989 59,233 2,297J46 63 1,017,484 1,017,546 58,682 495J45 66 1,018,006 1,018,071 58,160 460J44 63 1,018,901 1,018,963 57,265 830J43 54 1,019,991 1,020,044 56,175 1,028J42 66 1,020,967 1,021,032 55,199 923J41 62 1,021,737 1,021,798 54,429 705J40 61 1,023,767 1,023,827 52,399 1,969J39 63 1,025,680 1,025,742 50,486 1,853J38 62 1,026,310 1,026,371 49,856 568J37 62 1,027,830 1,027,891 48,336 1,459J36 59 1,029,190 1,029,248 46,976 1,299J35 59 1,030,722 1,030,780 45,444 1,474J34 58 1,031,744 1,031,801 44,422 964J33 57 1,032,680 1,032,736 43,486 879J32 66 1,033,418 1,033,483 42,748 682J31 57 1,035,044 1,035,100 41,122 1,561J30 57 1,036,927 1,036,983 39,239 1,827J29 60 1,038,014 1,038,073 38,152 1,031J28 66 1,039,694 1,039,759 36,472 1,621J27 59 1,040,344 1,040,402 35,822 585J26 60 1,042,517 1,042,576 33,649 2,115J25 60 1,042,883 1,042,942 33,283 307J24 63 1,044,040 1,044,102 32,126 1,098J23 63 1,044,487 1,044,549 31,679 385J22 63 1,046,109 1,046,171 30,057 1,560J21 55 1,047,666 1,047,720 28,500 1,495J20 57 1,048,389 1,048,445 27,777 669J19 60 1,049,326 1,049,385 26,840 881J18 66 1,049,713 1,049,778 26,453 328J17 63 1,050,905 1,050,967 25,261 1,127J16 60 1,052,580 1,052,639 23,586 1,613J15 60 1,053,673 1,053,732 22,493 1,034J14 52 1,054,369 1,054,420 21,797 637J13 63 1,055,117 1,055,179 21,049 697J12 60 1,055,980 1,056,039 20,186 801J11 60 1,056,543 1,056,602 19,623 504J10 64 1,057,536 1,057,599 18,630 934J9 61 1,059,593 1,059,653 16,573 1,994J8 60 1,060,183 1,060,242 15,983 530J7 59 1,061,658 1,061,716 14,508 1,416J6 62 1,063,107 1,063,168 13,059 1,391J5 60 1,064,281 1,064,340 11,885 1,113J4 63 1,066,233 1,066,295 9,933 1,893J3 62 1,067,213 1,067,274 8,953 918J2 66 1,068,106 1,068,171 8,060 832J1 62 1,069,072 1,069,133 7,094 901C 4,637 1,071,538 1,076,174 4,628 2,405
On the organization of T cell receptor loci. Toor A, Toor A, Manjili M. 24
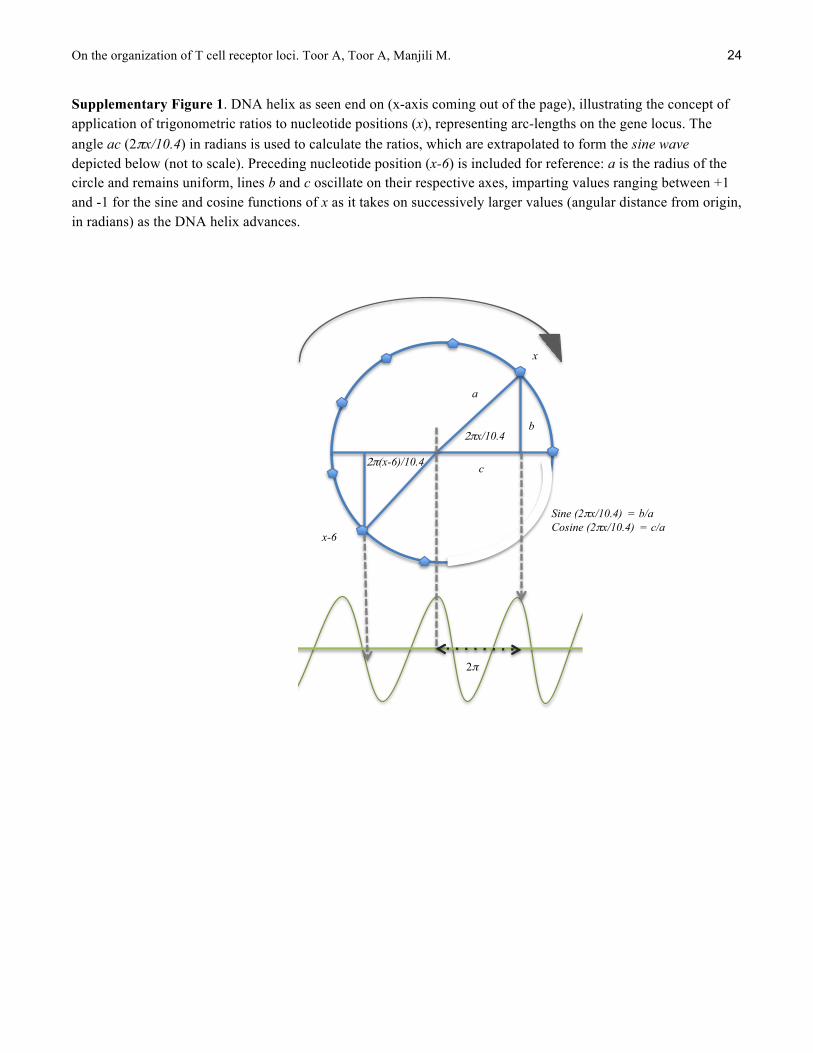
Supplementary Figure 1. DNA helix as seen end on (x-axis coming out of the page), illustrating the concept of application of trigonometric ratios to nucleotide positions (x), representing arc-lengths on the gene locus. The angle ac (2πx/10.4) in radians is used to calculate the ratios, which are extrapolated to form the sine wave depicted below (not to scale). Preceding nucleotide position (x-6) is included for reference: a is the radius of the circle and remains uniform, lines b and c oscillate on their respective axes, imparting values ranging between +1 and -1 for the sine and cosine functions of x as it takes on successively larger values (angular distance from origin, in radians) as the DNA helix advances.
c
b
a
Sine (2πx/10.4) = b/a Cosine (2πx/10.4) = c/a
2π!
2πx/10.4
x
x-6
2π(x-6)/10.4

On the organization of T cell receptor loci. Toor A, Toor A, Manjili M. 25
Supplementary figure 2. TRB V clonal frequency measured by high-throughput sequencing of cDNA isolated
from circulating CD3+ cells from 6 normal stem cell donors
On the organization of T cell receptor loci. Toor A, Toor A, Manjili M. 26
References.
1. Felix NJ, Allen PM. Specificity of T-cell alloreactivity. Nat Rev Immunol 2007. 7(12):942-53. 2. Danska JS, Livingstone AM, Paragas V, Ishihara T, Fathman CG. The presumptive CDR3 regions of both T cell receptor alpha and beta chains determine T cell specificity for myoglobin peptides. J Exp Med 1990. 172(1):27-33. 3. http://www.imgt.org/IMGTrepertoire/LocusGenes/index.html#C 4. Robins HS, Srivastava SK, Campregher PV, Turtle CJ, Andriesen J, Riddell SR, Carlson CS, Warren EH. Overlap and effective size of the human CD8+ T cell receptor repertoire. Sci Transl Med. 2010. 2(47):47ra64. 5. Freeman JD, Warren RL, Webb JR, Nelson BH, Holt RA. Profiling the T-cell receptor beta-chain repertoire by massively parallel sequencing. Genome Res. 2009 Oct;19(10):1817-24. doi: 10.1101/gr.092924.109. 6. Toor AA, Sabo RT, Chung HM, Roberts C, Manjili RH, Song S, Williams DC Jr, Edmiston W, Gatesman ML, Edwards RW, Ferreira-Gonzalez A, Clark WB, Neale MC, McCarty JM, Manjili MH. Favorable Outcomes in Patients with High Donor-Derived T Cell Count after in Vivo T Cell-Depleted Reduced-Intensity Allogeneic Stem Cell Transplantation. Biology of Blood and Marrow Transplantation 2012. 18(5):794-804. 7. Pavletic ZS, Joshi SS, Pirruccello SJ, Tarantolo SR, Kollath J, Reed EC, et al. Lymphocyte reconstitution after allogeneic blood stem cell transplantation for hematologic malignancies. Bone Marrow Transplant 1998. 21:33-41. 8. Amir A. Toor, Roy T. Sabo, Catherine H. Roberts, Bonny L. Moore, Salman R. Salman, Allison F. Scalora, May T. Aziz, Ali S. Shubar Ali, Charles E. Hall, Jeremy Meier, Radhika M. Thorn, Elaine Wang, Shiyu Song, Kristin Miller, Kathryn Rizzo, William B. Clark, John M. McCarty, Harold M. Chung, Masoud H. Manjili, Michael C. Neale. Dynamical System Modeling Of Immune Reconstitution Following Allogeneic Stem Cell Transplantation Identifies Patients At Risk For Adverse Outcomes. arXiv:1412.4416 Quantitative Methods (q-bio.QM) 9. Toor AA, Kobulnicky JD, Salman S, Roberts CH, Jameson-Lee M, Meier J, Scalora A, Sheth N, Koparde V, Serrano M, Buck GA, Clark WB, McCarty JM, Chung HM, Manjili MH, Sabo RT and Neale MC. Stem Cell Transplantation As A Dynamical System: Are Clinical Outcomes Deterministic? Frontiers in Immunology, 2014; 5:613. 10. Meier J, Roberts C, Avent K, Hazlett A, Berrie J, Payne K, Hamm D, Desmarais C, Sanders C, Hogan KT, Archer KJ, Manjili MH, Toor AA. Fractal Organization of the Human T Cell Repertoire in Health and Following Stem Cell Transplantation. Biology of Blood and Marrow Transplantation 2013. 19(3):366-377. 11. Adam JA. Mathematics in Nature: Modeling Patterns in the Natural World (Princeton University Press, Princeton, 2003), pp.336-40. 12. West GB, Brown JH, Enquist BJ. The fourth dimension of life: fractal geometry and allometric scaling of organisms. Science. 1999 Jun 4;284(5420):1677-9. 13. Tălu S. Fractal analysis of normal retinal vascular network. Oftalmologia 2011. 55(4):11-6. 14. West BJ. Fractal physiology and the fractional calculus: a perspective. Front Physiol 2010.1:12. 15. Gallos LK, Sigman M, Makse HA. The conundrum of functional brain networks: small-world efficiency or fractal modularity. Front Physiol. 2012. 3:123. 16. Lieberman-Aiden E, van Berkum NL, Williams L, Imakaev M, Ragoczy T, Telling A, Amit I, Lajoie BR, Sabo PJ, Dorschner MO, Sandstrom R, Bernstein B, Bender MA, Groudine M, Gnirke A, Stamatoyannopoulos J, Mirny LA, Lander ES, Dekker J. Comprehensive mapping of long-range interactions reveals folding principles of the human genome. Science. 2009. 326(5950):289-93. .

On the organization of T cell receptor loci. Toor A, Toor A, Manjili M. 27
17. Ouyang Z, Wang C, She ZS. Scaling and hierarchical structures in DNA sequences. Phys Rev Lett. 2004. 93(7):078103. 18. Albrecht-Buehler G. Fractal genome sequences. Gene. 2012. 498(1):20-7. 19. Moreno PA, Vélez PE, Martínez E, Garreta LE, Díaz N, Amador S, Tischer I, Gutiérrez JM, Naik AK, Tobar F, García F. The human genome: a multifractal analysis. BMC Genomics. 2011. 12:506. 20. Annunziato, A. (2008) DNA packaging: Nucleosomes and chromatin. Nature Education 1(1):26 21. Robins HS, Campregher PV, Srivastava SK, et al. Comprehensive assessment of T-cell receptor beta-chain diversity in alphabeta T Cells. Blood. 2009. 114,4099-107. 22. Robins H, Desmarais C, Matthis J, et al. Ultra-sensitive detection of rare T cell clones. J Immunol Methods. 2012. 375(1–2),14-9. 23. Franchini DM, Benoukraf T, Jaeger S, Ferrier P, Payet-Bornet D. Initiation of V(D)J recombination by Dbeta-associated recombination signal sequences: a critical control point in TCRbeta gene assembly. PLoS One. 2009. 4(2):e4575. 24. Shih HY, Hao B, Krangel MS. Orchestrating T-cell receptor α gene assembly through changes in chromatin structure and organization. Immunol Res. 2011. 49(1-3):192-201. 25. Lee YN, Alt FW, Reyes J, Gleason M, Zarrin AA, Jung D. Differential utilization of T cell receptor TCR alpha/TCR delta locus variable region gene segments is mediated by accessibility. Proc Natl Acad Sci U S A. 2009.106(41):17487-92. 26. Naumov YN, Naumova EN, Hogan KT, Selin LK, Gorski J. A fractal clonotype distribution in the CD8+ memory T cell repertoire could optimize potential for immune responses. J Immunol. 2003. 170(8),3994-4001. 27. Bolkhovskaya OV, Zorin DY, Ivanchenko MV. Assessing T cell clonal size distribution: A non-parametric approach. PLoS One. 2014. 9(9): e108658. 28. Gluzman, S. and Sornette, D. Log-periodic route to fractal functions. PhysRevE. 2002. 65 (3) 036142 29. Didier Sornette. Discrete scale invariance and complex dimensions. Physics Reports, 1998. 297 (5): 239–270 30. Sherwood AM, Desmarais C, Livingston RJ, Andriesen J, Haussler M, Carlson CS, Robins H. Deep sequencing of the human TCRγ and TCRβ repertoires suggests that TCRβ rearranges after αβ and γδ T cell commitment. Sci Transl Med. 2011 Jul 6;3(90):90ra61. 31. Ndifon W, Gal H, Shifrut E, Aharoni R, Yissachar N, Waysbort N, Reich-Zeliger S, Arnon R, Friedman N. Chromatin conformation governs T-cell receptor Jβ gene segment usage. Proc Natl Acad Sci U S A. 2012. 109(39):15865-70.
Related Documents


