RESEARCH ARTICLE On the Frontline: Tracking Ocean Acidification in an Alaskan Shellfish Hatchery Wiley Evans 1,2 *, Jeremy T. Mathis 1,2 , Jacqueline Ramsay 3 , Jeff Hetrick 3 1 National Oceanic and Atmospheric Administration, Pacific Marine Environmental Laboratory, Seattle, Washington, United States of America, 2 Ocean Acidification Research Center, School of Fisheries and Ocean Sciences, University of Alaska Fairbanks, Fairbanks, Alaska, United States of America, 3 Alutiiq Pride Shellfish Hatchery, Seward, Alaska, United States of America * [email protected] Abstract The invasion of anthropogenic carbon dioxide (CO 2 ) into the ocean is shifting the marine carbonate system such that saturation states of calcium carbonate (CaCO 3 ) minerals are decreasing, and this is having a detrimental impact on early life stages of select shellfish species. The global, secular decrease in CaCO 3 saturation states is occurring on top of a backdrop of large natural variability in coastal settings; progressively shifting the envelope of variability and leading to longer and more frequent exposure to adverse conditions. This is a great concern in the State of Alaska, a high-latitude setting vulnerable to rapid changes in the marine carbonate system, where an emerging shellfish industry plans major growth over the coming decades. Currently, the Alutiiq Pride Shellfish Hatchery (APSH) in Seward, Alaska is the only hatchery in the state, and produces many shellfish species with early life stages known to be sensitive to low CaCO 3 saturation states. Here we present the first land- based OA measurements made in an Alaskan shellfish hatchery, and detail the trends in the saturation state of aragonite (Ω arag ), the more soluble form of CaCO 3 , over a 10-month period in the APSH seawater supply. These data indicate the largest changes are on the seasonal time scale, with extended periods of sub-optimal Ω arag levels (Ω arag < 1.5) in winter and autumn associated with elevated water column respiration and short-lived runoff events, respectively. The data pinpoint a 5-month window of reprieve with favorable Ω arag conditions above the sub-optimal Ω arag threshold, which under predicted upper-bound CO 2 emissions trajectories is estimated to close by 2040. To date, many species in production at APSH remain untested in their response to OA, and the data presented here establish the current conditions at APSH as well as provide a framework for hatchery-based measure- ments in Alaska. The current and expected conditions seen at APSH are essential to con- sider for this developing Alaskan industry. PLOS ONE | DOI:10.1371/journal.pone.0130384 July 1, 2015 1 / 14 OPEN ACCESS Citation: Evans W, Mathis JT, Ramsay J, Hetrick J (2015) On the Frontline: Tracking Ocean Acidification in an Alaskan Shellfish Hatchery. PLoS ONE 10(7): e0130384. doi:10.1371/journal.pone.0130384 Academic Editor: Erik V. Thuesen, The Evergreen State College, UNITED STATES Received: February 3, 2015 Accepted: May 20, 2015 Published: July 1, 2015 Copyright: This is an open access article, free of all copyright, and may be freely reproduced, distributed, transmitted, modified, built upon, or otherwise used by anyone for any lawful purpose. The work is made available under the Creative Commons CC0 public domain dedication. Data Availability Statement: Both the hatchery data and the TA and salinity cruise data presented in this paper are available through AOOS (http://portal.aoos. org/alaska-statewide.php#module-search?page= 1&tagId=118&q=). This URL will take the reader to both datasets. In addition, the validation TA and salinity samples are included as Supporting Information (S1 Table). Funding: This work was funded by the Alaska Ocean Observing System (AOOS) and the National Oceanic and Atmospheric Administration (NOAA) Ocean Acidification Program (OAP).

Welcome message from author
This document is posted to help you gain knowledge. Please leave a comment to let me know what you think about it! Share it to your friends and learn new things together.
Transcript

RESEARCH ARTICLE
On the Frontline: Tracking OceanAcidification in an Alaskan Shellfish HatcheryWiley Evans1,2*, Jeremy T. Mathis1,2, Jacqueline Ramsay3, Jeff Hetrick3
1 National Oceanic and Atmospheric Administration, Pacific Marine Environmental Laboratory, Seattle,Washington, United States of America, 2 Ocean Acidification Research Center, School of Fisheries andOcean Sciences, University of Alaska Fairbanks, Fairbanks, Alaska, United States of America, 3 AlutiiqPride Shellfish Hatchery, Seward, Alaska, United States of America
AbstractThe invasion of anthropogenic carbon dioxide (CO2) into the ocean is shifting the marine
carbonate system such that saturation states of calcium carbonate (CaCO3) minerals are
decreasing, and this is having a detrimental impact on early life stages of select shellfish
species. The global, secular decrease in CaCO3 saturation states is occurring on top of a
backdrop of large natural variability in coastal settings; progressively shifting the envelope
of variability and leading to longer and more frequent exposure to adverse conditions. This
is a great concern in the State of Alaska, a high-latitude setting vulnerable to rapid changes
in the marine carbonate system, where an emerging shellfish industry plans major growth
over the coming decades. Currently, the Alutiiq Pride Shellfish Hatchery (APSH) in Seward,
Alaska is the only hatchery in the state, and produces many shellfish species with early life
stages known to be sensitive to low CaCO3 saturation states. Here we present the first land-
based OA measurements made in an Alaskan shellfish hatchery, and detail the trends in
the saturation state of aragonite (Ωarag), the more soluble form of CaCO3, over a 10-month
period in the APSH seawater supply. These data indicate the largest changes are on the
seasonal time scale, with extended periods of sub-optimal Ωarag levels (Ωarag < 1.5) in winter
and autumn associated with elevated water column respiration and short-lived runoff
events, respectively. The data pinpoint a 5-month window of reprieve with favorable Ωarag
conditions above the sub-optimal Ωarag threshold, which under predicted upper-bound CO2
emissions trajectories is estimated to close by 2040. To date, many species in production at
APSH remain untested in their response to OA, and the data presented here establish the
current conditions at APSH as well as provide a framework for hatchery-based measure-
ments in Alaska. The current and expected conditions seen at APSH are essential to con-
sider for this developing Alaskan industry.
PLOS ONE | DOI:10.1371/journal.pone.0130384 July 1, 2015 1 / 14
OPEN ACCESS
Citation: Evans W, Mathis JT, Ramsay J, Hetrick J(2015) On the Frontline: Tracking Ocean Acidificationin an Alaskan Shellfish Hatchery. PLoS ONE 10(7):e0130384. doi:10.1371/journal.pone.0130384
Academic Editor: Erik V. Thuesen, The EvergreenState College, UNITED STATES
Received: February 3, 2015
Accepted: May 20, 2015
Published: July 1, 2015
Copyright: This is an open access article, free of allcopyright, and may be freely reproduced, distributed,transmitted, modified, built upon, or otherwise usedby anyone for any lawful purpose. The work is madeavailable under the Creative Commons CC0 publicdomain dedication.
Data Availability Statement: Both the hatchery dataand the TA and salinity cruise data presented in thispaper are available through AOOS (http://portal.aoos.org/alaska-statewide.php#module-search?page=1&tagId=118&q=). This URL will take the reader toboth datasets. In addition, the validation TA andsalinity samples are included as SupportingInformation (S1 Table).
Funding: This work was funded by the AlaskaOcean Observing System (AOOS) and the NationalOceanic and Atmospheric Administration (NOAA)Ocean Acidification Program (OAP).
IntroductionA total of nearly 155 Pg (1 Pg = 1015 g) of carbon have been taken by the ocean due to risingatmospheric carbon dioxide (CO2) levels that result largely from anthropogenic fossil fuelemissions [1]. Ocean CO2 uptake increases the concentration of hydrogen ions (H+; lowers sea-water pH) while also decreasing carbonate ion (CO3
2-) levels; reactions that collectively havebeen termed ocean acidification (OA) [2–6]. Decreasing CO3
2- has the effect of reducing thesaturation state of calcium carbonate (CaCO3) by the equation: Ophase = [Ca2+][CO3
2-]/Ksp;where Ophase is the saturation state for typically either aragonite or calcite phases of CaCO3,Ca2+ is the calcium concentration, and Ksp is the phase specific solubility product. Of thesereactions associated with OA, a decrease in Ophase is a critical alteration in carbonate chemistryaffecting rates of calcification and shellfish growth [7, 8]. For the aragonite phase of CaCO3,Oarag values where sub-lethal sensitivity first become evident for a number of bivalve larvaerange between 1.2 and 2.0 [7]. At Oarag < 1.0, thermodynamics dictate aragonite will activelydissolve in seawater [9]. An unfavorable condition for aragonite precipitation is a considerablestressor for early life stages of select shellfish species that can ultimately lead to mortality [7, 8].Due to the critical nature of this carbonate system parameter in dictating shellfish production,it is imperative for aquaculture facilities to accurately track Oarag in their seawater supplies. Inthe State of Alaska, having this capacity is essential for an emerging shellfish industry in themidst of a shifting biogeochemical seascape [10].
Over the time scale of a year, ocean uptake of anthropogenic CO2 results in small incre-mental chemical changes. On decadal time scales, these changes can shift baselines in marinecarbonate chemistry with potentially significant ecosystem level impacts [11–13]. This is espe-cially the case in high-latitude settings where anthropogenically-driven reductions in Oarag areexpected to occur ahead of changing conditions in warmer locales [14, 15]. The risk associatedwith such wholesale biogeochemical shifts in the marine environment will potentially have far-reaching effects beyond the ecosystems themselves and the dependence of coastal communitieson ocean goods and services [10, 15]. Aquaculture hatcheries have the capacity to be importantcontributors to food security in support of growing populations by ingesting seawater fromadjacent coastal settings in order to produce marketable marine species. As such, hatcheries areon the frontline both in terms of being one of the first industries impacted by OA [8, 11, 15,16] and in their need to track and cope with the changing ocean biogeochemical conditions. Itis important to note that in vulnerable coastal settings, secular changes in CO2 are occurring inconjunction with large, in many cases understudied, carbonate system variability; demon-strated, for instance, by data collected on the United States (U.S.) west coast (Oregon) conti-nental shelf over multiple years [17]. As shown by Harris et al. [17], large carbonate systemvariability does not diminish the importance of an increasing trend. Effectively, the gradualhuman-induced changes in Oarag shift the envelope of variability such that organisms experi-ence more adverse conditions longer and more often than they would otherwise [17–19].
Pacific oyster, Crassostrea gigas, is a cultured species that has been described as a “canary inthe coalmine” for being an organism highly impacted by reduced Oarag levels in the coastalzone [8, 16, 20]. Pacific oyster production failures in U.S. Pacific Northwest (PNW) shellfishhatcheries between 2005 and 2009 resulted from the ingestion of low- Oarag, high-pCO2 water,which is naturally upwelled along the coast, into shore-side hatchery facilities. As detailed byWaldbusser et al. [21], adverse Oarag conditions dually impact larval Crassostrea gigas duringD-hinge (prodissoconch I) shell formation by: (1) exposing calcification surfaces until comple-tion of the D-hinge shell, and (2) increasing kinetic demands that then impacts the energybudget already limited by endogenous resources. The combination of these factors explains thesensitivity to Oarag > 1 when aragonite is thermodynamically favored to precipitate. The
Tracking Ocean Acidification in an Alaskan Shellfish Hatchery
PLOS ONE | DOI:10.1371/journal.pone.0130384 July 1, 2015 2 / 14
Competing Interests: The authors have declaredthat no competing interests exist.
additional anthropogenic CO2 signal in upwelled water along the PNW is small relative to nat-ural CO2 levels in upwelling source waters [22], however large enough to alter the naturalenvelop of variability in these systems and impart a significant stress that resulted in a near col-lapse in a $270 Million industry for the State of Washington [23]. The hatchery production fail-ures served as a vital catalyst in two ways [16]: (1) by unifying stakeholders and scientists inestablishing robust monitoring techniques to track Oarag in hatchery intake water [8], and (2)by instigating state and federal government action to fund scientific activities needed to catalogtrends in coastal manifestations of OA along with their impacts on marine ecosystems and theeconomies they support. To this end, data are presently streaming in near real-time from anumber hatchery facilities along the Pacific coast of North America [24], and guidelines havebeen developed to aid stakeholders in making OA related land-based measurements [25].
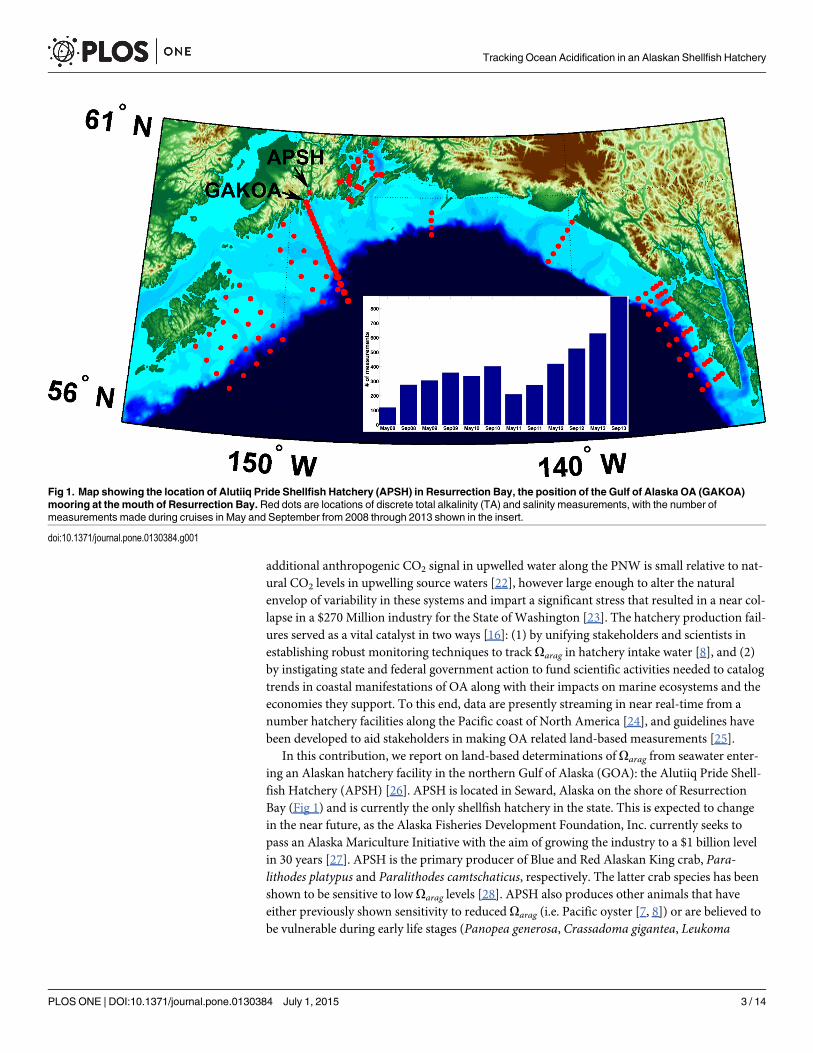
In this contribution, we report on land-based determinations of Oarag from seawater enter-ing an Alaskan hatchery facility in the northern Gulf of Alaska (GOA): the Alutiiq Pride Shell-fish Hatchery (APSH) [26]. APSH is located in Seward, Alaska on the shore of ResurrectionBay (Fig 1) and is currently the only shellfish hatchery in the state. This is expected to changein the near future, as the Alaska Fisheries Development Foundation, Inc. currently seeks topass an Alaska Mariculture Initiative with the aim of growing the industry to a $1 billion levelin 30 years [27]. APSH is the primary producer of Blue and Red Alaskan King crab, Para-lithodes platypus and Paralithodes camtschaticus, respectively. The latter crab species has beenshown to be sensitive to low Oarag levels [28]. APSH also produces other animals that haveeither previously shown sensitivity to reduced Oarag (i.e. Pacific oyster [7, 8]) or are believed tobe vulnerable during early life stages (Panopea generosa, Crassadoma gigantea, Leukoma
Fig 1. Map showing the location of Alutiiq Pride Shellfish Hatchery (APSH) in Resurrection Bay, the position of the Gulf of Alaska OA (GAKOA)mooring at the mouth of Resurrection Bay. Red dots are locations of discrete total alkalinity (TA) and salinity measurements, with the number ofmeasurements made during cruises in May and September from 2008 through 2013 shown in the insert.
doi:10.1371/journal.pone.0130384.g001
Tracking Ocean Acidification in an Alaskan Shellfish Hatchery
PLOS ONE | DOI:10.1371/journal.pone.0130384 July 1, 2015 3 / 14
staminea). Prior to the data presented here, it was unclear whether APSH had been experienc-ing threatening levels of Oarag in their seawater supply. APSH is unique owing to its close prox-imity to an area of intense OA-related sampling from central Resurrection Bay to over theadjacent continental shelf [29]. Full water column measurements have been made in this areaevery May and September since 2008, and the GOA OA (GAKOA) mooring has been in placeat the mouth of Resurrection Bay since 2011(Fig 1) [30]. Using high-speed measurements ofthe seawater entering the hatchery and a compiled dataset from the adjacent coastal ocean,trends in Oarag were resolved over a 10-month period and projections were made for thechanging conditions at this integral site for the state of Alaska’s growing shellfish industry.
Materials and MethodsFrom October 5, 2013 to August 5, 2014, temperature, salinity and CO2 partial pressure(pCO2) data were collected from the seawater supply flowing into APSH. This seawater supplywas provided to the hatchery by the University of Alaska D. W. Hood Laboratory at the SewardMarine Center [31]. Untreated seawater was pumped to the facilities from an intake pipeextending to 75 m depth and 91 m from the laboratory into Resurrection Bay. Two seawaterpumps provided flow at ~200 gallons per minute (gpm), and a tangential split off the main sup-ply line provided seawater at ~1 gpm to the hydrographic and chemical sensors positioned inthe preparation room of the D.W. Hood Laboratory. Temperature and salinity (calculatedfrom conductivity) were measured with a Sea-Bird Electronics SBE 45 MicroTSG thermosali-nograph [32], with salinity reported in this paper using the Practical Salinity Scale (PSS-78,dimensionless).
Seawater pCO2 data were calculated from corrected measurements of CO2 mixing ratio(xCO2) made using a Sunburst Sensors SuperCO2 System [33] following protocols recom-mended by Pierrot et al. [34] with the system theory and calculations described in detail else-where [35–38]. Seawater continuously flowed first through the thermosalinograph and thenthrough two (primary and secondary) showerhead equilibrators [34, 39]. The primary shower-head equilibrator supplied equilibrated carrier gas (marine air) to a non-dispersive infrared gasanalyzer (LI-COR LI840A CO2/H2O) housed within the SuperCO2 system’s electronics box ata rate of ~50 ml min-1. Unaltered marine air was drawn from 0.25 inch polyethylene tubingthat connected a vented water trap positioned outside of the D.W. Hood Laboratory to the sec-ondary equilibrator. Marine air was pre-equilibrated in the secondary equilibrator, and thenplumbed to the primary equilibrator as a make-up air supply to replace equilibrated carrier gasprovided to the LI-COR. Pressure and temperature were continuously measured in the primaryequilibrator using a Honeywell ASCX Microstructure Pressure Sensor and a Minco FastResponse RTD, respectively. Equilibrated carrier gas, three standard gases of known mixingratio (148, 448 and 748 ppm; Scott-Marin, Inc.), and unaltered marine air were all plumbed toprovide gas flow to the SuperCO2 system’s electronics box. The SuperCO2 system was con-trolled using National Instruments LabVIEW software run on an HP laptop computer. Thesoftware controls data acquisition from the thermosalinograph, the pressure and temperaturesensors, and the LI-COR; while also controlling Valco Instruments Co. Inc. (VICI) multi-portactuators that cycle between the gas streams plumbed to the electronics box. None of the gasstreams were dried prior to analysis, and all measurements were made at 0.5 Hz. The pre-scribed measurement scheme controlled by the software was to supply equilibrated carrier gasfrom the primary equilibrator to the LI-COR continuously for 240 minutes, then cycle theactuators to consecutively allow the three standard gas streams and unaltered marine air to bemeasured for 90 s at 100 ml min-1 before returning to sample the carrier gas equilibrated withseawater xCO2. From each sequence of standard gas measurements, the final 20 s of data in the
Tracking Ocean Acidification in an Alaskan Shellfish Hatchery
PLOS ONE | DOI:10.1371/journal.pone.0130384 July 1, 2015 4 / 14

90 s interval before the actuator changed position were used to construct calibration functionsthat were then interpolated in time between standard gas sequences. These functions were thenused to calibrate the xCO2 measurements of seawater equilibrated carrier gas, with an adjust-ment on the order of 1%. Atmospheric xCO2 measurements made by the SuperCO2 systemwere not used in this analysis, as these data do not enter in to calculations of Oarag. Annualmean atmospheric pCO2 was calculated from the well-resolved data collected on the GAKOAmooring. This annual mean atmospheric pCO2 value was then used in anthropogenic CO2 cal-culations. Corrected seawater xCO2 was subsequently adjusted for under-pressurization in theprimary showerhead equilibrator using the ratio of equilibrator to vented LI-COR cell pressure,and then converted to pCO2 using atmospheric pressure measured by the LI-COR. The 2-s sea-water pCO2, temperature and salinity data were quality controlled, and then bin-averaged in5-min interval bins.
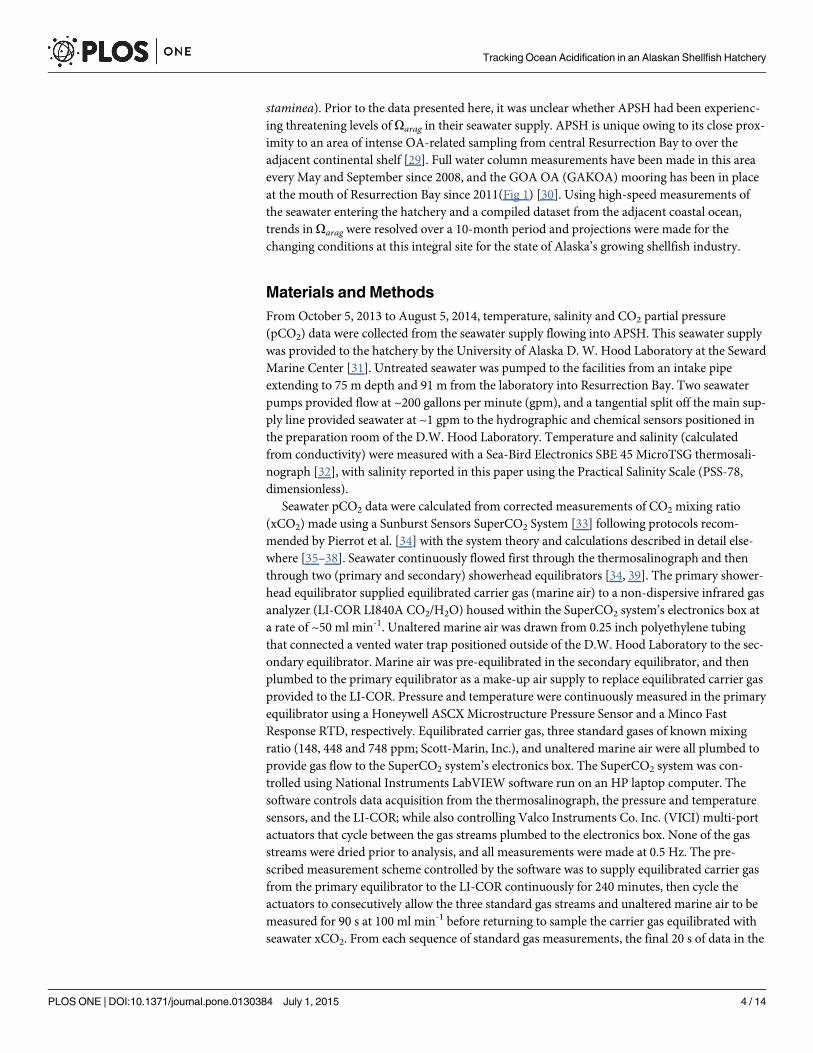
Taking advantage of the expansive and growing dataset of paired total alkalinity (TA) andsalinity measurements made throughout the northern GOA coastal ocean (Fig 1; [29]), thesedata were compiled and used to construct a TA–salinity relationship. The compiled data werecollected as part of the growing suite of carbonate system and hydrographic measurementsmade from oceanographic cruises that have occurred every May and September since 2008.Briefly, seawater samples were collected at specific stations and depths using a rosette equippedwith 5-l Niskin bottles and a Sea-Bird Electronics 911Plus conductivity-temperature-depth(CTD) profiler. Seawater was drawn from Niskin bottles into clean 250 ml Pyrex glass reagentbottles using established sampling techniques [40], and treated with 200 μl of saturated HgCl2solution to halt biological activity in the samples. TA was measured in the fixed seawater sam-ples at the University of Alaska Fairbanks (UAF) Ocean Acidification Research Center(OARC) using a VINDTA 3C [41]. Seawater certified reference materials (provided by A. G.Dickson, Scripps Institute of Oceanography) were analyzed before samples were processed toensure measurements were accurate to within 0.1% (2 μmol kg-1). A robust linear regressionwas computed between the TA and salinity data using MathWorks MATLAB software. Asmall number of TA validation measurements (n = 23) were collected at APSH to verify thecredibility of this linear relationship (S1 Table). 5-min binned seawater pCO2 data, TA derivedusing the TA–salinity relationship, temperature and salinity were input into a customizedMathWorks MATLAB version of CO2SYS [42] for carbonate system calculations. pH on thetotal hydrogen ion scale (pHT), CO3
2- and Oarag were computed using the equilibrium con-stants for the dissociation of carbonic acid fromMillero [43]. Ca2+ concentrations were calcu-lated from salinity using the relationship from Riley and Tongudai [44]. For estimating thecontribution of anthropogenic CO2 in setting Oarag variability at APSH, the mean atmosphericpCO2 from GAKOA (398 ± 6.7 μatm) was used to calculate the sea-air difference in pCO2
(ΔpCO2). While the term “sub-lethal” has been used in the literature to describe the impact ofOarag levels< 1.5 on select larval shellfish species [7, 8, 15], to date, there has been no evidenceof die-offs directly linked to Oarag conditions at APSH. Here, we consider Oarag values� 1.5 tobe sub-optimal growth conditions for many larval species produced by APSH (e.g. Crassostreagigas); Oarag equal to 1.5 marks the threshold value below which increased stress and vulnera-bility is expected [7, 15].
Results and DiscussionPresented here are the first Oarag values from seawater entering an Alaskan shellfish hatchery,and the data indicate unique characteristics setting conditions at APSH apart from those atother hatcheries to the south along the U.S. Pacific coast within the California Current System[8]. In source waters to APSH, temperature and salinity underwent only modest changes
Tracking Ocean Acidification in an Alaskan Shellfish Hatchery
PLOS ONE | DOI:10.1371/journal.pone.0130384 July 1, 2015 5 / 14

throughout the period of observation, with temperature ranging from 5 to 11°C and salinityvarying between 26 and 32 (Fig 2). pCO2 spanned 305 to 463 μatm, and was relatively confinedin comparison to the dynamic range seen in surface water measured by the GAKOA buoy atthe mouth of Resurrection Bay [45]. At this nearby surface site, only limited pCO2 data aboveatmospheric levels have been observed to occur between February and March [30]. The mostprolonged periods of high pCO2 levels at APSH were from January to April (Fig 2). Note thatrecord gaps in April, May and June ranged from 2 to 20 days, and were caused by either electri-cal power outages in Seward or technical issues associated with the SuperCO2 system. The TA–salinity relationship built from compiled GOA data [29] was robust (Fig 3) as indicated by ahigh r2 value (0.94), low root mean square error (RMSE; 17.21 μmol kg-1), and close agreementwith our validation samples (S1 Table). Oarag, calculated using TA from the TA–salinity rela-tionship with the pCO2 data, showed a smaller dynamic range of relative to the measurementsmade within PNW hatcheries [8], with only a 0.8 unit oscillation about the 1.5 Oarag thresholdover the 10-month record (Fig 4). The largest abrupt changes in Oarag were seen duringautumn runoff events (0.5 unit), whereas during July and August the near 40-μtam diurnal sig-nal in pCO2 (Fig 2) amounted to only 0.1 unit daily changes in Oarag (Fig 4). This small vari-ability in Oarag is greater than the at most 0.06 unit error in the Oarag calculation estimated bypropagating the RMSE value from the TA–salinity relationship with the error in the pCO2 data(2.1 μatm; dominated by error in the LI-COR LI840A calibration functions). Short-term diur-nal variability in the Alaskan hatchery is minimal in comparison to the extremes seen at theWhiskey Creak Hatchery (WCH) in Netarts Bay, Oregon where Oarag can vary by more than awhole unit over a day [8]. Oarag varies more on seasonal time scales at APSH, with highest val-ues in July and August and low sub-optimal levels persisting from January to April. Octoberthrough December is a transition period to the prolonged sub-optimal conditions in winter,which is punctuated by abrupt short-lived decreases in Oarag. Assuming that May and June alsoare transition months to the high summer Oarag levels, and that conditions in September are
Fig 2. Tenmonths of data collected from intake water entering the Alutiiq Pride Shellfish Hatchery (APSH). The top panel is temperature (°C; blue)and salinity (red), and the bottom panel is seawater pCO2 (μatm) with the red dashed horizontal line as the mean atmospheric concentration (398 ± 6.7 μatm).
doi:10.1371/journal.pone.0130384.g002
Tracking Ocean Acidification in an Alaskan Shellfish Hatchery
PLOS ONE | DOI:10.1371/journal.pone.0130384 July 1, 2015 6 / 14
similar to those of August, this implies a 5-month window (May through September) of favor-able Oarag conditions at APSH. During these 5 months, prolonged Oarag levels above the sub-optimal 1.5 Oarag threshold should alleviate this as a stressor for larval shellfish production,whereas during the other months of the year this may not be the case.
Over the 10-month period, pHT ranged from 7.96 to 8.13 and averaged 8.03 ± 0.02. AverageOarag was near the sub-optimal threshold at 1.55 ± 0.15, with levels varying from 1.2 to 2.0.pHT and Oarag closely tracked each other for only 6 of the 10 months of observations (Fig 4).From January to June, pHT and Oarag were tightly coupled, with Oarag largely near or below the1.5 Oarag threshold. pHT and Oarag became decoupled in July, August, October and November,with pHT depressed while Oarag persisted above the sub-optimal Oarag threshold, except during
Fig 3. Relationship between total alkalinity (TA; μmol kg-1) and salinity in the northern Gulf of Alaska calculated using the data described in Fig 1.The linear fit (gray line) for these data is: TA = 48.7709*S + 606.23 μmol kg-1 (r2 = 0.94, root mean square error = 17.21 μmol kg-1). This fit was calculatedusing the MathWorks MATLAB robust linear regression algorithm with only salinity data < 33.6 (blue dots). Measurements above this salinity range are deepsamples collected over the outer continental shelf that have a steeper TA-salinity relationship (black dots). Twenty-three validation TA measurements (S1Table) were made and are shown here as red dots.
doi:10.1371/journal.pone.0130384.g003
Tracking Ocean Acidification in an Alaskan Shellfish Hatchery
PLOS ONE | DOI:10.1371/journal.pone.0130384 July 1, 2015 7 / 14

short-lived periods of abrupt decreases in Oarag. Maximal error in the pHT calculations esti-mated by propagating pCO2 and TA–salinity errors was 0.01 units, well below the 0.07 unitdrop in pHT during the pHT− Oarag. The pHT and Oarag decoupling was opposite in directionto what was observed in surface water impacted by glacial melt within nearby Prince WilliamSound [46], and highlights the absolute requirement to track two concurrent carbonate systemparameters in order to constrain the carbonate system in coastal settings [8, 25, 47]. In thiscase, the decoupling was entirely temperature driven. As eloquently described by Takahashiet al. [48], the equilibrium constants for the dissociation of carbonic acid, and the Ksp-arag, aretemperature and salinity dependent, with the second equilibrium constant for the dissociationof carbonic acid increasing 1.5x faster with increasing temperature than the first. This inequal-ity in the temperature response between the two equilibrium constants drives an adjustmentwithin the carbonate system to increase carbonic acid and CO3
2- while decreasing bicarbonateion in order to maintain charge and mass balances. Carbonic acid equals the product of CO2
solubility and pCO2, and the required increase in pCO2 drives an increase in H+ lowering pHT.In addition to the increase in CO3
2- caused by the temperature-driven shift within the carbon-ate system, Ksp-arag decreases with increasing temperature and the sum of these two effectsraises Oarag levels. For the months of July, August, October and November at APSH, utilizingpH alone as an indication of Oarag would produce misleading and inaccurate results.
Fig 4. Top panel is pH on the total hydrogen ion scale (pHT) and the saturation state of the aragonite phase of CaCO3 (Ωarag). The dashed red line isthe sub-optimal 1.5Ωarag threshold. Subsequent panels are a decomposition ofΩarag components: middle panel is calcium (Ca2+) and carbonate (CO3
2-)concentrations (mmol kg-1), and bottom panel is Ca2+ x CO3
2- ((mol kg-1)2 x 10⁻⁷) and the solubility product for aragonite (Ksp-arag; (mol kg-1)2 x 10⁻⁷).
doi:10.1371/journal.pone.0130384.g004
Tracking Ocean Acidification in an Alaskan Shellfish Hatchery
PLOS ONE | DOI:10.1371/journal.pone.0130384 July 1, 2015 8 / 14
Using output Ca2+, CO32- and Ksp-arag data from CO2SYS, theOarag record was decomposed
into its constituents in order to pinpoint the drivers of sub-optimal Oarag levels that occurredduring months outside of the window of favorable Oarag conditions (Fig 4). Ca
2+ in the seawa-ter supply to the hatchery ranged between 7.5 and 9.5 mmol kg-1, dropping to lowest valuesonly during brief periods when low salinity surface water was mixed vertically to the depth ofthe intake in October and November (Figs 2 and 4). CO3
2- levels vary over a narrower range,between 0.08 and 0.13 mmol kg-1, and were highest during the period of sustained low pCO2
and warm water temperatures during July and August (Figs 2 and 4). The dynamic range ofCO3
2-, 51 μmol kg-1, was 13x the error of 3.9 μmol kg-1 calculating by propagating pCO2 andTA–salinity errors. During winter months, Ca2+ and Ksp-arag were largely stable and near 9mmol kg-1 and 7 (mol kg-1)2 x 10⁻⁷, respectively. The decline in Oarag over this period resultedfrom the steady decrease in CO3
2- to a minimum in February and March (Fig 4), consistentwith the period of sustained pCO2 above atmospheric levels (Fig 2) and indicating a respira-tion-driven depression in Oarag. During October and November, CO3
2- decreases abruptly (Fig4) along with short-lived increases in pCO2 above atmospheric levels (Fig 2). During this time,CO3
2-, Ca2+ and Ksp-arag all decrease precipitously during the episodic low salinity events (Figs2 and 4). Low Oarag conditions during these autumn months are triggered by runoff events andmatch the intensity but not the length of exposure of the respiration-driven decline in Oarag
seen in winter (Fig 4). In temperature-salinity space, the two differing water masses responsiblyfor these trends in Oarag become readily apparent, and this provides a framework for avoidanceof sub-optimal Oarag levels (Fig 5). Temperature-salinity data collected over the 10-monthperiod show a two-pronged distribution, with sub-optimal Oarag levels seen in water masseswith the lowest salinities (<29) and coldest temperatures (< 7°C). Both of these water masstypes have high pCO2 with respect to the atmosphere (Fig 2), and these temperature–salinity–pCO2 characteristics set up a diagnostic for APSH to respond to adverse Oarag conditions inthe absence of real-time Oarag calculations.
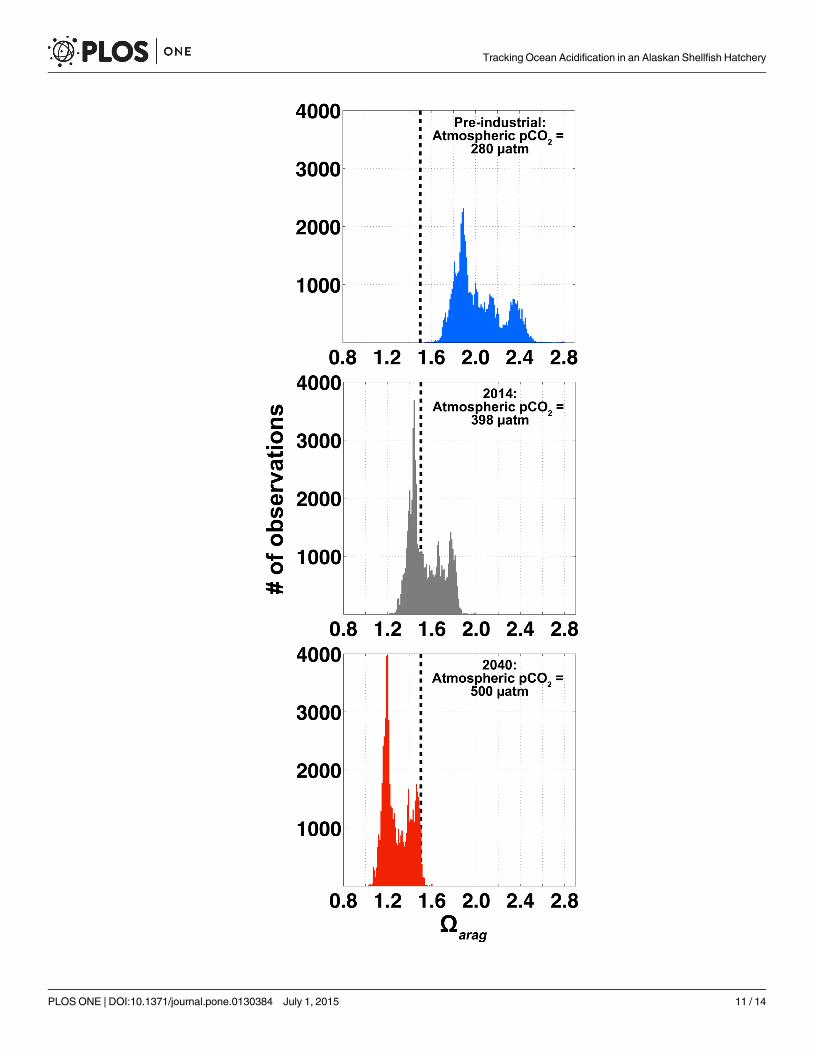
The 5-month window of favorable Oarag conditions at APSH will shrink in the future underthe continued increase in anthropogenic CO2 emissions. Using the approach of Harris et al.[17], we can subtract the anthropogenic CO2 signal from the APSH pCO2 data by making theassumptions that the sea-air CO2 disequilibrium is roughly constant as are the processes shap-ing the distributions of TA, salinity and temperature. In this same way, we can also add addi-tional anthropogenic CO2 to pinpoint when the window of favorable growth conditions mayclose. Target atmospheric pCO2 levels were added to APSH ΔpCO2 data computed using themean atmospheric pCO2 from GAKOA (Figs 1 and 2) with the result being an adjusted seawa-ter pCO2 record. Oarag at the target atmospheric pCO2 levels were calculated with CO2SYSusing the adjusted seawater pCO2, TA, salinity and temperature data. Under a pre-industrialatmospheric pCO2 level (pCO2 = 280 μatm), the window for favorable Oarag conditions is openthe entire year (Fig 6); none of the estimated Oarag levels fell below the 1.5 Oarag threshold.Note that the average difference between total CO2 calculated using both unadjusted seawaterpCO2 and adjusted seawater pCO2 to a pre-industrial atmosphere with TA, salinity and tem-perature data was 52.4 μmol kg-1. This was in close agreement with an independent estimate ofthe total CO2 addition from anthropogenic CO2 uptake on density surfaces< 26.9 kg m-3 inthe North Pacific until 2006 and scaled to 2014 using a growth rate of 1.62 μmol kg-1 yr-1
(47.96 μmol kg-1) [49]. Atmospheric pCO2 concentrations were then iteratively increasedbeyond the mean 2014 atmospheric level to estimate when the window of favorable Oarag con-ditions may close. The atmospheric pCO2 at which this occurred was 500 μatm (Fig 6). Underthe Intergovernmental Panel on Climate Change (IPCC) representative concentration pathway(RCP) emissions scenario 8.5, this atmospheric pCO2 threshold will be reached by approxi-mately 2040 [50]. Oarag levels at APSH in 2040 would still remain above the thermodynamic
Tracking Ocean Acidification in an Alaskan Shellfish Hatchery
PLOS ONE | DOI:10.1371/journal.pone.0130384 July 1, 2015 9 / 14

threshold for aragonite dissolution (Oarag = 1; Fig 6), but clearly seawater manipulation strate-gies will need to be in place by this time in order to facilitate conditions favorable for larvalshellfish production.
ConclusionsThe window of favorable Oarag conditions in source waters to APSH is gradually closing, andthis biogeochemical shift is consistent across the coastal Gulf of Alaska [10, 15, 51]. In 3decades, sub-optimal Oarag levels will be a constant condition for this premier Alaskan hatchery(Fig 6). Manipulation strategies will need to be invoked to alter the carbonate chemistry of theseawater supply, or alternatively draw seawater from a shallower depth at the risk of experienc-ing a higher frequency of low Oarag runoff events. Inherently this implies a decreased volume inthe water column of Resurrection Bay containing Oarag above the sub-optimal threshold, and
Fig 5. Temperature (°C)–salinity diagramwith contours of seawater potential density anomaly (σt) andΩarag as colored dots. Note the two areas ofsub-optimalΩarag (Ωarag < 1.5; warm colors) at the lowest salinities (<29) and coldest temperatures (< 7°C).
doi:10.1371/journal.pone.0130384.g005
Tracking Ocean Acidification in an Alaskan Shellfish Hatchery
PLOS ONE | DOI:10.1371/journal.pone.0130384 July 1, 2015 10 / 14
Tracking Ocean Acidification in an Alaskan Shellfish Hatchery
PLOS ONE | DOI:10.1371/journal.pone.0130384 July 1, 2015 11 / 14
this has implications for natural populations of vulnerable shellfish species in the region. A lim-ited number of studies examining biological impacts due to shifting carbonate chemistry inAlaskan coastal waters exist [28], and additional studies are essential for detailing the severityof these changes for natural and cultured assemblages. Most of the species currently in produc-tion at APSH remain untested in their response to OA. The data presented here establish thecurrent conditions experienced by APSH, and provide a framework for hatchery-based mea-surements in Alaska. For Alaska’s growing shellfish aquaculture industry to reach its targetgrowth and be successful in the shifting biogeochemical climate of the coastal ocean, the imple-mentation of robust measures for tracking Oarag are key, as are strong partnerships betweenstakeholders and scientists. State and federal government provision of OA-related scientificresearch that directly supports stakeholders such as the Alaskan shellfish industry is an excel-lent model for simultaneously backing industry while progressing scientific initiatives.
Supporting InformationS1 Table. Validation measurements (n = 23) of temperature, salinity and total alkalinitycollected in the hatchery during the 10-month period of observation.(EPS)
AcknowledgmentsWe would like to thank Phyllis Shoemaker, Linda Lasota and Jennifer Elhard from the Univer-sity of Alaska Seward Marine Center for their support throughout this project. We thank theAlaska Ocean Observing System (AOOS) and the National Oceanic and Atmospheric Admin-istration (NOAA) Ocean Acidification Program (OAP) for funding this research. Both thehatchery data and the TA and salinity cruise data presented in this manuscript are availablethrough AOOS (http://portal.aoos.org/alaska-statewide.php#module-search?page=1&tagId=118&q=). This is PMEL contribution number 4285.
Author ContributionsConceived and designed the experiments: WE JTM JH. Performed the experiments: WE JR JH.Analyzed the data: WE. Contributed reagents/materials/analysis tools: WE JTM. Wrote thepaper: WE JTM JR JH. Oversaw routine operation and maintenance of the sensors used to col-lect data for this project: JR. Provided the facility in which WE and JTM installed their sensors:JH.
References1. Feely RA, Wanninkhof R, Sabine CL, Mathis JT, Takahashi T, Khatiwala S. Global ocean carbon cycle.
In: Blunden J, Arndt DS, editors. State of the Climate in 2013. 95: Bulletin of the American Meteorologi-cal Society; 2014. p. 73–8.
2. Doney SC, Fabry VJ, Feely RA, Kleypas JA. Ocean Acidification: The Other CO2 Problem. AnnualReview of Marine Science. 2009; 1:169–92. PMID: 21141034
Fig 6. Bar graphs showing histograms ofΩarag observations at APSH. The center panel is the datashown in Fig 4 with 2014 atmospheric pCO2 levels (398 μatm; gray). Top and bottom panels areΩarag
computed using total CO2 (TCO2) adjusted to atmospheric pCO2 levels of 280 (blue) and 500 (red) μatm,respectively, following the approach of Harris et al. [17] by assuming sea-air CO2 disequilibria and theprocesses that determine TA, temperature and salinity variability are constant in time. The vertical dashedblack line in all panels is the sub-optimal 1.5Ωarag threshold where some early life stages of marine bivalvesbecome stressed [7, 8]. An atmospheric pCO2 of 500 is expected by 2040 if the IPCC AR5 RCP 8.5emissions trajectory is realized.
doi:10.1371/journal.pone.0130384.g006
Tracking Ocean Acidification in an Alaskan Shellfish Hatchery
PLOS ONE | DOI:10.1371/journal.pone.0130384 July 1, 2015 12 / 14

3. Raven J, Caldeira K, Elderfield H, Hoegh-Guldberg O, Liss PS, Riebesell U, et al. Ocean acidificationdue to increasing atmospheric carbon dioxide. The Royal Society, 2005.
4. Caldeira K, Wickett ME. Anthropogenic carbon and ocean pH. Nature. 2003; 425:365. PMID:14508477
5. Orr JC, Fabry VJ, Aumont O, Bopp L, Doney SC, Feely RA, et al. Anthropogenic ocean acidificationover the twenty-first century and its impact on calcifying organisms. Nature. 2005; 437:681–6. PMID:16193043
6. Feely RA, Sabine CL, Lee K, BerelsonW, Kleypas J, Fabry VJ, et al. Impact of Anthropogenic CO2 onthe CaCO3 System in the Oceans. Science. 2004; 305:362–6. PMID: 15256664
7. Waldbusser GG, Hales B, Langdon CJ, Haley BA, Schrader P, Brunner EL, et al. Saturation-state sen-sitivity of marine bivalve larvae to ocean acidification. Nature Climate Change. 2014. doi: 10.1038/nclimate2479
8. Barton A, Hales B, Waldbusser G, Langdon C, Feely RA. The Pacific oyster, Crassostrea gigas, showsnegative correlation to naturally elevated carbon dioxide levels: Implications for near-term ocean acidifi-cation effects. Limnology and Oceanography. 2012; 57(3):698–710.
9. Millero FJ. The Marine Inorganic Carbon Cycle. Chemical Reviews. 2007; 107:308–41. PMID:17300138
10. Mathis JT, Cooley SR, Lucey N, Colt S, Ekstrom J, Hurst T, et al. Ocean acidification risk assessmentfor Alaska’s fishery sector. Progress in Oceanography. 2014. doi: 10.1016/j.pocean.2014.07.001
11. Feely RA, Klinger T, Newton JA, Chadset M. Scientific Summary of Ocean Acidification in WashingtonState MarineWaters. 2012.
12. Fabry VJ, Seibel BA, Feely RA, Orr JC. Impacts of ocean acidification on marine fauna and ecosystemprocesses. ICES Journal of Marine Science. 2008; 65:414–32.
13. Bednarsek N, Feely RA, Reum JC, Peterson B, Menkel J, Alin SR, et al. Limacina helicina shell dissolu-tion as an indicator of declining habitat suitability owing to ocean acidification in the California CurrentEcosystem. Proceedings Biological sciences / The Royal Society. 2014; 281(1785):20140123. doi: 10.1098/rspb.2014.0123 PMID: 24789895; PubMed Central PMCID: PMC4024287.
14. Fabry VJ, McClintock JB, Mathis JT, Grebmeier JM. Ocean Acidification at High Latitudes: The Bell-wether. Oceanography. 2009; 22(4):160–71.
15. Ekstrom JA, Suatoni L, Cooley SR, Pendleton LH, Waldbusser GG, Cinner JE, et al. Vulnerability andadaptation of US shellfisheries to ocean acidification. Nature Climate Change. 2015; 5(3):207–14. doi:10.1038/nclimate2508
16. Kelly RP, Cooley SR, Klinger T. Narratives can motivate environmental action: the Whiskey Creekocean acidification story. Ambio. 2014; 43(5):592–9. doi: 10.1007/s13280-013-0442-2 PMID:24081705; PubMed Central PMCID: PMC4132469.
17. Harris KE, Degrandpre MD, Hales B. Aragonite saturation state dynamics in a coastal upwelling zone.Geophysical Research Letters. 2013; 40:2720–5. doi: 10.1002/grl.50460
18. Gruber N, Hauri C, Lachkar Z, Loher D, Frolicher TL, Plattner GK. Rapid progression of ocean acidifica-tion in the California Current System. Science. 2012; 337(6091):220–3. doi: 10.1126/science.1216773PMID: 22700658.
19. Waldbusser GG, Salisbury JE. Ocean acidification in the coastal zone from an organism's perspective:multiple system parameters, frequency domains, and habitats. Ann Rev Mar Sci. 2014; 6:221–47. doi:10.1146/annurev-marine-121211-172238 PMID: 23987912.
20. Scigliano E. The Great Oyster Crash. OnEarth. 2011 August 17, 2011.
21. Waldbusser GG, Brunner EL, Haley BA, Hales B, Langdon CJ, Prahl FG. A developmental and ener-getic basis linking larval oyster shell formation to acidification sensitivity. Geophysical Research Let-ters. 2013; 40(10):2171–6. doi: 10.1002/grl.50449
22. Feely RA, Sabine CL, Hernandez-Ayon M, Ianson D, Hales B. Evidence for Upwelling of Corrosive"Acidified" Water onto the Continental Shelf. Science. 2008; 320(5882):1490–2. doi: 10.1126/science.1155676 PMID: 18497259
23. Adelsman H, Whitely Binder L. Ocean Acidifaction: From Knowledge to Action, Washington State'sStrategic Response. Washington State Blue Ribbon Panel on Ocean Acidification. Olympia, Washing-ton Washington Department of Ecology; 2012.
24. IOOS. IOOS Pacific Region Ocean Acidification 2015. Available: http://www.ipacoa.org.
25. McLaughlin K, Weisberg SB, Alin S, Barton A, Capson T, Dickson A, et al. Guidance Manual for Estab-lishing a Land-Based Station for Measurement of Ocean Acidification Parameters. 2014.
26. Ramsay J. Alutiiq Pride Shellfish Hatchery on Resurrection Bay, Seward, Alaska 2015. Available:http://alutiiqpridehatchery.com.
Tracking Ocean Acidification in an Alaskan Shellfish Hatchery
PLOS ONE | DOI:10.1371/journal.pone.0130384 July 1, 2015 13 / 14

27. AFDF. Alaska Mariculture Initiative: Grow a $1 billion industry in 30 years 2015. Available: http://www.afdf.org/alaska-mariculture-initiative-recommended-for-noaa-funds/.
28. LongWC, Swiney KM, Harris C, Page HN, Foy RJ. Effects of ocean acidification on juvenile red kingcrab (Paralithodes camtschaticus) and Tanner crab (Chionoecetes bairdi) growth, condition, calcifica-tion, and survival. PLoS One. 2013; 8(4):e60959. doi: 10.1371/journal.pone.0060959 PMID: 23593357;PubMed Central PMCID: PMC3617201.
29. Mathis JT, EvansW, Cross JN, Weingartner TJ, Monacci N. The Physical and Biogeochemical Control-lers on Ocean Acidification in the Northern Gulf of Alaska. Journal of Geophysical Research. 2015:inpreparation.
30. NOAA/PMEL. GAKOA: Gulf of Alaska Ocean Acidification Mooring (59.85°N 149.5°W) 2015. Available:http://www.pmel.noaa.gov/co2/story/GAKOA.
31. UAF. University of Alaska Fairbanks Seward Marine Center 2015. Available: https://http://www.sfos.uaf.edu/smc/.
32. SBE. Sea-Bird Electronics SBE 45 MicroTSG Thermosalinograph 2015. Available: http://www.seabird.com/sbe45-thermosalinograph.
33. Beck J. SuperCO2 System 2015. Available: http://www.sunburstsensors.com/products/oceanographic-carbon-dioxide-sensor-benchtop-li-cor.html.
34. Pierrot D, Neill C, Sullivan K, Castle R, Wanninkhof R, Lüger H, et al. Recommendations for autono-mous underway pCO2 measureing systems and data-reduction routines. Deep-Sea Research II. 2009;56:512–22.
35. EvansW, Hales B, Strutton PG. The seasonal cycle of surface ocean pCO2 on the Oregon shelf. Jour-nal of Geophysical Research. 2011; 116(C05012): doi: 10.1029/2010JC006625 PMID: 24383048
36. Hales B, Chipman D, Takahashi T. High-frequency measurements of partial pressure and total concen-tration of carbon dioxide in seawater using microporous hydrophobic membrane contactors. Limnologyand Oceanography: Methods. 2004; 2:356–64.
37. EvansW, Hales B, Strutton PG. pCO2 distributions and air-water CO2 fluxes in the Columbia Riverestuary. Estuarine, Coastal and Shelf Science. 2013; 117: doi: 10.1016/j.ecss.2012.12.003
38. EvansW, Hales B, Strutton PG, Ianson D. Sea-air CO2 fluxes in the western Canadian coastal ocean.Progress in Oceanography. 2012: doi: 10.1016/j.pocean.2012.01.003
39. Takahashi T. Carbon Dioxide in the Atmosphere and in Atlantic OceanWater. Journal of GeophyiscalResearch. 1961; 66(2):477–94.
40. Dickson AG, Sabine CL, Christian JR, editors. Guide to Best Practices for Ocean CO2 Measurements:North Pacific Marine Science Organization; 2007.
41. Marianda. Total alkalinity and dissolved inorganic carbon in seawater (VINDTA 3C) 2015. Available:http://www.marianda.com/index.php?site = products&subsite = vindta3c.
42. van Heuven S, Pierrot D, Rae JWB, Lewis E, Wallace DWR. MATLAB Program Developed for CO2
System Calculations Oak Ridge, Tennessee: Department of Energy, 2011.
43. Millero FJ. Carbonate constants for estuarine waters. Marine and Freshwater Research. 2010; 61(2):139–42.
44. Riley JP, Tongudai M. The major cation/chlorinity ratios in seawater Chemical Geology. 1967; 2:263–9.
45. EvansW, Mathis JT. The Gulf of Alaska coastal ocean as an atmospheric CO2 sink. Continental ShelfResearch. 2013; 65:52–63.
46. EvansW, Mathis JT, Cross JN. Calcium Carbonate Corrosivity in an Alaskan Inland Sea. Biogeos-ciences. 2014; 11:365–79. doi: 10.5194/bg-11-365-2014
47. Cullison Gray SE, Degrandpre M, Moore TS, Martz TR, Friederich GE, Johnson KS. Applications of insitu pHmeasurements for inorganic carbon calculations. Marine Chemistry. 2011; 125:82–90.
48. Takahashi T, Sutherland SC, Chipman DW, Goddard JG, Ho C, Newberger T, et al. Climatological dis-tributions of pH, pCO2, total CO2, alkalinity, and CaCO3 saturation in the global surface ocean, andtemporal changes at selected locations. Marine Chemistry. 2014; 164:95–125. doi: 10.1016/j.marchem.2014.06.004
49. Watanabe YW, Chiba T, Tanaka T. Recent change in the oceanic uptake rate of anthropogenic carbonin the North Pacific subpolar region determined by using a carbon-13 time series. Journal of Geophys-ical Research. 2011; 116(C2). doi: 10.1029/2010jc006199
50. van Vuuren DP, Edmonds J, KainumaM, Riahi K, Thomson A, Hibbard K, et al. The representative con-centration pathways: an overview. Climatic Change. 2011; 109(1–2):5–31. doi: 10.1007/s10584-011-0148-z
51. Mathis JT, Cross JN, EvansW, Doney SC. Ocean Acidification in the SurfaceWaters of the Pacific-Arc-tic Boundary Regions. Oceanography. 2015:Accepted.
Tracking Ocean Acidification in an Alaskan Shellfish Hatchery
PLOS ONE | DOI:10.1371/journal.pone.0130384 July 1, 2015 14 / 14
Related Documents