sustainability Article On the Evolution of Hierarchical Urban Systems in Soviet Russia, 1897–1989 Kazuhiro Kumo 1, * and Elena Shadrina 2 Citation: Kumo, K.; Shadrina, E. On the Evolution of Hierarchical Urban Systems in Soviet Russia, 1897–1989. Sustainability 2021, 13, 11389. https://doi.org/10.3390/ su132011389 Academic Editor: Åsa Gren Received: 6 September 2021 Accepted: 11 October 2021 Published: 15 October 2021 Publisher’s Note: MDPI stays neutral with regard to jurisdictional claims in published maps and institutional affil- iations. Copyright: © 2021 by the authors. Licensee MDPI, Basel, Switzerland. This article is an open access article distributed under the terms and conditions of the Creative Commons Attribution (CC BY) license (https:// creativecommons.org/licenses/by/ 4.0/). 1 Institute of Economic Research, Hitotsubashi University, 2-1 Naka, Kunitachi, Tokyo 186-8603, Japan 2 School of International Liberal Studies, Waseda University, 1-6-1 Nishi-Waseda, Shinjuku-ku, Tokyo 169-8050, Japan; [email protected] * Correspondence: [email protected]; Tel.: +81-42-580-8361 Abstract: One piece of evidence of the inefficiency of the spatial economy of modern Russia presented in the seminal work of Hill and Gaddy (2004) is that Russian urban agglomerations are non-viable. This was demonstrated using Zipf’s rank-size distribution, which does not hold for Russian urban systems. Hill and Gaddy explained this through the legacy of the Soviet command-administrative planning. Having constructed an original dataset, which incorporated comprehensive historical data for all the cities in the former Soviet Union republics and tested the rank-size distributions for the respective years, the study yielded more nuanced findings. First, unlike the modern Russian hierarchical urban systems, the Soviet ones followed rank-size distribution fairly well. Second, the Soviet urban systems were evolving. In the late Imperial era and early Soviet period, they followed the Zipf’s law prediction. However, between 1939 and 1959, the rank-size distribution diverged from the predicted one. Yet again, the Soviet hierarchical urban systems revealed a trend of convergence toward the traditional rank-size distribution in the late Soviet era. A corollary to such evidence from data trajectory appears that the evolution of the Soviet hierarchical urban systems was not necessarily the ultimate product of the urban development policies of the command-administrative system. It can be thus presumed that, contrary to the established belief, command administrative urban development might be ineffectual even in centrally planned socialist economies. Keywords: Zipf’s law; rank-size rule; hierarchical urban system; Soviet Union; Russia 1. Introduction During the 30 years since the demise of the Soviet Union, numerous studies have con- firmed significant drawbacks in the spatial organization of Russian urban systems [1–6]. It is interesting to verify whether Russian economic geography still carries features inherited from the Soviet period. Gaining more clarity on the essence of the problem will better equip us for the necessary policy action. This study attempts to shed light on the evolution of Soviet urban systems and re-evaluate the insights presented in relevant scholarly work. One of the findings of the seminal work by Hill and Gaddy (2004) on Russia’s eco- nomic geography was that Russian urban systems do not follow rank-size distribution [7]. According to Hill and Gaddy (2004), such a result is expected given the legacy of peculiar Soviet economic management institutions. This legacy includes the Soviet command-style industrialization policy, the urban development policy backed by the Cold War ideologeme of avoidance of concentration of Soviet factors of production for population and industrial asset dispersion, as well as the pursuit of a regional equalization agenda. Hill and Gaddy (2004) inspired numerous studies that explored this matter further. It should be noted that most contemporary studies focus on the (modern) Russian Federation [2–4,6]. This paper aims to fill gaps in the existing research such as the absence of a com- prehensive historical examination of the rank-size rule or Zipf’s law for the pre-Soviet and Soviet periods. Additionally, relatively sparse scholarly contributions to the theme of Soviet economic geography tend to focus on the urban systems within the borders of Sustainability 2021, 13, 11389. https://doi.org/10.3390/su132011389 https://www.mdpi.com/journal/sustainability

Welcome message from author
This document is posted to help you gain knowledge. Please leave a comment to let me know what you think about it! Share it to your friends and learn new things together.
Transcript

sustainability
Article
On the Evolution of Hierarchical Urban Systems in SovietRussia, 1897–1989
Kazuhiro Kumo 1,* and Elena Shadrina 2
�����������������
Citation: Kumo, K.; Shadrina, E. On
the Evolution of Hierarchical Urban
Systems in Soviet Russia, 1897–1989.
Sustainability 2021, 13, 11389.
https://doi.org/10.3390/
su132011389
Academic Editor: Åsa Gren
Received: 6 September 2021
Accepted: 11 October 2021
Published: 15 October 2021
Publisher’s Note: MDPI stays neutral
with regard to jurisdictional claims in
published maps and institutional affil-
iations.
Copyright: © 2021 by the authors.
Licensee MDPI, Basel, Switzerland.
This article is an open access article
distributed under the terms and
conditions of the Creative Commons
Attribution (CC BY) license (https://
creativecommons.org/licenses/by/
4.0/).
1 Institute of Economic Research, Hitotsubashi University, 2-1 Naka, Kunitachi, Tokyo 186-8603, Japan2 School of International Liberal Studies, Waseda University, 1-6-1 Nishi-Waseda, Shinjuku-ku,
Tokyo 169-8050, Japan; [email protected]* Correspondence: [email protected]; Tel.: +81-42-580-8361
Abstract: One piece of evidence of the inefficiency of the spatial economy of modern Russia presentedin the seminal work of Hill and Gaddy (2004) is that Russian urban agglomerations are non-viable.This was demonstrated using Zipf’s rank-size distribution, which does not hold for Russian urbansystems. Hill and Gaddy explained this through the legacy of the Soviet command-administrativeplanning. Having constructed an original dataset, which incorporated comprehensive historicaldata for all the cities in the former Soviet Union republics and tested the rank-size distributions forthe respective years, the study yielded more nuanced findings. First, unlike the modern Russianhierarchical urban systems, the Soviet ones followed rank-size distribution fairly well. Second, theSoviet urban systems were evolving. In the late Imperial era and early Soviet period, they followedthe Zipf’s law prediction. However, between 1939 and 1959, the rank-size distribution diverged fromthe predicted one. Yet again, the Soviet hierarchical urban systems revealed a trend of convergencetoward the traditional rank-size distribution in the late Soviet era. A corollary to such evidencefrom data trajectory appears that the evolution of the Soviet hierarchical urban systems was notnecessarily the ultimate product of the urban development policies of the command-administrativesystem. It can be thus presumed that, contrary to the established belief, command administrativeurban development might be ineffectual even in centrally planned socialist economies.
Keywords: Zipf’s law; rank-size rule; hierarchical urban system; Soviet Union; Russia
1. Introduction
During the 30 years since the demise of the Soviet Union, numerous studies have con-firmed significant drawbacks in the spatial organization of Russian urban systems [1–6]. Itis interesting to verify whether Russian economic geography still carries features inheritedfrom the Soviet period. Gaining more clarity on the essence of the problem will betterequip us for the necessary policy action. This study attempts to shed light on the evolutionof Soviet urban systems and re-evaluate the insights presented in relevant scholarly work.
One of the findings of the seminal work by Hill and Gaddy (2004) on Russia’s eco-nomic geography was that Russian urban systems do not follow rank-size distribution [7].According to Hill and Gaddy (2004), such a result is expected given the legacy of peculiarSoviet economic management institutions. This legacy includes the Soviet command-styleindustrialization policy, the urban development policy backed by the Cold War ideologemeof avoidance of concentration of Soviet factors of production for population and industrialasset dispersion, as well as the pursuit of a regional equalization agenda. Hill and Gaddy(2004) inspired numerous studies that explored this matter further. It should be noted thatmost contemporary studies focus on the (modern) Russian Federation [2–4,6].
This paper aims to fill gaps in the existing research such as the absence of a com-prehensive historical examination of the rank-size rule or Zipf’s law for the pre-Sovietand Soviet periods. Additionally, relatively sparse scholarly contributions to the themeof Soviet economic geography tend to focus on the urban systems within the borders of
Sustainability 2021, 13, 11389. https://doi.org/10.3390/su132011389 https://www.mdpi.com/journal/sustainability

Sustainability 2021, 13, 11389 2 of 17
modern Russia, not the entire Soviet Union. Such an approach is questionable becauseurban systems take their shape within the territory of a country [8]. The present workexamines two principal aspects: whether the rank-size rule/Zipf’s law holds for historicaldata embracing the pre-Soviet and Soviet era and whether the rank-size rule/Zipf’s lawholds for the entire Union of Soviet Socialist Republics’ (USSR) urban population data. Indoing so, the study first constructs comprehensive urban population data for the entireformer Soviet Union based on the population censuses. It then examines the historicaldynamics of the Soviet urban systems.
If only the cities of modern Russia/the then Russian Soviet Federative Socialist Re-public (RSFSR) are sampled, the hierarchical urban systems do not follow the rank-sizerule as early as during the time of the Russian Empire. However, a comprehensive sampleconsisting of all the cities of the Russian Empire/the Soviet Union reveals that the urbanhierarchy systems appear to follow Zipf’s law. For the first time, it is presented that theSoviet hierarchical urban systems were evolving. Around World War II, deviations fromthe rank-size rule occurred. Yet another shift, this time toward Zipf’s law distribution, wasidentified in the late Soviet period.
The remainder of this paper is organized as follows. In Section 2, Zipf’s law literature isbriefly reviewed. Section 3 discusses the definitional aspects of Soviet urban agglomerationstudies and characterizes the Soviet urban policies. Further, empirical evidence of theevolution of Soviet hierarchical urban systems is presented. The final Section 6 concludes.
2. Rank-Size Rule and Related Literature
There is no strict theoretical basis for the rank-size rule [9]. However, the followingthree theories may be instrumental in analyzing the pattern of concentration of economicactivity and city size distribution. These theories are: (1) of increasing returns, (2) ofrandom growth, and (3) of locational fundamentals [10].
The increasing returns theory postulates that advantages of size may arise fromknowledge spillovers, labor market pooling, or the advantages of proximity for bothsuppliers and demanders. According to this approach, the distribution of city sizes mayarise from the technological characteristics of individual industries [11] or competitionamong locations for mobile factors of production [12]. Important themes within this streamof research include the possibilities of multiple equilibria, path dependency, and spatialcatastrophes [13].
The random growth theory holds that a distribution of cities of different sizes emergesfrom simple stochastic processes [14]. This approach embraces Zipf’s law, the centralconcept of this paper. Zipfian distribution stipulates that the number of cities with apopulation greater than A is proportional to 1/A. The idea that the form of the sizedistribution of cities follows the Pareto distribution was first indicated by [15]:
Pi × Ri = A
where Pi is the population size of city i, Ri is its rank, and A is a positive constant.
Ri = A × Pi−α
orln Ri = ln A − αln Pi
Zipf (1949) proposed that the distribution of city sizes not only follows a Pareto law,but also takes a special form with α = 1, with the result being that A is the size of thelargest city [16]. It was long believed that Zipf’s law (or the rank-size rule) holds for mostcountries [9,17] and that it can even be verified at the regional level [18]. While numerousstudies on urban agglomerations in large samples of countries have confirmed the rank-size relationship, several examinations have found that the rank-size rule does not holdstrictly [19–21]. Attempting to explain such mixed results, Arshad et al. (2018) indicated
Sustainability 2021, 13, 11389 3 of 17
that consistency in the definition of an urban system, as well as improvements in empiricalmethods, could result in a more accurate fulfillment of Zipf’s law [9].
The locational fundamentals theory is a variant of the random growth theory. How-ever, it is not the city growth that is random but the fundamental characteristics of locations.The locational fundamentals theory predictions about the size of specific locations beingrobust to large temporary shocks were confirmed for a number of countries that had expe-rienced massive war destruction [10,22–24]. The evolutionary process of hierarchical urbansystems has been analyzed from different perspectives: a gradual increase in populationsize [25], the impact of institutional and technological changes [26], the effect of commut-ing and transportation costs [27], politically determined factors, including the legacy ofdemocratization and federalism (via taxation and transfers policies), and development ofinterregional infrastructure [28], to name but a few.
Before examining whether the Soviet urban systems followed the rank-size rule, Sovieturban studies and urban policies are reviewed.
3. The Subject Matter: Soviet City and Urban Agglomeration3.1. Types of Soviet Cities
There are different approaches to identifying the typology of Soviet cities. Focusing ona historical perspective, Frost (2018) distinguished between two groups of cities—“socialistcities” formed by the command-administrative style for the sake of accelerated industrial-ization and cities of “permanent transition,” which first saw the arrival of socialism, thenexperienced post-socialist transformations [29]. More traditional systematization highlightsthe functional aspect. In line with this, there are two types of cities: centers of trade, admin-istration, and cultural life, and highly localized clusters of cities with specialized industrialfunctions. Harris pointed that “nearly 90 per cent of the 304 larger Soviet cities fall intotwo classes: diversified administrative centres and industrial cities” [30] (p. 61), which isthe result of the political administrative structure that underpinned the Soviet economy.
Typically, the capitals of Soviet republics were their largest cities. This can be explainedby the multifaceted role played by such cities. For example, Moscow used to function as aquadruple capital, specifically, that of the USSR, RSFSR, and Moscow region as well as thecenter of the Central Economic Region. Similarly, the size of Leningrad (currently SaintPetersburg) can be linked to its former role as the capital of Imperial Russia as well as itsrole as the center of the Leningrad region and the Northwestern Economic Region duringthe Soviet era. Typically, there was a “close association of size of the administrative centers. . . and the degree of development of industry” [30] (p. 82). While administrative citieswere “widely spaced from one another, industrial cities displayed sharp localization andclustering” near the sources of natural resources or transportation routes [30] (p. 90).
Planning authorities have practiced economic zoning since the early Soviet era, withthe Economic Regions being the units for the territorial distribution of plans. In the latestSoviet taxonomic design of 1963, there were 18 Economic Regions. Ten were located in theRSFSR and three in the Ukrainian Soviet Socialist Republic (SSR), while the BelorussianSSR and the Kazakh SSR had one each. The center of the Baltic Economic Region was Riga,of the Central Asian—Tashkent, and of the Caucasus—Tbilisi. The largest cities in therespective territories were the centers of their Economic Regions.
In the Soviet planning tradition, the task of accelerated comprehensive development ofresource-rich regions was implemented through the introduction of another planning unit—theterritorial-production complex [31], which facilitated industry-driven urban agglomeration.
3.2. Delineation of Urban Agglomerations in the Soviet Union
The USSR lacked clear parameters for a “city.” The General Statute on Urban andRural Settlements of 15 September 1924 classified all populated places of the RSFSR intourban settlements or cities, rural settlements or peasant villages and cottages, and workers’and resort settlements. An adult population of not less than 1000 and non-agriculturalpursuits as the primary occupation of at least two-thirds of the residents were listed as
Sustainability 2021, 13, 11389 4 of 17
the threshold criteria for the urban category. Later, a population of 12,000 was fixed as theminimum numerical requirement for a city [32]. Although the latter was frequently usedas the all-Union standard, the republican criteria varied greatly. De facto, the “city” titlecould have been used discretely for even much smaller settlements.
Similarly, there was definitional ambiguity regarding “urban agglomeration” [33–36].Early Soviet approaches to defining urban agglomeration can be dated to the 1960s [37].Within the functional-settlement paradigm, the individual approach relied on empiricalmethodologies adapted to study specific urban agglomerations. This non-standardizedapproach incorporated data (traffic flows and transport accessibility, real migration flows,population gravitation towards certain centers, etc.) obtained during field studies. Inthe 1980s, a more universal network-wide approach to defining urban agglomerationswas developed, and the respective study methods were applied. This approach relied onstatistics, allowing for the computation of relatively simple and universal metrics gaugingthe degree of population concentration.
Underlining the lack of terminological precision peculiar to the Soviet era, Antonov(2020) offered definitional references to urban agglomeration [37]. In the late Soviet pe-riod, the following standardized methodology for urban agglomeration delimitation wasdeveloped (Table 1).
Table 1. Standardized methodology for urban area delimitation.
Stages ofDelimitation Criteria
Urban Region
LargestBig
Polycentric Monocentric
1 core city large city,≥250,000
two big cities (≥100,000)within 50 km of each other big city (≥100,000)
2 urban area boundaries1.5 h from core city and 0.5 hfrom big and middle towns
on the periphery
1 h from core city and 0.5 hfrom middle towns on the
periphery
1 h from core city and 0.5 hfrom middle towns on the
periphery
3 satellite zone ≥4 urban settlements ≥6 urban settlements ≥4 urban settlements
4 development coefficient ≥1 ≥1 ≥2
Note: Development coefficient (K dev.) is defined as (K dev.) = [P × (M × m + N × n)], where P is the population of the urban area, M and Nare the number of cities and urban-type settlements, respectively, and m and n are the shares of M and N in the total population of theurban area, respectively. Source: adapted from [36].
The Soviet practice was centered on the functional urban areas approach, but it differedsignificantly from the Western tradition wherein metropolitan areas were/are delineatedbased on two key criteria: the population size and the intensity of pendulum migration tothe core city. The latter was assessed not based on calculation (as was the Soviet traditionof assessing the size of the population living within isochrones of transport accessibility)but based on the actual flows from detailed and relatively reliable population censuses.A limited amount of Soviet research mentions the within-metropolitan area pendulummigration criteria as an attribute of the Soviet urban area. For instance, Vishnevskyi (1967)defined the periphery to the core migration ratio as not less than 25% [38]. Strongina (1970)and Zaslavskiy et al. (1988) set a labor migration threshold of not less than 20%, includingnot less than 12% migration to the core city [39,40]. Hence, a serious limitation of the Sovietapproach was its normative character. Such an approach disregarded the differences incore city sizes; urban areas were delineated based on the same criteria.
3.3. Soviet Urbanization Policies
The Soviet Union experienced urbanization at an unprecedented pace from the outsetof the Soviet era and throughout the 1970s [30]. Soviet urbanization was a product of apolicy mix which comprised regulation of internal migration, caps on large cities’ growth,industrialization modeled on the development of medium-sized and small cities, regional
Sustainability 2021, 13, 11389 5 of 17
policies targeted at easing interregional economic differences through state investment,subsidies, and transfers, among other levers.
3.3.1. Regulation of Interregional Migration
Propiska, an instrument for space equalization, was both a residency permit and amigration-recording tool. The Soviets resumed the Russian Empire’s practice of propiskain 1932. By 1935, the nature of registration became more permissive. Literally, propiskacould have been denied to citizens with a willingness to migrate but no solid employmentprospects. Propiska in the most attractive cities (Moscow and Leningrad) was stringentand it required the fulfillment of a set of conditions. Even enrolment in a higher educationinstitution would only grant temporary propiska.
It is important to note that between 1935 (response to the intensified rural outmigrationin the aftermath of collectivization) and 1974, rural outmigration was nearly impossiblefor the village residents who did not possess passports. The issuance of passports was atthe discretion of the village soviets/kolkhoz administrative quarters. The young leavingfor their studies or army service could obtain their documents more easily, while others(at some point, as much as 37% of the total Soviet population) were literally limited totheir home villages throughout their entire lives, pretty much as it was during the serfdomera [41].
The alleviation of propiska restrictions enhanced interregional migration, which wasespecially important for the development of the eastern regions. The Far East was the onlyregion that steadily recorded positive net migration during the end of the USSR [42].
3.3.2. City Size Control
City size control was a doctrine of the Soviet government [43,44] which, in a certainway, was inherited from the tsarist governments [45]. The Soviet Union practiced limitingcity growth (especially after 1959) in order to achieve economic sustainability, enableeffective administration, and avoid overconcentration of population in the more developedwestern part of the USSR. In addition, the preference for a dispersed population andindustry was dictated by the communist leaders’ security and defense considerations [46].Restrictive policies were applied to fifteen Soviet cities, including Moscow, Leningrad, andKiev [32,47].
In the 1960s, the concentration of economic activity and population in the Europeanpart of the Soviet Union was perceived as a problem. Accordingly, the 22nd (1961) and 23rd(1966) Congresses of the Communist Party of the Soviet Union adopted specific programsto foster the growth of small and middle-sized cities [30].
Among the Soviet plans were the General Scheme of Productive Forces Distributionand the General Scheme of Population Distribution of the USSR [48,49]. The latter proposedthe five-tier hierarchy of urban systems. This meant an all-union system of settlementswith the center at Moscow, regional systems with the center at a city with a 1 to 3 millionpopulation, large group systems with the center at a city with a population between 500,000to 1 million, middle-size group systems with the center at a 100,000 to 500,000 populationcity, and small group settlement systems with the center at a town with 10,000 to 100,000inhabitants. Thus, between the 1959 and 1970 population censuses, the Soviet Union wasseeking a more balanced development of settlement networks by restraining the growth oflarge cities (over 1 million) and promoting the role of urban settlements with populationsunder 1,000,000, especially settlements with populations below 100,000 [50–52].
3.3.3. Regional Equalization
The Soviet ideology aimed to assemble an egalitarian space with uniform cities evenlydistributed across the USSR. However, the pre-Soviet history of urbanization, as well asthe economics of shortage, among other factors, affected policy implementation. The rateof urbanization varied across the Soviet Republics. Kazakhstan saw the most dramaticurbanization, reaching 57.2% by 1989. In contrast, Uzbekistan experienced relatively
Sustainability 2021, 13, 11389 6 of 17
modest progress, recording 41% in 1989. The most urbanized Soviet Republic was theRSFSR, with a 73.6% urbanization rate.
Although the urbanization progress was affected by the republics’ specialization(agricultural versus industrial), it was primarily affected by the Soviet policies for urbandevelopment, which aimed to achieve a more uniform distribution of cities across the SovietUnion. During 1947–1989, the number of cities in Latvia decreased by two, Turkmenistanacquired four new cities, and Kyrgyzstan founded nine new cities. Simultaneously, thelargest number of new cities appeared in the RSFSR (305), Ukraine (176), Uzbekistan(97), and Kazakhstan (48) [29]. This may suggest that the implementation of the Sovieturban development policy came at the expense of certain regions. Industrial centers wereespecially promoted in Siberia, the Far East, and Central Asia [8]. Senyavskiy (2019) arguedthat the movement of the city-forming industrial base to the East and Central Asia, with thesubsequent development of new industrial centers, was largely a product of the transfer ofthe Soviet productive assets from the European part to regions far from the theater of theSoviet-German War [53].
The Soviet Union steadily pursued two goals: modernization and regional equal-ity [54], or growth and equality [55]. Senyavskiy (2019) proposed that urbanization wasprompted by the pursuit of one of the key Soviet ideologemes—leveling the differences insocio-economic advancements across the national republics [53]. The triangular pattern ofresource distribution—plentiful fuels and raw materials in the Asiatic part (conventionally,Siberia), majority of the population and the most developed industries in the Europeanpart, and an ample and rapidly increasing workforce in Central Asia—made Soviet spatialeconomic planning a multifaceted problem. The equalization of economic developmentwas attempted through administrative decisions about the distribution of resources, mostlyinvestments. Such policies resulted in growth centers shifting from the European part ofthe USSR to priority areas in greater Siberia, with backwash effects on Central Asia [54].
3.3.4. Forced Urbanization
The Soviets’ urban policies were distinct in many respects. The most egregious ofthem was the notorious GULAG—forced labor camps—system, which had profound andlong-lasting effects on the spatial economy of the Soviet Union [56]. Scholars differ in theirassessments of the scale of the Soviet GULAG system which was composed of 475 camps(of which 408 were located inside the borders of modern Russia). Cumulative data for the1929 to 1953 period shows that the number of GULAG prisoners ranged from 4 to 9 millionpeople [57,58]. Siddiqi (2021) estimates that 18 million people passed through the GULAGand approximately 2.5 million people were in the camps in the early 1950s [59].
In the process of dismantling the GULAG system, a large number of remote settlementsoperated under the secrecy regime were turned into closed cities [59]. In the RSFSR,the majority of such cities were located in the European part, the North, and the FarEast. Although closed cities were not penitentiary settlements, they retained some of theGULAG’s traits dictated by the regime of rigid secrecy. Such cities could not have beenincorporated into the network of urban agglomerations, thus propelling the phenomenonof atomized urbanism [59].
4. Rank-Size Rule and Urban Development in Studies on Russia/USSR
As domestic Soviet urban studies were unique in their abundance of normativeapproaches and absence of statistical approaches, most of the existing quantitative scholarlywork was undertaken by foreign researchers. Soviet urban studies on hierarchical urbansystems are scarce. Drawing upon the available statistical explorations of urban growthand hierarchical urban systems in the Soviet Union, the key findings can be summarizedas follows (Tables 2 and 3). Urbanization accelerated around the late Soviet period, andthe RSFSR took the lead in this sphere with the largest number of metropolitan areas. Therepublics’ capitals grew faster in the late Soviet era. In the course of urbanization, a city’ssize might have initially been affected by its historical size, transport infrastructure, and

Sustainability 2021, 13, 11389 7 of 17
functional role. However, non-administrative cities in the non-European part of the USSRgrew faster, possibly owing to the government-led development projects for the peripheralregions. It is almost apparent that urbanization was enhanced by industrialization, butsocial aspects were unattended, and restrictive migration policies constrained the growthof cities (Table 2).
Table 2. Examination of urban development patterns.
Source Sample Method Findings
Harris 1972 [30]
633 cities of ≥15,000 in theRSFSR; 614 urban settlements of≥10,000 in the rest of the USSRfor 1897, 1926, 1939, and 1959
Principal component analysis,30 characteristics checked.
Size, density, and growth account for 80% ofthe variation among the 30 variables; city’s ageand latitude do not show variation.
Largest correlation of variables with sizefactor: population in 1959; city’s functions(manufacturing); transport facilities (airlines);and spacing (proximity to the next largestcity).
Largest correlation of variables with densityfactor: positive for urban population potential,especially within economic regions; negativefor distance to the nearest neighbor, nearestlarger neighbor, and Moscow.
Largest correlation of variables with growthfactor: increase in population in Soviet time;distance from Moscow, particularly in theeastern part; clustering in non-administrativesettlements.
Rowland 1998 [33]
Cities of ≥15,000 in the USSR,1897–1989
Computations of the number ofmetropolitan areas, (1)
population of metropolitanareas, and shifts in both.
Number of metropolitan areas increased from23 in 1970 to 40 in 1989; the metropolitanpopulation doubled from 45 M to 79.9 M;urban population concentrated inmetropolitan areas.
Russia, 1897–1997 Computations of the number ofmetropolitan areas.
Despite deconcentration/suburbanization,metropolitan areas were central citydominated.
Computations of populationand share of population incentral cities, inner suburbs,and outer suburbs inmetropolitan areas.
The formation and growth of metropolitanareas were enhanced by rapid industrializationat the expense of social aspects.
Gang and Stuart 1999 [60] 308 cities of ≥50,000, 1939, 1959,1970, 1979, and 1989
Net migration rates.
77 of the 308 cities were under migrationrestrictions.
Restrictions mattered; restrictions matteredless in earlier post-war period and morethereafter through the late 1980s.
Faster expansion of cities in the RSFSR than inother republics.
Republican capitals grew faster.
Note: (1) “[A]rea with an urban population of one million or more people based on the summation of the population residing in a majorcentral city and other urban centers of 15,000 and over within a 50-mile radius (straight-line distance) of that central city” [33] (p. 273).Source: authors.
The scope of studies on the applicability of the rank-size rule to the Soviet Unionis limited (Table 3). Several generalizing observations can be made based on the studiesreviewed. In the Soviet hierarchical urban systems, large cities dominated. Apparently, thedensity of transport infrastructure was an important factor in the development of urbanhierarchy. Finally, the rank-size rule was not observed in the USSR in general, with city sizesbeing more homogeneous than predicted by Zipfian distribution. Two size groups, namely,the large and small cities, deviated especially further from the predicted distribution.

Sustainability 2021, 13, 11389 8 of 17
Table 3. Evaluation of the applicability of the rank-size rule (1).
Source Sample Method Findings
Rosen and Resnik 1980 [19] 225 cities of ≥100,000, 1970 Rank-size rule
The rule does not hold.
The size of cities is more homogenous thanpredicted.
Small cities are marked outliers.
Clayton and Richardson1989 [45]
514 cities of ≥50,000, 1959, 1970,and 1979 Rank-size rule
10 of the 11 largest cities are major outlierswith their size below the regression plane.
Large and small cities are major outliers.
Restrictions on city size and considerableoutmigration are likely reasons.
Medvedkov 1990 [52]
Cities of ≥20,000 in USSR,Ukraine, and six EasternEuropean members of theWarsaw Pact (commandeconomies), 1959, 1970, 1976,1979, and 1986
Modified rank-size approach toquantify urban hierarchysystems (2) log(H(j)) =log(H(1)/K)) − b × log(j)
Impact of central planning on urbanhierarchy systems is debatable; findingsvary greatly across the eight cases studied.
Basic Canonical CorrelationModel (3) Z = F(G)
Density of freight transported by railroads,density of railroads, density of the networkof cities, and index of shape for the nationalterritory are important variables affectingSoviet urban hierarchy systems.
Pumain et al. 2015 [61]91–1929 cities of ≥ 10,000,1840–2010; Russia is not themain target
Zipf’s lawDuring the Soviet era, urban growth wasrestrained, resulting in cities not exceedingone million inhabitants.
Notes: (1) As for the location of major Soviet cities, see the map of cities of the Soviet Union in [62] (pp. 109–110) and [63] (p. 58) for reference.The three-dimensional population distribution map in [52] (p. 12) may help intuitive understanding on the location of Soviet population;(2) H(j) is the population of the jth city; j—rank of a city in a list arranged by decreasing order of city size; K—primacy coefficient to signal acharacteristic of the biggest city, a measure of its being within or outside the tendency for all other cities; b—the parameter of hierarchygradient, numerically the same as the slope of regressing log H on log j; (3) Z—“Zipf” and G—“geography” multidimensional matrices.G-set incorporates such variables as density of freight transported by railroads, density of railroads, density of the network of cities withpopulation greater than 20,000 per 10,000 km2, index of shape for the national territory, and Nearest Neighbor index. Source: authors.
Thus, the effects of Soviet urban policies, which were direct through migration controland indirect through industrialization, have been acknowledged in previous research.Hill and Gaddy (2004) analyzed urban data from the population census for 2002 anddemonstrated that the third to tenth largest cities in terms of population were almostidentical in population size [7]. This means that several cities were too small comparedwith the scales that could be expected from Zipf’s law. Hill and Gaddy (2004) explainedthis phenomenon as an effect of the Soviet era regulation of population inflows [7].
While this result seems to hold for the cities of the Russian Federation, it is importantto remember that the urban system shapes within a country. The Russian Federation, as isknown, was founded at the end of the 20th century. The examination of the hierarchicalurban systems of the entire Soviet Union until its demise might help disclose new evidence.Another aspect explored in this study is the historical perspective of this phenomenon. Ifthe deviation from Zipf’s law is a consequence of the Soviet urban policies, it is reasonableto assume that the deviation from the rank-size rule should increase over time. These novelaspects are examined in the remainder of this paper.
Examining the previous studies, especially those on the evaluation of rank-size dis-tribution of Soviet cities, one can notice the following gaps. The studies conducted so farnever thoroughly examined the hierarchical urban systems of the broadly defined Russianterritory from the Imperial era to the late Soviet period. Within a narrow timeframe (theydiscussed mainly the late Soviet era’s urban systems), the applicability of rank-size rulewas generally, although not definitely, rejected. After the collapse of the Soviet Union, theexisting studies targeted the urban systems of the modern Russian Federation and firmlyrejected the applicability of Zipf’s law, arguing that this was an ultimate result of the Sovieturban policies.
These are the principal inconsistencies persisting in scholarly accounts in this fieldwhich this article addresses.
Sustainability 2021, 13, 11389 9 of 17
5. Verification of Zipf’s Law for Historical Data for Soviet Russia, 1897–19895.1. Data and Method
The original dataset constructed for this study includes the lists of city names and theirpopulation data at the seven-year points for the Russian Empire and the Soviet Union [64].Data on the population of the Russian Empire and the Soviet Union’s cities in 1897, 1939,1959, 1970, 1979, and 1989 were acquired. Since urban systems can be discussed within theterritory of one country, the data until the dissolution of the USSR were collected. Based onthe original dataset, the lists of cities, urban-type settlements, workers’ settlements, andother urban type category townships for all the years were composed.
Delimitation of the territory (of Russia or the USSR) was a serious problem in compil-ing the data. For data of the 1897 Imperial census, cities of what are now Poland, Turkey,and Finland were intentionally excluded from the original set. Because the Baltic nations—Lithuania, Estonia, and Latvia—became independent states after the demise of the RussianEmpire through the outbreak of World War II, these three countries were not included in the1926 and 1939 Soviet population censuses. To enable consistent examination throughoutthe population history of the Russian Empire and the Soviet Union, this study incorporatedthe Baltic states’ population census data for the closest other years. In other words, as aproxy for the 1926 Soviet census data, the data of Estonia’s 1922 census, Lithuania’s 1923census, and Latvia’s 1925 census were included. Census data of Estonia and Latvia for1934 and 1935, respectively, were included as a proxy for the 1939 Soviet census data. Itis worthwhile to note that because Poland occupied nearly 1/3 of Lithuania’s territory,including its capital Vilnius, during the interwar period (1920-1939), the respective years’data for many cities in Lithuania are missing. As no population census was conductedin Lithuania from 1923 to 1959, no approximate population data could be obtained forLithuania from 1939. For more details on data please refer to [64].
5.2. Evaluating the Law: Territorial and Historical Perspectives Unified
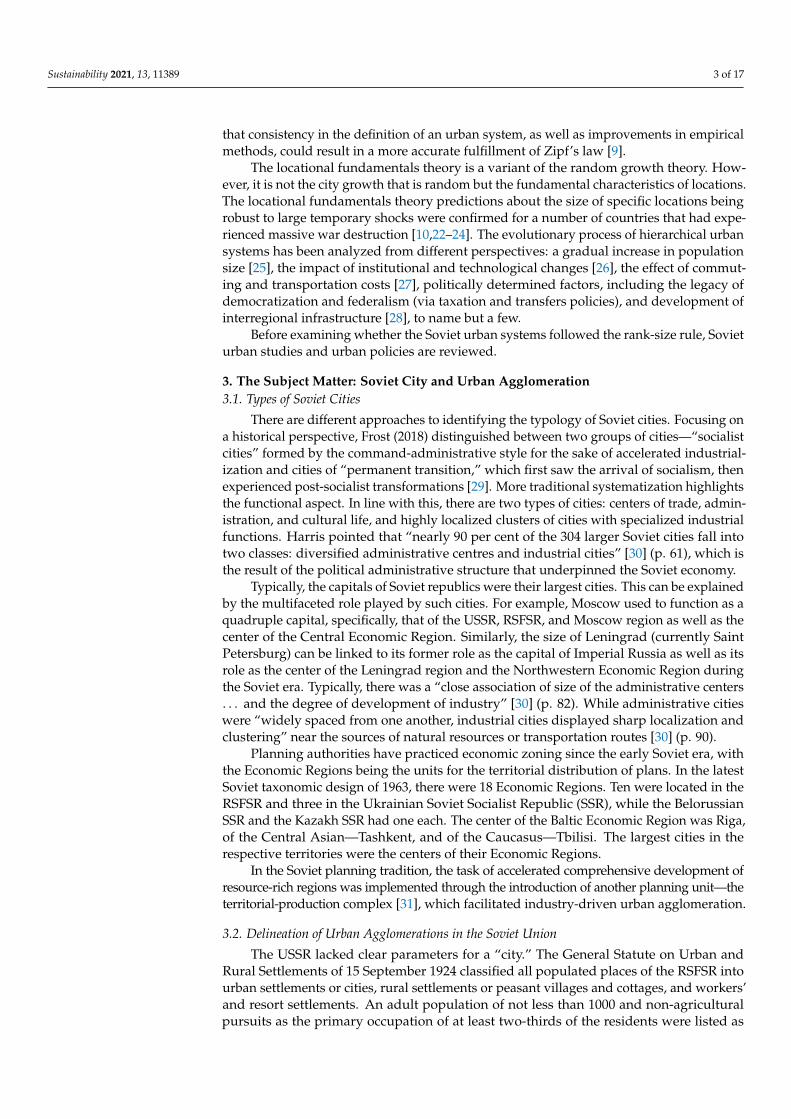
Hill and Gaddy’s (2004) work and related literature on the evaluation of the applica-bility of the rank-size distribution of Russian cities argued that cities in Russia are too smalland do not follow Zipf’s law or the rank-size rule [7]. This point can be understood fromFigure 1. Urban population data for the modern Russian territory from the 1989 Sovietpopulation census results are plotted in a full logarithmic chart for the 100 largest cities.If the cities follow the rank-size rule, they fall on the log–linear curve. The cities that arethird to tenth largest in terms of population, indicated by a dashed line, are smaller thanpredicted by Zipf’s law. Although Hill and Gaddy (2004) used data for 2002, the results arealmost the same [7].
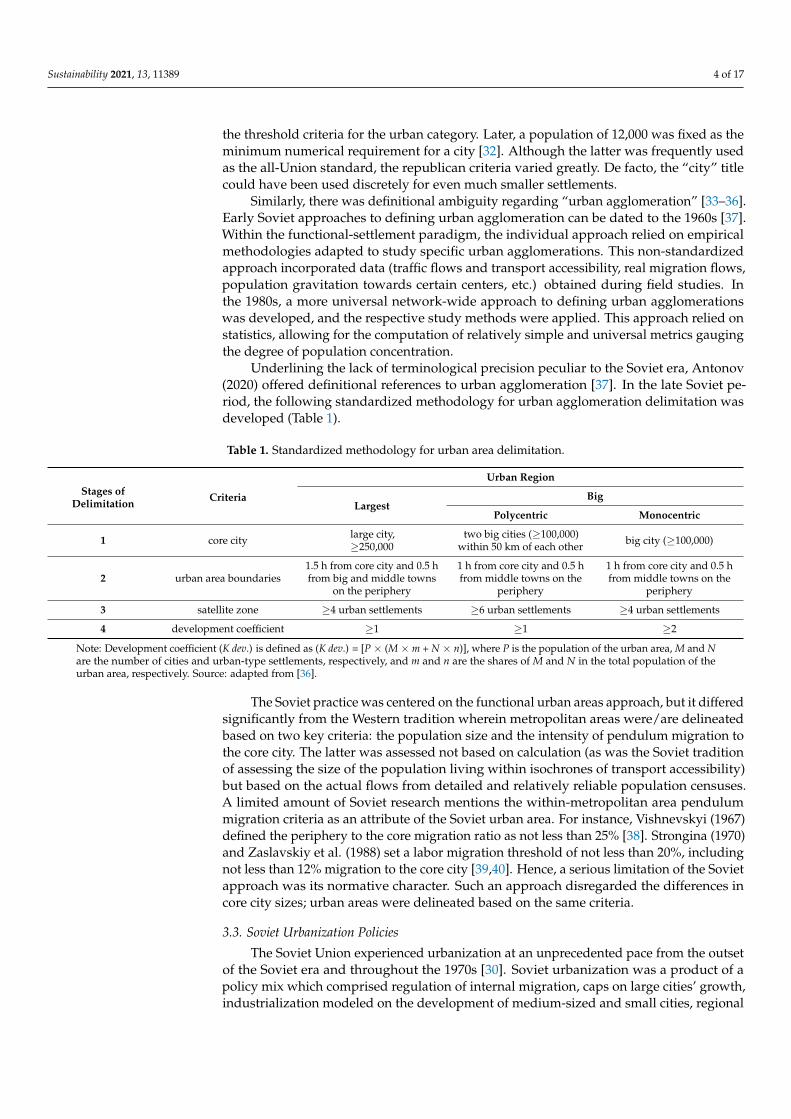
If the assumptions in Hill and Gaddy’s (2004) work and other previous literaturewere correct, it could be expected that the deviation from Zipf’s law would be small in theearly Soviet period and, over time, it would become larger [7]. To verify this, figures aredrawn for 1897, the Imperial era, and up to 1959 (the mid-Soviet era). This exercise helpsreveal similarities across patterns in the established urban hierarchy in the modern Russianterritory (Figure 2). Note that the key elements of interregional migration control, such aspropiska, were introduced after 1926.

Sustainability 2021, 13, 11389 10 of 17
Sustainability 2021, 13, x FOR PEER REVIEW 10 of 18
collected. Based on the original dataset, the lists of cities, urban-type settlements, workers’ settlements, and other urban type category townships for all the years were composed.
Delimitation of the territory (of Russia or the USSR) was a serious problem in compiling the data. For data of the 1897 Imperial census, cities of what are now Poland, Turkey, and Finland were intentionally excluded from the original set. Because the Baltic nations—Lithuania, Estonia, and Latvia—became independent states after the demise of the Russian Empire through the outbreak of World War II, these three countries were not included in the 1926 and 1939 Soviet population censuses. To enable consistent examination throughout the population history of the Russian Empire and the Soviet Union, this study incorporated the Baltic states’ population census data for the closest other years. In other words, as a proxy for the 1926 Soviet census data, the data of Estonia’s 1922 census, Lithuania’s 1923 census, and Latvia’s 1925 census were included. Census data of Estonia and Latvia for 1934 and 1935, respectively, were included as a proxy for the 1939 Soviet census data. It is worthwhile to note that because Poland occupied nearly 1/3 of Lithuania’s territory, including its capital Vilnius, during the interwar period (1920-1939), the respective years’ data for many cities in Lithuania are missing. As no population census was conducted in Lithuania from 1923 to 1959, no approximate population data could be obtained for Lithuania from 1939. For more details on data please refer to [64].
5.2. Evaluating the Law: Territorial and Historical Perspectives Unified Hill and Gaddy’s (2004) work and related literature on the evaluation of the
applicability of the rank-size distribution of Russian cities argued that cities in Russia are too small and do not follow Zipf’s law or the rank-size rule [7]. This point can be understood from Figure 1. Urban population data for the modern Russian territory from the 1989 Soviet population census results are plotted in a full logarithmic chart for the 100 largest cities. If the cities follow the rank-size rule, they fall on the log–linear curve. The cities that are third to tenth largest in terms of population, indicated by a dashed line, are smaller than predicted by Zipf’s law. Although Hill and Gaddy (2004) used data for 2002, the results are almost the same [7].
Figure 1. City size distribution for the 100 largest cities in Russia (RSFSR), 1989. Source: authors, based on an original dataset [63].
If the assumptions in Hill and Gaddy’s (2004) work and other previous literature were correct, it could be expected that the deviation from Zipf’s law would be small in the early Soviet period and, over time, it would become larger [7]. To verify this, figures are drawn for 1897, the Imperial era, and up to 1959 (the mid-Soviet era). This exercise helps reveal similarities across patterns in the established urban hierarchy in the modern
Figure 1. City size distribution for the 100 largest cities in Russia (RSFSR), 1989. Source: authors,based on an original dataset [64].
Sustainability 2021, 13, x FOR PEER REVIEW 11 of 18
Russian territory (Figure 2). Note that the key elements of interregional migration control, such as propiska, were introduced after 1926.
Figure 2. City size distribution in Russia for the 100 largest cities (1959, 1939, 1926, and 1897). Source: authors, based on an original dataset [63].
Figure 2 suggests that during the period of Imperial Russia and throughout the entire Soviet era, cities that were third to tenth largest in terms of population were smaller than expected. This fact indicates that the deviation from Zipf’s law in modern Russia does not originate in the urban development policy or population redistribution policy implemented during the Soviet era.
Possible explanations can be derived directly from the data. For this purpose, the graph is drawn using population data for the top 100 cities throughout the Soviet Union, not only the cities in the territory of the modern Russian Federation. On the left side of Figure 3, all the Soviet cities of 1989 are shown, and the RSFSR is shown on the right for better comparison.
Figure 2. City size distribution in Russia for the 100 largest cities (1959, 1939, 1926, and 1897). Source: authors, based on anoriginal dataset [64].
Figure 2 suggests that during the period of Imperial Russia and throughout the entireSoviet era, cities that were third to tenth largest in terms of population were smaller thanexpected. This fact indicates that the deviation from Zipf’s law in modern Russia does not
Sustainability 2021, 13, 11389 11 of 17
originate in the urban development policy or population redistribution policy implementedduring the Soviet era.
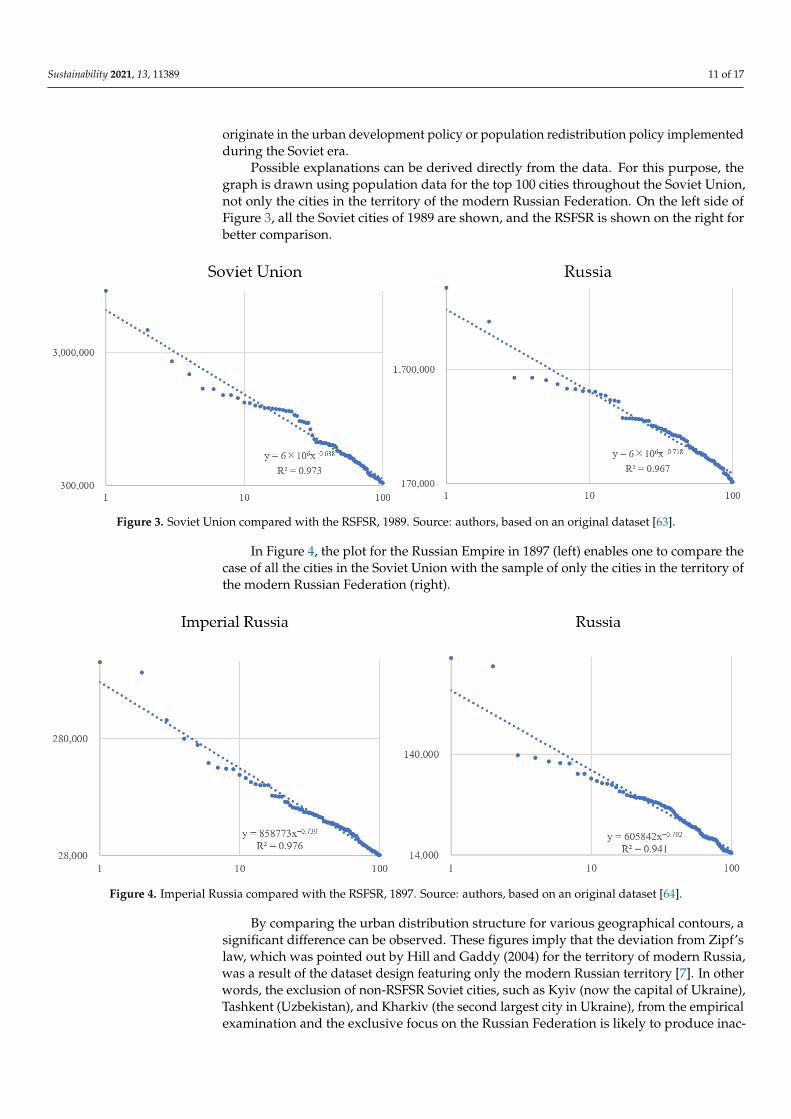
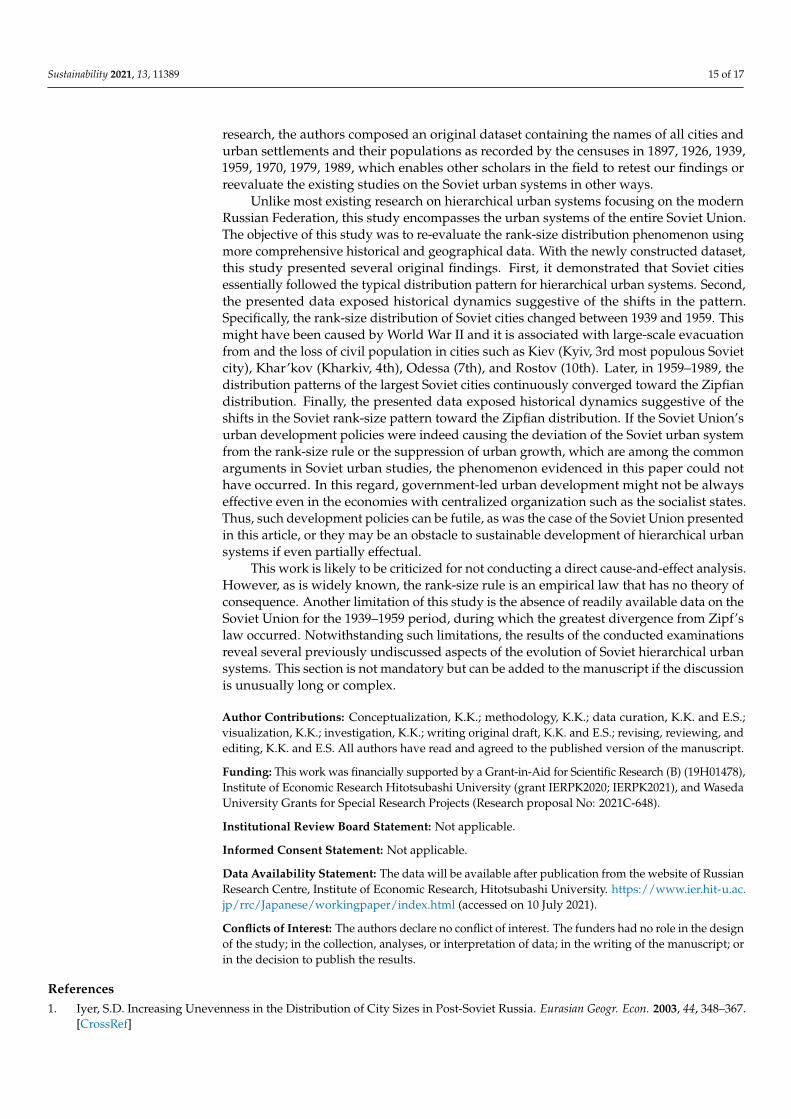
Possible explanations can be derived directly from the data. For this purpose, thegraph is drawn using population data for the top 100 cities throughout the Soviet Union,not only the cities in the territory of the modern Russian Federation. On the left side ofFigure 3, all the Soviet cities of 1989 are shown, and the RSFSR is shown on the right forbetter comparison.
Sustainability 2021, 13, x FOR PEER REVIEW 12 of 18
Figure 3. Soviet Union compared with the RSFSR, 1989. Source: authors, based on an original dataset [63].
In Figure 4, the plot for the Russian Empire in 1897 (left) enables one to compare the case of all the cities in the Soviet Union with the sample of only the cities in the territory of the modern Russian Federation (right).
Figure 4. Imperial Russia compared with the RSFSR, 1897. Source: authors, based on an original dataset [64].
By comparing the urban distribution structure for various geographical contours, a significant difference can be observed. These figures imply that the deviation from Zipf’s law, which was pointed out by Hill and Gaddy (2004) for the territory of modern Russia, was a result of the dataset design featuring only the modern Russian territory [7]. In other words, the exclusion of non-RSFSR Soviet cities, such as Kyiv (now the capital of Ukraine), Tashkent (Uzbekistan), and Kharkiv (the second largest city in Ukraine), from the empirical examination and the exclusive focus on the Russian Federation is likely to produce inaccurate results. Although Markevich and Mikhailova (2013) and others speculated about such a probability [8], no study thus far has offered a quantitative elaboration of this. The examinations presented in this section confirm the problem involved with the exclusion of Soviet cities for the evaluation of the applicability of the rank-size rule for the target area.
To identify whether (and if, when) any shifts in city rank distribution occurred during the Soviet era, the urban population data from the population censuses for all available years for the entire territory of the Soviet Union are plotted in Figure 5.
Figure 3. Soviet Union compared with the RSFSR, 1989. Source: authors, based on an original dataset [63].
In Figure 4, the plot for the Russian Empire in 1897 (left) enables one to compare thecase of all the cities in the Soviet Union with the sample of only the cities in the territory ofthe modern Russian Federation (right).
Sustainability 2021, 13, x FOR PEER REVIEW 12 of 18
Figure 3. Soviet Union compared with the RSFSR, 1989. Source: authors, based on an original dataset [63].
In Figure 4, the plot for the Russian Empire in 1897 (left) enables one to compare the case of all the cities in the Soviet Union with the sample of only the cities in the territory of the modern Russian Federation (right).
Figure 4. Imperial Russia compared with the RSFSR, 1897. Source: authors, based on an original dataset [64].
By comparing the urban distribution structure for various geographical contours, a significant difference can be observed. These figures imply that the deviation from Zipf’s law, which was pointed out by Hill and Gaddy (2004) for the territory of modern Russia, was a result of the dataset design featuring only the modern Russian territory [7]. In other words, the exclusion of non-RSFSR Soviet cities, such as Kyiv (now the capital of Ukraine), Tashkent (Uzbekistan), and Kharkiv (the second largest city in Ukraine), from the empirical examination and the exclusive focus on the Russian Federation is likely to produce inaccurate results. Although Markevich and Mikhailova (2013) and others speculated about such a probability [8], no study thus far has offered a quantitative elaboration of this. The examinations presented in this section confirm the problem involved with the exclusion of Soviet cities for the evaluation of the applicability of the rank-size rule for the target area.
To identify whether (and if, when) any shifts in city rank distribution occurred during the Soviet era, the urban population data from the population censuses for all available years for the entire territory of the Soviet Union are plotted in Figure 5.
Figure 4. Imperial Russia compared with the RSFSR, 1897. Source: authors, based on an original dataset [64].
By comparing the urban distribution structure for various geographical contours, asignificant difference can be observed. These figures imply that the deviation from Zipf’slaw, which was pointed out by Hill and Gaddy (2004) for the territory of modern Russia,was a result of the dataset design featuring only the modern Russian territory [7]. In otherwords, the exclusion of non-RSFSR Soviet cities, such as Kyiv (now the capital of Ukraine),Tashkent (Uzbekistan), and Kharkiv (the second largest city in Ukraine), from the empiricalexamination and the exclusive focus on the Russian Federation is likely to produce inac-

Sustainability 2021, 13, 11389 12 of 17
curate results. Although Markevich and Mikhailova (2013) and others speculated aboutsuch a probability [8], no study thus far has offered a quantitative elaboration of this. Theexaminations presented in this section confirm the problem involved with the exclusion ofSoviet cities for the evaluation of the applicability of the rank-size rule for the target area.
To identify whether (and if, when) any shifts in city rank distribution occurred duringthe Soviet era, the urban population data from the population censuses for all availableyears for the entire territory of the Soviet Union are plotted in Figure 5.
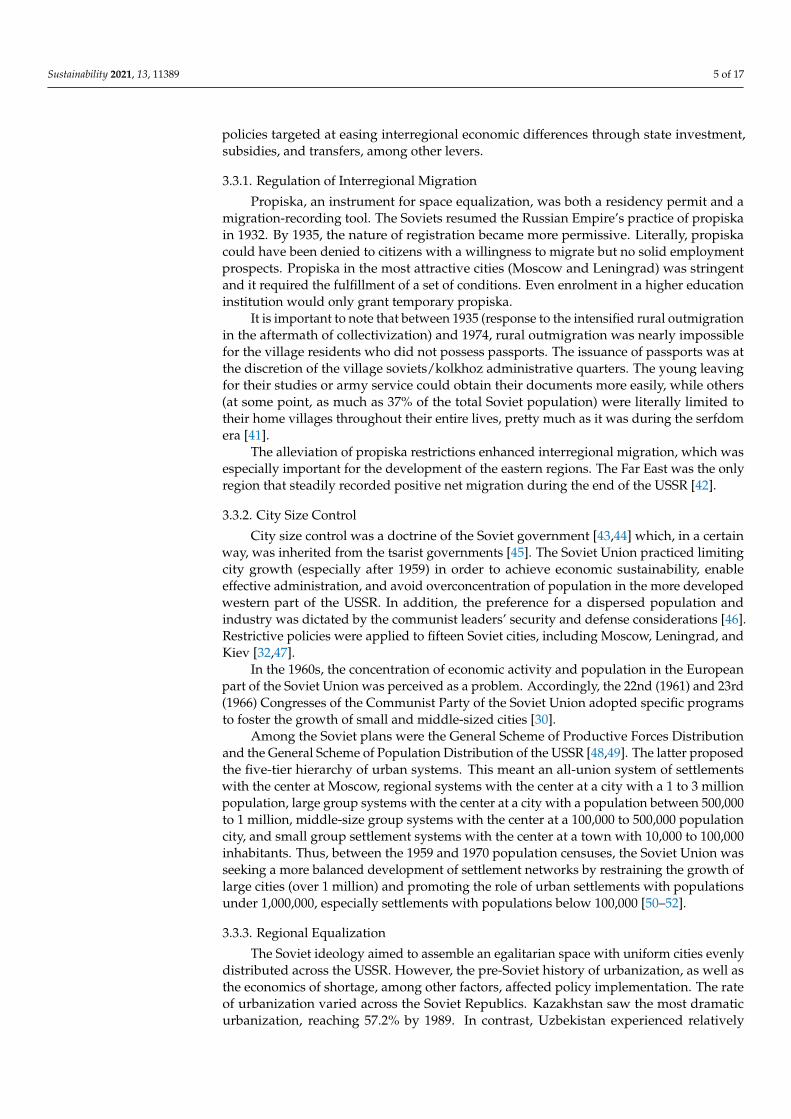
Figure 5. Urban population of the Soviet Union for the top 100 cities, 1897, 1926, 1939, 1959, 1970, 1979, and 1989. Source:authors, based on an original dataset [64].
It is apparent that in both 1897 and 1926, the Soviet urban systems followed therank-size rule fairly well. It can be detected that the largest deviation occurred in theperiod between 1939 and 1959. However, the deviation stopped around 1970, as demon-strated by the estimated log–linear regression curves and their R-squared values (R-sq.)for the respective years (Table 4). Judging by the R-sq. values, the deviation entered

Sustainability 2021, 13, 11389 13 of 17
an upward phase in 1970. This might suggest that the regional equalization policy orforced/regulated population distribution policy did not affect urban distribution patterns,as previously discussed.
Table 4. Estimated log–linear curve for respective years.
Year Log–Linear Regression Function and R-sq.
1897 y = 858,773x−0.74; R2 = 0.9761926 y = 1 × 10⁶x−0.77; R2 = 0.9831939 y = 3 × 10⁶x−0.77; R2 = 0.9821959 y = 4 × 10⁶x−0.69; R2 = 0.9661970 y = 5 × 10⁶x−0.67; R2 = 0.9641979 y = 6 × 10⁶x−0.65; R2 = 0.9681989 y = 6 × 10⁶x−0.64; R2 = 0.973
Source: authors, from the calculation in Figure 5.
The same picture appears when only the data for the largest cities are examined.Intuitively, the impact of large cities on nations is more critical than that of small ones,and the dynamics of large cities may suggest the direction of the government’s urbandevelopment strategy more clearly. In order to compare the trajectories between 1939 and1989 (slow diversion from the rank-size rule) for the entire Soviet cities sample with the 30most populated Soviet cities sample, the data are plotted in Figure 6.
Similar to the cases plotted in Figure 5, the urban distribution diverged from theexpected form in 1959. Furthermore, the subsequent dynamics are consistent with thoseshown in Figure 5. That is to say, there was no improvement between 1959 and 1970, but inthe later period, the distribution of cities was closer to that predicted by Zipf’s law. This isalso indicated by R-sq. in Table 5.
Table 5. Estimated log–linear curve for each year for the 30 largest cities.
Year Log–Linear Regression Function and R-sq.
1939 y = 3 × 10⁶x−0.762; R2 = 0.9411959 y = 3 × 10⁶x−0.585; R2 = 0.8901970 y = 4 × 10⁶x−0.553; R2 = 0.8761979 y = 5 × 10⁶x−0.552; R2 = 0.8911989 y = 5 × 10⁶x−0.558; R2 = 0.903
Source: authors, from the calculation in Figure 6.
Hence, the distribution of cities in Russia/Soviet Union did not deviate from Zipf’slaw consistently. On the contrary, the distribution of cities deviated from the rank-size ruleduring the periods before and after World War II. After WWII ended, the Soviet hierarchicalurban systems seemed to move almost consistently toward the distribution predicted byZipf’s law. This observation could counter Hill and Gaddy’s (2004) argument that thelargest cities followed the direction of decentralization, which was frequently stated inSoviet policy documents [7].

Sustainability 2021, 13, 11389 14 of 17
Sustainability 2021, 13, x FOR PEER REVIEW 14 of 18
It is apparent that in both 1897 and 1926, the Soviet urban systems followed the rank-size rule fairly well. It can be detected that the largest deviation occurred in the period between 1939 and 1959. However, the deviation stopped around 1970, as demonstrated by the estimated log–linear regression curves and their R-squared values (R-sq.) for the respective years (Table 4). Judging by the R-sq. values, the deviation entered an upward phase in 1970. This might suggest that the regional equalization policy or forced/regulated population distribution policy did not affect urban distribution patterns, as previously discussed.
Table 4. Estimated log–linear curve for respective years.
Year Log–Linear Regression Function and R-sq. 1897 y = 858,773x−0.74; R2 = 0.976 1926 y = 1 × 10⁶x−0.77; R2 = 0.983 1939 y = 3 × 10⁶x−0.77; R2 = 0.982 1959 y = 4 × 10⁶x−0.69; R2 = 0.966 1970 y = 5 × 10⁶x−0.67; R2 = 0.964 1979 y = 6 × 10⁶x−0.65; R2 = 0.968 1989 y = 6 × 10⁶x−0.64; R2 = 0.973
Source: authors, from the calculation in Figure 5.
The same picture appears when only the data for the largest cities are examined. Intuitively, the impact of large cities on nations is more critical than that of small ones, and the dynamics of large cities may suggest the direction of the government’s urban development strategy more clearly. In order to compare the trajectories between 1939 and 1989 (slow diversion from the rank-size rule) for the entire Soviet cities sample with the 30 most populated Soviet cities sample, the data are plotted in Figure 6.
Sustainability 2021, 13, x FOR PEER REVIEW 15 of 18
Figure 6. Rank size distribution for the top 30 Soviet cities, 1939, 1959, 1970, 1979, and 1989.Source: authors, based on an original dataset [64].
Similar to the cases plotted in Figure 5, the urban distribution diverged from the expected form in 1959. Furthermore, the subsequent dynamics are consistent with those shown in Figure 5. That is to say, there was no improvement between 1959 and 1970, but in the later period, the distribution of cities was closer to that predicted by Zipf’s law. This is also indicated by R-sq. in Table 5.
Table 5. Estimated log–linear curve for each year for the 30 largest cities.
Year Log–Linear Regression Function and R-sq. 1939 y = 3 × 10⁶x−0.762; R2 = 0.941 1959 y = 3 × 10⁶x−0.585; R2 = 0.890 1970 y = 4 × 10⁶x−0.553; R2 = 0.876 1979 y = 5 × 10⁶x−0.552; R2 = 0.891 1989 y = 5 × 10⁶x−0.558; R2 = 0.903
Source: authors, from the calculation in Figure 6.
Hence, the distribution of cities in Russia/Soviet Union did not deviate from Zipf’s law consistently. On the contrary, the distribution of cities deviated from the rank-size rule during the periods before and after World War II. After WWII ended, the Soviet hierarchical urban systems seemed to move almost consistently toward the distribution predicted by Zipf’s law. This observation could counter Hill and Gaddy’s (2004) argument that the largest cities followed the direction of decentralization, which was frequently stated in Soviet policy documents [7].
6. Conclusions The existing research gaps in this field are, as mentioned in Section 3, as follows: (1)
previous studies did not examine thoroughly Russian hierarchical urban systems through the Imperial era to the late Soviet period; (2) mainly the late Soviet period was examined in the field and the applicability of rank-size rule was generally, although not definitely, rejected; (3) after the collapse of the Soviet Union, only the modern Russian Federation was targeted and this resulted in rejection of Zipf’s law.
This study examined data for the whole period from the Imperial Russia to the end of the Soviet era, and the entire territory. The authors tested the applicability of Zipf’s law, and its validity was clearly confirmed in the Imperial and the early Soviet period. Additionally, the analysis identified that, during the period of the World War II, the Soviet Union’s urban systems diverted from the rank-size distribution and demonstrated the convergence toward rank-size distribution in the late Soviet era. For conducting this research, the authors composed an original dataset containing the names of all cities and
Figure 6. Rank size distribution for the top 30 Soviet cities, 1939, 1959, 1970, 1979, and 1989.Source: authors, based on anoriginal dataset [64].
6. Conclusions
The existing research gaps in this field are, as mentioned in Section 3, as follows: (1)previous studies did not examine thoroughly Russian hierarchical urban systems throughthe Imperial era to the late Soviet period; (2) mainly the late Soviet period was examinedin the field and the applicability of rank-size rule was generally, although not definitely,rejected; (3) after the collapse of the Soviet Union, only the modern Russian Federation wastargeted and this resulted in rejection of Zipf’s law.
This study examined data for the whole period from the Imperial Russia to the endof the Soviet era, and the entire territory. The authors tested the applicability of Zipf’slaw, and its validity was clearly confirmed in the Imperial and the early Soviet period.Additionally, the analysis identified that, during the period of the World War II, the SovietUnion’s urban systems diverted from the rank-size distribution and demonstrated theconvergence toward rank-size distribution in the late Soviet era. For conducting this
Sustainability 2021, 13, 11389 15 of 17
research, the authors composed an original dataset containing the names of all cities andurban settlements and their populations as recorded by the censuses in 1897, 1926, 1939,1959, 1970, 1979, 1989, which enables other scholars in the field to retest our findings orreevaluate the existing studies on the Soviet urban systems in other ways.
Unlike most existing research on hierarchical urban systems focusing on the modernRussian Federation, this study encompasses the urban systems of the entire Soviet Union.The objective of this study was to re-evaluate the rank-size distribution phenomenon usingmore comprehensive historical and geographical data. With the newly constructed dataset,this study presented several original findings. First, it demonstrated that Soviet citiesessentially followed the typical distribution pattern for hierarchical urban systems. Second,the presented data exposed historical dynamics suggestive of the shifts in the pattern.Specifically, the rank-size distribution of Soviet cities changed between 1939 and 1959. Thismight have been caused by World War II and it is associated with large-scale evacuationfrom and the loss of civil population in cities such as Kiev (Kyiv, 3rd most populous Sovietcity), Khar’kov (Kharkiv, 4th), Odessa (7th), and Rostov (10th). Later, in 1959–1989, thedistribution patterns of the largest Soviet cities continuously converged toward the Zipfiandistribution. Finally, the presented data exposed historical dynamics suggestive of theshifts in the Soviet rank-size pattern toward the Zipfian distribution. If the Soviet Union’surban development policies were indeed causing the deviation of the Soviet urban systemfrom the rank-size rule or the suppression of urban growth, which are among the commonarguments in Soviet urban studies, the phenomenon evidenced in this paper could nothave occurred. In this regard, government-led urban development might not be alwayseffective even in the economies with centralized organization such as the socialist states.Thus, such development policies can be futile, as was the case of the Soviet Union presentedin this article, or they may be an obstacle to sustainable development of hierarchical urbansystems if even partially effectual.
This work is likely to be criticized for not conducting a direct cause-and-effect analysis.However, as is widely known, the rank-size rule is an empirical law that has no theory ofconsequence. Another limitation of this study is the absence of readily available data on theSoviet Union for the 1939–1959 period, during which the greatest divergence from Zipf’slaw occurred. Notwithstanding such limitations, the results of the conducted examinationsreveal several previously undiscussed aspects of the evolution of Soviet hierarchical urbansystems. This section is not mandatory but can be added to the manuscript if the discussionis unusually long or complex.
Author Contributions: Conceptualization, K.K.; methodology, K.K.; data curation, K.K. and E.S.;visualization, K.K.; investigation, K.K.; writing original draft, K.K. and E.S.; revising, reviewing, andediting, K.K. and E.S. All authors have read and agreed to the published version of the manuscript.
Funding: This work was financially supported by a Grant-in-Aid for Scientific Research (B) (19H01478),Institute of Economic Research Hitotsubashi University (grant IERPK2020; IERPK2021), and WasedaUniversity Grants for Special Research Projects (Research proposal No: 2021C-648).
Institutional Review Board Statement: Not applicable.
Informed Consent Statement: Not applicable.
Data Availability Statement: The data will be available after publication from the website of RussianResearch Centre, Institute of Economic Research, Hitotsubashi University. https://www.ier.hit-u.ac.jp/rrc/Japanese/workingpaper/index.html (accessed on 10 July 2021).
Conflicts of Interest: The authors declare no conflict of interest. The funders had no role in the designof the study; in the collection, analyses, or interpretation of data; in the writing of the manuscript; orin the decision to publish the results.
References1. Iyer, S.D. Increasing Unevenness in the Distribution of City Sizes in Post-Soviet Russia. Eurasian Geogr. Econ. 2003, 44, 348–367.
[CrossRef]
Sustainability 2021, 13, 11389 16 of 17
2. Kolomak, E. Urbanization and Economic Development in Russia. 2012. Available online: https://www.econstor.eu/handle/10419/120471 (accessed on 12 October 2021).
3. Kolomak, E. Spatial development of the post-Soviet Russia: Tendencies and factors. Reg. Sci. Policy Pract. 2020, 12, 579–594.[CrossRef]
4. Andreev, V.V. Territorial’noe raspredelenie naseleniya Rossiiskoy Federatsii. Ekon. Reg. 2017, 13, 803–811.5. Fattakhov, R.V.; Nizamutdinov, M.M.; Oreshnikov, V.V. Analiz i modelirovanie tendentsiy razvitiya sistemy territorial’nogo
rasseleniya v Rossii. Ekon. Reg. 2019, 15, 436–450.6. WB. Rolling Back Russia’s Spatial Disparities: Re-Assembling the Soviet Jigsaw under a Market Economy; World Bank: Washington, DC,
USA, 2018.7. Hill, F.; Gaddy, C. The Siberian Curse: How Communist Planners Left Russia Out in the Cold; Brookings: Washington, DC, USA, 2004.8. Markevich, A.; Tatiana, N.M. Economic Geography of Russia. In The Oxford Handbook of the Russian Economy; Alexeev, M., Weber,
S., Eds.; Oxford University Press: Oxford, UK, 2013; pp. 617–642.9. Arshad, S.; Hub, S.; Ashraf, B. Zipf’s law and city size distribution: A survey of the literature and future research agenda. Physica
A 2018, 492, 75–92. [CrossRef]10. Davis, D.R.; David, E.W. Bones, Bombs, and Break Points: The Geography of Economic Activity. Am. Econ. Rev. 2002, 92,
1269–1289. [CrossRef]11. Henderson, J.V. The Sizes and Types of Cities. Am. Econ. Rev. 1974, 64, 640–656.12. Krugman, P. Increasing Returns and Economic Geography; NBER Working Paper Series, no. w3275; National Bureau of Economic
Research: Cambridge, MA, USA, 1990.13. Fujita, M.; Krugman, P.; Venables, A. The Spatial Economy: Cities, Regions, and International Trade; MIT Press: Cambridge, MA, USA,
1999.14. Simon, H. On a Class of Skew Distribution Functions. Biometrika 1955, 42, 425–440. [CrossRef]15. Auerbach, F. Das gesetz der bevölkerungskonzentration. Petermanns Geogr. Mitt. 1913, 59, 74–76.16. Zipf, G.K. Human Behaviour and the Principle of Least Effort: An Introduction to Human Ecology; Addison-Wesley: Reading, MA,
USA, 1949.17. Veneri, P. City Size Distribution across the OECD: Does the Definition of Cities Matter? Comput. Environ. Urban Syst. 2016, 59,
86–94. [CrossRef]18. Giesen, K.; Sudekum, J. Zipf’s Law for Cities in the Regions and the Country. J. Econ. Geogr. 2011, 11, 667–686. [CrossRef]19. Rosen, K.T.; Resnick, M. The Size Distribution of Cities: An Examination of the Pareto Law and Primacy. J. Urban Econ. 1980, 8,
165–186. [CrossRef]20. Soo, K.T. Zipf’s Law for Cities: A Cross-Country Investigation. Reg. Sci. Urban Econ. 2005, 35, 239–263. [CrossRef]21. Nitsch, V. Zipf Zipped. J. Urban Econ. 2005, 57, 86–100. [CrossRef]22. Davis, D.R.; Weinstein, D.E. A Search for Multiple Equilibria in Urban Industrial Structure. J. Reg. Sci. 2008, 48, 29–65. [CrossRef]23. Brakman, S.; Garretsen, H.; Schramm, M. The Strategic Bombing of German Cities during World War II and Its Impact on City
Growth. J. Econ. Geogr. 2004, 4, 201–218. [CrossRef]24. Miguel, E.; Roland, G. The Long-Run Impact of Bombing Vietnam. J. Dev. Econ. 2011, 96, 1–15. [CrossRef]25. Fujita, M.; Krugman, P.; Mori, T. On the Evolution of Hierarchical Urban Systems. Eur. Econ. Rev. 1999, 43, 209–251. [CrossRef]26. Henderson, J.V.; Wang, G.H. Urbanization and City Growth: The Role of Institutions. Reg. Sci. Urban Econ. 2007, 37, 283–313.
[CrossRef]27. Takayama, Y.; Ikeda, K.; Thisse, J.-F. Stability and Sustainability of Urban Systems under Commuting and Transportation Costs.
Reg. Sci. Urban Econ. 2020, 84, 103553. [CrossRef]28. Davis, J.C.; Henderson, J.V. Evidence on the Political Economy of the Urbanization Process. J. Urban Econ. 2003, 53, 98–125.
[CrossRef]29. Frost, I. Exploring varieties of (post)Soviet urbanization: Reconciling the general and particular in post-socialist urban studies.
Eur. Reg. 2018, 25, 2–14. Available online: https://nbn-resolving.org/urn:nbn:de:0168-ssoar-59047-7 (accessed on 12 October2021).
30. Harris, C.D. Cities of the Soviet Union: Studies in Their Functions, Size, Density, and Growth; Association of American Geographers:Washington, DC, USA, 1972.
31. Kolosovskiy, N.N. The Territorial-Production Combination (Complex) in Soviet Economic Geography. J. Reg. Sci. 1961, 3, 1–25.[CrossRef]
32. Zile, Z.L. Programs and Problems of City Planning in the Soviet Union. Wash. U.L.Q. 1963. Available online: https://openscholarship.wustl.edu/law_lawreview/vol1963/iss1/3 (accessed on 12 October 2021).
33. Rowland, R.H. Metropolitan Population Change in Russia and the Former Soviet Union, 1897–1997. Post Sov. Geogr. Econ. 1998,39, 271–296. [CrossRef]
34. Kolyasnikov, V.A. Razvitie ponyatiya gorodskaya aglomeratsiya. Akademichesky Vestn. Ural. RAASN 2015, 2, 10–15.35. Sirina, D.A. Podkhody k issledovaniyu struktury gorodskikh konglomeratsyi. Naukovedenie 2017, 9, 1–17. Available online:
http://naukovedenie.ru/PDF/12TVN117.pdf (accessed on 12 October 2021). (In Russian)36. Rogov, M.; Rozenblat, C. Delineating Russian cities in the perspective of corporate globalization: Towards Large Urban Regions.
Cyberage Eur. J. Geogr. 2021. [CrossRef]

Sustainability 2021, 13, 11389 17 of 17
37. Antonov, E.V. Gorodskie aglomeratsii: Podkhody k vedeleniyu I delimitizatsii. Kontury Glob. Transform. Polit. Ekon. Pravo 2020,13, 180–202. [CrossRef]
38. Vishnevskiy, A.G. Gorodskiye Aglomeratsii i Ekonomicheskoye Regulirovaniye ikh Rosta (na Primere Khar’kovskoy Aglomeratsii); Institutekonomiki, Russian Academy of Science: Moscow, Russia, 1967; Available online: http://www.demoscope.ru/weekly/2021/0885/pdf/abstract1967.pdf (accessed on 12 October 2021). (In Russian)
39. Strongina, M.L. Sotsial’no-Ekonomicheskie Problem Razvitiya Bol’shikh Gorodov v SSSR; Nauka: Moscow, Russia, 1970.40. Zaslavskiy, I.N.; Naymark, N.I.; Polyan, P.M. Problemy delimitatsii gorodskikh aglomera-tsiy: Sravneniye i sintez vedushchikh
metodik. In Problemy Izucheniya Gorodskikh Aglomeratsiy: Sbornik Statey; Institute of Geography of the Academy of Sciences of theUSSR: Moscow, Russian, 1988; pp. 27–41. (In Russian)
41. Zhirnov, Y. Ne imeyut prava na passport 37 protsentov grazhdan. Kommers. Vlast 2009, 14, 54. Available online: https://www.kommersant.ru/doc/1147485 (accessed on 12 October 2021).
42. Pchelintsev, O.S. Regional Hierarchy under Threat: A Spatial Dimension of the Socio-Economic Crisis in the Former Soviet Unionand Russia. Int. Reg. Sci. Rev. 1992, 15, 267–279. [CrossRef]
43. White, P. Urban Planning in Britain and the Soviet Union: A Comparative Analysis of Two Planning Systems. Town Plan. Rev.1980, 51, 211–226. Available online: http://www.jstor.org/stable/40103713 (accessed on 12 October 2021). [CrossRef]
44. Hausladen, G. The satellite city in Soviet urban development. Sov. Geogr. 1984, 25, 229–247.45. Clayton, E.; Richardson, T. Soviet Control of City Size. Econ. Dev. Cult. Chang. 1989, 38, 155–165. Available online: https:
//www.jstor.org/stable/1154166 (accessed on 12 October 2021). [CrossRef]46. Shiklomanov, N.; Streletskiy, D.; Suter, L.; Orttung, R.; Zamyatina, N. Dealing with the bust in Vorkuta, Russia. Land Use Policy
2020, 93, 103908. [CrossRef]47. Frolic, M. The Soviet Study of Soviet Cities. J. Politics 1970, 32, 675–695. [CrossRef]48. Kudinov, O.V. Strategy of the Spatial Distribution of Productive Forces and Population in the USSR. In National Settlement
Strategies East and West; Swain, H., Ed.; IIASA: Luxenburg, Austria, 1975; pp. 12–40, CP-75-003.49. Underhill, J.A. Soviet New Towns, Planning and National Urban Policy: Shaping the Face of Soviet Cities. Town Plan. Rev. 1990,
61, 263–285. Available online: http://www.jstor.org/stable/40112920 (accessed on 12 October 2021). [CrossRef]50. Avdotjin, L. Principles of Regional Settlement in the USSR. In National Settlement Strategies East and West; Swain, H., Ed.; IIASA:
Laxenburg, Austria, 1975; pp. 1–11, CP-75-003.51. Bater, J.H. Soviet Town Planning: Theory and Practice in the 1970s. Prog. Hum. Geogr. 1977, 1, 177–207. [CrossRef]52. Medvedkov, O. Soviet Urbanization; Routledge: London, UK, 1990.53. Senyavskiy, A. Urbanizatsionnyi protsess v SSSR v ekonjvichtskom izmerenii: Strukturnye i institsuonal’nye aspelty. VTE 2019, 2,
147–161.54. Dellenbrant, J.Å. Soviet Regional Policy: A Qualitative Inquiry into the Social and Political Development of the Soviet Republics; Almqvist
& Wiksell International and Atlantic Highlands, N.J. Humanities Press: Stockholm, Sweden, 1980.55. Rodgers, A. The Locational Dynamics of Soviet Industry. Ann. Assoc. Am. Geogr. 1974, 64, 226–240. [CrossRef]56. Mikhailova, T. Gulag, WWII and the Long-Run Patterns of Soviet City Growth. MPRA Paper No.41758. 2012. Available online:
https://mpra.ub.uni-muenchen.de/41758/ (accessed on 12 October 2021).57. Allen, R.C. Farm to Factory: A Reinterpretation of the Soviet Industrial Revolution; Princeton and Oxford, Princeton University Press:
Princeton, NJ, USA, 2003.58. Rosefielde, S. The Russian Economy: From Lenin to Putin; Blackwell Publishing: Oxford, UK, 2007.59. Siddiqi, A. Atomized urbanism: Secrecy and security from the Gulag to the Soviet closed cities. Urban Hist. 2021, 1–21. [CrossRef]60. Ira, N.; Ira, G.; Robert, S. Mobility Where Mobility Is Illegal: Internal Migration and City Growth in the Soviet Union. J. Popul.
Econ. 1999, 12, 117–134.61. Pumain, D.; Elfie, S.; Cottineau, C.; Vacchiani-Marcuzzo, C.; Ignazzi, C.A.; Bretagnolle, A.D.; François, C.; Lizzi, R.L.; Baffi, S.
Multilevel comparison of large urban systems. Cybergeo Eur. J. Geogr. 2015. [CrossRef]62. Harris, C. The Cities of the Soviet Union. Geogr. Rev. 1945, 35, 107–121. [CrossRef]63. Mellor, R. The Soviet Union and Its Geographical Problems; Macmillan Press: London, UK, 1982.64. Kumo, K.; Shadrina, E. City Size Distributions in Imperial Russia and the Soviet Union; Russian Research Centre, Institute of
Economic Research, Hitotsubashi University: Tokyo, Japan, 2021; Available online: https://www.ier.hit-u.ac.jp/rrc/Japanese/workingpaper/index.html (accessed on 10 July 2021).
Related Documents