Electronic copy available at: http://ssrn.com/abstract=2362820 ON THE EMPIRICAL CONTENT OF CARBON LEAKAGE CRITERIA IN THE EU EMISSIONS TRADING SCHEME * Ralf Martin † Mirabelle Muûls ‡ Laure B. de Preux § Ulrich J. Wagner ** December 2013 Abstract The EU Emissions Trading Scheme continues to exempt industries deemed at risk of carbon leakage from permit auctions. Carbon leakage risk is established based on the carbon intensity and trade exposure of each 4-digit industry. Using a novel measure of carbon leakage risk obtained in interviews with almost 400 managers at regulated firms in six countries, we show that carbon intensity is strongly correlated with leakage risk whereas trade exposure is not. In spite of this, most exemptions from auctioning are granted to trade exposed industries. Our analysis suggests two ways of tightening the exemption criteria without increasing relocation risk among non-exempt industries. The first one is to exempt trade exposed industries only if they are also carbon intensive. The second one is to consider exposure to trade only with less developed countries. By modifying the carbon leakage criteria along these lines, European governments could raise additional revenue from permit auctions of up to €3 billion per year. Keywords: Carbon leakage, industrial relocation, emissions trading, EU ETS, permit allocation, firm data JEL Classifications: H23, H25, Q52, Q54, F18 * Part of the analysis in this paper was previously circulated as NBER Working Paper 19097 (Martin et al., 2013). We are indebted to Barry Anderson, Jörg Leib and Marty McGuigan for their invaluable help at different stages of this research, and to Felix de Bousies, Pieter De Vlieger, David Disch, Eszter Domokos, Lorenz Elsasser, Helen Franzen, Maite Kervyn, Zsofia Kopetka, Oliwia Kurtyka, Anne-Lise Laurain, Emeric Lujan, Nicole Polsterer, Antoine Martin-Regniault, Maxence Snoy, Joanna Romanowicz, Bartosz Vu, Julia Wittig, Joanna Wylegala for their help with the interviews. Melanie Hermann and Antonin Cura provided excellent research assistance. Olivier Sartor, Stephen Lecourt and Clément Pallière graciously provided data on National Implementation Measures. We have received helpful comments from Stephen Boucher, Alex Bowen, Denny Ellerman, Sam Fankhauser, Tom Foxon, Andy Gouldson, Mark Jacobsen, Stéphanie Monjon, and from staff members at DECC, at DG Climate, and at the Environmental Committee of the European Parliament. All remaining errors are our own. The interviews were funded through grants from the European Climate Foundation and the ESRC. The Centre for Economic Performance and the Grantham Institute on Climate Change provided generous logistical support. The authors gratefully acknowledge financial support from the British Academy (Martin), from the Leverhulme Trust (Muûls) and from the Spanish Ministry for Science and Innovation, reference number SEJ2007-62908 (Wagner). † Imperial College Business School, South Kensington Campus, London SW7 2AZ, United Kingdom, Grantham Institute on Climate Change, and Centre for Economic Performance (CEP), London School of Economics (LSE). Email: [email protected] ‡ Grantham Institute for Climate Change and Imperial College Business School, South Kensington Campus, London SW7 2AZ, United Kingdom, and CEP. Email: [email protected] § Imperial College Business School, South Kensington Campus, London SW7 2AZ, United Kingdom, and CEP, LSE. Email: [email protected] ** Departamento de Economía, Universidad Carlos III de Madrid, Calle de Madrid 126, 28903 Madrid, Spain. Email: [email protected]

Welcome message from author
This document is posted to help you gain knowledge. Please leave a comment to let me know what you think about it! Share it to your friends and learn new things together.
Transcript

Electronic copy available at: http://ssrn.com/abstract=2362820
ON THE EMPIRICAL CONTENT OF CARBON LEAKAGE CRITERIA IN THE EU EMISSIONS TRADING SCHEME*
Ralf Martin† Mirabelle Muûls‡
Laure B. de Preux§ Ulrich J. Wagner**
December 2013
Abstract
The EU Emissions Trading Scheme continues to exempt industries deemed at risk of carbon leakage from permit auctions. Carbon leakage risk is established based on the carbon intensity and trade exposure of each 4-digit industry. Using a novel measure of carbon leakage risk obtained in interviews with almost 400 managers at regulated firms in six countries, we show that carbon intensity is strongly correlated with leakage risk whereas trade exposure is not. In spite of this, most exemptions from auctioning are granted to trade exposed industries. Our analysis suggests two ways of tightening the exemption criteria without increasing relocation risk among non-exempt industries. The first one is to exempt trade exposed industries only if they are also carbon intensive. The second one is to consider exposure to trade only with less developed countries. By modifying the carbon leakage criteria along these lines, European governments could raise additional revenue from permit auctions of up to €3 billion per year.
Keywords: Carbon leakage, industrial relocation, emissions trading, EU ETS, permit allocation, firm data
JEL Classifications: H23, H25, Q52, Q54, F18
* Part of the analysis in this paper was previously circulated as NBER Working Paper 19097 (Martin et al., 2013). We are indebted to Barry Anderson, Jörg Leib and Marty McGuigan for their invaluable help at different stages of this research, and to Felix de Bousies, Pieter De Vlieger, David Disch, Eszter Domokos, Lorenz Elsasser, Helen Franzen, Maite Kervyn, Zsofia Kopetka, Oliwia Kurtyka, Anne-Lise Laurain, Emeric Lujan, Nicole Polsterer, Antoine Martin-Regniault, Maxence Snoy, Joanna Romanowicz, Bartosz Vu, Julia Wittig, Joanna Wylegala for their help with the interviews. Melanie Hermann and Antonin Cura provided excellent research assistance. Olivier Sartor, Stephen Lecourt and Clément Pallière graciously provided data on National Implementation Measures. We have received helpful comments from Stephen Boucher, Alex Bowen, Denny Ellerman, Sam Fankhauser, Tom Foxon, Andy Gouldson, Mark Jacobsen, Stéphanie Monjon, and from staff members at DECC, at DG Climate, and at the Environmental Committee of the European Parliament. All remaining errors are our own. The interviews were funded through grants from the European Climate Foundation and the ESRC. The Centre for Economic Performance and the Grantham Institute on Climate Change provided generous logistical support. The authors gratefully acknowledge financial support from the British Academy (Martin), from the Leverhulme Trust (Muûls) and from the Spanish Ministry for Science and Innovation, reference number SEJ2007-62908 (Wagner).
† Imperial College Business School, South Kensington Campus, London SW7 2AZ, United Kingdom, Grantham Institute on Climate Change, and Centre for Economic Performance (CEP), London School of Economics (LSE). Email: [email protected] ‡ Grantham Institute for Climate Change and Imperial College Business School, South Kensington Campus, London SW7 2AZ, United Kingdom, and CEP. Email: [email protected] § Imperial College Business School, South Kensington Campus, London SW7 2AZ, United Kingdom, and CEP, LSE. Email: [email protected] ** Departamento de Economía, Universidad Carlos III de Madrid, Calle de Madrid 126, 28903 Madrid, Spain. Email: [email protected]

Electronic copy available at: http://ssrn.com/abstract=2362820
1 Introduction
It is widely recognized that the problem of carbon leakage poses a major challenge for design-
ing effective unilateral policies aimed at mitigating global climate change. In its most direct
manifestation, carbon leakage occurs when polluting plants that are subject to climate policy
relocate to an unregulated jurisdiction. Since carbon emissions are a global pollutant, their
“leaking” to unregulated places reduces the environmental benefits from the policy. In addition,
carbon leakage creates an excess burden for those countries that regulate emissions to the extent
that relocation reduces output, employment, and taxable profits at home.
Not surprisingly, carbon leakage takes the center stage whenever new climate change reg-
ulation is up for debate. So far, the most common deterrent against carbon leakage has been
to either compensate or to exempt those industries deemed to be most adversely affected by
the policy. For instance, virtually all of the numerous carbon taxes that have emerged in Eu-
rope since the 1990’s grant rebates or exemptions to energy-intensive firms in order to prevent
them from relocating.1 While this practice can be justified from the point-of-view of industrial
policy, it runs counter to the polluter-pays principle underlying environmental policy-making
in the EU. It also gives way to rent-seeking behavior, as regulated firms have an incentive to
exaggerate their compliance costs in order to receive more generous compensation. Addressing
carbon leakage is therefore a difficult and controversial policy issue.
In this paper, we analyze the current scheme to prevent carbon leakage implemented in the
European Emissions Trading System (EU ETS), the world’s first and largest regional cap-and-
trade system for greenhouse gas emissions. During the first eight years of the EU ETS, leakage
was addressed by offering manufacturing firms generous compensation in the form of allocat-
ing most emission allowances free of charge. In the current, third trading phase, which runs
from 2013 until 2020, the European Commission (EC) gradually reduces the proportion of free
allowances allocated to manufacturing firms. At the same time, and contrary to its stated ob-
jective of achieving full auctioning of emission allowances, the EC exempts from this transition
more than three quarters of the regulated emissions from manufacturing, on the grounds that
1In their analysis of the UK Climate Change Levy, Martin, de Preux, and Wagner (2011) find no causal impacton output, employment or plant exit among treated firms.
1

the firms accounting for those emissions are at risk of carbon leakage. Exemptions are granted
according to two simple criteria, namely the carbon intensity of value added and trade exposure,
measured at the level of the 4-digit industry code.
Our paper assesses the accuracy of these criteria based on a novel firm-level measure of
leakage risk we gathered in telephone interviews with managers of 761 manufacturing firms in
six European countries (Martin, Muuls, de Preux, and Wagner, 2014). The flexibility of the
interview based approach, along with the bias-reducing format of the survey tool developed
by Bloom and van Reenen (2007) and adapted to the climate policy context in Martin et al.
(2012, 2014), allows us to elicit valuable information on politically contentious issues such as
a firm’s vulnerability to carbon pricing, defined as the firm’s propensity to downsize or relocate
in response to climate change policy.
We show that carbon intensity is strongly correlated with our interview-based measure of
vulnerability whereas trade intensity is not. This is a reason for concern because most ex-
emptions from auctioning are granted on the basis of the trade intensity criterion alone. We
propose two simple improvements to the exemption criteria, based on the principle that free
permits should only be given to industries where the average relocation propensity is signifi-
cantly higher than that of non-exempt industries. First, by not exempting trade intensive sectors
but the ones that are at least moderately carbon intensive as well, European governments could
raise additional auction revenue of up to C3 billion every year. Second, we show that a sector’s
intensity of trade with less developed countries such as China is a better proxy for vulnerability
than the overall trade intensity. A change in the definition of the trade intensity criterion along
these lines could raise an additional C430 million in auction revenues per year.
In extending the normative analysis of industry compensation rules in the EU ETS by Mar-
tin et al. (2014), this paper contributes further evidence of practical value on this controversial
aspect of climate policy. This will be relevant for the revision of the carbon leakage criteria by
the EU Commission in 2014, but our findings also inform climate policy far beyond the Euro-
pean context. This is because similar criteria to the ones used by the EC have been adopted
in actual and proposed legislation underlying half a dozen regional carbon trading schemes
world wide. For instance, emission intensity and trade intensity are used to determine eligi-
2
bility for compensation in the recently implemented carbon trading schemes in California and
Switzerland, in Australia’s Carbon Pollution Reduction Scheme and in New Zealand’s ETS.
Moreover, these metrics were proposed for a US wide cap-and-trade scheme under the 2009
Waxman-Markey Bill, and will be applied in a future South Korean ETS (cf. Hood, 2010;
www.icapcarbonaction.com). In view of this, it seems of first-order importance to know
how these criteria relate to leakage risk by the very managers who get to decide on relocation.
The next section describes the policy background and summarizes the relevant literature.
Section 3 describes the data set and explains our regression based test. Section 4 presents the
results and Section 5 discusses their implications for the auction revenues forgone by the actual
policy. Section 6 concludes.
2 Policy background: Carbon Leakage and the EU ETS
2.1 Permit allocation, benchmarking and carbon leakage sectors
According to the independence property of emissions trading (Montgomery, 1972), the per-
mit price only depends on the stringency of the overall cap, but not on the initial allocation.
An implication of this is that the permit allocation per se does not condition firm behavior
at the intensive margin, because firms factor the opportunity cost of using a permit into their
marginal cost – regardless of the initial cost of acquiring permits. Independence need not hold
in the presence of market power (Hahn, 1984) or transaction costs (Stavins, 1995), but existing
research has not rejected the independence property in the EU ETS (Convery and Redmond,
2007; Reguant and Ellerman, 2008).
In contrast, the extensive-margin behavior of firms is affected by both the overall stringency
and the initial permit allocation. This is because variable profits are decreasing in the permit
price and total profits decrease with the total cost of permits. Thus, full auctioning of emission
permits might lower firm profits to the point where exit or relocation to non-EU countries are
worth considering. Likewise, a more stringent cap may have similar effects as it sustains a
higher carbon price. An economic rationale behind allocating permits for free is thus to miti-
gate the risk of relocation and carbon leakage by compensating industry for the adverse profit
3

impacts of emissions trading.
Initial permit allocation in phases I and II of the EU ETS was delegated to the member
states who drew up a National Allocation Plan (NAP) that both fixed the national cap and
determined the sectoral allocation. The principles guiding NAP development in phase I were
quite consistent across countries, as most opted for “grandfathering”, i.e. free permit allocations
based on historical emissions (Ellerman, Buchner, and Carraro, 2007). In phase II, the member
states imposed more stringent caps so as to honor their commitment to the EU’s joint emission
target under the Kyoto Protocol, but they also retained free allocation. Auctioning fell far short
of what was allowed, and benchmarking remained an exception (Ellerman and Joskow, 2008).
In phase III, the allocation of free emission allowances is relegated from national govern-
ments back to Brussels. Directive 2009/29/EC advances the transition towards auctioning of
permits as the basic principle of allocation and stipulates a harmonized allocation scheme to
reduce competitive distortions among producers of similar products across member states. The
two main features of this scheme are (i) the use of benchmarks which rewards operators who
have taken early action to reduce the emission intensity of production, and (ii) the continued
free allocation to sectors considered at risk of carbon leakage.
To the extent possible, benchmarks are defined in tons of CO2 equivalent per unit of out-
put of a specific product.2 They reflect the average greenhouse gas emission performance of
the 10% best performing installations in the EU producing that product, based on the average
emissions intensity in 2007-2008.3 The amount of free permits is obtained by multiplying the
benchmark with the historical reference activity level, defined as the median activity level over
the years from 2005 until 2008 (or from 2009 until 2010, if larger). Total allocations calculated
in this way are scaled by a factor that takes a value of 0.8 in 2013 and declines linearly to a fac-
tor of 0.3 in 2020.4 This factor is meant to accomplish the gradual transition to full auctioning
foreseen already in the first version of the EU Emissions Trading Directive.
2Where deriving a product benchmark is not feasible, a hierarchy of fallback approaches is applied, as explainedin detail by Lecourt, Palliere, and Sartor (2013).
3Cf. Commission Decision 2011/87/EU determining transitional Union-wide rules for harmonized free alloca-tion of emission allowances pursuant to Article 10a of Directive 2003/87/EC of the European Parliament and ofthe Council (2011) OJ L 130/1 (Benchmarking Decision).
4Furthermore, a uniform correction factor is applied if necessary to align the total free allocation to bench-marked installations with the overall cap on emissions.
4
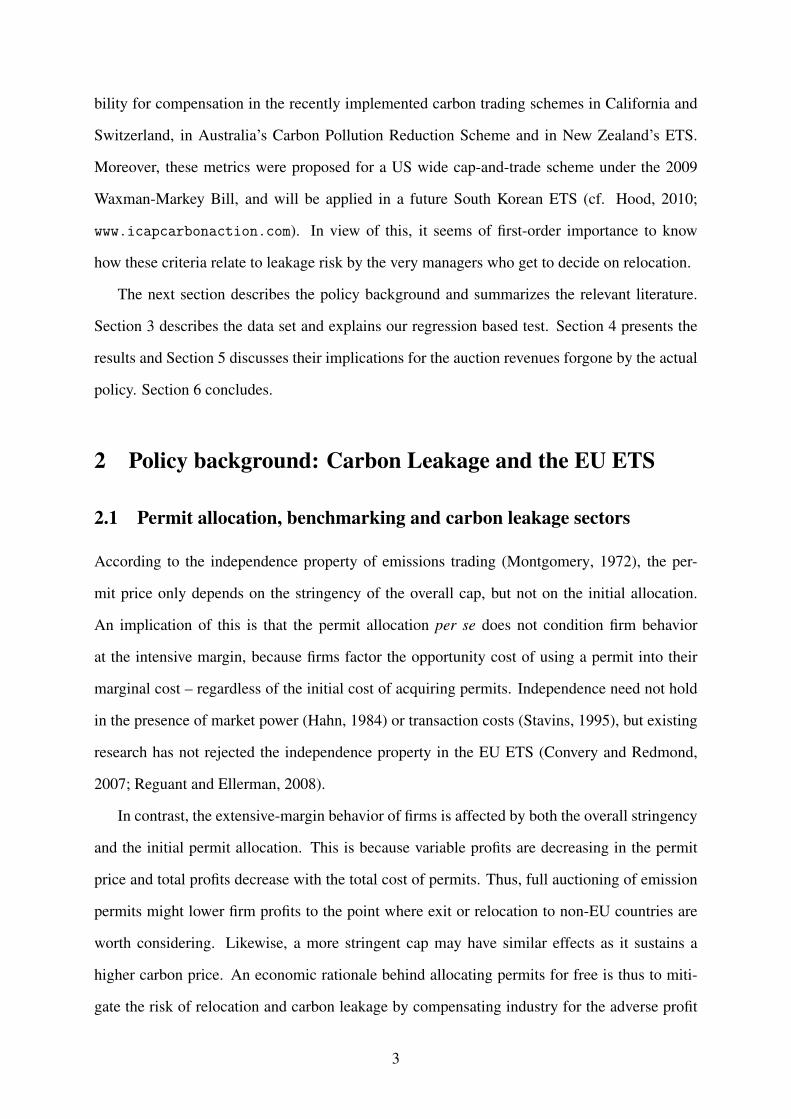
Figure 1: Free Allocation under Benchmarking
However, carbon intensive industries convinced EU law makers that full auctioning of per-
mits would have a detrimental impact on their competitiveness. In response to this, the EC
grants 100% of benchmark allocations for free to firms in sectors that are considered at risk of
carbon leakage, as depicted in Figure 1. The Carbon Leakage Decision5 stipulates that leak-
age risk of a sector or subsector be assessed on the basis of its carbon intensity (CI) and/or
trade intensity (TI). The former proxies for the cost burden imposed by full auctioning, and is
measured as the sum of the direct and indirect costs of permit auctioning, divided by the gross
value added of a sector. The direct costs are calculated as the value of direct CO2 emissions,
where a proxy price of 30C/tCO2 is used. Indirect costs measure the exposure to electricity
price increases that are inevitable on account of full permit auctioning in the power sector. To
calculate indirect costs, electricity consumption (in MWh) is multiplied by the average emission
intensity of electricity generation in the EU27 countries (0.465 tCO2/MWh), and by the same
proxy price of 30C/tCO2 for one European Union Allowance. The TI metric is calculated as
“the ratio between the total value of exports to third countries plus the value of imports from
third countries and the total market size for the Community (annual turnover plus total imports
from third countries” (EU Commission, 2009, p. 24).
According to Directive 2009/29/EC, a combination of thresholds for CI and TI is used to
assess carbon leakage risk. For a sector to be considered at significant risk of carbon leakage,
its CI must be greater than 5% and its TI greater than 10%, or else its CI or TI is greater than
30%. This enables us to classify eligible sectors into three mutually exclusive categories:
5Commission Decision 2010/2/EU determining, pursuant to Directive 2003/87/EC of the European Parliamentand of the Council, a list of sectors and subsectors which are deemed to be exposed to a significant risk of carbonleakage (2010) OJ L 1/10 (Carbon Leakage Decision).
5

Figure 2: Sectors exempt from permit auctions
020
4060
80C
arbo
n In
tens
ity
0 20 40 60 80 100Trade Intensity
A
BC
Notes: The figure shows a scatter plot of the carbon and trade intensities of 4-digit (NACE 1.1) manufacturing industries, based on 9,061 EUETS installations. The size of the circles is proportional to the number of firms in a given industry. Sectors in areas A, B, and C will continueto be exempt from permit auctions in EU ETS phase III. Source: Martin et al. (2014).
• A: high carbon intensity (CI > 30%)
• B: high trade intensity and low to moderate carbon intensity (CI ≤ 30% ∩ T I > 30%),
• C: moderate carbon and trade intensities (5% <CI ≤ 30% ∩ 5% < T I ≤ 30).
Figure 2 plots the location of 3-digit sectors in a diagram with CI on the vertical and TI on
the horizontal axis.6 Two findings strongly emerge from this graph: First, category B contains
most of the sectors the EC considers at risk of carbon leakage. Second, most of these carbon
leakage sectors are not carbon intensive at all, as their carbon intensity is less than 5%. After
splitting category B according to its carbon intensity we plot in Figure 3 the relative size of the
resulting five categories in terms of the shares in the number of firms, in employment and in
CO2 emissions. By all these measures, category B turns out to be the largest group of exempted
firms. The share of CO2 emissions that is not exempt from auctioning is as small as 15%,
which is in line with an alternative estimate of 23% by Juergens et al. (2013). This means that
the Carbon Leakage Decision leaves most pollution rights with European industry and hence
strongly undermines the principle of full auctioning established in the amended ETS directive.
6Similar graphical representations have been used by Clo (2010) and Martin et al. (2014).
6
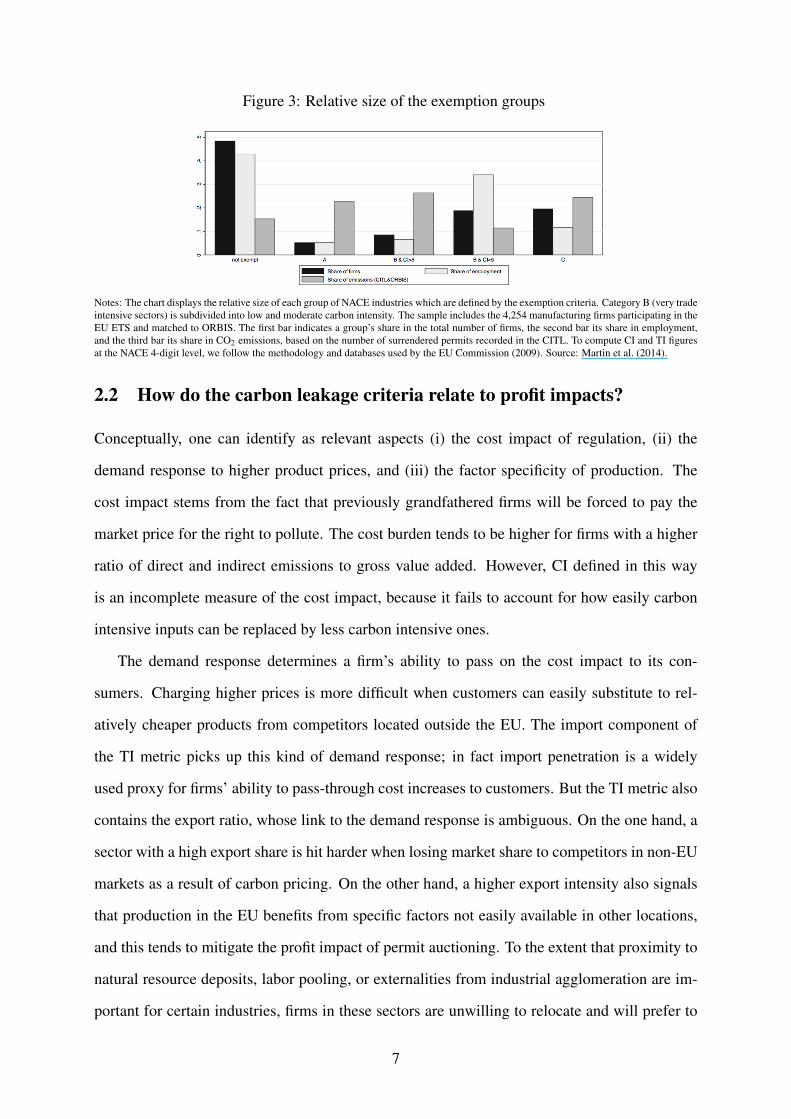
Figure 3: Relative size of the exemption groups
Notes: The chart displays the relative size of each group of NACE industries which are defined by the exemption criteria. Category B (very tradeintensive sectors) is subdivided into low and moderate carbon intensity. The sample includes the 4,254 manufacturing firms participating in theEU ETS and matched to ORBIS. The first bar indicates a group’s share in the total number of firms, the second bar its share in employment,and the third bar its share in CO2 emissions, based on the number of surrendered permits recorded in the CITL. To compute CI and TI figuresat the NACE 4-digit level, we follow the methodology and databases used by the EU Commission (2009). Source: Martin et al. (2014).
2.2 How do the carbon leakage criteria relate to profit impacts?
Conceptually, one can identify as relevant aspects (i) the cost impact of regulation, (ii) the
demand response to higher product prices, and (iii) the factor specificity of production. The
cost impact stems from the fact that previously grandfathered firms will be forced to pay the
market price for the right to pollute. The cost burden tends to be higher for firms with a higher
ratio of direct and indirect emissions to gross value added. However, CI defined in this way
is an incomplete measure of the cost impact, because it fails to account for how easily carbon
intensive inputs can be replaced by less carbon intensive ones.
The demand response determines a firm’s ability to pass on the cost impact to its con-
sumers. Charging higher prices is more difficult when customers can easily substitute to rel-
atively cheaper products from competitors located outside the EU. The import component of
the TI metric picks up this kind of demand response; in fact import penetration is a widely
used proxy for firms’ ability to pass-through cost increases to customers. But the TI metric also
contains the export ratio, whose link to the demand response is ambiguous. On the one hand, a
sector with a high export share is hit harder when losing market share to competitors in non-EU
markets as a result of carbon pricing. On the other hand, a higher export intensity also signals
that production in the EU benefits from specific factors not easily available in other locations,
and this tends to mitigate the profit impact of permit auctioning. To the extent that proximity to
natural resource deposits, labor pooling, or externalities from industrial agglomeration are im-
portant for certain industries, firms in these sectors are unwilling to relocate and will prefer to
7
serve foreign markets through exporting, causing TI to be high. Consequently, the sector looks
vulnerable according to EU criteria even though it can easily pass through the cost of permit
auctioning in international product markets.
Another measurement issue arises from the aggregation to the 4-digit sector level, which
lumps together many different products. Clo (2010) points out that, in spite of a high import
penetration at the sector level, firms may be able to pass through the costs of carbon in some
product markets that are less competitive due to concentration or product differentiation.
Theoretical research suggests that the EU ETS adversely impacts on production in most
regulated industries while rising electricity prices lower the profitability of highly exposed in-
dustries such as primary aluminum production (Demailly and Quirion, 2006, 2008; Reinaud,
2005).7 These studies also show that free permit allocation offsets negative profit impacts in
most industries, and can even lead to overcompensation (Smale, Hartley, Hepburn, Ward, and
Grubb, 2006). Based on this literature, Sato, Grubb, Cust, Chan, Korppoo, and Ceppi (2007)
propose to use trade intensity, carbon intensity and electricity intensity as proxies for the com-
petitiveness impact of the EU ETS.
There is, however, little empirical evidence to date that directly links CI and TI to sectoral
heterogeneity in the relocation response to carbon pricing. In fact, the literature on the ex-post
analysis of the impact of the EU ETS on international competitiveness is still in its infancy. This
literature, which is reviewed in detail by Martin, Muuls, and Wagner (2013b), does not suggest
that industrial firms on the whole suffered strong adverse impacts when permits were allocated
for free in the first years of the EU ETS (Anger and Oberndorfer, 2008; Abrell et al., 2011;
Chan et al., 2013; Commins et al., 2011; Bushnell et al., 2013; Wagner et al., 2013a,b).
Few papers so far have analyzed the link between carbon leakage and free allowance alloca-
tion in the EU ETS specifically. Monjon and Quirion (2011) use a computable partial equilib-
rium model to compare various configurations of border-tax adjustments and output-based al-
location to counter carbon leakage in the EU ETS. In a theoretical analysis, Meunier, Ponssard,
7A widespread approach to assessing aggregate leakage effects has been to calibrate computable general equi-librium models that are capable of predicting the consequences of differential carbon pricing across regions. Wedo not review these models here as they are not informative about individual industries. Models with exogenoustechnical change predict carbon leakage rates between 5 and 35% for the Kyoto Protocol commitments (Paltsev,2001).
8

and Quirion (2012) show that a combination of output based and capacity based allowance al-
location is second-best when border-tax adjustments are not available. Martin et al. (2014) also
take a normative approach, showing how free allowances should be distributed across firms in
order to minimize leakage, subject to a maximum amount of foregone auction revenue. While
they use microdata on free allocation in the EU ETS to conduct numerical simulations of the
efficiency gains of their proposed allocation rule, this paper uses regression analysis to analyze
the accuracy of the specific carbon leakage criteria used by the EC.
3 Data and Methods
3.1 Data
We use a unique firm-level data set constructed by Martin et al. (2014) for analyzing the link
between permit allocation and carbon leakage. A key ingredient of this data set is a measure
of a firm’s propensity to downsize or relocate in response to carbon pricing, obtained from
interviews with managers of 761 manufacturing firms in six European countries: Belgium,
France, Germany, Hungary, Poland and the UK. As in Bloom and van Reenen (2007), interviews
were conducted over the telephone and follow a protocol intended to minimize cognitive bias.
Further, a large sample size and interviewer rotation is exploited to control for possible bias on
the part of the interviewers by including interviewer fixed effects in regression analyses (see
also Bloom and van Reenen, 2010). Specifically, managers were asked: “Do you expect that
government efforts to put a price on carbon emissions will force you to outsource part of the
production of this business site in the foreseeable future, or to close down completely?”, and
the interviewers ranked the answers to obtain an ordinal ‘vulnerability score’ (VS). The highest
score of 5 was assigned if the manager expected the plant to be closed completely, whereas
the lowest score of 1 was given if the manager expected no detrimental impacts at all. A score
of 3 was assigned if the manager expected that at least 10% of production and/or employment
would be outsourced in response to future policies. Scores of 2 or 4 were given to account for
intermediate responses. Table 1 presents the empirical distribution of the vulnerability score
(VS) across countries and industries.
9
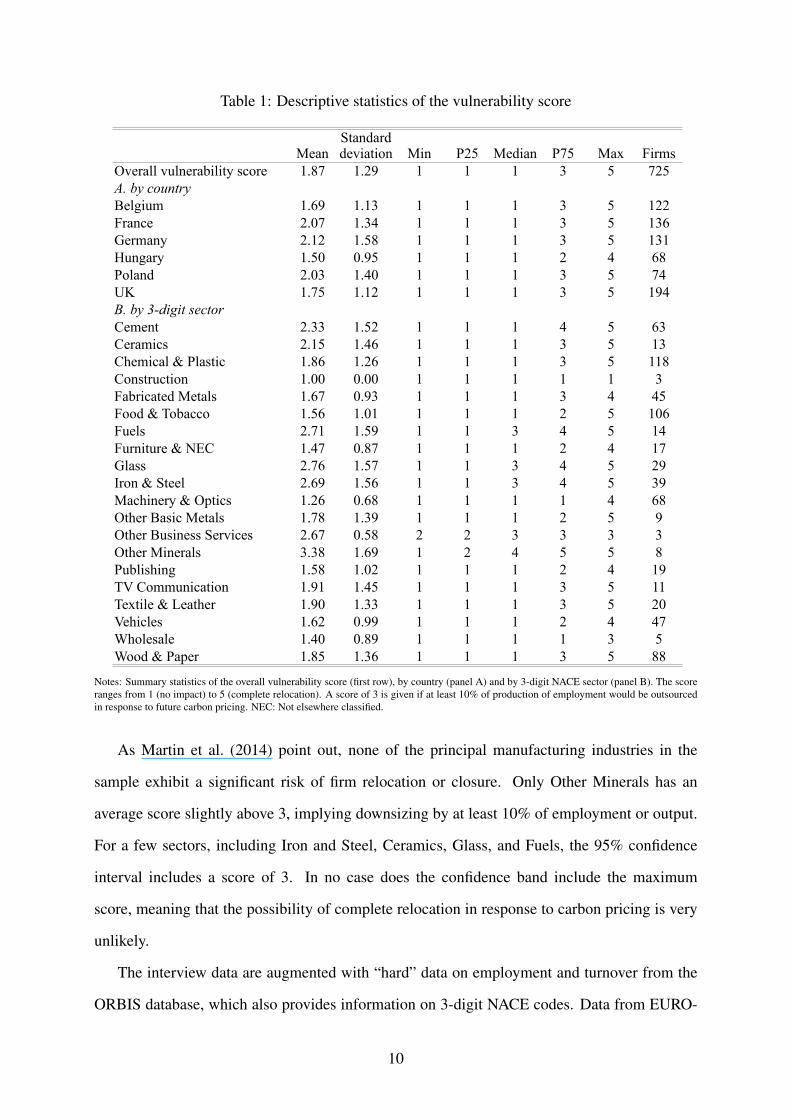
Table 1: Descriptive statistics of the vulnerability score
Mean Min P25 Median P75 Max FirmsOverall vulnerability score 1.87 1.29 1 1 1 3 5 725A. by countryBelgium 1.69 1.13 1 1 1 3 5 122France 2.07 1.34 1 1 1 3 5 136Germany 2.12 1.58 1 1 1 3 5 131Hungary 1.50 0.95 1 1 1 2 4 68Poland 2.03 1.40 1 1 1 3 5 74UK 1.75 1.12 1 1 1 3 5 194B. by 3-digit sectorCement 2.33 1.52 1 1 1 4 5 63Ceramics 2.15 1.46 1 1 1 3 5 13Chemical & Plastic 1.86 1.26 1 1 1 3 5 118Construction 1.00 0.00 1 1 1 1 1 3Fabricated Metals 1.67 0.93 1 1 1 3 4 45Food & Tobacco 1.56 1.01 1 1 1 2 5 106Fuels 2.71 1.59 1 1 3 4 5 14Furniture & NEC 1.47 0.87 1 1 1 2 4 17Glass 2.76 1.57 1 1 3 4 5 29Iron & Steel 2.69 1.56 1 1 3 4 5 39Machinery & Optics 1.26 0.68 1 1 1 1 4 68Other Basic Metals 1.78 1.39 1 1 1 2 5 9Other Business Services 2.67 0.58 2 2 3 3 3 3Other Minerals 3.38 1.69 1 2 4 5 5 8Publishing 1.58 1.02 1 1 1 2 4 19TV Communication 1.91 1.45 1 1 1 3 5 11Textile & Leather 1.90 1.33 1 1 1 3 5 20Vehicles 1.62 0.99 1 1 1 2 4 47Wholesale 1.40 0.89 1 1 1 1 3 5Wood & Paper 1.85 1.36 1 1 1 3 5 88
Standard deviation
Notes: Summary statistics of the overall vulnerability score (first row), by country (panel A) and by 3-digit NACE sector (panel B). The scoreranges from 1 (no impact) to 5 (complete relocation). A score of 3 is given if at least 10% of production of employment would be outsourcedin response to future carbon pricing. NEC: Not elsewhere classified.
As Martin et al. (2014) point out, none of the principal manufacturing industries in the
sample exhibit a significant risk of firm relocation or closure. Only Other Minerals has an
average score slightly above 3, implying downsizing by at least 10% of employment or output.
For a few sectors, including Iron and Steel, Ceramics, Glass, and Fuels, the 95% confidence
interval includes a score of 3. In no case does the confidence band include the maximum
score, meaning that the possibility of complete relocation in response to carbon pricing is very
unlikely.
The interview data are augmented with “hard” data on employment and turnover from the
ORBIS database, which also provides information on 3-digit NACE codes. Data from EURO-
10
STAT were used to reproduce as closely as possible the EC’s calculation of the sector-level
variables CI and TI. Finally, firm-level data on CO2 emissions and permit allocations was ob-
tained from the European Union Transaction Log (EUTL, formerly known as CITL) and from
the National Implementation Measures (NIM) which contain permit allocation for the current
trading phase.8 For a comprehensive description of the data set, the interested reader is referred
to Martin et al. (2014), which also contains a thorough analysis of the ability of the VS to
capture firms’ downsizing risk.
3.2 A regression based test
To evaluate the accuracy of the EC’s carbon leakage criteria, we examine how they correlate
with VS. In particular, CI and TI should be positively correlated with VS. We test this hy-
pothesis by estimating partial correlations in a regression framework that controls for possible
confounders at the firm and sector levels. The basic regression equation is given by
V Si,s = β0 +βT T Is +βCCIs +x′i,sβx + εi,s (1)
where V Si,s is the vulnerability score of firm i in sector s, T Is and CIs are the EC’s trade and
carbon criteria at the sector level, and xi,s is a vector including higher order terms of these vari-
ables, country dummies, and interviewer fixed effects to control for possible bias on the part of
the interviewers. Moreover, we control for interview noise due to the manager’s characteristics
– by including the tenure in the company, dummies for gender and professional background
(technical or law) – and due to the time of the interview – by including dummies for month, day
of week and time of day (am/pm).
It could be argued that the continuous relationship between VS, CI and TI imposed in these
regressions is not appropriate for the EC’s threshold based approach. We thus modify equation
(1) to include a set of dummy variables representing the exemption categories (A,B,C) defined
8We thank Oliver Sartor, Stephen Lecourt and Clement Palliere for kindly providing us with the data for 20of these countries, for which they collected and matched the NIM data on free permit allocation to ORBIS (seeLecourt et al., 2013). We complemented this dataset with the NIM data for Belgium and Hungary, which wematched to ORBIS by hand. In total, this results in a sample of nearly 8,000 installations covering 95% of theemissions.
11
above instead of the continuous variables TI and CI.
V Si,s = γ0 + γAI{i∈A}+ γBI{i∈B}+ γCI{i∈C}+x′i,sγx +ηi,s (2)
The omitted category in this regression are firms that are not exempt under the Carbon Leak-
age Decision. We estimate these regressions using ordinary least squares and calculate robust
standard errors which are clustered at the 4-digit NACE code level.
4 Results
4.1 Baseline specifications
Table 2 summarizes the results of various versions of regression equation (1). In the univariate
specifications, we find a strong positive association of VS with carbon intensity, but no sta-
tistically significant association with trade intensity. This result is robust when both measures
are included in a quadratic form that is better suited to capture possible effects of interactions
and non-linearities. For instance, trade exposure could matter for very high values of TI only,
or only when it coincides with high CI. There is no evidence of such effects. Weighting the
regression equation (1) by employment does not change the qualitative findings but gives rise
to a larger estimate for the impact on CI. This suggests that CI is a particularly good measure
of the risk of downsizing among large firms. In sum, our regression-based test reveals that TI is
not a good indicator to measure the risk of downsizing or outsourcing whereas CI is.
We obtain similar results when looking at exemption categories. The first column of Table
3 reports the results obtained for equation (2). Only the very carbon intensive group (A) has
an average VS significantly higher than the reference category (firms that are not exempt from
auctioning). But even in group A there is no dramatically high risk of downsizing or outsourcing
for the average firm. The 95%-confidence band for the VS in group A just about includes
the value of 3, which means a reduction of at least 10% in production or employment due to
outsourcing.
Taken together, the regression results obtained in equations (1) and (2) suggest that the
12
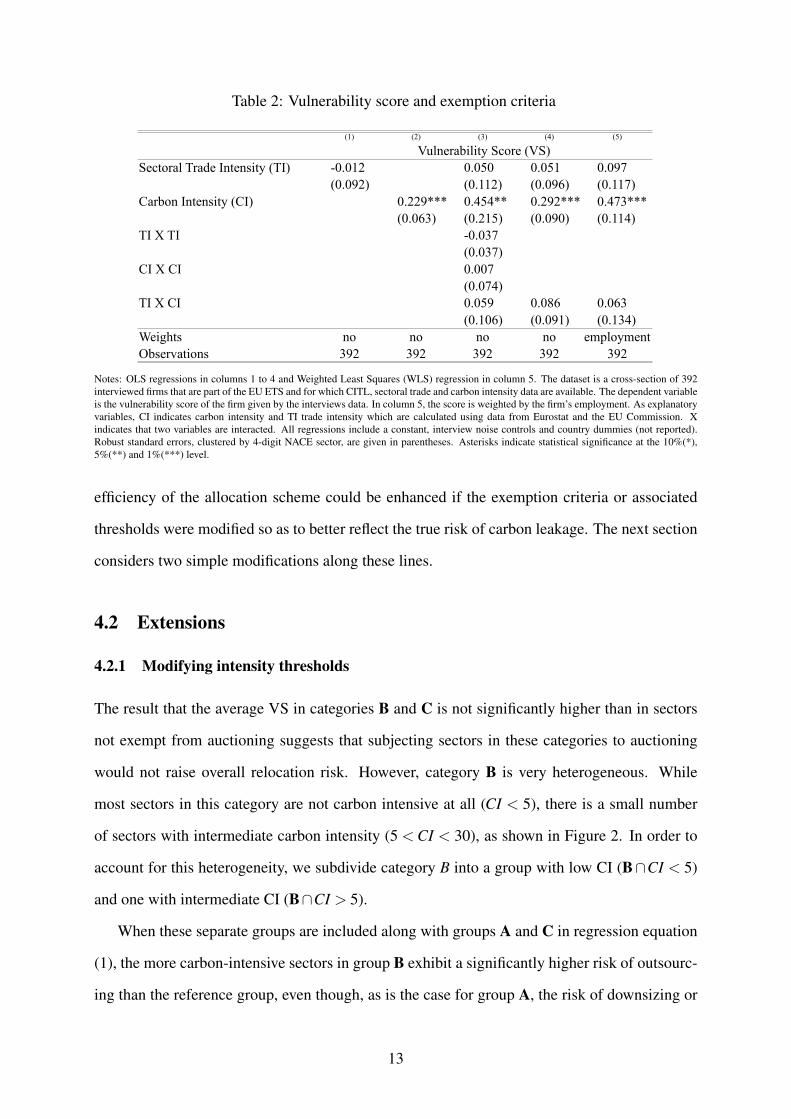
Table 2: Vulnerability score and exemption criteria
(1) (2) (3) (4) (5)
Vulnerability Score (VS)Sectoral Trade Intensity (TI) -0.012 0.050 0.051 0.097
(0.092) (0.112) (0.096) (0.117)Carbon Intensity (CI) 0.229*** 0.454** 0.292*** 0.473***
(0.063) (0.215) (0.090) (0.114)TI X TI -0.037
(0.037)CI X CI 0.007
(0.074)TI X CI 0.059 0.086 0.063
(0.106) (0.091) (0.134)Weights no no no no employmentObservations 392 392 392 392 392
Notes: OLS regressions in columns 1 to 4 and Weighted Least Squares (WLS) regression in column 5. The dataset is a cross-section of 392interviewed firms that are part of the EU ETS and for which CITL, sectoral trade and carbon intensity data are available. The dependent variableis the vulnerability score of the firm given by the interviews data. In column 5, the score is weighted by the firm’s employment. As explanatoryvariables, CI indicates carbon intensity and TI trade intensity which are calculated using data from Eurostat and the EU Commission. Xindicates that two variables are interacted. All regressions include a constant, interview noise controls and country dummies (not reported).Robust standard errors, clustered by 4-digit NACE sector, are given in parentheses. Asterisks indicate statistical significance at the 10%(*),5%(**) and 1%(***) level.
efficiency of the allocation scheme could be enhanced if the exemption criteria or associated
thresholds were modified so as to better reflect the true risk of carbon leakage. The next section
considers two simple modifications along these lines.
4.2 Extensions
4.2.1 Modifying intensity thresholds
The result that the average VS in categories B and C is not significantly higher than in sectors
not exempt from auctioning suggests that subjecting sectors in these categories to auctioning
would not raise overall relocation risk. However, category B is very heterogeneous. While
most sectors in this category are not carbon intensive at all (CI < 5), there is a small number
of sectors with intermediate carbon intensity (5 < CI < 30), as shown in Figure 2. In order to
account for this heterogeneity, we subdivide category B into a group with low CI (B∩CI < 5)
and one with intermediate CI (B∩CI > 5).
When these separate groups are included along with groups A and C in regression equation
(1), the more carbon-intensive sectors in group B exhibit a significantly higher risk of outsourc-
ing than the reference group, even though, as is the case for group A, the risk of downsizing or
13

Table 3: Vulnerability score and exemption categories
(1) (2) (3) (4) (5)Vulnerability Score Vulnerability Score>2
CI>30 (A) 1.032*** 1.015*** 1.996*** 0.714*** 1.704***(0.303) (0.312) (0.523) (0.242) (0.448)0.225(0.258)0.122 0.139 0.358 0.105 0.271(0.248) (0.240) (0.241) (0.233) (0.292)
0.596* 1.031*** 0.500** 1.267***(0.316) (0.322) (0.252) (0.417)-0.053 0.056 -0.059 0.121(0.243) (0.329) (0.233) (0.389)
Constant 1.623*** 1.572*** 1.426(0.516) (0.523) (0.912)
Weights no no employment no employmentObservations 392 392 392 392 392
TI>30 ∩ CI<30 (B)
10<TI<30 ∩ 5<CI<30 (C)
B ∩ CI>5
B ∩ CI<5
Notes: OLS regressions in columns 1 and 2, WLS in column 3 and Probit regressions in columns 4 and 5. The dataset is a cross-section of392 interviewed firms that are part of the EU ETS and for which CITL, sectoral trade and carbon intensity data are available. The dependentvariable is the vulnerability score (on a scale of 5) of the firm given by the interviews data in regressions 1 to 3, and a dummy indicating whetherthe score is higher than 2 in regressions 4 and 5. In columns 3 and 5, the firm’s employment is used to weight the regression. CI indicatescarbon intensity and TI trade intensity, calculated using data from Eurostat and the EU Commission. Based on these, dummies are constructedto represent belonging to categories A, B and C, as well as (B ∩ CI¿5) and (B ∩ CI¡5). These are used as explanatory variables. Columns 4and 5 report marginal effects of the probit regressions. All regressions include a constant, interview noise controls and country dummies (notreported). Robust standard errors, clustered by 4-digit NACE sector, in parentheses. Asterisks indicate statistical significance at the 10% (*),5%(**) and 1%(***) level.
closure does not attain very high levels for the average firm (cf. columns 2 and 3 of Table 3).
This result holds up when the regression is weighted by employment. In fact, the coefficient
estimates on groups A and B∩CI > 5 both become stronger, indicating that some of the larger
firms in those categories are at a higher risk.
In order to account for the qualitative difference between a slight increase in downsizing
risk and a strong downsizing impact, we also estimate Probit regressions of the binary event
that a firm has a VS of 3 or larger. The results, reported in columns 4 and 5 of Table 3, confirm
that only groups A and B∩CI > 5 present some risk of downsizing. It would therefore seem
justified to adjust the thresholds for exemption accordingly.
4.2.2 Refining the trade intensity definition
The evidence shows that the TI criterion is of limited value for proxying a sector’s actual down-
sizing risk. One reason for this could be that this indicator is not precise enough to capture
how exposure to international markets affects downsizing risk. For example, being exposed
to competition from China might affect a firm’s competitiveness in a very different way than
14
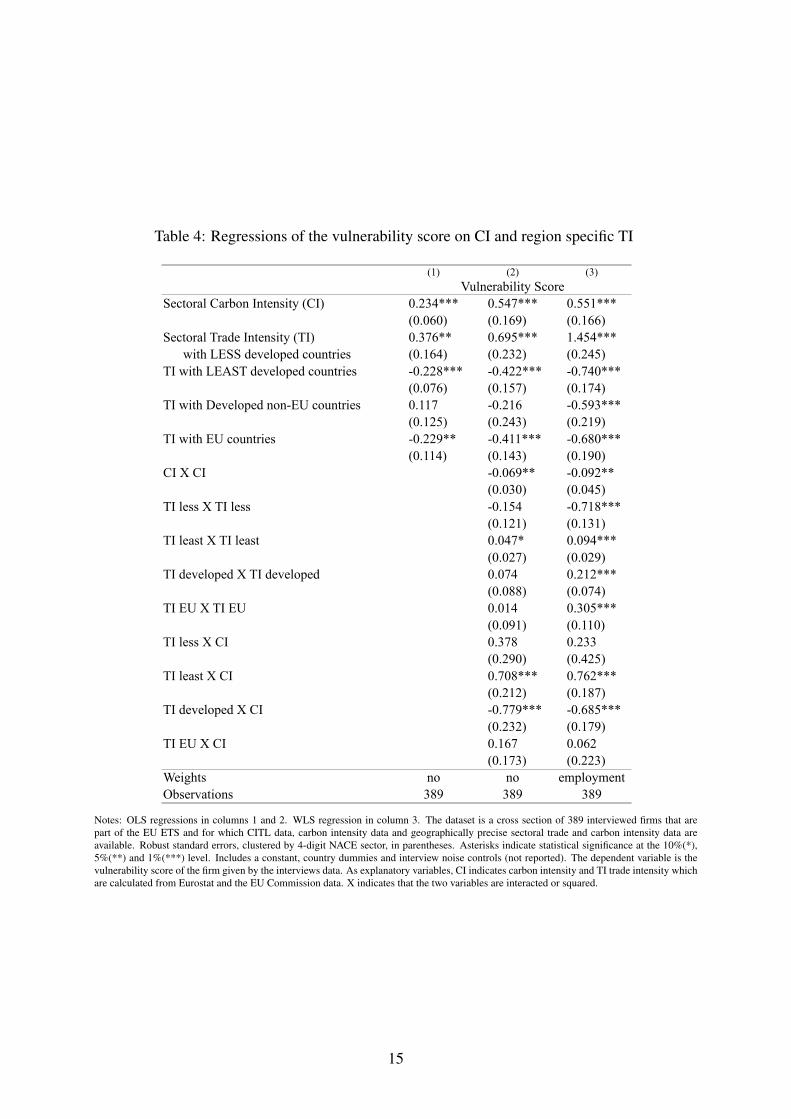
Table 4: Regressions of the vulnerability score on CI and region specific TI
(1) (2) (3)
Vulnerability ScoreSectoral Carbon Intensity (CI) 0.234*** 0.547*** 0.551***
(0.060) (0.169) (0.166)Sectoral Trade Intensity (TI) 0.376** 0.695*** 1.454*** with LESS developed countries (0.164) (0.232) (0.245)TI with LEAST developed countries -0.228*** -0.422*** -0.740***
(0.076) (0.157) (0.174)TI with Developed non-EU countries 0.117 -0.216 -0.593***
(0.125) (0.243) (0.219)TI with EU countries -0.229** -0.411*** -0.680***
(0.114) (0.143) (0.190)CI X CI -0.069** -0.092**
(0.030) (0.045)TI less X TI less -0.154 -0.718***
(0.121) (0.131)TI least X TI least 0.047* 0.094***
(0.027) (0.029)TI developed X TI developed 0.074 0.212***
(0.088) (0.074)TI EU X TI EU 0.014 0.305***
(0.091) (0.110)TI less X CI 0.378 0.233
(0.290) (0.425)TI least X CI 0.708*** 0.762***
(0.212) (0.187)TI developed X CI -0.779*** -0.685***
(0.232) (0.179)TI EU X CI 0.167 0.062
(0.173) (0.223)Weights no no employmentObservations 389 389 389
Notes: OLS regressions in columns 1 and 2. WLS regression in column 3. The dataset is a cross section of 389 interviewed firms that arepart of the EU ETS and for which CITL data, carbon intensity data and geographically precise sectoral trade and carbon intensity data areavailable. Robust standard errors, clustered by 4-digit NACE sector, in parentheses. Asterisks indicate statistical significance at the 10%(*),5%(**) and 1%(***) level. Includes a constant, country dummies and interview noise controls (not reported). The dependent variable is thevulnerability score of the firm given by the interviews data. As explanatory variables, CI indicates carbon intensity and TI trade intensity whichare calculated from Eurostat and the EU Commission data. X indicates that the two variables are interacted or squared.
15

does competition from Australia. Moreover, being export intensive could have different impli-
cations than being import intensive. In order to explore whether a refined TI measure would
give a better indicator of carbon leakage risk, we regress VS on CI and four separate measures
of the intensity of trade with (i) least developed countries (according to the UN classification),
(ii) less developed (or developing) countries including China and India, (iii) developed non-EU
countries and (iv) EU countries.
Table 4 summarizes the results of these regressions. Column 1 reveals a strong positive asso-
ciation between vulnerability and TI with less developed countries, which includes China and
other countries that tend to have less stringent environmental regulation standards and which
compete with European manufacturing firms. The relationship between vulnerability and TI
with least developed countries is negative and significant. This could reflect a lack of competi-
tion from such countries as they tend to export agricultural products and natural resources rather
than manufactured goods. High TI with EU countries is negatively associated with the VS. This
is consistent with firms anticipating that their EU competitors will be subject to the same policy
constraints. The findings obtained in the quadratic form, which includes interactions of TI with
CI and squared terms, are qualitatively similar (column 2). In addition, TI with other developed
countries outside the EU only matters in interaction with high CI, in which case vulnerability
is lower. Conversely, the negative link between vulnerability and TI for the least developed
countries is partially offset for the most carbon intensive firms. The employment-weighted re-
gression shows that especially the large firms in sectors that have a high TI with less developed
countries are relatively more at risk of downsizing (column 3). The coefficients on TI with other
regions are negative.
In further specifications, reported in Table 5, we decompose the TI measure into export in-
tensity (EI) and import intensity (II). This does not yield more significant results than for the
overall TI measure. After differentiating trade intensities by region as above, we find that ex-
ports and imports to less developed countries are both positively associated with VS, confirming
our earlier finding for overall trade with these regions.
16

Table 5: Regressions of the vulnerability score on CI, EI and II
(1) (2) (3)
Vulnerability ScoreCarbon Intensity (CI) 0.217*** 0.611*** 0.312
(0.058) (0.201) (0.202)Sectoral Export intensity (EI) -0.072
(0.160)Sectoral Import intensity (II) 0.142
(0.153)EI with LESS developed countries 0.200 1.613***
(0.263) (0.286)II with LESS developed countries 0.350 0.640**
(0.225) (0.273)EI with LEAST developed countries -0.476** -0.833***
(0.203) (0.240)II with LEAST developed countries 0.030 -0.052
(0.185) (0.284)EI with Developed non-EU countries -0.083 -0.551**
(0.242) (0.216)II with Developed non-EU countries -0.156 -0.443
(0.416) (0.374)EI with EU countries 0.544 0.016
(0.544) (0.675)II with EU countries -0.827 -0.901
(0.579) (0.682)EI less X EI less 0.081 -0.467***
(0.164) (0.171)II less X II less -0.018 -0.363**
(0.102) (0.139)EI least X EI least 0.089*** 0.095
(0.034) (0.097)II least X II least -0.012 0.007
(0.020) (0.034)EI developed X EI developed 0.328** 0.303**
(0.137) (0.134)II developed X II developed -0.044 0.010
(0.098) (0.110)EI EU X EI EU -0.926** -0.243
(0.361) (0.386)II EU X II EU 0.633** 0.695**
(0.305) (0.295)EI less X CI -0.027 0.918*
(0.386) (0.512)II less X CI 0.262 0.191
(0.214) (0.295)EI least X CI 0.255 0.145
(0.257) (0.262)II least X CI 0.064 0.411*
(0.169) (0.233)EI developed X CI 0.311 0.153
(0.338) (0.394)II developed X CI -0.354 -1.218***
(0.292) (0.410)EI EU X CI 0.041 -3.959**
(1.419) (1.659)II EU X CI 0.158 3.700**
(1.479) (1.692)Weights no no employmentObservations 389 389 389
Notes: OLS regressions in columns 1 and 2. WLS in column 3. The dataset is a cross-section of 389 interviewed firms that are part of the EUETS for which CITL, geographically precise sectoral trade and carbon intensity data are available. Robust standard errors, clustered by 4-digitNACE sector, in parentheses. Asterisks indicate statistical significance at the 10%(*), 5%(**) and 1%(***) level. Includes a constant, countrydummies and interview noise controls (not reported). The dependent variable is the vulnerability score of the firm given by the interview data.In column 3, the firm’s employment is used to weight the regression. As explanatory variables, CI indicates carbon intensity, EI export intensityand II import intensity which are calculated from Eurostat and the EU Commission data. X indicates that the two variables are interacted orsquared.
17

5 Discussion
Our analysis of the correlation between a measure of carbon leakage based on managers’ re-
sponses, and the carbon leakage criteria applied by the EC has revealed that carbon intensity is
a good proxy for leakage risk whereas trade intensity is not. This mismatch gives rise to overly
generous compensation in the form of free permits granted to trade-exposed industries that are
not really at risk of relocating due to carbon pricing. Based on our results, we have identified
two simple modifications of the carbon leakage criteria that might inform the EC’s impending
review of carbon leakage sectors, scheduled for 2014. The first one is to consider trade inten-
sive sectors at risk only if they are also carbon intensive. The second modification suggests
the adoption of a more specific TI measure which is based on trade only with less developed
countries rather than with all non-EU countries.
If exemptions from permit auctioning were granted according to these modified criteria,
more emission permits could be auctioned without a significant increase in leakage risk. Given
the scale of the EU ETS, it is worthwhile to perform a back-of-the-envelope calculation of
the resulting increase in auction revenue. To this end, we compile installation-level data on
benchmarking allocations, available for 22 countries, and match in the information on the NACE
industry code, which is needed to assign installations to exemption groups. The amount of
emissions no longer exempt from auctioning under an alternative rule is computed taking into
account that installations in non-exempt sectors get free permits for only 80% instead of 100%
of their benchmark emissions in 2013, and that this proportion falls linearly to 30% until 2020.
The results of this exercise are reported in Table 6.
Consider first a modification of the trade intensity threshold, as described above. Table 7
lists all sectors that would cease to be exempt from auctioning under this proposal. For our
sample, we calculate that this would yield an additional 82.3 million emission rights to be auc-
tioned. The bootstrapped confidence intervals at the 95% level indicate that the sampling error
surrounding this estimate interval is quite small. The point estimate is a lower bound as it does
not include (i) a small proportion of installations that could not be matched to industry codes
and (ii) installations in seven countries for which the NIM data were not publicly available.9 Us-
9The Czech Republic, Latvia, Liechtenstein, Lithuania, Malta, Norway and Slovenia.
18

Table 6: Reduction of free permit allocation and additional revenue
82.27 100.29 3,008.78 501.46[70.78; 95.54] [86.51; 115.54] [2,595.35; 3,466.17] [432.56; 577.69]
8.29 14.35 430.4 71.73[6.32; 10.17] [9.47; 20.11] [284.11; 603.41] [47.35; 100.57]
Reduction of free permit allocation (22 countries)
[MtCO2 eq]
Reduction of free permit allocation, whole EU ETS
[MtCO2 eq]
Additional revenue with price of €30 per
ton [M€]
Additional revenue with price of €5
per ton [M€]
A and B & CI>5
A, B and C – but TI with less developed countries only
Notes: Each row reports the reduction of free permit allocations and additional revenue under a different rule. A, B and C refer to the EU criteriadefined in Section 2.1. The second row uses trade intensity (TI) with less developed countries in the definition of groups B and C. MtCO2eqstands for million metric tons of CO2 equivalent. The numbers in brackets report two-sided 95% confidence intervals of the reductions of freepermit allocation and additional revenue obtained from a bootstrap with 200 replications.
ing aggregate data on emissions in 2009, we scale up the initial estimate to the entire EU ETS
and obtain a total of 100.3 million permits to be auctioned.10 Finally, we translate emissions
into revenues using two alternative allowance prices. The higher price of C30 is considered in
keeping with the EU Commission (2009). A lower price of C5 is closer to the market price ob-
served during 2012 and 2013. This leads to an estimate of additional auction revenue of either
C0.5 billion or C3 billion per year, with uncertainty of ±15%.
When the exemption categories are maintained but TI with less developed countries is used
instead of overall TI, the increase in auction revenue is lower, C71 million to C430m million
per year, depending on the allowance price, and estimated somewhat less precisely. While these
revenue estimates are also subject to uncertainty about future carbon emissions and allowance
prices, their order of magnitude shows that the EU is prepared to hand out profit subsidies to
polluting firms on an enormous scale without getting anything in return.
6 Conclusion
In spite of a push towards more permit auctioning during the current third trading phase of the
EU ETS, the evidence presented in this paper substantiates concerns that the European Com-
mission compensates polluting industries too generously at the expense of European taxpayers.
10This is done in two steps. First, for each CITL sector in each of the 22 countries, extra auctioning is scaled upby the proportion of matched 2009 allocations for the respective sector-country pair. Second, for each CITL sector,additional auctioned permits were divided by the share of the 22 countries in the total, EU ETS wide allocation forthat sector in 2009.
19
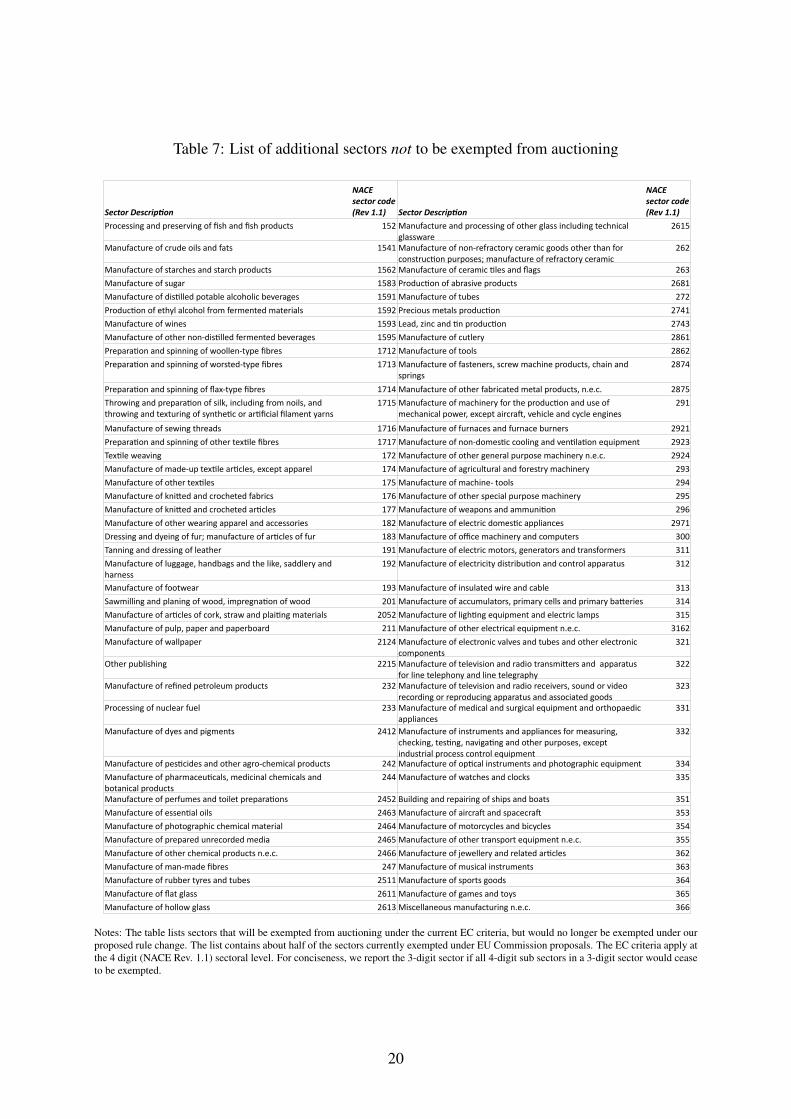
Table 7: List of additional sectors not to be exempted from auctioning
Sector Descripton Sector Descripton
Processing and preserving of fsh and fsh products 152 2615
Manufacture of crude oils and fats 1541 262
Manufacture of starches and starch products 1562 Manufacture of ceramic tles and fags 263
Manufacture of sugar 1583 Producton of abrasive products 2681
Manufacture of distlled potable alcoholic beverages 1591 Manufacture of tubes 272
Producton of ethyl alcohol from fermented materials 1592 Precious metals producton 2741
Manufacture of wines 1593 Lead, zinc and tn producton 2743
Manufacture of other non-distlled fermented beverages 1595 Manufacture of cutlery 2861
Preparaton and spinning of woollen-type fbres 1712 Manufacture of tools 2862
Preparaton and spinning of worsted-type fbres 1713 2874
Preparaton and spinning of fax-type fbres 1714 Manufacture of other fabricated metal products, n.e.c. 2875
1715 291
Manufacture of sewing threads 1716 Manufacture of furnaces and furnace burners 2921
Preparaton and spinning of other textle fbres 1717 Manufacture of non-domestc cooling and ventlaton equipment 2923
Textle weaving 172 Manufacture of other general purpose machinery n.e.c. 2924
Manufacture of made-up textle artcles, except apparel 174 Manufacture of agricultural and forestry machinery 293
Manufacture of other textles 175 Manufacture of machine- tools 294
Manufacture of knited and crocheted fabrics 176 Manufacture of other special purpose machinery 295
Manufacture of knited and crocheted artcles 177 Manufacture of weapons and ammuniton 296
Manufacture of other wearing apparel and accessories 182 Manufacture of electric domestc appliances 2971
Dressing and dyeing of fur; manufacture of artcles of fur 183 Manufacture of ofce machinery and computers 300
Tanning and dressing of leather 191 Manufacture of electric motors, generators and transformers 311
192 Manufacture of electricity distributon and control apparatus 312
Manufacture of footwear 193 Manufacture of insulated wire and cable 313
201 Manufacture of accumulators, primary cells and primary bateries 314
Manufacture of artcles of cork, straw and plaitng materials 2052 Manufacture of lightng equipment and electric lamps 315
Manufacture of pulp, paper and paperboard 211 Manufacture of other electrical equipment n.e.c. 3162
Manufacture of wallpaper 2124 321
Other publishing 2215 322
Manufacture of refned petroleum products 232 323
Processing of nuclear fuel 233 331
Manufacture of dyes and pigments 2412 332
242 Manufacture of optcal instruments and photographic equipment 334
244 Manufacture of watches and clocks 335
Manufacture of perfumes and toilet preparatons 2452 Building and repairing of ships and boats 351
Manufacture of essental oils 2463 Manufacture of aircraf and spacecraf 353
Manufacture of photographic chemical material 2464 Manufacture of motorcycles and bicycles 354
Manufacture of prepared unrecorded media 2465 Manufacture of other transport equipment n.e.c. 355
Manufacture of other chemical products n.e.c. 2466 Manufacture of jewellery and related artcles 362
Manufacture of man-made fbres 247 Manufacture of musical instruments 363
Manufacture of rubber tyres and tubes 2511 Manufacture of sports goods 364
Manufacture of fat glass 2611 Manufacture of games and toys 365
Manufacture of hollow glass 2613 Miscellaneous manufacturing n.e.c. 366
NACE sector code (Rev 1.1)
NACE sector code (Rev 1.1)
Manufacture and processing of other glass including technical glasswareManufacture of non-refractory ceramic goods other than for constructon purposes; manufacture of refractory ceramic
Manufacture of fasteners, screw machine products, chain and springs
Throwing and preparaton of silk, including from noils, and throwing and texturing of synthetc or artfcial flament yarns
Manufacture of machinery for the producton and use of mechanical power, except aircraf, vehicle and cycle engines
Manufacture of luggage, handbags and the like, saddlery and harness
Sawmilling and planing of wood, impregnaton of wood
Manufacture of electronic valves and tubes and other electronic componentsManufacture of television and radio transmiters and apparatus for line telephony and line telegraphyManufacture of television and radio receivers, sound or video recording or reproducing apparatus and associated goodsManufacture of medical and surgical equipment and orthopaedic appliancesManufacture of instruments and appliances for measuring, checking, testng, navigatng and other purposes, except industrial process control equipment
Manufacture of pestcides and other agro-chemical products
Manufacture of pharmaceutcals, medicinal chemicals and botanical products
Notes: The table lists sectors that will be exempted from auctioning under the current EC criteria, but would no longer be exempted under ourproposed rule change. The list contains about half of the sectors currently exempted under EU Commission proposals. The EC criteria apply atthe 4 digit (NACE Rev. 1.1) sectoral level. For conciseness, we report the 3-digit sector if all 4-digit sub sectors in a 3-digit sector would ceaseto be exempted.
20

Clearly, subsidizing “carbon fat cats”11 in times of deep cuts in public spending could (fur-
ther) undermine political support for emissions trading. However, our analysis also points to a
window of opportunity for European governments to improve the design of the EU ETS signif-
icantly while raising additional revenue in the billions of euros annually. Rather than providing
an unspecific subsidy for industry, governments could earmark this money to finance invest-
ments in infrastructure and R&D which are costly but crucial for the transition to a low-carbon
economy. Furthermore, part of the additional revenue could be used to mitigate possibly re-
gressive effects of higher carbon prices on low-income groups. Not least, more permit revenue
would help to balance strained government budgets in those European countries most affected
by the grand recession.
References
Abrell, J., Ndoye, A., and Zachmann, G. (2011). Assessing the impact of the EU ETS using
firm level data. Bruegel Working Paper 2011/08, Brussels, Belgium.
Anger, N., and Oberndorfer, U. (2008). Firm performance and employment in the EU emissions
trading scheme: An empirical assessment for Germany. Energy Policy, 36(1), 12–22.
Bloom, N., and van Reenen, J. (2007). Measuring and Explaining Management Practices across
Firms and Countries. Quarterly Journal of Economics, CXXII(4), 1351–1406.
Bloom, N., and van Reenen, J. (2010). New Approaches to Surveying Organizations. American
Economic Review, 100(2), 105–09.
Bushnell, J. B., Chong, H., and Mansur, E. T. (2013). Profiting from Regulation: An Event
Study of the EU Carbon Market. American Economic Journal: Economic Policy, 5(4).
Chan, H. S., Li, S., and Zhang, F. (2013). Firm competitiveness and the European Union
emissions trading scheme. Energy Policy, (0).
Clo, S. (2010). Grandfathering, auctioning and Carbon Leakage: Assessing the inconsistencies
of the new ETS Directive. Energy Policy, 38(5), 2420–2430.11http://www.sandbag.org.uk/maps/companymap/
21

Commins, N., Lyons, S., Schiffbauer, M., and Tol, N. C. (2011). Climate Policy and Corporate
Behavior. The Energy Journal, 32(4).
Convery, F. J., and Redmond, L. (2007). Market and Price Developments in the European Union
Emissions Trading Scheme. Review of Environmental Economics and Policy, 1(1), 88–111.
Demailly, D., and Quirion, P. (2006). CO2 abatement, competitiveness and leakage in the
European cement industry under the EU ETS: grandfathering versus output-based allocation.
Climate Policy, 1, 93–113.
Demailly, D., and Quirion, P. (2008). European Emission Trading Scheme and competitiveness:
A case study on the iron and steel industry. Energy Economics, 30(4), 2009–2027.
Ellerman, A. D., Buchner, B. K., and Carraro, C. (Eds.) (2007). Allocation in the European
Emissions Trading Scheme: Rights, Rents and Fairness. Cambridge: Cambridge University
Press.
Ellerman, A. D., and Joskow, P. L. (2008). The European Union’s Emissions Trading System
in Perspective. Tech. rep., Pew Center on Global Climate Change, Washington, DC.
EU Commission (2009). Impact Assessment accompanying the commission decision determin-
ing a list of sectors and subsectors which are deemed to be exposed to a significant risk of
carbon leakage pursuant to article 10a (13) of Directive 2003/87/ec.
Hahn, R. W. (1984). Market Power and Transferable Property Rights. The Quarterly Journal
of Economics, 99(4), 753–765.
Hood, C. (2010). Reviewing Existing and Proposed Emissions Trading Systems. Tech. Rep. 13,
International Energy Agency, Paris.
Juergens, I., Barreiro-Hurle, J., and Vasa, A. (2013). Identifying carbon leakage sectors in the
EU ETS and implications of results. Climate Policy, 13(1), 89–109.
Lecourt, S., Palliere, C., and Sartor, O. J. (2013). The impact of emissions-performance bench-
marking on free allocations in EU ETS Phase 3. Tech. Rep. 2013-02, Paris Dauphine CDC
Climat.
22

Martin, R., de Preux, L. B., and Wagner, U. J. (2011). The Impacts of the Climate Change
Levy on Manufacturing: Evidence from Microdata. Working Paper 17446, National Bureau
of Economic Research.
Martin, R., Muuls, M., de Preux, L. B., and Wagner, U. J. (2012). Anatomy of a Paradox: Man-
agement Practices, Organizational Structure and Energy Efficiency. Journal of Environmental
Economics and Management, 63(2), 208–223.
Martin, R., Muuls, M., de Preux, L. B., and Wagner, U. J. (2013a). Industry Compensation Un-
der Relocation Risk: A Firm-Level Analysis of the EU Emissions Trading Scheme. Working
Paper 19097, National Bureau of Economic Research.
Martin, R., Muuls, M., de Preux, L. B., and Wagner, U. J. (2014). Industry compensation
under relocation risk: A firm-level analysis of the eu Emissions Trading Scheme. American
Economic Review, forthcoming.
Martin, R., Muuls, M., and Wagner, U. J. (2013b). The Impact of the EU ETS on Regulated
Firms: What is the Evidence After Eight Years? Mimeograph.
Meunier, G., Ponssard, J.-P., and Quirion, P. (2012). Carbon Leakage and Capacity-Based
Allocations. Is the EU right? CESifo Working Paper Series 4029, CESifo Group Munich.
Monjon, S., and Quirion, P. (2011). Addressing leakage in the EU ETS: Border adjustment or
output-based allocation? Ecological Economics, 70(11), 1957–1971.
Montgomery, W. (1972). Markets in licenses and efficient pollution control programs. Journal
of Economic Theory, 5(3), 395–418.
Paltsev, S. V. (2001). The Kyoto Protocol: Regional and Sectoral Contributions to the Carbon
Leakage. The Energy Journal, 22(4), 53–79.
Reguant, M., and Ellerman, A. D. (2008). Grandfathering and the endowment effect - an as-
sessment in the context of the Spanish national allocation plan. MIT Center for Energy and
Environmental Policy Research Paper 0818, Cambridge, MA.
23

Reinaud, J. (2005). Industrial competitiveness under the European Union Trading Scheme.
Tech. rep., International Energy Agency, Paris.
Sato, M., Grubb, M., Cust, J., Chan, K., Korppoo, A., and Ceppi, P. (2007). Differentiation and
dynamics of competitiveness impacts from the EU ETS. CWPE 0712, Faculty of Economics,
University of Cambridge, UK.
Smale, R., Hartley, M., Hepburn, C. J., Ward, J., and Grubb, M. (2006). The impact of CO2
emissions trading on firm profits and market prices. Climate Policy, 6(1), 31–48.
Stavins, R. N. (1995). Transaction Costs and Tradeable Permits. Journal of Environmental
Economics and Management, 29(2), 133–148.
Wagner, U. J., Muuls, M., Martin, R., and Colmer, J. (2013a). An evaluation of the impact of
the EU emissions trading system on the industrial sector. Plant-level evidence from France.
Tech. rep., Imperial College London, London, UK.
Wagner, U. J., Rehdanz, K., and Petrick, S. (2013b). The impact of carbon trading on industry:
Evidence from German manufacturing plants. Tech. rep., Universidad Carlos III de Madrid.
24
Related Documents


