On the Electric-Field-Induced Responses of Charged Spherical Colloids in Uncharged Hydrogels and the Anomalous Bulk Viscosity of Polymer-Nanocomposite Melts Mu Wang Master of Engineering Department of Chemical Engineering McGill University Montreal,Quebec June 2008 A thesis submitted to McGill University in partial fulfilment of the requirements of the degree of Master of Engineering c Mu Wang 2008. All rights reserved.

Welcome message from author
This document is posted to help you gain knowledge. Please leave a comment to let me know what you think about it! Share it to your friends and learn new things together.
Transcript
On the Electric-Field-InducedResponses of Charged SphericalColloids in Uncharged Hydrogels
and the Anomalous Bulk Viscosity ofPolymer-Nanocomposite Melts
Mu Wang
Master of Engineering
Department of Chemical Engineering
McGill University
Montreal,Quebec
June 2008
A thesis submitted to McGill University in partial fulfilment of therequirements of the degree of Master of Engineering
c© Mu Wang 2008. All rights reserved.
ABSTRACT
Colloidal particles dispersed in complex fluids such as hydrogels and poly-
mer melts are important because nano-scale inclusions often impart unex-
pected and commercially attractive changes in the dispersed phase. Future
development of these colloidal composites, and diagnostics to characterize
their microstructure, demand a sound understanding of micro-scale dynamics.
Accordingly, this thesis addresses (i) the steady and dynamic electric-field-
induced displacements of spherical colloidal particles embedded in hydrogels,
and (ii) the anomalous viscosity reduction of polymer-nanocomposite melts.
The first problem is undertaken by solving a multi-phase electrokinetic model
that quantifies how the viscoelasticity, compressibility, and hydrodynamic per-
meability of the hydrogel skeleton, and physicochemical properties of the in-
clusions, modulate the particle dynamics and electroacoustic responses. For
the second problem, a hydrodynamic model is developed, and its analytical so-
lution and numerical extension are adopted to interpret recent experiments in
the literature where the bulk viscosity decreases anomalously with increasing
particle volume fraction.
ii
ABREGE
Les particules colloıdales dispersees dans les fluides complexes comme les
hydrogels et des fontes de polymeres sont importantes parce que les inclusions
a nano-echelle repandent souvent des changements inattendus et commerciale-
ment interessants dans la phase dispersee. Les developpements futurs de ces
composites colloıdales et des diagnostiques pour caracteriser leur microstruc-
ture, demande une bonne comprehension de la dynamique a micro-echelle. En
consequence, cette these porte sure (i) la progression reguliere et dynamique
des deplacements de particules colloıdales spheriques embarques dans des hy-
drogels induits par le champ electrique, et (ii) la reduction anormale de la
viscosite des fontes en polymeres nanocomposites. Le premier probleme est
entrepris par la resolution d’un modele electrocinetique a multiple phases qui
quantifie de facon ou la viscoelasticite, de compression, la permeabilite hy-
drodynamiques de squelette d’hydrogel et des proprietes physico-chimiques
des inclusions, et de moduler la dynamique des particules et reponses elec-
troacoustiques. Pour le deuxieme probleme, un modele hydrodynamique est
developpe, sa solution analytique et son extension numerique sont adoptees
pour interpreter les experiences recentes en litterature ou la plus grande vis-
cosite diminue anormalement avec l’augmentation du volume fraction des par-
ticules.
iii
ACKNOWLEDGEMENTS
I would like to express my sincere gratitude to Professor R. J. Hill for his
guidance, support and patience during this research project. I was very lucky
to work with him on the exciting subjects of colloid and interface science. His
physical insights and critical thinking abilities for solving complex problems
make every discussion with him very fruitful. Professor Hill is not only a
supervisor, but also a good mentor of life. I am especially grateful for his
understanding and support during various phases of the project.
It is a pleasure to work with members of Hill’s group: Jan van Heiningen,
Aliasghar Mohammadi, Huaiying Zhang, and Savnit Raj, as our delightful
conversations over various topics are not only relaxing, but also enlightening.
I would like to thank my families and my friends for their help, and especially
my parents, for their unconditional love and support.
Finally, I would like to thank the Department of Chemical Engineering,
McGill University, for financial support through the William H. Gauvin Fel-
lowship and an Eugenie Ulmer Lamothe Award.
iv
COPYRIGHT CLEARANCES
I, Reghan J. Hill, hereby give copyright clearance of the following papers,
of which I am a co-author, in the master thesis of Mu Wang:
• Chapter 3: Wang, M. & Hill, R. J. 2008 Electric-field-induced dis-
placement of charged spherical colloids in compressible hydrogels. Soft
Matter 4, 1048–1058.
• Chapter 4: Wang, M. & Hill, R. J. Dynamic electric-field-induced
response of charged spherical colloids in uncharged hydrogels. Submitted.
• Chapter 5: Wang, M. & Hill, R. J. Anomalous bulk viscosity of
polymer-nanocomposite melt. Submitted.
Reghan J. Hill, Associate Professor
Department of Chemical Engineering
McGill University
Montreal, Quebec, Canada
v
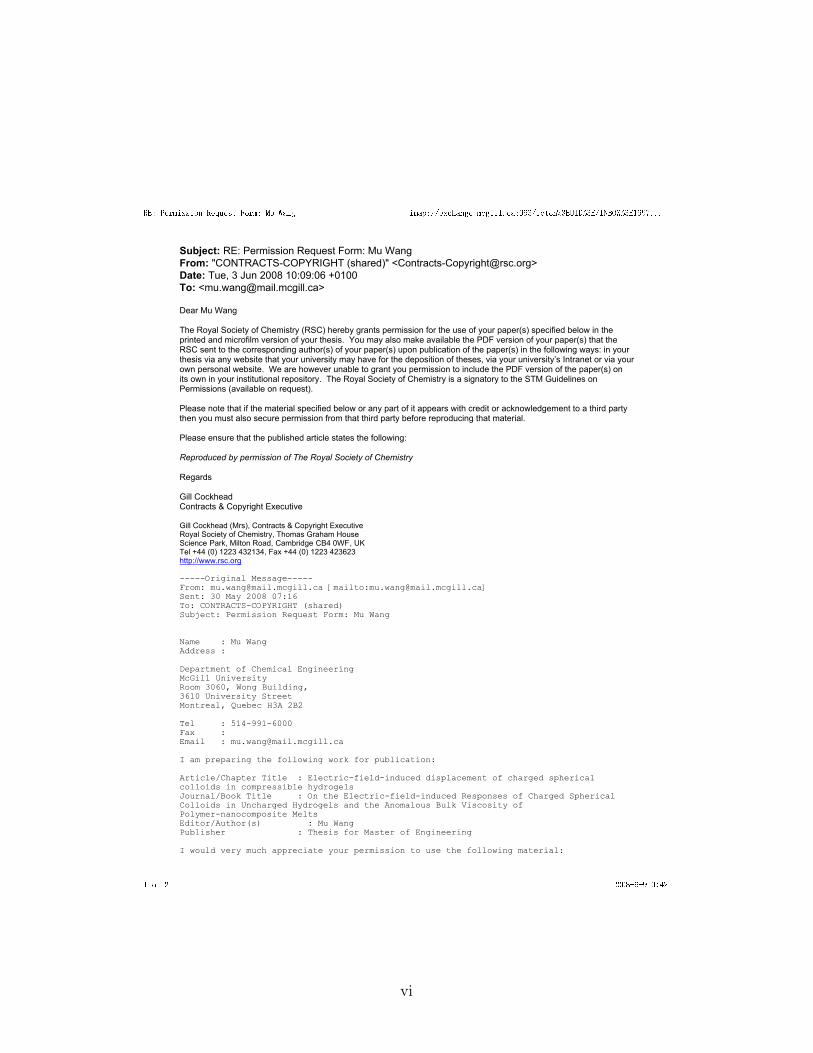
RE: Permission Request Form: Mu Wang imap://exchange.mcgill.ca:993/fetch%3EUID%3E/INBOX%3E1997...
1 of 2 2008-6-9 0:42
Subject: RE: Permission Request Form: Mu Wang
From: "CONTRACTS-COPYRIGHT (shared)" <[email protected]>
Date: Tue, 3 Jun 2008 10:09:06 +0100
To: <[email protected]>
Dear Mu Wang The Royal Society of Chemistry (RSC) hereby grants permission for the use of your paper(s) specified below in theprinted and microfilm version of your thesis. You may also make available the PDF version of your paper(s) that theRSC sent to the corresponding author(s) of your paper(s) upon publication of the paper(s) in the following ways: in yourthesis via any website that your university may have for the deposition of theses, via your university’s Intranet or via yourown personal website. We are however unable to grant you permission to include the PDF version of the paper(s) onits own in your institutional repository. The Royal Society of Chemistry is a signatory to the STM Guidelines onPermissions (available on request). Please note that if the material specified below or any part of it appears with credit or acknowledgement to a third partythen you must also secure permission from that third party before reproducing that material. Please ensure that the published article states the following: Reproduced by permission of The Royal Society of Chemistry Regards Gill CockheadContracts & Copyright Executive Gill Cockhead (Mrs), Contracts & Copyright ExecutiveRoyal Society of Chemistry, Thomas Graham HouseScience Park, Milton Road, Cambridge CB4 0WF, UKTel +44 (0) 1223 432134, Fax +44 (0) 1223 423623http://www.rsc.org -----Original Message-----From: [email protected] [mailto:[email protected]] Sent: 30 May 2008 07:16To: CONTRACTS-COPYRIGHT (shared)Subject: Permission Request Form: Mu Wang Name : Mu WangAddress : Department of Chemical EngineeringMcGill UniversityRoom 3060, Wong Building, 3610 University StreetMontreal, Quebec H3A 2B2 Tel : 514-991-6000Fax :Email : [email protected] I am preparing the following work for publication: Article/Chapter Title : Electric-field-induced displacement of charged sphericalcolloids in compressible hydrogelsJournal/Book Title : On the Electric-field-induced Responses of Charged SphericalColloids in Uncharged Hydrogels and the Anomalous Bulk Viscosity ofPolymer-nanocomposite Melts Editor/Author(s) : Mu Wang Publisher : Thesis for Master of Engineering I would very much appreciate your permission to use the following material:
vi
RE: Permission Request Form: Mu Wang imap://exchange.mcgill.ca:993/fetch%3EUID%3E/INBOX%3E1997...
2 of 2 2008-6-9 0:43
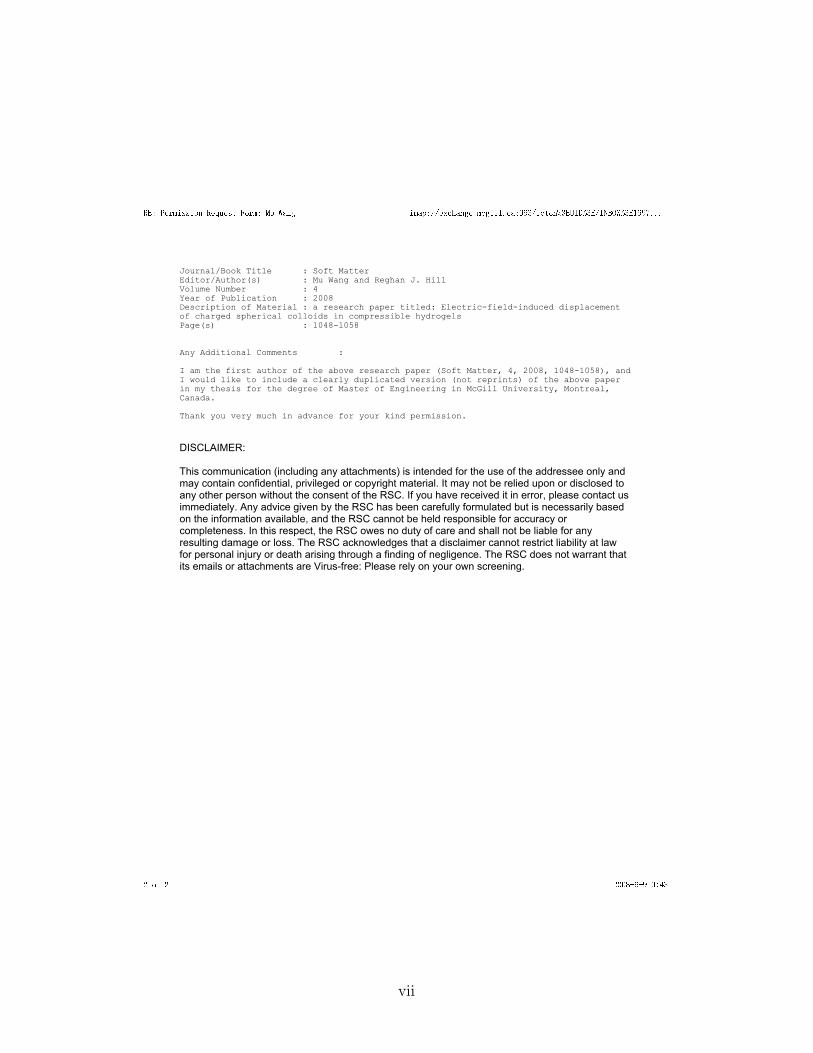
Journal/Book Title : Soft MatterEditor/Author(s) : Mu Wang and Reghan J. HillVolume Number : 4Year of Publication : 2008 Description of Material : a research paper titled: Electric-field-induced displacementof charged spherical colloids in compressible hydrogels Page(s) : 1048-1058 Any Additional Comments : I am the first author of the above research paper (Soft Matter, 4, 2008, 1048-1058), andI would like to include a clearly duplicated version (not reprints) of the above paperin my thesis for the degree of Master of Engineering in McGill University, Montreal,Canada. Thank you very much in advance for your kind permission.
DISCLAIMER:
This communication (including any attachments) is intended for the use of the addressee only and may contain confidential, privileged or copyright material. It may not be relied upon or disclosed to any other person without the consent of the RSC. If you have received it in error, please contact usimmediately. Any advice given by the RSC has been carefully formulated but is necessarily based on the information available, and the RSC cannot be held responsible for accuracy or completeness. In this respect, the RSC owes no duty of care and shall not be liable for any resulting damage or loss. The RSC acknowledges that a disclaimer cannot restrict liability at law for personal injury or death arising through a finding of negligence. The RSC does not warrant that its emails or attachments are Virus-free: Please rely on your own screening.
vii

CONTRIBUTION OF AUTHORS
Contents of chapters 3–5 of this thesis are reproduced or adapted from the
papers that have been published or submitted for publication in scientific jour-
nals under the supervision of my research supervisor, Professor R. J. Hill, who
is also a co-author. Chapter 3 discussed the steady electric-field-induced dis-
placement of a colloidal particle in compressible hydrogels, chapter 4 extended
the steady displacement to the dynamic responses and connected the single
particle response to the bulk electroacoustic signals, and chapter 5 theoreti-
cally interpreted the recently discovered bulk viscosity reduction in polymer-
nanocomposite melts.
The research project was initiated by Professor Hill. In chapter 3, using a
displacement construction proposed by Professor Hill, I devised the computa-
tional methodology and boundary layer solution for the steady displacement,
and highlighted the importance of compressibility. In chapter 4, I numerically
calculated dynamic particle displacement and derived a boundary layer ap-
proximation. To overcome numerical difficulties, I also analytically solved a
so-called two-fluid model, and performed a far-field asymptotic analysis on the
governing equations. Furthermore, I have theoretically shown that electric mi-
crorheology and electroacoustic diagnostics can be applied to hydrogel-colloid
composites at low and high frequencies, respectively. In both chapters, I devel-
oped robust computer programs in C and FORTRAN to compute the steady
and dynamic particle responses. In chapter 5, I proposed that the bulk vis-
cosity reduction may arise from Rouse dynamics in entangled melts at small
scales. Professor Hill and I derived a hydrodynamic model to verify this idea,
and I have showed that the layer thickness is qualitatively independent of the
continuous layer profile.
viii
TABLE OF CONTENTS
ABSTRACT . . . . . . . . . . . . . . . . . . . . . . . . . . . . . . . . ii
ABREGE . . . . . . . . . . . . . . . . . . . . . . . . . . . . . . . . . . iii
ACKNOWLEDGEMENTS . . . . . . . . . . . . . . . . . . . . . . . . iv
COPYRIGHT CLEARANCES . . . . . . . . . . . . . . . . . . . . . . v
CONTRIBUTION OF AUTHORS . . . . . . . . . . . . . . . . . . . . viii
LIST OF TABLES . . . . . . . . . . . . . . . . . . . . . . . . . . . . . xi
LIST OF FIGURES . . . . . . . . . . . . . . . . . . . . . . . . . . . . xii
1 Introduction . . . . . . . . . . . . . . . . . . . . . . . . . . . . . . 1
1.1 Thesis motivation . . . . . . . . . . . . . . . . . . . . . . . 11.2 Objectives of the thesis . . . . . . . . . . . . . . . . . . . . 21.3 Thesis organization . . . . . . . . . . . . . . . . . . . . . . 4
2 Literature Review . . . . . . . . . . . . . . . . . . . . . . . . . . . 5
2.1 Theoretical models for hydrogels . . . . . . . . . . . . . . . 52.2 Theoretical development of electroacoustics . . . . . . . . . 62.3 Numerical solutions of electrokinetic models . . . . . . . . 7
3 Electric-field-induced displacement of charged spherical colloids incompressible hydrogels1 . . . . . . . . . . . . . . . . . . . . . . 10
3.1 Introduction . . . . . . . . . . . . . . . . . . . . . . . . . . 113.2 Theoretical model and solution . . . . . . . . . . . . . . . 15
3.2.1 Coupled electrokinetic transport and elastic deforma-tion model . . . . . . . . . . . . . . . . . . . . . . 16
3.2.2 Solution methodology . . . . . . . . . . . . . . . . . 173.2.3 Force evaluation and inclusion displacement . . . . . 20
3.3 Boundary-layer analysis for κa 1, ` a and |ζ| < kT/e 213.3.1 Outer solution . . . . . . . . . . . . . . . . . . . . . 223.3.2 Inner solution and matching . . . . . . . . . . . . . 24
3.4 Numerically exact results . . . . . . . . . . . . . . . . . . . 273.5 Summary . . . . . . . . . . . . . . . . . . . . . . . . . . . 37
4 Dynamic electric-field-induced response of charged spherical col-loids in uncharged hydrogels . . . . . . . . . . . . . . . . . . . . 38
4.1 Introduction . . . . . . . . . . . . . . . . . . . . . . . . . . 39
ix
4.2 Two-fluid model and response for uncharged colloids . . . . 454.2.1 Fluid velocity and polymer displacement fields . . . 464.2.2 Force and response function . . . . . . . . . . . . . 49
4.3 Multi-phase electrokinetic model . . . . . . . . . . . . . . . 504.3.1 Governing equations and boundary conditions . . . 514.3.2 Solution methodology . . . . . . . . . . . . . . . . . 534.3.3 Simplification for incompressible hydrogels . . . . . 564.3.4 Force and dynamic electrokinetic response . . . . . . 57
4.4 Far-field asymptotic analysis . . . . . . . . . . . . . . . . . 604.4.1 Far-field decays of ψ and nj . . . . . . . . . . . . . 614.4.2 Far-field decays of f,r, g1 and g2 . . . . . . . . . . . 634.4.3 Far-field analysis for incompressible hydrogels . . . . 64
4.5 Connection to electroacoustics . . . . . . . . . . . . . . . . 664.6 High-frequency boundary-layer approximation . . . . . . . 704.7 Results . . . . . . . . . . . . . . . . . . . . . . . . . . . . . 76
4.7.1 Response functions for an uncharged particle . . . . 764.7.2 Numerical solution of the multi-phase electrokinetic
model . . . . . . . . . . . . . . . . . . . . . . . . 794.7.3 High-frequency boundary-layer approximation and ap-
plication to electroacoustics . . . . . . . . . . . . 864.8 Summary . . . . . . . . . . . . . . . . . . . . . . . . . . . 914.A Point-force representation of a particle in an uncharged hy-
drogel matrix . . . . . . . . . . . . . . . . . . . . . . . . 944.B Numerical solution of the field equations . . . . . . . . . . 97
5 Anomalous bulk viscosity of polymer-nanocomposite melt . . . . 101
5.1 Introduction . . . . . . . . . . . . . . . . . . . . . . . . . . 1015.2 Theory . . . . . . . . . . . . . . . . . . . . . . . . . . . . . 1055.3 Intrinsic viscosity from the single-layer model . . . . . . . . 1125.4 Theoretical interpretation of experiments . . . . . . . . . . 1155.5 Summary and conclusions . . . . . . . . . . . . . . . . . . 121
6 Summary and conclusions . . . . . . . . . . . . . . . . . . . . . . 122
REFERENCES . . . . . . . . . . . . . . . . . . . . . . . . . . . . . . . 125
x
LIST OF TABLESTable page
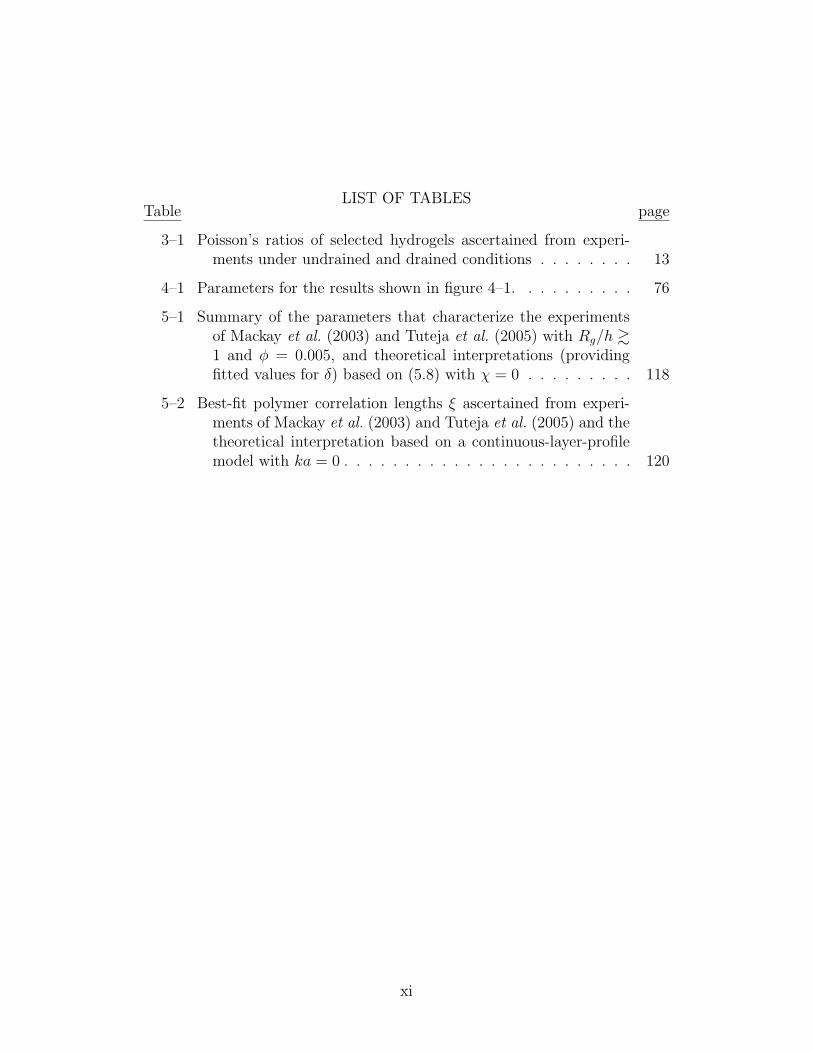
3–1 Poisson’s ratios of selected hydrogels ascertained from experi-ments under undrained and drained conditions . . . . . . . . 13
4–1 Parameters for the results shown in figure 4–1. . . . . . . . . . 76
5–1 Summary of the parameters that characterize the experimentsof Mackay et al. (2003) and Tuteja et al. (2005) with Rg/h &1 and φ = 0.005, and theoretical interpretations (providingfitted values for δ) based on (5.8) with χ = 0 . . . . . . . . . 118
5–2 Best-fit polymer correlation lengths ξ ascertained from experi-ments of Mackay et al. (2003) and Tuteja et al. (2005) and thetheoretical interpretation based on a continuous-layer-profilemodel with ka = 0 . . . . . . . . . . . . . . . . . . . . . . . . 120
xi
LIST OF FIGURESFigure page
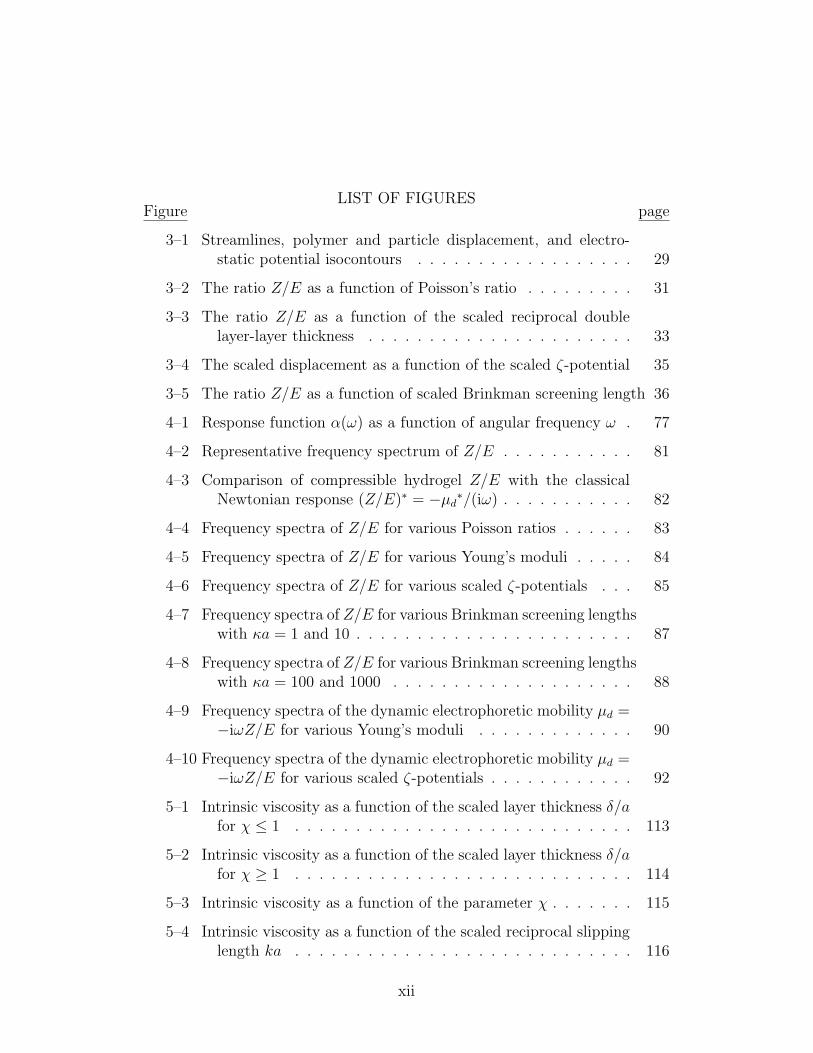
3–1 Streamlines, polymer and particle displacement, and electro-static potential isocontours . . . . . . . . . . . . . . . . . . 29
3–2 The ratio Z/E as a function of Poisson’s ratio . . . . . . . . . 31
3–3 The ratio Z/E as a function of the scaled reciprocal doublelayer-layer thickness . . . . . . . . . . . . . . . . . . . . . . 33
3–4 The scaled displacement as a function of the scaled ζ-potential 35
3–5 The ratio Z/E as a function of scaled Brinkman screening length 36
4–1 Response function α(ω) as a function of angular frequency ω . 77
4–2 Representative frequency spectrum of Z/E . . . . . . . . . . . 81
4–3 Comparison of compressible hydrogel Z/E with the classicalNewtonian response (Z/E)∗ = −µd∗/(iω) . . . . . . . . . . . 82
4–4 Frequency spectra of Z/E for various Poisson ratios . . . . . . 83
4–5 Frequency spectra of Z/E for various Young’s moduli . . . . . 84
4–6 Frequency spectra of Z/E for various scaled ζ-potentials . . . 85
4–7 Frequency spectra of Z/E for various Brinkman screening lengthswith κa = 1 and 10 . . . . . . . . . . . . . . . . . . . . . . . 87
4–8 Frequency spectra of Z/E for various Brinkman screening lengthswith κa = 100 and 1000 . . . . . . . . . . . . . . . . . . . . 88
4–9 Frequency spectra of the dynamic electrophoretic mobility µd =−iωZ/E for various Young’s moduli . . . . . . . . . . . . . 90
4–10 Frequency spectra of the dynamic electrophoretic mobility µd =−iωZ/E for various scaled ζ-potentials . . . . . . . . . . . . 92
5–1 Intrinsic viscosity as a function of the scaled layer thickness δ/afor χ ≤ 1 . . . . . . . . . . . . . . . . . . . . . . . . . . . . 113
5–2 Intrinsic viscosity as a function of the scaled layer thickness δ/afor χ ≥ 1 . . . . . . . . . . . . . . . . . . . . . . . . . . . . 114
5–3 Intrinsic viscosity as a function of the parameter χ . . . . . . . 115
5–4 Intrinsic viscosity as a function of the scaled reciprocal slippinglength ka . . . . . . . . . . . . . . . . . . . . . . . . . . . . 116
xii
CHAPTER 1Introduction
1.1 Thesis motivation
Colloidal dispersions are formed by distributing a discrete phase into a
continuous, immiscible phase (Cosgrove 2005). The discrete phase is usually
referred to as the disperse phase or colloid, and the continuous phase as the
dispersing medium (Hunter 2001). The size of the disperse phase, ranging
from several nanometers to a few micrometers, distinguishes colloidal disper-
sions from solutions where the kinetic units of the solute and the solvent are
similar in size. Colloidal dispersions encompass a broad scope of materials,
e.g., smoke (aerosols), milk (emulsions), printing inks, and biological cells
(dispersions) (Hunter 2001; Cosgrove 2005), and they are crucial for many in-
dustrial processes, for example, oil recovery, ceramic processing, and mineral
processing, to name a few (Cosgrove 2005).
Colloid and interface science traditionally focuses on aqueous dispersions
due to their simplicity and practical importance, and even these relatively
“simple” systems exhibit extremely rich mechanical, rheological, optical, and
electrical behaviors (Hunter 2001; Lyklema 1995; Cosgrove 2005). Recently,
dispersing colloidal particles in complex fluids such as hydrogels, polymer solu-
tions, and polymer melts forms novel colloidal dispersions, also termed colloid
composites. In these systems, colloidal particles can serve as probes to char-
acterize the mechanical, rheological, and physicochemical properties of the
base material (Lin et al. 2005; Schnurr et al. 1997; Hunter 1998), and can
also introduce new dynamics and enhancements, such as light-wave-sensitive
swelling (Sershen et al. 2005) and enhanced mechanical and optical proper-
ties (Haraguchi & Takehisa 2002; Haraguchi et al. 2002). Further development
of colloid composites requires the following questions to be answered: (i) How
1
does the continuous phase, e.g., hydrogel, influence the dynamics of colloidal
particles when subjected to external fields, e.g., electrical, optical, and mag-
netic fields? (ii) How do the colloidal particles affect the microstructure, and,
consequently, how do microstructural changes affect bulk properties of the
composite? These questions are extremely challenging to answer, since they
cover a broad range of topics in colloid and interface science.
Motivated by these questions, this thesis seeks answers to the foregoing
questions by focusing on the interactions between the continuous and dispersed
phases, and neglecting the particle-particle interactions. To make the project
more tractable, two representative systems with appealing characteristics are
selected. For question (i), hydrogel-colloid composites, i.e., colloidal particles
dispersed in water-saturated swollen polymer networks, are chosen as a model
system. The single particle and collective bulk responses of the composite
to electric fields are investigated in detail using a multi-phase electrokinetic
model. These investigations not only reveal the influences of the continuous
phase, but also serve as a rigorous theoretical foundation for novel electric-
field-based characterization techniques for hydrogel-colloid composites. For
question (ii), colloidal dispersions in polymer melts are selected (Buscall &
Ettelaie 2006), as changes in polymer configurations can significantly affect
the melt bulk properties (de Gennes 1979). Using a hydrodynamic model,
this project interprets the anomalous bulk viscosity reduction recently discov-
ered in polymer-nanocomposite melts, i.e., nanoparticles dispersed in polymer
melts (Mackay et al. 2003; Tuteja et al. 2005). The theory shows how the
nanoparticle-induced changes in the polymer microstructure affect the bulk
viscosity of the composite.
1.2 Objectives of the thesis
As evident from § 1.1, the overall objective of this project is to understand
how electric-field-induced colloid dynamics are affected by the viscoelastic-
ity of hydrogels, and how nanoparticle-induced microstructural changes influ-
ence the bulk viscosity of the polymer-nanocomposite melts. It is important
2

to note that the electric-field-induced displacement of a spherical colloidal
particle embedded in incompressible hydrogels has been addressed by Hill &
Ostoja-Starzewski (2008) using a special case of the multi-phase electrokinetic
model. Their work serves as an important first step for this and future in-
vestigations. In this project, the multi-phase electrokinetic model of Hill &
Ostoja-Starzewski (2008) is adopted to describe the fluid velocity, polymer
displacement, electrostatic potential and ionic concentrations in hydrogels.
The first objective, as a direct extension of the theory by Hill & Ostoja-
Starzewski (2008), is to investigate the effect of hydrogel compressibility, as
characterized by the Poisson ratio, on the steady particle displacement. The
steady multi-phase electrokinetic model is solved numerically, and an analyt-
ical approximation is also derived. Similarly to the Smoluchowski formula for
electrophoretic mobility (Hunter 2001), the analytical approximation can be
extremely useful for interpreting microrheological experiments that measure
the quasi-steady particle displacement.
Extending the steady electric-field-induced responses to the dynamic re-
sponses in hydrogel-colloid composites is the second objective of this project.
This is also crucial for developing new electric-field-based characterization
techniques—including electrophoretic microrheology (Mizuno et al. 2000, 2001)
and electroacoustics (Hunter 1998)—for these materials. Note that the dy-
namic multi-phase electrokinetic model is an augmentation of a two-fluid
model currently used in microrheology, where only approximate solutions are
available (Levine & Lubensky 2000, 2001). Therefore, the two-fluid model
is first solved exactly, and the results are compared with several approxima-
tions. Spectra of electric-field-induced particle responses can be obtained by
numerically solving the full multi-phase electrokinetic model for compress-
ible and incompressible hydrogels. An analytical approximation, which can
be valuable for designing and interpreting experiments, is also derived. The
connection between the single particle dynamic response and electroacoustic
signals is also established.
3

The last objective of this project is to understand how nanoparticle-
induced microstructural changes affect the bulk viscosity of polymer melts.
Specifically, the contribution of a nanoparticle encapsulated by a layer of dif-
ferent properties to the bulk viscosity is derived and examined thoroughly
using a hydrodynamic model. The model is then compared with the available
experiments of Mackay et al. (2003) and Tuteja et al. (2005) to help elucidate
the physical origin of the bulk viscosity reduction.
1.3 Thesis organization
This thesis is arranged as a collection of manuscripts published and sub-
mitted to meet the objectives presented in § 1.2. Since each manuscript con-
tains an exhaustive literature review in its introduction, the literature reviews
presented in chapter 2 serve as a brief complement to the manuscripts. Chap-
ters 3–5 are the main body of the thesis, organized in the form of manuscripts.
The steady response of a spherical colloidal particle embedded in a compress-
ible hydrogel matrix is presented in chapter 3. Numerically exact solutions and
an analytical approximation of the steady multi-phase electrokinetic model are
presented. Chapter 4 addresses the dynamic response of hydrogel-colloid com-
posites. The two-fluid model of Levine & Lubensky (2001) is first solved ana-
lytically, and it is the basis for the dynamic multi-phase electrokinetic model,
which is solved numerically. A high-frequency analytical approximation is also
derived. In addition, the connection between electroacoustic signals and the
single particle response is established. In chapter 5, a hydrodynamic model
that incorporates nanoparticle-induced microstructural changes is presented
to interpret the experimentally observed bulk viscosity reduction in polymer-
nanocomposite melts. Comparison between the model and the experimental
data reveals the physical origin of the bulk viscosity reduction. Chapter 6
provides a brief summary and conclusions.
4
CHAPTER 2Literature Review
Since the introductions of chapters 3–5 provide exhaustive literature re-
views on their respective subjects, this chapter serves as a complement to these
reviews, and presents additional important information.
2.1 Theoretical models for hydrogels
Hydrogels are an important class of complex fluids that exhibit viscoelas-
ticity depending on the characteristic time scales, i.e., if the time scales are
long, they behave as elastic solids, and if the time scales are short, they behave
as viscous fluids. Their viscoelasticity arises from their composite nature: the
fluid contributes to the viscosity, and the elasticity comes from the polymer
network (Tanaka et al. 1973). Modeling the dynamics of hydrogels is crucial
for understanding the viscoelastic response of inclusions in the hydrogels, as
well as for developing acoustical diagnostic techniques (Snieder & Page 2007).
The viscoelasticity of hydrogels was first modeled as a complex, frequency-
dependent modulus or viscosity. Using this idea, Oestreicher (1951) derived
the stress-strain relation and equations of motion for general viscoelastic me-
dia, including hydrogels. He also calculated the force on an oscillating sphere
in a viscoelastic medium using the method of Lamb (1945), and the results
agreed well with experimental data. However, this model is phenomenological,
and does not account for the fluid-network interactions. In the more recent
two-fluid model of Levine & Lubensky (2001), the viscoelasticity of hydrogels
arises from the hydrodynamic coupling of the viscous and elastic phases. The
exact solution of the two-fluid model, which is the foundation of the multi-
phase electrokinetic model, is not as straighforward as that of Oestreicher
(1951), and Levine & Lubensky (2001) derived only an approximation for the
force on an oscillating sphere.
5
The exact solution of the two-fluid model is largely inspired by the field of
poroelasticity, which studies the dynamics of porous, liquid-containing rocks
in the Earth’s crust (Frenkel 1944; Biot 1941; Coussy 2004). Although rocks
are quite different from hydrogels, their theoretical treatment, as evidenced
from the poroelasticity constitutive equations (Biot 1941, 1956a,b), is mathe-
matically similar to the two-fluid model. Noteworthy is the theory by Markov
(2005), where he analytically solved the wave propagation problem in a fluid-
saturated porous medium with spherical inclusions. In his work, the consti-
tutive equations of poroelasticity are solved by constructing scalar and vector
potential solutions for the fluid and elastic skeleton displacements based on
plane-wave propagations in porous medium (Biot 1956a,b). The same pro-
cedure can be applied to the hydrogel two-fluid model for the fluid velocity
and polymer displacement. Note that the waves propagate differently: in the
two-fluid model, there are two propagating shear waves and one compressional
wave, and the fluid is incompressible; whereas in poroelasticity, there are two
propagating compressional waves and one shear wave, and both the elastic and
viscous media are considered compressible. These differences will modify the
construction of Markov (2005) accordingly, but the underlying ideas remain
the same.
The above models are restricted to linear responses of statistically homo-
geneous media, and do not consider non-linear effects due to large deforma-
tions, or local inhomogeneity (Fung & Tong 2001). Moreover, the assumption
of an incompressible fluid in the hydrogel two-fluid model is valid when the
fluid wavelength is much longer than the characteristic length scale. For a
typical speed of sound in water ∼ 103 m s−1 and colloidal particles of sizes
∼ 10−6 m, the incompressible assumption is valid at frequencies less than
∼ 1 GHz.
2.2 Theoretical development of electroacoustics
In this thesis, electroacoustics, first introduced by Debye (1933), is pro-
posed to characterize hydrogel-colloid composites at ultrasonic frequencies.
6
An electroacoustic response arises from the surface charge of colloidal particles
in the medium, which produces an electric field when applying a sound wave,
i.e., the colloidal vibration potential/current (CVP/CVI), and pressure distur-
bances when subjected to external electric fields, i.e., the electrokinetic sonic
amplitude (ESA). In chapter 4, the modern theory of O’Brien (1988, 1990) for
the electroacoustics of Newtonian suspensions is extended to hydrogel-colloid
composites. The theory of O’Brien (1988, 1990) connects the micro-scale single
particle response to macro-scale electroacoustic signals of the composite.
There is another class of theories of suspension electroacoustics primar-
ily focused on CVP/CVI phenomena. These were first published by Enderby
(1951) and Booth & Enderby (1952). Unlike O’Brien’s approach, these au-
thors directly connected the CVI/CVP signals of suspensions to the surface
physicochemical properties of colloidal particles. However, the theories of En-
derby (1951) and Booth & Enderby (1952) are restricted to low frequencies,
and are not applicable to modern ultrasonic electroacoustic techniques. The
high frequency theory, valid over a wide range of particle concentrations, was
developed by Dukhin et al. (2000, 1999a,b) using a coupled-phase model and
cell boundary conditions for non-conducting colloidal suspensions. Together
with the computation of the electrophoretic mobilities for concentrated sys-
tems (Rider & O’Brien 1993; O’Brien et al. 2003), the theory of O’Brien (1988,
1990) is equivalent to the theory of Dukhin et al. (2000, 1999a,b). Note that
both classes of experiments with complementary theories have been success-
fully commercialized (Hunter 1998; Dukhin & Goetz 2002).
This thesis adopts the methodology of O’Brien (1988, 1990) for the elec-
troacoustic response of dilute hydrogel-colloid composites. The approach of
Dukhin et al. (2000, 1999a,b), although valid for both dilute and concentrated
systems, is complicated and beyond the scope of the present project.
2.3 Numerical solutions of electrokinetic models
The multi-phase electrokinetic model adopted in this thesis is an extension
of the standard electrokinetic model first developed by Overbeek (1943). The
7

standard electrokinetic model describes a wide range of colloidal dynamics,
ranging from electrophoretic mobilities to dielectric responses (Hunter 2001).
O’Brien & White (1978) presented the first numerical solution of the full steady
model over the entire experimental accessible parameter space by linearly per-
turbing an equilibrium base state. They decomposed the non-linear problem
to a non-linear equilibrium base state governed by the Poisson-Boltzmann
equation, and a linearly perturbed state. Using far-field asymptotic analysis,
the model was solved using a technique analogous to the multiple shooting
method (Ascher et al. 1988). Using a very similar approach, the dynamic
model was solved by DeLacey & White (1981) for the dielectric response of
dilute colloidal suspensions. The results are only valid at low frequencies,
since fluid inertia is neglected. Mangelsdorf & White (1992) first solved the
full dynamic problem by removing the numerical difficulties through a careful
reformulation of the differential equations. As a result, they calculated the
dynamic electrophoretic mobility up to several MHz. The same methodology
was later applied to determine the dielectric response of dilute colloidal sus-
pensions (Mangelsdorf & White 1997). A very powerful method developed by
Preston et al. (2005) using a general-purpose boundary value problem soft-
ware package COLSYS (Ascher et al. 1988) can compute the dynamic elec-
trophoretic mobility over a wide range of frequencies, from several Hz to GHz.
Hill et al. (2003a) developed the software package MPEK to calculate the
electrophoretic mobility of polymer-coated colloidal particles using a modified
electrokinetic model. MPEK also calculates the high-frequency polarizabil-
ity of dilute colloidal suspensions up to several GHz (Hill et al. 2003b). Fi-
nally, based on the MPEK package, Hill & Ostoja-Starzewski (2008) solved the
steady multi-phase electrokinetic model for incompressible hydrogels. Their
model is the basis for the present study.
Evidently, numerical solution of electrokinetic models can benefit signif-
icantly from the development of powerful boundary value problem solvers
8
with automatic mesh adjustments, such as COLSYS, COLNEW, and TW-
PBVPL (Ascher et al. 1988; Cash & Mazzia 2006). Also, far-field asymptotic
analysis can greatly improve the accuracy and stability of the numerical ap-
proach. In this thesis, the solution of the Poisson-Boltzmann equation is based
on the methodology of MPEK, and the perturbed multi-phase electrokinetic
model is solved using TWPBVPL, a general-purpose boundary value problem
solver (Cash & Mazzia 2006). To help improve the computational accuracy,
asymptotic analysis of the governing equations is undertaken.
9
CHAPTER 3Electric-field-induced displacement of charged spherical colloids in
compressible hydrogels1
This chapter concerns the electric-field-induced displacement of a charged
spherical colloid embedded in an uncharged compressible hydrogel. Previ-
ous theoretical calculations for incompressible polymer skeletons predict sub-
nanometer particle displacements within the experimentally accessible param-
eter space (e.g., particle surface charge density, polymer shear modulus, and
electric field strength). Accordingly, the prevailing expectation is that an ex-
perimental test of the theory would be extraordinarily difficult. In this work,
however, we solved the electrokinetic model for compressible polymer skele-
tons with arbitrary Poisson’s ratio. The most striking result, obtained from
numerically exact solutions of the full model and an analytical boundary-layer
approximation, is that polymer compressibility admits particle displacements
that increase linearly with particle size when the radius is greater than the
Debye length. This scaling is qualitatively different than previously obtained
for incompressible skeletons, where the ratio of the particle displacement to
the electric field approaches a particle-size-independent constant. The dis-
placement is also much more sensitive to the hydrodynamic permeability of
the polymer skeleton. Therefore, when compressible hydrogels are deformed
at frequencies below their reciprocal draining time, our theory identifies the
parameter space where displacements could be registered using optical mi-
croscopy. In turn, this will help to establish a quantitative connection between
the electric-field-induced particle displacement and physicochemical character-
istics of the particle-polymer interface.
1 Reproduced by permission of The Royal Society of Chemistry
10
3.1 Introduction
Hydrogels are polymer networks that have found widespread use in tis-
sue engineering (Barndl et al. 2007), drug delivery (Qiu & Park 2001), and
molecular separations, e.g., gel-electrophoresis, isoelectric focusing, and iso-
tachophoresis (Westermeier 2005). The networks are often synthesized from
polymers such as poly(methyl methacrylate) (PMMA), poly(vinyl alcohol)
(PVA), and polyacrylamide (PA); as well as from macromolecules of biologi-
cal origin, such as collagen and agar.
Recently, several novel applications of hydrogel nano-composites have
been demonstrated where organic and inorganic nanoparticles are immobi-
lized in otherwise conventional hydrogel matrices. For example, wavelength-
selective light-induced swelling from gold and gold-coated silica nanoparticle
inclusions makes these intriguing materials useful as light-activated microflu-
idic valves (Sershen et al. 2005). Nanoparticles have also been introduced
into soft biological tissues to increase the sensitivity of ultrasound imaging for
early tumor detection (Liu et al. 2006; Dayton & Ferrara 2002), and to adsorb
optical energy for treating certain cancers (Loo et al. 2005). Larger colloidal
inclusions have been used to probe the local and bulk viscoelastic response
of polymer solutions and gels (Schnurr et al. 1997; MacKintosh & Schmidt
1999). Finally, in an effort to control the otherwise diffusion-limited transfer
of uncharged molecules across membranes in biosensing, silica nanoparticles
have been embedded in uncharged hydrogel gels to produce electroosmotic
flow (Matos et al. 2006).
As a first step toward understanding the coupling of electroosmotic flow
and polymer deformation in hydrogel composites, Hill & Ostoja-Starzewski
(2008) calculated the electric-field-induced displacement of particles embed-
ded in incompressible polymer skeletons. Their work demonstrates that a
simple balance between the bare Coulomb force and an elastic restoring force
on the particles prevails only when the particle radius a is smaller than the
11
Debye screening length κ−1. Otherwise, the theory quantifies how electroos-
motic flow—in the diffuse layer of countercharge that envelops each particle—
deforms the polymer skeleton and, therefore, influences the particle displace-
ment. For incompressible skeletons, the ratio of the particle displacement to
the electric field strength bears a striking resemblance to the electrophoretic
mobility (O’Brien & White 1978) at all values of κa. Accordingly, the electric-
field-induced particle displacement reflects the size and charge of the inclu-
sions, the viscosity and concentration of the electrolyte, and the shear modu-
lus and hydrodynamic permeability of the polymer skeleton. In principle, the
electric-field-induced displacement is an appealing diagnostic for probing the
physicochemical characteristics of the particle-polymer interface, in a similar
way that electrophoresis is routinely used to ascertain the surface charge of
colloidal particles dispersed in Newtonian electrolytes. However, in the exper-
imentally accessible parameter space, the particle displacements predicted by
Hill & Ostoja-Starzewski (2008) are extraordinarily small, making it difficult
to envision practical diagnostic applications.
In the absence of electroosmotic flow, the elastic restoring force of the
polymer skeleton varies by up to 25 percent over the experimentally accessible
range of Poisson’s ratios for hydrogels (Schnurr et al. 1997). Therefore, when
κa 1, the electric-field-induced displacement of a particle in a compressible
polymer network increases by only 25 percent over the value for an incom-
pressible skeleton. It is therefore unlikely that finite compressibility would
significantly influence the sensitivity of an experiment to test Hill and Ostoja-
Starzewski’s theory when κa 1. However, the situation when κa & 1, which
is generally achieved for particles larger than about one micron, is not as
straightforward to interpret. In this chapter, we show that the electric-field-
induced particle displacement of sufficiently large particles in compressible
matrices is qualitatively different than in incompressible skeletons. Rather
than tending to a size-independent value, the particle displacement increases
linearly with particle size when κa 1. For particles whose radius is greater
12
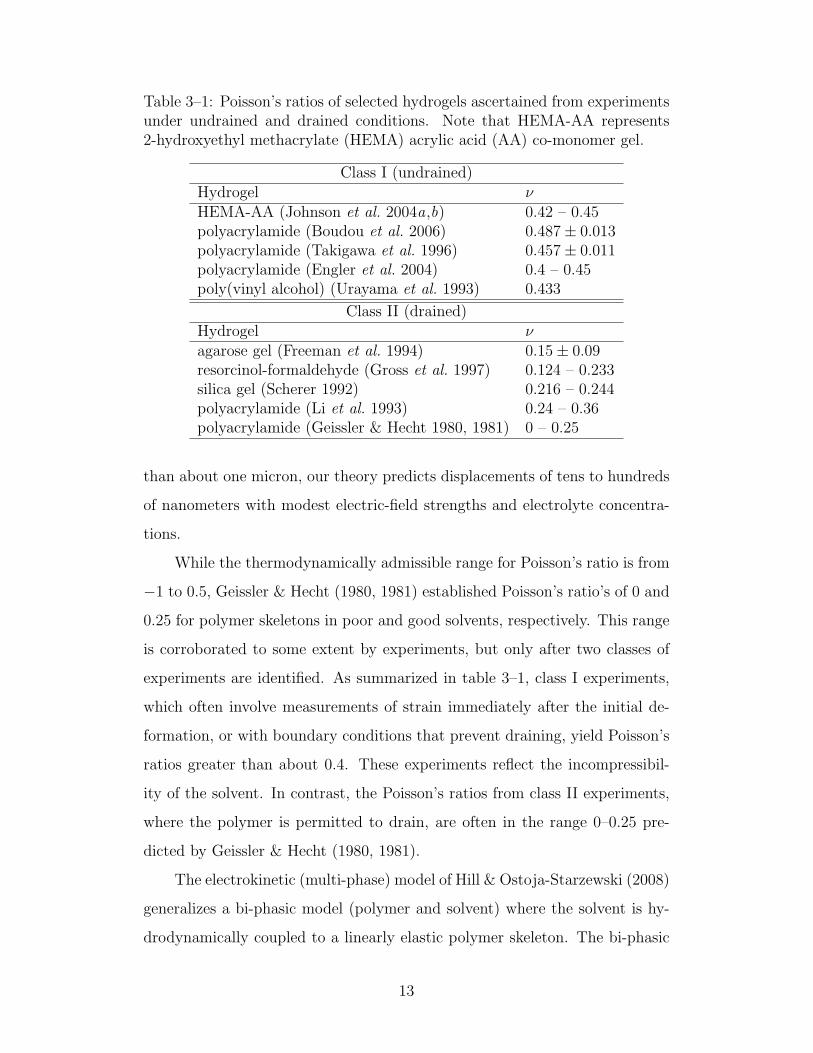
Table 3–1: Poisson’s ratios of selected hydrogels ascertained from experimentsunder undrained and drained conditions. Note that HEMA-AA represents2-hydroxyethyl methacrylate (HEMA) acrylic acid (AA) co-monomer gel.
Class I (undrained)Hydrogel νHEMA-AA (Johnson et al. 2004a,b) 0.42 – 0.45polyacrylamide (Boudou et al. 2006) 0.487± 0.013polyacrylamide (Takigawa et al. 1996) 0.457± 0.011polyacrylamide (Engler et al. 2004) 0.4 – 0.45poly(vinyl alcohol) (Urayama et al. 1993) 0.433
Class II (drained)Hydrogel νagarose gel (Freeman et al. 1994) 0.15± 0.09resorcinol-formaldehyde (Gross et al. 1997) 0.124 – 0.233silica gel (Scherer 1992) 0.216 – 0.244polyacrylamide (Li et al. 1993) 0.24 – 0.36polyacrylamide (Geissler & Hecht 1980, 1981) 0 – 0.25
than about one micron, our theory predicts displacements of tens to hundreds
of nanometers with modest electric-field strengths and electrolyte concentra-
tions.
While the thermodynamically admissible range for Poisson’s ratio is from
−1 to 0.5, Geissler & Hecht (1980, 1981) established Poisson’s ratio’s of 0 and
0.25 for polymer skeletons in poor and good solvents, respectively. This range
is corroborated to some extent by experiments, but only after two classes of
experiments are identified. As summarized in table 3–1, class I experiments,
which often involve measurements of strain immediately after the initial de-
formation, or with boundary conditions that prevent draining, yield Poisson’s
ratios greater than about 0.4. These experiments reflect the incompressibil-
ity of the solvent. In contrast, the Poisson’s ratios from class II experiments,
where the polymer is permitted to drain, are often in the range 0–0.25 pre-
dicted by Geissler & Hecht (1980, 1981).
The electrokinetic (multi-phase) model of Hill & Ostoja-Starzewski (2008)
generalizes a bi-phasic model (polymer and solvent) where the solvent is hy-
drodynamically coupled to a linearly elastic polymer skeleton. The bi-phasic
13
model can be traced to early works of Biot (1941) and Frenkel (1944) per-
taining, respectively, to the consolidation and seismoelectric behavior of soils,
as well as the propagation of sound waves in geological exploration (Biot
1956a,b). More recently, the bi-phasic model—also termed a two-fluid model—
has been adopted in the relatively new field of microrheology to interpret the
dynamics of entangled polymer solutions and gels (Brochard & de Gennes
1977; de Gennes 1976a; Milner 1993; Barrire & Leibler 2003; Levine & Luben-
sky 2001; Cicuta & Donald 2007).
Central to microrheology (Valentine et al. 1996; Lin et al. 2005; Schnurr
et al. 1997; Ziemann et al. 1994; Mason & Weitz 1995; MacKintosh & Schmidt
1999) are the static and dynamic susceptibilities of a colloidal sphere embedded
in a fluid-saturated polymer network. Early applications of the two-fluid model
addressed dynamics in which the polymer skeleton and fluid are hydrodynami-
cally coupled to yield divergence-free (incompressible) states of strain (Schnurr
et al. 1997). However, as first identified by Tanaka et al. (1973), the apparent
compressibility of a fluid-saturated network depends, in part, on the deforma-
tion time scale. If this is shorter than the characteristic draining time, which
depends on the elastic modulus, characteristic length, and hydrodynamic per-
meability, then the polymer skeleton and incompressible solvent are coupled
as a single phase. Consequently, at sufficiently high frequencies, the polymer
skeleton adopts non-equilibrium, divergence-free states of strain. On longer
time scales (or at lower frequencies), however, draining permits the displace-
ment field of a compressible skeleton to adopt non-zero divergence. Under
these conditions, the particle dynamics also reflect the compressibility and
hydrodynamic permeability of the polymer, similarly to the class II experi-
ments presented in table 3–1. Levine & Lubensky (2001) derived closed-form
approximations for the dynamic susceptibility and, accordingly, their theory
provides a basis for interpreting particle dynamics in the absence of electroki-
netic influences.
14
Returning to the electric-field-induced particle displacement considered by
Hill & Ostoja-Starzewski (2008), their theory for incompressible skeletons also
applies to compressible polymer networks when the frequency of an oscillatory
electric field is higher than the reciprocal draining time. Therefore, our effort
to solve the model for compressible skeletons (arbitrary Poisson’s ratio) also
makes an important step toward a theory for dynamics at frequencies below the
reciprocal draining time. Such a theory would facilitate an interpretation of
electro-acoustic phenomena in hydrogel nanocomposites, in a similar way that
acoustic spectroscopy has recently been adopted to probe the microstructure
of model food gels (Strubulevych et al. 2007), for example.
This chapter is set out as follows. Section 3.2 presents the model and
methodology for calculating the particle displacement from the polymer dis-
placement and fluid velocity fields. A boundary-layer analysis is undertaken in
§ 3.3 to verify the numerics and obtain a convenient closed-form expression for
the particle displacement when the Debye and Brinkman screening lengths are
both small compared to the particle radius. Numerical and analytical solutions
of the model are compared in § 3.4, where the separate influences of Poisson’s
ratio and several other important parameters on the particle displacement are
investigated; this section also highlights the significant influence of polymer
compressibility and hydrodynamic permeability. This chapter concludes with
a brief summary in § 3.5.
3.2 Theoretical model and solution
A charged spherical colloid with radius a and surface charge density σ is
embedded in an unbounded, uncharged hydrogel matrix with Darcy permeabil-
ity `2 (` is the Brinkman screening length), Young’s modulus E , and Poisson’s
ratio ν. The hydrogel is saturated with an aqueous electrolyte (e.g., NaCl)
whose concentration determines the Debye screening length κ−1. The prime
objective of the following theory is to determine the particle displacement Z
when the particle and gel are placed in a uniform electric field E.
15
First, consider the situation where the electrolyte concentration is so low
that the only forces acting on the colloid are the bare Coulomb force f e,E =
σ4πa2E and the elastic restoring force (Hill & Ostoja-Starzewski 2008)
fm,Z = − 2πaE(1− ν)
(5/6− ν)(1 + ν)Z. (3.1)
Balancing these forces to achieve static equilibrium (fm,Z = −f e,E) gives
Z =2ζεoεs(5/6− ν)(1 + ν)
E(1− ν)E as κa→ 0. (3.2)
Note that the surface charge density has been written in terms of the surface
potential ζ = σa/(εoεs) appropriate when κa → 0. Here, εs and εo are, re-
spectively, the dielectric constant of the solvent (water) and permittivity of
a vacuum. Equation (3.2) demonstrates that a Poisson’s ratio less than 0.5
increases the particle displacement by up to 25 percent in the range appro-
priate for hydrogel skeletons (0 < ν < 0.5). This is due to the vanishing
electroosmotic flow as κa→ 0. To capture the influence of flow on the parti-
cle displacement when κa & 1, the full electrokinetic and elastic deformation
model must be solved. This requires calculating the electroosmotic flow and
the degree to which it distorts the (compressible) polymer skeleton.
3.2.1 Coupled electrokinetic transport and elastic deformation model
The full set of equations involving N electrolyte ions is
εoεs∇2ψ = −N∑j=1
njzje (3.3)
jj = −Dj∇nj − zjeDj
kTnj∇ψ + nju (3.4)
η∇2u−∇p = (η/`2)u+N∑j=1
njzje∇ψ (3.5)
µ∇2v + (λ+ µ)∇(∇ · v) = −(η/`2)u (3.6)
with ion and electrolyte conservation equations
∇ · jj = 0 and ∇ · u = 0. (3.7)
16
Here, ψ, p, u and v denote the electrostatic potential, fluid pressure, fluid
velocity, and polymer displacement; and nj and jj denote the concentration
and flux of the jth electrolyte species. Moreover, η is the shear viscosity of
the fluid; and zj and Dj are the valence and diffusion coefficient of the jth
electrolyte species. The Debye length is κ−1 =√kTεoεs/(2Ie2), where I =
(1/2)∑N
j=1 z2jn∞j is the bulk ionic strength and n∞j is the bulk concentration
of the jth electrolyte species. Finally, the Lame constants µ and λ, written
in terms of Young’s modulus and Poisson’s ratio, are µ = E/[2(1 + ν)] and
λ = Eν/[(1 + ν)(1− 2ν)] (Landau & Lifshitz 1986).
Boundary conditions at the surface of the colloid particle (r = a) ensure:
u = 0 (zero fluid slip), v = Z (zero polymer slip); jj · er = 0 (zero radial ion
flux); and εoεs(er ·∇>)ψ − εoεp(er ·∇<)ψ = −σ (constant surface charge).
Here, er is the radial unit vector, εp is the particle dielectric constant, and
the subscripts attached to the gradient operators distinguish the particle (<)
and the solvent (>) sides of the interface. In the far field (r → ∞), the
fluid velocity and polymer displacement vanish (u → 0, v → 0); the ion
concentrations approach their bulk values (nj → n∞j ); and ψ → −rE · er(uniform undisturbed electric field).
Our analysis considers linearized perturbations to an equilibrium base
state (with E = Z = 0) that is governed by the non-linear Poisson-Boltzmann
equation (Verwey & Overbeek 1948). The continuum model is valid when the
inclusion size a is larger than the hydrogel Brinkman screening length `. To
this level of approximation, the Darcy permeability equals its homogeneous
and isotropic equilibrium value `2 (Hill & Ostoja-Starzewski 2008). Finally,
because the inclusion is assumed to be much stiffer (due to its higher density)
than the polymer skeleton, it remains spherical.
3.2.2 Solution methodology
The equilibrium base state and the linearized perturbations and boundary
conditions are similar to those of Hill & Ostoja-Starzewski (2008). Moreover,
17
we adopt the same methodology in which the solution is obtained by super-
posing the solutions of two simpler problems: one where the particle is fixed at
the origin (Z = 0) and subjected to an electric field E; and another where the
particle is displaced a distance Z in the absence of an electric field (E = 0).
The latter solution can be obtained analytically and provides the force given
by (3.1), so the following addresses the more challenging task of calculating
u, v, ψ and nj for a fixed particle in the presence of an electric field.
For a compressible polymer skeleton, a more general functional form for
the polymer displacement is necessary. Therefore, by considering the linearity
and symmetry of the perturbations to equilibrium, the polymer displacement
must have the form
v = g1(r)E + g2(r)(E · er)er, (3.8)
where g1 and g2 are scalar functions of radial position r. For a spherical
inclusion in an unbounded isotropic continuum, (3.8) is the most general con-
struction of a real, first-order tensor (v) that depends on position r = rer
and is linear in E = Eez. Here, ez is the polar axis of a coordinate sys-
tem (r, θ, φ) that has mutually orthogonal unit basis vectors (er, eθ, eφ); e.g.,
er · ez = cos θ. With axisymmetry, the radial and tangential components
of v are vr = (g1 + g2)E cos θ and vθ = −g1E sin θ. These demonstrate the
equivalence of our construction of v with classical treatments based on scalar
and vector potentials (Temkin & Leung 1976; Oestreicher 1951; Lamb 1945;
Markov 2005).
The fluid velocity takes the usual form (Landau & Lifshitz 1987)
u = ∇×∇× f(r)E, (3.9)
where f is another scalar function of radial position. Substituting (3.8) and
(3.9) into (3.6) provides two independent linear ordinary differential equations
18
for g1 and g2:
(µ+ λ)(r−1g1r + r−1g2r + 2r−2g2) +
µ(g1rr + 2r−1g1r + 2r−2g2) = (η/`2)(frr + r−1fr), (3.10)
(µ+ λ)(g1rr + g2rr − r−1g1r + r−1g2r − 4r−2g2) +
µ(g2rr + 2r−1g2r − 6r−2g2) = (η/`2)(r−1fr − frr) (3.11)
with boundary conditions g1 = g2 = 0 at r = a; and, more importantly,
g1 → ZE1 r−1 and g2 → ZE
2 r−1 as r →∞. (3.12)
Here, the subscripts r indicate differentiation, and the asymptotic coefficients
ZE1 and ZE
2 measure the strength of the far-field decay of v when the particle is
fixed at the origin (Z = 0) and subjected to an electric field E. As identified
by the boundary-layer analysis in § 3.3.1, the r−1 far-field decays of g1 and g2,
which reflect a net force, arise from the symmetry of the biharmonic potentials
of the irrotational and solenoidal contributions to the polymer displacement.
Our numerical solutions of (3.10) and (3.11) are accomplished using an
established finite-difference methodology with an adaptive mesh (Hill et al.
2003a). First, however, f(r) is obtained from a numerical solution of the
electrokinetic transport equations (involving u, ψ and nj) with a perfectly
rigid (v = 0) polymer skeleton (Hill 2006d). Briefly, taking the curl of the
momentum conservation equation with u written in terms of f according to
(3.9) leads to a system of ordinary differential equations that couple f(r), ψ(r)
and nj(r), where nj = n0j + njE cos θ and ψ = ψ0 − rE cos θ + ψE cos θ (Hill
et al. 2003a; Hill 2006d). Here, ψ0(r) and n0j(r) denote spherically symmetric
solutions of the Poisson-Boltzmann equation (with E = Z = 0) (Hill et al.
2003a). Our stepwise approach for obtaining g1 and g2 simply reflects the one-
way coupling of the electrolyte and polymer deformation under the prevailing
steady conditions.
19
3.2.3 Force evaluation and inclusion displacement
Using the superposition methodology adopted by Hill & Ostoja-Starzewski
(2008), the force balance on the inclusion demands
0 = fm,Z + fm,E + f e,E + f d,E, (3.13)
where fm,Z and fm,E are the mechanical-contact forces acting on the inclusion
by the polymer. The superscript Z indicates that the force is calculated with
the particle displaced a distance Z in the absence of an electric field (E = 0);
and the superscript E indicates that the force is calculated with the particle
fixed at the origin (Z = 0) and subjected to an electric field E. Furthermore,
f e,E and f d,E are electrical and hydrodynamic drag forces acting on the inclu-
sion by the electrolyte; both arise from the electric field while the particle is
fixed at the origin. Note that the calculation of fm,Z involves only the poly-
mer equation of static equilibrium and, consequently, the analytical solution
of this problem is given by (3.1).
The asymptotic coefficients ZE1 and ZE
2 determine fm,E as follows. First,
the mechanical-contact force on the inclusion is transformed to the far field
via
fm,E =
∫r=a
Te · erdA =
∫r→∞
Te · erdA+
∫ r→∞
r=a
(η/`2)udV, (3.14)
where the elastic stress tensor is
Te = 2µe + λ(∇ · v)I, (3.15)
where I is the identity tensor. Writing the strain e = (1/2)[∇v + (∇v)T ] in
terms of g1(r) and g2(r) gives
2e = g1r[Eer + (Eer)T ] + 2(g2r − 2r−1g2)(E · er)erer
+r−1g2[2(E · er)I +Eer + (Eer)T ], (3.16)
20
with dilation
∇ · v = (g1r + g2r + 2r−1g2)E · er. (3.17)
Therefore, from the far-field decays of g1 and g2, the surface and volume inte-
grals in (3.14) become∫r→∞
Te · erdA =−4πE
3(1 + ν)
[2ZE
1 +ν
1− 2ν(ZE
1 − ZE2 )
]E (3.18)
and ∫ r→∞
r=a
(η/`2)udV = −(8/3)π(η/`2)CEE, (3.19)
so
fm,E =−4πE
3(1 + ν)
[2ZE
1 +ν(ZE
1 − ZE2 )
(1− 2ν)
]E − 8π
3(η/`2)CEE. (3.20)
Note that f e,E+f d,E can be expressed in terms of the asymptotic coefficient CE
that characterizes the strength of the r−3 far-field decay of u, giving (Hill
2006d)
f e,E + f d,E = 4π(η/`2)CEE. (3.21)
Finally, the force balance in (3.13) becomes
aE(1− ν)
(5/6− ν)(1 + ν)Z =
2
3(η/`2)CEE − 2E
3(1 + ν)
[2ZE
1 +ν(ZE
1 − ZE2 )
(1− 2ν)
]E.
(3.22)
3.3 Boundary-layer analysis for κa 1, ` a and |ζ| < kT/e
The following boundary-layer analysis addresses the limit in which the
Debye length κ−1 and Brinkman screening length ` are both small compared
to the inclusion radius a. In practice, κ−1 is less than ∼ 100 nm at practical
ionic strengths, and ` is less than ∼ 10 nm for hydrogel skeletons. It follows
that the boundary-layer analysis is appropriate for inclusions with radii greater
than∼ 1 µm. Our analysis also adopts the Debye-Huckel approximation where
|ζ| < kT/e; fortunately, this proves to be satisfactory when |ζ| > kT/e if κa
is sufficiently large.
21
Using boundary-layer scaling approximations, we derive analytical solu-
tions of the governing equations in inner and outer regions, and match these to
determine the asymptotic coefficients in (3.22). Hill (2006b) used the method-
ology to calculate the incremental pore velocity for a dilute random array of
inclusions in a rigid Brinkman medium, and Hill & Ostoja-Starzewski (2008)
calculated the particle displacement in an incompressible hydrogel (ν = 0.5),
finding
Z → ζεoεsµ−1E as κa→∞. (3.23)
It is noteworthy that the particle displacement under these conditions is inde-
pendent of the hydrodynamic permeability, fluid viscosity, and particle size.
In striking contrast, our analysis for a compressible skeleton reveals a parti-
cle displacement that grows linearly with the particle radius, and decreases
with increasing hydrodynamic permeability. Similarly to the situation when
κa → 0 in (3.2), the scaling with particle size reflects a balance between an
electrical force that increases with a2—as expected for an unscreened surface
charge with constant surface charge density—and an elastic restoring force as
shown in (3.1), that is proportional to a.
3.3.1 Outer solution
The outer region is distinguished by the electrically neutral space where
κ(r − a) 1. Here, the electrical body force in the fluid momentum con-
servation equation is zero, and the viscous stresses are overwhelmed by the
Darcy drag force where r − a `. Accordingly, the fluid momentum equa-
tion reduces to Darcy’s equation u = −(`2/η)∇p with ∇2p = 0. The general
decaying solution is
p = −(η/`2)CEr−2E · er, (3.24)
where the asymptotic coefficient CE is determined by matching to the inner
solution.
The polymer displacement in the outer region can be written
v = ∇φs + ∇×Ψs, (3.25)
22
where ∇ ·Ψs = 0. Note that φs and Ψs specify the irrotational and solenoidal
(incompressible) contributions to v. Axisymmetry requires φs = φs(r, θ) and
Ψs = Ψs(r, θ)eθ, so, from the polymer equation of static equilibrium in (3.6),
∇[(2µ+ λ)∇2φs − p] = −∇× (µ∇2Ψs). (3.26)
Taking the curl and divergence of (3.26) separately give,
∇2∇2Ψs = 0 and ∇2∇2φs = 0, (3.27)
so, from axisymmetry (Lamb 1945) and relations between biharmonic and
harmonic functions (Fung & Tong 2001), the general solutions are
φs = (A′r3 + Ar +B′ +Br−2)E cos θ, (3.28)
Ψs = (C ′r3 + Cr +D′ +Dr−2)E sin θ, (3.29)
where the constants A–D and A′–D′ are specified by satisfying (3.26) and the
boundary conditions.
The polymer displacement is
v = [(3A′ + 2C ′)r2 + (A+ 2C) + 2D′r−1 − 2(B −D)r−3](E · er)er
+[(A′ + 4C ′)r2 + (A+ 2C) + (B′ +D′)r−1
+(B −D)r−3](E · eθ)eθ, (3.30)
so, because v → 0 as r → ∞ and A′ = C ′ = (A + 2C) = 0, it follows that v
decays as r−1 in the far field. To satisfy (3.26),
(4µ+ 2λ)B′ − (η/`2)CE = 2µD′, (3.31)
where B′ and D′ give
ZE1 = B′ +D′ and ZE
2 = D′ −B′. (3.32)
23
Finally, B′, D′ and (B−D), i.e., three independent constants, are determined
by satisfying (3.31) and matching to the radial and tangential components of
the inner polymer displacement field.
3.3.2 Inner solution and matching
The boundary-layer solution for the fluid velocity is independent of the
polymer deformation and, after matching, gives radial and tangential compo-
nents (Hill 2006b)
ur = 2a1(`/a)exp[−(r − a)/`]− 1E cos θ
−[2a2/(κa)]exp[−κ(r − a)]− 1E cos θ, (3.33)
uθ = a1 exp[−(r − a)/`]− a2 exp[−κ(r − a)] + a3E sin θ, (3.34)
where
a1 =3κ`2σ
2η[(κ`)2 − 1]− CE
a3, a2 =
3κ`2σ
2η[(κ`)2 − 1], a3 =
CE
a3,
and
CE =3σ(a`)2
2η(κ`+ 1).
Note that the surface charge density σ and ζ-potential are related by the
Debye-Huckel approximation σ = εoεsκζ when κa 1.
With standard boundary-layer scaling arguments, we establish the follow-
ing dominant balances for the radial and tangential components of the polymer
equation of static equilibrium:
(2µ+ λ)∂2vr∂r2
+
(µ+ λ
a sin θ
)∂2(vθ sin θ)
∂r∂θ= −(η/`2)ur, (3.35)
µ∂2vθ∂r2
= −(η/`2)uθ. (3.36)
24
These provide the following radial and tangential components of the inner
displacement field:
vr = − 2η
µ`2(a1`
3/a) exp[−(r − a)/`]
+[a2/(κ3a)] exp[−κ(r − a)] + C2E cos θ, (3.37)
vθ = − η
µ`2a1`
2 exp[−(r − a)/`]
+(a2/κ2) exp[−κ(r − a)] + C1E sin θ, (3.38)
where the constants
C1 = −`2a1 − a2/κ2 and C2 = −a1(`3/a)− a2/(κ
3a) (3.39)
ensure v = 0 at r = a. Note that linear and quadratic terms have been ne-
glected to permit matching when κa→∞. Accordingly, the inner components
of v as r →∞ are
vr →
2η`
µa4CE +
3σ[(κ`)2 + (κ`) + 1]
κ2aµ(κ`+ 1)
E cos θ, (3.40)
vθ →ηCE
µa3+
3σ
2µκ
E sin θ, (3.41)
and the outer components as r → a are
vr → [2D′/a− 2(B −D)/a3]E cos θ, (3.42)
vθ → −[(B′ +D′)/a+ (B −D)/a3]E sin θ. (3.43)
Equating the inner and outer displacement fields gives
B′ =3aσ
E(1 + ν)(1− 2ν)
(5− 6ν)
×`(`/a)− (`/a)2
(κ`+ 1)+ κ−1
[(κ`)2 + (κ`) + 1
κa(κ`+ 1)− 1
]+
a
κ`+ 1
, (3.44)
D′ = −3a2σ(1 + ν)
2E(κ`+ 1)+
6aσ
E(1 + ν)(1− ν)
(5− 6ν)
×`(`/a)− (`/a)2
(κ`+ 1)+ κ−1
[(κ`)2 + (κ`) + 1
κa(κ`+ 1)− 1
]+
a
κ`+ 1
, (3.45)
25
so writing (3.22) in terms of B′ and D′ gives
Z/E = −2(D′/a)(5/6− ν)/(1− ν), (3.46)
or, after simplifying for κa 1 and `/a 1,
Z/E = 2εoεsζE−1(1 + ν) +εoεsζκa(1 + ν)(1− 2ν)
2E(κ`+ 1)(1− ν). (3.47)
In terms of Lame constants µ and λ, (3.47) is
Z/E = εoεsζµ−1 +
εoεsζκa
2(κ`+ 1)(λ+ 2µ). (3.48)
The first term in (3.47) is the electric-field-induced displacement derived
by Hill & Ostoja-Starzewski (2008) for particles embedded in incompressible
skeletons (ν = 0.5). In the incompressible limit, the displacement is indepen-
dent of the particle size and hydrogel permeability. In striking contrast, (3.47),
which is valid for all thermodynamically admissible Poisson ratios, reveals a
particle displacement that increases linearly with particle size, and decreases
with increasing permeability.
To quantify the role of compressibility, and to explore the possibility of ex-
perimentally testing the theory, let us consider a representative example where
a particle with surface potential ζ = −3kT/e ≈ −75 mV (at room tempera-
ture) and radius a = 5 µm is embedded in a gel with Poisson’s ratio ν = 0.2,
Young’s modulus E = 100 Pa and Brinkman screening length ` = 10 nm. Fur-
thermore, with an electrolyte concentration corresponding to κ−1 ≈ 10 nm,
κa = 500 and (3.47) gives Z/E ≈ −6.0 nm/(V cm−1). For comparison, the
same particle in an incompressible gel (ν = 0.5) with the same E moves only
Z/E ≈ −0.16 nm/(V cm−1). With an electric field E = 10 V cm−1, the 60 nm
displacement in a compressible skeleton could be registered using optical mi-
croscopy (Ziemann et al. 1994; Cicuta & Donald 2007) and digital particle
tracking (Hoffman et al. 2006). However, measuring the 1.6 nm displacement
in an incompressible gel presents a much greater challenge, which is likely to
26
be met only with much more specialized equipment, involving interferome-
try (Allersma et al. 1998) and, possibly, feedback-controlled nano-positioning.
It is interesting to note that, when κ→∞ (high ionic strength) with `/a 1
and ν < 0.5, the displacement is
Z/E ≈ εoεsζ(a/`)(1 + ν)(1− 2ν)
2E(1− ν)=εoεsζ(a/`)
2(λ+ 2µ). (3.49)
With the same parameters as the previous example, (3.49) gives Z/E ≈
−12 nm/(V cm−1) at room temperature, so with E = 10 V cm−1, the particle
moves Z ≈ −120 nm. However, it should be remembered that the ζ-potential
decreases with increasing κ at constant surface charge density, and the elastic
modulus should increase with decreasing hydrodynamic permeability (Candau
et al. 1982).
3.4 Numerically exact results
Our numerical calculations are performed with the same characteristic
scales for length, velocity, and displacement as Hill & Ostoja-Starzewski (2008):
κ−1, u∗ = εsεo(kT/e)2/(ηa) and ηu∗/E = εsεo(kT/e)
2/(Ea), respectively. Also,
because the particle displacement remains inversely proportional to Young’s
modulus, our numerical calculations of Z/E are presented, for convenience,
with E = 1 kPa. Note, however, that many polymeric networks have a lower
modulus (Lin et al. 2004; Ziemann et al. 1994; Yamaguchi et al. 2005; Schnurr
et al. 1997), so particle displacements can be significantly larger than indicated
with E = 1 kPa. Clearly, the displacement for arbitrary Young’s modulus can
be obtained from the figures by a trivial rescaling of the ordinate axes.
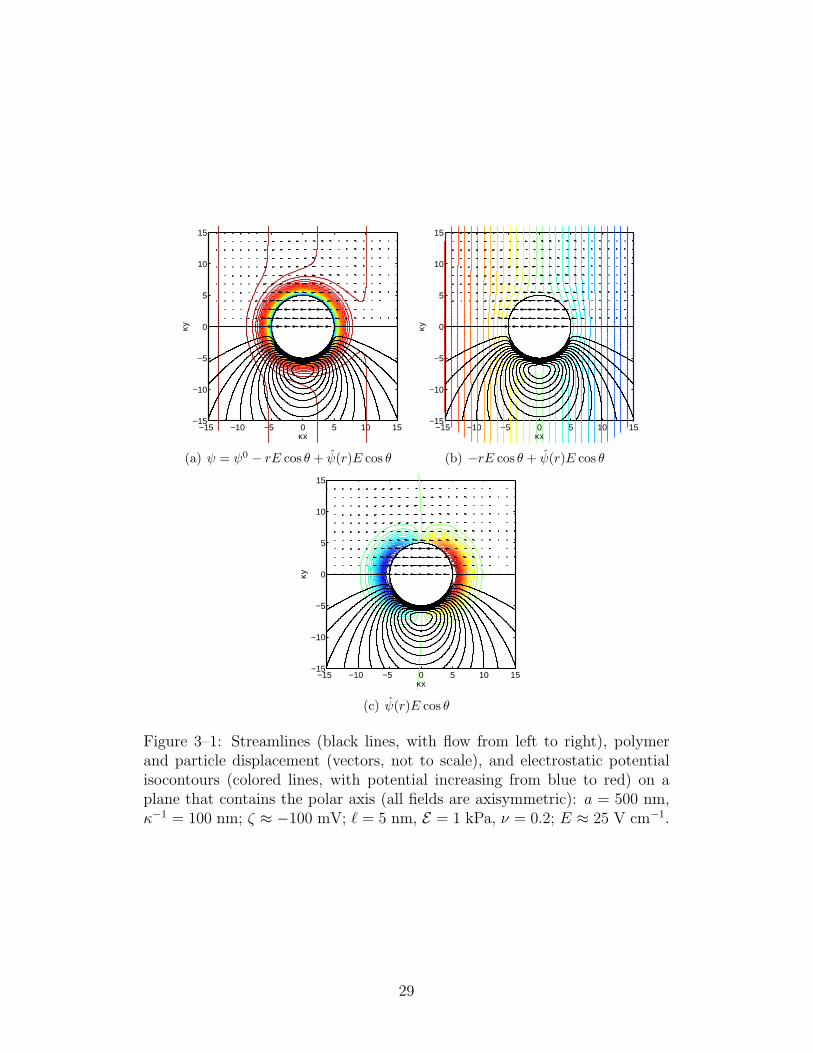
The general structures of the electrolyte flow, polymer displacement, and
electrostatic potential are shown in figure 3–1. The flow (for clarity, stream-
lines are shown only in the bottom-half of each panel) and displacement (vec-
tors shown only in the top-half of each panel) are superposed on isocontours of
the total electrostatic potential in panel (a), perturbed electrostatic potential
in panel (b), and perturbed electrostatic potential without the applied field in
27
panel (c). All fields are axisymmetric about the polar axis, which coincides
with the rectangular cartesian x-axis shown.
The particle has a negative surface charge (and therefore a positive layer of
counter charge), and it is subjected to an electric field directed along the polar
axis, i.e., from left to right along the cartesian x-axis. Accordingly, the flow
is from left to right and the particle is displaced to the left. Also the polymer
deformation is dominated by its response to the particle displacement—not
its coupling to the electroosmotic flow—so its displacement is predominantly
in the opposite direction of the flow.
Finally, the electrostatic potential isocontours in panel (a) reflect the mag-
nitude of the applied electric field E relative to κζ ∼ κkT/e. The electric field
E = 0.01κkT/e ≈ 25 V cm−1 adopted here is not only representative of readily
achieved experimental conditions, but is also consistent with our linearization
of the perturbations to equilibrium. While panel (a) emphasizes the equilib-
rium potential within a Debye length of the particle surface, panel (c) reveals
intricate features of the polarized double layer that are not clearly evident from
panel (b). Finally, because the pressure (not shown) is also dipolar in the far
field, the streamlines tend to be perpendicular to the electrostatic potential
isocontours in panel (c) beyond a Debye length of the particle surface.
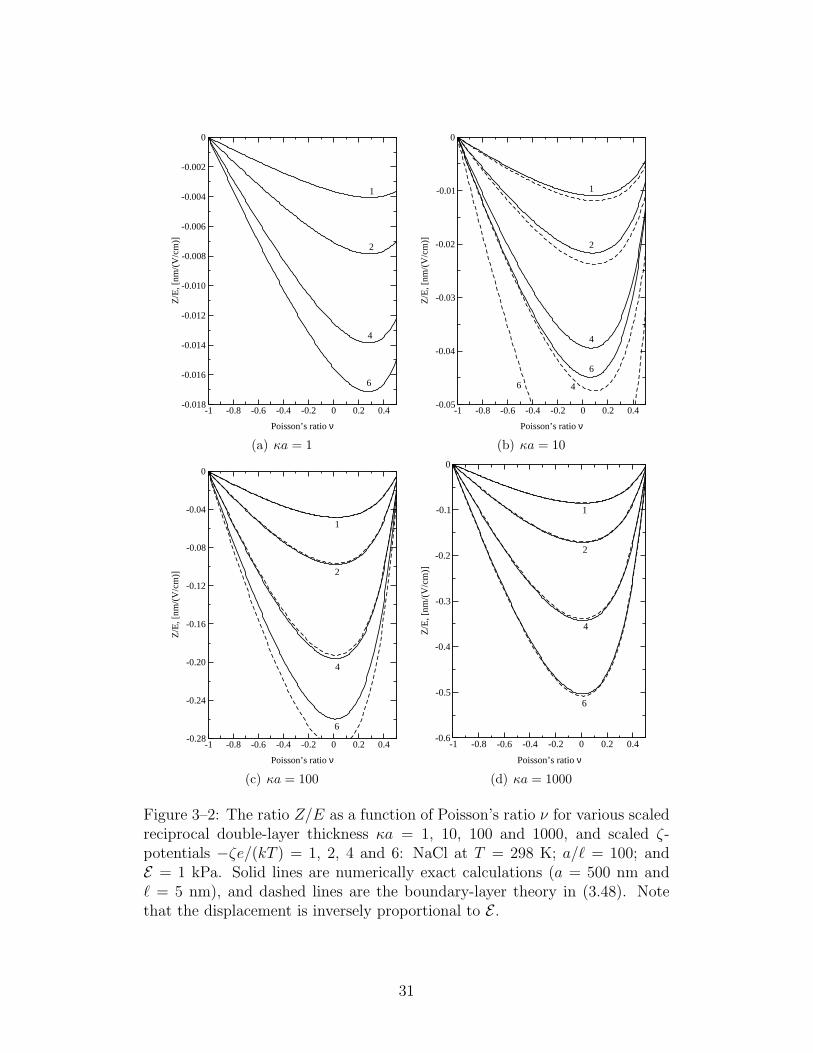
The particle displacement is plotted in figure 3–2 as a function of Pois-
son’s ratio for various values of κa and scaled ζ-potential. The dimensional
parameters (see the figure caption) facilitate direct comparisons with Hill &
Ostoja-Starzewski’s numerical calculations (Hill & Ostoja-Starzewski 2008,
figure 2) with ν = 0.5. As κa increases, the other independent dimensionless
parameter κ` = (`/a)κa = 0.01κa increases accordingly. As is customary,
we have plotted the results with constant ζ-potential, so the surface charge
density σ increases with κa according to the non-linear Poisson-Boltzmann
equation (Overbeek 1943). For example, when κa 1, σ ≈ εoεsa−1ζ, and
when κa 1, σ ≈ εoεsκζ. The ostensible increase in the displacement with
28
−15 −10 −5 0 5 10 15−15
−10
−5
0
5
10
15
κx
κy
(a) ψ = ψ0 − rE cos θ + ψ(r)E cos θ
−15 −10 −5 0 5 10 15−15
−10
−5
0
5
10
15
κx
κy
(b) −rE cos θ + ψ(r)E cos θ
−15 −10 −5 0 5 10 15−15
−10
−5
0
5
10
15
κx
κy
(c) ψ(r)E cos θ
Figure 3–1: Streamlines (black lines, with flow from left to right), polymerand particle displacement (vectors, not to scale), and electrostatic potentialisocontours (colored lines, with potential increasing from blue to red) on aplane that contains the polar axis (all fields are axisymmetric): a = 500 nm,κ−1 = 100 nm; ζ ≈ −100 mV; ` = 5 nm, E = 1 kPa, ν = 0.2; E ≈ 25 V cm−1.
29

increasing κa can therefore be attributed, in part, to the accompanying in-
crease in surface charge.
When κa = 0.1 (results not shown), the numerical calculations coincide
with (3.2), which, recall, reflects a direct balance between the bare Coulomb
force and elastic restoring force of the polymer skeleton. Under these con-
ditions, the particle displacement is extraordinarily small. When κa & 1,
however, the displacement is considerably larger. Comparing the numeri-
cal (solid lines) and boundary-layer theory (dashed lines) demonstrates that
(3.48) provides satisfactory predictions of the displacement when κa & 10 and
|ζ| < kT/e. It is noteworthy that the boundary-layer theory, which, recall,
also rests on the Debye-Huckel approximation (|ζ| < kT/e), is also reliable
when |ζ| > kT/e if κa is sufficiently large. Therefore, (3.48) furnishes accu-
rate predictions of the displacement for sufficiently large particles embedded
in any (uncharged) hydrogel at any reasonable ionic strength.
As identified in the introduction, negative Poisson’s ratios are not relevant
for hydrogel skeletons. Nevertheless, for completeness, it is interesting to note
that a negative Poisson’s ratio indicates an isotropic continuum that, under
homogeneous axial strain, adopts an equally signed transverse strain. More
specifically, the axial and transverse strain are equal when ν = −1, and,
therefore, the material changes density without changing shape. In general,
such materials can only support an isotropic state of strain, which is clearly
evident when writing the strain in terms of the stress (Landau & Lifshitz
1986). Therefore, because the strain tensor must be linear in the electric
field or displacement vector, the displacement must be zero when ν = −1, as
confirmed by the numerics and boundary-layer theory.
In the range of Poisson’s ratios appropriate for hydrogel skeletons (0 ≤
ν < 0.5), the displacement achieves a maximum that depends on κa. The
maximum displacement is achieved at a Poisson’s ratio that approaches zero
with increasing κa, and the sensitivity of the displacement to Poisson’s ratio—
as measured qualitatively by the ratio of the maximum displacement to the
30
-1 -0.8 -0.6 -0.4 -0.2 0 0.2 0.4
Poisson’s ratio ν
-0.018
-0.016
-0.014
-0.012
-0.010
-0.008
-0.006
-0.004
-0.002
0
Z/E
, [nm
/(V
/cm
)]
1
2
4
6
(a) κa = 1
-1 -0.8 -0.6 -0.4 -0.2 0 0.2 0.4
Poisson’s ratio ν
-0.05
-0.04
-0.03
-0.02
-0.01
0
Z/E
, [nm
/(V
/cm
)]
1
2
4
6
46
(b) κa = 10
-1 -0.8 -0.6 -0.4 -0.2 0 0.2 0.4
Poisson’s ratio ν
-0.28
-0.24
-0.20
-0.16
-0.12
-0.08
-0.04
0
Z/E
, [nm
/(V
/cm
)]
1
2
4
6
(c) κa = 100
-1 -0.8 -0.6 -0.4 -0.2 0 0.2 0.4
Poisson’s ratio ν
-0.6
-0.5
-0.4
-0.3
-0.2
-0.1
0
Z/E
, [nm
/(V
/cm
)]
1
2
4
6
(d) κa = 1000
Figure 3–2: The ratio Z/E as a function of Poisson’s ratio ν for various scaledreciprocal double-layer thickness κa = 1, 10, 100 and 1000, and scaled ζ-potentials −ζe/(kT ) = 1, 2, 4 and 6: NaCl at T = 298 K; a/` = 100; andE = 1 kPa. Solid lines are numerically exact calculations (a = 500 nm and` = 5 nm), and dashed lines are the boundary-layer theory in (3.48). Notethat the displacement is inversely proportional to E .
31
displacement when ν = 0.5—increases significantly with κa. This important
result, which is also captured by the boundary-layer theory in (3.47), produces
significantly larger particle displacements in compressible skeletons than in in-
compressible ones when κa is large. In other words, finite compressibility
permits large particles to undergo relatively large electric-field-induced dis-
placements. The displacement is plotted in figure 3–3 as a function of κa for
various ζ-potentials with ν = 0.2. As highlighted in the introduction, this
Poisson’s ratio is representative of the values ascertained by several indepen-
dent experiments reported in the literature involving hydrogels under drained
conditions. Again, note that the particle radius a = 500 nm and Brinkman
screening length ` = 5 nm are fixed, so κ` = (`/a)κa = 0.01κa. This way
of plotting the results clearly identifies the ranges of κa and ζ-potential over
which the analytical theories for small (dash-dotted lines) and large (dashed
lines) κa are accurate. Furthermore, in the parameter space where the particle
displacements are large and, therefore, most easily measured, the boundary-
layer theory in (3.47) is reliable.
To draw comparisons between the displacement and electrophoretic mo-
bility, which Hill & Ostoja-Starzewski (2008) demonstrated are very closely
connected when ν = 0.5, figure 3–4 presents the scaled particle displacement
−(Z/E)Ee/(2εoεskT ) as a function of the scaled ζ-potential for various re-
ciprocal double-layer thickness κa with `/a = 0.01 and ν = 0.2. In addi-
tion to testing the boundary-layer approximation (dashed lines, right panel),
this figure clearly identifies maximums in the displacement due to polariza-
tion and relaxation. These processes are well known from their influences on
the electrophoretic mobility (O’Brien & White 1978) and incremental pore
mobility (Hill 2006d). Note also that, due to finite polymer compressibility
(ν = 0.2), the scaled displacements in figure 3–4 (right panel) are significantly
larger than the corresponding scaled electrophoretic mobility (Hill & Ostoja-
Starzewski 2008, figure 5). Even the general shape of the collection of curves is
different from the incompressible limit. In fact, the overall trends bear a much
32
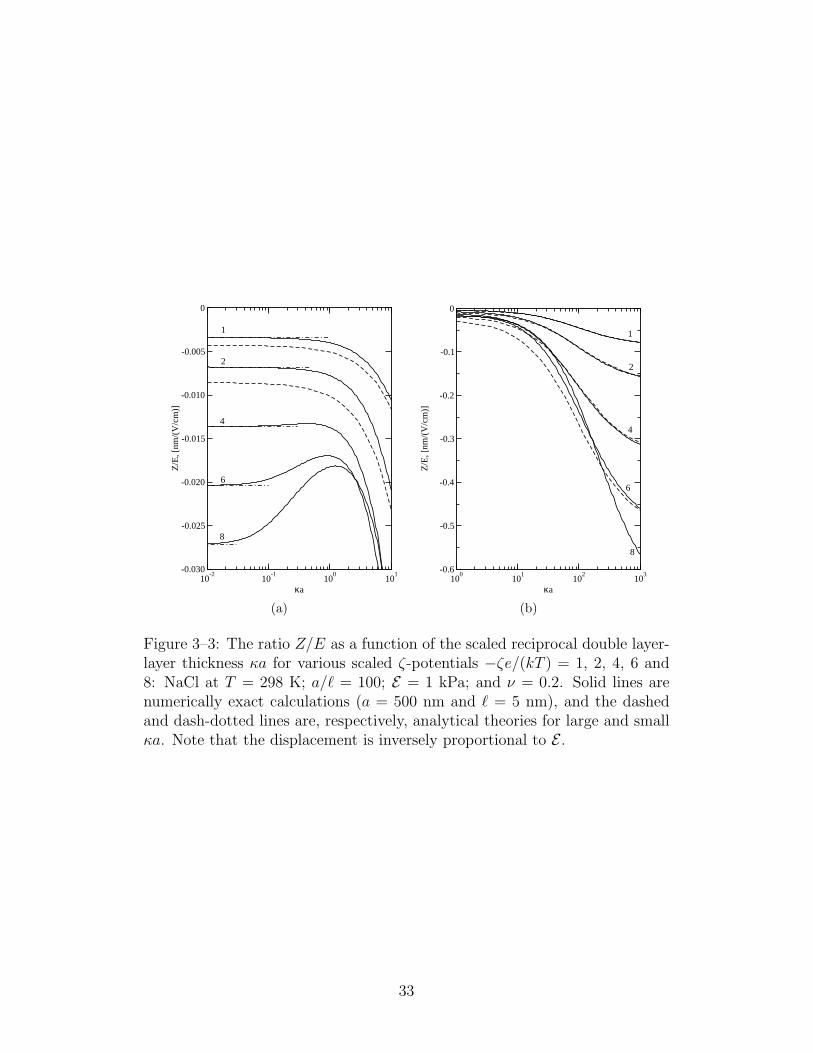
10-2
10-1
100
101
κa
-0.030
-0.025
-0.020
-0.015
-0.010
-0.005
0
Z/E
, [nm
/(V
/cm
)]
1
2
4
6
8
(a)
100
101
102
103
κa
-0.6
-0.5
-0.4
-0.3
-0.2
-0.1
0
Z/E
, [nm
/(V
/cm
)]
1
2
4
6
8
(b)
Figure 3–3: The ratio Z/E as a function of the scaled reciprocal double layer-layer thickness κa for various scaled ζ-potentials −ζe/(kT ) = 1, 2, 4, 6 and8: NaCl at T = 298 K; a/` = 100; E = 1 kPa; and ν = 0.2. Solid lines arenumerically exact calculations (a = 500 nm and ` = 5 nm), and the dashedand dash-dotted lines are, respectively, analytical theories for large and smallκa. Note that the displacement is inversely proportional to E .
33
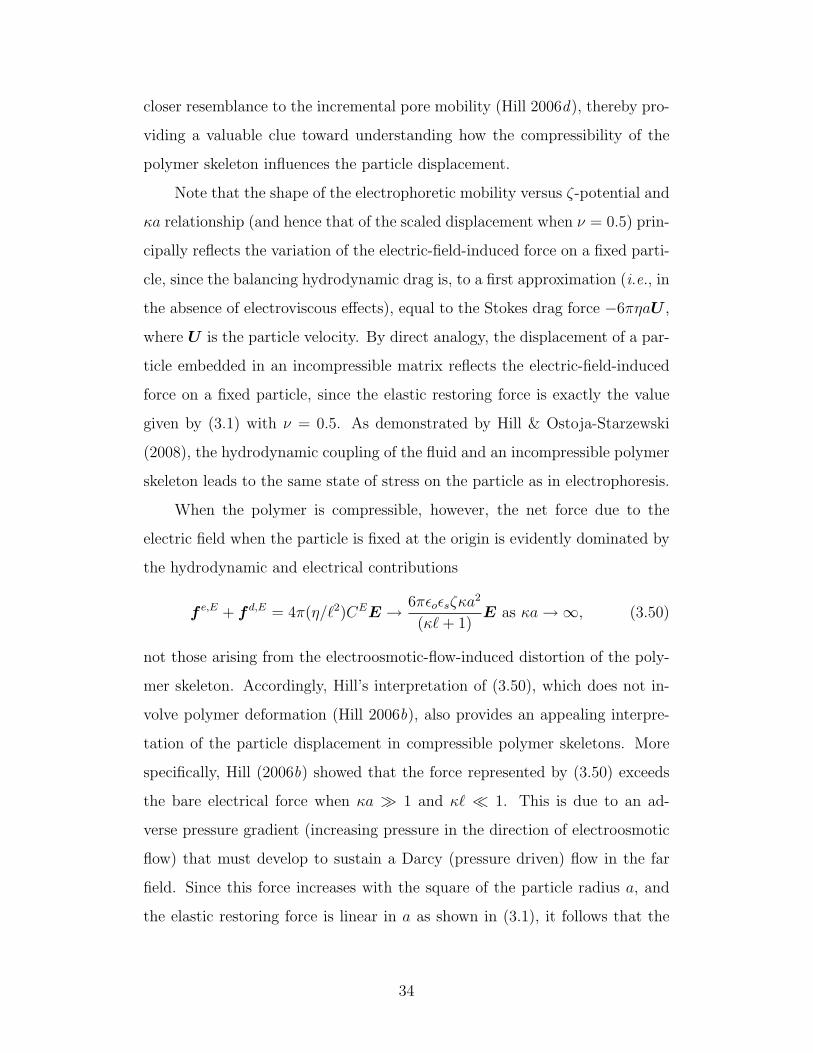
closer resemblance to the incremental pore mobility (Hill 2006d), thereby pro-
viding a valuable clue toward understanding how the compressibility of the
polymer skeleton influences the particle displacement.
Note that the shape of the electrophoretic mobility versus ζ-potential and
κa relationship (and hence that of the scaled displacement when ν = 0.5) prin-
cipally reflects the variation of the electric-field-induced force on a fixed parti-
cle, since the balancing hydrodynamic drag is, to a first approximation (i.e., in
the absence of electroviscous effects), equal to the Stokes drag force −6πηaU ,
where U is the particle velocity. By direct analogy, the displacement of a par-
ticle embedded in an incompressible matrix reflects the electric-field-induced
force on a fixed particle, since the elastic restoring force is exactly the value
given by (3.1) with ν = 0.5. As demonstrated by Hill & Ostoja-Starzewski
(2008), the hydrodynamic coupling of the fluid and an incompressible polymer
skeleton leads to the same state of stress on the particle as in electrophoresis.
When the polymer is compressible, however, the net force due to the
electric field when the particle is fixed at the origin is evidently dominated by
the hydrodynamic and electrical contributions
f e,E + f d,E = 4π(η/`2)CEE → 6πεoεsζκa2
(κ`+ 1)E as κa→∞, (3.50)
not those arising from the electroosmotic-flow-induced distortion of the poly-
mer skeleton. Accordingly, Hill’s interpretation of (3.50), which does not in-
volve polymer deformation (Hill 2006b), also provides an appealing interpre-
tation of the particle displacement in compressible polymer skeletons. More
specifically, Hill (2006b) showed that the force represented by (3.50) exceeds
the bare electrical force when κa 1 and κ` 1. This is due to an ad-
verse pressure gradient (increasing pressure in the direction of electroosmotic
flow) that must develop to sustain a Darcy (pressure driven) flow in the far
field. Since this force increases with the square of the particle radius a, and
the elastic restoring force is linear in a as shown in (3.1), it follows that the
34
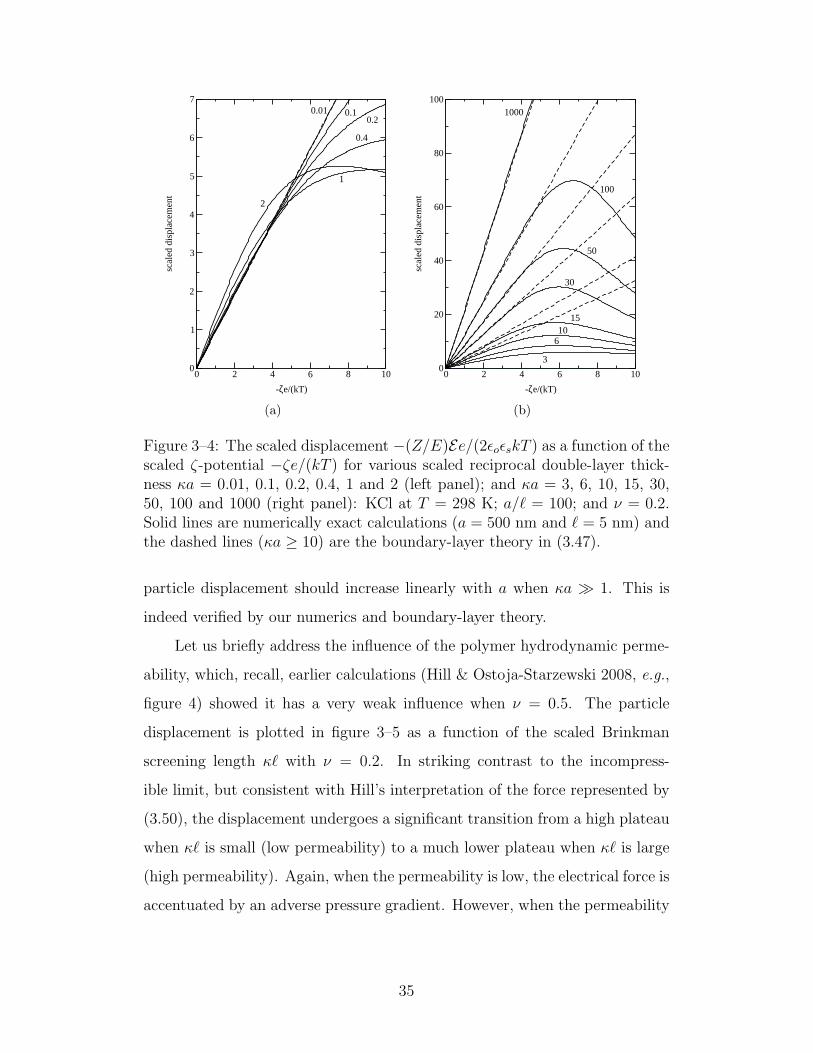
0 2 4 6 8 10
-ζe/(kT)
0
1
2
3
4
5
6
7
scal
ed d
ispl
acem
ent
0.01 0.10.2
0.4
1
2
(a)
0 2 4 6 8 10
-ζe/(kT)
0
20
40
60
80
100
scal
ed d
ispl
acem
ent
3
610
15
30
50
100
1000
(b)
Figure 3–4: The scaled displacement −(Z/E)Ee/(2εoεskT ) as a function of thescaled ζ-potential −ζe/(kT ) for various scaled reciprocal double-layer thick-ness κa = 0.01, 0.1, 0.2, 0.4, 1 and 2 (left panel); and κa = 3, 6, 10, 15, 30,50, 100 and 1000 (right panel): KCl at T = 298 K; a/` = 100; and ν = 0.2.Solid lines are numerically exact calculations (a = 500 nm and ` = 5 nm) andthe dashed lines (κa ≥ 10) are the boundary-layer theory in (3.47).
particle displacement should increase linearly with a when κa 1. This is
indeed verified by our numerics and boundary-layer theory.
Let us briefly address the influence of the polymer hydrodynamic perme-
ability, which, recall, earlier calculations (Hill & Ostoja-Starzewski 2008, e.g.,
figure 4) showed it has a very weak influence when ν = 0.5. The particle
displacement is plotted in figure 3–5 as a function of the scaled Brinkman
screening length κ` with ν = 0.2. In striking contrast to the incompress-
ible limit, but consistent with Hill’s interpretation of the force represented by
(3.50), the displacement undergoes a significant transition from a high plateau
when κ` is small (low permeability) to a much lower plateau when κ` is large
(high permeability). Again, when the permeability is low, the electrical force is
accentuated by an adverse pressure gradient. However, when the permeability
35
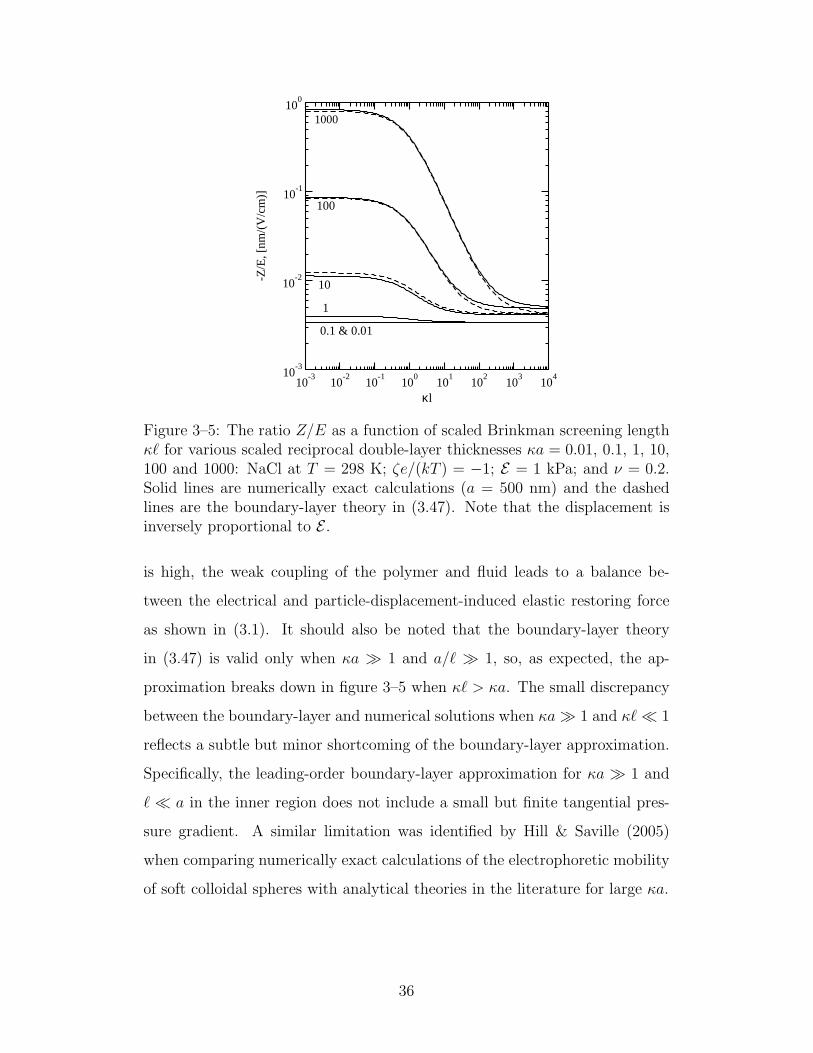
10-3
10-2
10-1
100
101
102
103
104
κl
10-3
10-2
10-1
100
-Z/E
, [nm
/(V
/cm
)]
10
100
1000
1
0.1 & 0.01
Figure 3–5: The ratio Z/E as a function of scaled Brinkman screening lengthκ` for various scaled reciprocal double-layer thicknesses κa = 0.01, 0.1, 1, 10,100 and 1000: NaCl at T = 298 K; ζe/(kT ) = −1; E = 1 kPa; and ν = 0.2.Solid lines are numerically exact calculations (a = 500 nm) and the dashedlines are the boundary-layer theory in (3.47). Note that the displacement isinversely proportional to E .
is high, the weak coupling of the polymer and fluid leads to a balance be-
tween the electrical and particle-displacement-induced elastic restoring force
as shown in (3.1). It should also be noted that the boundary-layer theory
in (3.47) is valid only when κa 1 and a/` 1, so, as expected, the ap-
proximation breaks down in figure 3–5 when κ` > κa. The small discrepancy
between the boundary-layer and numerical solutions when κa 1 and κ` 1
reflects a subtle but minor shortcoming of the boundary-layer approximation.
Specifically, the leading-order boundary-layer approximation for κa 1 and
` a in the inner region does not include a small but finite tangential pres-
sure gradient. A similar limitation was identified by Hill & Saville (2005)
when comparing numerically exact calculations of the electrophoretic mobility
of soft colloidal spheres with analytical theories in the literature for large κa.
36
3.5 Summary
We generalized the electrokinetic model of Hill & Ostoja-Starzewski (2008)
to calculate the electric-field-induced displacement of a charged, spherical col-
loid embedded in an electrolyte-saturated compressible polymer skeleton. The
fluid velocity and polymer displacement fields were calculated to linear order
in perturbations from an equilibrium state governed by the non-linear Poisson-
Boltzmann equation. Using linear superposition, we expressed the particle dis-
placement in terms of asymptotic coefficients that describe the far-field decays
of the fluid pressure and polymer displacement. Because the polymer skeleton
is compressible, two asymptotic coefficients are necessary to correctly quan-
tify the polymer distortion and, hence, to compute the electric-field-induced
particle displacement. In addition to numerically exact solutions of the full
model, we derived an analytical boundary-layer solution for the limit in which
the inclusion radius is larger than the Debye and Brinkman screening lengths.
Our theory reveals an electric-field-induced particle displacement that is
a sensitive and, in general, complicated function of the Poisson ratio and
hydrodynamic permeability of the polymer skeleton, the size and charge of
the inclusion, and the concentration of the electrolyte. However, the parti-
cle displacement remains inversely proportional to Young’s modulus (or shear
modulus) of the polymer. More importantly, polymer compressibility yields
a particle displacement that has a qualitatively different dependence on the
particle size than for incompressible polymer skeletons. Specifically, when
κa 1, the electric-field-induced displacement increases linearly with the
particle size, rather than tending to a size-independent value. Fortunately,
in the parameter space where experimentally measurable particle displace-
ments are expected, our boundary-layer approximation furnishes a reliable
and convenient alternative to numerical solutions of the full model. To our
best knowledge, experiments have not been reported in the literature, so we
hope our theory will stimulate future experimental work in this area.
37
CHAPTER 4Dynamic electric-field-induced response of charged spherical
colloids in uncharged hydrogels
Embedding colloidal particles in polymeric hydrogels often endows the
polymer skeleton with appealing characteristics for microfluidics and biosens-
ing applications. This chapter provides a rigorous foundation for interpreting
active electrical microrheology and electroacoustic experiments on such mate-
rials. In addition to viscoelastic properties of the composites, these techniques
sense physicochemical characteristics of the particle-polymer interface. We
extended the steady multi-phase electrokinetic model in the previous chapter
to calculate the dynamic response of charged spherical colloids embedded in
uncharged hydrogels when subjected to harmonically oscillating electric fields.
The frequency response depends on the particle size and charge, ionic strength
of the electrolyte, and elastic and hydrodynamic characteristics of the polymer
skeleton. Our calculations capture the transition from quasi-steady compress-
ible to quasi-steady incompressible dynamics as the frequency passes through
the reciprocal draining time of the gel. At higher frequencies, the dynamics
are dominated by hydrodynamic viscous and inertial forces, with the response
eventually becoming equal to the classical dynamic electrophoretic mobility
measured using modern electroacoustic instruments. We establish the connec-
tion between the electroacoustic signal for hydrogel composites and the single-
particle dynamic electrophoretic mobility. Finally, we provide an approximate
analytical theory that captures the elasticity of the hydrogel at the ultrasonic
frequencies used in commercially available electroacoustic instruments. This
agrees very well with our numerics over a wide range of the experimentally
accessible parameter space.
38
4.1 Introduction
Hydrogels are an important class of soft matter that have gained widespread
application in drug delivery (Qiu & Park 2001; Lin & Netters 2006; Peppas
et al. 2000), tissue engineering (Khademhosseini & Langer 2007; Barndl et al.
2007; Drury & Mooney 2003), advanced materials (Peppas et al. 2006; Edding-
ton & Beebe 2004; Chaterji et al. 2007), and molecular separations (Wang
et al. 1993; Kim & Park 1998). Novel characteristics can be achieved by
immobilizing organic and inorganic colloidal particulates in the polymer skele-
ton. For example, embedding gold or gold-coated silica nanoparticles into a
thermally responsive hydrogel induces light-wavelength-sensitive swelling to
achieve optically active microfluidic flow control (Sershen et al. 2005). In
biosensing, immobilizing silica nanoparticles in polyacrylamide hydrogels and
applying an electric field increase the otherwise diffusion-limited flux of un-
charged macromolecules across the composite membrane (Matos et al. 2006).
This flux enhancement can be attributed to electroosmotic flow (Hill 2006d),
and theoretical predictions from continuum electrokinetic theory are in good
agreement with the available experiments (Hill 2007). Other applications in-
clude delivering growth factors for bone regeneration (Chung et al. 2007),
improving the contrast of ultrasound imaging for early tumor detection (Liu
et al. 2006; Dayton & Ferrara 2002), and absorbing infrared energy for certain
cancer treatment (Loo et al. 2005). Note also that polystyrene nanoparticles
have been dispersed in neutral polyacrylamide hydrogels to increase the storage
modulus and produce mechanoelectrical effects for artificial tactile perception
and psycho-sensorial materials (Thevenot et al. 2007).
Advances in the development and application of hydrogel-colloid com-
posites could benefit from a quantitative characterization of the microstruc-
ture. This motivates the present theoretical study, where we investigate the
response of hydrogel-colloid composites to dynamic electric fields. Our the-
ory provides a first step toward quantifying the electrical, hydrodynamic and
mechanical interactions under dynamic conditions. It therefore establishes a
39
rigorous foundation for interpreting electrical microrheology and electroacous-
tic experiments. We show that electrophoretic microrheology (Mizuno et al.
2000; Kimura & Mizuno 2007) is appropriate at low frequencies, whereas the
response to electric fields at high frequencies is best probed using electroacous-
tics, namely the electrokinetic sonic amplitude (ESA) (O’Brien 1988, 1990;
Hunter 1998).
In microrheology, the storage and loss moduli of soft materials, such as hy-
drogels and polymer solutions, can be obtained from the frequency-dependent
susceptibility of probe particles in an external field (Ziemann et al. 1994;
Breuer 2005). One advantage of applying a dynamic electric field is that the
viscoelastic properties of the matrix and the physicochemical characteristics of
the probe particles can be measured simultaneously. Note that physicochem-
ical properties, such as the surface charge or ζ-potential of the inclusions, are
important for electroosmotic pumping (Yao & Santiago 2003; Yao et al. 2003;
Matos et al. 2006; Hill 2007) and micromixing (Matos et al. 2008). Another
advantage of dynamic experiments is that the spectral response provides con-
siderably more information than a steady experiment (Hunter 2001; Russel
et al. 1989).
Microrheology is often adopted for materials that are too fragile for bulk
rheology measurements (MacKintosh & Schmidt 1999; Cicuta & Donald 2007;
Breuer 2005). Passive microrheology, such as diffusing wave spectroscopy
(DWS) (Pine et al. 1988; Mason & Weitz 1995) or one- and two-particle mi-
crorheology (Levine & Lubensky 2000), measures thermal fluctuations in the
displacement of probe particles. In active microrheology, the probe particles
typically respond to applied magnetic (Ziemann et al. 1994) or optical (Valen-
tine et al. 1996; Yamaguchi et al. 2005) forces.
Mizuno et al. (2000, 2001, 2004) and Kimura & Mizuno (2007) have ap-
plied electric fields in a novel heterodyne light scattering technique to mea-
sure the dynamic electrophoretic mobility of nanoparticles in dilute lamellar
phases. Their experiments simultaneously measure the dynamic mobility and
40
diffusion coefficient of probe particles at frequencies from less than 1 Hz to
about 50 kHz. Microrheology techniques can also be applied to assess the sur-
face characteristics of colloidal particles. With optical tweezers, Galneder et al.
(2001) measured the ζ-potential of phospholipid-bilayer-coated silica beads by
monitoring electrophoretic forces. Electrical microrheology can also be ap-
plied to hydrogel-colloid composites, so simultaneous characterization of the
viscoelastic and physicochemical properties of the composite microstructure
could be achieved.
The upper frequency limit of electrical microrheology is about 50 kHz (Mizuno
et al. 2000). Higher frequencies have been achieved with Newtonian colloidal
dispersions using electroacoustics, typically operating between 0.3 MHz and
11 MHz (Hunter 1998). Electroacoustics has also been successful for deter-
mining the size and ζ-potential of colloidal particles in Newtonian electrolytes.
It includes the colloid vibration potential (CVP), arising from external sound
waves, and the electrokinetic sonic amplitude (ESA), generated by oscillat-
ing electric fields. These techniques are independent of the suspension opti-
cal properties, and are therefore particularly well suited for opaque and con-
centrated dispersions. Modern electroacoustic theories (O’Brien 1988, 1990)
connect the macroscopic electric-field-induced pressure disturbances or sound-
wave-generated electrical potentials to the dynamic mobility and polarizability
of dispersed colloidal particles. Theoretical calculations of the dynamic elec-
trophoretic mobility for dilute (Mangelsdorf & White 1992; Preston et al. 2005;
O’Brien 1988) and concentrated (Ahualli et al. 2006; Rider & O’Brien 1993;
O’Brien et al. 2003) suspensions have been successfully compared with exper-
iments, which has undoubtedly facilitated successful commercialization of the
technology (Hunter 1998).
In this work, we connect the macroscopic electroacoustic response of
hydrogel-colloid composites to the dynamic electrophoretic mobility of a sin-
gle colloidal particle embedded in a hydrogel matrix. Our analysis demon-
strates that the electroacoustic response of a hydrogel-colloid composite could
41
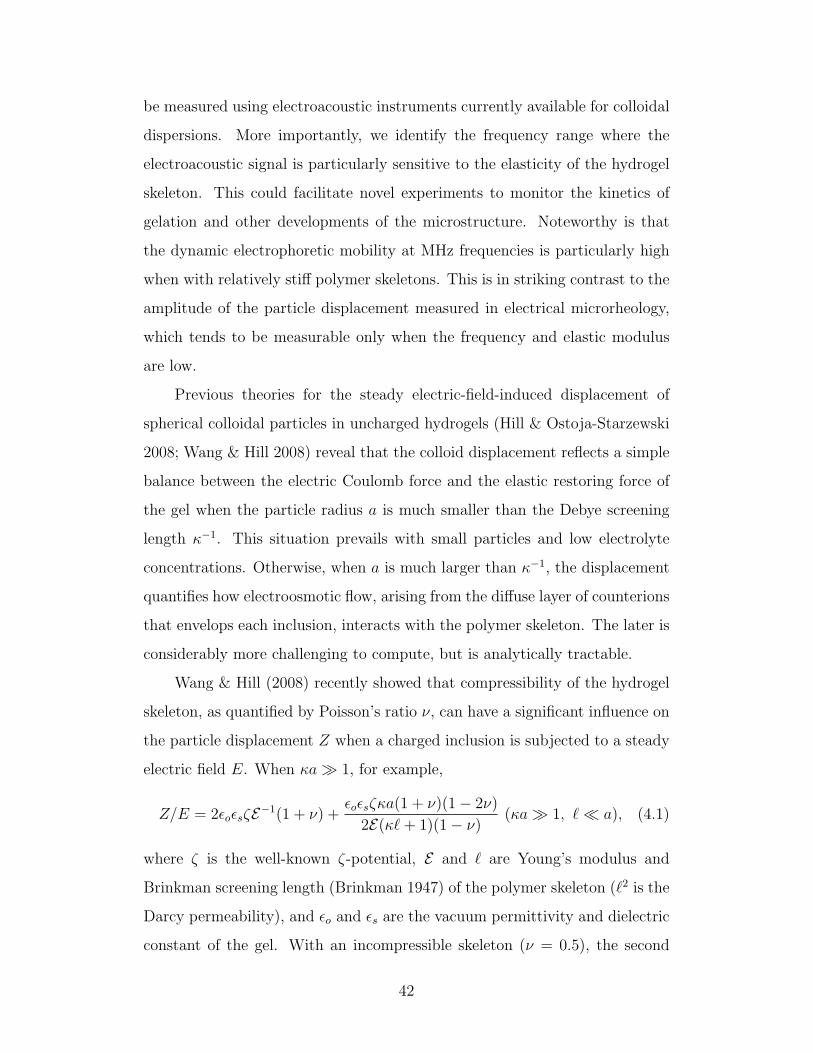
be measured using electroacoustic instruments currently available for colloidal
dispersions. More importantly, we identify the frequency range where the
electroacoustic signal is particularly sensitive to the elasticity of the hydrogel
skeleton. This could facilitate novel experiments to monitor the kinetics of
gelation and other developments of the microstructure. Noteworthy is that
the dynamic electrophoretic mobility at MHz frequencies is particularly high
when with relatively stiff polymer skeletons. This is in striking contrast to the
amplitude of the particle displacement measured in electrical microrheology,
which tends to be measurable only when the frequency and elastic modulus
are low.
Previous theories for the steady electric-field-induced displacement of
spherical colloidal particles in uncharged hydrogels (Hill & Ostoja-Starzewski
2008; Wang & Hill 2008) reveal that the colloid displacement reflects a simple
balance between the electric Coulomb force and the elastic restoring force of
the gel when the particle radius a is much smaller than the Debye screening
length κ−1. This situation prevails with small particles and low electrolyte
concentrations. Otherwise, when a is much larger than κ−1, the displacement
quantifies how electroosmotic flow, arising from the diffuse layer of counterions
that envelops each inclusion, interacts with the polymer skeleton. The later is
considerably more challenging to compute, but is analytically tractable.
Wang & Hill (2008) recently showed that compressibility of the hydrogel
skeleton, as quantified by Poisson’s ratio ν, can have a significant influence on
the particle displacement Z when a charged inclusion is subjected to a steady
electric field E. When κa 1, for example,
Z/E = 2εoεsζE−1(1 + ν) +εoεsζκa(1 + ν)(1− 2ν)
2E(κ`+ 1)(1− ν)(κa 1, ` a), (4.1)
where ζ is the well-known ζ-potential, E and ` are Young’s modulus and
Brinkman screening length (Brinkman 1947) of the polymer skeleton (`2 is the
Darcy permeability), and εo and εs are the vacuum permittivity and dielectric
constant of the gel. With an incompressible skeleton (ν = 0.5), the second
42
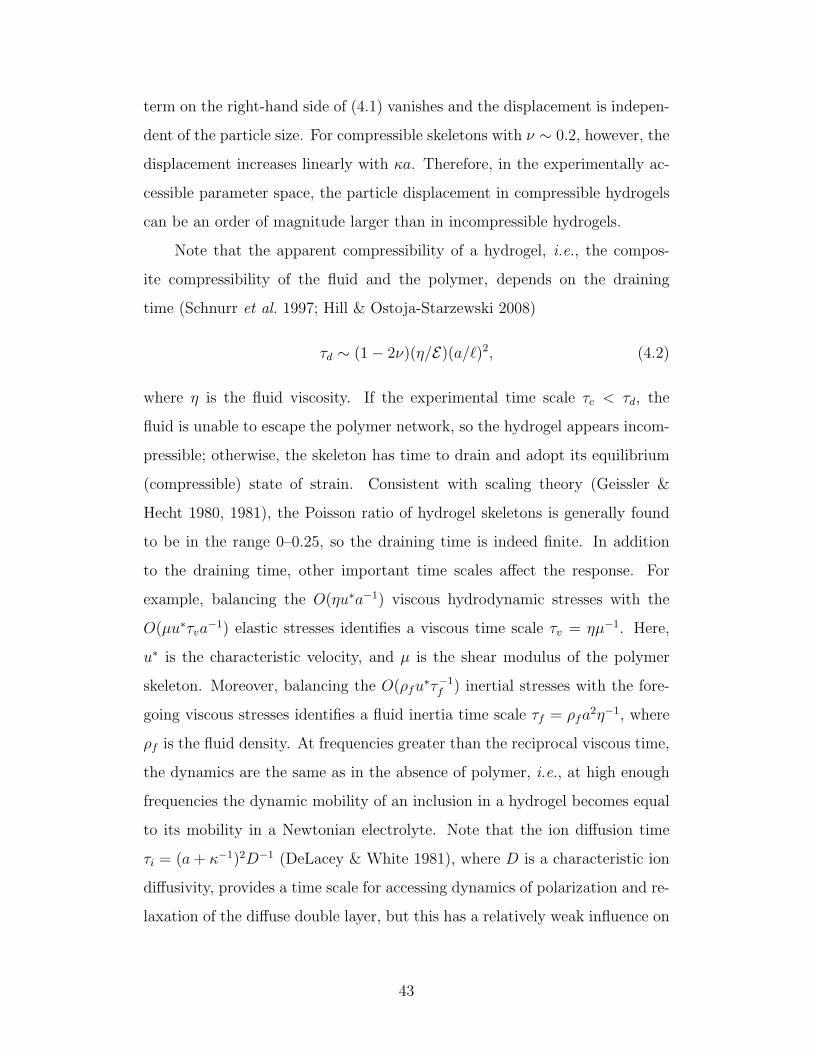
term on the right-hand side of (4.1) vanishes and the displacement is indepen-
dent of the particle size. For compressible skeletons with ν ∼ 0.2, however, the
displacement increases linearly with κa. Therefore, in the experimentally ac-
cessible parameter space, the particle displacement in compressible hydrogels
can be an order of magnitude larger than in incompressible hydrogels.
Note that the apparent compressibility of a hydrogel, i.e., the compos-
ite compressibility of the fluid and the polymer, depends on the draining
time (Schnurr et al. 1997; Hill & Ostoja-Starzewski 2008)
τd ∼ (1− 2ν)(η/E)(a/`)2, (4.2)
where η is the fluid viscosity. If the experimental time scale τc < τd, the
fluid is unable to escape the polymer network, so the hydrogel appears incom-
pressible; otherwise, the skeleton has time to drain and adopt its equilibrium
(compressible) state of strain. Consistent with scaling theory (Geissler &
Hecht 1980, 1981), the Poisson ratio of hydrogel skeletons is generally found
to be in the range 0–0.25, so the draining time is indeed finite. In addition
to the draining time, other important time scales affect the response. For
example, balancing the O(ηu∗a−1) viscous hydrodynamic stresses with the
O(µu∗τva−1) elastic stresses identifies a viscous time scale τv = ηµ−1. Here,
u∗ is the characteristic velocity, and µ is the shear modulus of the polymer
skeleton. Moreover, balancing the O(ρfu∗τ−1f ) inertial stresses with the fore-
going viscous stresses identifies a fluid inertia time scale τf = ρfa2η−1, where
ρf is the fluid density. At frequencies greater than the reciprocal viscous time,
the dynamics are the same as in the absence of polymer, i.e., at high enough
frequencies the dynamic mobility of an inclusion in a hydrogel becomes equal
to its mobility in a Newtonian electrolyte. Note that the ion diffusion time
τi = (a+ κ−1)2D−1 (DeLacey & White 1981), where D is a characteristic ion
diffusivity, provides a time scale for accessing dynamics of polarization and re-
laxation of the diffuse double layer, but this has a relatively weak influence on
43
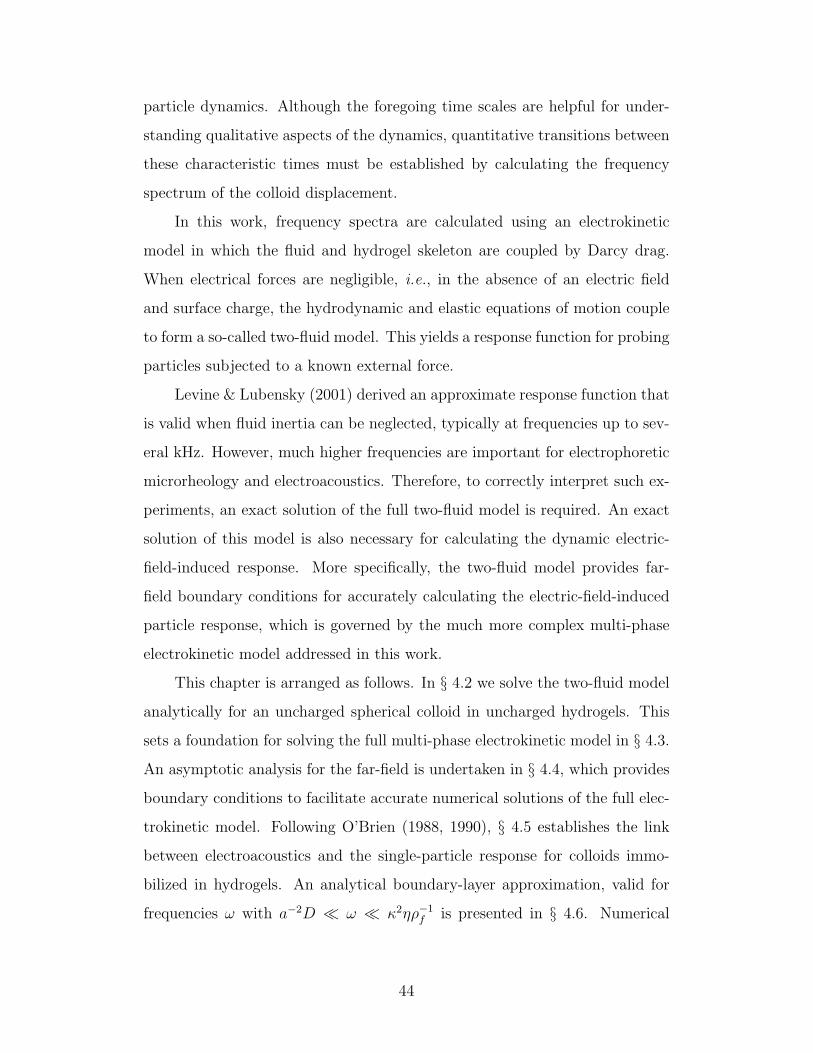
particle dynamics. Although the foregoing time scales are helpful for under-
standing qualitative aspects of the dynamics, quantitative transitions between
these characteristic times must be established by calculating the frequency
spectrum of the colloid displacement.
In this work, frequency spectra are calculated using an electrokinetic
model in which the fluid and hydrogel skeleton are coupled by Darcy drag.
When electrical forces are negligible, i.e., in the absence of an electric field
and surface charge, the hydrodynamic and elastic equations of motion couple
to form a so-called two-fluid model. This yields a response function for probing
particles subjected to a known external force.
Levine & Lubensky (2001) derived an approximate response function that
is valid when fluid inertia can be neglected, typically at frequencies up to sev-
eral kHz. However, much higher frequencies are important for electrophoretic
microrheology and electroacoustics. Therefore, to correctly interpret such ex-
periments, an exact solution of the full two-fluid model is required. An exact
solution of this model is also necessary for calculating the dynamic electric-
field-induced response. More specifically, the two-fluid model provides far-
field boundary conditions for accurately calculating the electric-field-induced
particle response, which is governed by the much more complex multi-phase
electrokinetic model addressed in this work.
This chapter is arranged as follows. In § 4.2 we solve the two-fluid model
analytically for an uncharged spherical colloid in uncharged hydrogels. This
sets a foundation for solving the full multi-phase electrokinetic model in § 4.3.
An asymptotic analysis for the far-field is undertaken in § 4.4, which provides
boundary conditions to facilitate accurate numerical solutions of the full elec-
trokinetic model. Following O’Brien (1988, 1990), § 4.5 establishes the link
between electroacoustics and the single-particle response for colloids immo-
bilized in hydrogels. An analytical boundary-layer approximation, valid for
frequencies ω with a−2D ω κ2ηρ−1f is presented in § 4.6. Numerical
44
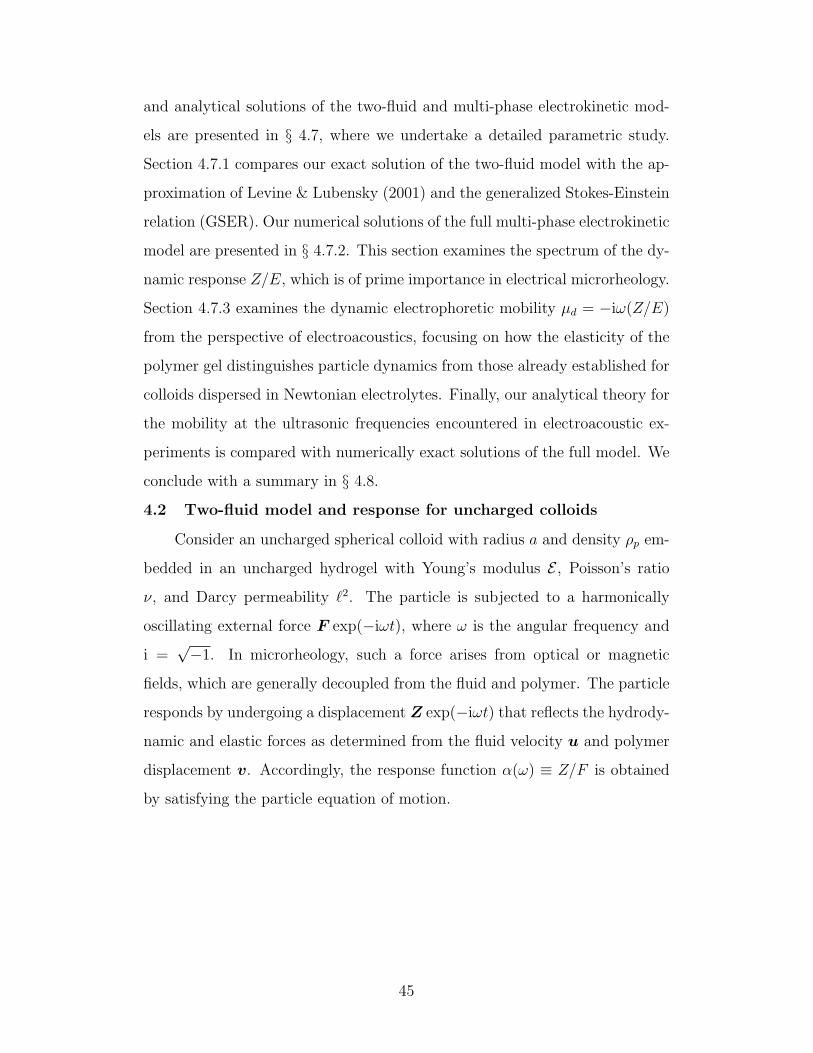
and analytical solutions of the two-fluid and multi-phase electrokinetic mod-
els are presented in § 4.7, where we undertake a detailed parametric study.
Section 4.7.1 compares our exact solution of the two-fluid model with the ap-
proximation of Levine & Lubensky (2001) and the generalized Stokes-Einstein
relation (GSER). Our numerical solutions of the full multi-phase electrokinetic
model are presented in § 4.7.2. This section examines the spectrum of the dy-
namic response Z/E, which is of prime importance in electrical microrheology.
Section 4.7.3 examines the dynamic electrophoretic mobility µd = −iω(Z/E)
from the perspective of electroacoustics, focusing on how the elasticity of the
polymer gel distinguishes particle dynamics from those already established for
colloids dispersed in Newtonian electrolytes. Finally, our analytical theory for
the mobility at the ultrasonic frequencies encountered in electroacoustic ex-
periments is compared with numerically exact solutions of the full model. We
conclude with a summary in § 4.8.
4.2 Two-fluid model and response for uncharged colloids
Consider an uncharged spherical colloid with radius a and density ρp em-
bedded in an uncharged hydrogel with Young’s modulus E , Poisson’s ratio
ν, and Darcy permeability `2. The particle is subjected to a harmonically
oscillating external force F exp(−iωt), where ω is the angular frequency and
i =√−1. In microrheology, such a force arises from optical or magnetic
fields, which are generally decoupled from the fluid and polymer. The particle
responds by undergoing a displacement Z exp(−iωt) that reflects the hydrody-
namic and elastic forces as determined from the fluid velocity u and polymer
displacement v. Accordingly, the response function α(ω) ≡ Z/F is obtained
by satisfying the particle equation of motion.
45
In the absence of electrical influences, the two-fluid model in the frequency
domain for harmonic dynamics comprises (e.g., Levine & Lubensky 2001)
−iωρfu = −∇p+ η∇2u− (η/`2)(u+ iωv), (4.3a)
0 = ∇ · u, (4.3b)
0 = µ∇2v + (µ+ λ)∇(∇ · v) + (η/`2)(u+ iωv), (4.3c)
where p is the pressure, and the first and second Lame constants, λ and µ,
respectively, are related to Young’s modulus E and Poisson’s ratio ν by λ =
Eν/[(1 + ν)(1− 2ν)] and µ = E/[2(1 + ν)]. In a frame of reference that moves
with the sphere, the boundary conditions are
u = v = 0 at r = a, (4.4)
u→ −iωY , v → Y as r →∞, (4.5)
where Y = −Z.
In general, the first and second Lame constants for the polymer skeleton
are complex and frequency dependent (Larson 1999). However, their deter-
mination requires specific knowledge of the polymer and gelation. Therefore,
for simplicity, the first and second Lame constants are specified as real con-
stants. Note that time derivatives appear via the factor −iω; polymer inertia
is neglected because of its low mass fraction; and the fluid and polymer are
coupled by the Darcy drag force (η/`2)(u+ iωv).
4.2.1 Fluid velocity and polymer displacement fields
Inspired by the method of Markov (2005), we construct the fluid velocity
and polymer displacement fields as
u = ∇Φ1 + ∇×Ψ1 + ∇×Ψ2 − iωY , (4.6a)
v = m∇Φ1 + ∇Φ2 +M1∇×Ψ1 +M2∇×Ψ2 + Y , (4.6b)
where Φ1 and Φ2 are scalar functions; Ψ1 and Ψ2 are vector functions; and m,
M1 and M2 are constants. Physically, Φ1 can be attributed to the pressure in
46
the incompressible fluid; Φ2 represents a compressional wave; and Ψ1 and Ψ2
represent shear waves.
Fluid incompressibility (4.3b) requires
∇2Φ1 = 0, (4.7)
so taking the divergence of (4.3c), and substituting (4.6a) and (4.6b) gives
∇2[∇2(mΦ1 + Φ2) + (η/`2)(λ+ 2µ)−1Φ1 + iω(η/`2)(λ+ 2µ)−1(mΦ1 + Φ2)] = 0.
(4.8)
Next, eliminating Φ1 by setting m = −(iω)−1 gives
∇2Φ2 + k2Φ2 = 0, (4.9)
where
k2 = iω(η/`2)(µ+ 2λ)−1. (4.10)
Taking the curl of (4.3a) and (4.3c), and substituting (4.6a) and (4.6b) gives
∇×∇×2∑j=1
η∇2 + [iωρf − (η/`2)− iω(η/`2)Mj]Ψj = 0, (4.11a)
∇×∇×2∑j=1
µMj∇2 + [(η/`2) + iω(η/`2)Mj]Ψj = 0, (4.11b)
or
∇2Ψj +K2jΨj = 0 (j = 1, 2), (4.12)
where
K2j = [iωρf − (η/`2)− iω(η/`2)Mj]/η (j = 1, 2). (4.13)
For Ψ1 and Ψ2 to be distinct, M1 and M2 must be roots of the quadratic
iω(µ/`2)M2j + [iω(η/`2) + (µ/`2)− iωρf (µ/η)]Mj + (η/`2) = 0. (4.14)
The wave numbers k correspond to the propagation of compressional waves,
and K1 and K2 are associated with shear waves. Note that all the foregoing
47
wave numbers can also be obtained from the Fourier representation of the
governing equations (Levine & Lubensky 2001).
With the prevailing axisymmetric spherical geometry, the Laplace equa-
tion (4.7) and Helmholtz equations (4.9) and (4.12) are easily solved analyti-
cally. The vector potential Ψj can be written as Ψj = Ψjeφ (j = 1,2) (Lamb
1945; Markov 2005; Oestreicher 1951; Temkin & Leung 1976), where eφ is one
of the mutually orthogonal unit basis vectors (er, eθ, eφ) for spherical polar
coordinates (r, θ, φ) with respect to the polar axis ez such that ez ·er = cos θ.
Since the fluid velocity and polymer displacement must be linear with respect
to Y , and vanish as r →∞, we have
Φ1 = A1r−2Y cos θ, (4.15a)
Φ2 = A2h(kr)Y cos θ, (4.15b)
Ψj = Bjh(Kjr)Y sin θ (j = 1, 2), (4.15c)
where h(x) = −x−2(x+ i) exp(ix) is the spherical Hankel function of the first
kind, which represents an outward propagating wave, and Aj and Bj (j = 1, 2)
are constants to satisfy the boundary conditions at r = a. To ensure vanishing
far-field disturbances, Im(k) > 0, Im(K1) > 0, and Im(K2) > 0.
The radial and tangential components of the fluid velocity and polymer
displacement are
ur = [−2A1r−3 + 2
2∑j=1
Bjr−1h(Kjr)− iω]Y cos θ, (4.16a)
uθ = A1r−3 +
2∑j=1
BjKj[(Kjr)−1h(Kjr) + h′(Kjr)]− iω(−Y sin θ), (4.16b)
vr = [−2mA1r−3 + A2kh′(kr) + 2
2∑j=1
MjBjr−1h(Kjr) + 1]Y cos θ, (4.16c)
vθ = mA1r−3 + A2r
−1h(kr) +2∑j=1
MjBjKj[(Kjr)−1h(Kjr) + h′(Kjr)] + 1
×(−Y sin θ). (4.16d)
48
Note that the prime on the spherical Hankel function denotes its first deriva-
tive, and the constants Aj and Bj (j = 1, 2) are chosen to satisfy the no-slip
boundary conditions at r = a.
4.2.2 Force and response function
The force f exerted on the sphere by the fluid and polymer is calculated
from knowledge of the fluid velocity and polymer displacement. Integrating the
hydrodynamic and elastic surface tractions over the particle surface (Landau
& Lifshitz 1987) gives
f = (4/3)πa2−iωρfA1Y/a2 + [iω(η/`2)− λk2]A2Y h(ka) + 2f1(a) + 2f2(a)
= −4πiωρfA1Y, (4.17a)
where
f1(r) cos θ = ηur,r + µvr,r, (4.17b)
f2(r) sin θ = ηuθ,r + µvθ,r. (4.17c)
Note that the subscripts “r” following commas denote differentiation with
respect to r. Equation (4.17a) is the same as obtained by applying Gauss’s
divergence theorem to the volume enclosed by the particle surface and a large
concentric sphere. With no-slip boundary conditions at r = a,
A1 = a3(Θ + Γ)(2H)−1, (4.18a)
where
Θ = ω(M1 −M2)[2i(β1β2)2(b+ i)− 2b2(β1 + i)(β2 + i)
+b2(β21 + iβ1 − 1)(β2
2 + iβ2 − 1)], (4.18b)
Γ = 2(b2 + 3ib− 3)[β21(1 + iωM1)(β2 + i)
−β22(1 + iωM2)(β1 + i)], (4.18c)
H = i(β1β2)2(b2 + 2ib− 2)(M1 −M2)
+b2[β21(M2 −m)(β2 + i)− β2
2(M1 −m)(β1 + i)], (4.18d)
49
with b = ka and βj = Kja (j = 1, 2).
Finally, in a stationary reference frame, also taking into account particle
and fluid inertia (see Appendix 4.A), the particle equation of motion is
F + 4πiωρfA1Z = ω2Vp(ρf − ρp)Z, (4.19)
where Vp = (4/3)πa3 is the particle volume, and, recall, Z = −Y . Our exact
solution of the two-fluid model for the response function is therefore
α(ω) ≡ Z/F = [ω2Vp(ρf − ρp)− 4πiωρfA1]−1. (4.20)
This is compared with the approximation of Levine & Lubensky (2001) and
the GSER in § 4.7.1. To evaluate A1 in (4.20), quadratic equation (4.14) is
solved for M1 and M2, which provide wave numbers K1 and K2 from (4.13).
Next, k is obtained from (4.10). Note that Im(k) > 0 and Im(Kj) > 0
(j = 1, 2). After evaluating b, β1 and β2, equations (4.18b)–(4.18d) give Θ,
Γ, and H, which provide A1 from (4.18a). Several of the foregoing steps must
be performed using multiple precision algebra (Granlund 2007; Fousse et al.
2007; Enge et al. 2007) to avoid significant round-off errors. The integrals in
the approximation of Levine & Lubensky (2001) are easily evaluated using
standard numerical quadrature.
4.3 Multi-phase electrokinetic model
In general, the particle surface charge is screened by a diffuse layer of
electrolyte- and counter-ions, whose bulk concentration determines the Debye
length κ−1 and surface potential ζ for a given surface charge density σ. How-
ever, when κa 1, the external force on the particle equals the bare Coulomb
force F = σ4πa2E, and there is vanishing electroosmotic flow. Therefore, the
ratio of the particle displacement to the electric field strength is simply
Z/E = σ4πa2α(ω). (4.21)
50
As highlighted by scaling analysis (Schnurr et al. 1997) and the approximate
response function of Levine & Lubensky (2001), in (4.21) the hydrogel com-
pressibility affects Z/E by at most 25%. When κa & 1, however, an electroki-
netic model is necessary to capture the influence of electroosmotic flow and
polarization of the diffuse double layer, which together modify the phase and
amplitude of the effective Coulomb force on the particle.
4.3.1 Governing equations and boundary conditions
Our multi-phase electrokinetic model augments the two-fluid model con-
sidered in § 4.2 with an electrical body force on the fluid, a Poisson equation
linking the electrostatic potential to the free-charge density, and electrolyte-
ion conservation equations to account for ion diffusion, electromigration and
convection. With harmonic time dependence, e.g., an applied electric field
E exp (−iωt), the full electrokinetic model is
0 = εoεs∇2ψ +N∑j=1
njzje, (4.22a)
−iωnj = −∇ · jj, (4.22b)
−iωρfu = η∇2u−∇p− (η/`2)(u+ iωv)−N∑j=1
njzje∇ψ, (4.22c)
0 = ∇ · u, (4.22d)
0 = µ∇2v + (λ+ µ)∇(∇ · v) + (η/`2)(u+ iωv), (4.22e)
with ion fluxes
jj = nju−Dj∇nj − zjeDjnj(kT )−1∇ψ. (4.22f)
Note that ψ is the electrostatic potential, and nj is the concentration of the
jth ion species with valence zj and diffusivity Dj. The fundamental charge
and thermal energy are e and kT , respectively, and the diffusivities of the N
ion species are related to their limiting conductances Λj (Speight 2005) by
Dj = (kTΛj)/(e2|zj|). Note that the Debye length is κ−1 =
√kTεsεo/(2Ie2),
51
where the ionic strength I = (1/2)∑N
j=1 z2jn∞j with n∞j the bulk concentration
of the jth ion species.
Among the principal assumptions underlying this model are a linearly
elastic hydrogel skeleton that is isotropic and homogeneous (Hill & Ostoja-
Starzewski 2008), and does not hinder ion diffusion and electromigration (Hill
2006d). Furthermore, the colloidal particle is assumed to be rigid, and the
polymer displacement and fluid velocity are assumed to be continuous across
the particle-hydrogel interface.
Accordingly, in a reference frame that moves with the particle, no-slip
boundary conditions at the particle surface r = a require
u = v = 0. (4.23a)
Other possibilities, such as slipping or the opening of a crack at the particle-
hydrogel interface significantly complicate the problem, and are not pursued
here. An impenetrable and non-conducting particle demands
ψ> − ψ< = 0, (4.23b)
εpεo(er ·∇<)ψ − εsεo(er ·∇>)ψ = σ, (4.23c)
jj · er = 0, (4.23d)
where εp is the particle dielectric constant, er is the outward unit normal, and
the subscripts “<” and “>” distinguish the particle and hydrogel sides of the
interface.
Far from the particle, disturbances to the equilibrium electrostatic po-
tential, ion concentrations, fluid velocity, and polymer displacement vanish.
Therefore, as r →∞,
ψ → −E · r and nj → n∞j , (4.24a)
u→ iωZ and v → −Z. (4.24b)
52
Note that these boundary conditions cannot be directly applied in numerical
computations, because the slowly decaying, oscillating disturbances yield nu-
merical instabilities. We remedy this with an asymptotic analysis detailed in
§ 4.4.
4.3.2 Solution methodology
The equations in § 4.3.1 are solved by linearizing perturbations from an
equilibrium base state governed by the non-linear Poisson-Boltzmann equa-
tion. This methodology is widely adopted for calculating the steady and
dynamic electrophoretic mobilities of colloidal particles (O’Brien & White
1978; Hill et al. 2003a; Mangelsdorf & White 1992) and a variety of other
electrokinetic phenomena. The perturbation approach is accurate when the
applied electric field is sufficiently weak, i.e., |E| κζ. Under these condi-
tions, which are often achieved in experiments, the methodology is much more
computationally efficient than solving the full non-linear model (Masliyah &
Bhattacharjee 2006).
The equilibrium base state (ψ0 and n0j) prevails in the absence of external
stimuli. In this work, perturbations to equilibrium are induced by Y = −Z
and E. Accordingly, ψ and nj are constructed as
ψ = ψ0 + ψ′ = ψ0 −E · r + ψ′′ and nj = n0j + n′j, (4.25)
where linearity and axisymmetry demand
n′j = nj(r)X · er and ψ′′ = ψ(r)X · er, (4.26)
with X ∈ Y ,E. Note that fluid velocity u and polymer displacement v are
perturbed quantities whose constructions are given below.
It is expedient to linearize the perturbations and construct the solution by
superposing two sub-problems with either Y = 0 or E = 0, and the particle
fixed at the origin.
53
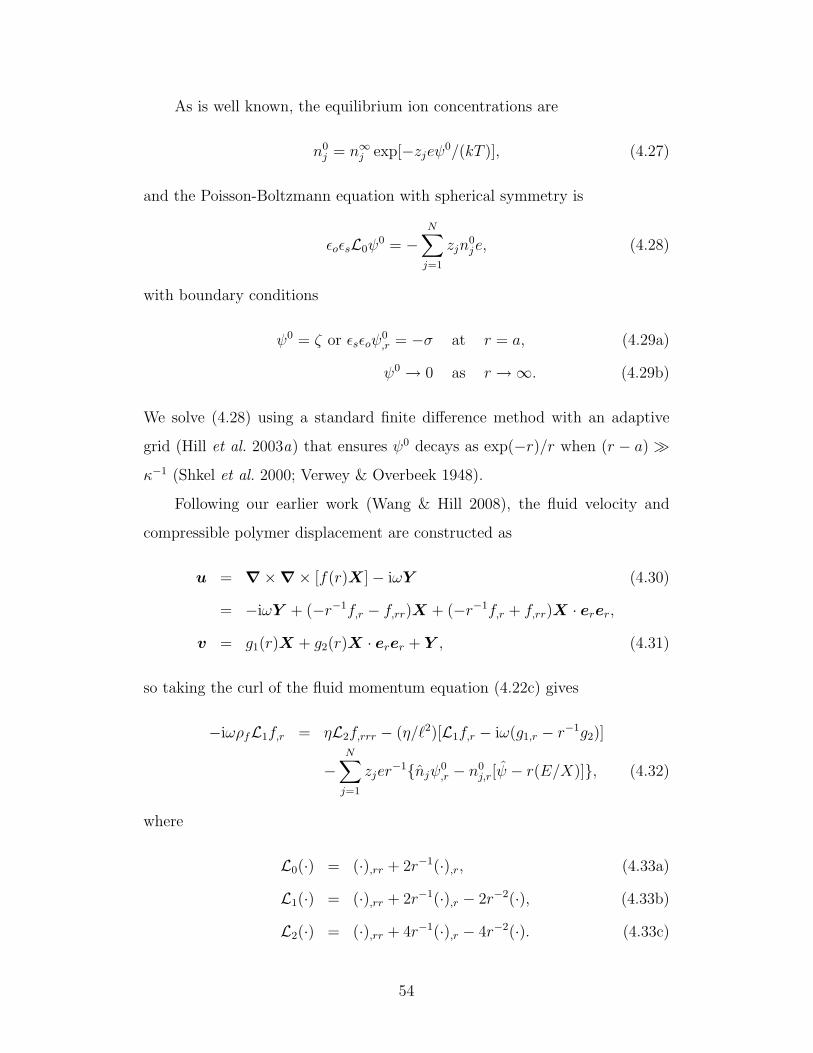
As is well known, the equilibrium ion concentrations are
n0j = n∞j exp[−zjeψ0/(kT )], (4.27)
and the Poisson-Boltzmann equation with spherical symmetry is
εoεsL0ψ0 = −
N∑j=1
zjn0je, (4.28)
with boundary conditions
ψ0 = ζ or εsεoψ0,r = −σ at r = a, (4.29a)
ψ0 → 0 as r →∞. (4.29b)
We solve (4.28) using a standard finite difference method with an adaptive
grid (Hill et al. 2003a) that ensures ψ0 decays as exp(−r)/r when (r − a)
κ−1 (Shkel et al. 2000; Verwey & Overbeek 1948).
Following our earlier work (Wang & Hill 2008), the fluid velocity and
compressible polymer displacement are constructed as
u = ∇×∇× [f(r)X]− iωY (4.30)
= −iωY + (−r−1f,r − f,rr)X + (−r−1f,r + f,rr)X · erer,
v = g1(r)X + g2(r)X · erer + Y , (4.31)
so taking the curl of the fluid momentum equation (4.22c) gives
−iωρfL1f,r = ηL2f,rrr − (η/`2)[L1f,r − iω(g1,r − r−1g2)]
−N∑j=1
zjer−1njψ0
,r − n0j,r[ψ − r(E/X)], (4.32)
where
L0(·) = (·),rr + 2r−1(·),r, (4.33a)
L1(·) = (·),rr + 2r−1(·),r − 2r−2(·), (4.33b)
L2(·) = (·),rr + 4r−1(·),r − 4r−2(·). (4.33c)
54
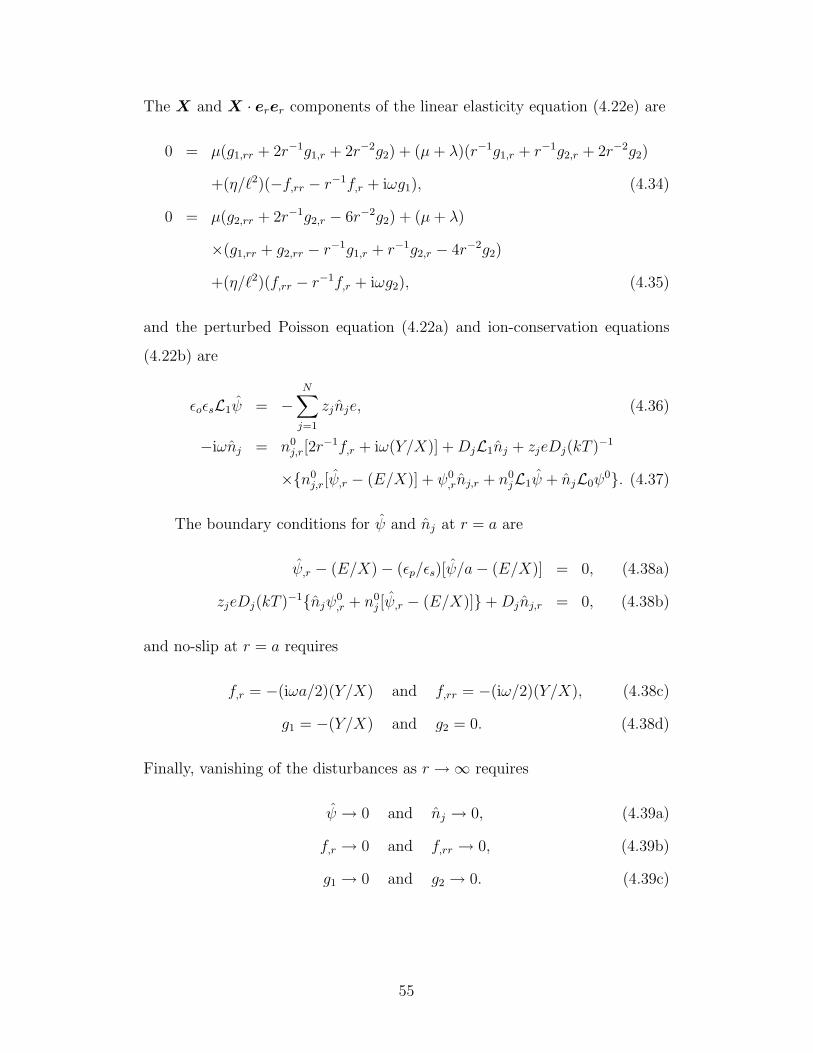
The X and X · erer components of the linear elasticity equation (4.22e) are
0 = µ(g1,rr + 2r−1g1,r + 2r−2g2) + (µ+ λ)(r−1g1,r + r−1g2,r + 2r−2g2)
+(η/`2)(−f,rr − r−1f,r + iωg1), (4.34)
0 = µ(g2,rr + 2r−1g2,r − 6r−2g2) + (µ+ λ)
×(g1,rr + g2,rr − r−1g1,r + r−1g2,r − 4r−2g2)
+(η/`2)(f,rr − r−1f,r + iωg2), (4.35)
and the perturbed Poisson equation (4.22a) and ion-conservation equations
(4.22b) are
εoεsL1ψ = −N∑j=1
zjnje, (4.36)
−iωnj = n0j,r[2r
−1f,r + iω(Y/X)] +DjL1nj + zjeDj(kT )−1
×n0j,r[ψ,r − (E/X)] + ψ0
,rnj,r + n0jL1ψ + njL0ψ
0. (4.37)
The boundary conditions for ψ and nj at r = a are
ψ,r − (E/X)− (εp/εs)[ψ/a− (E/X)] = 0, (4.38a)
zjeDj(kT )−1njψ0,r + n0
j [ψ,r − (E/X)]+Djnj,r = 0, (4.38b)
and no-slip at r = a requires
f,r = −(iωa/2)(Y/X) and f,rr = −(iω/2)(Y/X), (4.38c)
g1 = −(Y/X) and g2 = 0. (4.38d)
Finally, vanishing of the disturbances as r →∞ requires
ψ → 0 and nj → 0, (4.39a)
f,r → 0 and f,rr → 0, (4.39b)
g1 → 0 and g2 → 0. (4.39c)
55
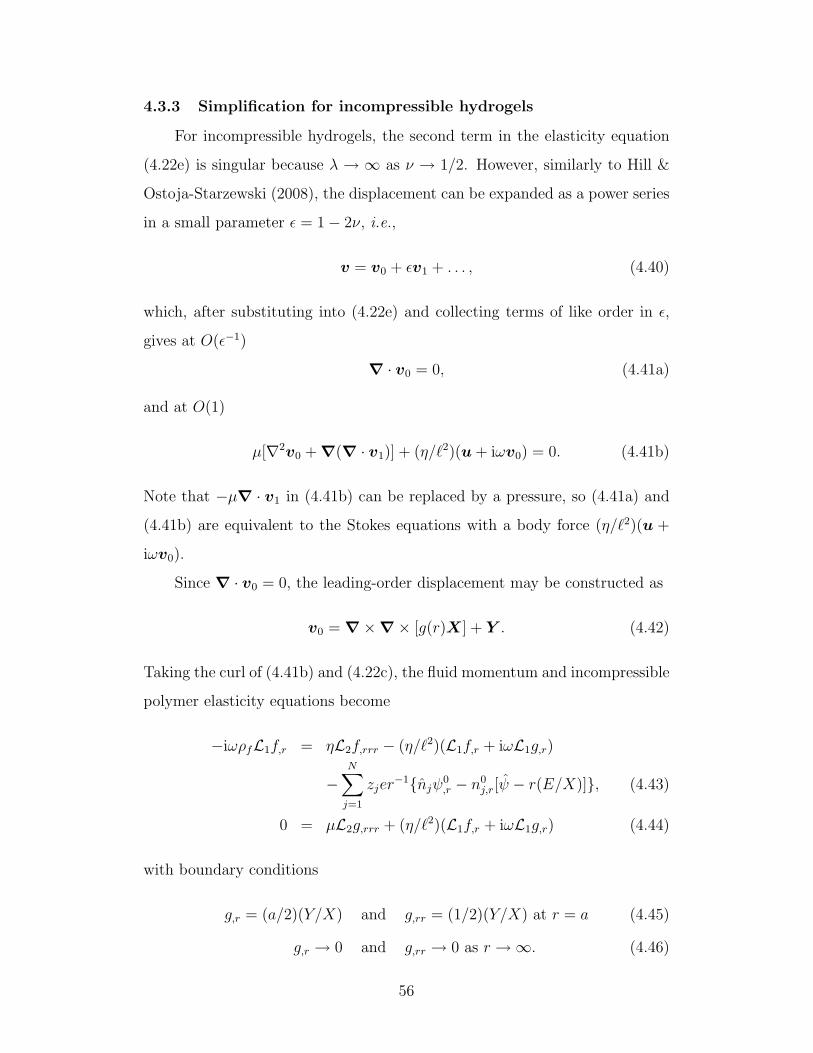
4.3.3 Simplification for incompressible hydrogels
For incompressible hydrogels, the second term in the elasticity equation
(4.22e) is singular because λ → ∞ as ν → 1/2. However, similarly to Hill &
Ostoja-Starzewski (2008), the displacement can be expanded as a power series
in a small parameter ε = 1− 2ν, i.e.,
v = v0 + εv1 + . . . , (4.40)
which, after substituting into (4.22e) and collecting terms of like order in ε,
gives at O(ε−1)
∇ · v0 = 0, (4.41a)
and at O(1)
µ[∇2v0 + ∇(∇ · v1)] + (η/`2)(u+ iωv0) = 0. (4.41b)
Note that −µ∇ · v1 in (4.41b) can be replaced by a pressure, so (4.41a) and
(4.41b) are equivalent to the Stokes equations with a body force (η/`2)(u +
iωv0).
Since ∇ · v0 = 0, the leading-order displacement may be constructed as
v0 = ∇×∇× [g(r)X] + Y . (4.42)
Taking the curl of (4.41b) and (4.22c), the fluid momentum and incompressible
polymer elasticity equations become
−iωρfL1f,r = ηL2f,rrr − (η/`2)(L1f,r + iωL1g,r)
−N∑j=1
zjer−1njψ0
,r − n0j,r[ψ − r(E/X)], (4.43)
0 = µL2g,rrr + (η/`2)(L1f,r + iωL1g,r) (4.44)
with boundary conditions
g,r = (a/2)(Y/X) and g,rr = (1/2)(Y/X) at r = a (4.45)
g,r → 0 and g,rr → 0 as r →∞. (4.46)
56
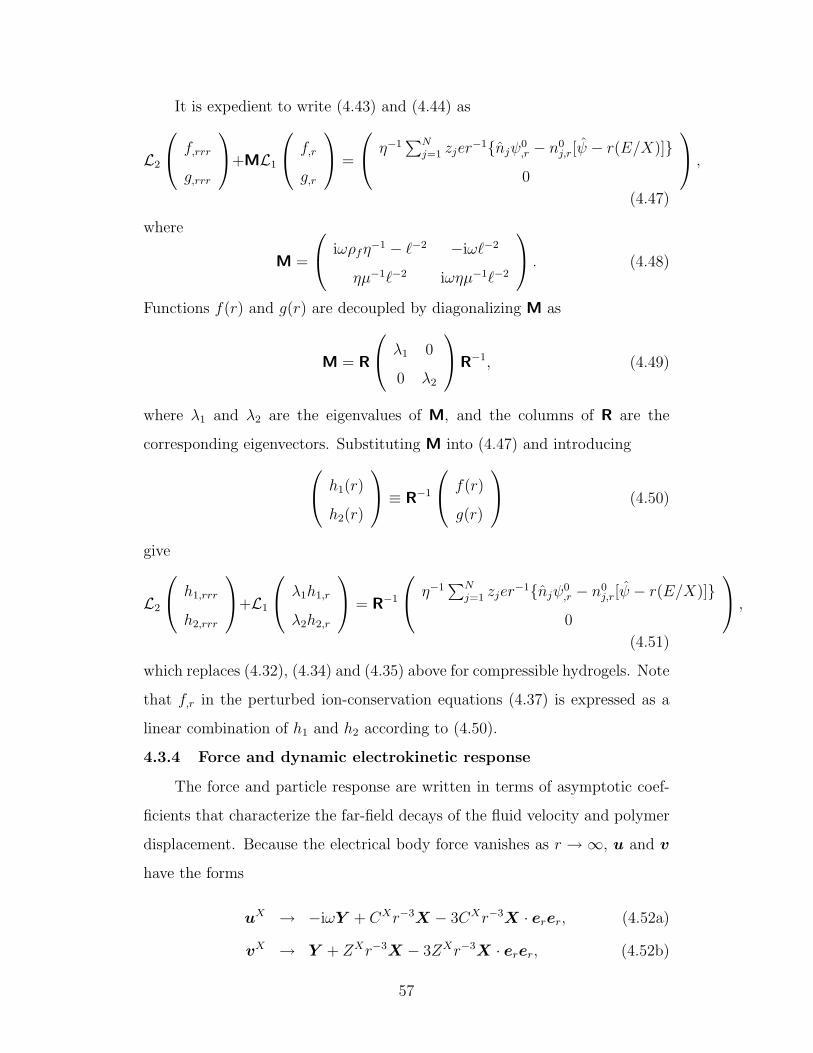
It is expedient to write (4.43) and (4.44) as
L2
f,rrr
g,rrr
+ML1
f,r
g,r
=
η−1∑N
j=1 zjer−1njψ0
,r − n0j,r[ψ − r(E/X)]
0
,
(4.47)
where
M =
iωρfη−1 − `−2 −iω`−2
ηµ−1`−2 iωηµ−1`−2
. (4.48)
Functions f(r) and g(r) are decoupled by diagonalizing M as
M = R
λ1 0
0 λ2
R−1, (4.49)
where λ1 and λ2 are the eigenvalues of M, and the columns of R are the
corresponding eigenvectors. Substituting M into (4.47) and introducing h1(r)
h2(r)
≡ R−1
f(r)
g(r)
(4.50)
give
L2
h1,rrr
h2,rrr
+L1
λ1h1,r
λ2h2,r
= R−1
η−1∑N
j=1 zjer−1njψ0
,r − n0j,r[ψ − r(E/X)]
0
,
(4.51)
which replaces (4.32), (4.34) and (4.35) above for compressible hydrogels. Note
that f,r in the perturbed ion-conservation equations (4.37) is expressed as a
linear combination of h1 and h2 according to (4.50).
4.3.4 Force and dynamic electrokinetic response
The force and particle response are written in terms of asymptotic coef-
ficients that characterize the far-field decays of the fluid velocity and polymer
displacement. Because the electrical body force vanishes as r → ∞, u and v
have the forms
uX → −iωY + CXr−3X − 3CXr−3X · erer, (4.52a)
vX → Y + ZXr−3X − 3ZXr−3X · erer, (4.52b)
57
where X ∈ E,Y . Recall, (4.52a) and (4.52b) emerge from the two-fluid
model presented in § 4.2. Since the fluid and polymer skeleton move together
in the far field, their respective asymptotic coefficients CX and ZX defined
here are related by ZX = −(iω)−1CX . Accordingly, the force and particle
displacement can be written in terms of CX alone.
Electrical, hydrodynamic, and elastic forces are exerted on the particle for
each E and Y sub-problem. The corresponding stress tensors are the Maxwell
stress
Tm = εoεs∇ψ∇ψ − (1/2)εoεs(∇ψ ·∇ψ)I, (4.53)
Newtonian hydrodynamic stress
Tf = −pI + η[∇u+ (∇u)T ], (4.54)
and linear elastic stress
Te = λ(∇ · v)I + µ[∇v + (∇v)T ], (4.55)
where I is the identity tensor.
The total force is
fX =
∫r=a
(Tm + Tf + Te
)· erdA, (4.56)
so applying Gauss’s divergence theorem to a volume that encloses the particle
surface and a large concentric sphere with radius r →∞ gives
fX =
∫r→∞
(Tm + Tf + Te
)· erdA−
∫ r→∞
r=a
∇ ·(Tm + Tf + Te
)dV. (4.57)
From the governing equations, the divergence of the foregoing stresses are
∇ · Tm = −ρe∇ψ, (4.58a)
∇ · Tf = −iωρfu+ (η/`2)(u+ iωv) + ρe∇ψ, (4.58b)
∇ · Te = −(η/`2)(u+ iωv), (4.58c)
58
where ρe =∑N
j=1 njzje is the free charge density. Accordingly, the force is
fX =
∫r→∞
(Tm + Tf + Te
)· erdA+ iωρf
∫ r→∞
r=a
udV
=
∫r→∞
(Tm + Tf + Te
)· erdA
+iωρf
[∫r→∞
(u · er)rdA−∫r=a
(u · er)rdA
]. (4.59)
Note that the first integral on the left-hand side of (4.59) is finite only if the
stress decays as r−2. The only such term involves the fluid pressure, so with
the no-slip boundary conditions at r = a,
fX = −∫r→∞
perdA+ iωρf
∫r→∞
(u · er)rdA. (4.60)
Substituting the velocity given by (4.52a) into the second integral on the
right-hand side of (4.60) gives∫r→∞
(u · er)rdA = −(8/3)πCXX − iω
∫r→∞
(Y · er)rdA, (4.61)
and, as r →∞,
p→∫ r
[η∇2u+ iωρfu− (η/`2)(u+ iωv)− ρe∇ψ] · erdr′. (4.62)
Since ∇2u ∼ r−5 and ρe∇ψ decays exponentially, the r−2 decaying and grow-
ing contributions give
p = [iωρfCXr−2 − (η/`2)(CX + iωZX)r−2](X · er) + ω2ρfr(Y · er)
= iωρfCXr−2(X · er) + ω2ρfr(Y · er), (4.63)
and, finally, the force on the particle is
fX = −4πiωρfCXX. (4.64)
Note that the radially growing term in (4.63) cancels the surface integral on
the right-hand side of (4.61) when evaluating the force. Equation (4.64) has
59
the same form as for a Newtonian fluid, and is valid for both compressible and
incompressible polymer skeletons.
Superposing the E and Y problems with Y = −Z, and correctly ac-
counting for fluid and particle inertia (see Appendix 4.A), give
−4πiωρfCEE + 4πiωρfC
YZ = ω2VpZ(ρf − ρp), (4.65)
where Vp = (4/3)πa3 is the particle volume. Accordingly, the electric-field-
induced dynamic response is
Z/E = iCE/[iCY + ωa3(ρp − ρf )/(3ρf )]. (4.66)
Comparing this with (4.20) reveals that the equivalent bare Coulomb electrical
force is −4πiωρfCEE.
4.4 Far-field asymptotic analysis
In the numerical computation of CE and CY , the far-field boundary condi-
tions in § 4.3 cannot be applied directly, because more information concerning
the functional forms of the solutions as r →∞ is required to avoid numerical
instabilities.
Beyond the equilibrium double layer, i.e., where r a+κ−1, the equilib-
rium electrostatic potential ψ0 and ion concentrations n0j decay rapidly (expo-
nentially fast) to their far-field values (ψ0 → 0 and n0j → n∞j ) as r →∞, and
the equations governing the linearized perturbations simplify to two decoupled
sets. The first set comprises the Poisson and ion-conservation equations:
εsεo∇2ψ′ +N∑j=1
zjn′je = 0, (4.67a)
iωn′j + zjeDjn∞j (kT )−1∇2ψ′ +Dj∇2n′j = 0, (4.67b)
and the other is identical to (4.3a)–(4.3c) in § 4.2.
In contrast to the full electrokinetic model, these equations have analyti-
cal solutions. We start by considering the first set of equations involving the
60
perturbed potential ψ′′ and ion concentrations n′j, and then establish the con-
nection between the asymptotic forms of f,r, g1 and g2 given in § 4.3.2 and
the exact solution of the two-fluid model in § 4.2. A separate analysis for
incompressible skeletons follows.
4.4.1 Far-field decays of ψ and nj
Equations (4.67a) and (4.67b) can be written
εsεoL1ψ +N∑j=1
zjnje = 0, (4.68a)
DjL1nj − zje2Djn∞j (εsεokT )−1
N∑k=1
zknk + iωnj = 0, (4.68b)
or
L1
n1
n2
...
nN
ψ
+ P
n1
n2
...
nN
ψ
= 0, (4.69)
where
P =e2
εsεokT
iωεsεokTe2D1
− n∞1 z21 −n∞1 z1z2 . . . −z1n
∞1 z2 − n∞1 z1zN 0
−n∞2 z2z1iωεsεokTe2D2
− n∞2 z22 . . . −n∞2 z2zN 0
......
. . ....
...
−n∞N zNz1 −n∞N zNz2 . . . iωεsεokTe2DN
− n∞N z2N 0
z1kT/e z2kT/e . . . zNkT/e 0
.
(4.70)
Similarly to the incompressible problem, matrix P can be diagonalized as
P = Q
γ1 0 . . . 0
0 γ2 . . . 0...
.... . .
...
0 0 . . . γN+1
Q−1, (4.71)
61
where γk (k = 1, 2, . . . , N + 1) are the eigenvalues of P, and the kth column
of Q is the corresponding eigenvector. By setting
χ1
χ2
...
χN
χN+1
≡ Q−1
n1
n2
...
nN
ψ
, (4.72)
we obtain a set of simpler equations
L1χk + γkχk = 0 (k = 1, 2, . . . , N + 1), (4.73)
where χk = χk(r). Using standard techniques (Lamb 1945; Markov 2005;
Oestreicher 1951; Temkin & Leung 1976; MacRobert 1967), the solutions of
(4.73) are
χk(r) = Dkh(√γkr) when γk 6= 0 (4.74a)
χk(r) = Dkr−2 when γk = 0, (4.74b)
where Dk are unknown constants. From (4.70), P has only one γk = 0, and to
ensure decaying solutions as r →∞, Im(√γk) > 0 for all γk 6= 0.
Equation (4.73) demonstrates that χk are decoupled in the far field.
Therefore nj and ψ can be constructed by inverting (4.72). Dividing the
far-field expressions for χk by their first derivative eliminates the constants
Dk, and therefore the boundary conditions for χk as r →∞ are
χk − [h(√γkr)/h
′(√γkr)]χk,r = 0 at r = rmax when γk 6= 0, (4.75)
χk + (r/2)χk,r = 0 at r = rmax when γk = 0, (4.76)
where rmax is the maximum radial extent of the numerical calculations where
a ≤ r ≤ rmax. Note that the kth column of Q corresponding to γk = 0
has only one non-zero entry, which equals one, and the dipole strength of the
62
electrostatic potential is
DX = r2maxχk(rmax) when γk = 0 as rmax →∞. (4.77)
4.4.2 Far-field decays of f,r, g1 and g2
Since the electrical body force vanishes far from the particle, i.e., where
r a+ κ−1, the fluid velocity and polymer displacement in § 4.2 can be used
to construct f,r(r), g1(r) and g2(r) in the far field. These provide boundary
conditions at r = rmax for the numerical solution in the region where a ≤ r ≤
rmax with rmax a+ κ−1.
From § 4.3.2, the radial and tangential components of the fluid velocity
are
ur = [−2r−1f,r − iω(Y/X)]X cos θ, (4.78a)
uθ = [−r−1f,r − f,rr − iω(Y/X)](−X sin θ), (4.78b)
and the radial and tangential components of the polymer displacement are
vr = [g1 + g2 − (Y/X)]X cos θ, (4.78c)
vθ = [g1 − (Y/X)](−X sin θ). (4.78d)
Equating these to the exact solution in § 4.2 with X = Y gives
f∞,r = A1r−2 −B1h(K1r)−B2h(K2r), (4.79a)
g∞1 = mA1r−3 + A2r
−1h(kr)
+2∑j=1
MjBjKj[(Kjr)−1h(Kjr) + h′(Kjr)], (4.79b)
g∞2 = −3mA1r−3 + A2k[(kr)−1h(kr)− h′(kr)]
+2∑j=1
MjBjKj[(Kjr)−1h(Kjr)− h′(Kjr)], (4.79c)
where superscripts “∞” denote far-field asymptotic solutions. Similarly to the
numerical calculation of electrophoretic mobilities in Newtonian electrolytes,
the foregoing far-field asymptotic solutions each differ from their exact solution
63
by a multiplicative constant. Therefore, the boundary conditions at r = rmax
for the numerical computation of f,r(r), g1(r) and g2(r) are
f,r − (f∞,r /f∞,rr)f,rr = 0, (4.80a)
f,rr − (f∞,rr/f∞,rrr)f,rrr = 0, (4.80b)
g1 − (g∞1 /g∞1,r)g1,r = 0, (4.80c)
g2 − (g∞2 /g∞2,r)g2,r = 0, (4.80d)
and the asymptotic coefficient
CX = A1f,r(rmax)/f∞,r (rmax) as rmax →∞. (4.81)
4.4.3 Far-field analysis for incompressible hydrogels
The far-field decay of the fluid velocity and polymer displacement for
incompressible hydrogels is handled in a similar manner to § 4.3.3. As r →∞,
the combined fluid momentum and O(1) linear elasticity equations are
∇2
u
v0
+ ∇
−η−1p
∇ · v1
+ M
u
v0
= 0, (4.82)
where M is defined in (4.48). Diagonalizing M according to (4.49), and left-
multiplying by R−1, which is defined in (4.49), yield two decoupled equations
∇2wj + ∇qj + λ1wj = 0 (j = 1, 2), (4.83)
where w1
w2
= R−1
u
v0
and
q1
q2
= R−1
−η−1p
∇ · v1
. (4.84)
An incompressible fluid and polymer skeleton require ∇ · wj = 0 (j = 1, 2),
so the solutions are
wj = ∇Φj + ∇×Ψj +W j (j = 1, 2), (4.85)
64
where Φj are scalar potentials, Ψj = Ψjeφ are vector potentials, and W 1
W 2
= R−1
−iωY
Y
. (4.86)
Substituting the relations above into (4.83) and taking the curl yields
∇2Ψj + λjΨj = 0 (j = 1, 2), (4.87)
and incompressibility requires ∇2Φi = 0, so
Φj = A′jr−2Y cos θ, (4.88a)
Ψj = B′jh(Kjr)Y sin θ, (4.88b)
where A′j and B′j (j = 1, 2) are constants to match the boundary conditions at
r = a, and Kj =√λj with Im(Kj) > 0 to ensure vanishing polymer displace-
ment and fluid velocity as r → ∞. The radial and tangential components of
wj = ∇×∇× [hj(r)Y ] +W j are
wjr = [−2A′jr−3 + 2B′jr
−1h(Kjr) + (Wj/X)]X cos θ, (4.89a)
wjθ = A′jr−3 +B′jKj[(Kjr)−1h(Kjr) + h′(Kjr)] + (Wj/X)
×(−X sin θ). (4.89b)
Matching at r = rmax gives
h∞j,r = A′jr−2 −B′jh(Kjr) as rmax →∞, (4.90)
where the four constants A′j and B′j (j = 1, 2) are obtained from the boundary
conditions at r = a with X = Y as h∞1,r(a)
h∞2,r(a)
= R−1
−iωa/2
a/2
(4.91a)
and h∞1,rr(a)
h∞2,rr(a)
= R−1
−iω/2
1/2
. (4.91b)
65
Finally, the far-field boundary conditions for hj at r = rmax are
hj,r − (h∞j,r/h∞j,rr)hj,rr = 0 and hj,rr − (h∞j,rr/h
∞j,rrr)hj,rrr = 0 (j = 1, 2) (4.92)
and the asymptotic coefficient
CX =2∑j=1
R1jA′jhj,r(rmax)/h∞j,r(rmax) as rmax →∞, (4.93)
where R11 and R12 are elements of R.
4.5 Connection to electroacoustics
Here we show the close connection between the electroacoustic properties
of hydrogel-colloid composites and the dynamic electric-field-induced response
of a single particle addressed in § 4.3. Following O’Brien (1988, 1990), our
analysis is for composites with arbitrary colloid concentration. The macro-
scopic momentum, mass, and charge conservation equations, and suspension
constitutive equations from O’Brien (1990) can be directly applied to hydrogel-
colloid composites, since the elasticity of the polymer does not invalidate the
macroscopic equations. However, elasticity changes an integral that underlies
the electroacoustic reciprocal relation, which is crucial for subsequent simpli-
fications of the governing equations.
Electroacoustic signals originate from perturbations to an equilibrium
base state. To linear order, these perturbations satisfy
εsεo∇2ψ′ = −ρe′, (4.94a)
−iωn′j = −∇ · jj, (4.94b)
−iωρfu = ∇ · Tf − ρe′∇ψ0 − ρe0∇ψ′ − (η/`2)(u+ iωv), (4.94c)
0 = ∇ · u, (4.94d)
0 = ∇ · Te + (η/`2)(u+ iωv), (4.94e)
where the perturbed ion fluxes are
jj = −Dj∇n′j − zjeDj(kT )−1n′j∇ψ0 − zjeDj(kT )−1n0j∇ψ′ + n0
ju. (4.94f)
66
The primes denote perturbed quantities and the superscripts “0” denote the
equilibrium base state. The local current density in a harmonically oscillating
external field is (O’Brien 1988, 1986; DeLacey & White 1981)
i =N∑j=1
jjzje+ iωεoεs∇ψ′, (4.95)
and satisfies ∇ · i = 0.
Following O’Brien (1988, 1990), consider an integral over a representative
volume V enclosed by a surface A,
V −1
∫A
[u1 · Tf
2 − iωv1 · Te2 − i1ψ′2 −
N∑j=1
kT
n0j
n′j2(jj1 − n0ju1)
]· ndA (4.96)
for two systems “1” and “2”, where n is an outward unit normal. From
the linearly perturbed equations and Gauss’s divergence theorem, the integral
above is
V −1
∫Vh
[2ηef1 : ef2 − 2iωµee1 : ee2 + (η/`2)(u1 + iωv1) · (u2 + iωv2)
+N∑j=1
kT
Djn0j
(jj1 − n0ju1) · (jj2 − n0
ju2)
]dV
−iωV −1
∫Vh
[λ(∇ · v1)(∇ · v2) + ρfu1 · u2 + εoεs(∇ψ′1) · (∇ψ′2)
+N∑j=1
kT
n0j
n′j1n′j2
]dV
+V −1∑p
∫Ap
[u1 · Tf
2 − iωv1 · Te2 − i1ψ′2
−N∑j=1
kT
n0j
n′j2(jj1 − n0ju1)
]· ndA, (4.97)
where ef = (1/2)[∇u+ (∇u)T ] and ee = (1/2)[∇v + (∇v)T ]. Note that∑
p
indicates a sum over all the particles enclosed by A, Ap is the particle surface
within and intersecting A, and Vh is the hydrogel volume excluding particles
enclosed by A. According to O’Brien (1990), exchanging indices “1” and “2”
in (4.97) does not change the integral.
67
If the surface A is large enough to contain many particles, and its radius
of curvature is everywhere greater than the length scales associated with fluc-
tuations of the perturbed quantities, it is a “macroscopic boundary” and can
be divided into portions that are small enough to neglect their curvature, but
large enough to average the perturbed quantities (O’Brien 1979). Also, for an
incompressible fluid, we need to ensure that the size of A is smaller than the
sound wave length (O’Brien 1988). With these constraints, and an assumption
of statistical homogeneity, (4.96) is
〈u〉1 ·∇〈p〉2 + 〈i〉1 · 〈E〉2, (4.98)
where the angled brackets denote volume averaged quantities,
〈·〉 ≡ V −1
∫V
(·)dV. (4.99)
Note that only terms that grow with r contribute to the integral in (4.96) over
the macroscopic surface A, and consequently the second and fourth terms in
(4.96) are negligibly small. Surprisingly, although the polymer displacement v
and elastic stress tensor Te enter the integral in (4.96), they do not contribute
to (4.98).
Since disturbances to the hydrogel-colloid composite can only be intro-
duced through external electric fields and sound waves (pressure gradients),
the electroacoustic constitutive relations are the same as for colloidal disper-
sions, i.e.,
〈U〉 = α∇〈p〉+ µd〈E〉 and 〈i〉 = γ∇〈p〉+K∗〈E〉, (4.100)
where α, µd, γ and K∗ are composite transport properties: K∗ is the complex
conductivity and µd is the particle dynamic electrophoretic mobility. Note
that 〈U〉 is the particle velocity averaged over all particles in V (O’Brien
et al. 2003); it is connected to the average fluid velocity 〈u〉 via the mass
68
averaged momentum
〈ρ0〉u ≡ 〈ρu〉 = ρf〈u〉+ (ρp − ρf )φ〈U〉, (4.101)
where 〈ρ0〉 is the equilibrium composite density, ρ is the position dependent
local density, and φ is the particle volume fraction.
Setting 〈E〉1 = ∇〈p〉2 = 0 for the two systems that differ only by the
boundary conditions due to external fields, and noting that (4.98) is indepen-
dent of an exchange of indices, it follows that
〈u〉2 ·∇〈p〉1 = 〈i〉1 · 〈E〉2. (4.102)
Therefore, from the macroscopic momentum conservation equation (O’Brien
1990, § 3), u = 0 if ∇〈p〉 = 0, and together with (4.100)–(4.102) we have
γ = ρ−1f (ρp − ρf )φµd. (4.103)
This is the same as O’Brien’s formula for colloidal dispersions (O’Brien 1990,
§ 5), so his subsequent analysis for particulate suspensions is applicable to
hydrogel-colloid composites. Accordingly, the elasticity introduced by the
polymer skeleton only affects the electroacoustic response through the dy-
namic electrophoretic mobility
µd = −iω(Z/E), (4.104)
with all other macroscopic relations the same as for Newtonian colloidal dis-
persions.
One concern with electroacoustic characterization of hydrogel-colloid com-
posites is whether the pressure fluctuations in an ESA experiment are measur-
able. Therefore, in § 4.7 we compare the dynamic electrophoretic mobilities
of particles in hydrogels and Newtonian fluids at the operating frequencies of
commercial electroacoustic instruments. Noteworthy is that the mobility for
69
hydrogel composites has a comparable amplitude to those of Newtonian dis-
persions, but with characteristics that are sensitive to the shear modulus of the
polymer skeleton. Moreover, in the relevant frequency range, the response for
particles with κa 1 can be captured with the following analytical solution
of the electrokinetic model.
4.6 High-frequency boundary-layer approximation
In this section we derive an approximate expression for the frequency de-
pendent response Z/E when κa 1 and a `. The dynamics of the diffuse
double layer are calculated using the surface conduction model of O’Brien
(1986), which is valid when ω a−2D. With a ∼ 1 µm and D ∼ 10−9 m2 s−1,
the model is valid at frequencies beyond the kHz range where colloidal dy-
namics are accessed as dynamic electrophoretic mobilities in electroacoustic
experiments.
We solve this problem using the decomposition and superposition tech-
niques outlined in § 4.3. Briefly, the approximate asymptotic coefficients for
the E and Y sub-problems are calculated, and the response Z/E is obtained
by the superposition leading to (4.66). For the Y sub-problem with κa 1,
we neglect the influence of surface charge, so the full model reduces to the
two-fluid model addressed in § 4.2. In this case, CY = A1, where A1 is given
in (4.18a). For the E sub-problem, we calculate the polymer displacement
and fluid velocity inside the thin double layer, and match the inner and outer
solutions to obtain CE.
In our earlier publication (Wang & Hill 2008), we derived a boundary-layer
approximation for the steady response Z/E given in (4.1). The contribution
that depends on the particle size, and permeability and compressibility of the
hydrogel, arises from terms in the inner solution that are O[(κa)−1] smaller
than the leading-order terms as κa → ∞. Note that hydrogel compressibil-
ity is important only if ω . τ−1d . Moreover, hydrogel-colloid composites with
a ∼ 1 µm, ` ∼ 10 nm, E ∼ 1 kPa and ν ∼ 0.2 have a reciprocal draining
time τ−1d ∼ 1 kHz that is comparable to the lower frequency limit of O’Brien’s
70
surface conduction model. Therefore, under conditions where the surface con-
duction model is valid, the hydrogel can also be considered incompressible.
Accordingly, with ω & τ−1d it is reasonable to neglect the O[(κa)−1] terms in
the inner solution, which tremendously simplifies the resulting expression for
Z/E.
As shown by O’Brien (1988), perturbations to the equilibrium ion con-
centrations in the inner and outer regions are negligible at the frequencies of
interest for electroacoustics, so they do not enter the fluid momentum equation.
Therefore, the perturbed electrostatic potential ψ′ satisfies Laplace’s equation
outside the equilibrium diffuse double layer. Accordingly, in the outer region
ψ′ = −rE cos θ − a3Pr−2E cos θ, (4.105)
where P is the dipole strength. Analysis of conduction within a thin surface
layer (O’Konski 1960) gives
P =(1− iω′)− (2Du− iω′εp/εs)
2(1− iω′) + (2Du− iω′εp/εs), (4.106)
where ω′ = ωεsεo/σ∞, σ∞ =
∑Nj=1 z
2jn∞j Dje
2/(kT ) is the bulk conductiv-
ity, and Du = σs/(σ∞a) is the Dukhin number (Lyklema 1995). The con-
nection between the surface conductivity σs and the ζ-potential is addressed
below (Hunter 2001; Lyklema 1995).
Adopting standard boundary-layer scaling (Pozrikidis 1996), the fluid mo-
mentum and linear elasticity equations (radial and tangential directions) in the
inner region where κ(r − a) 1 are
−p,r − ρe0ψ′,r = 0, (4.107a)
−a−1p,θ + ηuθ,rr − ρe0a−1ψ′,θ − (η/`2)(uθ + iωvθ) = 0, (4.107b)
(2µ+ λ)vr,rr + (µ+ λ)(a sin θ)−1(vθ sin θ),rθ
+(η/`2)(ur + iωvr) = 0, (4.107c)
µvθ,rr + (η/`2)(uθ + iωvθ) = 0, (4.107d)
71
with fluid continuity equation
vr,r + (a sin θ)−1(uθ sin θ),θ = 0. (4.107e)
Note that the equilibrium charge density ρe0 = −κ2εsεoζ exp[−κ(r− a)] when
|ζ| kT/e and κa 1 (Hunter 2001), and fluid inertia has been neglected
inside the double layer, since it is important only beyond the GHz range (Hill
et al. 2003b). For simplicity, we addresses the inner problem when |ζ| kT/e
before considering higher ζ-potentials.
Since p and ψ′ both vary on the length scale of the particle size a, to lead-
ing order they are radially invariant in the inner region. Therefore, (4.107a)
gives p = pE cos θ, where p is a constant. By setting uθ = uθ(y)E sin θ and
vθ = vθ(y)E sin θ, where y = r − a, the tangential equations (4.107b) and
(4.107d) become
ηuθ,yy − (η/`2)(uθ + iωvθ) + a−1p+ ζκ2εsεo(1 + P ) exp(−κy) = 0, (4.108)
µvθ,yy + (η/`2)(uθ + iωvθ) = 0. (4.109)
With boundary conditions vθ = uθ = 0 at y = 0, and finite vθ and uθ as
y →∞, the solutions are
uθ = iωεsεoζ(1 + P )(µ− iωη)−1[exp(−κy)− 1]
−µc1η−1 exp(−sy) + pµ[ηa(µ− iωη)s2]−1
+µκ2εoεsζ(1 + P )[η(µ− iωη)(s2 − κ2)]−1 exp(−κy), (4.110)
vθ = −εsεoζ(1 + P )(µ− iωη)−1[exp(−κy)− 1]
+c1 exp(−sy)− p[a(µ− iωη)s2]−1
−κ2εoεsζ(1 + P )[(µ− iωη)(s2 − κ2)]−1 exp(−κy), (4.111)
where s2 = (µ− iωη)(µ`2)−1 with Re(s) > 0. The no-slip boundary conditions
at y = 0 require
c1 = p[(µ− iωη)s2a]−1 + κ2εsεoζ(1 + P )[(µ− iωη)(s2 − κ2)]−1. (4.112)
72
For the inner solution to be finite as y → ∞, the terms that are linear and
quadratic in y must be neglected. Integrating (4.107e) gives ur = ur(y)E cos θ,
where
ur = −2a−1
∫ y
0
uθ(y′)dy′
= 2εsεoζ(1 + P )[κa(µ− iωη)]−1iω + µκ2[η(s2 − κ2)]−1[exp(−κy)− 1]
−2µc1(ηsa)−1[exp(−sy)− 1]. (4.113)
Note that setting ω = 0 recovers the steady solutions derived in earlier works (Wang
& Hill 2008; Hill 2006b).
Finally, integrating (4.107c) gives vr = vr(y)E cos θ, where
vr = c2 exp(−ny)− a1(n2 − κ2)−1 exp(−κy)
−a2(n2 − s2)−1 exp(−sy) + a3[n−2 − (n2 − κ2) exp(−κy)]
+a4[n−2 − (n2 − s2) exp(−sy)] (4.114)
with n2 = −iωη[`2(2µ+ λ)]−1 and Re(n) > 0,
a1 = −(µ+ λ)κεsεoζ(1 + P )[a(2µ+ λ)(µ− iωη)]−1
×[1 + κ2(s2 − κ2)−1], (4.115a)
a2 = (µ+ λ)sc1[a(2µ+ λ)]−1, (4.115b)
a3 = −ηεsεoζ(1 + P )[κa`2(2µ+ λ)(µ− iωη)]−1
×iω + µκ2[η(s2 − κ2)]−1, (4.115c)
a4 = µc1[`2sa(2µ+ λ)]−1, (4.115d)
and c2 is chosen to ensure vr = 0 at y = 0.
73
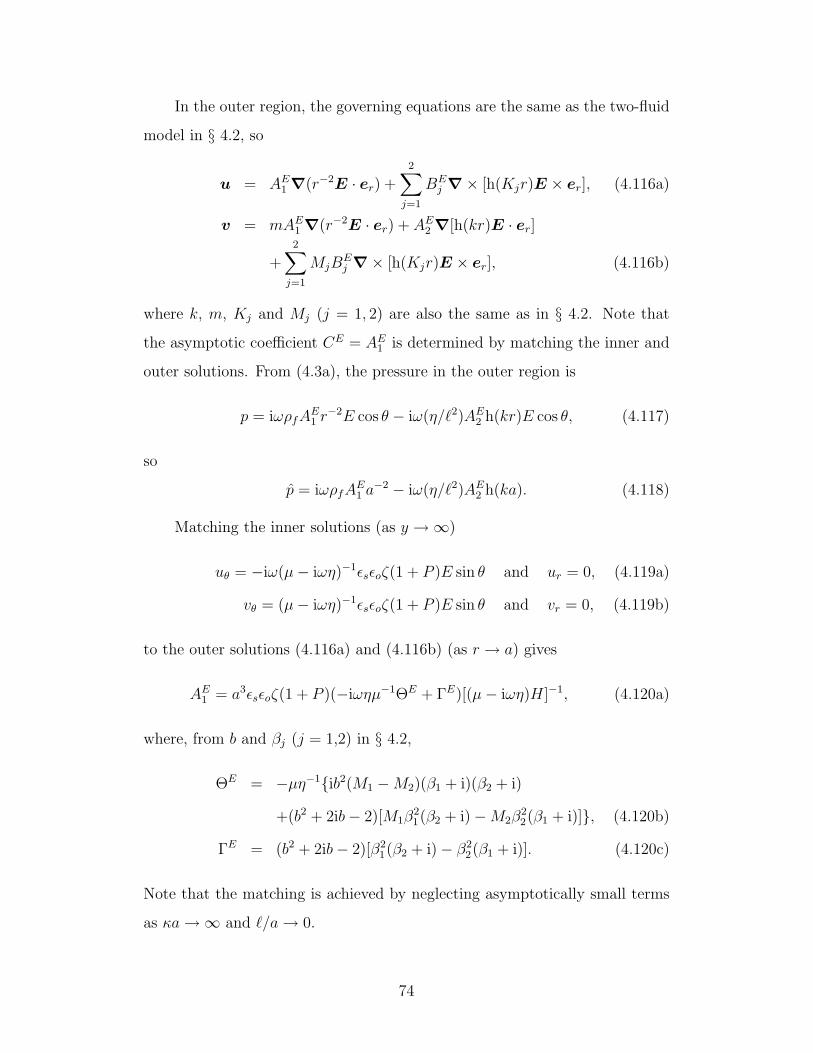
In the outer region, the governing equations are the same as the two-fluid
model in § 4.2, so
u = AE1 ∇(r−2E · er) +2∑j=1
BEj ∇× [h(Kjr)E × er], (4.116a)
v = mAE1 ∇(r−2E · er) + AE2 ∇[h(kr)E · er]
+2∑j=1
MjBEj ∇× [h(Kjr)E × er], (4.116b)
where k, m, Kj and Mj (j = 1, 2) are also the same as in § 4.2. Note that
the asymptotic coefficient CE = AE1 is determined by matching the inner and
outer solutions. From (4.3a), the pressure in the outer region is
p = iωρfAE1 r−2E cos θ − iω(η/`2)AE2 h(kr)E cos θ, (4.117)
so
p = iωρfAE1 a−2 − iω(η/`2)AE2 h(ka). (4.118)
Matching the inner solutions (as y →∞)
uθ = −iω(µ− iωη)−1εsεoζ(1 + P )E sin θ and ur = 0, (4.119a)
vθ = (µ− iωη)−1εsεoζ(1 + P )E sin θ and vr = 0, (4.119b)
to the outer solutions (4.116a) and (4.116b) (as r → a) gives
AE1 = a3εsεoζ(1 + P )(−iωηµ−1ΘE + ΓE)[(µ− iωη)H]−1, (4.120a)
where, from b and βj (j = 1,2) in § 4.2,
ΘE = −µη−1ib2(M1 −M2)(β1 + i)(β2 + i)
+(b2 + 2ib− 2)[M1β21(β2 + i)−M2β
22(β1 + i)], (4.120b)
ΓE = (b2 + 2ib− 2)[β21(β2 + i)− β2
2(β1 + i)]. (4.120c)
Note that the matching is achieved by neglecting asymptotically small terms
as κa→∞ and `/a→ 0.
74
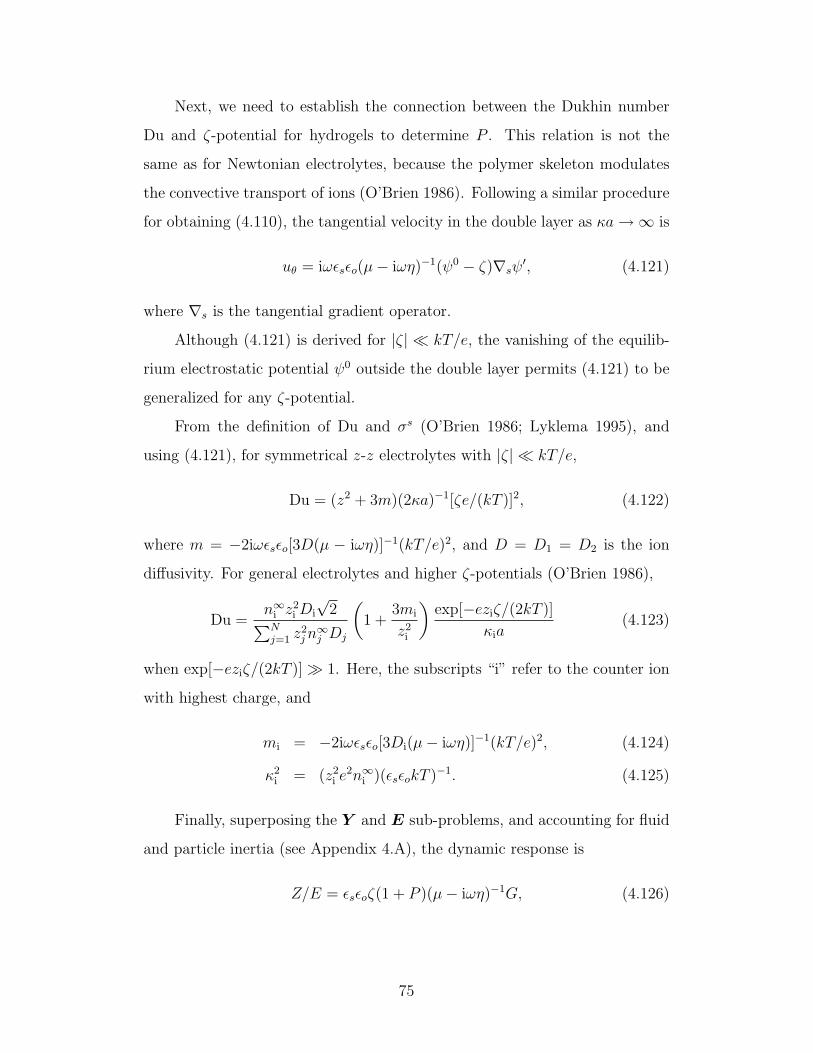
Next, we need to establish the connection between the Dukhin number
Du and ζ-potential for hydrogels to determine P . This relation is not the
same as for Newtonian electrolytes, because the polymer skeleton modulates
the convective transport of ions (O’Brien 1986). Following a similar procedure
for obtaining (4.110), the tangential velocity in the double layer as κa→∞ is
uθ = iωεsεo(µ− iωη)−1(ψ0 − ζ)∇sψ′, (4.121)
where ∇s is the tangential gradient operator.
Although (4.121) is derived for |ζ| kT/e, the vanishing of the equilib-
rium electrostatic potential ψ0 outside the double layer permits (4.121) to be
generalized for any ζ-potential.
From the definition of Du and σs (O’Brien 1986; Lyklema 1995), and
using (4.121), for symmetrical z-z electrolytes with |ζ| kT/e,
Du = (z2 + 3m)(2κa)−1[ζe/(kT )]2, (4.122)
where m = −2iωεsεo[3D(µ − iωη)]−1(kT/e)2, and D = D1 = D2 is the ion
diffusivity. For general electrolytes and higher ζ-potentials (O’Brien 1986),
Du =n∞i z
2i Di
√2∑N
j=1 z2jn∞j Dj
(1 +
3mi
z2i
)exp[−eziζ/(2kT )]
κia(4.123)
when exp[−eziζ/(2kT )] 1. Here, the subscripts “i” refer to the counter ion
with highest charge, and
mi = −2iωεsεo[3Di(µ− iωη)]−1(kT/e)2, (4.124)
κ2i = (z2
i e2n∞i )(εsεokT )−1. (4.125)
Finally, superposing the Y and E sub-problems, and accounting for fluid
and particle inertia (see Appendix 4.A), the dynamic response is
Z/E = εsεoζ(1 + P )(µ− iωη)−1G, (4.126)
75
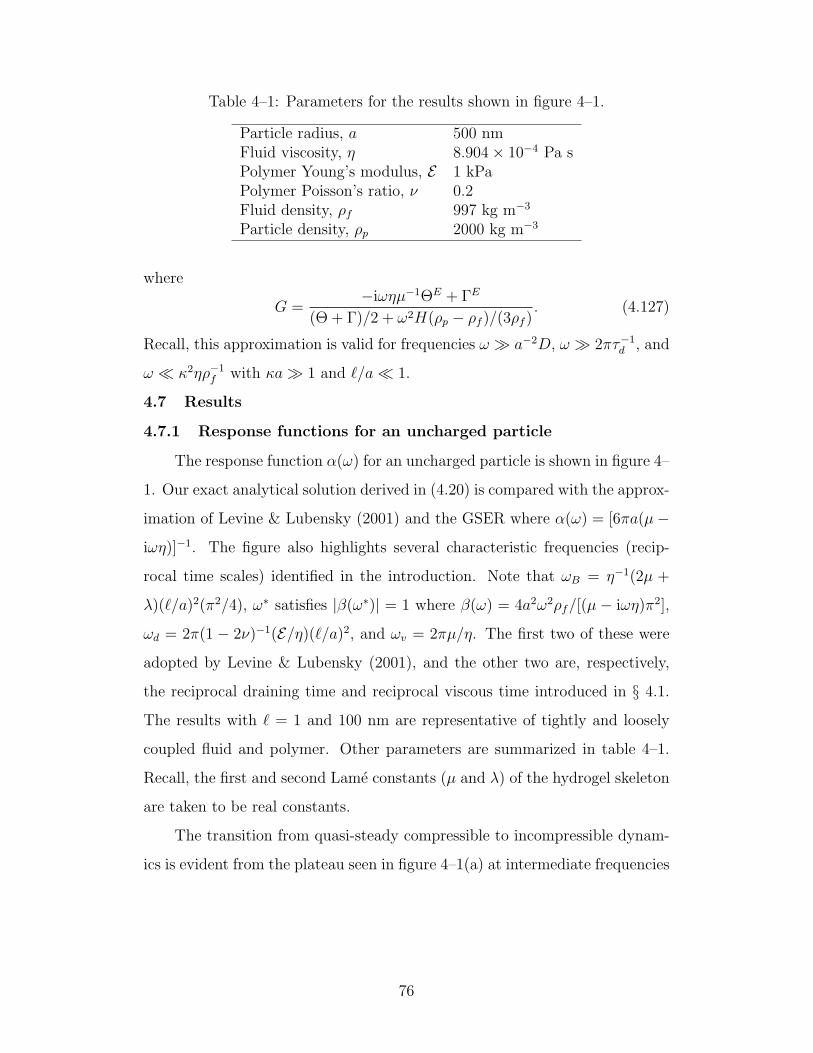
Table 4–1: Parameters for the results shown in figure 4–1.
Particle radius, a 500 nmFluid viscosity, η 8.904× 10⁻⁴ Pa sPolymer Young’s modulus, E 1 kPaPolymer Poisson’s ratio, ν 0.2Fluid density, ρf 997 kg m−3
Particle density, ρp 2000 kg m−3
where
G =−iωηµ−1ΘE + ΓE
(Θ + Γ)/2 + ω2H(ρp − ρf )/(3ρf ). (4.127)
Recall, this approximation is valid for frequencies ω a−2D, ω 2πτ−1d , and
ω κ2ηρ−1f with κa 1 and `/a 1.
4.7 Results
4.7.1 Response functions for an uncharged particle
The response function α(ω) for an uncharged particle is shown in figure 4–
1. Our exact analytical solution derived in (4.20) is compared with the approx-
imation of Levine & Lubensky (2001) and the GSER where α(ω) = [6πa(µ−
iωη)]−1. The figure also highlights several characteristic frequencies (recip-
rocal time scales) identified in the introduction. Note that ωB = η−1(2µ +
λ)(`/a)2(π2/4), ω∗ satisfies |β(ω∗)| = 1 where β(ω) = 4a2ω2ρf/[(µ − iωη)π2],
ωd = 2π(1 − 2ν)−1(E/η)(`/a)2, and ωv = 2πµ/η. The first two of these were
adopted by Levine & Lubensky (2001), and the other two are, respectively,
the reciprocal draining time and reciprocal viscous time introduced in § 4.1.
The results with ` = 1 and 100 nm are representative of tightly and loosely
coupled fluid and polymer. Other parameters are summarized in table 4–1.
Recall, the first and second Lame constants (µ and λ) of the hydrogel skeleton
are taken to be real constants.
The transition from quasi-steady compressible to incompressible dynam-
ics is evident from the plateau seen in figure 4–1(a) at intermediate frequencies
76
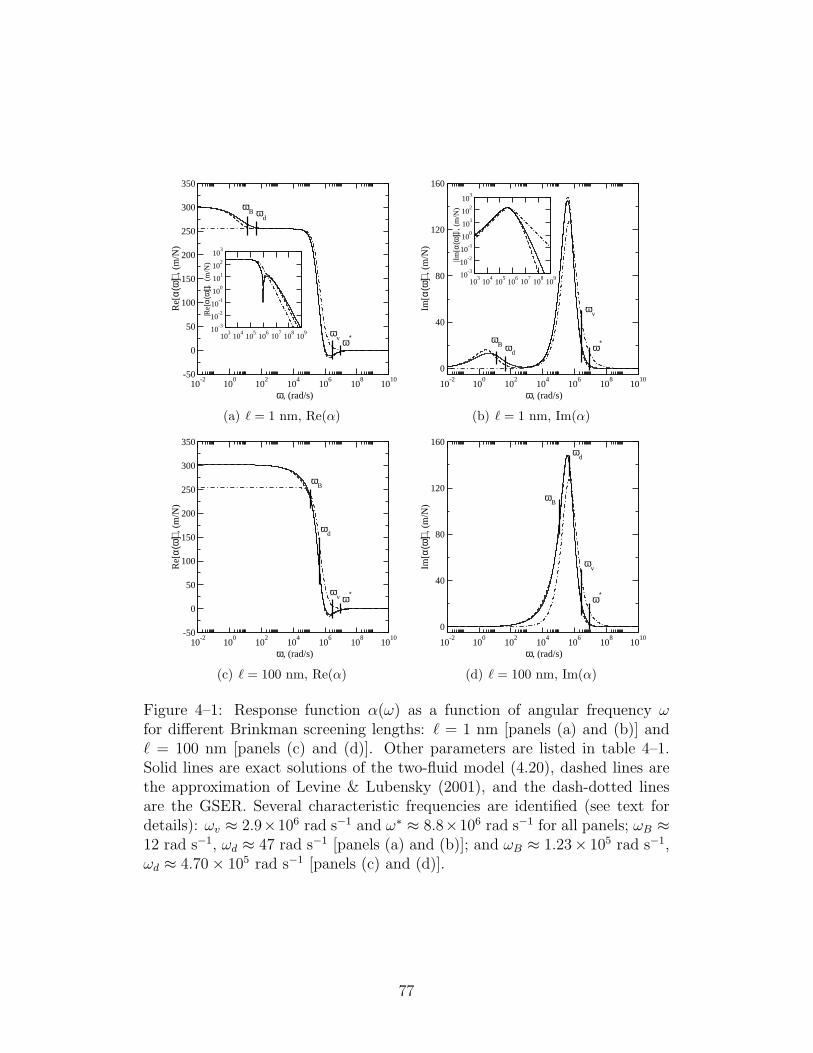
10-2
100
102
104
106
108
1010
ω, (rad/s)
-50
0
50
100
150
200
250
300
350R
e[α(
ω)]
, (m
/N)
103
104
105
106
107
108
10910
-3
10-2
10-1
100
101
102
103
|Re[
α(ω
)]|,
(m/N
)ω
B ωd
ωv ω∗
(a) ` = 1 nm, Re(α)
10-2
100
102
104
106
108
1010
ω, (rad/s)
0
40
80
120
160
Im[α
(ω)]
, (m
/N)
103
104
105
106
107
108
10910
-3
10-2
10-1
100
101
102
103
|Im[α
(ω)]
|, (m
/N)
ωB ω
d
ωv
ω∗
(b) ` = 1 nm, Im(α)
10-2
100
102
104
106
108
1010
ω, (rad/s)
-50
0
50
100
150
200
250
300
350
Re[
α(ω
)], (
m/N
)
ωB
ωd
ωv ω∗
(c) ` = 100 nm, Re(α)
10-2
100
102
104
106
108
1010
ω, (rad/s)
0
40
80
120
160
Im[α
(ω)]
, (m
/N)
ωB
ωd
ωv
ω∗
(d) ` = 100 nm, Im(α)
Figure 4–1: Response function α(ω) as a function of angular frequency ωfor different Brinkman screening lengths: ` = 1 nm [panels (a) and (b)] and` = 100 nm [panels (c) and (d)]. Other parameters are listed in table 4–1.Solid lines are exact solutions of the two-fluid model (4.20), dashed lines arethe approximation of Levine & Lubensky (2001), and the dash-dotted linesare the GSER. Several characteristic frequencies are identified (see text fordetails): ωv ≈ 2.9×10⁶ rad s−1 and ω∗ ≈ 8.8×10⁶ rad s−1 for all panels; ωB ≈12 rad s−1, ωd ≈ 47 rad s−1 [panels (a) and (b)]; and ωB ≈ 1.23× 10⁵ rad s−1,ωd ≈ 4.70× 10⁵ rad s−1 [panels (c) and (d)].
77

with ` = 1 nm. When ` = 100 nm, however, the draining time τd is compa-
rable to the viscous time τv, so the low-frequency plateau (compressible elas-
tic regime) in figure 4–1(c) transits to the high-frequency viscous dominated
regime without an intermediate (incompressible elastic) plateau.
The real parts of the quasi-steady compressible and quasi-steady incom-
pressible elastic plateaus differ by at most 25%, as predicted by Schnurr et al.
(1997). This relatively small change is often used to justify neglecting com-
pressibility when interpreting optical and magnetic tweezers microrheology
experiments (Schnurr et al. 1997; Ziemann et al. 1994). However, if the exter-
nal force is accompanied by electroosmotic flow, the effect of compressibility
is much more significant when κa & 1 (Wang & Hill 2008). This is explored
when we address the electric-field-induced response.
Levine and Lubensky’s approximation is valid when fluid inertia can be
neglected. Accordingly, it agrees well with the exact solution when ω ω∗.
As seen in the insets of figures 4–1(a) and 4–1(b), which have logarithmic
axes, Levine and Lubensky’s theory yields increasingly large relative errors
at higher frequencies. However, the absolute displacement is practically zero
at such high frequencies, so the errors are of minor concern for magnetic and
optical microrheology, but have important consequences for electroacoustics.
Earlier studies suggest the GSER is valid at frequencies between ωB and
ω∗ (Levine & Lubensky 2001, 2000). However, our exact results in figure 4–
1 show that the GSER is a good approximation only when the quasi-steady
incompressible elastic plateau is present. At higher frequencies, the GSER de-
viates from the exact solution at frequencies well below ω∗, because it does not
account for fluid or particle inertia. Consequently, our calculations reveal that
the frequency range of validity for the GSER is considerably narrower than
previously expected. Also, the characteristic frequencies ωB and ω∗ intro-
duced by Levine & Lubensky (2001) are similar here to ωd and ωv adopted in
this work; they are practically equivalent for mapping out the experimentally
accessible parameter space.
78
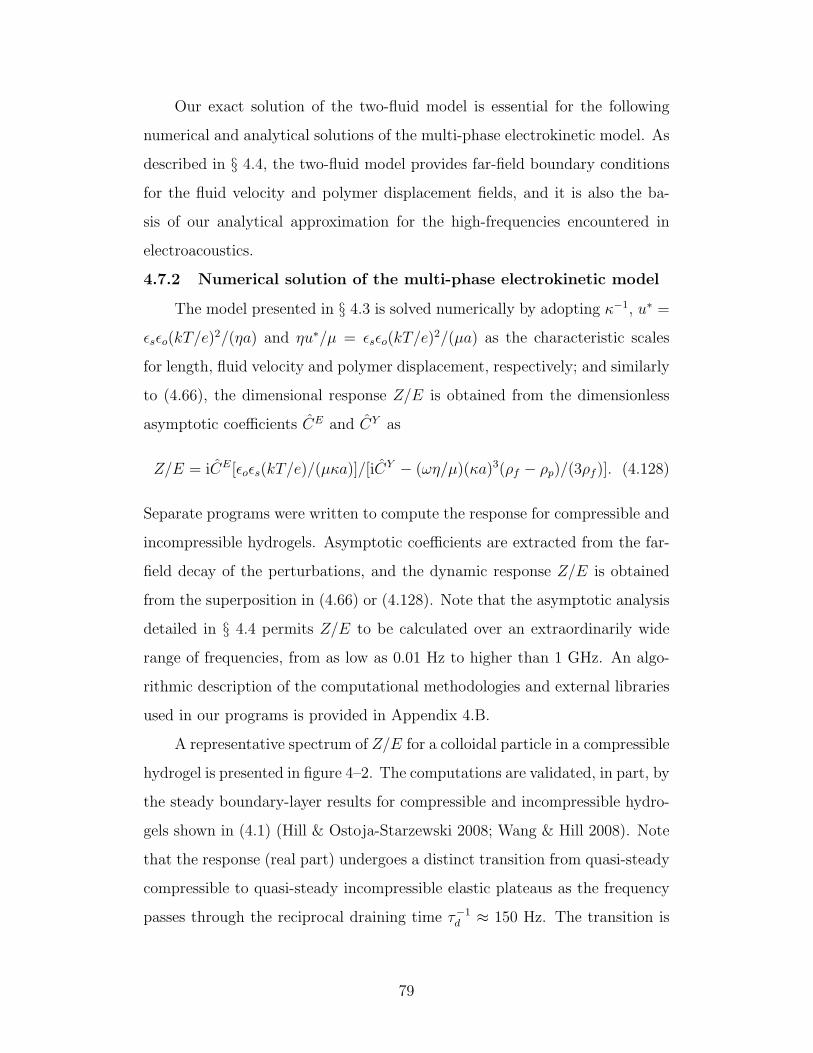
Our exact solution of the two-fluid model is essential for the following
numerical and analytical solutions of the multi-phase electrokinetic model. As
described in § 4.4, the two-fluid model provides far-field boundary conditions
for the fluid velocity and polymer displacement fields, and it is also the ba-
sis of our analytical approximation for the high-frequencies encountered in
electroacoustics.
4.7.2 Numerical solution of the multi-phase electrokinetic model
The model presented in § 4.3 is solved numerically by adopting κ−1, u∗ =
εsεo(kT/e)2/(ηa) and ηu∗/µ = εsεo(kT/e)
2/(µa) as the characteristic scales
for length, fluid velocity and polymer displacement, respectively; and similarly
to (4.66), the dimensional response Z/E is obtained from the dimensionless
asymptotic coefficients CE and CY as
Z/E = iCE[εoεs(kT/e)/(µκa)]/[iCY − (ωη/µ)(κa)3(ρf − ρp)/(3ρf )]. (4.128)
Separate programs were written to compute the response for compressible and
incompressible hydrogels. Asymptotic coefficients are extracted from the far-
field decay of the perturbations, and the dynamic response Z/E is obtained
from the superposition in (4.66) or (4.128). Note that the asymptotic analysis
detailed in § 4.4 permits Z/E to be calculated over an extraordinarily wide
range of frequencies, from as low as 0.01 Hz to higher than 1 GHz. An algo-
rithmic description of the computational methodologies and external libraries
used in our programs is provided in Appendix 4.B.
A representative spectrum of Z/E for a colloidal particle in a compressible
hydrogel is presented in figure 4–2. The computations are validated, in part, by
the steady boundary-layer results for compressible and incompressible hydro-
gels shown in (4.1) (Hill & Ostoja-Starzewski 2008; Wang & Hill 2008). Note
that the response (real part) undergoes a distinct transition from quasi-steady
compressible to quasi-steady incompressible elastic plateaus as the frequency
passes through the reciprocal draining time τ−1d ≈ 150 Hz. The transition is
79
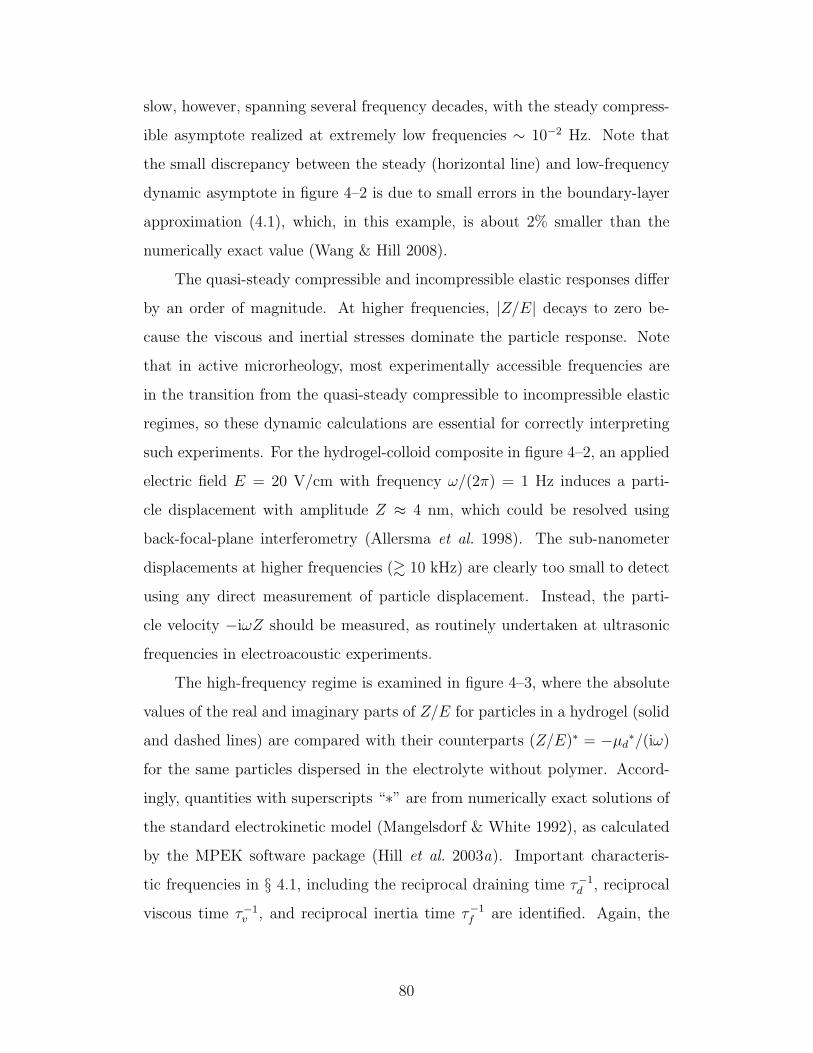
slow, however, spanning several frequency decades, with the steady compress-
ible asymptote realized at extremely low frequencies ∼ 10−2 Hz. Note that
the small discrepancy between the steady (horizontal line) and low-frequency
dynamic asymptote in figure 4–2 is due to small errors in the boundary-layer
approximation (4.1), which, in this example, is about 2% smaller than the
numerically exact value (Wang & Hill 2008).
The quasi-steady compressible and incompressible elastic responses differ
by an order of magnitude. At higher frequencies, |Z/E| decays to zero be-
cause the viscous and inertial stresses dominate the particle response. Note
that in active microrheology, most experimentally accessible frequencies are
in the transition from the quasi-steady compressible to incompressible elastic
regimes, so these dynamic calculations are essential for correctly interpreting
such experiments. For the hydrogel-colloid composite in figure 4–2, an applied
electric field E = 20 V/cm with frequency ω/(2π) = 1 Hz induces a parti-
cle displacement with amplitude Z ≈ 4 nm, which could be resolved using
back-focal-plane interferometry (Allersma et al. 1998). The sub-nanometer
displacements at higher frequencies (& 10 kHz) are clearly too small to detect
using any direct measurement of particle displacement. Instead, the parti-
cle velocity −iωZ should be measured, as routinely undertaken at ultrasonic
frequencies in electroacoustic experiments.
The high-frequency regime is examined in figure 4–3, where the absolute
values of the real and imaginary parts of Z/E for particles in a hydrogel (solid
and dashed lines) are compared with their counterparts (Z/E)∗ = −µd∗/(iω)
for the same particles dispersed in the electrolyte without polymer. Accord-
ingly, quantities with superscripts “∗” are from numerically exact solutions of
the standard electrokinetic model (Mangelsdorf & White 1992), as calculated
by the MPEK software package (Hill et al. 2003a). Important characteris-
tic frequencies in § 4.1, including the reciprocal draining time τ−1d , reciprocal
viscous time τ−1v , and reciprocal inertia time τ−1
f are identified. Again, the
80
10-2
100
102
104
106
108
frequency, (Hz)
0
0.05
0.1
0.15
0.2
0.25
0.3
-Z/E
, [nm
/(V
/cm
)]
10-2
100
102
104
106
10810
-6
10-5
10-4
10-3
10-2
10-1
100
| Z/E
|, [
nm/(
V/c
m)]
Figure 4–2: Representative frequency spectrum of Z/E for a charged colloidalsphere embedded in an uncharged, compressible electrolyte-saturated hydro-gel: NaCl at T = 298 K; a = 500 nm; κa = 500; −ζe/(kT ) = 3; ` = 5 nm;ρp = 1050 kg m−3, ν = 0.2; and E = 800 Pa. Solid and dashed lines are thereal and imaginary parts of Z/E from numerically exact solutions of the fullmulti-phase electrokinetic model; and dash-dotted lines are from (4.1) withν = 0.2 and 0.5.
transition from quasi-steady compressible to quasi-steady incompressible elas-
tic dynamics is clearly evident as the frequency passes through τ−1d ≈ 150 Hz.
More importantly, this figure highlights the transition from quasi-steady elas-
tic to viscous dynamics as the frequency passes through τ−1v ≈ 370 kHz. At
frequencies beyond τ−1f ≈ 3.6 MHz, both the real and imaginary parts of Z/E
equal their (Z/E)∗ counterparts. Therefore, it is only at these ∼MHz frequen-
cies that the electroacoustic response of the hydrogel composite is the same as
for its respective colloidal dispersion (Hunter 1998; O’Brien 1988). Moreover,
at lower frequencies, the electroacoustic response probes the shear modulus of
the polymer skeleton and the size and charge of the inclusions.
Having identified several qualitative features of a typical frequency spec-
trum, let us explore the influences of various parameters. First, figure 4–4
shows how Poisson’s ratio, increasing from 0 to 0.5 with fixed shear modulus
µ ≈ 0.333 kPa, affects the response. Recall, the spectrum for the incom-
pressible hydrogel (ν = 0.5) was calculated using an independently developed
81

10-2
100
102
104
106
108
frequency, (Hz)
10-6
10-5
10-4
10-3
10-2
10-1
100
| Z/E
|, [
nm/(
V/c
m)]
τv
-1
τd
-1
τf
-1
Figure 4–3: Comparison of Z/E for a compressible hydrogel with the response(Z/E)∗ = −µd∗/(iω) for a classical Newtonian dispersion. Parameters are thesame as in figure 4–2. Solid and dashed lines are the real and imaginary partsof Z/E from numerically exact solutions of the full multi-phase electrokineticmodel. Dash-dotted and dash-double-dotted lines are the real and imaginaryparts of (Z/E)∗ = −µd∗/(iω) calculated from the MPEK software package(Hill et al. 2003a).
program based on the theory in § 4.3.3 and § 4.4.3. Comparing the spectra for
ν = 0.5 and ν < 0.5 provides an important consistency check on our numeri-
cal computations, since the methodologies for compressible and incompressible
skeletons are distinct. In general, Z/E can vary with Poisson’s ratio by up
to an order of magnitude at frequencies below the reciprocal draining time.
The response is clearly very sensitive to Poisson’s ratio as ν → 0.5 at these
frequencies. At higher frequencies, however, Z/E is independent of Poisson’s
ratio with fixed shear modulus µ, because the compressible polymer skeleton
is hydrodynamically coupled to the incompressible fluid.
Next, figure 4–5 shows how Young’s modulus affects the response spec-
trum. As expected from the steady displacement (Hill & Ostoja-Starzewski
2008; Wang & Hill 2008), the response is indeed inversely proportional to
the elastic modulus at frequencies below the reciprocal viscous time τ−1v . In
addition, the elastic modulus changes both the draining and viscous times.
Accordingly, the spectra in figure 4–5 overlap at frequencies below τ−1v when
82
10-2
100
102
104
106
108
frequency, (Hz)
0
0.1
0.2
0.3
0.4
-Z/E
, [nm
/(V
/cm
)]
10-2
100
102
104
106
10810
-6
10-5
10-4
10-3
10-2
10-1
100
| Z/E
|, [
nm/(
V/c
m)]
0
0.1
0.2
0.3
0.4
0.5
Figure 4–4: Frequency spectra of Z/E for various Poisson ratios ν = 0, 0.1,0.2, 0.3, 0.4, and 0.5 with a fixed shear modulus µ = E/(2 + 2ν) ≈ 333 Pa.All other parameters are the same as in figure 4–2. Solid and dashed lines thereal and imaginary parts of Z/E from numerically exact solutions of the fullmulti-phase electrokinetic model.
multiplying Z/E by E and dividing the frequency ω/(2π) by E . Noteworthy
from the perspective of electroacoustics is that the real part of Z/E (solid
lines) is sensitive to E at ultrasonic frequencies, whereas the imaginary part
(dashed lines) is practically independent of E .
The influences of the scaled ζ-potential ζe/(kT ) and scaled reciprocal
double layer thickness κa on Z/E are examined in figure 4–6. Note that our
computational methodology is stable and accurate for all κa & 1. When κa .
1, however, electro-osmotic flow is extremely weak and the dynamic response
can be approximated by (4.21). Situations of practical significance most often
occur when κa & 1, so figure 4–6 presents spectra for six values of κa in the
range 1–500. When κa is large, electroosmotic flow significantly affects the
particle displacement in the quasi-steady compressible elastic regime in the
same manner as for steady electric fields (Wang & Hill 2008). Consequently,
the displacement at frequencies below the reciprocal draining time increases
with κa relative to the respective quasi-steady elastic plateaus (incompressible
regimes).
83
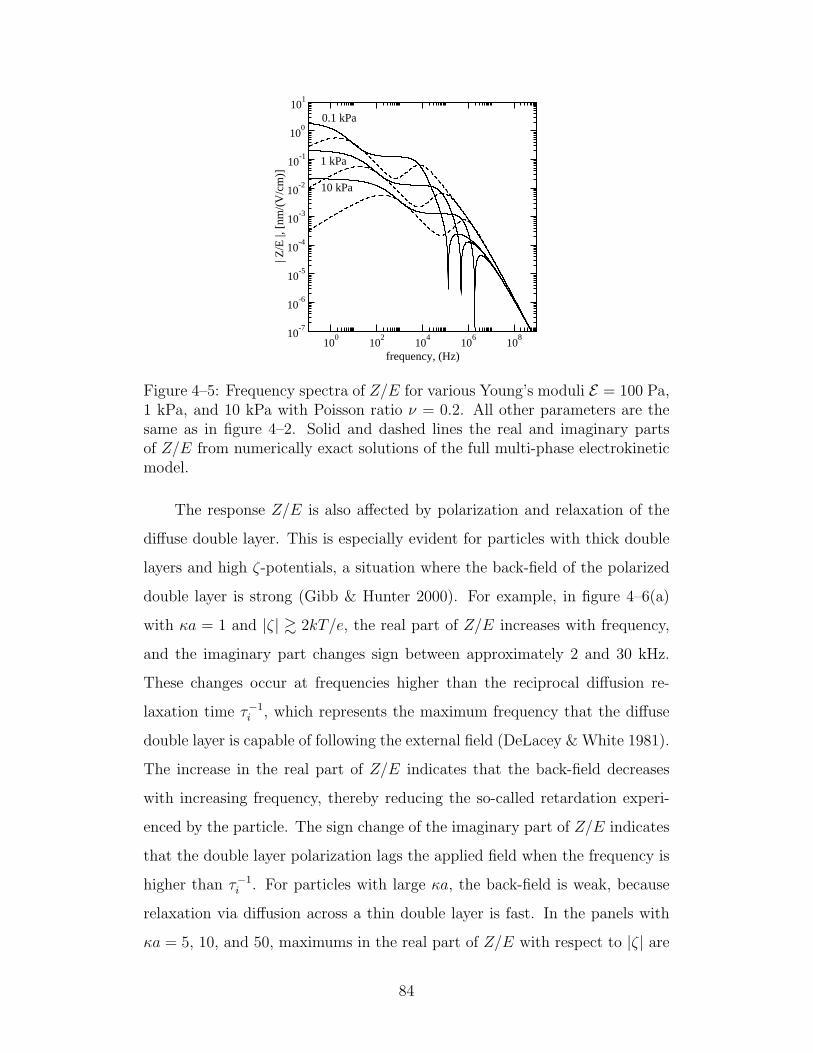
100
102
104
106
108
frequency, (Hz)
10-7
10-6
10-5
10-4
10-3
10-2
10-1
100
101
| Z/E
|, [
nm/(
V/c
m)]
0.1 kPa
1 kPa
10 kPa
Figure 4–5: Frequency spectra of Z/E for various Young’s moduli E = 100 Pa,1 kPa, and 10 kPa with Poisson ratio ν = 0.2. All other parameters are thesame as in figure 4–2. Solid and dashed lines the real and imaginary partsof Z/E from numerically exact solutions of the full multi-phase electrokineticmodel.
The response Z/E is also affected by polarization and relaxation of the
diffuse double layer. This is especially evident for particles with thick double
layers and high ζ-potentials, a situation where the back-field of the polarized
double layer is strong (Gibb & Hunter 2000). For example, in figure 4–6(a)
with κa = 1 and |ζ| & 2kT/e, the real part of Z/E increases with frequency,
and the imaginary part changes sign between approximately 2 and 30 kHz.
These changes occur at frequencies higher than the reciprocal diffusion re-
laxation time τ−1i , which represents the maximum frequency that the diffuse
double layer is capable of following the external field (DeLacey & White 1981).
The increase in the real part of Z/E indicates that the back-field decreases
with increasing frequency, thereby reducing the so-called retardation experi-
enced by the particle. The sign change of the imaginary part of Z/E indicates
that the double layer polarization lags the applied field when the frequency is
higher than τ−1i . For particles with large κa, the back-field is weak, because
relaxation via diffusion across a thin double layer is fast. In the panels with
κa = 5, 10, and 50, maximums in the real part of Z/E with respect to |ζ| are
84
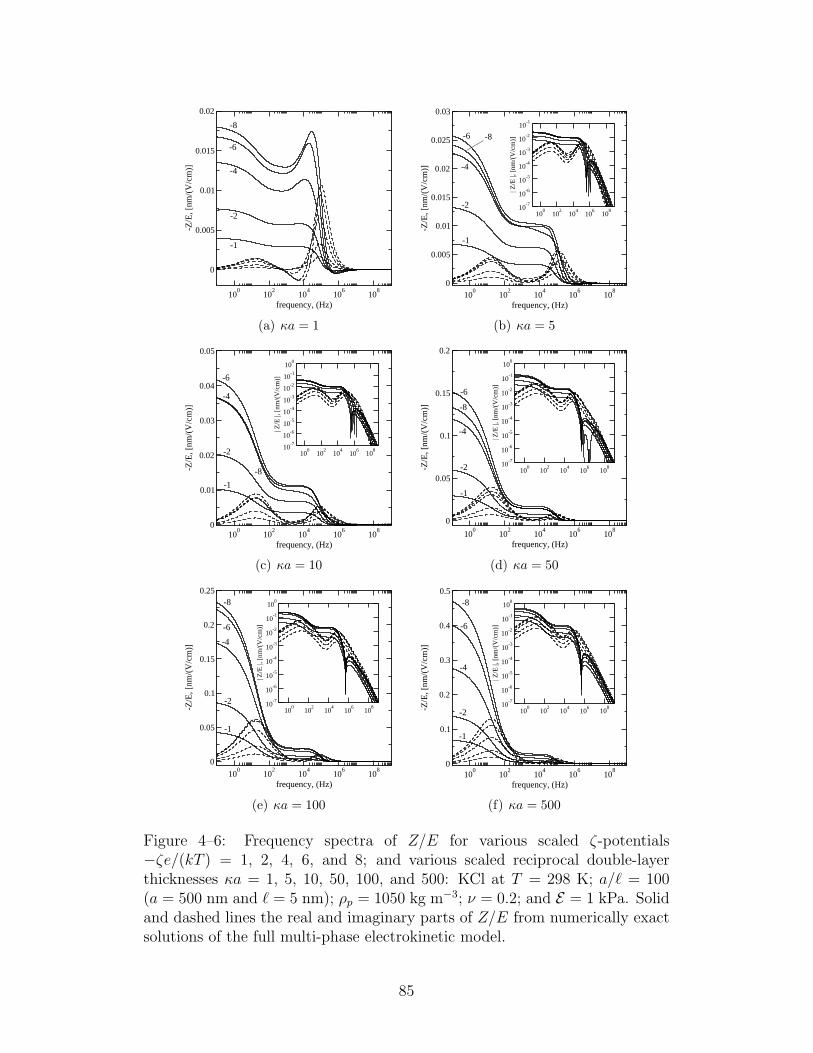
100
102
104
106
108
frequency, (Hz)
0
0.005
0.01
0.015
0.02
-Z/E
, [nm
/(V
/cm
)]
-1
-2
-4
-6
-8
(a) κa = 1
100
102
104
106
108
frequency, (Hz)
0
0.005
0.01
0.015
0.02
0.025
0.03
-Z/E
, [nm
/(V
/cm
)]
100
102
104
106
10810
-7
10-6
10-5
10-4
10-3
10-2
10-1
| Z/E
|, [
nm/(
V/c
m)]
-1
-2
-4
-6 -8
(b) κa = 5
100
102
104
106
108
frequency, (Hz)
0
0.01
0.02
0.03
0.04
0.05
-Z/E
, [nm
/(V
/cm
)]
100
102
104
106
10810
-7
10-6
10-5
10-4
10-3
10-2
10-1
100
| Z/E
|, [
nm/(
V/c
m)]
-1
-2
-4
-6
-8
(c) κa = 10
100
102
104
106
108
frequency, (Hz)
0
0.05
0.1
0.15
0.2
-Z/E
, [nm
/(V
/cm
)]
100
102
104
106
10810
-7
10-6
10-5
10-4
10-3
10-2
10-1
100
| Z/E
|, [
nm/(
V/c
m)]
-1
-2
-4
-6
-8
(d) κa = 50
100
102
104
106
108
frequency, (Hz)
0
0.05
0.1
0.15
0.2
0.25
-Z/E
, [nm
/(V
/cm
)]
100
102
104
106
10810
-7
10-6
10-5
10-4
10-3
10-2
10-1
100
| Z/E
|, [
nm/(
V/c
m)]
-1
-2
-4
-6
-8
(e) κa = 100
100
102
104
106
108
frequency, (Hz)
0
0.1
0.2
0.3
0.4
0.5
-Z/E
, [nm
/(V
/cm
)]
100
102
104
106
10810
-7
10-6
10-5
10-4
10-3
10-2
10-1
100
| Z/E
|, [
nm/(
V/c
m)]
-1
-2
-4
-6
-8
(f) κa = 500
Figure 4–6: Frequency spectra of Z/E for various scaled ζ-potentials−ζe/(kT ) = 1, 2, 4, 6, and 8; and various scaled reciprocal double-layerthicknesses κa = 1, 5, 10, 50, 100, and 500: KCl at T = 298 K; a/` = 100(a = 500 nm and ` = 5 nm); ρp = 1050 kg m−3; ν = 0.2; and E = 1 kPa. Solidand dashed lines the real and imaginary parts of Z/E from numerically exactsolutions of the full multi-phase electrokinetic model.
85
evident. These can lead to ambiguity in determining the ζ-potential from the
steady response (Hill & Ostoja-Starzewski 2008; Wang & Hill 2008). However,
by measuring the frequency spectrum of Z/E (or the mobility µd = −iωZ/E),
it may be easier to unambiguously ascertain the correct ζ-potential. This ap-
proach has been useful for interpreting electroacoustic measurements of the
dynamic mobility (Hunter & O’Brien 1997).
Finally, figures 4–7 and 4–8, respectively, show the influence of hydrogel
permeability `2 for small and large values of κa. The Brinkman screening
length ` has a significant influence on the hydrodynamic coupling between
the fluid and polymer skeleton. Earlier studies (Hill & Ostoja-Starzewski
2008; Wang & Hill 2008) demonstrate that the polymer displacement at steady
state is practically independent of ` for incompressible hydrogels, but varies
significantly for compressible hydrogels due to an adverse electroosmotic-flow-
induced pressure gradient, particularly when κa is large. Note that the Brinkman
screening length also affects the draining time.
When κa is small (figure 4–7), the Brinkman screening length is most ef-
fective in changing reciprocal draining time τ−1d . Accordingly, as the Brinkman
screening length increases, the frequency range exhibiting a quasi-steady in-
compressible elastic response decreases, and eventually disappears, with Z/E
transferring directly from the quasi-steady compressible plateau to the vis-
cous and inertial stress dominated regimes. When κa is large (figure 4–8),
the Brinkman screening length also significantly changes the amplitude of the
quasi-steady compressible plateau. Similarly to the steady displacement (Hill
& Ostoja-Starzewski 2008; Wang & Hill 2008), decreasing the permeability
increases the magnitude of the adverse tangential pressure gradient, which, in
turn, increases the particle displacement.
4.7.3 High-frequency boundary-layer approximation and applica-tion to electroacoustics
The amplitude of the dynamic electrokinetic response Z/E was demon-
strated above to become extraordinarily small at high frequencies. The results
86
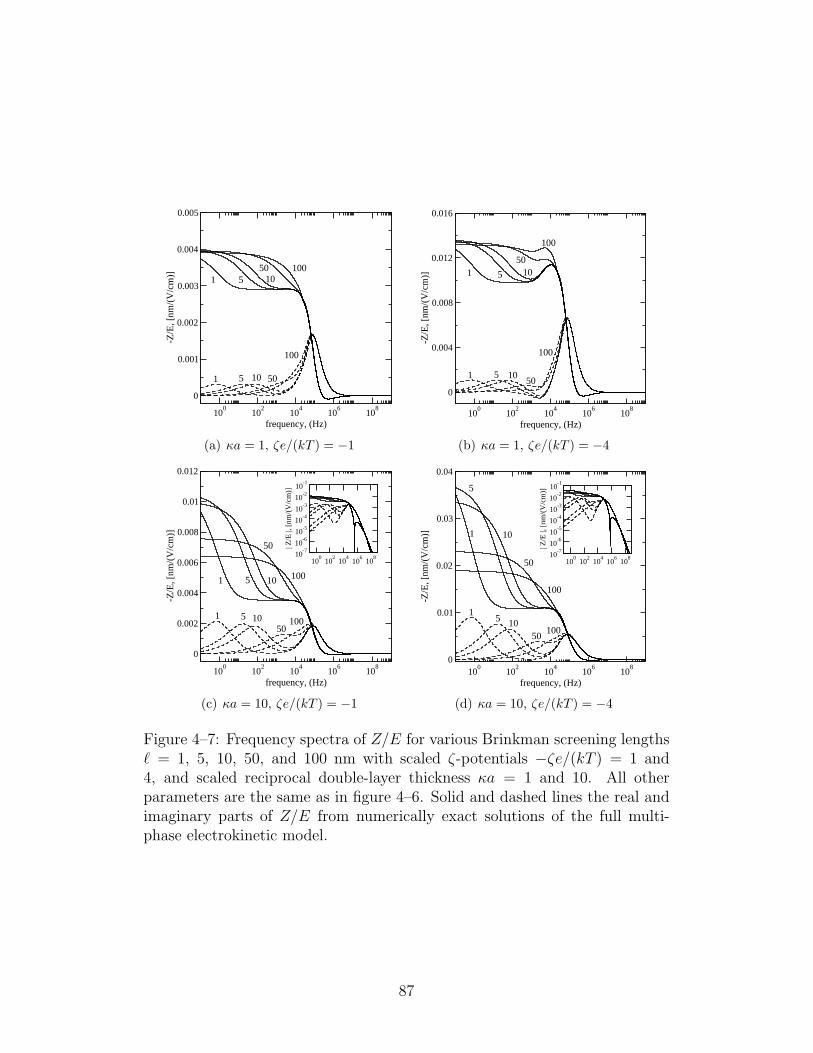
100
102
104
106
108
frequency, (Hz)
0
0.001
0.002
0.003
0.004
0.005
-Z/E
, [nm
/(V
/cm
)]
1 10
1 10
50
50
100
1005
5
(a) κa = 1, ζe/(kT ) = −1
100
102
104
106
108
frequency, (Hz)
0
0.004
0.008
0.012
0.016
-Z/E
, [nm
/(V
/cm
)]
1 10
1 10
50
50
100
100
5
5
(b) κa = 1, ζe/(kT ) = −4
100
102
104
106
108
frequency, (Hz)
0
0.002
0.004
0.006
0.008
0.01
0.012
-Z/E
, [nm
/(V
/cm
)]
100
102
104
106
10810
-710
-610
-510
-410
-310
-210
-1
| Z/E
|, [
nm/(
V/c
m)]
1 10
1 10
50
50
100
1005
5
(c) κa = 10, ζe/(kT ) = −1
100
102
104
106
108
frequency, (Hz)
0
0.01
0.02
0.03
0.04
-Z/E
, [nm
/(V
/cm
)]
100
102
104
106
10810
-710
-610
-510
-410
-310
-210
-1
| Z/E
|, [
nm/(
V/c
m)]
110
1 10
50
50
100
100
5
5
(d) κa = 10, ζe/(kT ) = −4
Figure 4–7: Frequency spectra of Z/E for various Brinkman screening lengths` = 1, 5, 10, 50, and 100 nm with scaled ζ-potentials −ζe/(kT ) = 1 and4, and scaled reciprocal double-layer thickness κa = 1 and 10. All otherparameters are the same as in figure 4–6. Solid and dashed lines the real andimaginary parts of Z/E from numerically exact solutions of the full multi-phase electrokinetic model.
87

100
102
104
106
108
frequency, (Hz)
0
0.01
0.02
0.03
0.04
0.05
0.06
-Z/E
, [nm
/(V
/cm
)]
100
102
104
106
10810
-7
10-6
10-5
10-4
10-3
10-2
10-1
| Z/E
|, [
nm/(
V/c
m)]1
10
50
100
5
(a) κa = 100, ζe/(kT ) = −1
100
102
104
106
108
frequency, (Hz)
0
0.05
0.1
0.15
0.2
0.25
0.3
-Z/E
, [nm
/(V
/cm
)]
100
102
104
106
10810
-8
10-6
10-4
10-2
100
| Z/E
|, [
nm/(
V/c
m)]
1
10
50100
5
(b) κa = 100, ζe/(kT ) = −4
100
102
104
106
108
frequency, (Hz)
0
0.05
0.1
0.15
0.2
0.25
-Z/E
, [nm
/(V
/cm
)]
100
102
104
106
10810
-7
10-6
10-5
10-4
10-3
10-2
10-1
100
| Z/E
|, [
nm/(
V/c
m)]
1
1050 100
5
(c) κa = 1000, ζe/(kT ) = −1
100
102
104
106
108
frequency, (Hz)
0
0.2
0.4
0.6
0.8
1
-Z/E
, [nm
/(V
/cm
)]
100
102
104
106
10810
-7
10-6
10-5
10-4
10-3
10-2
10-1
100
| Z/E
|, [
nm/(
V/c
m)]
1
10 50 100
5
(d) κa = 1000, ζe/(kT ) = −4
Figure 4–8: Frequency spectra of Z/E for various Brinkman screening lengths` = 1, 5, 10, 50, and 100 nm with scaled ζ-potentials −ζe/(kT ) = 1 and 4,and scaled reciprocal double-layer thickness κa = 100 and 1000. All otherparameters are the same as in figure 4–6. Solid and dashed lines the real andimaginary parts of Z/E from numerically exact solutions of the full multi-phase electrokinetic model.
88
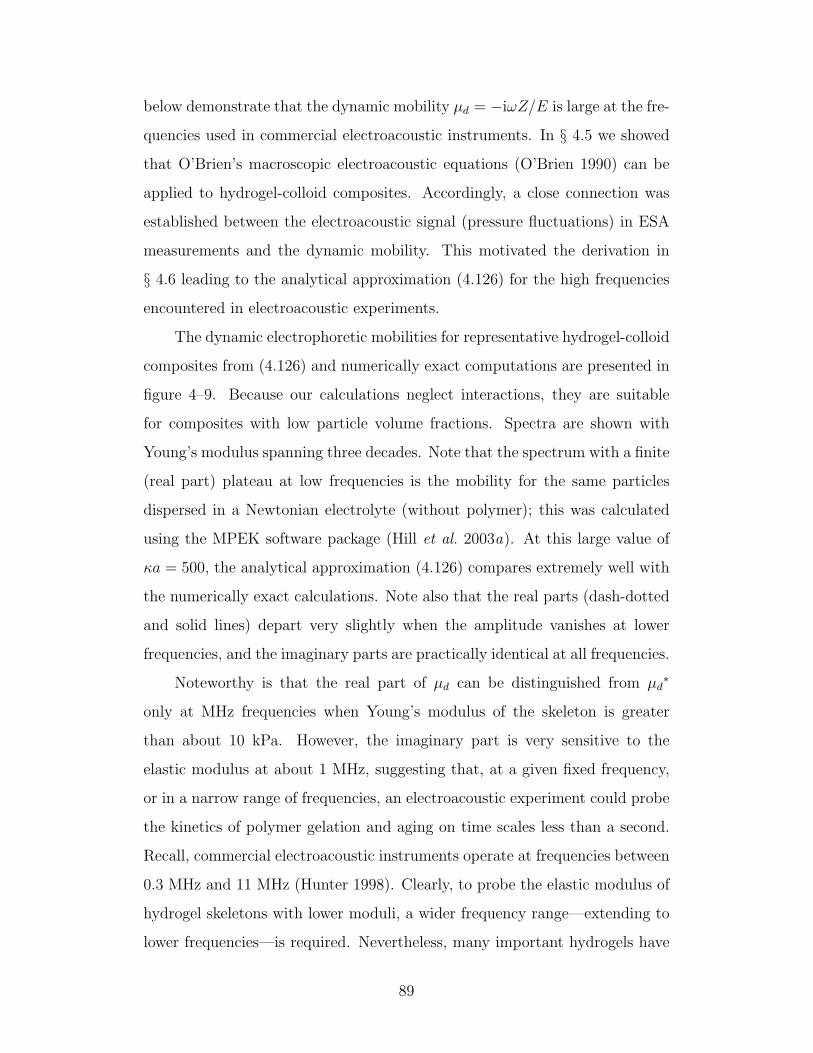
below demonstrate that the dynamic mobility µd = −iωZ/E is large at the fre-
quencies used in commercial electroacoustic instruments. In § 4.5 we showed
that O’Brien’s macroscopic electroacoustic equations (O’Brien 1990) can be
applied to hydrogel-colloid composites. Accordingly, a close connection was
established between the electroacoustic signal (pressure fluctuations) in ESA
measurements and the dynamic mobility. This motivated the derivation in
§ 4.6 leading to the analytical approximation (4.126) for the high frequencies
encountered in electroacoustic experiments.
The dynamic electrophoretic mobilities for representative hydrogel-colloid
composites from (4.126) and numerically exact computations are presented in
figure 4–9. Because our calculations neglect interactions, they are suitable
for composites with low particle volume fractions. Spectra are shown with
Young’s modulus spanning three decades. Note that the spectrum with a finite
(real part) plateau at low frequencies is the mobility for the same particles
dispersed in a Newtonian electrolyte (without polymer); this was calculated
using the MPEK software package (Hill et al. 2003a). At this large value of
κa = 500, the analytical approximation (4.126) compares extremely well with
the numerically exact calculations. Note also that the real parts (dash-dotted
and solid lines) depart very slightly when the amplitude vanishes at lower
frequencies, and the imaginary parts are practically identical at all frequencies.
Noteworthy is that the real part of µd can be distinguished from µd∗
only at MHz frequencies when Young’s modulus of the skeleton is greater
than about 10 kPa. However, the imaginary part is very sensitive to the
elastic modulus at about 1 MHz, suggesting that, at a given fixed frequency,
or in a narrow range of frequencies, an electroacoustic experiment could probe
the kinetics of polymer gelation and aging on time scales less than a second.
Recall, commercial electroacoustic instruments operate at frequencies between
0.3 MHz and 11 MHz (Hunter 1998). Clearly, to probe the elastic modulus of
hydrogel skeletons with lower moduli, a wider frequency range—extending to
lower frequencies—is required. Nevertheless, many important hydrogels have
89
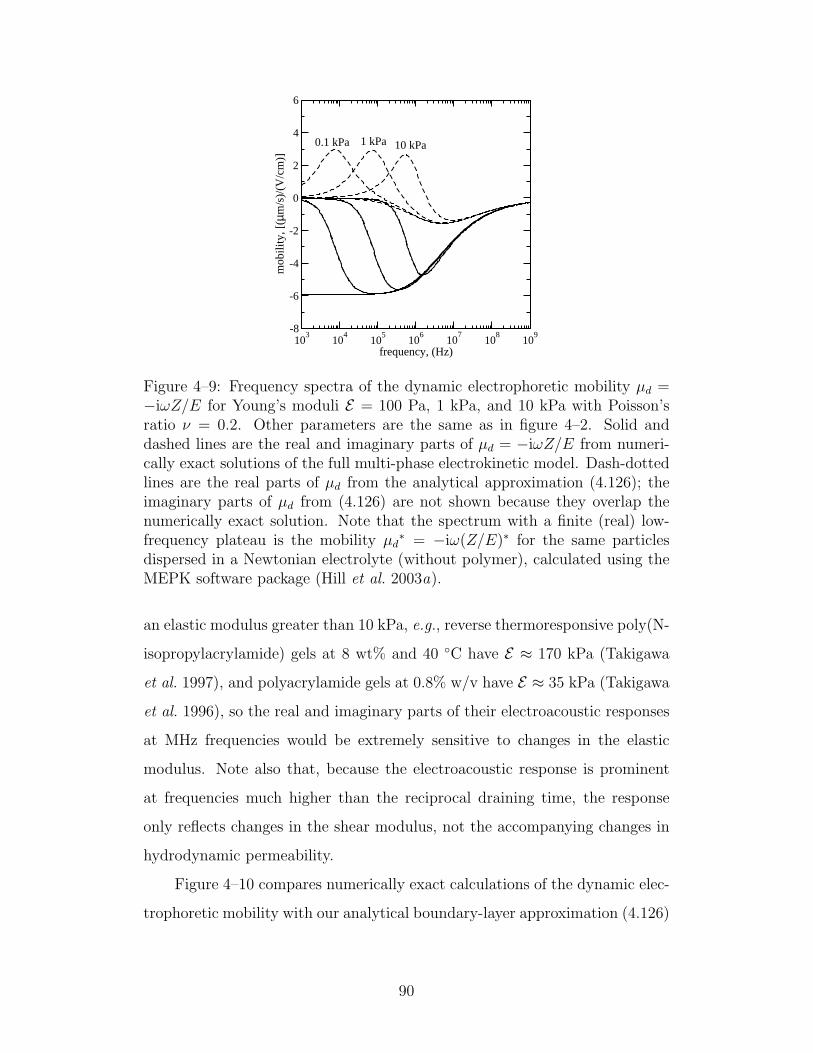
103
104
105
106
107
108
109
frequency, (Hz)
-8
-6
-4
-2
0
2
4
6
mob
ility
, [(µ
m/s
)/(V
/cm
)]
0.1 kPa 1 kPa 10 kPa
Figure 4–9: Frequency spectra of the dynamic electrophoretic mobility µd =−iωZ/E for Young’s moduli E = 100 Pa, 1 kPa, and 10 kPa with Poisson’sratio ν = 0.2. Other parameters are the same as in figure 4–2. Solid anddashed lines are the real and imaginary parts of µd = −iωZ/E from numeri-cally exact solutions of the full multi-phase electrokinetic model. Dash-dottedlines are the real parts of µd from the analytical approximation (4.126); theimaginary parts of µd from (4.126) are not shown because they overlap thenumerically exact solution. Note that the spectrum with a finite (real) low-frequency plateau is the mobility µd
∗ = −iω(Z/E)∗ for the same particlesdispersed in a Newtonian electrolyte (without polymer), calculated using theMEPK software package (Hill et al. 2003a).
an elastic modulus greater than 10 kPa, e.g., reverse thermoresponsive poly(N-
isopropylacrylamide) gels at 8 wt% and 40 C have E ≈ 170 kPa (Takigawa
et al. 1997), and polyacrylamide gels at 0.8% w/v have E ≈ 35 kPa (Takigawa
et al. 1996), so the real and imaginary parts of their electroacoustic responses
at MHz frequencies would be extremely sensitive to changes in the elastic
modulus. Note also that, because the electroacoustic response is prominent
at frequencies much higher than the reciprocal draining time, the response
only reflects changes in the shear modulus, not the accompanying changes in
hydrodynamic permeability.
Figure 4–10 compares numerically exact calculations of the dynamic elec-
trophoretic mobility with our analytical boundary-layer approximation (4.126)
90
with κa = 50 (top panels) and 1000 (bottom panels). The boundary-layer ap-
proximation is accurate when κa = 1000 for all the experimentally accessible
ζ-potentials and frequencies, and even when κa = 50 the approximation de-
viates only slightly from the exact calculations at the highest ζ-potentials
and frequencies. These dynamics are independent of the Brinkman screening
length and Poisson ratio (with fixed shear modulus). Note that (4.126) does
not capture the compressible dynamics at frequencies below the reciprocal
draining time, where the dynamic mobility is vanishingly small.
4.8 Summary
We extended the multi-phase electrokinetic model of Hill & Ostoja-Starzewski
(2008) and Wang & Hill (2008) to calculate the dynamic response of a charged,
spherical colloid embedded in uncharged hydrogels subjected to harmonically
oscillating electric fields. We began by solving the two-fluid model of Levine
& Lubensky (2001) exactly, and compared our analytical solution with two
approximations widely adopted in the microrheology literature. We then de-
veloped a powerful computational methodology to solve the full multi-phase
electrokinetic model by linearly perturbing an equilibrium base state governed
by the non-linear Poisson-Boltzmann equation. The particle response, defined
as the ratio of the displacement to the electric field strength, was obtained
by superposing two simpler sub-problems to satisfy the particle equation of
motion. Compressible and incompressible hydrogel skeletons had to be con-
sidered separately. By adopting an analytical solution in the far field, we
achieved accurate numerical solutions over an extraordinarily wide range of
frequencies, in a wide range of the experimentally accessible parameter space.
In addition, we examined the dynamic electrophoretic mobility, defined as the
ratio of the particle velocity to the electric field strength, and its connection
to electroacoustic diagnostics for characterizing hydrogel-colloid composites.
Noteworthy was an analytical boundary-layer approximation that compares
extremely well with the numerically exact results at the ultra-sonic frequen-
cies adopted in commercial electroacoustic instruments.
91
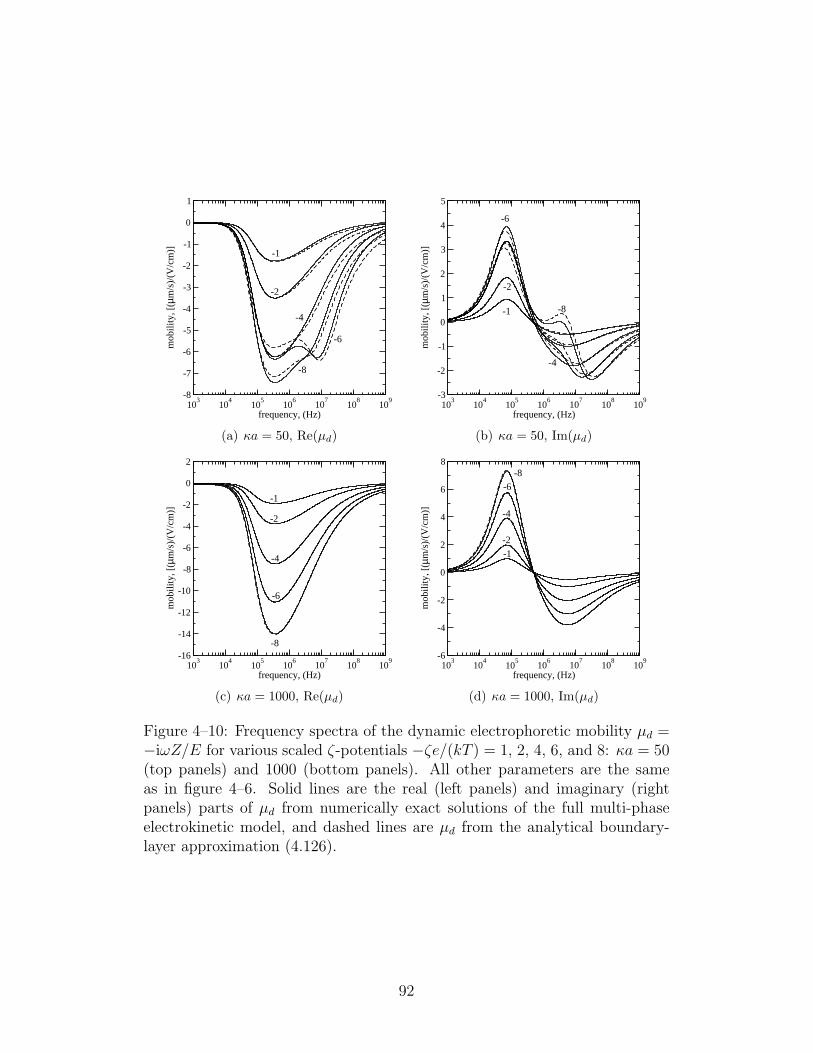
103
104
105
106
107
108
109
frequency, (Hz)
-8
-7
-6
-5
-4
-3
-2
-1
0
1
mob
ility
, [(µ
m/s
)/(V
/cm
)]
-2
-1
-4
-6
-8
(a) κa = 50, Re(µd)
103
104
105
106
107
108
109
frequency, (Hz)
-3
-2
-1
0
1
2
3
4
5
mob
ility
, [(µ
m/s
)/(V
/cm
)]
-2
-1
-4
-6
-8
(b) κa = 50, Im(µd)
103
104
105
106
107
108
109
frequency, (Hz)
-16
-14
-12
-10
-8
-6
-4
-2
0
2
mob
ility
, [(µ
m/s
)/(V
/cm
)]
-1
-2
-4
-6
-8
(c) κa = 1000, Re(µd)
103
104
105
106
107
108
109
frequency, (Hz)
-6
-4
-2
0
2
4
6
8
mob
ility
, [(µ
m/s
)/(V
/cm
)]
-1
-2
-4
-6
-8
(d) κa = 1000, Im(µd)
Figure 4–10: Frequency spectra of the dynamic electrophoretic mobility µd =−iωZ/E for various scaled ζ-potentials −ζe/(kT ) = 1, 2, 4, 6, and 8: κa = 50(top panels) and 1000 (bottom panels). All other parameters are the sameas in figure 4–6. Solid lines are the real (left panels) and imaginary (rightpanels) parts of µd from numerically exact solutions of the full multi-phaseelectrokinetic model, and dashed lines are µd from the analytical boundary-layer approximation (4.126).
92
The approximate solution of the two-fluid model by Levine & Lubensky
(2001) agrees well with our exact analytical solution when fluid and particle
inertia can be neglected. However, the range of applicability of the gener-
alized Stokes-Einstein relation (GSER) was found to be narrower than pre-
viously thought. The electric-field-induced dynamic response of a colloidal
particle in a hydrogel often exhibits an ostensible transition from quasi-steady
compressible to incompressible elastic dynamics—both characterized by dis-
tinct plateaus in the real part of the frequency spectrum—as the frequency
passes through the reciprocal draining time τ−1d of the hydrogel. At higher
frequencies, when the dynamics are dominated by viscous and inertial forces,
the response is similar to a particle in a Newtonian electrolyte. In general,
the response depends on Poisson’s ratio, Young’s modulus, and Brinkman
screening length of the hydrogel, as well as physicochemical characteristics of
the inclusions, including size and charge. At frequencies above the reciprocal
draining time, the response is practically independent of hydrogel permeabil-
ity and compressibility, since the the fluid and polymer skeleton are strongly
coupled by hydrodynamic drag forces. At frequencies below the reciprocal
draining time, hydrogel compressibility can increase the electric-field-induced
particle displacement by an order of magnitude relative to the displacement in
a perfectly incompressible skeleton with the same shear modulus. Accordingly,
the dynamics of compressible and incompressible hydrogels are qualitatively
different at low frequencies. Note that the response spectrum also reflects po-
larization and relaxation of the diffuse double layer, particularly for inclusions
with thick double layers (small κa) and high ζ-potentials.
The present theory provides a rigorous foundation for interpreting two
classes of electric-field-based diagnostic experiments involving hydrogel-colloid
composites. Such experiments probe both the physicochemical characteris-
tics of the charged inclusions, and the viscoelastic rheology of the hydrogel.
Our calculations demonstrate that the particle displacement at low frequen-
cies could be directly measured using active electrical microrheology. At
93
higher frequencies, however, the particle displacements are too small (sub-
nanometer) to measure directly, so electroacoustic techniques are necessary to
measure instead the dynamic electrophoretic mobility of the inclusions. Ac-
cordingly, we showed that the macroscopic relations for colloidal dispersions
developed by O’Brien (1990) can be directly applied to hydrogel-colloid com-
posites. Our calculations of the dynamic electrophoretic mobility demonstrate
that the strength of electroacoustic signals from hydrogel-colloid composites
are comparable to those from Newtonian electrolytes without a polymer skele-
ton. Accordingly, our calculations suggest that electroacoustic experiments
on hydrogel-colloid composites could be performed using presently available
commercial instruments.
This chapter and chapter 3 provide the complete solution of the multi-
phase electrokinetic model for dynamic and steady electric-field-induced re-
sponses of colloidal particles embedded in hydrogels. The particle responses
are sensitive to the hydrogel viscoelasticity, compressibility and hydrodynamic
permeability, and physicochemical properties of the inclusion. Therefore, char-
acterization techniques based on these responses can be developed. Clearly,
the continuous phase significantly affects particle dynamics. Effects of colloidal
particles on the bulk composite properties are revealed in the next chapter with
a different problem, where the nanoparticle-induced anomalous bulk viscosity
reductions found in polymer-nanocomposite melts are studied.
Appendicies
4.A Point-force representation of a particle in an uncharged hy-drogel matrix
Here we relate the net force on a spherical colloid in an uncharged hydrogel
to the strength of a point force that produces the same far-field disturbances.
The particle undergoes harmonic translation in an otherwise stationary hy-
drogel. The strength of the point force is obtained from reciprocal relations
similar to Hill et al. (2003a). However, in addition to the Lorentz reciprocal
94
relation for fluid in a domain S (Kim & Karrila 1991),∫∂S
(u′ · Tf − u · Tf ′) · ndA =
∫S
(u′ ·∇ · Tf − u ·∇ · Tf ′)dV, (4.129)
a similar reciprocal relation, known in solid mechanics as the Betty theo-
rem (Barber 2003) is required. This is∫∂S
(µ′v′ · Te − µv · Te′) · ndA =
∫S
(µ′v′ ·∇ · Te − µv ·∇ · Te′)dV, (4.130)
provided λ = λ′.
Consider a large domain Ω with boundary ∂Ω and outward unit normal
n that encloses an oscillating sphere centered at position r1 with radius a
(system 1) and a fixed point-force centered at position r2 (system 2). Note that
|r1−r2| a+κ−1. Furthermore, the sphere occupies volume Ω1 and undergoes
oscillatory translation with velocity −iωZ. The corresponding surface and
outward unit normal are denoted ∂Ω1 and n1, respectively.
The divergence of elastic and hydrodynamic stresses for system 1 (∇ ·Tf1
and ∇ · Te1) are given by (4.58b) and (4.58c), respectively. For system 2,
∇ · Tf2 = η∇2u2 −∇p2
= −iωρfu2 + (η/`2)(u2 + iωv2) + f fδ(r2), (4.131a)
∇ · Te2 = µ∇2v2 + (λ+ µ)∇(∇ · v2)
= f eδ(r2)− (η/`2)(u2 + iωv2), (4.131b)
where δ(r) is the Dirac-delta function, and f f and f e are the point forces
exerted on the fluid and elastic medium, respectively.
Applying the Lorentz reciprocal relation to the volume enclosed by ∂Ω1
and ∂Ω gives∫∂Ω
(u1 · Tf2 − u2 · Tf
1) · ndA−∫∂Ω1
(u1 · Tf2 − u2 · Tf
1) · n1dA
=
∫Ω−Ω1
(u1 ·∇ · Tf2 − u2 ·∇ · Tf
1)dV. (4.132)
95
Because u ∼ r−3 as r → ∞, the integral over ∂Ω on the left-hand side of
(4.132) vanishes when Ω is sufficiently large. Therefore, substituting (4.58b)
and (4.131a) into (4.132) gives
−∫∂Ω1
(u1 · Tf2 − u2 · Tf
1) · n1dA
= u1(r2) · f f +
∫Ω−Ω1
[iω(η/`2)(u1 · v2 − u2 · v1) + u2 ·∇ · Tm1 ]dV.(4.133)
Inside the particle, u1 = −iωZ, and since |r1 − r2| a + κ−1, u2(|x −
r1| ≤ a) can be considered constant. Therefore, applying Gauss’s divergence
theorem to the integral over ∂Ω1 on the left-hand side of (4.133) gives∫∂Ω1
(u1 · Tf2 − u2 · Tf
1) · n1dA
= −iωZ ·∫
Ω1
∇ · Tf2dV − u2(r1) ·
∫∂Ω1
Tf1 · n1dA
= −u2(r1) ·[ω2ρfVpZ +
∫∂Ω1
Tf1 · n1dA
], (4.134)
where Vp is the particle volume. Substituting (4.134) into (4.133) gives
f f · u1(r2) = u2(r1) ·[ω2ρfVpZ +
∫∂Ω1
Tf1 · n1dA
]−∫
Ω−Ω1
[iω(η/`2)(u1 · v2 − u2 · v1) + u2 ·∇ · Tm1 ]dV. (4.135)
Similarly, for the elastic displacements, applying the same procedure as above,
but with the Betty theorem, yields
f e ·v1(r2) = v2(r1) ·∫∂Ω1
Te1 ·n1dA−
∫Ω−Ω1
(η/`2)(u1 ·v2−u2 ·v1)dV. (4.136)
where v2(|x− r1| ≤ a) may be considered constant.
Again, since u1(r2) = −iωv1(r2) and u2(r1) = −iωv2(r1), multiplying
(4.136) by −iω and adding (4.135) gives
f ·u1(r2) = u2(r1)·[ω2ρfVpZ +
∫∂Ω1
(Tf1 + Te
1) · n1dA
]−∫
Ω−Ω1
u2 ·∇·Tm1 dV,
(4.137)
96
where f = f e + f f is the total point force. Note that the volume integral on
the right-hand side of (4.137) can be factored to give∫Ω−Ω1
u2 ·∇ · Tm1 dV = −u2(r1) ·
∫∂Ω1
Tm1 · n1dA, (4.138)
because ∇ · Tm is exponentially small when |x − r1| a + κ−1, and u2 can
be considered constant where ∇ · Tm is finite.
Substituting (4.138) into (4.137) yields
f = ω2ρfVpZ +
∫∂Ω1
(Te1 + Tf
1 + Tm1 ) · n1dA. (4.139)
The integral over ∂Ω1 on the left-hand side of (4.139) is the total force on the
sphere, which according to Newton’s second law must equal the acceleration
of its mass, −Vpρpω2Z, so the strength of the point force is
f = ω2VpZ(ρf − ρp). (4.140)
In other words, similarly to bare particles (Mangelsdorf & White 1992) and
particles with polymer coatings (Hill et al. 2003a) dispersed in Newtonian
electrolytes, the acceleration of the mass of fluid displaced by a finite sized
inclusion in a hydrogel must be added to the force on a point particle producing
the same far-field fluid velocity and polymer displacement disturbances. Note
that the foregoing analysis neglects the mass of the polymer.
4.B Numerical solution of the field equations
The field equations are solved according to the outline presented in § 4.3.
First, the Poisson-Boltzmann equation is solved efficiently using the adaptive
mesh algorithm developed by Hill et al. (2003a), and then various equilibrium
quantities and their derivatives are computed. Next, the linearly perturbed
equations are solved. Before this calculation, the equations are transformed to
simplify the numerical methods discussed in § 4.3 and § 4.4. The matrix alge-
bra and eigenvalue calculations involved in the transformations are performed
97
using BLAS and LAPACK routines (Anderson et al. 1999). Completely differ-
ent computational strategies are adopted for calculating the linearized pertur-
bations for incompressible and compressible hydrogel skeletons. Asymptotic
coefficients and physical quantities are then constructed from the numerical so-
lutions. The following discusses in further detail how the perturbed problems
are solved.
For incompressible skeletons, the perturbed equations are transformed to
the decoupled forms outlined in § 4.3, and the resulting differential equations
are discretized using a second-order central difference scheme, and solved using
a banded matrix solver. Solutions are then improved iteratively using a mov-
ing mesh method based on the methodology of Hill et al. (2003a). When the
solution has converged, asymptotic coefficients based on the far-field asymp-
totic analysis are obtained. The far-field solution is calculated using LAPACK.
Our program to compute the response for incompressible skeletons is written
entirely in C.
For compressible skeletons, the perturbed solutions oscillate in space with
several wave lengths, e.g., the construction of the fluid velocity and polymer
displacement in § 4.2 involves three wave lengths. The second-order central
difference scheme with the moving mesh method of Hill et al. (2003a) does not
converge. We therefore modified a general-purpose boundary value problem
software package TWPBVPL (Cash & Mazzia 2006), which solves the differ-
ential equations using fourth-, sixth- and eighth-order methods with hybrid
mesh selection, to solve the linearly perturbed problem. The second-order or-
dinary differential equations (ODEs) presented in § 4.3.2, i.e., (4.36), (4.37),
(4.32), (4.34), and (4.35), are arranged into a set of first-order ODEs
x,r = C · x+ q, (4.141)
where x = [n1, n1,r, . . . , nN , nN,r, ψ, ψ,r, f,r, f,rr, f,rrr, f,rrrr, g1, g1,r, g2, g2,r]T
is a vector of unknown functions, C is a coefficient matrix, and q is a vec-
tor. Note that x, C and q all depend on radial position r. To convert nj
98
(j = 1, 2, . . . , N) and ψ to χk (k = 1, 2, . . . , N +1) in x, we introduce a square
transformation matrix
T =
Q−1
0
0 I
, (4.142)
and a transformed vector of unknowns
y = T · x. (4.143)
Here, Q is given in (4.71), and the tilde denotes a matrix augmentation oper-
ation that increases the size of an n × n matrix M (with elements Mij) to a
2n× 2n augmented matrix
M =
M11 0 M12 0 . . . M1n 0
0 M11 0 M12 . . . 0 M1n
......
......
. . ....
...
Mn1 0 Mn2 0 . . . Mnn 0
0 Mn1 0 Mn2 . . . 0 Mnn
. (4.144)
Equation (4.141) is then transformed to
y,r = (TCT−1) · y + T · q, (4.145)
where the far-field boundary conditions at r = rmax given in § 4.4 can be
directly applied. The original boundary conditions at the particle surface
r = a in matrix form
B · x = β (4.146)
are transformed to
(BT−1) · y = β. (4.147)
The transformed equations (4.145), together with their boundary conditions,
i.e., (4.147) as boundary conditions at r = a and far-field boundary conditions
presented in § 4.4 at r = rmax, are first solved with a second-order central differ-
ence scheme (Ascher et al. 1988) on the non-uniform mesh of the equilibrium
99
solution. With this initial guess, TWPBVPL is used to calculate y by ad-
justing the mesh and applying higher order methods. The far-field boundary
conditions are calculated using multiple precision packages GMP (Granlund
2007), MPFR (Fousse et al. 2007), and MPC (Enge et al. 2007) to avoid
round-off errors, and various matrix operations are performed using LAPACK
and BLAS. When the error tolerance or the maximum number of iterations is
achieved, asymptotic coefficients are extracted. Our program combines codes
written in C and FORTRAN.
100
CHAPTER 5Anomalous bulk viscosity of polymer-nanocomposite melt
Different from chapters 3 and 4, this chapter discusses the influences of
nanoparticles, i.e., colloidal particles of nanometer size (Rotello 2004), on the
bulk viscosity of polymer-nanocomposite melts. This shows, as an example,
how colloid-induced microstructures can change the bulk transport properties
of composites.
Nanoparticles dispersed in polymer melts have recently been shown to
decrease the bulk viscosity. This contradicts expectations based on Einstein’s
well-known theory for effective viscosity of dilute, random dispersions of rigid
spheres in Newtonian fluids. In this chapter, we examine a continuum hydro-
dynamic model where a layer of polymer at the nanoparticle-polymer interface
has a different viscosity and density to the bulk polymer. When the layer thick-
ness is greater than the nanoparticle radius, and the layer viscosity is lower
than that of the bulk polymer, the intrinsic viscosity is comparable to the
unexpectedly large, negative values reported experimentally in the literature.
Accordingly, our continuum hydrodynamic model attributes the bulk viscos-
ity reduction to a lower melt viscosity at the nanoparticle-polymer interface.
Such a reduction can be attributed to the increased free volume and the Rouse
dynamics of polymer chains that interact strongly with the nanoparticles. Our
model also supports Mackay and coworkers’ arguments that nanoparticles can
organize the bulk polymer even when the nanoparticle volume fraction is very
small.
5.1 Introduction
Polymer-nanocomposites formed by dispersing organic or inorganic nanopar-
ticles (NPs) in polymeric matrices often have significantly improved mechani-
cal, thermal, electrical, and magnetic properties (Kickelbick 2003). Purposely
101
tailoring the composite microstructure provides opportunities for developing
a variety of new or substantially improved technological applications, e.g.,
gas- and liquid-based membrane separations, fuel cells, and semiconductor
technologies (Kang et al. 2006; Schmidt & Malwitz 2003; Abetz et al. 2006;
Rotello 2004).
Because of their extraordinarily small sizes, the contribution of nanopar-
ticles to the bulk properties often cannot be explained by classical theories
(Torquato 2002). For instance, Merkel et al. (2002) showed that impenetrable
fumed silica nanoparticles embedded in a glassy polymer matrix unexpectedly
promote gas permeability and reverse selectivity: a phenomenon that cannot
be explained by classical Maxwell-like theories, where nanoparticles obstruct
molecular transport, and therefore decrease membrane permeability (Maxwell
1873). Merkel et al. (2002) interpreted the enhanced permeability and reverse
selectivity on the basis of the theory of Cohen & Turnbull (1959) by proposing
that nanoparticles increase the polymer free volume. In a more detailed quan-
titative theory, Hill (2006a,c) attributed the free-volume changes to polymer
depletion layers established during the membrane casting. These calculations
show that nanoparticle-induced microstructural changes, such as polymer de-
pletion layers, modify the polymer in a manner that is in good quantitative
agreement with the available experiments.
In this work, we use a similar idea to interpret the non-Einstein-like
anomalous bulk viscosity of certain polymer-nanocomposite melts, most no-
tably in the experiments by Mackay and coworkers (Mackay et al. 2003; Tuteja
et al. 2005). The viscosity of particulate suspensions is expected to increase
with the particle volume fraction, as demonstrated in various experimen-
tal (Rutgers 1962) and theoretical (Einstein 1906; Brennen 1975; Pal 2007;
Batchelor 1967) studies. At low volume fractions, interactions between parti-
cles can be neglected, and the bulk viscosity η is expected to increase according
to η = η0[1 + (5/2)φ], where η0 is the solvent viscosity, and φ is the particle
volume fraction (Einstein 1906).
102
However, Einstein’s relation does not hold for many polymer-nanocomposite
melts, even at very low nanoparticle volume fractions. Roberts et al. (2001)
dispersed 0.35 nm silicate nanoparticles into poly(dimethyl siloxane) (PDMS)
melts, and found that the composite bulk viscosity decreases linearly with
the nanoparticle volume fraction. The viscosity reduction was attributed
to the solvent effect of nanoparticles due to their similar sizes as PDMS
monomers (Roberts et al. 2001). Bulk viscosity reduction was also observed in
poly(methyl methacrylate) (PMMA) melts with untethered polyhedral oligomeric
silsesquioxanes (POSS) nanoparticles (Kopesky et al. 2004). In these exper-
iments, the bulk viscosity first decreases, and then increases with the POSS
volume fraction. The explanation is that, at low volume fractions, the POSS
nanoparticles act as plasticizer, increasing the free volume and therefore de-
creasing the bulk viscosity; whereas at higher volume fractions, nanoparticles
agglomerate and form crystallites that increase the bulk viscosity by the hy-
drodynamic mechanisms that underly Einstein’s theory.
A reduction of the polymer-nanocomposite melt viscosity is helpful for
processing. Clearly, an understanding of the underlying mechanism is nec-
essary. However, the foregoing experiments do not reveal whether the bulk
viscosity reduction arises from nano-scale effects, or interactions between the
nanoparticle surface and the polymer, or both. Insight into the origin of the
viscosity reduction can be obtained by studying an ideal system where the
nanoparticles and the polymer are chemically identical, so that the surface
enthalpic interactions are minimized (Russel et al. 1989).
Mackay et al. (2003) studied such an ideal system of polystyrene (PS)
nanoparticles dispersed in linear PS melts. They found that the bulk viscosity
decrease is a unique feature of nano-scale systems, and attributed the viscosity
decrease to the increase in free volume, as evidenced from the nanoparticle-
induced glass transition temperature and polymer configuration changes. Tuteja
et al. (2005) expanded the experimental data sets and revealed conditions for
the reduced bulk viscosity. They concluded that: (1) the polymers have to
103
be entangled, i.e., above the critical molecular mass for entanglement cou-
pling Mc; and (2) the average nanoparticle separation distance must be smaller
than twice the polymer radius of gyration Rg. Consequently, they proposed
that, in tandem to the free-volume changes, nanoparticles affect polymer chain
entanglement dynamics similarly to constraint release (Dealy & Larson 2006),
i.e., the constraints imposed by the surrounding molecules constituting the
entanglement mesh (tube) on a particular polymer chain are released due to
movement of the mesh. In this model, nanoparticles reduce the relaxation time
of the polymer melt, but do not affect the plateau modulus, and consequently
contribute to the bulk terminal viscosity reduction. Using the aforementioned
conditions of bulk viscosity reduction, low-viscosity multifunctional polymer-
nanocomposites with enhanced mechanical, electrical and magnetic properties
have been prepared (Tuteja et al. 2007a). Nanoparticle-induced polymer con-
figuration changes have been partly demonstrated by the recent small angle
neutron scattering (SANS) of Tuteja et al. (2008), where the polymer chains
are found to swell (Rg increases) due to nanoparticles.
There are currently no theories available to successfully quantify the nega-
tive intrinsic viscosity of polymer-nanocomposite melts. Ganesan et al. (2006)
proposed a wavenumber-dependent non-local phenomenological constitutive
equation for melt viscosity based on Rouse dynamics. Their equation is valid
when b < q−1 < L, where q is the velocity disturbance wavenumber, b is
the polymer segment size, and L is a characteristic length scale that controls
the break down of classical Einstein predictions. Solving a Fourier spectral
representation of slow viscous flow, with the viscosity constitutive equation,
yields a bulk viscosity reduction at low particle loading when nanoparticles
are smaller than L. Ganesan et al. (2006) also identified that L ≈ Rg for un-
entangled melts, and L ≈ dt for entangled melts, where dt is the entanglement
tube diameter. Their analytical prediction is consistent with accompanying
computer simulations for unentangled melts with low nanoparticle volume frac-
tions. However, contrary to Tuteja et al. (2005), their model predicts a much
104
smaller bulk viscosity reduction, and demonstrates that chain entanglement is
unnecessary. Consequently, Ganesan et al. (2006) did not compare their quan-
titative theory with the available experimental data of Mackay et al. (2003)
and Tuteja et al. (2005).
In this work, we present a new theory based on a layer of polymer at the
particle-polymer interface that has a viscosity and density that are, in general,
different from the bulk. A simple analytical model, valid for low nanoparticle
volume fractions, reveals that such a layer can significantly reduce the bulk
viscosity. We compare our theory with the experiments of Mackay et al. (2003)
and Tuteja et al. (2005) to ascertain the layer thickness. This provides valuable
insight toward understanding the mechanism of bulk viscosity reduction.
The chapter is arranged as follows. In § 5.2 we present an analytical model
for the reduced bulk viscosity arising from a layer around each nanoparticle
in a dilute, random dispersion. For simplicity, we consider the polymer melt
to be a Newtonian fluid, which is reasonable at the low shear rates encoun-
tered when measuring the steady shear viscosity. Our model satisfies quasi-
steady momentum and mass conservation equations, and allows for slip at the
particle-polymer interface. Section 5.3 presents the results of the analytical
theory, and highlights the importance of parameters that affect the bulk vis-
cosity reduction. The model is used to interpret experimental measurements
in § 5.4, where origins of the bulk viscosity reduction are also discussed. A nu-
merical extension of the analytical theory, which permits a continuous change
in layer properties, is also presented. We conclude with a brief summary in
§ 5.5.
5.2 Theory
Similarly to particulate suspensions, the bulk viscosity of a dilute polymer-
nanocomposite melt can be written
η = η0(1 + [η]φ+ . . .), (5.1)
105
where the intrinsic viscosity (Larson 1999)
[η] ≡ limφ→0
(η/η0 − 1)/φ, (5.2)
characterizes the contribution of each (non-interacting) particle to the bulk
viscosity. For example, the Einstein relation gives [η] = 5/2, and a reduced
bulk viscosity corresponds to [η] < 0. Note that the intrinsic viscosities of
many particulate suspensions have been measured, and, until recently, were
always positive (Rutgers 1962).
It is tempting to hypothesize that the intrinsic viscosity of bubbly suspen-
sions comprised of a low-viscosity dispersed phase in a higher viscosity con-
tinuous phase would be negative. However, Taylor (1932) has shown that the
intrinsic viscosity for spherical drops with arbitrary viscosity ratio asymptotes
to [η] = 1 for inviscid, spherical bubbles. Accordingly, the impenetrability of
a spherical bubble is as influential on the intrinsic viscosity as the vanishing
viscosity of the bubble itself.
Here we present a simple hydrodynamic model to interpret the large,
negative intrinsic viscosities reported by Mackay et al. (2003) and Tuteja et al.
(2005). We introduce a step change in the polymer segment density and
viscosity around each nanoparticle. Our analytical model can be generalized to
handle—in a numerically efficient way—a continuous radial change of density
and viscosity.
The intrinsic viscosity of nanoparticles is calculated from the velocity dis-
turbance produced by a rigid force- and torque-free nanoparticle embedded in
a polymer melt whose undisturbed velocity is u = G · r, where r is position
relative to the particle center, and the velocity-gradient tensor G = E + Ω
comprises the rate-of-strain tensor E and vorticity tensor Ω. For macroscop-
ically incompressible dispersions, E is symmetric and traceless, representing
an extensional flow. For torque-free particles, only the extensional part of the
106
macro-scale velocity gradient contributes to the intrinsic viscosity. It is there-
fore sufficient to compute the disturbance of a fixed sphere at the origin of an
extensional flow where u = E · r.
Our model neglects particle interactions, which may be important at much
lower particle volume fractions than expected for nanoparticles in molecular
fluids. Since the chain dynamics for an entangled melt are often characterized
by the entanglement tube diameter dt (Brochard-Wyart & de Gennes 2000),
we may assume nanoparticles with radius a organize polymer chains in their
close proximity over a distance that is comparable to dt. Then the theory
will be limited to particle volume fractions φ φm(1 + dt/a)−3, where φm
is the maximum random packing volume fraction (' 0.638). For PS melts,
dt ' 10 nm and the nanoparticle concentration when a ' 3 nm should yield
φ 0.008.
We approximate the polymer melt as an incompressible Newtonian fluid
with shear viscosity η and density ρ, which, in general, are presumed to vary
with radial position from the center of each nanoparticle. The Newtonian
stress tensor is T = −pI + η[∇u+ (∇u)T ], where p is the dynamic pressure
and I is the identity tensor. The viscosity and density inside a uniform layer
are denoted ηi and ρi, respectively, and, similarly, outside the layer ηo and ρo.
Newtonian rheology demands the polymer chains to be in equilibrium dur-
ing the deformation, i.e., the chain relaxation time τ should be much shorter
than the characteristic flow-deformation time. In Mackay and coworkers’ ex-
periments (Mackay et al. 2003; Tuteja et al. 2005), the zero-shear viscosity is
extrapolated from the dynamic viscosity in the low-shear Newtonian regime
at frequencies ω less than 0.01 rad s−1. The characteristic relaxation times of
the linear PS melt, obtained from the analysis of Baumgaertel et al. (1990)
with temperature adjusted to 170C from the William-Landau-Ferry (WLF)
equation (Ferry 1980), are τ ∼ 0.03 and 20 s for melts with molecular weights
75 and 393 kDa, respectively. These are clearly much shorter than the char-
acteristic flow-deformation time ω−1 ∼ 100 s. In other words, the Deborah
107
number De ≡ ωτ 1 (Dealy & Larson 2006), so the polymer melt is expected
to flow as a Newtonian fluid.
Spatial and temporal fluid inertia can be neglected due to the small
Reynolds number Re = γa2ρ/η 1 and its product with the Strouhal number
Re Sr 1, where Sr = ω/γ (Batchelor 1967). The characteristic shear strain
rate γ ∼ ωγ, where γ is the characteristic shear strain (Larson 1999). For
the parallel-plate rheometer used by Mackay et al. (2003) and Tuteja et al.
(2005), Soskey & Winter (1984) showed that a linear response is achieved with
γ ≤ 0.2, so we conservatively estimate γ ≈ 0.11 . Note that the reciprocal
shear strain rate γ−1 is the characteristic time for a polymer coil to convect
past a nanoparticle. Consequently, in the experiments of Mackay et al. (2003)
and Tuteja et al. (2005), Re = ωγa2ρo/ηo ∼ 10−22 and Sr = γ−1 ∼ 10−21 when
ω ∼ 0.01 rad s−1 and a ' 3 nm.
The intrinsic viscosity of nanoparticles dispersed in an incompressible
Newtonian fluid can be obtained by solving the quasi-steady mass and mo-
mentum conservation equations with uniform polymer viscosity and density
in a spherically symmetric shell. With the assumptions above, the governing
equations are well-known Stokes equations:
0 = ∇ · u, (5.3a)
0 = −∇p+ η∇2u. (5.3b)
The boundary conditions at the particle surface demand zero radial ve-
locity and, in general, finite tangential slip. Accordingly, at r = a:
u · n = 0, (5.4a)
t− t · nn = kη(u− u · nn). (5.4b)
1 Mackay et al. (2003) and Tuteja et al. (2005) did not report γ.
108
Here, t = T · n is the surface traction, k is a slipping-friction parameter—
hereafter referred to as a reciprocal slipping length—and n is an outward unit
normal. When k = 0, the polymer slips without resistance along the nanopar-
ticle surface, whereas k → ∞ reproduces the conventional no-slip boundary
condition. Note that slipping of polymer at interfaces has been theoretically
discussed (Brochard & de Gennes 1992) and experimentally observed (Migler
et al. 1993) at small scales.
We demand a continuous stress and mass flux at the interface between the
uniform layer and the bulk polymer (r = a+δ). This ensures that a continuum
of uniform shells, each with uniform density and viscosity, yields the solution
of the mass and momentum conservations equations with continuous, radially
varying density and viscosity. Accordingly, at r = a+ δ:
Ti = To, (5.5a)
ρiui = ρouo, (5.5b)
where superscripts “i” and “o” indicate quantities evaluated inside and outside
the interface, respectively.
A continuous mass flux is consistent with the mass conservation equation
∂ρ/∂t+∇ ·(ρu) = 0. Although the polymer melt is considered incompressible
on both sides of the interface, individual chains are compressible, and they
must be compressed or dilated as they convect through the interface or, indeed,
through a region of continuously varying density. With the continuous stress
boundary condition, we neglected the force required to compress or dilate
polymer when it moves across the interface, since this force is much smaller
than the viscous force. For each nanoparticle, the viscous force fv ∼ ηγ(a+δ)2,
and with γ ∼ 10−3 s−1 and η ∼ 105 Pa s in the experiments, fv ∼ 102(a+δ)2 N.
On the other hand, the force fp required to move the polymer across the
interface scales as fp ∼ κ∆Rg[(a+δ)/Rg]2, where κ is the polymer chain spring
constant and ∆Rg is the extent of the chain compression or dilation. Using
the dumbbell model (Larson 1999), the chain spring constant κ = kBT (2R2g)−1
109
with kBT the thermal energy. At the experimental temperature T = 170C,
assuming the chain deformation ∆Rg/Rg ∼ 0.01 and Rg ∼ 20 nm, fp ∼
4(a+δ)2 N, so fp/fv ∼ 0.04 1, which justifies the continuous stress boundary
condition.
As r →∞, vanishing of the disturbance velocity and pressure require
u → E · r, (5.6a)
p → 0. (5.6b)
Linearity of the Stokes equations and boundary conditions require that
u and p are linear in E, so the general solution inside the layer must have the
form (Lamb 1945)
ui =c1
2ηirE:∇∇r−1 +
c2
2ηir5rE:∇∇r−1 + c4E ·∇r−1
+c5r3E ·∇r−1 + c6E:∇∇∇r−1 + c7r
7E:∇∇∇r−1, (5.7a)
pi = c1E:∇∇r−1 + c2r5E:∇∇r−1, (5.7b)
and, similarly, outside the layer
uo =c3
2ηorE:∇∇r−1 + c8E ·∇r−1 + c9E:∇∇∇r−1 + E · r, (5.7c)
po = c3E:∇∇r−1. (5.7d)
Note that (5.7c) and (5.7d) satisfy the far-field boundary conditions (5.6a)
and (5.6b). The nine scalar constants c1, c2, . . . , c9 can be specified to satisfy
two (scalar) mass-conservation equations, i.e., ∇ ·ui = ∇ ·uo = 0, and seven
scalar equations from the boundary conditions at r = a and r = a + δ: there
are two scalar equations from (5.4a) and (5.4b) at r = a, which are linear in
E · r and E:rrr; two from (5.5b) at r = a + δ, which are linear in E · r and
E:rrr; and three from (5.5a) at r = a + δ, which are linear in E, E · rr, and
E:rrrr.
The intrinsic viscosity can be obtained from the strength of the r−3
(quadrupole) decay of the velocity disturbance (Batchelor 1967). It follows
110
that [η] = −(3/2)a−3(ηo)−1c3. Solving the Stokes equations above with the
boundary conditions gives
[η] =(A′χ2 +B′χ+ C ′) + ka(D′χ2 + E ′χ+ F ′)
(Aχ2 +Bχ+ C) + ka(Dχ2 + Eχ+ F ), (5.8)
where a′ = a+ δ, χ = (ηi/ηo)/(ρi/ρo), and
A = −480a13 − 800a10a′3 + 900a6a′7 + 380a3a′10, (5.9a)
B = 960a13 − 400a10a′3 + 300a6a′7 + 890a3a′10, (5.9b)
C = −480a13 + 1200a10a′3 − 1200a6a′7 + 480a3a′10, (5.9c)
D = 96a13 + 400a10a′3 − 672a8a′5 + 450a6a′7 + 76a3a′10, (5.9d)
E = −192a13 + 200a10a′3 − 336a8a′5 + 150a6a′7 + 178a3a′10, (5.9e)
F = 96a13 − 600a10a′3 + 1008a8a′5 − 600a6a′7 + 96a3a′10, (5.9f)
A′ = −1200a10a′3 − 2000a7a′6 + 2250a3a′10 + 950a′13, (5.9g)
B′ = 400a10a′3 + 4000a7a′6 − 2500a3a′10 − 150a′13, (5.9h)
C ′ = 800a10a′3 − 2000a7a′6 + 2000a3a′10 − 800a′13, (5.9i)
D′ = 240a10a′3 + 1000a7a′6 − 1680a5a′8 + 1125a3a′10 + 190a′13, (5.9j)
E ′ = −80a10a′3 − 2000a7a′6 + 3360a5a′8 − 1250a3a′10 − 30a′13, (5.9k)
F ′ = −160a10a′3 + 1000a7a′6 − 1680a5a′8 + 1000a3a′10 − 160a′13.(5.9l)
An important limiting case arises when a → 0. This corresponds to an
instantaneously spherical, deformable drop-like particle with radius δ. The
intrinsic viscosity is
[η] =5χ− 5
2χ+ 3. (5.10)
Note that to calculate the bulk viscosity using (5.1), φ = n(4/3)πδ3 with n
the particle number density.
Equation (5.10) reveals that, when χ→∞ (rigid bubble), [η]→ 5/2, so,
as expected, the shell mimics an impenetrable, rigid sphere. When χ → 0
(inviscid bubble), [η]→ −5/3, which is different from the intrinsic viscosity of
undeformable bubbles with impenetrable surface, i.e., [η] = 1 (Taylor 1932).
111
Brennen (1975) obtained (5.10) using a “cell” model for the intrinsic viscosity
of droplets enclosed by an infinitely deformable membrane in the dilute limit.
This earlier result validates the present model in the liquid-droplet regime
(a→ 0).
It is important to note that the layer around a rigid nanoparticle un-
dergoes continuous deformation, while polymer chains passing through the
interface must be simultaneously compressed or dilated to maintain—to lead-
ing order in the perturbed density and velocity—the equilibrium structure of
the layer. This requires the polymer self-diffusion time to be much shorter
than the characteristic flow deformation time. For PS melts, the self diffu-
sion coefficients Ds ∼ 10−15 and 10−17 m2 s−1 for molecular weights of 75 and
393 kDa, respectively (Green & Kramer 1986). The corresponding self diffu-
sion times a2/Ds ∼ 0.1 and 10 s when a = 10 nm, which are much shorter
than ω−1 and γ−1 in the experiments.
5.3 Intrinsic viscosity from the single-layer model
The intrinsic viscosity from (5.8) depends on three dimensionless param-
eters: the scaled layer thickness δ/a, the scaled reciprocal slipping length
ka, and a layer property parameter χ = (ηi/ηo)/(ρi/ρo). In polymer solu-
tions (de Gennes 1979; Larson 1999), the bulk viscosity increases with the
polymer concentration according to a power law. Considering the similarity
between polymer melts and solutions, it is natural to assume that the viscos-
ity in the layer varies with the polymer segment density as η ∼ ρn (n > 0).
Consequently, χ = (ρi/ρo)n−1, and when ρi < ρo, it follows that χ < 1 if n > 1.
Figures 5–1 and 5–2 present the effect of scaled layer thickness δ/a on the
intrinsic viscosity [η] for χ ≤ 1 and χ ≥ 1, respectively. Evidently, when the
layer properties are identical to those of the bulk polymer melt, i.e., χ = 1, [η]
is independent of the layer thickness. Note that ka = 0 gives [η] = 1, which
mimics the intrinsic viscosity of an inviscid spherical bubble, and ka→∞ gives
[η] → 5/2, which recovers the hard-sphere result from Einstein (1906). With
increasing layer thickness δ/a, the intrinsic viscosity decreases from positive
112
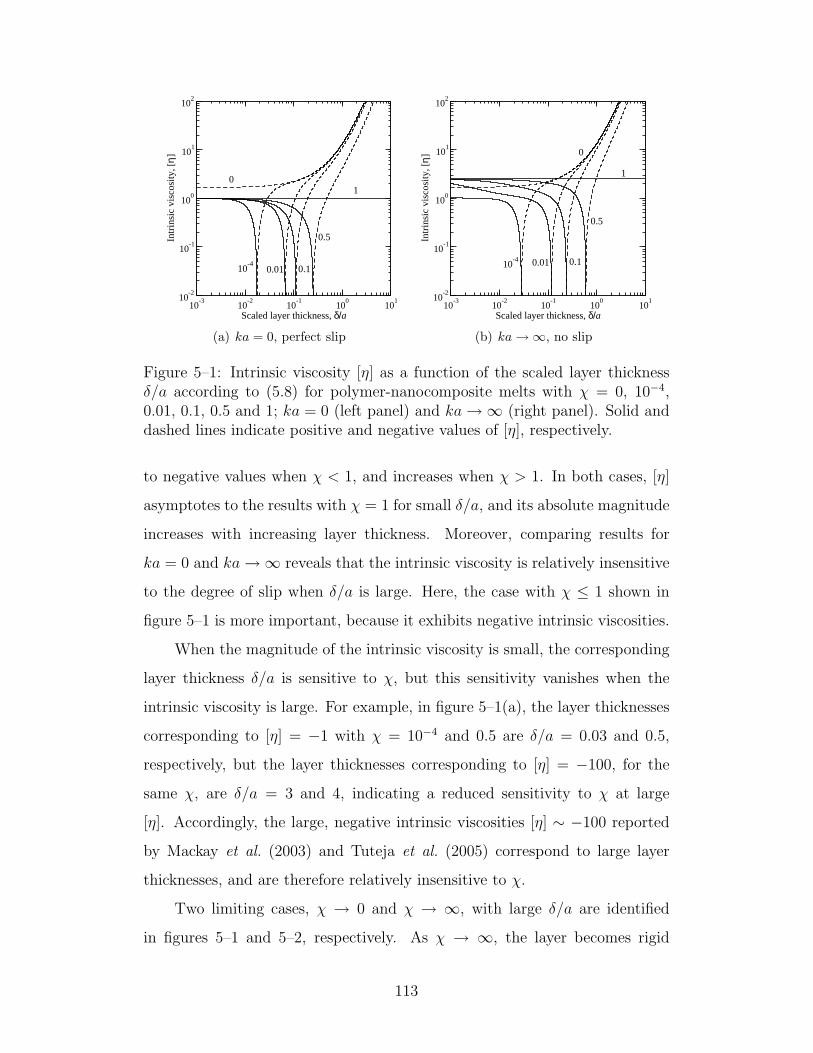
10-3
10-2
10-1
100
101
Scaled layer thickness, δ/a
10-2
10-1
100
101
102
Intr
insi
c vi
scos
ity, [
η]0
10-4
1
0.01
0.5
0.1
(a) ka = 0, perfect slip
10-3
10-2
10-1
100
101
Scaled layer thickness, δ/a
10-2
10-1
100
101
102
Intr
insi
c vi
scos
ity, [
η]
0
10-4
1
0.01
0.5
0.1
(b) ka→∞, no slip
Figure 5–1: Intrinsic viscosity [η] as a function of the scaled layer thicknessδ/a according to (5.8) for polymer-nanocomposite melts with χ = 0, 10−4,0.01, 0.1, 0.5 and 1; ka = 0 (left panel) and ka→∞ (right panel). Solid anddashed lines indicate positive and negative values of [η], respectively.
to negative values when χ < 1, and increases when χ > 1. In both cases, [η]
asymptotes to the results with χ = 1 for small δ/a, and its absolute magnitude
increases with increasing layer thickness. Moreover, comparing results for
ka = 0 and ka→∞ reveals that the intrinsic viscosity is relatively insensitive
to the degree of slip when δ/a is large. Here, the case with χ ≤ 1 shown in
figure 5–1 is more important, because it exhibits negative intrinsic viscosities.
When the magnitude of the intrinsic viscosity is small, the corresponding
layer thickness δ/a is sensitive to χ, but this sensitivity vanishes when the
intrinsic viscosity is large. For example, in figure 5–1(a), the layer thicknesses
corresponding to [η] = −1 with χ = 10−4 and 0.5 are δ/a = 0.03 and 0.5,
respectively, but the layer thicknesses corresponding to [η] = −100, for the
same χ, are δ/a = 3 and 4, indicating a reduced sensitivity to χ at large
[η]. Accordingly, the large, negative intrinsic viscosities [η] ∼ −100 reported
by Mackay et al. (2003) and Tuteja et al. (2005) correspond to large layer
thicknesses, and are therefore relatively insensitive to χ.
Two limiting cases, χ → 0 and χ → ∞, with large δ/a are identified
in figures 5–1 and 5–2, respectively. As χ → ∞, the layer becomes rigid
113
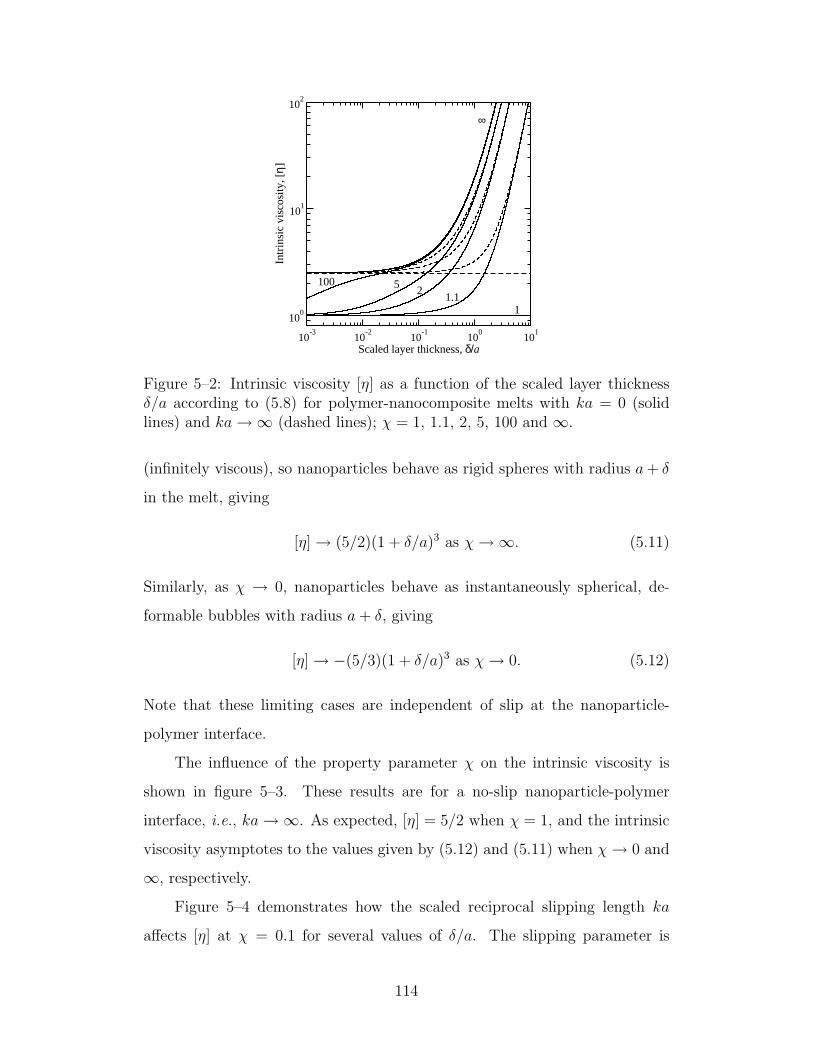
10-3
10-2
10-1
100
101
Scaled layer thickness, δ/a
100
101
102
Intr
insi
c vi
scos
ity, [
η]
11.1
25100
∞
Figure 5–2: Intrinsic viscosity [η] as a function of the scaled layer thicknessδ/a according to (5.8) for polymer-nanocomposite melts with ka = 0 (solidlines) and ka→∞ (dashed lines); χ = 1, 1.1, 2, 5, 100 and ∞.
(infinitely viscous), so nanoparticles behave as rigid spheres with radius a+ δ
in the melt, giving
[η]→ (5/2)(1 + δ/a)3 as χ→∞. (5.11)
Similarly, as χ → 0, nanoparticles behave as instantaneously spherical, de-
formable bubbles with radius a+ δ, giving
[η]→ −(5/3)(1 + δ/a)3 as χ→ 0. (5.12)
Note that these limiting cases are independent of slip at the nanoparticle-
polymer interface.
The influence of the property parameter χ on the intrinsic viscosity is
shown in figure 5–3. These results are for a no-slip nanoparticle-polymer
interface, i.e., ka→∞. As expected, [η] = 5/2 when χ = 1, and the intrinsic
viscosity asymptotes to the values given by (5.12) and (5.11) when χ→ 0 and
∞, respectively.
Figure 5–4 demonstrates how the scaled reciprocal slipping length ka
affects [η] at χ = 0.1 for several values of δ/a. The slipping parameter is
114
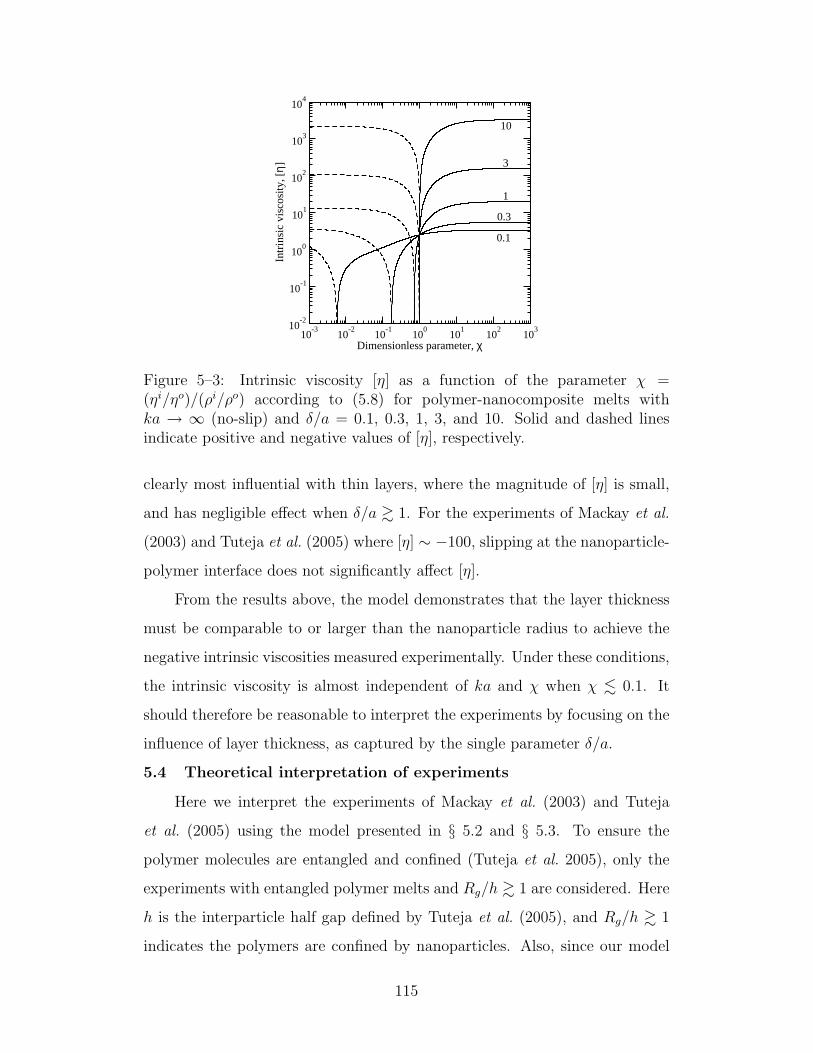
10-3
10-2
10-1
100
101
102
103
Dimensionless parameter, χ
10-2
10-1
100
101
102
103
104
Intr
insi
c vi
scos
ity, [
η]
0.1
0.3
1
3
10
Figure 5–3: Intrinsic viscosity [η] as a function of the parameter χ =(ηi/ηo)/(ρi/ρo) according to (5.8) for polymer-nanocomposite melts withka → ∞ (no-slip) and δ/a = 0.1, 0.3, 1, 3, and 10. Solid and dashed linesindicate positive and negative values of [η], respectively.
clearly most influential with thin layers, where the magnitude of [η] is small,
and has negligible effect when δ/a & 1. For the experiments of Mackay et al.
(2003) and Tuteja et al. (2005) where [η] ∼ −100, slipping at the nanoparticle-
polymer interface does not significantly affect [η].
From the results above, the model demonstrates that the layer thickness
must be comparable to or larger than the nanoparticle radius to achieve the
negative intrinsic viscosities measured experimentally. Under these conditions,
the intrinsic viscosity is almost independent of ka and χ when χ . 0.1. It
should therefore be reasonable to interpret the experiments by focusing on the
influence of layer thickness, as captured by the single parameter δ/a.
5.4 Theoretical interpretation of experiments
Here we interpret the experiments of Mackay et al. (2003) and Tuteja
et al. (2005) using the model presented in § 5.2 and § 5.3. To ensure the
polymer molecules are entangled and confined (Tuteja et al. 2005), only the
experiments with entangled polymer melts and Rg/h & 1 are considered. Here
h is the interparticle half gap defined by Tuteja et al. (2005), and Rg/h & 1
indicates the polymers are confined by nanoparticles. Also, since our model
115
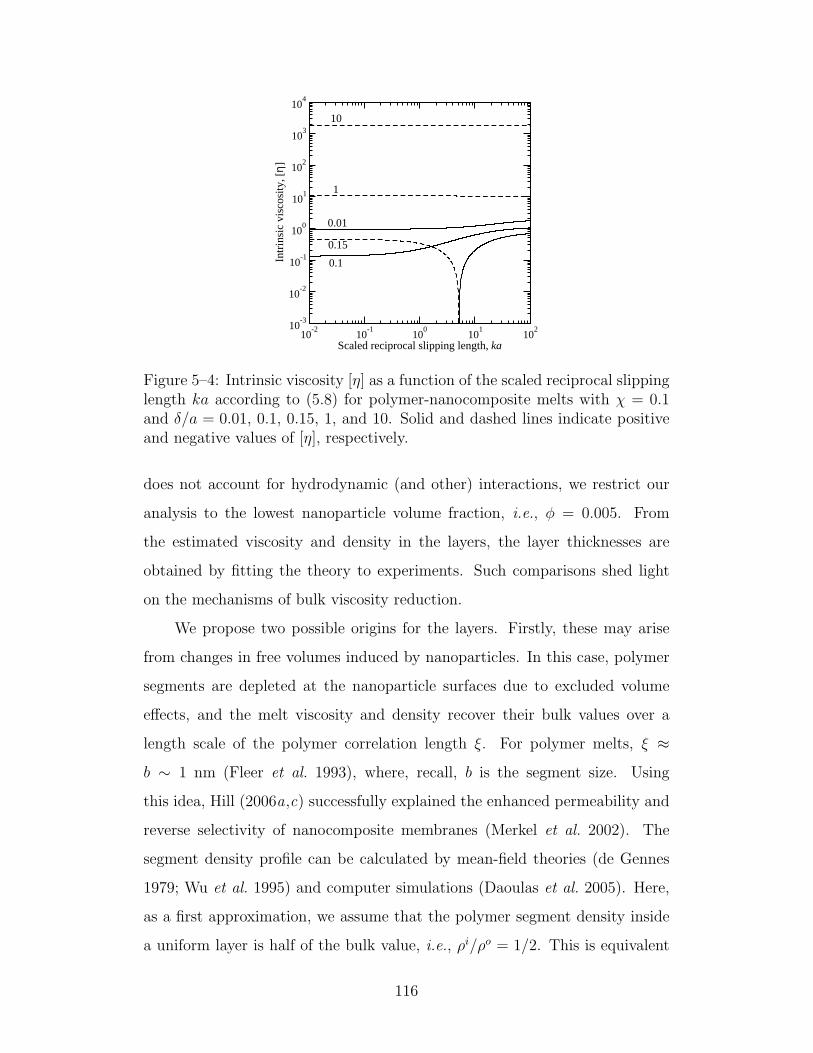
10-2
10-1
100
101
102
Scaled reciprocal slipping length, ka
10-3
10-2
10-1
100
101
102
103
104
Intr
insi
c vi
scos
ity, [
η]
0.01
0.1
0.15
1
10
Figure 5–4: Intrinsic viscosity [η] as a function of the scaled reciprocal slippinglength ka according to (5.8) for polymer-nanocomposite melts with χ = 0.1and δ/a = 0.01, 0.1, 0.15, 1, and 10. Solid and dashed lines indicate positiveand negative values of [η], respectively.
does not account for hydrodynamic (and other) interactions, we restrict our
analysis to the lowest nanoparticle volume fraction, i.e., φ = 0.005. From
the estimated viscosity and density in the layers, the layer thicknesses are
obtained by fitting the theory to experiments. Such comparisons shed light
on the mechanisms of bulk viscosity reduction.
We propose two possible origins for the layers. Firstly, these may arise
from changes in free volumes induced by nanoparticles. In this case, polymer
segments are depleted at the nanoparticle surfaces due to excluded volume
effects, and the melt viscosity and density recover their bulk values over a
length scale of the polymer correlation length ξ. For polymer melts, ξ ≈
b ∼ 1 nm (Fleer et al. 1993), where, recall, b is the segment size. Using
this idea, Hill (2006a,c) successfully explained the enhanced permeability and
reverse selectivity of nanocomposite membranes (Merkel et al. 2002). The
segment density profile can be calculated by mean-field theories (de Gennes
1979; Wu et al. 1995) and computer simulations (Daoulas et al. 2005). Here,
as a first approximation, we assume that the polymer segment density inside
a uniform layer is half of the bulk value, i.e., ρi/ρo = 1/2. This is equivalent
116
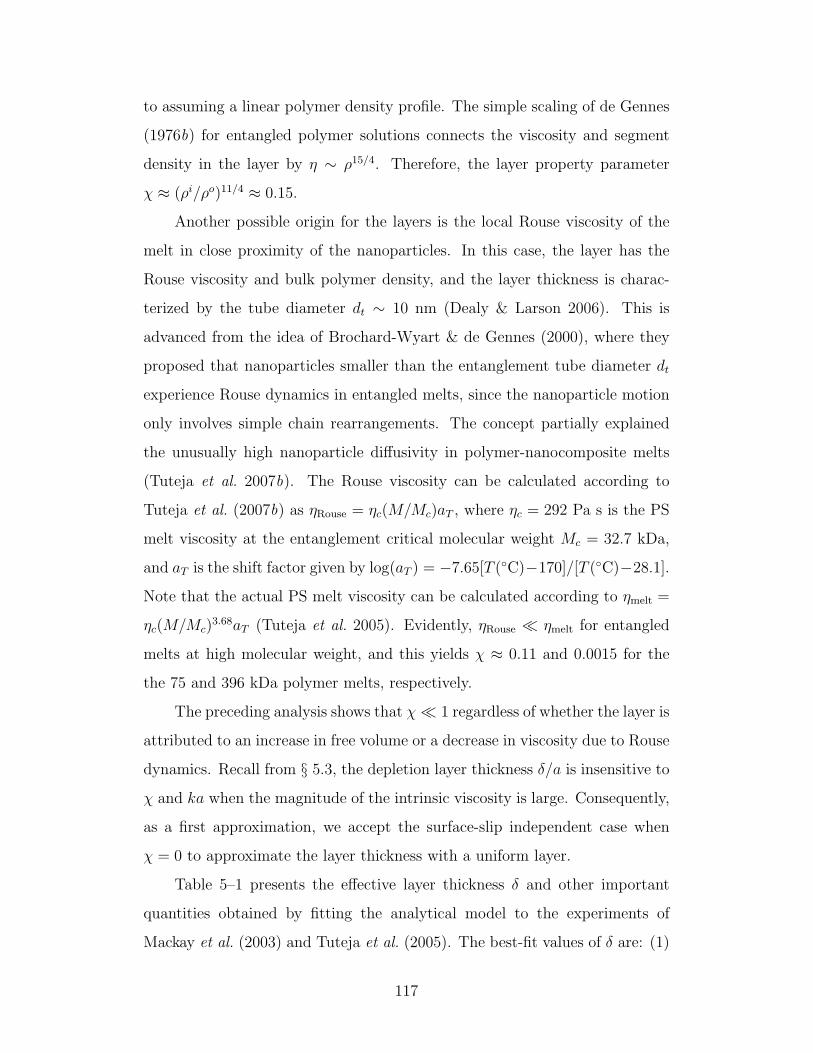
to assuming a linear polymer density profile. The simple scaling of de Gennes
(1976b) for entangled polymer solutions connects the viscosity and segment
density in the layer by η ∼ ρ15/4. Therefore, the layer property parameter
χ ≈ (ρi/ρo)11/4 ≈ 0.15.
Another possible origin for the layers is the local Rouse viscosity of the
melt in close proximity of the nanoparticles. In this case, the layer has the
Rouse viscosity and bulk polymer density, and the layer thickness is charac-
terized by the tube diameter dt ∼ 10 nm (Dealy & Larson 2006). This is
advanced from the idea of Brochard-Wyart & de Gennes (2000), where they
proposed that nanoparticles smaller than the entanglement tube diameter dt
experience Rouse dynamics in entangled melts, since the nanoparticle motion
only involves simple chain rearrangements. The concept partially explained
the unusually high nanoparticle diffusivity in polymer-nanocomposite melts
(Tuteja et al. 2007b). The Rouse viscosity can be calculated according to
Tuteja et al. (2007b) as ηRouse = ηc(M/Mc)aT , where ηc = 292 Pa s is the PS
melt viscosity at the entanglement critical molecular weight Mc = 32.7 kDa,
and aT is the shift factor given by log(aT ) = −7.65[T (C)−170]/[T (C)−28.1].
Note that the actual PS melt viscosity can be calculated according to ηmelt =
ηc(M/Mc)3.68aT (Tuteja et al. 2005). Evidently, ηRouse ηmelt for entangled
melts at high molecular weight, and this yields χ ≈ 0.11 and 0.0015 for the
the 75 and 396 kDa polymer melts, respectively.
The preceding analysis shows that χ 1 regardless of whether the layer is
attributed to an increase in free volume or a decrease in viscosity due to Rouse
dynamics. Recall from § 5.3, the depletion layer thickness δ/a is insensitive to
χ and ka when the magnitude of the intrinsic viscosity is large. Consequently,
as a first approximation, we accept the surface-slip independent case when
χ = 0 to approximate the layer thickness with a uniform layer.
Table 5–1 presents the effective layer thickness δ and other important
quantities obtained by fitting the analytical model to the experiments of
Mackay et al. (2003) and Tuteja et al. (2005). The best-fit values of δ are: (1)
117
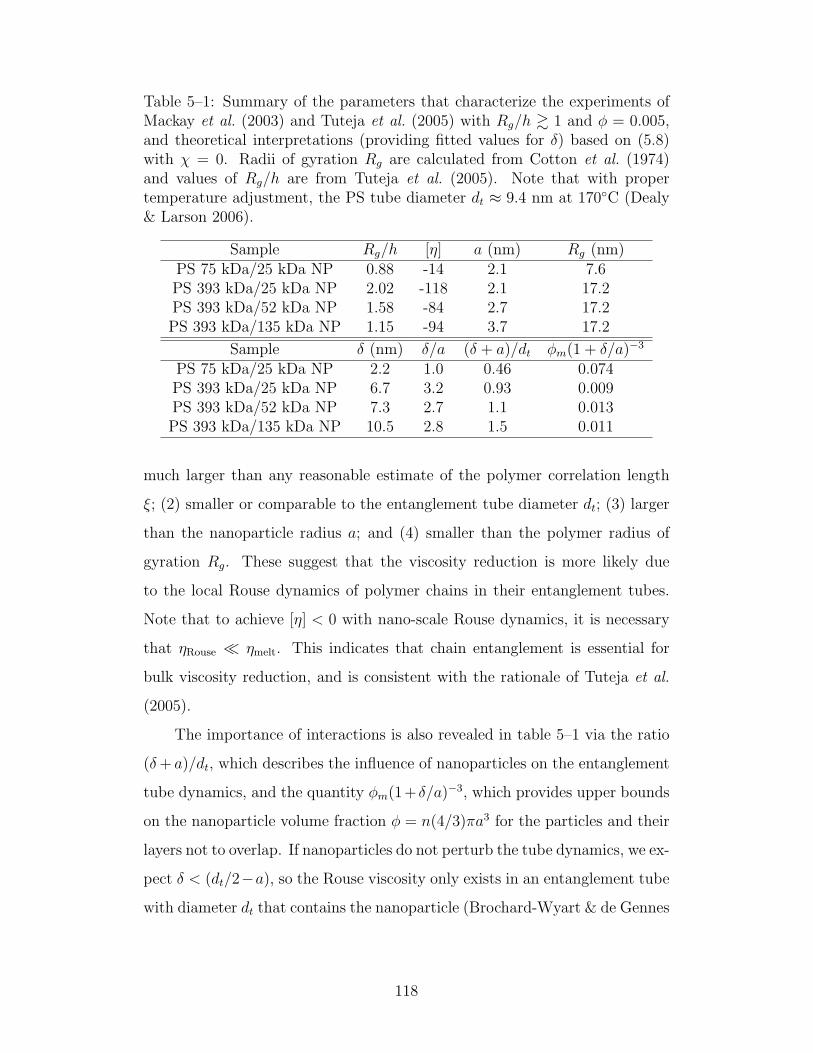
Table 5–1: Summary of the parameters that characterize the experiments ofMackay et al. (2003) and Tuteja et al. (2005) with Rg/h & 1 and φ = 0.005,and theoretical interpretations (providing fitted values for δ) based on (5.8)with χ = 0. Radii of gyration Rg are calculated from Cotton et al. (1974)and values of Rg/h are from Tuteja et al. (2005). Note that with propertemperature adjustment, the PS tube diameter dt ≈ 9.4 nm at 170C (Dealy& Larson 2006).
Sample Rg/h [η] a (nm) Rg (nm)PS 75 kDa/25 kDa NP 0.88 -14 2.1 7.6PS 393 kDa/25 kDa NP 2.02 -118 2.1 17.2PS 393 kDa/52 kDa NP 1.58 -84 2.7 17.2PS 393 kDa/135 kDa NP 1.15 -94 3.7 17.2
Sample δ (nm) δ/a (δ + a)/dt φm(1 + δ/a)−3
PS 75 kDa/25 kDa NP 2.2 1.0 0.46 0.074PS 393 kDa/25 kDa NP 6.7 3.2 0.93 0.009PS 393 kDa/52 kDa NP 7.3 2.7 1.1 0.013PS 393 kDa/135 kDa NP 10.5 2.8 1.5 0.011
much larger than any reasonable estimate of the polymer correlation length
ξ; (2) smaller or comparable to the entanglement tube diameter dt; (3) larger
than the nanoparticle radius a; and (4) smaller than the polymer radius of
gyration Rg. These suggest that the viscosity reduction is more likely due
to the local Rouse dynamics of polymer chains in their entanglement tubes.
Note that to achieve [η] < 0 with nano-scale Rouse dynamics, it is necessary
that ηRouse ηmelt. This indicates that chain entanglement is essential for
bulk viscosity reduction, and is consistent with the rationale of Tuteja et al.
(2005).
The importance of interactions is also revealed in table 5–1 via the ratio
(δ+ a)/dt, which describes the influence of nanoparticles on the entanglement
tube dynamics, and the quantity φm(1+ δ/a)−3, which provides upper bounds
on the nanoparticle volume fraction φ = n(4/3)πa3 for the particles and their
layers not to overlap. If nanoparticles do not perturb the tube dynamics, we ex-
pect δ < (dt/2−a), so the Rouse viscosity only exists in an entanglement tube
with diameter dt that contains the nanoparticle (Brochard-Wyart & de Gennes
118
2000). However, (δ + a)/dt > 1/2 implies strong polymer-nanoparticle inter-
actions, because the thickness of the layer exceeds the entanglement tube
diameter for a pure melt.
Evidently, the experimental data giving (δ + a)/dt > 1/2 are always ac-
companied by small φm(1 + δ/a)−3 close to the actual nanoparticle volume
fraction φ = 0.005. This implies that distorted polymer configurations may
arise from nanoparticle interactions. Moreover, careful examination of data
from Tuteja et al. (2005) reveals that interactions also introduce strong free-
volume effects on the composite, as is evidenced by the large change in Tg.
Note that this is different from the free volumes introduced by excluded vol-
ume effects described above, which give rise to a layer thickness δ ∼ 1 nm,
and consequently a moderate negative intrinsic viscosity [η] ≈ −5. Clearly,
the large negative intrinsic viscosities observed by Mackay et al. (2003) and
Tuteja et al. (2005) are the result of strong polymer-mediated interactions
between nanoparticles and the polymer. Accordingly, we envision no clear
distinction between the bulk polymer and polymer in layers, so extending our
notion of perturbed polymer layers surrounding individual nanoparticles in an
unperturbed bulk polymer, we hypothesize that the polymer is everywhere
perturbed by the nanoparticles.
With weak interactions, the nano-scale Rouse dynamics in the polymer
entanglement tubes give rise to negative intrinsic viscosities much smaller in
magnitude than those with strong interactions. This is evidenced from the PS
75 kDa/25 kDa NP polymer nanocomposite in table 5–1, which shows (δ +
a)/dt < 1/2, φm(1 + δ/a)−3 φ, and the glass transition temperature change
∆Tg = 0.1C (Tuteja et al. 2005). Clearly, weak interactions explain the
thinnest depletion layer and moderate negative intrinsic viscosity achieved by
this sample, which is representative of a single nanoparticle in an unperturbed
entangled polymer melt.
Our uniform layer model can be extended to handle continuous polymer
density and viscosity layers by extending the uniform layer model to multiple
119
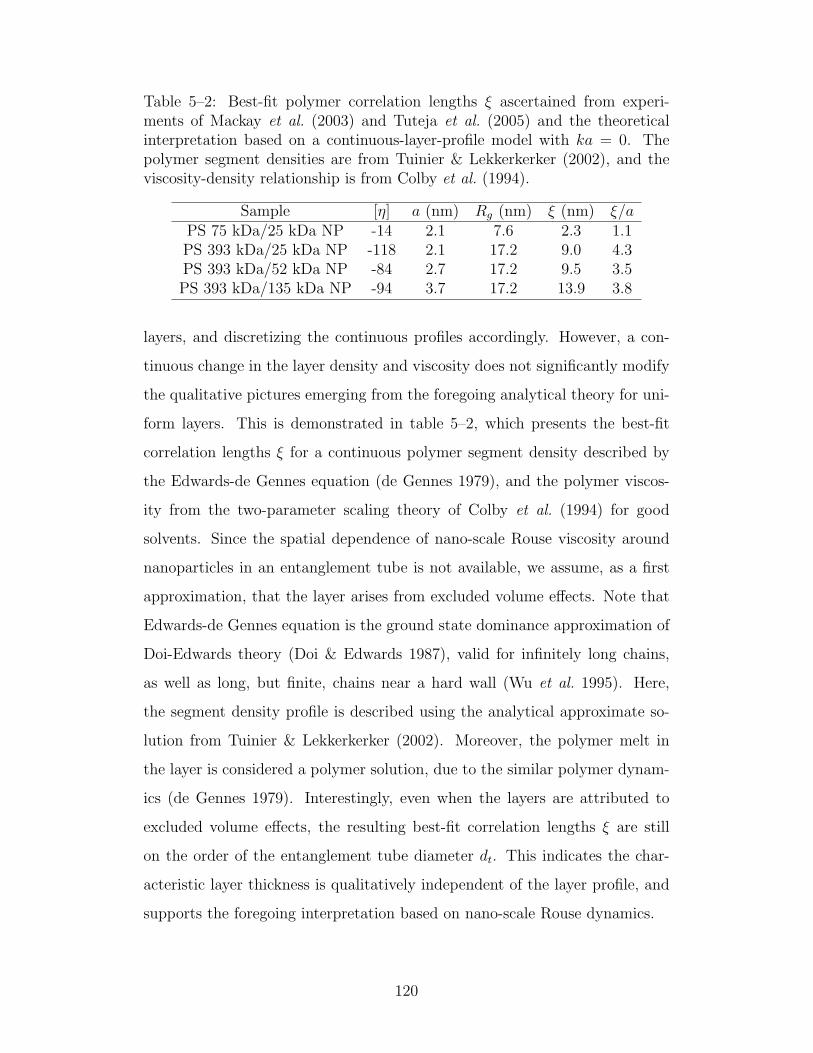
Table 5–2: Best-fit polymer correlation lengths ξ ascertained from experi-ments of Mackay et al. (2003) and Tuteja et al. (2005) and the theoreticalinterpretation based on a continuous-layer-profile model with ka = 0. Thepolymer segment densities are from Tuinier & Lekkerkerker (2002), and theviscosity-density relationship is from Colby et al. (1994).
Sample [η] a (nm) Rg (nm) ξ (nm) ξ/aPS 75 kDa/25 kDa NP -14 2.1 7.6 2.3 1.1PS 393 kDa/25 kDa NP -118 2.1 17.2 9.0 4.3PS 393 kDa/52 kDa NP -84 2.7 17.2 9.5 3.5PS 393 kDa/135 kDa NP -94 3.7 17.2 13.9 3.8
layers, and discretizing the continuous profiles accordingly. However, a con-
tinuous change in the layer density and viscosity does not significantly modify
the qualitative pictures emerging from the foregoing analytical theory for uni-
form layers. This is demonstrated in table 5–2, which presents the best-fit
correlation lengths ξ for a continuous polymer segment density described by
the Edwards-de Gennes equation (de Gennes 1979), and the polymer viscos-
ity from the two-parameter scaling theory of Colby et al. (1994) for good
solvents. Since the spatial dependence of nano-scale Rouse viscosity around
nanoparticles in an entanglement tube is not available, we assume, as a first
approximation, that the layer arises from excluded volume effects. Note that
Edwards-de Gennes equation is the ground state dominance approximation of
Doi-Edwards theory (Doi & Edwards 1987), valid for infinitely long chains,
as well as long, but finite, chains near a hard wall (Wu et al. 1995). Here,
the segment density profile is described using the analytical approximate so-
lution from Tuinier & Lekkerkerker (2002). Moreover, the polymer melt in
the layer is considered a polymer solution, due to the similar polymer dynam-
ics (de Gennes 1979). Interestingly, even when the layers are attributed to
excluded volume effects, the resulting best-fit correlation lengths ξ are still
on the order of the entanglement tube diameter dt. This indicates the char-
acteristic layer thickness is qualitatively independent of the layer profile, and
supports the foregoing interpretation based on nano-scale Rouse dynamics.
120
5.5 Summary and conclusions
We proposed a simple hydrodynamic model to interpret the reduced
bulk viscosity of polymer-nanocomposite melts observed by Mackay et al.
(2003) and Tuteja et al. (2005). The model adopts a uniform viscosity and
density layer around nanoparticles, and can be easily extended to continu-
ous layer profiles (as demonstrated by the results in table 5–2). Comparing
the theory with experiments suggests that the reduced bulk viscosity arises
from nano-scale Rouse dynamics experienced by nanoparticles in entanglement
tubes (Brochard-Wyart & de Gennes 2000) when the nanoparticle-polymer
interactions are weak. Our model also confirms that polymer-mediated inter-
actions are indeed crucial for the large bulk viscosity reductions found with
high molecular weight polymer, as first pointed out by Tuteja et al. (2005).
The comparison also suggests that the polymers in samples that exhibit a large
bulk viscosity reduction are strongly perturbed. We further demonstrated that
a continuous variation of polymer density and viscosity around nanoparticles
does not change the qualitative picture emerging from our analytical expres-
sion for a single uniform layer. Our model showed how the microstructure
affects the bulk viscosity in a manner that is consistent with experiments, and
it highlighted how sensitive the bulk viscosity is to interactions between the
nanoparticles and polymer.
121
CHAPTER 6Summary and conclusions
This thesis showed (i) the influences of the continuous phase on the
single-particle and bulk-composite responses by investigating the electric-field-
induced steady and dynamic responses of charged colloidal particles embedded
in uncharged hydrogel matrices and (ii) the influences of colloid-induced mi-
crostructural changes on composite transport properties by theoretically inter-
preting the recently discovered anomalous bulk viscosity reduction in polymer-
nanocomposite melts. The objectives outlined in § 1.2 have been accomplished,
and the theories and results presented in chapters 3–5 contribute to our un-
derstanding of the dynamics of interacting dispersed and continuous phases in
colloid composites. These dynamics are crucial for developing new composite
materials and diagnostic techniques to probe their microstructures.
Chapters 3 and 4 investigated the steady and dynamic electric-field-induced
responses of a charged colloidal particle in an uncharged hydrogel matrix.
These theoretical studies are not only important for understanding the in-
fluences of complex fluids, but also serve as rigorous foundations for electric
microrheology and electroacoustic techniques. A multi-phase electrokinetic
model, generalized from the standard electrokinetic model, was used to de-
scribe the polymer displacement, fluid velocity, ion fluxes and electrostatic
potentials. Computer programs based on MPEK (Hill et al. 2003a) were de-
veloped to solve the multi-phase electrokinetic model accurately with steady
and dynamic electrical forcing. Generally, the electric-field-induced particle
responses depend on both the hydrogel viscoelastic and the particle physico-
chemical properties, making the electric-field-based characterizations distinct
from existing techniques. Chapter 3 showed that the particle displacements
in compressible hydrogels with Poisson’s ratio close to zero can be an order of
122
magnitude larger than those for incompressible hydrogels. This is confirmed
by dynamic studies in chapter 4, where the response spectra for compress-
ible hydrogels present an evident transition from quasi-steady compressible
to quasi-steady incompressible elastic regimes. These results imply that elec-
tric microrheology could be successfully applied to hydrogel-colloid composites
at frequencies below the reciprocal draining time. On the other hand, high
frequency responses can be measured using electroacoustics, and chapter 4
also showed that the electroacoustic signals and the single particle response
are connected by the theory of O’Brien (1988, 1990). Similarly to other elec-
trokinetic phenomena (Hunter 2001; Lyklema 1995), both steady and dynamic
responses exhibit double layer polarization and relaxation at large ζ-potentials.
Moreover, boundary-layer analytical approximations—valuable for interpret-
ing experiments—were derived in chapters 3 and 4 for both the steady and
dynamic forcing.
After studying the influences of a hydrogel matrix on particle responses
in chapters 3 and 4, chapter 5 focused on the effect of colloid-induced mi-
crostructural changes on the bulk viscosity of polymer-nanocomposite melts.
This chapter developed a hydrodynamic model that incorporates a polymer
layer with properties different from the bulk. The model suggested that the
bulk viscosity reductions observed in the experiments of Mackay et al. (2003)
and Tuteja et al. (2005) can be attributed to the Rouse dynamics in poly-
mer entanglement tubes experienced by the nanoparticles, as proposed by
Brochard-Wyart & de Gennes (2000). The model also revealed that the inter-
actions are strong in polymer-nanocomposite melts, and that polymer chains
are likely everywhere disturbed, as evidenced from the large fitted layer thick-
ness and free volume changes. This chapter shows the effect of the inhomo-
geneous layer as a result of colloid-induced microstructural changes, and is an
important first step toward more quantitative theories to interpret intriguing
nano-scale phenomena, such as bulk viscosity reduction.
123
Experimental verifications of the theoretical treatment presented in chap-
ters 3 and 4 using electric microrheology and electroacoustics are recommended
for future investigations. Other possibilities include studying the dielectric re-
laxation spectra of dilute hydrogel-colloid composites theoretically and exper-
imentally, and developing new theories that take particle-particle interactions
into account. For the colloid-induced bulk viscosity reduction, theoretical,
simulation, and experimental studies focused on resolving the polymer-particle
and particle-particle interactions that influence these anomalous behaviors are
recommended.
124
REFERENCES
Abetz, V., Brinkmann, T., Dijkstra, M., Ebert, K., Fritsch, D.,Ohlrogge, K., Paul, D., Peinemann, K. V., Nunes, S. P.,Scharnagl, N. & Schossig, M. 2006 Developments in membrane re-search: from material via process design to industrial application. Ad-vanced Engineering Materials 8, 328–358.
Ahualli, S., Delgado, A. V., Miklavcic, S. J. & White, L. R. 2006Dynamic electrophoretic mobility of concentrated dispersions of sphericalcolloidal particle. On the consistent use of the cell model. Langmuir 22,7041–7051.
Allersma, M. W., Gittes, F., deCastro, M. J., Stewart, R. J. &Schmidt, C. F. 1998 Two-dimensional tracking of ncd motility by backfocal plane interferometry. Biophysical Journal 74, 1074–1085.
Anderson, E., Bai, Z., Bischof, C., Blackford, S., Demmel, J.,Dongarra, J., Du Croz, J., Greenbaum, A., Hammarling, S.,McKenney, A. & Sorensen, D. 1999 LAPACK Users’ Guide, 3rdedn. Society for Industrial and Applied Mathematics.
Ascher, U. M., Mattheij, R. M. M. & Russell, R. D. 1988 Numeri-cal Solution of Boundary Value Problems for Ordinary Differential Equa-tions . Englewood Cliffs: Prentice Hall.
Barber, J. R. 2003 Elasticity , 2nd edn. Dordrecht: Springer.
Barndl, F., Sommer, F. & Goepferich, A. 2007 Rational design of hy-drogels for tissue engineering: impact of physical factors on cell behavior.Biomaterials 28 (2), 134–146.
Barrire, B. & Leibler, L. 2003 Kinetics of solvent absorption and perme-ation through a highly swellable elastomeric network. Journal of PolymerScience Part B: Polymer Physics 41, 166–182.
Batchelor, G. K. 1967 An Introduction to Fluid Dynamics . Cambridge:Cambridge University Press.
Baumgaertel, M., Schausberger, A. & Winter, H. H. 1990 The relax-ation of polymers with linear flexible chains of uniform length. RheologicaActa 29, 400–408.
Biot, M. A. 1941 General theory of three-dimensional consolidation. Journalof Applied Physics 12, 155–164.
Biot, M. A. 1956a Theory of propagation of elastic waves in a fluid-saturated
125
porous solid. I. low-frequency range. The Journal of The Acoustical Soci-ety of America 28, 168–178.
Biot, M. A. 1956b Theory of propagation of elastic waves in a fluid-saturatedporous solid. II. higher frequency range. The Journal of The AcousticalSociety of America 28, 179–191.
Booth, F. & Enderby, J. A. 1952 On electrical effects due to sound wavesin colloidal suspensions. Proceedings of the Physical Society. Section A65, 321–324.
Boudou, T., Ohayon, J., Arntz, Y., Finet, G., Picart, C. & Trac-qui, P. 2006 An extended modeling of the micropipette aspiration exper-iment for the characterization of the Young’s modulus and Poisson’s ratioof adherent thin biological samples: Numerical and experimental studies.Journal of Biomechanics 39, 1677–1685.
Brennen, C. 1975 A concentrated suspension model for the Couette rheologyof blood. Canadian Journal of Chemical Engineering 53, 126–133.
Breuer, K., ed. 2005 Microscale Diagnostic Techniques . Berlin: Springer.
Brinkman, H. C. 1947 A calculation of the viscous force exerted by a flowingfluid on a dense swarm of particles. Applied Scientific Research Section A1, 27–34.
Brochard, F. & de Gennes, P.-G. 1977 Dynamical scaling for polymersin theta solvents. Macromolecules 10, 1157–1161.
Brochard, F. & de Gennes, P.-G. 1992 Shear dependent slippage at apolymer/solid interface. Langmuir 8, 3033–3037.
Brochard-Wyart, F. & de Gennes, P.-G. 2000 Viscosity at small scalesin polymer melts. European Physical Journal E 1, 93–97.
Buscall, R. & Ettelaie, R. 2006 Colloidal dispersions in polymer melts.Industrial and Engineering Chemistry Research 45, 6915–6922.
Candau, S., Bastide, J. & Delsanti, M. 1982 Structural, elastic, anddynamic properties of swollen polymer networks. Advances in PolymerScience 44, 27–71.
Cash, J. R. & Mazzia, F. 2006 Hybrid mesh selection algorithms based onconditioning for two-point boundary value problems. Journal of Numeri-cal Analysis, Industrial and Applied Mathematics 1, 81–90.
Chaterji, S., Kwon, I. K. & Park, K. 2007 Smart polymeric gels: Re-defining the limits of biomedical devices. Progress in Polymer Science 32,1083–1122.
Chung, Y.-I., Ahn, K.-M., Jeon, S.-H., Lee, S.-Y., Lee, J.-H. &Tae, G. 2007 Enhanced bone regeneration with BMP-2 loaded functionnanoparticle-hydrogel complex. Journal of Controlled Release 121, 91–99.
126
Cicuta, P. & Donald, A. M. 2007 Microrheology: a review of the methodand applications. Soft Matter 3, 1449–1455.
Cohen, M. H. & Turnbull, D. 1959 Molecular transport in liquids andglasses. Journal of Chemical Physics 31, 1164–1169.
Colby, R. H., Rubinstein, M. & Daoud, M. 1994 Hydrodynamics ofpolymer solutions via two-parameter scaling. Journal de Physique II 4,1299–1310.
Cosgrove, T., ed. 2005 Colloid Science: Theory, Methods and Applications .Ames: Blackwell Publishing.
Cotton, J. P., Decker, D., Benoit, H., Farnoux, B., Higgins, J.,Jannink, G., Ober, R., Picot, C. & Cloizeau, J. D. 1974 Confor-mation of polymer chain in the bulk. Macromolecules 7, 863–872.
Coussy, O. 2004 Poromechanics . Chichester: Wiley.
Daoulas, K. C., Theodorou, D. N., Harmandaris, V. A., Karayian-nis, N. C. & Mavrantzas, V. G. 2005 Self-consistent-field study ofcompressible semiflexible melts adsorbed on a solid substrate and com-parison with atomistic simulations. Macromolecules 38, 7134–7149.
Dayton, P. A. & Ferrara, K. W. 2002 Targeted imaging using ultra-sound. Journal of Magnetic Resonance Imaging 16, 362–377.
Dealy, D. M. & Larson, R. G. 2006 Structure and Rheology of MoltenPolymers. From Structure to Flow Behavior and Back Again. Munich:Hanser.
Debye, P. 1933 A method for the determination of the mass of electrolyticions. Journal of Chemical Physics 1, 13–16.
DeLacey, E. H. B. & White, L. R. 1981 Dielectric response and conduc-tivity of dilute suspensions of colloidal particles. Journal of the ChemicalSociety, Faraday Transactions II 77, 2007–2039.
Doi, M. & Edwards, S. F. 1987 The Theory of Polymer Dynamics . NewYork: Oxford University Press.
Drury, J. L. & Mooney, D. J. 2003 Hydrogels for tissue engineering:scaffold design variables and applications. Biomaterials 24, 4337–4351.
Dukhin, A. S. & Goetz, P. J. 2002 Ultrasound for Characterizing ColloidsParticle Sizing, Zeta Potential, Rheology . Amsterdam: Elsevier.
Dukhin, A. S., Goetz, P. J., Wines, T. H. & Somasundaran, P.2000 Acoustic and electroacoustic spectroscopy. Colloids and Surfaces A:Physicochemical and Engineering Aspects 173, 127–158.
Dukhin, A. S., Ohshima, H., Shilov, V. N. & Goetz, P. J. 1999aElectroacoustics for concentrated dispersions. Langmuir 15, 3445–3451.
Dukhin, A. S., Shilov, V. N., Ohshima, H. & Goetz, P. J. 1999b
127
Electroacoustic phenomena in concentrated dispersions: new theory andCVI experiment. Langmuir 15, 6992–6706.
Eddington, D. T. & Beebe, D. J. 2004 Flow control with hydrogels.Advanced Drug Delivery Reviews 56, 199–210.
Einstein, A. 1906 The theory of the Brownian motion. Annalen Der Physik19, 371–381.
Enderby, J. A. 1951 On electrical effects due to sound wave in colloidalsuspensions. Proceedings of the Royal Society of London Series A 207,329–342.
Enge, A., Pelissier, P. & Zimmermann, P. 2007 MPC: Multiple Preci-sion Complex Library . INRIA.
Engler, A., Bacakova, L., Newman, C., Hategan, A., Griffin, M.& Discher, D. 2004 Substrate compliance versus ligand density in cellon gel responses. Biophysical Journal 86, 617–628.
Ferry, J. D. 1980 Viscoelastic Properties of Polymers . New York: JohnWiley and Sons.
Fleer, G. J., Cohen-Stuart, M. A., Scheutjens, J. M. H. M., Cos-grove, T. & Vincent, B. 1993 Polymers at Interfaces . London: Chap-man and Hall.
Fousse, L., Hanrot, G., Lefevre, V., Pelissier, P. & Zimmermann,P. 2007 MPFR: A multiple-precision binary floating-point library withcorrect rounding. ACM Transactions on Mathematical Software 33, 13.
Freeman, P. M., Natarajan, R. N., Kimura, J. H. & Andriacchi,T. P. 1994 Chondrocyte cells respond mechanically to compressive loads.Journal of Orthopaedic Research 12, 311–320.
Frenkel, J. 1944 On the theory of seismic and seismoelectric phenomena ina moist soil. Journal of Physics-USSR 3, 230–241.
Fung, Y. C. & Tong, P. 2001 Classical and Computational Solid Mechan-ics . Singapore: World Scientific.
Galneder, R., Kahl, V., Arbuzova, A., Rebecchi, M., Radler,J. O. & McLaughlin, S. 2001 Microelectrophoresis of a bilayer-coatedsilica bead in an optical trap: Application to enzymology. BiophysicalJournal 80, 2298–2309.
Ganesan, V., Pryamitsyn, V., Surve, M. & Narayanan, B. 2006Noncontinuum effects in nanoparticle dynamics in polymers. Journal ofChemical Physics 124 (22), 221102.
Geissler, E. & Hecht, A. M. 1980 The Poisson ratio in polymer gels.Macromolecules 13, 1276–1280.
128
Geissler, E. & Hecht, A. M. 1981 The Poisson ratio in polymer gels. 2.Macromolecules 14, 185–188.
de Gennes, P.-G. 1976a Dynamics of entangled polymer solutions: I. theRouse model. Macromolecules 9, 587–593.
de Gennes, P.-G. 1976b Dynamics of entangled polymer solutions. II. in-clusion of hydrodynamic interactions. Macromolecules 9, 594–598.
de Gennes, P.-G. 1979 Scaling Concepts in Polymer Physics . Cornell Uni-versity Press.
Gibb, S. E. & Hunter, R. J. 2000 Dynamic mobility of colloidal particleswith thick double layers. Journal of Colloid and Interface Science 224,99–111.
Granlund, T. 2007 GNU MP: The GNU Multiple Precision Arithmetic Li-brary , 4th edn.
Green, P. G. & Kramer, E. J. 1986 Matrix effects on the diffusion of longpolymer chains. Macromolecules 19, 1108–1114.
Gross, J., Scherer, G. W., Alviso, C. T. & Pekala, R. W. 1997Elastic properties of crosslinked resorcinol-formaldehyde gels and aerogels.Journal of Non-Crystalline Solids 211, 132–142.
Haraguchi, K. & Takehisa, T. 2002 Nanocomposite hydrogels: a uniqueorganic-inorganic network structure with extraordinary mechanical, op-tical, and swelling/de-swelling properties. Advanced Materials 14, 1120–1124.
Haraguchi, K., Takehisa, T. & Fan, S. 2002 Effects of clay con-tent on the properties of nanocomposite hydrogels composed of poly(N-isopropylacrylamide) and clay. Macromolecules 35, 10162–10171.
Hill, R. J. 2006a Diffusive permeability and selectivity of nanocompositemembranes. Industrial and Engineering Chemistry Research 45, 6890–6898.
Hill, R. J. 2006b Electric-field-induced force on a charged spherical colloidembedded in an electrolyte-saturated Brinkman medium. Physics of Flu-ids 18, 043103.
Hill, R. J. 2006c Reverse-selective diffusion in nanocomposite membranes.Physical Review Letters 96, 216001.
Hill, R. J. 2006d Transport in polymer-gel composites: theoretical method-ology and response to an electric field. Journal of Fluid Mechanics 551,405–433.
Hill, R. J. 2007 Electric-field-enhanced transport in polyacrylamide hydrogelnanocomposites. Journal of Colloid and Interface Science 316, 635–644.
129
Hill, R. J. & Ostoja-Starzewski, M. 2008 Electric-field-induced dis-placement of a charged spherical colloid embedded in an elastic Brinkmanmedium. Physical Review E 77, 011404.
Hill, R. J. & Saville, D. A. 2005 ‘Exact’ solutions of the full electrokineticmodel for soft spherical colloids: electrophoretic mobility. Colloids andSurfaces A: Physicochemical and Engineering Aspects 267, 31–49.
Hill, R. J., Saville, D. A. & Russel, W. B. 2003a Electrophoresisof spherical polymer-coated colloidal particles. Journal of Colloid andInterface Science 258, 56–74.
Hill, R. J., Saville, D. A. & Russel, W. B. 2003b High-frequencydielectric relaxation of spherical colloidal particles. Physical ChemistryChemical Physics 5, 911–915.
Hoffman, B. D., Massiera, G., Van Citters, K. M. & Crocker,J. C. 2006 The consensus mechanics of cultured mammalian cells. Pro-ceedings of the National Academy of Sciences of the United States ofAmerica 103, 10259–10264.
Hunter, R. J. 1998 Recent developments in the electroacoustic character-isation of colloidal suspensions and emulsions. Colloids and Surfaces A:Physicochemical and Engineering Aspects 141, 37–65.
Hunter, R. J. 2001 Foundations of Colloid Science, 2nd edn. Oxford: OxfordUniversity Press.
Hunter, R. J. & O’Brien, R. W. 1997 Electroacoustic characterization ofcolloids with unusual particle properties. Colloids and Surfaces A: Physic-ochemical and Engineering Aspects 126, 123–128.
Johnson, B., Bauer, J. M., Niedermaier, D. J., Crone, W. C. &Beebe, D. J. 2004a Experimental techniques for mechanical character-ization of hydrogels at the microscale. Experimental Mechanics 44 (1),21–28.
Johnson, B. D., Beebe, D. J. & Crone, W. C. 2004b Effects of swellingon the mechanical properties of a pH-sensitive hydrogel for use in mi-crofluidic devices. Materials Science and Engineering: C 24, 575–581.
Kang, S. W., Kim, J. H., Char, K., Won, J. & Kang, Y. S. 2006Nanocomposite silver polymer electrolytes as facilitated olefin transportmembranes. Journal of Membrane Science 285, 102–107.
Khademhosseini, A & Langer, R. 2007 Microengineered hydrogels fortissue engineering. Biomaterials 28, 5087–5092.
Kickelbick, G. 2003 Concepts for incorporation of inorganic building blocksinto organic polymers on a nanoscale. Progress in Polymer Science 28,83–114.
130
Kim, J. J. & Park, K. 1998 Smart hydrogels for bioseparation. Bioseparation7, 177–184.
Kim, S. & Karrila, S. J. 1991 Microhydrodynamics: Principles and SelectedApplications . Boston: Butterworth-Heinemann.
Kimura, Y. & Mizuno, D. 2007 Microrheology of a swollen lyotropic lamel-lar phase. Molecular Crystals and Liquid Crystals 478, 3–13.
Kopesky, E. T., Haddad, T. S., Cohen, R. E. & McKinley, G. H.2004 Thermomechanical properties of poly(methly methacrylate)s con-taining tethered and untethered polyhedral oligomeric silsesquioxanes.Macromolecules 37, 8992–9004.
Lamb, H. 1945 Hydrodynamics . New York: Dover Publications.
Landau, L. D. & Lifshitz, E. M. 1986 Theory of Elasticity , 3rd edn.Oxford: Pergamon Press.
Landau, L. D. & Lifshitz, E. M. 1987 Fluid Mechanics . Oxford: Perga-mon Press.
Larson, R. G. 1999 The Structure and Rheology of Complex Fluids . NewYork: Oxford University Press.
Levine, A. J. & Lubensky, T. C. 2000 One- and two-particle microrheol-ogy. Physical Review Letters 85, 1774–1777.
Levine, A. J. & Lubensky, T. C. 2001 Response function of a sphere in aviscoelastic two-fluid medium. Physical Review E 63, 041510.
Li, Y., Hu, Z. & Li, C. 1993 New method for measuring Poisson ratio inpolymer gels. Journal of Applied Polymer Science 50, 1107–1111.
Lin, C.-C. & Netters, A. T. 2006 Hydrogels in controlled release for-mulations: Network design and mathematical modeling. Advanced DrugDelivery Reviews 58, 1379–1408.
Lin, D. C., Yurke, B. & Langrana, N. A. 2004 Mechanical proper-ties of a reversible, DNA-crosslinked polyacrylamide hydrogel. Journal ofBiomechanical Engineering-Transactions of ASME 26, 104–110.
Lin, D. C., Yurke, B. & Langrana, N. A. 2005 Use of rigid spher-ical inclusions in Young’s moduli determination: application to DNA-crosslinked gels. Journal of Biomechanical Engineering-Transactions ofASME 127, 571–579.
Liu, J., Levine, A. L., Mattoon, J. S., Yamaguchi, M., Lee, R. J.,Pan, X. L. & Rosol, T. J. 2006 Nanoparticles as image enhancingagents for ultrasonography. Physics in Medicine and Biology 51, 2179–2189.
131
Loo, C., Lowery, A., Halas, N., West, J. & Drezek, R. 2005 Im-munotargeted nanoshells for integrated cancer imaging and therapy. NanoLetters 5, 709–711.
Lyklema, J. 1995 Fundamentals of Interface and Colloid Science. II. Solid-Liquid Interfaces . London: Academic Press.
Mackay, M. E., Dao, T. T., Tuteja, A., Ho, D. L., Van Horn,B., Kim, H.-C. & Hawker, C. J. 2003 Nanoscale effects leading tonon-Einstein-like decrease in viscosity. Nature Materials 2, 762–766.
MacKintosh, F. C. & Schmidt, C. F. 1999 Microrheology. Current Opin-ion in Colloid and Interface Science 4, 300–307.
MacRobert, T. M. 1967 Spherical Harmonics: An elementary treatise onharmonic functions, with applications., 3rd edn. Oxford: Pergamon Press.
Mangelsdorf, C. S. & White, L. R. 1992 Electrophoretic mobility of aspherical colloidal particle in an oscillating electric field. Journal of theChemical Society, Faraday Transactions 88, 3567–3581.
Mangelsdorf, C. S. & White, L. R. 1997 Dielectric response of a dilutesuspension of spherical colloidal particles to an oscillating electric field.Journal of the Chemical Society, Faraday Transactions 93, 3145–3154.
Markov, M. G. 2005 Propagation of longitudinal elastic waves in a fluid-saturated porous medium with spherical inclusions. Acoustical Physics51, S115–S121.
Masliyah, J. H. & Bhattacharjee, S. 2006 Electrokinetic and ColloidTransport Phenomena. Hoboken: Wiley-Interscience.
Mason, T. G. & Weitz, D. A. 1995 Optical measurements of frequency-dependent linear viscoelastic moduli of complex fluids. Physical ReviewLetters 74 (7), 1250–1253.
Matos, M. A., White, L. R. & Tilton, R. D. 2006 Electroosmoticallyenhanced mass transfer through polyacrylamide gels. Journal of Colloidand Interface Science 300, 429–436.
Matos, M. A., White, L. R. & Tilton, R. D. 2008 Enhanced mixing inpolyacrylamide gels containing embedded silica nanoparticles as internalelectroosmotic pumps. Colloids and Surfaces B: Biointerfaces 61, 262–269.
Maxwell, J. C. 1873 Treatise on Electricity and Magnetism, vol. 1 . London:Oxford University Press.
Merkel, T. C., Freeman, B. D., Spontak, R. J., He, Z., Pinnau,I., Meakin, P. & Hill, A. J. 2002 Ultrapermeable, reverse-selectivenanocomposite membranes. Science 296, 519–522.
Migler, K. B., Hervet, H. & Leger, L. 1993 Slip transition of a polymermelt under shear stress. Physical Review Letters 70, 287–290.
132
Milner, S. T. 1993 Dynamical theory of concentration fluctuations in poly-mer solutions under shear. Physical Review E 48, 3674–3691.
Mizuno, D., Kimura, Y. & Hayakawa, R. 2000 Dynamic electrophoreticmobility of colloidal particles measured by the newly developed methodof quasi-elastic light scattering in a sinusoidal electric field. Langmuir 16,9547–9554.
Mizuno, D., Kimura, Y. & Hayakawa, R. 2001 Electrophoretic microrhe-ology in a dilute lamellar phase of a nonionic surfactant. Physical ReviewLetters 87, 088104.
Mizuno, D., Kimura, Y. & Hayakawa, R. 2004 Electrophoretic microrhe-ology of a dilute lamellar phase: Relaxation mechanisms in frequency-dependent mobility of nanometer-sized particles between soft membranes.Physical Review E 70, 011509.
O’Brien, R. W. 1979 A method for the calculation of the effective trans-port properties of suspensions of interacting particles. Journal of FluidMechanics 91, 17–39.
O’Brien, R. W. 1986 The high frequency dielectric dispersion of a colloid.Journal of Colloid and Interface Science 113, 81–93.
O’Brien, R. W. 1988 Electro-acoustic effects in a dilute suspension of spher-ical particles. Journal of Fluid Mechanics 190, 71–86.
O’Brien, R. W. 1990 The electroacoustic equations for a colloidal suspen-sion. Journal of Fluid Mechanics 212, 81–93.
O’Brien, R. W., Jones, A. & Rowlands, W. N. 2003 A new formulafor the dynamic mobility in a concentrated colloid. Colloids and SurfacesA: Physicochemical and Engineering Aspects 218, 89–101.
O’Brien, R. W. & White, L. R. 1978 Electrophoretic mobility of a spher-ical colloidal particle. Journal of the Chemical Society, Faraday Transac-tions II 74, 1607–1626.
Oestreicher, H. L. 1951 Field and impedance of an oscillating sphere ina viscoelastic medium with an application to biophysics. The Journal ofThe Acoustical Society of America 23, 707–714.
O’Konski, C. T. 1960 Electric properties of macromolecules V. Theory ofionic polarization in polyelectrolytes. Journal of Physical Chemistry 64,605–619.
Overbeek, J. Th. G. 1943 Theorie der elektrophorese. Kolloid-Beih 54,287–364.
Pal, R. 2007 Rheology of Particulate Dispersions and Composites . Boca Ra-ton: CRC Press.
Peppas, N. A., Bures, P., Leobandung, W. & Ichikawa, H. 2000
133
Hydrogels in pharmaceutical formulations. European Journal of Pharma-ceutics and Biopharmaceutics 50, 27–46.
Peppas, N. A., Hilt, J. Z., Khademhosseini, A. & Langer, R. 2006Hydrogels in biology and medicine: from molecular principles to bionan-otechnology. Advanced Materials 18, 1345–1360.
Pine, D. J., Weitz, D. A., Chaikin, P. M. & Herbolzheimer, E. 1988Diffusing wave spectroscopy. Physical Review Letters 61, 1134–1137.
Pozrikidis, C. 1996 Introduction to Theoretical and Computational FluidDynamics . New York: Oxford University Press.
Preston, M. A., Kornbrekke, R. & White, L. R. 2005 Determinationof the dynamic electrophoretic mobility of a spherical colloidal particlethrough a novel numerical solution of the electrokinetic equations. Lang-muir 21 (22), 9832–9842.
Qiu, Y. & Park, K. 2001 Environment-sensitive hydrogels for drug delivery.Advanced Drug Delivery Reviews 53, 321–339.
Rider, P. F. & O’Brien, R. W. 1993 The dynamic mobility of particlesin a non-dilute suspension. Journal of Fluid Mechanics 257, 607–636.
Roberts, C., Cosgrove, T., Schmidt, R. G. & Gordon, G. V. 2001Diffusion of poly(dimethyl siloxane) mixtures with silicate nanoparticles.Macromolecules 34, 538–543.
Rotello, V. M., ed. 2004 Nanoparticles: Building Blocks for Nanotechnol-ogy . New York: Kluwer Academic/Plenum Publishers.
Russel, W. B., Schowalter, W. R. & Saville, D. A. 1989 ColloidalDispersions . Cambridge: Cambridge University Press.
Rutgers, Ir. R. 1962 Relative viscosity of suspensions of rigid spheres inNewtonian liquids. Rheologica Acta 2, 202–210.
Scherer, G. W. 1992 Bending of gel beams: method for characterizing elas-tic properties and permeability. Journal of Non-Crystalline Solids 142,18–35.
Schmidt, G. & Malwitz, M. M. 2003 Properties of polymer-nanoparticlecomposites. Current Opinion in Colloid and Interface Science 8, 103–108.
Schnurr, B., Gittes, F., MacKintosh, F. C. & Schmidt, C. F. 1997Determining microscopic viscoelasticity in flexible and semiflexible poly-mer networks from thermal fluctuations. Macromolecules 30, 7781–7792.
Sershen, S. R., Mensing, G. A., Ng, M., Halas, N. J., Beebe, D. J.& West, J. L. 2005 Independent optical control of microfluidic valvesformed from optomechanically responsive nanocomposite hydrogels. Ad-vanced Materials 17, 1366–1368.
Shkel, I. A, Tsodikov, O. V. & Record Jr, M. T. 2000 Complete
134
asymptotic solution of cylindrical and spherical Poisson-Boltzmann equa-tions at experimental salt concentrations. Journal of Physical ChemistryB 104, 5161–5170.
Snieder, R. & Page, J. 2007 Multiple scattering in evolving media. PhysicsToday May 2007, 49–55.
Soskey, P. R. & Winter, H. H. 1984 Large step shear strain experimentswith parallel-disk rotational rheometers. Journal of Rheology 28, 625–645.
Speight, J. G. 2005 Lange’s Handbook of Chemistry , 16th edn. New York:McGraw-Hill.
Strubulevych, A., Leroy, V., Scanlon, M. G. & Page, J. H. 2007Characterizing a model food gel containing bubbles and solid inclusionsusing ultrasound. Soft Matter 3, 1388–1394.
Takigawa, T., Morino, Y., Urayama, K. & Masuda, T. 1996 Poisson’sratio of polyacrylamide (PAAm) gels. Polymer Gels and Networks 4, 1–5.
Takigawa, T., Yamawaki, T., Takahashi, K. & Masuda, T. 1997Change in Young’s modulus of poly(N-isopropylacrylamide) gels by vol-ume phase transition. Polymer Gels and Networks 5, 585–589.
Tanaka, T., Hocker, L. O. & Benedek, G. B. 1973 Spectrum of lightscattered from a viscoelastic gel. Journal of Chemical Physics 59, 5151–5159.
Taylor, G. I. 1932 The viscosity of a fluid containing small drops of anotherfluid. Proceedings of the Royal Society of London Series A 138, 41–48.
Temkin, L. & Leung, C. M. 1976 On the velocity of a rigid sphere in asound wave. Journal of Sound and Vibration 49, 75–92.
Thevenot, C., Khoukh, A., Reynaud, S., Desbrieres, J. & Grassl,B. 2007 Kinetic aspects, rheological properties and mechanoelectrical ef-fects of hydrogels composed of polyacrylamide and polystyrene nanopar-ticles. Soft Matter 3, 437–447.
Torquato, S. 2002 Random Heterogeneous Materials: Microstructure andMacroscopic Properties . New York: Springer-Verlag.
Tuinier, R. & Lekkerkerker, H. N. W. 2002 Polymer density around asphere. Macromolecules 35, 3312–3313.
Tuteja, A., Duxbury, P. M. & Mackay, M. E. 2007a Multifunctionalnanocomposites with reduced viscosity. Macromolecules 40, 9427–9434.
Tuteja, A., Duxbury, P. M. & Mackay, M. E. 2008 Polymer chainswelling induced by dispersed nanoparticles. Physical Review Letters 100,077801.
Tuteja, A., Mackay, M. E., Hawker, C. J. & Van Horn, B. 2005
135
Effect of ideal, organic nanoparticles on the flow properties of linear poly-mers: Non-Einstein-like behavior. Macromolecules 38, 8000–8011.
Tuteja, A., Mackay, M. E., Narayanan, S., Asokan, S. & Wong,M. S. 2007b Breakdown of the continuum Stokes-Einstein relation fornanoparticle diffusion. Nano Letters 7, 1276–1281.
Urayama, K., Takigawa, T. & Masuda, T. 1993 Poisson ratio ofpoly(vinyl alcohol) gels. Macromolecules 26, 3092–9096.
Valentine, M. T., Dewalt, L. E. & Ou-Yang, H. D. 1996 Forces ona colloidal particle in a polymer solution: a study using optical tweezers.Journal of Physics: Condensed Matter 8, 9477–9482.
Verwey, E. J. W. & Overbeek, J. Th. G. 1948 Theory of Stability ofLyophobic Colloids . Elsevier, Amsterdam.
Wang, K. L., Burban, J. H. & Cussler, E. L. 1993 Hydrogels as sepa-ration agents. Advances in Polymer Science 110, 67–79.
Wang, M. & Hill, R. J. 2008 Electric-field-induced displacement of chargedspherical colloids in compressible hydrogels. Soft Matter 4, 1048–1058.
Westermeier, R. 2005 Electrophoresis in Practice. Weinheim: Wiley-VCH.
Wu, D. T., Fredrickson, G. H., Carton, J. P., Ajdari, A. &Leibler, L. 1995 Distribution of chain-ends at the surface of a poly-mer melt: compensation effects and surface-tension. Journal of PolymerScience Part B: Polymer Physics 33, 2373–2389.
Yamaguchi, N., Chae, B.-S., Zhang, L., Kiick, K. L. & Furst, E. M.2005 Rheological characterization of polysaccharide-poly(ethylene glycol)star copolymer hydrogels. Biomacromolecules 6 (4), 1931–1940.
Yao, S. H., Hertzog, D. E., Zeng, S. L., Mikkelsen, J. C. & Santi-ago, J. G. 2003 Porous glass electroosmotic pumps: design and experi-ments. Journal of Colloid and Interface Science 268, 143–153.
Yao, S. H. & Santiago, J. G. 2003 Porous glass electroosmotic pumps:theory. Journal of Colloid and Interface Science 268, 133–142.
Ziemann, F., Radler, J. & Sackmann, E. 1994 Local measurement ofviscoelastic moduli of entangled actin networks using an oscillating mag-netic bead micro-rheometer. Biophysical Journal 66, 2210–2216.
136
Related Documents


![Colloids and Surfaces B: Biointerfaces · Colloids and Surfaces B: Biointerfaces 88 (2011) 279–286 Contents lists available at ScienceDirect Colloids ... [26,27]. Other researchers](https://static.cupdf.com/doc/110x72/5fc50395d8208315bc08a19b/colloids-and-surfaces-b-colloids-and-surfaces-b-biointerfaces-88-2011-279a286.jpg)