On the economics of offshore energy conversion: smart combinations Converting offshore wind energy into green hydrogen on existing oil and gas platforms in the North Sea 3 February 2017 by Prof. Catrinus J. Jepma Miralda van Schot Energy Delta Institute (EDI)

Welcome message from author
This document is posted to help you gain knowledge. Please leave a comment to let me know what you think about it! Share it to your friends and learn new things together.
Transcript
On the economics of offshore energy conversion: smart combinations
Converting offshore wind energy into green hydrogen on existing oil and gas platforms in the North Sea
3 February 2017
by
Prof. Catrinus J. Jepma
Miralda van Schot
Energy Delta Institute (EDI)
2
This report reflects the view of the Energy Delta Institute (EDI) of potential benefits of synergy between
existing offshore natural gas infrastructure and new offshore wind energy in the timeframe beyond
2025. The study was conducted by EDI in association with the Energy research Centre of the
Netherlands (ECN). Besides general analytical support, ECN has provided input data and analysis on
offshore wind electricity infrastructure, electrolysis and infrastructure for hydrogen transport to the
study. The final technical and economic analysis, and the interpretation of results is done by EDI.
This text or parts thereof may not be cited, copied, reproduced or transmitted in any form, or by any means,
whether digitally or otherwise without the prior written consent of Energy Delta Institute.

3
Executive summary On the North Sea, two clear trends evolve in the energy landscape: on the one hand the process of
gradually decommissioning the about 600 oil and gas installations, and on the other hand the massive
investment from all North Sea countries in offshore wind activity. This dual development raises the
issue if there is scope for collaboration between the oil and gas and offshore wind operators. One
potentially promising area in this regard is using oil and gas platforms that run out of operation for
conversion and possibly storage of offshore wind energy to develop more economical ways for
transport, storage, and use of this energy than if it would need to be transported to shore via new e-
grid systems.
In this study, the perspective has been taken to relate the calculations and simulations to two
platforms (G17d and D18a), and to take into account not only the conversion and storage costs and
benefits, but also those related to the energy transport, even if the latter may be an externality to the
operators’ activities. For both platforms, two cases have been distinguished: one in which all wind
energy is transported to the platform for conversion, so that a new e-grid connection between the
wind farm and shore is no longer necessary (G-only case); and one in which the e-grid connection
between the wind farm and shore still exists, so that operators have the choice to bring the wind
energy to shore either by way of electrons, or, after conversion, by way of molecules (E+G case).
For the G-only case, it was analysed how much electrolyser capacity would optimally be used to service
a wind farm of a certain capacity. Based on an economic model and given wind profiles, it turned out
that the optimal ratio was about 78%.
With respect to the issue how much electrolyser capacity could be positioned on a platform, given
weight and surface area restrictions, it turned out that a complete production platform (G17d) can
host up to about 250 MW electrolyser capacity, based on the modern generation of electrolysers
currently under development. A much smaller satellite platform such as D18a could host up to about
60 MW of electrolyser capacity.
With the help of a model developed to assess the economics of offshore conversion and related
transport, it has been assessed what the net present value (NPV) would be under a range of
assumptions with respect to input and output variables, OPEX and CAPEX of technical devices, and grid
and gas treatment costs. Based on the available market data, different assumptions have been made
on ‘green’ hydrogen prices, ranging between €1.56/kg and €4.67/kg.
In terms of optimal transport modes through the gas grid, it turned out that depending on the distance
from the platform to shore, it was either optimal (e.g. for faraway North Sea locations) to admix the
hydrogen to the natural gas flow and separate it once on shore, or (typically for near-shore locations
providing significant volumes of hydrogen) to invest in a dedicated grid for hydrogen.
The results from the base case showed that even when taking into account the externalities, NPV
values are negative for virtually all E+G cases (i.e. except from the case in which a limited electrolyser
capacity is added to the still operational platform G17d, and hydrogen prices are at the top side of the
range). The explanation is that the transport/grid costs obviously dominate this picture, because the
net ‘decommissioning bonus’ is relatively small compared to the transport/grid costs.
For the G-only case, NPV values turned out to be negative if prices for ‘green’ hydrogen would be at
the low end of the range. However, if prices for ‘green’ hydrogen would move up towards the upper
level of the range, then serious positive NPVs seem to be feasible.
4
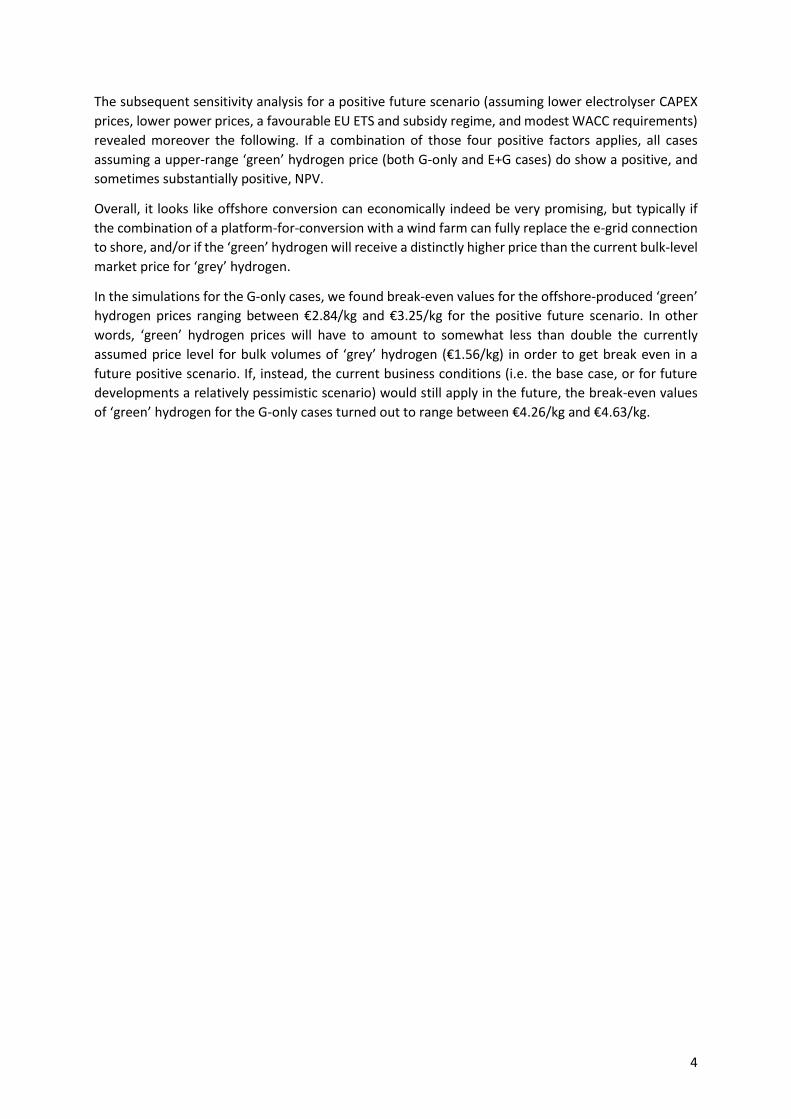
The subsequent sensitivity analysis for a positive future scenario (assuming lower electrolyser CAPEX
prices, lower power prices, a favourable EU ETS and subsidy regime, and modest WACC requirements)
revealed moreover the following. If a combination of those four positive factors applies, all cases
assuming a upper-range ‘green’ hydrogen price (both G-only and E+G cases) do show a positive, and
sometimes substantially positive, NPV.
Overall, it looks like offshore conversion can economically indeed be very promising, but typically if
the combination of a platform-for-conversion with a wind farm can fully replace the e-grid connection
to shore, and/or if the ‘green’ hydrogen will receive a distinctly higher price than the current bulk-level
market price for ‘grey’ hydrogen.
In the simulations for the G-only cases, we found break-even values for the offshore-produced ‘green’
hydrogen prices ranging between €2.84/kg and €3.25/kg for the positive future scenario. In other
words, ‘green’ hydrogen prices will have to amount to somewhat less than double the currently
assumed price level for bulk volumes of ‘grey’ hydrogen (€1.56/kg) in order to get break even in a
future positive scenario. If, instead, the current business conditions (i.e. the base case, or for future
developments a relatively pessimistic scenario) would still apply in the future, the break-even values
of ‘green’ hydrogen for the G-only cases turned out to range between €4.26/kg and €4.63/kg.

5
Table of contents
Introduction ..................................................................................................................................... 6
1.1. Background .............................................................................................................................. 6
1.2. Aim and scope of the study ..................................................................................................... 7
Options considered and data .......................................................................................................... 7
2.1. Platform selection ................................................................................................................... 7
2.2. Characteristics G17d-A and G17d-AP ...................................................................................... 8
2.3. Compression options to deal with NOX emissions .................................................................. 9
2.4. Infrastructure options ........................................................................................................... 11
2.5. Grid connection options ........................................................................................................ 12
2.6. The optimal electrolyser capacity per offshore wind capacity ............................................. 14
2.7. Economies of scale in producing green hydrogen ................................................................ 16
Platform modalities ....................................................................................................................... 18
3.1. Space and weight limitations ................................................................................................ 18
3.2. Other technological issues .................................................................................................... 25
The energy conversion and storage business model analysis ....................................................... 26
4.1. The modelling structure ........................................................................................................ 26
4.2. Main modelling assumptions ................................................................................................ 27
Transporting wind energy to shore: transport costs and other externalities ............................... 30
5.1. Transport options and modalities ......................................................................................... 30
5.2. Other relevant externalities: CO2 emissions reductions and subsidy savings ....................... 33
Integrated analysis of offshore renewable energy production, conversion, transport, and storage
34
6.1. The main cases considered ................................................................................................... 34
6.2. Base outcomes ...................................................................................................................... 35
6.3. Sensitivity analysis ................................................................................................................. 39
Summary, conclusions and policy recommendations ................................................................... 44
7.1. Summary and conclusions ..................................................................................................... 44
7.2. Some perspective on the scope of offshore energy conversion ........................................... 47
7.3. Policy recommendations ....................................................................................................... 47
References ............................................................................................................................................. 50
Annex 1: Water treatment .................................................................................................................... 52

6
Introduction
1.1. Background In view of the ongoing rapid extension of the offshore wind energy capacity in the Dutch continental
shelf of the North Sea (some 4.5 GW by 2023),1 and given the impact of the intermittency of wind
energy supply on grid and power market stability, a few studies have been carried out to analyse
whether offshore power-to-gas conversion and subsequent energy storage would be feasible, both
technologically and economically (Jepma, 2015; TNO, 2016; DNG GL AS, 2015). The main conclusion
from these studies was that it is not at the moment commercially feasible to convert offshore wind
energy into gases on existing oil and gas platforms,2 but that commercial perspectives will rapidly
improve especially if – e.g. due to larger-scale application – electrolyser CAPEX levels per MW will come
down, and if opportunities for commercial sales of ‘green’ hydrogen will develop, especially in
promising dedicated niche markets.
The studies also revealed that there seems to be a serious scope for positive externalities related to
such conversion, e.g. because it allows for the use of existing oil and gas infrastructure for transport
and storage rather than requiring investment by a TSO in new power-related infrastructure. Moreover,
using platforms running out of oil and gas production for energy conversion may create an additional
advantage, because the platform owner can postpone decommissioning;3 under specific conditions
this may be an externality as well, namely if the operator of the energy conversion and the owner of
the platform are not the same. The CO2 reduction impact of electrification of operational-platform
compression activity by use of wind energy for such purpose is another potential serious positive
externality of linking platform activities to offshore wind energy. Obviously, insofar as platform
conversion may contribute to energy storage, such activity on average adds to stabilising power
markets, and potentially – e.g. if power-to-gas carried out by wind operators improves their overall
business case – to reducing the dependency of offshore power generation on subsidies (note that
currently the SDE+ feed-in premium scheme applies if the wind power is introduced into the e-grid; it
is still unclear how the subsidy regime may change if instead green hydrogen is introduced into the gas
grid).4 Finally, offshore conversion and storage may contribute to the HV grid stabilising and balancing
responsibilities of the TSO responsible for the e-grid.
1 Based on the Energieakkoord of 2013, a number of so-called ‘windgebieden’ (wind areas) will be commissioned via tenders. The first tender related to the area called Borssele areas I and II (700 MW). Next areas to be commissioned are Borssele area III and IV (680 MW, 2016); Borssele area V (20 MW, 2017), and Hollandse kust zuid and noord (3 x 700 MW, 2017-2019). 2 The first offshore platforms in the Dutch continental shelf (DCS) were installed in 1974, and are still – after more than 40 years – operational. Presently there are over 150 platform installations in the DCS held by nine operators; 24 – 3 processing and 21 satellite platforms – have already been decommissioned (EBN, 2016, p. 52). 3 Decommissioning costs of the existing offshore gas pipeline system are relatively small, just some cleaning, and will therefore in the following be disregarded. 4 Currently, the proposed cap of the SDE+ base rate (subsidy + expected market price) is, for the planned wind farm near platform G17d, 15.5 cents per kWh for a direct connection with shore, and 12.3 cents per kWh for an offshore HV connection. However, in view of the result of the 2016 Borssele I and II tender (electricity price about 7.27 cents per kWh), the September 2016 Danish Near Shore tender won by Vattenfall (some 6.4 cents per kWh), the November 2016 Danish Kriegers Flak tender also won by Vattenfall (4.99 cents per kWh), and the December 2016 Borssele III and IV tender won by a consortium led by Shell (5.45 cents per kWh), it is very likely that the actual SDE+ base rate will trend towards considerably lower levels. For that reason, and because the assumed project starting date is 2025, in this study we have assumed base rates of 7.2 cents per kWh for both platforms considered. With respect to the various tender results mentioned, it should be noted that results may be affected by the degree to which preparatory costs and costs related to grid connections are covered by others than the subscribers; this may complicate the international comparison of tender results.

7
1.2. Aim and scope of the study This study tries to take the analysis of offshore conversion and storage a step further, by specifically
focusing on the technical and commercial feasibility of the use of existing offshore natural gas
infrastructures – platforms and pipelines – for conversion of the electrical energy from remote offshore
wind farms into hydrogen energy (power-to-gas) and subsequent transport of the hydrogen to shore.
In doing so, we tried to make a clear distinction between the business aspects from the operators’
point of view and the relevant externalities that may be linked to such processes. This is done with the
help of a quantitative business analysis framework, which is linked to two specific existing platform
situations in the North Sea that are owned and operated by ENGIE (G17d and D18a). One of the
advantages of linking the analysis to specific platforms of a specific company is not only data
availability, but also that the analysis is carried out in a realistic setting. Because of the assumed lead
time to prepare for power-to-gas technology installation on platforms, and because of the number of
years during which the platforms considered all still expected to be operational, the business modelling
relates to a 10-year period starting in 2025. Much of the analysis of the various economic variables and
impacts therefore have to be seen in the perspective of an international climate policy regime under
the guidance of the post-2020 Paris Agreement.
The study has been carried out during 2016 by Prof. Jepma (University of Groningen and Energy Delta
Institute) and Miralda van Schot (Energy Delta Institute), with some inputs from Marcel Weeda (ECN)
and Adriaan van der Welle (ECN). The study has been financed by TKI-gas and Gasunie. Comments
were provided by a steering committee consisting of Ulco Vermeulen and Jan Veijer (Gasunie), Jaap
Bolhuis (Siemens), Hans Timmers (NWEA) Jo Peters (NOGEPA), Jörg Gigler (TKI-gas), Bob Meijer (TKI-
Wind op Zee), Berend Scheffers (EBN), Jorinde Bettink (Tennet), and René van der Meer (ENGIE, former
Gaz de France). Much of the technical platform data have been provided by ENGIE (René van der
Meer), electrolyser data by Siemens (Jaap Bolhuis), information on demineralised water technology by
Lenntech (Rosario Gomes), data on e-grid investment by TenneT (Jorinde Bettink), and information on
pipeline transport by Gasunie (Jan Veijer). Some valuable comments were provided by Charlotte van
Leeuwen (University of Groningen).
Options considered and data
2.1. Platform selection In the selection of the platform situations to be analysed, the aim was to consider two platforms, both
on the Dutch continental shelf: one platform relatively close to shore, and another further away; one
operational, and one non-operational platform; and one platform with a satellite character and one
manned production platform.5 By this differentiation, it was hoped to get a better picture of the
economics of offshore conversion, depending on the distance, operational use, and platform
modalities. The hypothesis was that the savings on power infrastructure investment would increase
the further away the platform would be from shore, and that conversion conditions and economic
potential would strongly depend on whether or not active oil and gas exploration would still be
ongoing. Also, because satellite platforms are usually smaller than manned production platforms, it
was considered important to take this difference into account. For these reasons, and in close
consultation with ENGIE, the following platforms have been selected:
G17d, consisting of the combination of an operational satellite platform (G17d-A) and a
manned production platform (G17d-AP), not too far from the coast (85 km directly to shore,
5 Other than production platforms, satellite platforms have a shorter lifetime, and do not contain dryers, turbines, and compressors.

8
121 km via gas pipelines to Noordgastransport near Eemshaven). G17d-A and -AP are
connected via a bridge.
D18a, a non-operational satellite platform, far from the coast (213 km directly to shore, 329
km via gas pipelines to Noordgastransport near Eemshaven). D18a is similar to G17d-A, but
approximately 20% smaller.
Figure 1 illustrates the locations of the two platforms, potential locations of wind farms (yellow), and
linkages to the shore (Noordgastransport near Eemshaven) via gas infrastructure.
Figure 1. Locations of North Sea platforms and relevant infrastructure; source: Noordgastransport (2013), adapted by EDI
The following section provides an overview of the characteristics of the selected platforms.
2.2. Characteristics G17d-A and G17d-AP The satellite platform G17d-A is still operational (since 2005 and until mid-2020s).6 Moreover,
the manned production platform G17d-AP will not be taken out of production until all satellites
surrounding the production platform are taken out of operation. This implies that the
production platform will at least be operational until 2025. An important implication is that it
will not be easy to add substantial electrolyser capacity to the platform, for reasons of space
limitations. The calculations in section 3.1 showing how much electrolyser capacity can be
installed on this platform, therefore can only apply once the platform runs out of operation.
Both platforms are relatively near (less than 5 km) the potential wind farms Osters Bank 3 and
4 (450 MW each) and Ruyters West (260 MW). Although currently there are no concrete plans
by the government for extension of the offshore wind capacity on this location, this may
change in the future, also because wind conditions on this location seem to be rather
favourable.
Standard carrying weight 2,000 tonnes; the topside weight of the production platform (G17d-
AP) is 2,450 tonnes. The jacket weight of the satellite (G17d-A) is 1,050 tonnes and top-sides
weigh 1,310 tonnes. Water depth 38.7 m.
Extension of the platform is possible (costs about €40/kg).
Production platform dimensions (G17d-AP): 35 x 30 x 27 m; four levels.
6 Recent information from the TNO initiative on ‘System Integration Offshore Energy’ suggests that the lifetime of the cluster around G17d may stretch into the timeframe 2036-2050.

9
Decommissioning costs (including the jacket) are about €20 million.
Current OPEX and maintenance per annum: €8.8 million.
Compression capacity on the platform covers 300 million Nm3 per year, or 4-6 MW (gas-based)
and 650 kW (power-based), for 70 bar pressure.
Maintenance costs for the gas grid: some €2 million per annum.
Characteristics D18a
Wind farm (innovation park) still to be established (after 2020); max. distance from platform
D18a: some 5 km.
Unmanned satellite platform; no longer operational and for sale by 2016. This is one of the
relatively young satellite platforms that consists of high-quality steel; therefore it has a
relatively long remaining technical lifetime.
Standard carrying weight: 1,000 tonnes.
Platform dimensions: 27 x 15 x 20 m; three levels.
In case of re-use, a new topside needs to be added, because that is a cheaper option than
refurbishing the existing platform; also it allows for adapting height levels of the platform to
the space requirements of the electrolysis technology and other necessary equipment.
Admixing of hydrogen to methane will need to take place on the ‘mother platform’ on D15,
where compression capacity covers 300 million Nm3 per year, for 70-110 bar pressure.
Transport of pure hydrogen from D18a to D15 via the existing 8 inch pipeline covering some
20 km is possible. After D15 gas transport goes via the 60-65 bar Noordgastransport (NGT)
pipeline.
Current OPEX and maintenance costs per annum: €4 million.
Decommissioning costs (including of the jacket): €6-8 million.
2.3. Compression options to deal with NOX emissions Except from the generic interest in using oil and gas platforms for energy conversion for being able to
store intermittent offshore wind energy, another tendency in the offshore oil and gas operation is to
reduce NOX and CO2 emissions of the platform activities, notably from gas-fuelled compression. The
latter generates, if gas-based, about 80% of the total CO2 and NOX emissions from offshore
installations. Cleaner compression is therefore not only relevant for still-operational platforms, but
possibly also for non-operational platforms only used for energy conversion, because then also
compression capacity will practically always be needed.
An important reason for the increased Dutch Continental Shelf (DCS) operators’ interest in reducing
offshore compression emissions is related to Dutch national legislation (in Dutch: ‘Activiteitenbesluit
milieubeheer’, section 3.2.1) stating that all combustion plants < 50 MWth, including most of the
existing and all new ones, should fulfill the new NOX and SO2 emission requirements as of 1 January
2017. For offshore platforms there is a transitional period until 1 January 2019, and for offshore gas
turbines only NOX emission limitations apply.
In other words, regulation increasingly insists on cleaning oil and gas offshore production activities by
switching from gas-fuelled compression towards electrified compression, and – even better – using
green power for this. Nearby wind farms could provide such green power, which may give rise to
10
another type of smart combinations between the wind operators and the oil and gas operators, than
using platforms for wind power conversion and storage.7
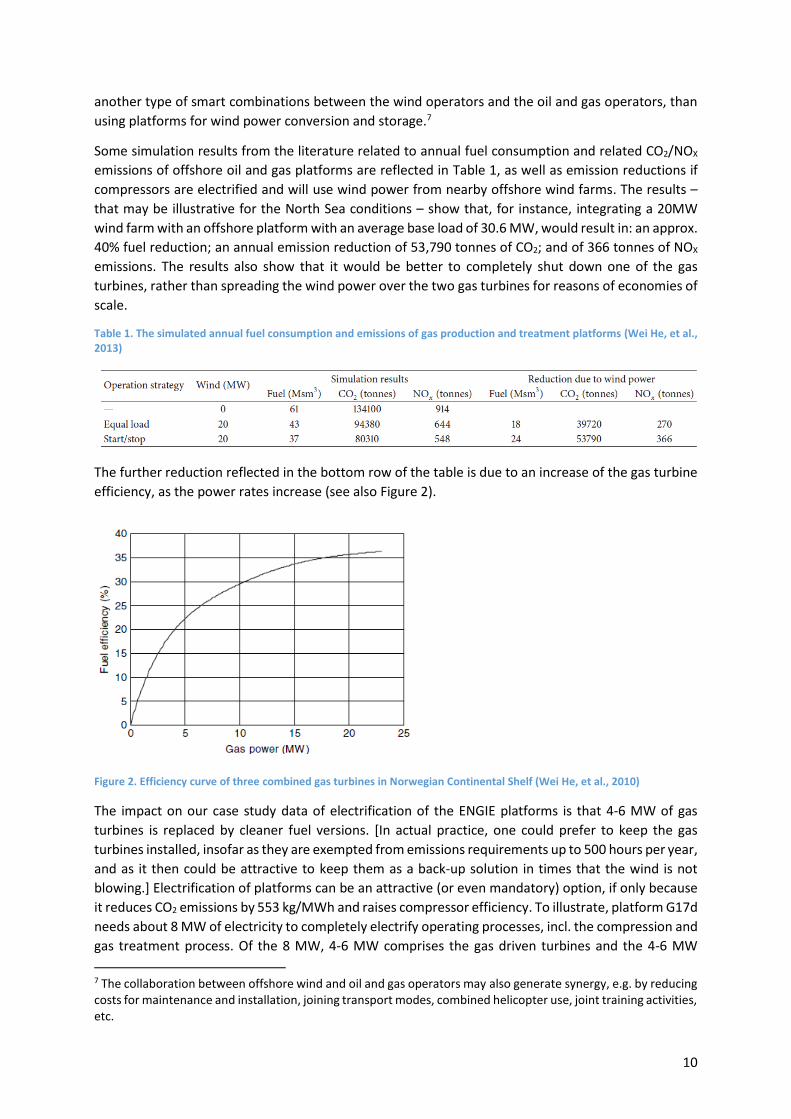
Some simulation results from the literature related to annual fuel consumption and related CO2/NOX
emissions of offshore oil and gas platforms are reflected in Table 1, as well as emission reductions if
compressors are electrified and will use wind power from nearby offshore wind farms. The results –
that may be illustrative for the North Sea conditions – show that, for instance, integrating a 20MW
wind farm with an offshore platform with an average base load of 30.6 MW, would result in: an approx.
40% fuel reduction; an annual emission reduction of 53,790 tonnes of CO2; and of 366 tonnes of NOX
emissions. The results also show that it would be better to completely shut down one of the gas
turbines, rather than spreading the wind power over the two gas turbines for reasons of economies of
scale.
Table 1. The simulated annual fuel consumption and emissions of gas production and treatment platforms (Wei He, et al., 2013)
The further reduction reflected in the bottom row of the table is due to an increase of the gas turbine
efficiency, as the power rates increase (see also Figure 2).
Figure 2. Efficiency curve of three combined gas turbines in Norwegian Continental Shelf (Wei He, et al., 2010)
The impact on our case study data of electrification of the ENGIE platforms is that 4-6 MW of gas
turbines is replaced by cleaner fuel versions. [In actual practice, one could prefer to keep the gas
turbines installed, insofar as they are exempted from emissions requirements up to 500 hours per year,
and as it then could be attractive to keep them as a back-up solution in times that the wind is not
blowing.] Electrification of platforms can be an attractive (or even mandatory) option, if only because
it reduces CO2 emissions by 553 kg/MWh and raises compressor efficiency. To illustrate, platform G17d
needs about 8 MW of electricity to completely electrify operating processes, incl. the compression and
gas treatment process. Of the 8 MW, 4-6 MW comprises the gas driven turbines and the 4-6 MW
7 The collaboration between offshore wind and oil and gas operators may also generate synergy, e.g. by reducing costs for maintenance and installation, joining transport modes, combined helicopter use, joint training activities, etc.

11
electrified capacity compares with a higher capacity gas turbine, because of the lower efficiency of the
latter (20%-25%) compared to the electrified process (information by ENGIE).
2.4. Infrastructure options Keeping the above in mind, a large number of infrastructure options to get the renewable energy
generated by the wind farm to shore via platforms can conceptually be distinguished, depending on
whether the oil and gas platform to which the wind farm may be connected is: an operational
production platform, a non-operational production platform, or a non-operational satellite platform
(the latter is important, because satellites are usually smaller, having less equipment, and having a less
advanced grid connection with shore). In order to structure the cases to be elaborated in this study
quantitatively, first the main categories that can be distinguished will be listed. Based on that, it will
be argued why we only will zoom in on a subset of them.
As far as operational production platforms are concerned, the following four variants can be
distinguished in terms of key infrastructure characteristics.
Table 2. Infrastructure options in case of an operational production platform
Operational production platform
Infrastructure Notes
O1. Gas grid and e-grid connection to shore
Existing gas grid connection to shore
e-grid investment to shore from platform
e-grid connection between platform and wind farm Traditional gas-based compression technology on platform electrified; e-power comes from offshore wind farm, but as a back-up there is an e-grid connection with shore. Hydrogen admixed with the natural gas flows; onshore separation of hydrogen from natural gas.
O2. Only gas grid connection to shore
Existing gas grid connection to shore
e-grid connection between platform and wind farm Traditional gas-based compression technology on platform electrified; e-power comes from offshore wind farm; back-up via gas turbines remains. All offshore wind power is transported to platform and converted into green hydrogen, unless power is needed on the platform itself Hydrogen admixed with the natural gas flows; onshore separation of hydrogen from natural gas.
O3. Gas grid and hydrogen grid connection to shore
Existing gas grid connection to shore
e-grid connection between platform and wind farm
Hydrogen grid connection to shore As case O2, but now also a separate hydrogen grid connection to shore (no admixing, nor separation).
O4. Offshore ammonia production unit and transport added
Existing gas grid connection to shore
e-grid connection between platform and wind farm
Ammonia grid connection, or transport of ammonia by ships

12
As case O2, but now hydrogen is converted to ammonia in the platform area. Ammonia is transported to shore via dedicated pipeline or by ship.
Table 3. Infrastructure options in case of a non-operational production platform
Non-operational production platform
Infrastructure Notes
N1. Gas grid and e-grid connection to shore
Existing gas grid connection to shore
e-grid investment to shore from platform
e-grid connection between platform and wind farm Only part of the electricity from the wind farm is converted to green hydrogen; remainder is transported to shore via e-grid. Green hydrogen admixed with the natural gas flows; onshore separation of hydrogen from natural gas.
N2. Only gas grid connection to shore
Existing gas grid connection to shore
e-grid connection between platform and wind farm All offshore wind power is transported to platform and converted into green hydrogen. Green hydrogen admixed with the natural gas flows; onshore separation of hydrogen from natural gas.
N3. Gas grid and hydrogen grid connection to shore
Existing gas grid connection to shore
e-grid connection between platform and wind farm
Hydrogen grid connection to shore As case N2, but now also a separate hydrogen grid connection to shore (no admixing, nor separation).
N4. Offshore ammonia production unit and transport added
Existing gas grid connection to shore
e-grid connection between platform and wind farm
Ammonia grid connection, or transport of ammonia by ships As case N2, but now green hydrogen is converted to ammonia in the platform area. Ammonia is transported to shore via dedicated pipeline or by ship.
Next to the above-mentioned cases, one could distinguish a case in which a non-operational,
unmanned satellite platform is typically used for electrolyser and related activities. In this case, the
satellite has to be connected with the ‘mother platform’ for getting the offshore wind power to the
satellite and the hydrogen back to the ‘mother platform’, assuming that the ‘mother platform’ has easy
access to admixing options. This may require new grid investment.
2.5. Grid connection options Basically, based on the above differentiation, three options can be distinguished in terms of grid
connections of offshore wind farms. The first case is the classical case in which a power grid connects
the wind farm with the shore. Usually, power from different wind farms is connected and possibly
AC/DC converted centrally at an offshore location. Disregarding such details, essentially in this option
the grid system is all-electric. Because much of the offshore wind capacity is still to be installed, so is
13
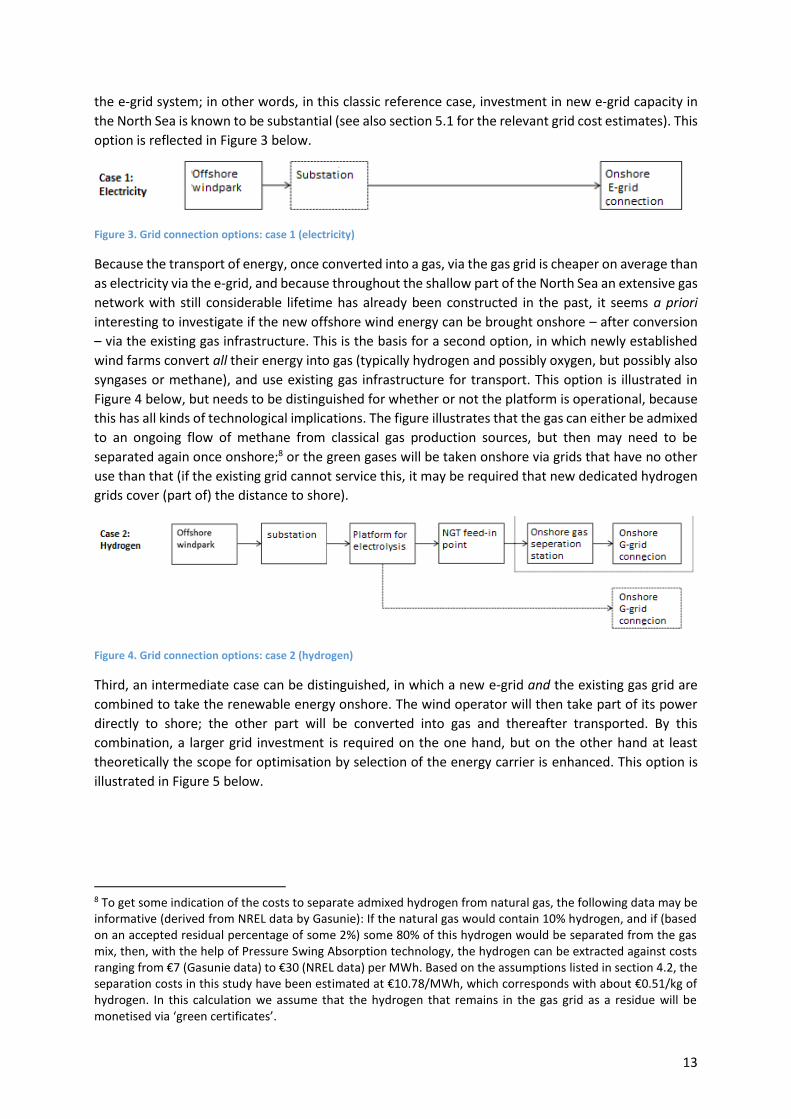
the e-grid system; in other words, in this classic reference case, investment in new e-grid capacity in
the North Sea is known to be substantial (see also section 5.1 for the relevant grid cost estimates). This
option is reflected in Figure 3 below.
Figure 3. Grid connection options: case 1 (electricity)
Because the transport of energy, once converted into a gas, via the gas grid is cheaper on average than
as electricity via the e-grid, and because throughout the shallow part of the North Sea an extensive gas
network with still considerable lifetime has already been constructed in the past, it seems a priori
interesting to investigate if the new offshore wind energy can be brought onshore – after conversion
– via the existing gas infrastructure. This is the basis for a second option, in which newly established
wind farms convert all their energy into gas (typically hydrogen and possibly oxygen, but possibly also
syngases or methane), and use existing gas infrastructure for transport. This option is illustrated in
Figure 4 below, but needs to be distinguished for whether or not the platform is operational, because
this has all kinds of technological implications. The figure illustrates that the gas can either be admixed
to an ongoing flow of methane from classical gas production sources, but then may need to be
separated again once onshore;8 or the green gases will be taken onshore via grids that have no other
use than that (if the existing grid cannot service this, it may be required that new dedicated hydrogen
grids cover (part of) the distance to shore).
Figure 4. Grid connection options: case 2 (hydrogen)
Third, an intermediate case can be distinguished, in which a new e-grid and the existing gas grid are
combined to take the renewable energy onshore. The wind operator will then take part of its power
directly to shore; the other part will be converted into gas and thereafter transported. By this
combination, a larger grid investment is required on the one hand, but on the other hand at least
theoretically the scope for optimisation by selection of the energy carrier is enhanced. This option is
illustrated in Figure 5 below.
8 To get some indication of the costs to separate admixed hydrogen from natural gas, the following data may be informative (derived from NREL data by Gasunie): If the natural gas would contain 10% hydrogen, and if (based on an accepted residual percentage of some 2%) some 80% of this hydrogen would be separated from the gas mix, then, with the help of Pressure Swing Absorption technology, the hydrogen can be extracted against costs ranging from €7 (Gasunie data) to €30 (NREL data) per MWh. Based on the assumptions listed in section 4.2, the separation costs in this study have been estimated at €10.78/MWh, which corresponds with about €0.51/kg of hydrogen. In this calculation we assume that the hydrogen that remains in the gas grid as a residue will be monetised via ‘green certificates’.

14
Figure 5. Grid connection options: case 3 (electricity and hydrogen)
A final special case to be distinguished is the one in which the hydrogen produced offshore is further
converted into ammonia or a comparable chemical substance (see also Table 2 and 3), that can be
brought onshore via dedicated pipelines, or in containers by ships. Especially as long as the market for
green hydrogen remains underdeveloped, the latter option may be interesting, because the current
market for ammonia is worldwide very big, and the market for ‘green’ ammonia may be promising
indeed.
2.6. The optimal electrolyser capacity per offshore wind capacity One of the fundamental questions related to conversion of offshore wind energy into gas with the help
of electrolysis is according to what ratio electrolysis capacity in MW would relate to the underlying
capacity of the wind farm that is assumed to deliver all its power to the electrolyser. In order to derive
that ratio, which is obviously crucial for getting to the business case assessment, the average 2015
wind power profile data for the Dutch continental shelf have been used to get to a time profile of
effective wind farm capacity, given the overall capacity of the existing wind farms, Egmond, Amalia,
and Luchterduinen (together 357 MW capacity). This profile is reflected in Figure 6 by the blue line,
whereby the hours of a year have been drawn on the horizontal axis, and the power generated as a
percentage of the maximum power production given wind farm capacity on the vertical axis. The figure
clearly indicates that production in accordance with full capacity rarely happens (about 500 hours per
year), and also that actual power production is about half of the theoretical maximum given wind farm
capacity.
It is, in the end, an economic issue how much investors would be prepared to invest in electrolyser
capacity of which it is known beforehand that it will stand idle part of the time. If, for instance,
electrolyser capacity in the example given would be installed up to a level of 100% of the wind capacity,
the unused electrolyser capacity would be reflected by the white surface in the figure, which would be
about half of the maximum output. That is why in actual practice optimal electrolyser capacity will be
(considerably) less. In the end, the offshore wind energy not used (e.g. by curtailment) because of
insufficient electrolyser capacity will have to be weighed against the power-to-gas operator’s losses
due to the number of hours per year there will be excess electrolyser capacity. Because the offshore
wind operator will not be prepared to lose any money due to curtailment, we will make the
conservative assumption that the platform operator will have to compensate for the full amount, i.e.
pay for the power including the subsidy that otherwise would have been received by the producer of
wind power. This practice explains why for the electrolyser operator the effective cost price of wind
surpasses its average wholesale price.

15
In the figure below, to illustrate the optimisation process regarding the ratio of the electrolyser
capacity to the offshore wind capacity, we have first made the assumption that no curtailment is
accepted, resulting in an electrolyser/wind farm capacity ratio of 100% (this is reflected by the red
line). Second, the alternative assumption has been made that the electrolyser will be operating at
about 65% of its maximum capacity, which results in an electrolyser/wind farm capacity ratio of 50%
(yellow line). The argument why this could be a more preferred case has to do with the high CAPEX
costs of electrolysers, which may cause the operator to be keen to have the electrolyser running a
significant part of the time.
What the optimal ratio between electrolyser and offshore wind capacity will be, in the end obviously
is a matter of economic optimisation. In a spreadsheet model developed for this study to determine
that optimal ratio, while taking into account the costs to compensate the wind farm operator for its
losses due to curtailed wind power, the optimal ratio at which green hydrogen production costs were
lowest, turned out to be some 78.1% (orange line), which results in curtailment of about 6% of
potential power production from wind.9 It is important to note once again, in this regard, that in this
study the conservative assumption has been used that insofar as the wind farm is curtailed in a case in
which an e-grid connection between the wind farm and shore is absent (G-only case), the operator of
the electrolyser will have to compensate the wind farm for all the missed returns on the curtailed wind
power. This means that the operator is assumed to not only pay the wholesale price for the curtailed
energy, but also the SDE+ subsidy foregone.10 At the assumed costs of electrolyser capacity
(€600,000/MW),11 the optimal electrolyser capacity/wind farm capacity ratio (78.1%) corresponds
with a levelised cost price of ‘green’ hydrogen per kg of €3.37.
Obviously, the optimal electrolyser/wind farm capacity ratio will increase as CAPEX costs of
electrolyser technology would come down, and decrease if compensation costs for curtailed wind
power would decline further and/or power prices would increase. So, keeping this in mind and in view
of the quite solid expectation of considerably declining electrolyser CAPEX prices, a 80% ratio would
probably be an acceptable ballpark figure. Obviously, wind-to-power profiles may change in the future,
if wind conversion technology and the size of windmills develop further, or if wind conditions
themselves alter due to climate change. This can also have some implications for the optimal future
ratio between wind farm capacity and electrolyser capacity, but how this can work out is still
unknown.12
9 The 6% curtailed wind power represents most likely a substantially smaller percentage of the potential wind power value, because the curtailed wind is likely to coincide with the moments in time at which power prices are relatively low (for an early study on the impact of availability of wind on day-ahead power price in the Netherlands, see for instance Nieuwenhout & Brand (2010)). 10 It turns out that this assumption has a strong impact on the ratio between the electrolyser capacity and the capacity of the wind farm. If, instead, we used the assumption that the subsidy on the curtailed wind would still be provided by the government, the optimal ratio declined from 78.1% to about 42%. Obviously, in the latter case the business case of power-to-gas is much more positive, simply because the operator only pays the wholesale power price for the power which needs to be curtailed due to insufficient electrolyser capacity. 11 See also the assumption parameters in section 4.2. 12 ECN (2016) simulated a wind power profile for a 700 MW wind park in the area of IJmuiden Ver, that could be applicable by 2025-2030. The simulation foresees that the current about 50% power return of wind farms may raise towards some 60%. In the simulation, this is caused by increasing the size of wind turbine rotor blades, and by expected higher relevant wind speeds. In this situation, the optimal electrolyser/wind farm capacity ratio may be higher than in the current situation. In this study, in order to provide a conservative and robust estimate of the power-to-gas potential, we have used the solid data with regard to the wind profiles of the existing DCS wind farms for 2015.

16
Figure 6. Graph of effective wind energy outputs and electrolyser to wind farm capacity ratios
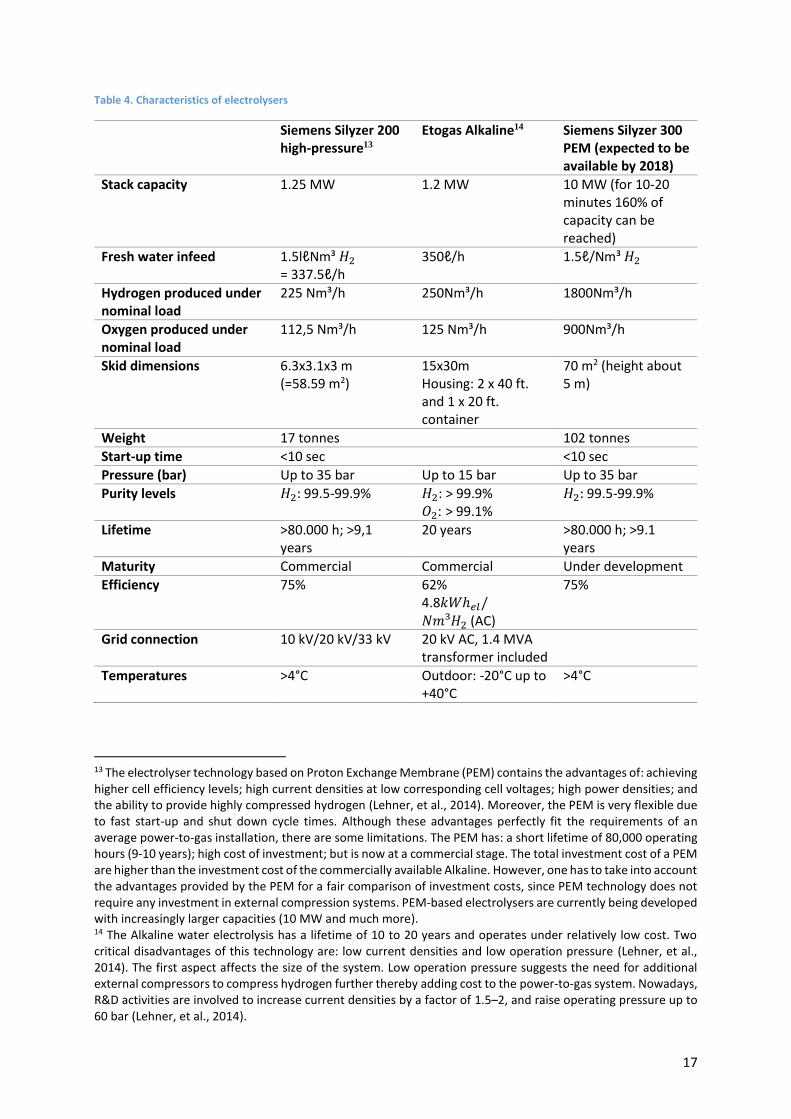
2.7. Economies of scale in producing green hydrogen Currently, relatively small electrolysers (capacity 1-2 MW) are available on the market, that can if
necessary be linked together to enhance overall electrolyser capacity. Some examples are the Siemens
Silyzer 200 and 300 high-pressure electrolysers with Proton Exchange Membrane (PEM) technology,
or the traditional Alkaline electrolyser by Etogas (see Table 4). Given the expected electrolyser market
development, currently some substantially larger and more flexible (10 MW) electrolyser systems are
under development (PEM), which are expected to be available on the market by 2018.
17
Table 4. Characteristics of electrolysers
Siemens Silyzer 200 high-pressure13
Etogas Alkaline14 Siemens Silyzer 300 PEM (expected to be available by 2018)
Stack capacity 1.25 MW 1.2 MW 10 MW (for 10-20 minutes 160% of capacity can be reached)
Fresh water infeed 1.5lℓNm³ 𝐻2 = 337.5ℓ/h
350ℓ/h 1.5ℓ/Nm³ 𝐻2
Hydrogen produced under nominal load
225 Nm³/h 250Nm³/h 1800Nm³/h
Oxygen produced under nominal load
112,5 Nm³/h 125 Nm³/h 900Nm³/h
Skid dimensions 6.3x3.1x3 m (=58.59 m2)
15x30m Housing: 2 x 40 ft. and 1 x 20 ft. container
70 m2 (height about 5 m)
Weight 17 tonnes 102 tonnes
Start-up time <10 sec <10 sec
Pressure (bar) Up to 35 bar Up to 15 bar Up to 35 bar
Purity levels 𝐻2: 99.5-99.9% 𝐻2: > 99.9% 𝑂2: > 99.1%
𝐻2: 99.5-99.9%
Lifetime >80.000 h; >9,1 years
20 years >80.000 h; >9.1 years
Maturity Commercial Commercial Under development
Efficiency 75% 62% 4.8𝑘𝑊ℎ𝑒𝑙/𝑁𝑚³𝐻2 (AC)
75%
Grid connection 10 kV/20 kV/33 kV 20 kV AC, 1.4 MVA transformer included
Temperatures >4°C Outdoor: -20°C up to +40°C
>4°C
13 The electrolyser technology based on Proton Exchange Membrane (PEM) contains the advantages of: achieving higher cell efficiency levels; high current densities at low corresponding cell voltages; high power densities; and the ability to provide highly compressed hydrogen (Lehner, et al., 2014). Moreover, the PEM is very flexible due to fast start-up and shut down cycle times. Although these advantages perfectly fit the requirements of an average power-to-gas installation, there are some limitations. The PEM has: a short lifetime of 80,000 operating hours (9-10 years); high cost of investment; but is now at a commercial stage. The total investment cost of a PEM are higher than the investment cost of the commercially available Alkaline. However, one has to take into account the advantages provided by the PEM for a fair comparison of investment costs, since PEM technology does not require any investment in external compression systems. PEM-based electrolysers are currently being developed with increasingly larger capacities (10 MW and much more). 14 The Alkaline water electrolysis has a lifetime of 10 to 20 years and operates under relatively low cost. Two critical disadvantages of this technology are: low current densities and low operation pressure (Lehner, et al., 2014). The first aspect affects the size of the system. Low operation pressure suggests the need for additional external compressors to compress hydrogen further thereby adding cost to the power-to-gas system. Nowadays, R&D activities are involved to increase current densities by a factor of 1.5–2, and raise operating pressure up to 60 bar (Lehner, et al., 2014).
18
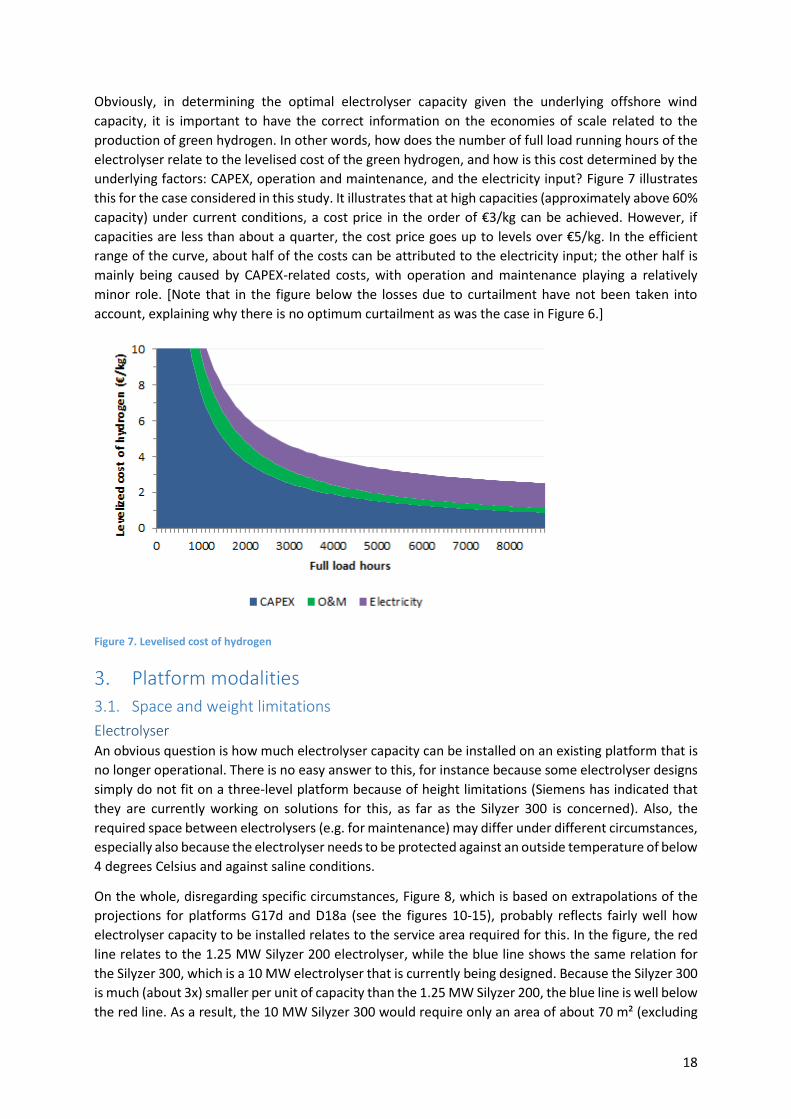
Obviously, in determining the optimal electrolyser capacity given the underlying offshore wind
capacity, it is important to have the correct information on the economies of scale related to the
production of green hydrogen. In other words, how does the number of full load running hours of the
electrolyser relate to the levelised cost of the green hydrogen, and how is this cost determined by the
underlying factors: CAPEX, operation and maintenance, and the electricity input? Figure 7 illustrates
this for the case considered in this study. It illustrates that at high capacities (approximately above 60%
capacity) under current conditions, a cost price in the order of €3/kg can be achieved. However, if
capacities are less than about a quarter, the cost price goes up to levels over €5/kg. In the efficient
range of the curve, about half of the costs can be attributed to the electricity input; the other half is
mainly being caused by CAPEX-related costs, with operation and maintenance playing a relatively
minor role. [Note that in the figure below the losses due to curtailment have not been taken into
account, explaining why there is no optimum curtailment as was the case in Figure 6.]
Figure 7. Levelised cost of hydrogen
Platform modalities
3.1. Space and weight limitations
Electrolyser An obvious question is how much electrolyser capacity can be installed on an existing platform that is
no longer operational. There is no easy answer to this, for instance because some electrolyser designs
simply do not fit on a three-level platform because of height limitations (Siemens has indicated that
they are currently working on solutions for this, as far as the Silyzer 300 is concerned). Also, the
required space between electrolysers (e.g. for maintenance) may differ under different circumstances,
especially also because the electrolyser needs to be protected against an outside temperature of below
4 degrees Celsius and against saline conditions.
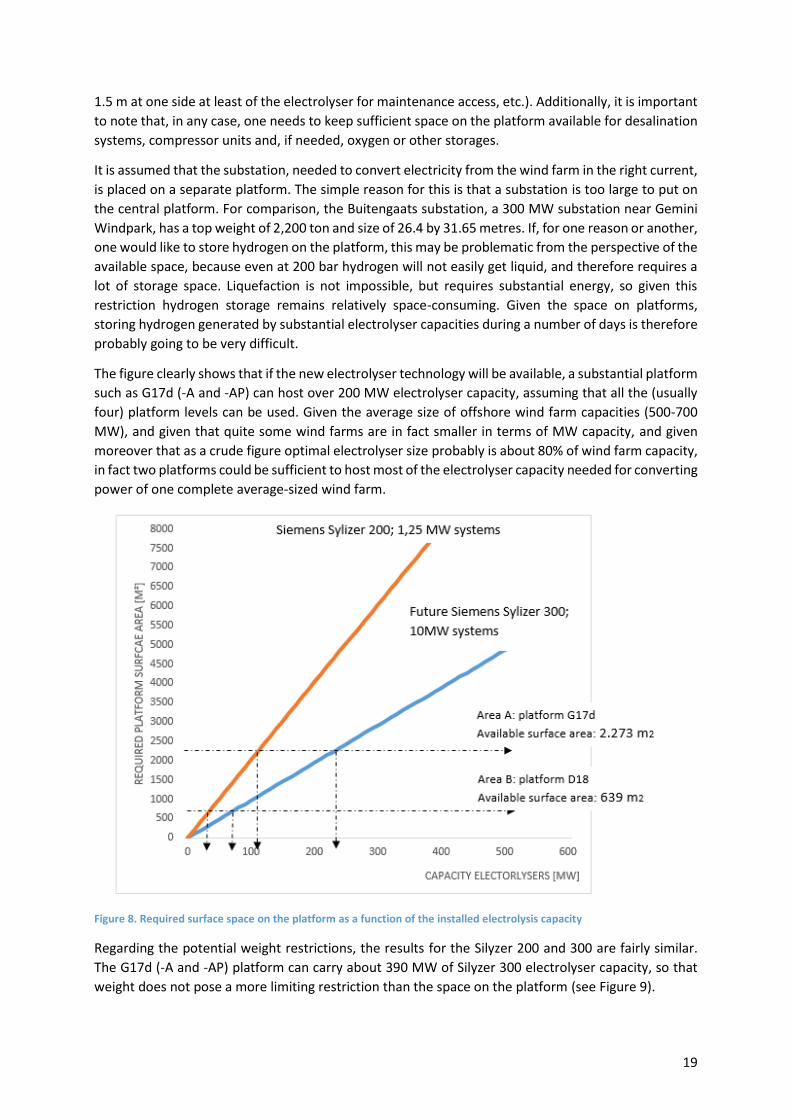
On the whole, disregarding specific circumstances, Figure 8, which is based on extrapolations of the
projections for platforms G17d and D18a (see the figures 10-15), probably reflects fairly well how
electrolyser capacity to be installed relates to the service area required for this. In the figure, the red
line relates to the 1.25 MW Silyzer 200 electrolyser, while the blue line shows the same relation for
the Silyzer 300, which is a 10 MW electrolyser that is currently being designed. Because the Silyzer 300
is much (about 3x) smaller per unit of capacity than the 1.25 MW Silyzer 200, the blue line is well below
the red line. As a result, the 10 MW Silyzer 300 would require only an area of about 70 m² (excluding
19
1.5 m at one side at least of the electrolyser for maintenance access, etc.). Additionally, it is important
to note that, in any case, one needs to keep sufficient space on the platform available for desalination
systems, compressor units and, if needed, oxygen or other storages.
It is assumed that the substation, needed to convert electricity from the wind farm in the right current,
is placed on a separate platform. The simple reason for this is that a substation is too large to put on
the central platform. For comparison, the Buitengaats substation, a 300 MW substation near Gemini
Windpark, has a top weight of 2,200 ton and size of 26.4 by 31.65 metres. If, for one reason or another,
one would like to store hydrogen on the platform, this may be problematic from the perspective of the
available space, because even at 200 bar hydrogen will not easily get liquid, and therefore requires a
lot of storage space. Liquefaction is not impossible, but requires substantial energy, so given this
restriction hydrogen storage remains relatively space-consuming. Given the space on platforms,
storing hydrogen generated by substantial electrolyser capacities during a number of days is therefore
probably going to be very difficult.
The figure clearly shows that if the new electrolyser technology will be available, a substantial platform
such as G17d (-A and -AP) can host over 200 MW electrolyser capacity, assuming that all the (usually
four) platform levels can be used. Given the average size of offshore wind farm capacities (500-700
MW), and given that quite some wind farms are in fact smaller in terms of MW capacity, and given
moreover that as a crude figure optimal electrolyser size probably is about 80% of wind farm capacity,
in fact two platforms could be sufficient to host most of the electrolyser capacity needed for converting
power of one complete average-sized wind farm.
Figure 8. Required surface space on the platform as a function of the installed electrolysis capacity
Regarding the potential weight restrictions, the results for the Silyzer 200 and 300 are fairly similar.
The G17d (-A and -AP) platform can carry about 390 MW of Silyzer 300 electrolyser capacity, so that
weight does not pose a more limiting restriction than the space on the platform (see Figure 9).

20
Figure 9. Weight of installed electrolysis capacity, compared to the current weight carried on platforms G17 and D18
In the figures below, for the platforms it has been illustrated how the electrolysers could be positioned,
given the platform sizes, both for the Siemens Silyzer 200 and 300. By this way of positioning, there
remains sufficient space between the electrolysers for maintenance, etc., as well as for other
equipment required.
Because the platforms contain three or four floor levels, platforms G17d-A, G17d-AP, and D18a can
contain respectively 9, 16, and 6 Silyzer 300 electrolysers, or 21, 44, and 12 Silyzer 200 electrolysers.
In all cases, given the weight of the electrolysers and the weight capacity of the platforms, the actual
weight of the electrolysers does not seem to pose a serious problem. As was mentioned before, a
caveat is the height of the electrolysers, which in their current design may be problematic, given the
vertical distance between the platform decks (for example, the two lowest levels of platform D18a are
3.6 m and 4.1 m high, respectively). That is why, for instance at Siemens, discussions on its design or
possibly dedicated designs for offshore purposes are currently ongoing. However, if platforms would
be brought to shore to be refitted, platform dimensions could be accommodated to the size of the
electrolysers.

21
Figure 10. Silyzer 200 electrolysers on platform G17d-A (per platform level, total of 3 levels)
Figure 11. Silyzer 300 electrolysers on platform G17d-A (per platform level, total of 3 levels)
22
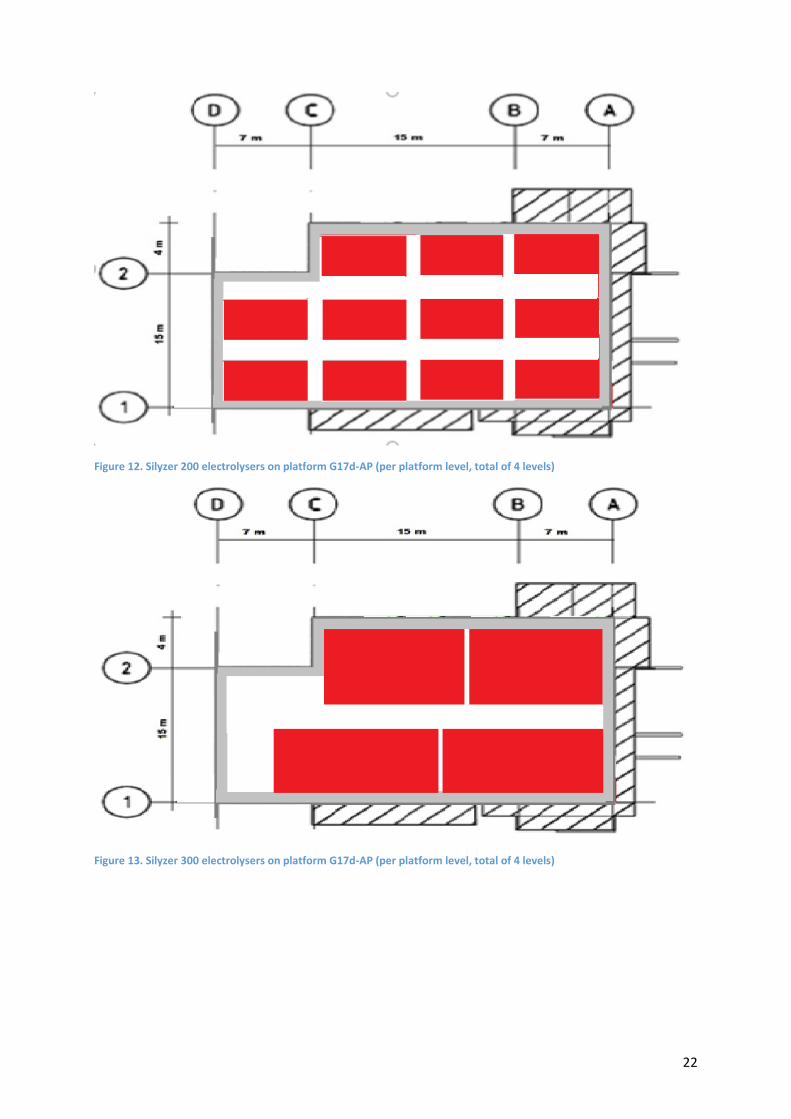
Figure 12. Silyzer 200 electrolysers on platform G17d-AP (per platform level, total of 4 levels)
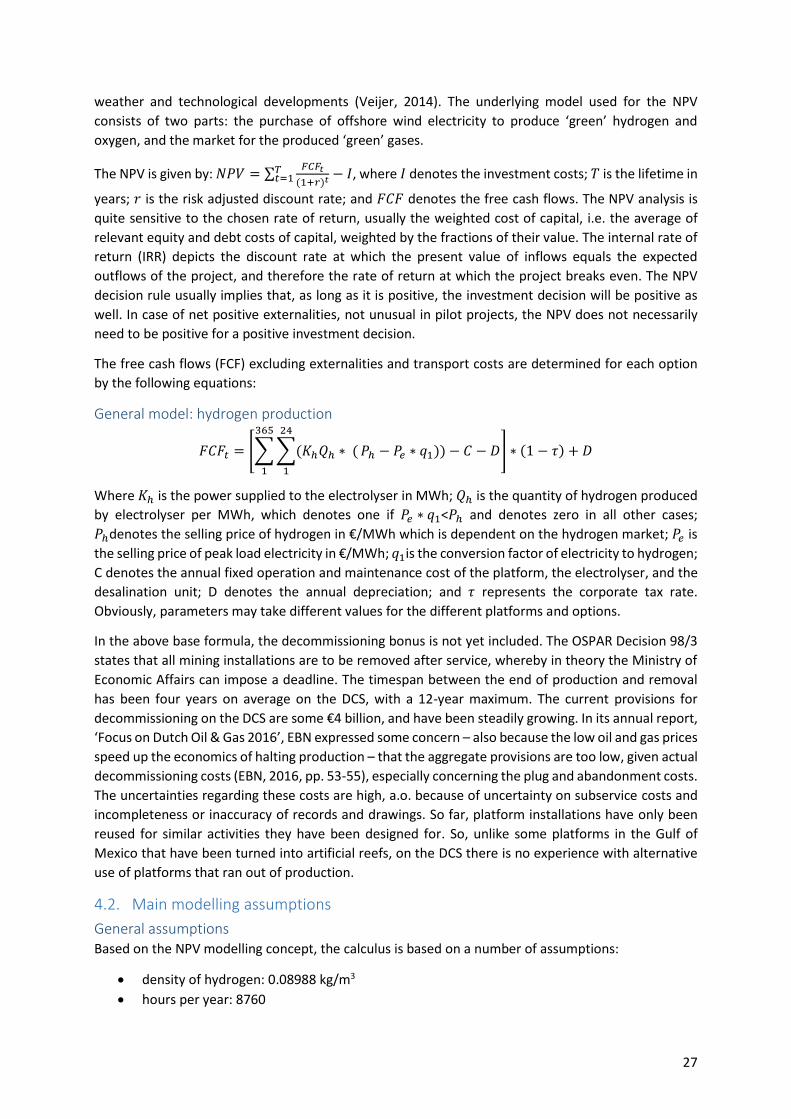
Figure 13. Silyzer 300 electrolysers on platform G17d-AP (per platform level, total of 4 levels)

23
Figure 14. Silyzer 200 electrolysers on platform D18a (per platform level, total of 3 levels)
Figure 15. Silyzer 300 electrolysers on platform D18a (per platform level, total of 3 levels)

24
Desalination unit Table 5. Characteristics of desalination unit
A specific component that is imperative for electrolysis is the availability of demineralised water. At
full load of an electrolyser, some 6,500 litre of this water per MW per day is required. This can be
produced from sea water, but that requires a demineralisation unit. The salinity of North Sea water
averages between 34 and 35 grams of salt per litre; desalination via reverse osmosis implies an
operating pressure of seawater of around 60 bar. This way, almost all (around 95 to 99%) of dissolved
salts is left behind in the reject stream. This may imply that additional technologies have to be applied
to make sure that pure demineralised water can be fed into the electrolyser system. Usually,
desalination units are not terribly big. An example of the data characteristics of such a unit is illustrated
in the table above. See Annex 1 for more information on water treatment.
Oxygen compression space and weight requirements The most efficient way to store oxygen is in cylinder bundles. The pure level of oxygen (at least 96%;
otherwise it would be explosive) from the electrolysis process is directed to an oxygen storage tank.
From the regulated storage tank, oxygen is fed into the RIX high pressure oxygen compressor where
oxygen is boosted to tank pressure and fed to the Manifold and into the high pressure cylinders (see
Figure 16).
Figure 16. Oxygen storage in Cylinder bundles; retrieved from Oxywise, 2016, personal contact with Fero Michalec
According to Oxywise data, compressing the oxygen retrieved from the conversion of 0.428 MW of
electrolyser capacity (i.e. in our calculations 1 MW of wind farm capacity) requires 10 RIX high pressure

25
oxygen compressors of the 4V4BG series. The size of a single compressor is 1.27 m by 1.55 m (with a
height of 1.04 m), and thus the space requirement of ten compressors is 19.69 m² of floor space. The
weight of the ten oxygen compressors combined is 7,500 kg. Since the minimum electrolysis capacity
assumed to be installed on a platform is about 10MW, space and weight of oxygen compression could
become a bottleneck. That is why in the following the assumption has been made not to use the
electrolysis ‘side-product’ oxygen.
3.2. Other technological issues
Compression capacities An obvious question is if the available compression capacity is sufficient and suitable to compress the
hydrogen generated by the electrolyser, assuming the hydrogen is admixed to the gas flows through
the pipeline system. On the whole, compression capacity does not seem to pose a bottleneck, at least
if one is allowed to assume15 that compressors traditionally used for compressing natural gas can also
handle the compression of hydrogen. Given the two platforms considered, G17d and D18a, the
argument is as follows.
In case of D18a, existing compressor capacity – at the nearby ‘mother platform’ D15a – is 300 million
m3 per annum. Assuming an electrolyser capacity to be installed on platform D18a of 60 MW (based
on two Silyzer 300 electrolysers per level, see Figure 15), and assuming that electrolyser capacity
comprises 78.1% of wind capacity (in conformity with the orange line in Figure 8), a wind farm of some
77 MW capacity can be serviced. Assuming that the power of this wind farm will generate about 62.5
million m3 hydrogen per year, it is clear that the existing compression capacity can easily handle this.
Even double this amount would most likely not pose any serious bottleneck in terms of available
compression capacity. In case of platforms G17d-A and G17d-AP, the joint electrolyser capacity may
well be in the order of 250 MW.
Ammonia One of the disadvantages of producing, transporting, storing, and using hydrogen, is that this gas is
rather reactive, difficult to compress, and because of its small molecules, easily leaking. This explains
why alternatives are explored to store energy on the basis of hydrogen, e.g. methane after
methanation, or ammonia or comparable chemical substances via chemical conversion based on
hydrogen combined with nitrogen. Especially the production of ammonia may be interesting under
offshore conditions (based on small- or medium-size conversion units), especially if somehow the
transport to shore and/or storage of hydrogen turns out to be problematic. Ammonia has a number of
advantages in this regard, a.o. that it is relatively easy to transport by boat, but also to store in tanks.
In addition, ammonia, being a combination of hydrogen with nitrogen, has a dual use in the sense that
ammonia can either be seen as an energy carrier, whereby the hydrogen is supported by the nitrogen
molecules, or as a fertiliser base, whereby the nitrogen is supported by the hydrogen molecules. This
explains also why the worldwide market for ammonia is enormous: currently over 140 million tonnes,
more than half of which is used for the agricultural sector as a fertiliser.
In a separate study, a crude calculation has been made of a case in which a 700 MW wind farm is
combined with a 125 MW electrolyser annex ammonia plant. The assumption is that power from the
wind farm is first allocated to the electrolyser as much as possible, the hydrogen of which is
subsequently completely converted into ammonia with the help of the nitrogen generated by an air-
to-nitrogen production unit. Assuming an ammonia price of €400 per tonne and a power price of 7.2
15 Information whether or not this assumption is justified differed between the various sources we asked for information.

26
cents per kWh,16 and assuming CAPEX costs of some €1.05 billion for the wind farm, €125 million for
the electrolyser, and about €86 million for the ammonia plant, and assuming that some 15% of the
electrolyser capacity cannot be used because of a lack of power (percentage derived from the North
Sea wind profile; see also Figure 6), the annual returns based on the sales of power and ammonia boils
down to some €176 million per year, consisting of some €124 million for the electricity and some €52
million for the ammonia. The overall rate of return of the total investment project studied covering 16
years – i.e. the wind farm, electrolyser, ammonia convertor, and related equipment – is 9.4%.
In a comparable calculation in which the ammonia convertor is absent, and the only product sold is –
next to power – the hydrogen from the 125 MW electrolyser, the business case result is slightly better
(assuming a hydrogen price of €3 per kg): total annual returns are now some €194 million, of which
some €70 million based on hydrogen sales, giving an overall rate of return of 12.3%. In other words,
given our assumptions with regard to hydrogen and ammonia prices, €3 per kg and €400 per tonne,
respectively, hydrogen sales provide a slightly better business case. This, however, obviously can easily
change if the price ratios change, and/or if the costs of transport modalities are taken into account.17
Obviously, if offshore conversion of hydrogen into ammonia would be considered, the issue that needs
to be addressed is if there is sufficient space on the platform(s) for the small or medium-sized
conversion units and related storage requirement. [Note that the production of the NFuel 1000
MT/year requires six 40ft container storage space.] A model image of such an installation is presented
in Figure 17.
Figure 17: Ammonia plant outline Protonventures; retrieved from Protonventures (2016)
The energy conversion and storage business model analysis
4.1. The modelling structure In this report, just as in the former report (Jepma, 2015), the economics of different power-to-gas
options is basically assessed by a net-present-value (NPV) analysis. NPV is a discounted cash-flow
method that calculates the expected net monetary gain or loss from a project by discounting all future
cash inflows and outflows to the present point in time using a specified rate of return. In this analysis
the focus is on daily optimisation. It is based on a stochastic calculus because one of the key inputs,
prevailing electricity prices, tends to follow a stochastic price pattern, induced by factors such as
16 Figure based on the mid-2016 tender results relating to the Borssele I and II wind farms. 17 A modern development in ammonia transport is to put it in train tanks, which makes it easy to transport substantial volumes of ammonia by rail. The same tanks could also be used for transport by ship.
27
weather and technological developments (Veijer, 2014). The underlying model used for the NPV
consists of two parts: the purchase of offshore wind electricity to produce ‘green’ hydrogen and
oxygen, and the market for the produced ‘green’ gases.
The NPV is given by: 𝑁𝑃𝑉 = ∑𝐹𝐶𝐹𝑡
(1+𝑟)𝑡𝑇𝑡=1 − 𝐼, where 𝐼 denotes the investment costs; 𝑇 is the lifetime in
years; 𝑟 is the risk adjusted discount rate; and 𝐹𝐶𝐹 denotes the free cash flows. The NPV analysis is
quite sensitive to the chosen rate of return, usually the weighted cost of capital, i.e. the average of
relevant equity and debt costs of capital, weighted by the fractions of their value. The internal rate of
return (IRR) depicts the discount rate at which the present value of inflows equals the expected
outflows of the project, and therefore the rate of return at which the project breaks even. The NPV
decision rule usually implies that, as long as it is positive, the investment decision will be positive as
well. In case of net positive externalities, not unusual in pilot projects, the NPV does not necessarily
need to be positive for a positive investment decision.
The free cash flows (FCF) excluding externalities and transport costs are determined for each option
by the following equations:
General model: hydrogen production
𝐹𝐶𝐹𝑡 = [∑ ∑(𝐾ℎ𝑄ℎ ∗ (
24
1
𝑃ℎ − 𝑃𝑒 ∗ 𝑞1)) − 𝐶 − 𝐷
365
1
] ∗ (1 − 𝜏) + 𝐷
Where 𝐾ℎ is the power supplied to the electrolyser in MWh; 𝑄ℎ is the quantity of hydrogen produced
by electrolyser per MWh, which denotes one if 𝑃𝑒 ∗ 𝑞1<𝑃ℎ and denotes zero in all other cases;
𝑃ℎdenotes the selling price of hydrogen in €/MWh which is dependent on the hydrogen market; 𝑃𝑒 is
the selling price of peak load electricity in €/MWh; 𝑞1is the conversion factor of electricity to hydrogen;
C denotes the annual fixed operation and maintenance cost of the platform, the electrolyser, and the
desalination unit; D denotes the annual depreciation; and 𝜏 represents the corporate tax rate.
Obviously, parameters may take different values for the different platforms and options.
In the above base formula, the decommissioning bonus is not yet included. The OSPAR Decision 98/3
states that all mining installations are to be removed after service, whereby in theory the Ministry of
Economic Affairs can impose a deadline. The timespan between the end of production and removal
has been four years on average on the DCS, with a 12-year maximum. The current provisions for
decommissioning on the DCS are some €4 billion, and have been steadily growing. In its annual report,
‘Focus on Dutch Oil & Gas 2016’, EBN expressed some concern – also because the low oil and gas prices
speed up the economics of halting production – that the aggregate provisions are too low, given actual
decommissioning costs (EBN, 2016, pp. 53-55), especially concerning the plug and abandonment costs.
The uncertainties regarding these costs are high, a.o. because of uncertainty on subservice costs and
incompleteness or inaccuracy of records and drawings. So far, platform installations have only been
reused for similar activities they have been designed for. So, unlike some platforms in the Gulf of
Mexico that have been turned into artificial reefs, on the DCS there is no experience with alternative
use of platforms that ran out of production.
4.2. Main modelling assumptions
General assumptions Based on the NPV modelling concept, the calculus is based on a number of assumptions:
density of hydrogen: 0.08988 kg/m3
hours per year: 8760

28
Assumptions regarding financing, return requirements, and economic conditions
inflation rate: 0%
tax rate: 20%
minimum required return on equity: 10%
interest long-term private debt: 4%
debt/equity ratio: 40/60
opportunity cost of capital: 7.6% (WACC)
year of investment: 2025
year of starting operation: 2026
operating period: 10 years
oxygen is not valued (see section 3.1 on oxygen compression space and weight requirements).
Assumptions regarding electricity prices It is assumed that the average production costs in €/MWh are similar to the bidding level for offshore
wind park concessions (in the base case these are assumed to be €72/MWh; in reality, however, lower
bids have already been made for some locations relatively near shore in the course of 2016:
€49.9/MWh; see also footnote 4). The overall wholesale (APX) market trend for power prices seems
to be downward.
The €72/MWh assumption in the base case includes the assumption of about €42/MWh SDE+ subsidy
for renewable power production, and €30/MWh price of power at the wholesale level.18 The additional
assumption is that the SDE+ subsidy will be provided for all wind power generated, irrespective
whether the power will actually be delivered to the grid or instead be delivered to the platform for
conversion.
In the case of an optimal ratio of the electrolyser capacity vis-à-vis the windfarm capacity (some 78%
in the base case), 6% of the wind power is curtailed. As was argued before, it is assumed in the
simulations that the operator of the electrolyser fully compensates the offshore wind operator for the
missed returns due to power being curtailed.
Assumptions regarding hydrogen prices The ‘grey’ hydrogen price as commonly used for bulk volumes by the chemical industry is assumed to
be €1.56/kg or €25.20/MWh, while the ‘grey’ hydrogen price as used in mobility is assumed to be
€4.67/kg or €75.55/MWh (Jansen, 2015; Jepma, 2015, pp. 22-23). Because the mass of CO2 emissions
related to the production of ‘grey’ hydrogen (generated via traditional steam reforming) is about 10
times higher than the mass of the produced hydrogen, the price impact of the CO2 footprint of the
production of a kg of ‘grey’ hydrogen is about €0.06, if one would assume that hydrogen production is
subject to the EU ETS, and that allowance prices are €6/tCO2.
Based on average Dutch subsidy rates for ‘green’ versus ‘grey’ energy supply, for ‘green’ hydrogen a
mark-up of 30% on the price of ‘grey’ hydrogen is assumed. This implies a price for ‘green’ hydrogen
of €2.03/kg or €32.76/MWh for the low hydrogen price cases, and €6.07/kg or €98.22/MWh for the
high hydrogen price cases. To further illustrate why the assumed about €6/kg for ‘green’ hydrogen to
be used in mobility could be considered to be still relatively conservative, the following reasoning could
apply. The energy content of 1 kg of hydrogen is roughly sufficient to drive a modern hydrogen car
18 The wholesale price of power relates to a post-2025 projection (the assumed starting year of the project); this price currently fluctuates fairly strongly, and shows a downward trend from the current average levels. See also the average wholesale baseload electricity price for the Netherlands during Q1 2016 (European Commission, 2016, p. 13).
29
(with fuel cell) about 100 km. If the same distance is covered with the help of an average car fuelled
by petrol or diesel, the average costs for fuels range anywhere between €8 and €10, as ballpark figures.
The assumed about €6/kg for ‘green’ hydrogen therefore is relatively low, if a direct price comparison
is made. This comparison is, however, of course complicated by the tax component of the petrol/diesel
price, which is not yet included in the €6/kg for the hydrogen. But then again, the hydrogen is a ‘green’
fuel unlike the petrol/diesel, so that a less heavy tax regime would seem fair. All in all, the about €6/kg
is therefore considered an acceptable proxy level for a future high, niche market ‘green’ hydrogen
price.
If the allowance price would increase the ‘grey’ hydrogen price per kg will roughly increase with €0.01
for every €1 of increase of the EU ETS allowance price. So, for the chemical industry, the price of ‘grey’
hydrogen would increase to levels similar to that of the assumed ‘green’ hydrogen price (€2.03), if the
EU ETS allowance price would rise to €53.
General assumptions regarding platforms
for operational platforms, 10% of OPEX is assigned to energy conversion
costs related to preparing a platform for installation of electrolysers: €10/kg
costs related to adding a complete new deck: €40/kg
part of the deck not replaced (direct gas-specific installations): 25% of weight (assumed also
25% of costs)
Assumptions specifically for platform G17d
OPEX of manned platform G17d if life is prolonged: €8,800,000/year
weight of platforms G17d-A and G17d-AP: 3,200 tonnes
max. electrolysis capacity to be installed: 250 MW (assuming Silyzer 300 electrolysers)
total costs of rebuilding platform decks, incl. design: €176,000,000
decommissioning costs: €20,000,000
Assumptions specifically for platform D18a
OPEX of satellite platform D18 if life is prolonged: €4,000,000/year
Weight of platform: 1,000 tonnes
max. electrolysis capacity to be installed: 60 MW (assuming Silyzer 300 electrolysers)
total costs of rebuilding platform decks, incl. design: €40,000,000
decommissioning costs: €7,000,000
Assumptions related to CAPEX and OPEX of conversion equipment
CAPEX of Silyzer 300 (projection; the 2016 CAPEX is about €1,000/kW): €600/kW. This assumed
CAPEX figure is based on the notion of a learning curve, suggesting considerable scope for cost
reduction if conversion technology can be implemented on a large scale and for a long period.
In comparable conversion technologies cost reductions of over 50% within a decade are no
exception.
CAPEX desalination unit: €61,200 for a 2000L/h capacity unit
maintenance costs of Silyzer 300 and a related desalination unit (projection): 2.5%. This figure
does not include the costs of electricity intake.
hydrogen production per unit of power: 1 kg/47 kWh, leading to an energy efficiency of 75%19
depreciation period of electrolyser and related equipment: 10 years
19 This figure can be considered conservative; in DNV GL AS (2015, p. 24), the theoretical system efficiency is estimated to be 81%.
30
residual value of the same equipment: €0 (at least if operation time exceeds 60,000 running
hours; otherwise depreciation in proportion with running hours)
Assumptions related to transport and project externalities
investment costs (2015)20 of a 320 MW e-grid connection of wind farm near platform G17d to
shore: €147,169,65021
investment costs (2015) of a 77 MW e-grid connection of wind farm near platform D18a to
shore: €38,529,01422
CAPEX of gas separation station (PSA): €1,000 per capacity of 1 Nm³/h
OPEX of gas separation station (PSA): 5% of CAPEX
CAPEX of new hydrogen compressor: €2,802/kW
Annual maintenance costs for hydrogen compressor: 3% of CAPEX
CAPEX of dedicated hydrogen pipeline (inlet pressure 100 bar): about € 450,000-625,000/km,
depending on pipeline diameter, see Table 7.
OPEX of dedicated hydrogen pipeline: 2% of CAPEX
Transport and compression costs for hydrogen via existing natural gas pipelines: €16.50/1000
Nm³
Assuming 6 MW compressor capacity, the annual monetary value of CO2 emission reductions
realised through zero-emission electrification of compressors is about €1,750,000 (assuming
an EU ETS allowance price of €6/tCO2 and assuming use of diesel fuelling as baseline)
Transporting wind energy to shore: transport costs and other
externalities
5.1. Transport options and modalities
Electricity transport to the platform The degree to which grid connections are to be considered an externality to the platform owner in the
end depends on the legal regime as to which party is held responsible for investment in the energy
transport system. In the offshore case of the Netherlands, the regime is relatively favourable for wind
farm operators: wind farm operators are responsible for the e-grid connection of their wind parks to a
substation, but the TSO is usually responsible for the substations and the connection of the substations
to shore; in the case of the Netherlands the TSO is TenneT.
The platforms have to be connected with the wind farms through 800 mm2 and 240 mm2 array cables
(DNV GL, 2016). The supply costs per metre are €465 and €180, respectively; installation costs for both
cable items are some €200 per metre, which is much higher than for onshore cables.
20 Data are based on 2010 prices. The assumption was that the relevant cumulative inflation (CPI) in the Netherlands between 2010 and 2015 amounted to 8.65% (based on CBS data). 21 Note that there is only a positive externality related to an e-grid if the investment costs will no longer be made, because all offshore wind energy is transported, after conversion, via the existing gas grid. Moreover, the assumption is that the investors linked to the platform activities will not themselves be engaged in any e-grid investment activity, because another, public party will have to take care of this and will only charge a publicly controlled annual access fee. 22 Note that in practice no 77 MW power cable would be used; rather the capacity of the cable will be substantially higher, e.g. 700 MW, and the investment costs would be shared among the connections. Therefore, only a proportion of the overall externality has been assigned to the D18a platform case considered.
31
Hydrogen transport via existing pipeline system The chemical and physical properties of methane and hydrogen are significantly different, which makes
that hydrogen cannot always simply be transported by the existing pipelines that are designed and
constructed for natural gas transport. The additional infeed of hydrogen may adversely affect the
integrity and durability of the pipeline network, especially at higher pressures, and affect the quality
of gas. This explains why admixing volumes are subject to specific regulations, codes, and standards.
The Naturalhy project,23 an integrated European project on the issue, assessed the feasibility and
impact of admixing hydrogen into the medium pressure gas pipeline system (operated between 8 and
40 bar), and found acceptable admixing levels up to 50%, depending on specific conditions. High
pressure transmission steel pipelines are only suitable for lower admixtures of up to 30% without
unacceptable risks. Nevertheless, currently the Dutch Government allows only 0.02% hydrogen
admixture, but plans do exist to allow admixing 0.5% hydrogen into low caloric gas by 2021; the
expectation, however, is that new technologies may further increase the abovementioned
percentages in the future (Verhagen, 2012). Also, it is well possible that in offshore conditions admixing
percentages allowed will be higher under the condition that the hydrogen will be removed again once
the gas comes onshore.
Also in other literature, various percentages of acceptable admixing of hydrogen are mentioned.
Altfeld and Pinchbeck (2013) show, for instance, that admixtures of up to 10% by volume of hydrogen
to the natural gas is possible without serious risks for most parts of the natural gas system. They also
indicate, however, that the same percentage may not be suitable for steel tanks in natural gas vehicles,
gas turbines and gas engines.
So, the technological and regulatory adaptation of the natural gas network to hydrogen admixture is
growing, but this may well be a long-term process. It seems not unlikely that admixing would typically
start under offshore conditions, whereby the hydrogen will be filtered out once the gas reaches the
shore, to be transported further possibly via dedicated pipeline systems. It is important to note in this
regard that in the Netherlands situation, supervision on the onshore pipeline transport system is
delegated to the Staatstoezicht op de Mijnen (SodM), whereas supervision on offshore pipelines is
subject to the so-called Wet Beheer Rijkswaterstaatwerken (WBR) act.
The admixture of hydrogen on the offshore platforms considered in this study is not expected to be
problematic, as peak hydrogen production at platform D18a does not lead to an admixture of more
than 5% of the total flow of gases via platform D15. When hydrogen infeed is technically feasible, its
costs (for both compression and transport) are expected to be similar to those of methane infeed:
€16.50/1000m³ (ENGIE, 2016).
Gas separation technology Assuming that for economic or regulatory reasons the hydrogen admixed to the natural gas will need
to be separated again once the gas is onshore, the question arises how this can be done and what can
be said about its costs. Various techniques of separation exist (Gupta, et al., 2015):
pressure swing adsorption (PSA) operating at low hydrogen concentrations (<20%);
(polymeric) membrane separation, which is efficient with relatively high concentrations of
hydrogen, and can give highly pure hydrogen (Kluiters, 2004; Uehara, 2008);
electrochemical hydrogen separation techniques, also known as hydrogen pumping.
23 http://www.gerg.eu/public/uploads/files/publications/academic_network/2010/1b_Florisson.pdf

32
In the simulations in this study, the PSA technology data have been used, because the concentration
of hydrogen admixed to the natural gas on average is rather small. The CAPEX costs of this extraction
technology are about €1,000 per capacity of 1 Nm3/h (assuming a depreciation period of 10 years),
with annual OPEX costs of 5% of CAPEX costs (Hy2Seps-2, 2015).
Hydrogen transport via dedicated pipelines Hydrogen transport via high pressure steel pipelines is more challenging than methane transport due
to hydrogen embrittlement, which causes the strong steel pipes to be more vulnerable to cracking,
and because of the hydrogen attack that allows reactions with the steel carbon atoms under certain
operating conditions (Dodds & McDowall, 2012). The pipeline capacity for hydrogen is about 20%
lower than that for methane, while the total hydrogen that can be stored within the pipelines is just a
quarter of the total methane at the same energetic pressure. This can be explained by the lower
volumetric density of hydrogen combined with a faster flow rate.
Hydrogen pipeline costs depend on pipeline diameter, pipeline length, land use, and labour costs. The
costs are dominated by high initial investment cost that are independent of the hydrogen throughput.
The latter implies that the utilisation rate is an important factor determining the economic viability per
transported unit, if there is a long transition period to using hydrogen. For an overview of the network
costs of a pipeline system, see Table 6.
Table 6. Recommended cost factors of gas pipeline investment (Dodds & McDowall, 2012, p. 13)
Based on these data and on the methodology used by André et al. (2014),24 the figures in
24 The methodology of André et al. (2014) is based on onshore conditions, but disregards costs related to licensing, etc. That is why this approach was considered acceptable for offshore conditions, where licensing issues may be relatively straightforward.

33
Table 7 reflect indicative offshore pipeline investment costs for transporting hydrogen to shore for the
platforms considered. The figures are based on high pressure pipelines (in 100 bar – out 62.5 bar). The
OPEX costs of a dedicated pipeline network are estimated to be about 2% of CAPEX.
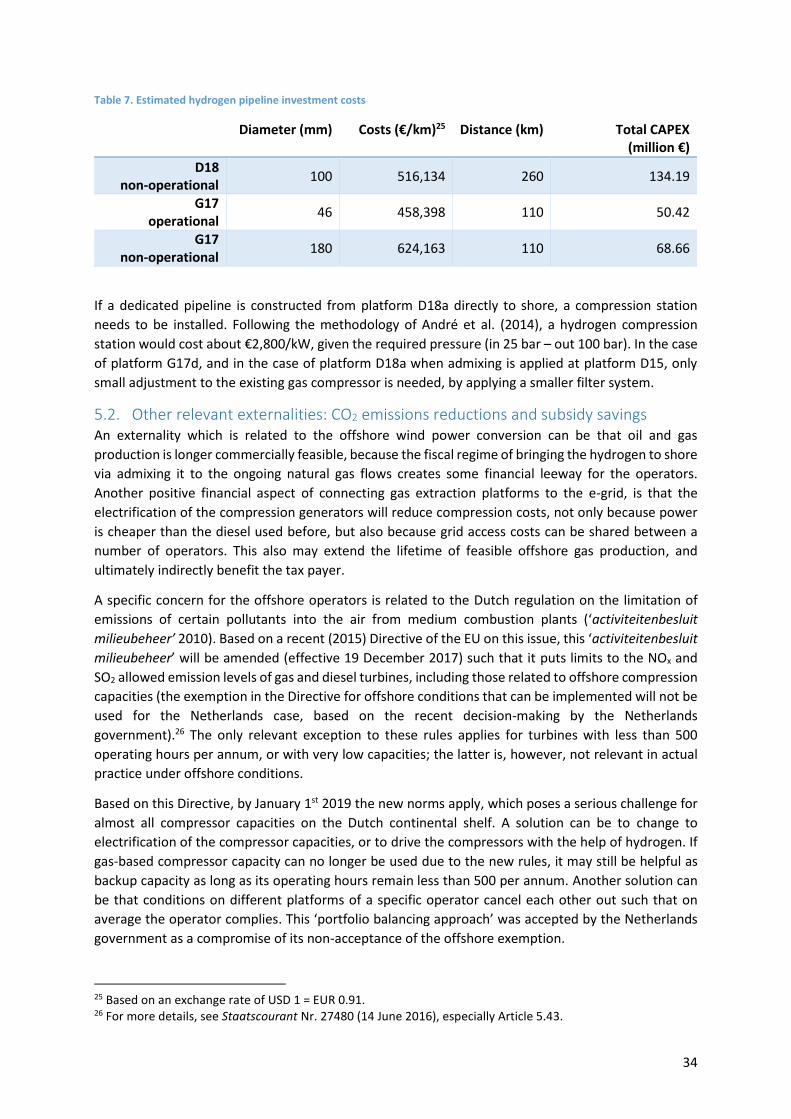
34
Table 7. Estimated hydrogen pipeline investment costs
Diameter (mm) Costs (€/km)25 Distance (km) Total CAPEX (million €)
D18 non-operational
100 516,134 260 134.19
G17 operational
46 458,398 110 50.42
G17 non-operational
180 624,163 110 68.66
If a dedicated pipeline is constructed from platform D18a directly to shore, a compression station
needs to be installed. Following the methodology of André et al. (2014), a hydrogen compression
station would cost about €2,800/kW, given the required pressure (in 25 bar – out 100 bar). In the case
of platform G17d, and in the case of platform D18a when admixing is applied at platform D15, only
small adjustment to the existing gas compressor is needed, by applying a smaller filter system.
5.2. Other relevant externalities: CO2 emissions reductions and subsidy savings An externality which is related to the offshore wind power conversion can be that oil and gas
production is longer commercially feasible, because the fiscal regime of bringing the hydrogen to shore
via admixing it to the ongoing natural gas flows creates some financial leeway for the operators.
Another positive financial aspect of connecting gas extraction platforms to the e-grid, is that the
electrification of the compression generators will reduce compression costs, not only because power
is cheaper than the diesel used before, but also because grid access costs can be shared between a
number of operators. This also may extend the lifetime of feasible offshore gas production, and
ultimately indirectly benefit the tax payer.
A specific concern for the offshore operators is related to the Dutch regulation on the limitation of
emissions of certain pollutants into the air from medium combustion plants (‘activiteitenbesluit
milieubeheer’ 2010). Based on a recent (2015) Directive of the EU on this issue, this ‘activiteitenbesluit
milieubeheer’ will be amended (effective 19 December 2017) such that it puts limits to the NOx and
SO2 allowed emission levels of gas and diesel turbines, including those related to offshore compression
capacities (the exemption in the Directive for offshore conditions that can be implemented will not be
used for the Netherlands case, based on the recent decision-making by the Netherlands
government).26 The only relevant exception to these rules applies for turbines with less than 500
operating hours per annum, or with very low capacities; the latter is, however, not relevant in actual
practice under offshore conditions.
Based on this Directive, by January 1st 2019 the new norms apply, which poses a serious challenge for
almost all compressor capacities on the Dutch continental shelf. A solution can be to change to
electrification of the compressor capacities, or to drive the compressors with the help of hydrogen. If
gas-based compressor capacity can no longer be used due to the new rules, it may still be helpful as
backup capacity as long as its operating hours remain less than 500 per annum. Another solution can
be that conditions on different platforms of a specific operator cancel each other out such that on
average the operator complies. This ‘portfolio balancing approach’ was accepted by the Netherlands
government as a compromise of its non-acceptance of the offshore exemption.
25 Based on an exchange rate of USD 1 = EUR 0.91. 26 For more details, see Staatscourant Nr. 27480 (14 June 2016), especially Article 5.43.

35
As far as the relevant subsidies is concerned, the SDE+ regime may require to transfer less subsidies to
the operators insofar as they would succeed in improving their business case in producing offshore
wind power. The various 2016 offshore wind park tender results did show some promising evidence of
a substantial reduction of offshore wind power production costs. A legal complexity of the current
SDE+ subsidy regime is that it requires that the renewable energy is actually introduced onto the e-
grid. Conversion into gases therefore means that the SDE+ subsidy can probably not be granted. This
seems to be a legal anomaly, and in the calculations it was assumed that this will be repaired in the
future.
A final factor that may play a role in the operator’s business case, but that has been disregarded in the
assessment, is the value of contributing to e-grid balancing by absorbing surplus power. The imbalance
market for power offers such value, but this component has been disregarded in the study because of
the complexity to exactly monetise this factor. Obviously, including this value would improve on the
whole the business case of power-to-gas conversion.
Integrated analysis of offshore renewable energy production,
conversion, transport, and storage
6.1. The main cases considered As was argued in chapter 5, externalities linked to offshore power-to-gas can be very significant indeed,
especially if somehow one can save on offshore e-grid investment. Therefore in the following we will
distinguish between two cases:
1. The windfarm is connected to shore and with the platform via an e-grid; the platform is
connected to shore via an existing gas grid. In short: the ‘E+G case’.
2. Like case 1, but now the windfarm is only connected with the platform via an e-grid and
substation, because all power is delivered to the platform for power-to-gas conversion. In
short: the ‘G-only case’.
Both cases are subsequently assessed with the help of the NPV model to determine their business case
with or without taking into account the transport costs and externalities.
The E+G case If the wind farm power producer does have the option to either deliver the power to shore against the
prevailing wholesale price, or deliver it to the platform for power-to-gas conversion, he/she will
obviously only opt for the latter if prices received for power surpass wholesale market levels (assuming
a continuation of SDE+ subsidies). The interesting issue is how this case relates to the situation of the
G-only case in which all power must be delivered to the platform. In the latter case, as was argued in
section 2.6, the optimal electrolyser/wind capacity ratio was 78.1%. But, given this capacity, how many
hours per year will the electrolyser be operational?
In answering this question, it was assumed that the electrolyser will not run on power that is coming
from other sources than the connected wind farm itself (e.g. from shore or from any other sources of
power supply). This simplifying assumption may underrate the optimal electrolyser operational use
and is therefore considered conservative. In addition, it is assumed that the ‘green hydrogen’ price
known from the dedicated destination markets’ data is completely passed through onto the wind farm
delivering the power from which the hydrogen is produced (this probably overstates the electrolyser
use, because some of the margin will stay with the other players, including the platform operator).
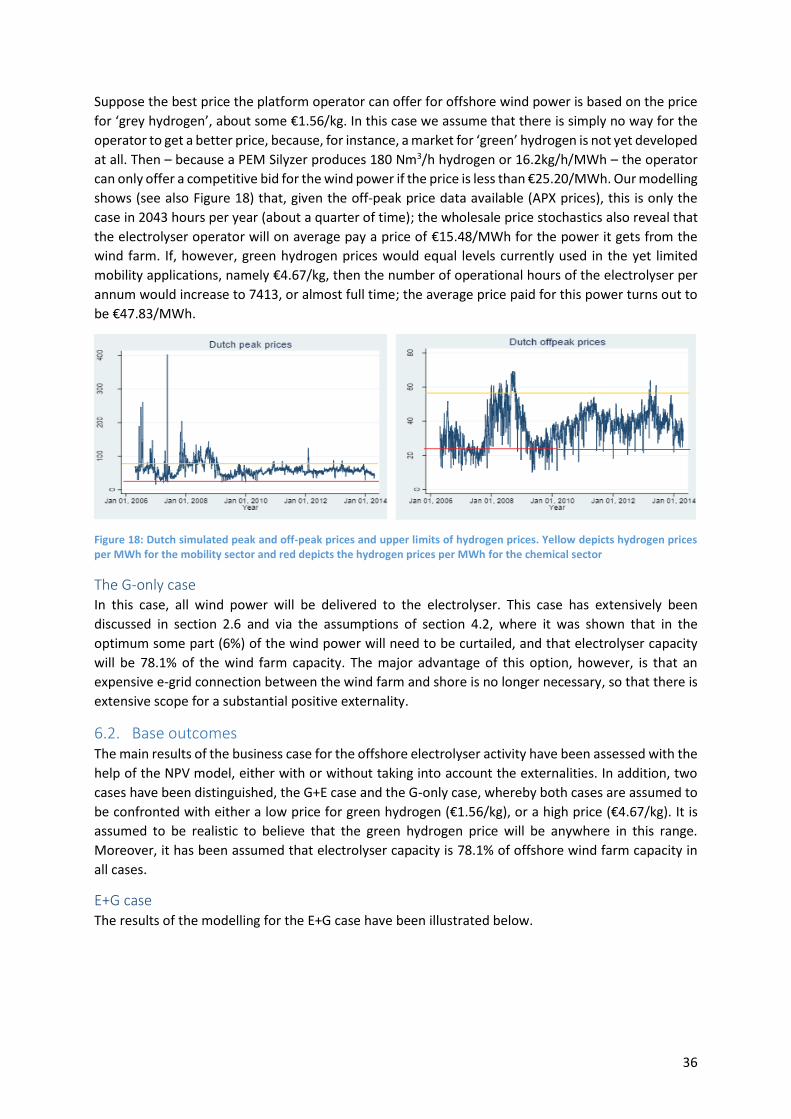
36
Suppose the best price the platform operator can offer for offshore wind power is based on the price
for ‘grey hydrogen’, about some €1.56/kg. In this case we assume that there is simply no way for the
operator to get a better price, because, for instance, a market for ‘green’ hydrogen is not yet developed
at all. Then – because a PEM Silyzer produces 180 Nm3/h hydrogen or 16.2kg/h/MWh – the operator
can only offer a competitive bid for the wind power if the price is less than €25.20/MWh. Our modelling
shows (see also Figure 18) that, given the off-peak price data available (APX prices), this is only the
case in 2043 hours per year (about a quarter of time); the wholesale price stochastics also reveal that
the electrolyser operator will on average pay a price of €15.48/MWh for the power it gets from the
wind farm. If, however, green hydrogen prices would equal levels currently used in the yet limited
mobility applications, namely €4.67/kg, then the number of operational hours of the electrolyser per
annum would increase to 7413, or almost full time; the average price paid for this power turns out to
be €47.83/MWh.
Figure 18: Dutch simulated peak and off-peak prices and upper limits of hydrogen prices. Yellow depicts hydrogen prices per MWh for the mobility sector and red depicts the hydrogen prices per MWh for the chemical sector
The G-only case In this case, all wind power will be delivered to the electrolyser. This case has extensively been
discussed in section 2.6 and via the assumptions of section 4.2, where it was shown that in the
optimum some part (6%) of the wind power will need to be curtailed, and that electrolyser capacity
will be 78.1% of the wind farm capacity. The major advantage of this option, however, is that an
expensive e-grid connection between the wind farm and shore is no longer necessary, so that there is
extensive scope for a substantial positive externality.
6.2. Base outcomes The main results of the business case for the offshore electrolyser activity have been assessed with the
help of the NPV model, either with or without taking into account the externalities. In addition, two
cases have been distinguished, the G+E case and the G-only case, whereby both cases are assumed to
be confronted with either a low price for green hydrogen (€1.56/kg), or a high price (€4.67/kg). It is
assumed to be realistic to believe that the green hydrogen price will be anywhere in this range.
Moreover, it has been assumed that electrolyser capacity is 78.1% of offshore wind farm capacity in
all cases.
E+G case The results of the modelling for the E+G case have been illustrated below.
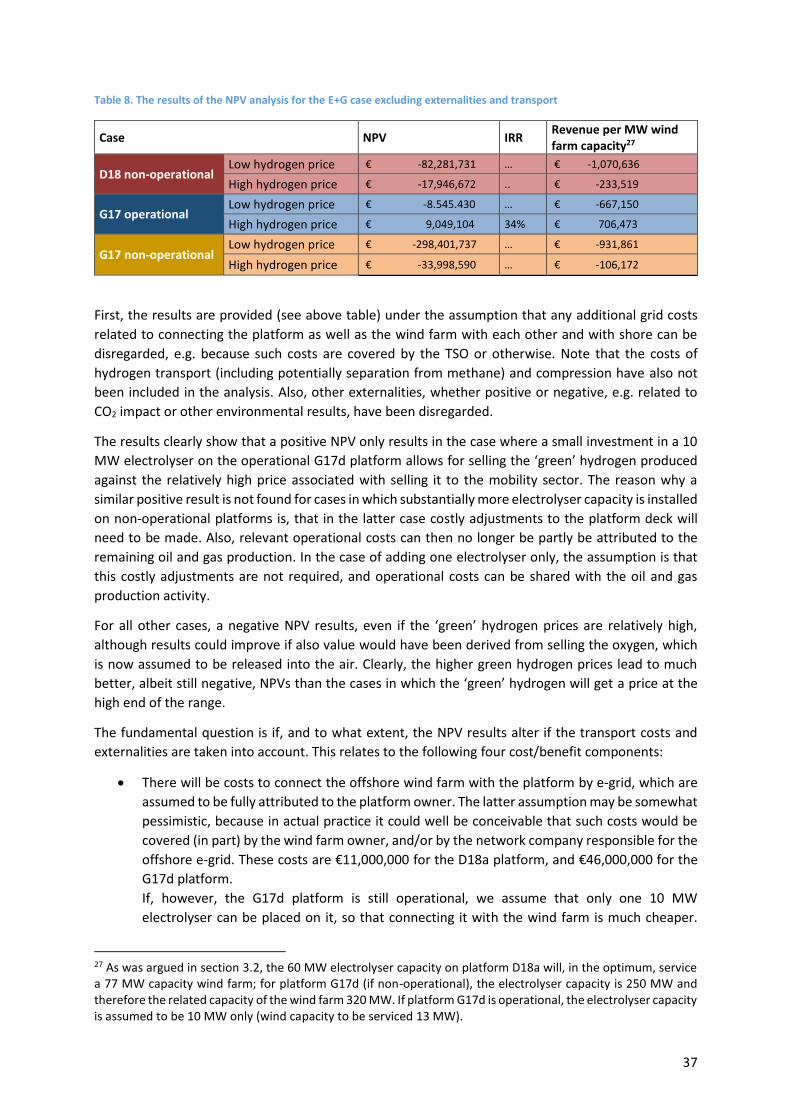
37
Table 8. The results of the NPV analysis for the E+G case excluding externalities and transport
Case NPV IRR Revenue per MW wind farm capacity27
D18 non-operational Low hydrogen price € -82,281,731 … € -1,070,636
High hydrogen price € -17,946,672 .. € -233,519
G17 operational Low hydrogen price € -8.545.430 … € -667,150
High hydrogen price € 9,049,104 34% € 706,473
G17 non-operational Low hydrogen price € -298,401,737 … € -931,861
High hydrogen price € -33,998,590 … € -106,172
First, the results are provided (see above table) under the assumption that any additional grid costs
related to connecting the platform as well as the wind farm with each other and with shore can be
disregarded, e.g. because such costs are covered by the TSO or otherwise. Note that the costs of
hydrogen transport (including potentially separation from methane) and compression have also not
been included in the analysis. Also, other externalities, whether positive or negative, e.g. related to
CO2 impact or other environmental results, have been disregarded.
The results clearly show that a positive NPV only results in the case where a small investment in a 10
MW electrolyser on the operational G17d platform allows for selling the ‘green’ hydrogen produced
against the relatively high price associated with selling it to the mobility sector. The reason why a
similar positive result is not found for cases in which substantially more electrolyser capacity is installed
on non-operational platforms is, that in the latter case costly adjustments to the platform deck will
need to be made. Also, relevant operational costs can then no longer be partly be attributed to the
remaining oil and gas production. In the case of adding one electrolyser only, the assumption is that
this costly adjustments are not required, and operational costs can be shared with the oil and gas
production activity.
For all other cases, a negative NPV results, even if the ‘green’ hydrogen prices are relatively high,
although results could improve if also value would have been derived from selling the oxygen, which
is now assumed to be released into the air. Clearly, the higher green hydrogen prices lead to much
better, albeit still negative, NPVs than the cases in which the ‘green’ hydrogen will get a price at the
high end of the range.
The fundamental question is if, and to what extent, the NPV results alter if the transport costs and
externalities are taken into account. This relates to the following four cost/benefit components:
There will be costs to connect the offshore wind farm with the platform by e-grid, which are
assumed to be fully attributed to the platform owner. The latter assumption may be somewhat
pessimistic, because in actual practice it could well be conceivable that such costs would be
covered (in part) by the wind farm owner, and/or by the network company responsible for the
offshore e-grid. These costs are €11,000,000 for the D18a platform, and €46,000,000 for the
G17d platform.
If, however, the G17d platform is still operational, we assume that only one 10 MW
electrolyser can be placed on it, so that connecting it with the wind farm is much cheaper.
27 As was argued in section 3.2, the 60 MW electrolyser capacity on platform D18a will, in the optimum, service a 77 MW capacity wind farm; for platform G17d (if non-operational), the electrolyser capacity is 250 MW and therefore the related capacity of the wind farm 320 MW. If platform G17d is operational, the electrolyser capacity is assumed to be 10 MW only (wind capacity to be serviced 13 MW).

38
Moreover, connection costs will in this case to a large extent have to be attributed to the
electrification of the gas extraction process needed for environmental reasons related to
platform NOX emissions (see also Section 2.3). So, only a small part of these cost are
attributable to the electrolysis process (in this study only €200,000 of the costs are attributed
to the electrolysis process).
There will be costs associated with transporting the ‘green’ hydrogen to shore. These costs
either exist of a new separate hydrogen pipeline, or, if admixing the hydrogen to the natural
gas flows via the existing grid is possible (and cheaper), of separating the hydrogen from the
natural gas once the flows are on shore. We assume that the cheapest of the two options will
be implemented. This means that for the D18a case, the hydrogen will be admixed and
separated later on (total costs €27,072,128). For the G17d case a separate hydrogen pipeline
turns out to be more economical (total costs €79.41 million). If the G17d platform is still
operational, obviously admixing is the optimal case given the small volumes (total costs
€4,500,665).
Substations are needed to transform the generated wind power to make it suitable for
hydrogen production. Investment costs for transformer stations are about €81/kW capacity. It
is assumed that the platform owner pays its share in the costs of this substation, which are
assumed to be proportional to the size of its electric capacity. The calculated costs are €6.8
million for the D18a platform, and €28.3 million for the G17d platform.
In the cases of non-operational platforms, there will be a ‘decommissioning bonus’, although
these have to be netted out with the additional OPEX for keeping the platform activities
running. The net positive effects of this are €3,635,075 for platform D18a, and €10,385,930 for
platform G17d.
Taking these transport costs and ‘externalities’28 into account, the results of the model including the
transport costs and externalities can be presented for the E+G case, as has been done in Table 9.
Table 9. The results of the NPV analysis for the E+G case including externalities and transport
Case NPV
D18 non-operational Low hydrogen price € -123,518,022
High hydrogen price € -59,182,962
G17 operational Low hydrogen price € -14,394,017
High hydrogen price € 3,200,516
G17 non-operational Low hydrogen price € -441,686,066
High hydrogen price € -177,282,920
The results show that when taking into account the transport costs and externalities, NPV values still
are negative for all E+G cases, except for G17 operational. The obvious explanation is that the
transport/grid costs obviously dominate this picture, because the net ‘decommissioning bonus’ is
relatively small compared to these transport/grid costs.
Regarding the E+G case for operational platforms the business case shows a positive effect as a
significant part of OPEX and CAPEX costs can be shared with oil and gas operations. An externality of
this option that has not been monetised is the impact of splitting OPEX cost between electrolyser
activities and gas production on the business case of the gas producer. As the gas producer can share
28 These factors are labelled ‘externalities’ because a priori it is not clear who will legally be linked to the positive or negative amounts. It is well possible, however, that they will be internalised by the platform owner.
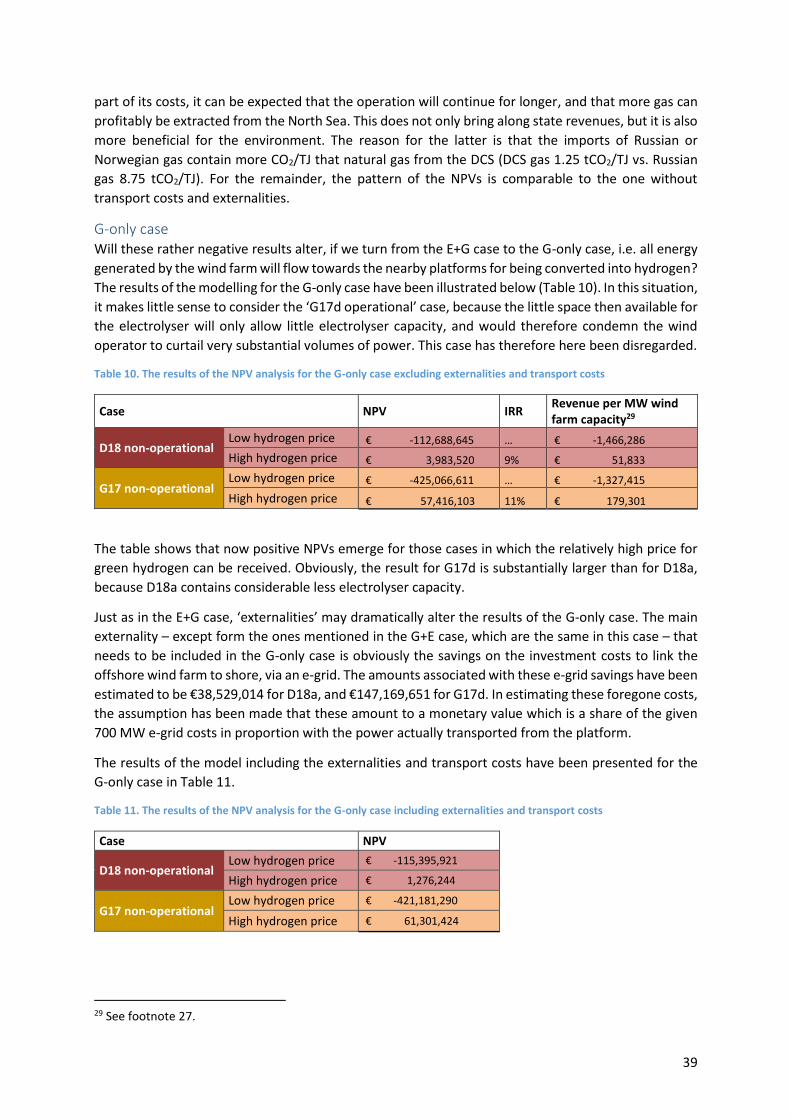
39
part of its costs, it can be expected that the operation will continue for longer, and that more gas can
profitably be extracted from the North Sea. This does not only bring along state revenues, but it is also
more beneficial for the environment. The reason for the latter is that the imports of Russian or
Norwegian gas contain more CO2/TJ that natural gas from the DCS (DCS gas 1.25 tCO2/TJ vs. Russian
gas 8.75 tCO2/TJ). For the remainder, the pattern of the NPVs is comparable to the one without
transport costs and externalities.
G-only case Will these rather negative results alter, if we turn from the E+G case to the G-only case, i.e. all energy
generated by the wind farm will flow towards the nearby platforms for being converted into hydrogen?
The results of the modelling for the G-only case have been illustrated below (Table 10). In this situation,
it makes little sense to consider the ‘G17d operational’ case, because the little space then available for
the electrolyser will only allow little electrolyser capacity, and would therefore condemn the wind
operator to curtail very substantial volumes of power. This case has therefore here been disregarded.
Table 10. The results of the NPV analysis for the G-only case excluding externalities and transport costs
Case NPV IRR Revenue per MW wind farm capacity29
D18 non-operational Low hydrogen price € -112,688,645 … € -1,466,286
High hydrogen price € 3,983,520 9% € 51,833
G17 non-operational Low hydrogen price € -425,066,611 … € -1,327,415
High hydrogen price € 57,416,103 11% € 179,301
The table shows that now positive NPVs emerge for those cases in which the relatively high price for
green hydrogen can be received. Obviously, the result for G17d is substantially larger than for D18a,
because D18a contains considerable less electrolyser capacity.
Just as in the E+G case, ‘externalities’ may dramatically alter the results of the G-only case. The main
externality – except form the ones mentioned in the G+E case, which are the same in this case – that
needs to be included in the G-only case is obviously the savings on the investment costs to link the
offshore wind farm to shore, via an e-grid. The amounts associated with these e-grid savings have been
estimated to be €38,529,014 for D18a, and €147,169,651 for G17d. In estimating these foregone costs,
the assumption has been made that these amount to a monetary value which is a share of the given
700 MW e-grid costs in proportion with the power actually transported from the platform.
The results of the model including the externalities and transport costs have been presented for the
G-only case in Table 11.
Table 11. The results of the NPV analysis for the G-only case including externalities and transport costs
Case NPV
D18 non-operational Low hydrogen price € -115,395,921
High hydrogen price € 1,276,244
G17 non-operational Low hydrogen price € -421,181,290
High hydrogen price € 61,301,424
29 See footnote 27.

40
The results reveal that even if the externalities are taken into account, there is no solid business case
for power-to-gas as long as there is no premium for ‘green’ as compared to ‘grey’ hydrogen. This
changes dramatically, however, if prices for green hydrogen would move up towards levels in the order
of €4.67/kg, levels assumed for the, albeit still small, green hydrogen deliveries to the mobility sector.
Then serious positive NPVs seem to be feasible.
6.3. Sensitivity analysis Given the above results, the question arises how future developments in environmental policy
variables, learning curve effects impacting CAPEX, macroeconomic effects on capital investments, and
changes in power prices profiles and levels may alter the business case of offshore power conversion
as described above. That is why, in the following, four additional assumptions have been introduced
that all separately, and in combination, may seriously impact the future business case of offshore
power-to-gas activity.
The first variable is related to the production costs of hydrogen in general. As was argued before, is
the current bulk ‘grey’ hydrogen price of €1.56 partly to be explained by the CO2 penalty linked to the
EU ETS allowance price. Since the beginning of the EU ETS scheme, this price has fluctuated roughly
between about €5 and €30, with a 2016 average level of about €6. Assuming that this penalty is
completely levelled off onto the hydrogen price, €0.06 of the current €1.56/kg of hydrogen is due to
this factor. If, however, the EU ETS allowance price would rise again to a level of €30 (or even to €50),
hydrogen prices would rise from €1.56/kg to €1.80/kg (or to €2.00/kg in the case of €50). For a
producer of ‘green’ hydrogen, this improves the business case, assuming that if ‘grey’ hydrogen prices
increase, those of ‘green’ hydrogen will follow automatically. Obviously, this applies equally for the
hydrogen sold against prices at the high end of the market.
In addition the sensitivity analysis relates to the ‘green’ premium, i.e. how much the market will be
prepared to pay extra for the ‘green’ hydrogen as compared to ‘grey’ hydrogen. So far, little
information exists on this premium, if only because a ‘green’ hydrogen market still is in its infancy. It
seems highly likely, however, that as a hydrogen market will develop, market segments will arise where
either only ‘green’ hydrogen will be accepted, or in any case a higher price will be paid for hydrogen
being ‘green’. Similar developments can be seen in various other energy markets, where ‘grey’ and
‘green’ products can be distinguished. In the sensitivity analysis (Figure 19), the assumption has been
made that this premium will amount to 30% of the hydrogen price, a figure which is roughly based on
subsidy practices in North-western Europe meant to develop ‘green’ energy product markets. The
‘green’ hydrogen price assumed in the high ‘green’ hydrogen price/‘EUA €30 & SDE+ 30%’ case is
therefore (€4.67 + €0.24)*1.3 ≈ €6.38; in the low ‘green’ hydrogen price, this figure is (€1.56 +
€0.24)*1.3 = €2.34.

41
Figure 19. Sensitivity analysis: Allowance prices and SDE+
The second variable is related to the power prices. During the last decade in North-western Europe
those prices have, on average, come down at a wholesale level, most likely due to the introduction of
the rather competitive renewable power sources, in combination with the worldwide trend towards
lower energy prices, the impact of more competition, and the influx of relatively cheap hydro and wind
power especially from Scandinavia. That is why in the sensitivity analysis the base scenario assumption
of using the Netherlands’ wholesale power prices has been altered by introducing both lower and
higher electricity prices. In the G-only cases, the assumed price level can be indicated precisely,
because all power will flow to the investor of the electrolyser (Figure 20). In the G+E cases, the power
price assumption is somewhat more complex, because only part of the power is channelled to the
electrolyser. That is why, in this case, a power price variation has been indicated as a percentage vis-
à-vis the baseline price level (Figure 21).

42
Figure 20. Sensitivity analysis: electricity price (G-only cases)
Figure 21. Sensitivity analysis: electricity prices (G+E cases)
The third variable is related to the learning curve of green technology. Various technologies related to
‘green’ energy, such as offshore and onshore power production with the help of wind energy, solar
panels, and various other devices, have shown to become considerably cheaper as mass production
becomes a market promise, and as learning progresses. Practice has shown that cutting the CAPEX
costs by half within a decade is no exception, once a technology gets off at substantial scale. That is
why the model has been run with an electrolyser capacity on the platforms, the CAPEX of which is half
of that of the base case, in other words €300,000/MW instead of €600,000/MW. Lower CAPEX has
various implications, such as less curtailment, lower power costs, another number of running hours,

43
etc. The sensitivity analysis (Figure 22), however, only includes the partial (direct) effect of changing
CAPEX cost levels. For the sake of staying at the conservative side, the current electrolyser CAPEX prices
(ranging from about €1.2 million to €900,000/MW) have been included as well.
Figure 22. Sensitivity analysis: CAPEX of the electrolyser
The final variable in the sensitivity analysis relates to the WACC (weighted average cost of capital). It
therefore assesses how variations in the long-term capital market interest rate or changes in the
debt/equity ratio affect the outcomes. Like in the case of the third variable, the sensitivity analysis
(Figure 23) does only take into account the partial (direct) effect of WACC changes, and therefore not
its potential impacts on curtailment, power prices, and running hours.
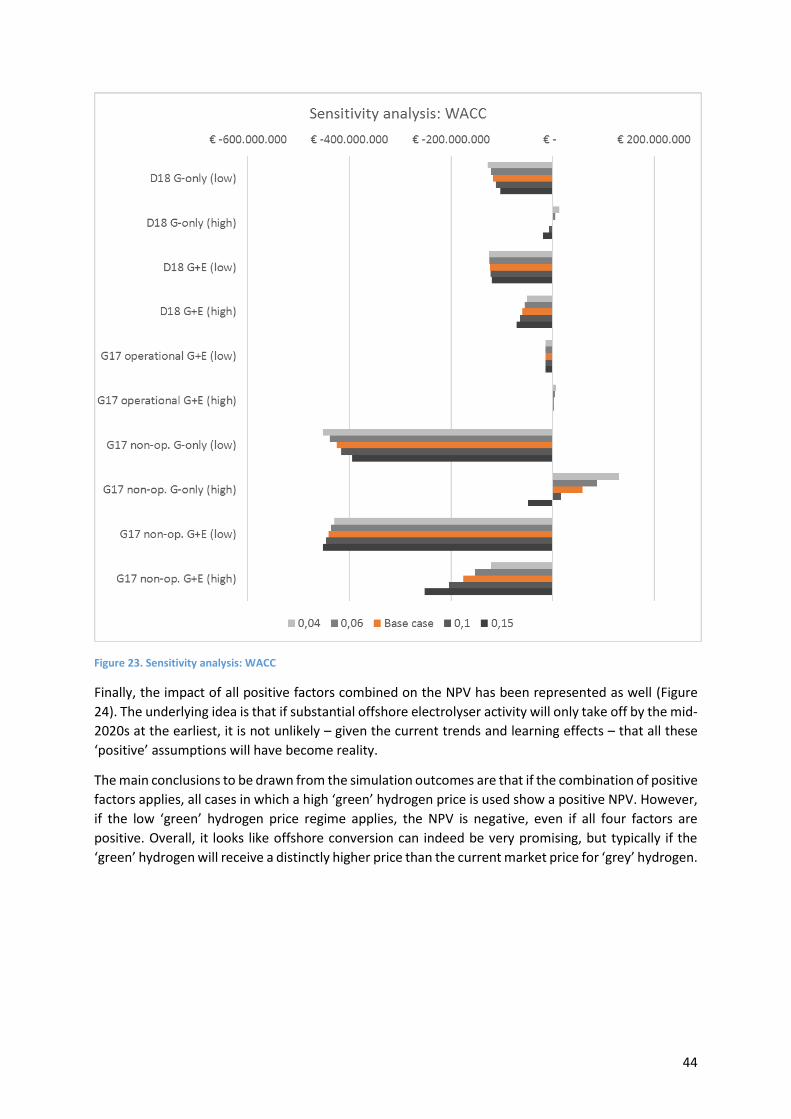
44
Figure 23. Sensitivity analysis: WACC
Finally, the impact of all positive factors combined on the NPV has been represented as well (Figure
24). The underlying idea is that if substantial offshore electrolyser activity will only take off by the mid-
2020s at the earliest, it is not unlikely – given the current trends and learning effects – that all these
‘positive’ assumptions will have become reality.
The main conclusions to be drawn from the simulation outcomes are that if the combination of positive
factors applies, all cases in which a high ‘green’ hydrogen price is used show a positive NPV. However,
if the low ‘green’ hydrogen price regime applies, the NPV is negative, even if all four factors are
positive. Overall, it looks like offshore conversion can indeed be very promising, but typically if the
‘green’ hydrogen will receive a distinctly higher price than the current market price for ‘grey’ hydrogen.
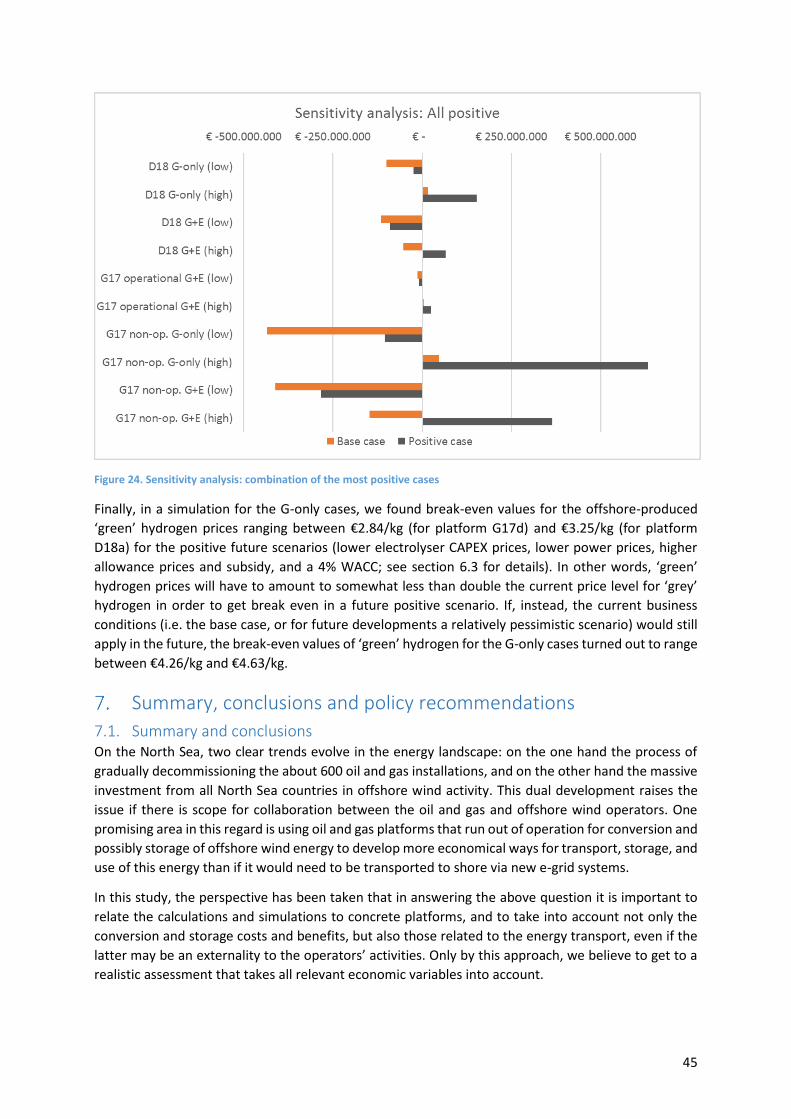
45
Figure 24. Sensitivity analysis: combination of the most positive cases
Finally, in a simulation for the G-only cases, we found break-even values for the offshore-produced
‘green’ hydrogen prices ranging between €2.84/kg (for platform G17d) and €3.25/kg (for platform
D18a) for the positive future scenarios (lower electrolyser CAPEX prices, lower power prices, higher
allowance prices and subsidy, and a 4% WACC; see section 6.3 for details). In other words, ‘green’
hydrogen prices will have to amount to somewhat less than double the current price level for ‘grey’
hydrogen in order to get break even in a future positive scenario. If, instead, the current business
conditions (i.e. the base case, or for future developments a relatively pessimistic scenario) would still
apply in the future, the break-even values of ‘green’ hydrogen for the G-only cases turned out to range
between €4.26/kg and €4.63/kg.
Summary, conclusions and policy recommendations
7.1. Summary and conclusions On the North Sea, two clear trends evolve in the energy landscape: on the one hand the process of
gradually decommissioning the about 600 oil and gas installations, and on the other hand the massive
investment from all North Sea countries in offshore wind activity. This dual development raises the
issue if there is scope for collaboration between the oil and gas and offshore wind operators. One
promising area in this regard is using oil and gas platforms that run out of operation for conversion and
possibly storage of offshore wind energy to develop more economical ways for transport, storage, and
use of this energy than if it would need to be transported to shore via new e-grid systems.
In this study, the perspective has been taken that in answering the above question it is important to
relate the calculations and simulations to concrete platforms, and to take into account not only the
conversion and storage costs and benefits, but also those related to the energy transport, even if the
latter may be an externality to the operators’ activities. Only by this approach, we believe to get to a
realistic assessment that takes all relevant economic variables into account.

46
Based on this philosophy, two platforms have been selected as a focus of the study (G17d relatively
near shore, and D18a relatively far from shore), and for each of them two cases have been
distinguished: one in which all wind energy is transported to the platform for conversion, so that a new
e-grid connection between the wind farm and shore is no longer necessary (G-only case); and one in
which the e-grid connection between the wind farm and shore still exists, so that operators have the
choice to bring the wind energy to shore either by way of electrons, or, after conversion, by way of
molecules (E+G case). As a special case that was distinguished, the economics have been analysed of
conversion of wind energy on a still operational platform (G17d), by putting just one 10 MW
electrolyser and related equipment on it for energy conversion.
One of the questions that was encountered during the study was – for the G-only case – how much
electrolyser capacity would optimally be used to service a wind farm of a certain capacity. Given the
wind profiles, it is clear that if one would not accept any curtailment, conversion capacity would need
to be almost completely equal to the wind farm capacity. This, however, would require a massive
financial investment, given the fact that the electrolyser CAPEX, in conjunction with the CAPEX of
related equipment, is relatively high. At the same time, in this case, would the number of operating
hours of the electrolysers on average be rather low, simply because wind farms rarely produce at their
full capacity. If, on the other hand, electrolyser capacity would be rather low compared to the capacity
of the wind farm, in the absence of an e-grid connection, substantial amount of offshore wind energy
would need to be curtailed, simply by lack of electrolyser capacity for conversion. Therefore, an
economic model was developed to assess what the economic optimal ratio was of electrolyser capacity
compared to the underlying wind farm capacity. In our example, this ratio turned out to be about 78%.
Because wind profiles will slightly improve as offshore wind technology proceeds, and also if the
capacity per wind turbine increases, in future circumstances this optimal ratio may somewhat increase,
so that the ballpark figure of some 80% may be a useful starting point, for the time being.
Another question that popped up during the study was how much electrolyser capacity could be
positioned on a platform, given weight and surface area restrictions. Obviously, the answer to this
question depends on electrolyser technology including compactness, safety constructions, etc. Also,
the space requirement of related equipment will need to be taken into account. Taking all these factors
into account, it turned out that a complete production platform (G17d-A and G17d-AP combined) can
host up to about 250 MW electrolyser capacity, at least if the modern generation of electrolysers
currently under development would be available. The much smaller satellite platform D18a could host
up to about 60 MW of electrolyser capacity.
A final question that we encountered during the study was how the optimal conversion of the green
electrons from the wind farm into green molecules would look like. One simple process is electrolysis,
generating ‘green’ hydrogen, but also additional conversion steps could be feasible, such as
methanation (turning ‘green’ hydrogen into ‘green’ methane), power-to-gas-to-power (turning the
stored ‘green’ hydrogen into power again if conditions would be beneficial to do so), or producing
‘green’ ammonia or derived products (combining the ‘green’ hydrogen with nitrogen, so that a product
is made that could be easily transported by ships and would be easily marketable). We did not
extensively discuss the various options, because this was considered to be beyond the scope of this
study.
With the help of a subsequent spreadsheet model developed to assess the economics of offshore
conversion and related transport, it has been assessed what the net present value (NPV) would be
under a range of assumptions with respect to input and output variables, OPEX and CAPEX of technical
devices, and grid and gas treatment costs. Much of the data has been provided by the operators under
47
the recognition that much of it is sensitive to technological progress and overall economic conditions.
That is why all the assumptions have been made explicit in this study.
The spreadsheet model was then used to develop the base case, i.e. the NPV for the G-only and E+G
cases for the two (non-operational) platforms, in addition to the case in which platform G17d would
be still operational. In terms of transport modes through the gas grid, a distinction was made between
the case in which the hydrogen would be admixed to the natural gas flow and separated from it once
on shore, and the case in which a separate dedicated grid for hydrogen transport was the more
economical alternative. Finally, in the base case a distinction was made between the prices for
hydrogen in distinct market segments: on the one hand the average hydrogen market, which is typical
for the chemical industry, where hydrogen is sold as a bulk product against relatively low prices
(currently some €1.50-1.60/kg); and on the other hand a niche market (e.g. in mobility), where much
smaller volumes of hydrogen are traded against much higher prices (currently some €4.60-4.70/kg).
The results of the base case were subsequently compared – in a sensitivity analysis – with a number of
altered assumptions, the most important of which being: significantly lower electrolyser CAPEX level
(€300,000/MW instead of €600,000/MW as in the base case), and a clear ‘green premium’
distinguishing the price for ‘grey’ hydrogen from the price for ‘green’ hydrogen (30% higher prices than
for ‘grey’ hydrogen). These two variables turned out to be key determinants of the conversion NPV in
an earlier study (Jepma, 2015). In addition, some other variables have also been introduced into the
sensitivity analysis (lower power prices and higher EU ETS allowance prices).
The results from the base case showed that even when taking into account the externalities, NPV
values are negative for all E+G cases. The obvious explanation is that the transport/grid costs obviously
dominate this picture, because the net ‘decommissioning bonus’ is relatively small compared to the
transport/grid costs. For the G-only case, NPV values are also negative if prices for ‘green’ hydrogen
would be similar to those currently applicable to ‘grey’ hydrogen at the bulk level such as in the
chemical sector. However, if prices for ‘green’ hydrogen would move up towards niche market levels
in the order of €4.67/kg, as is currently the case in the, albeit still small, ‘green’ hydrogen deliveries to
the mobility sector, then serious positive NPVs seem to be feasible.
The subsequent sensitivity analysis revealed the following. If a combination of four positive factors
applies (higher EU ETS allowance price, 30% ‘green premium’ for hydrogen, lower CAPEX for
electrolysers, lower power prices, and modest WACC requirements), all cases assuming a high ‘green’
hydrogen price do show a positive, and sometimes substantially positive, NPV. Overall, it looks like
offshore conversion can indeed be very promising, but typically if the combination of a platform-for-
conversion with a wind farm can fully replace the e-grid connection to shore, and if the ‘green’
hydrogen will receive a distinctly higher price than the market price for ‘grey’ hydrogen.
In a simulation for the G-only cases, we found break-even values for the offshore-produced ‘green’
hydrogen prices ranging between €2.84/kg (for platform G17d) and €3.25/kg (for platform D18a) for
the positive future scenarios (lower electrolyser CAPEX prices, lower power prices, higher allowance
prices and subsidy, and a 4% WACC; see section 6.3 for details). In other words, ‘green’ hydrogen prices
will have to amount to somewhat less than double the current price level for ‘grey’ hydrogen in order
to get break even in a future positive scenario. If, instead, the current business conditions (i.e. the base
case, or for future developments a relatively pessimistic scenario) would still apply in the future, the
break-even values of ‘green’ hydrogen for the G-only cases turned out to range between €4.26/kg and
€4.63/kg.
48
7.2. Some perspective on the scope of offshore energy conversion A fundamental question that emerges from the above analysis obviously is how realistic the
expectation would be that substantial and large-scale offshore power-to-gas activity will come off the
ground. A key finding of the analysis is that, obviously, various cost elements, energy prices,
externalities, and transportation costs matter a lot, but that in the end a sufficiently high market price
and sales perspectives for the ‘green’ hydrogen will need to emerge in order for creating a business
case for offshore conversion. In this study, we have assumed that the current flow of ‘grey’ hydrogen
– still completely dominating the hydrogen market – is not the appropriate base for comparison,
because future hydrogen markets may not accept hydrogen generated with a considerable carbon
footprint, even if such footprint has been ‘taxed’ according to the prevailing policy regime.
Based on this assumption, ‘green’ hydrogen generated through offshore electrolysis will obviously still
compete with ‘green’ hydrogen generated otherwise, e.g. hydrogen generated from ‘green’ methane
with the help of traditional technologies, or ‘green’ hydrogen generated via onshore electrolysis. The
remaining question would then be if hydrogen generated from ‘green’ methane can compete with the
hydrogen produced offshore, and if onshore conversion could have a better business case than
offshore conversion. Such systematic comparison was beyond the scope of this study. A priori,
however, the idea is that offshore conversion via electrolysis has a good chance of being among the
most competitive options because: production costs of ‘green’ gas will be substantially higher than
those of natural gas; and because offshore conversion will have a cost advantage beyond onshore
conversion due to the substantial potential savings on e-grid investment; due to it generating a license
to continue oil and gas production and postponing decommissioning; and due to less public acceptance
concerns potentially related to the large-scale introduction of hydrogen as an energy carrier.
In order to get some guidance as to how large-scale power-to-gas application at the North Sea may
work out on the longer term, a number of ballpark figures may be illustrative. Assuming that on the
long-term, some 40 GW offshore wind capacity will be installed on the North Sea, by the various North
Sea countries, and assuming that the average size of a wind farm is some 500-700 MW, then some 60
to 80 North Sea wind farms will emerge.
Assuming, for the sake of convenience, that optimal electrolyser capacity per wind farm will be some
80% of wind farm capacity, the electrolyser capacity per farm will then be some 400-550 MW (which,
on average, may be covered by two platforms filled with electrolysers). Hydrogen production would
then (assuming a 700 MW wind farm and 550 MW electrolyser capacity) be some 280,000 kg per day
on average. This corresponds to about 3.4 TWh per year. The latter figure represents about 11% of the
about 30 TWh per year energy based on the current hydrogen production (via steam conversion from
natural gas) in the Netherlands.
In other words, if one average wind farm will be used for the production of green hydrogen, this
production could be sufficient to replace about 11% of the Netherlands’ current ‘non-green’ hydrogen
production. Complete replacement therefore would require all the energy input of about 9 average-
sized wind farms.
7.3. Policy recommendations A legal complexity of the current SDE+ subsidy regime is that it requires that renewable energy is
actually introduced onto the e-grid. Conversion of wind energy into gases therefore means that the
SDE+ subsidy can formally not be granted. This seems to be a legal anomaly that could stand in the
way of an otherwise desirable offshore power-to-gas technology development. It is therefore
important that this SDE+ condition is reconsidered.
49
More generally, it seems worthwhile to assess the option of offshore conversion of wind energy from
an overall economic setting, i.e. by taking into account not only the costs related to the conversion and
possibly storage itself, but also costs and benefits related to transporting the energy from the offshore
locations to shore in conjunction with the possible ‘decommissioning bonus’ and environmental
impacts on the platforms. Only by taking this broader economic perspective is it possible to draw the
right policy conclusions with regard to the potential of offshore conversion versus the alternative of
onshore conversion, or not turning the green electrons generated offshore into green molecules.
Because a broader economic assessment of offshore conversion does provide substantial scope for
positive NPVs, but requires collaboration between oil and gas operators, wind farm operators, offshore
grid operators, and most likely the government and other stakeholders, the potential of this option
can only be developed if these various parties line up for the development of a joint economic case.
This may, in any case, require that some of the externalities will need to be internalised, or at least
included in the business case assessment, because otherwise the development of this offshore
technology may be locked-in by lack of a business case, given the risks.
Almost all hydrogen produced worldwide – over 140 million tonnes annually, primarily for the chemical
industry – is ‘grey’ hydrogen, and therefore carries a significant carbon footprint, because 1 tonne of
hydrogen produced causes emissions of about 10 tonnes of CO2. To illustrate, if worldwide all hydrogen
would only be produced without any carbon footprint, so would be ‘green’ hydrogen, the ‘Paris gap’,
i.e. the degree to which the Paris pledges are unable to get to the 2 degrees centigrade target, would
be filled by about 20%. It therefore seems important from a global climate perspective that policy-
makers start initiatives to develop ‘green’ instead of ‘grey’ hydrogen production. The North Sea could
be a region to start such a transition, the ‘green’ hydrogen production of which then subsequently
could be used for greening the chemical industry, greening fertiliser use, and greening mobility to the
extent that it would use hydrogen. It is therefore important that policy makers become increasingly
aware of the very substantial adverse carbon footprint of worldwide hydrogen production. This could
imply policies and measures on the longer term, that, if sufficient volumes of ‘green’ hydrogen would
be available, would rule out the production of ‘grey’ hydrogen altogether.
A ‘green hydrogen economy’ would be an important component of the energy transition, in which the
prime focus would no longer be on just greening the energy electrons while almost forgetting to green
the energy molecules. The development of a ‘green hydrogen economy’, however, is likely to suffer
from the ‘chicken-egg syndrome’, i.e. there is no clear business case for producing ‘green’ hydrogen as
long as there is no clear market for it, and ‘green’ hydrogen applications will not be developed as long
as there is insufficient ‘green’ hydrogen available on the market. To prevent this deadlock, it is
extremely important that policy-makers take the policies and measures that will enable a clear price
differentiation between ‘grey’ and ‘green’ hydrogen. This seems to be the best guarantee that the
conversion technology based on electrolysis and all related technology will get off the ground, and
learning effects achieved. It may also imply that serious measures are taken to line up all the various
stakeholders of the overall ‘green’ hydrogen value chain, ranging from the producers of ‘green’
hydrogen and of the underlying technologies to the manufacturers, maintenance organisations, and
users of appliances using the ‘green’ hydrogen, and related NGOs.
The positive result from this study is that if all economic aspects are included in the analysis, offshore
power-to-gas generating ‘green’ hydrogen may – under positive future conditions – generate a break-
even business case, if ‘green’ hydrogen prices develop towards levels in the order of €2.84-3.25/kg.
The North Sea Area is now developing so rapidly into a massive offshore wind production region, that
it seems to be a perfect place for giving some decisive terms to the energy transition by enabling

50
offshore wind operators to convert and store their energy such that on the longer term wind farm
investment gets the highest internal rates of return, also if the current subsidy regimes subside. The
range of oil and gas platforms and the related gas grid connecting them to shore represent a substantial
capital value, that could be used in the future for wind energy conversion and storage, and therewith
get a useful second life. In addition, the North Sea area could provide the perfect place where TSOs in
the gas sector and TSOs in the power sector from various North Sea countries get together to optimise
the composition, scaling, and spatial organisation of the energy grids, that will need to be installed to
channel the energy produced to the shore and to the final destination in the technically and
economically optimal way.

51
References
Agator, J., Chéron, J. & Ngô, C., 2008. Hydrogène , énergie de demain?, sl: Omniscience.
Altfeld, K. & Pinchbeck, D., 2013. Admissible hydrogen concentrations in natural gas systems, sl: DIV
Deutscher Industrieverlag GmbH.
André, J., Auray, S., Memmah, M.-M. & Simonet, A., 2014. Time development of new hydrogen
transmission pipeline network for France. Journal of Hydrogen Energy, 39(20), pp. 10323-10337.
DNG GL AS, 2015. Offshore Production of Renewable Hydrogen in Japan, Høvik: DNV GL AS.
DNV GL, 2016. Subsea powr cables in shallow water (DNVGL-RP-0360), sl: DNV GL.
Dodds, P. & McDowall, W., 2012. A review of hydrogen delivery technologies for energy system
models, London: UCL Energy Institute.
EBN, 2016. Focus on Dutch Oil & Gas 2016, Utrecht: EBN.
European Commission, 2016. Quarterly Report on European Electricity Markets - volume 9, Brussels:
European Commission - DG Energy Market Observatory for Energy.
Grond, L., Schulze, P. & Holstein, S., 2013. Systems analyses power to gas: deliverable 1: technology
review. Groningen, DNV KEMA energy & sustainability.
Gupta, R., Basile, A. & Veziroglu, T., 2015. Compendium of hydrogen energy. Vol. 2, Hydrogen
storage, distribution and infrastructure, Burlington: Woodhead Publishing in energy; no. 84.
Hy2Seps-2, 2015. Final Report Summary - HY2SEPS-2 (Hybrid Membrane - Pressure Swing Adsorption
(PSA) Hydrogen Purification Systems), sl: Hy2Seps-2 project.
Jansen, J., 2015. Kansen voor Power-to-Gas - concept eindrapport, Apeldoorn: Sparkling Projects.
Jepma, C., 2015. Smart sustainable combinations in the North Sea Area (NSA): Make the energy
transition work efficiently and effectively, Groningen: Energy Delta Institute.
Kluiters, S., 2004. Status review on membrane systems for hydrogen separation, Petten: ECN.
Lehner, M., Tichler, R., Steinmüller, H. & Koppe, M., 2014. Power-to-Gas: Technology and Business
Models. Heidelberg: Springer.
Mivechian, A. & Pakizeh, M., 2013. Hydrogen recovery from Tehran refinery off-gas using pressure
swing adsorption, gas absorption and membrane separation technologies: Simulation and economic
evaluation. Korean Journal of Chemical Engineering, 30(4), pp. 937-948.
Nieuwenhout, F. & Brand, A., 2010. The Impact of Wind Power on Day-ahead Electricity Prices in the
Netherlands, Petten: ECN.
Noordgastransport, 2013. Infrastructure NGT map. [Online]
Available at: http://www.noordgastransport.nl/over-ons
[Geopend 20 September 2016].
Schepers, J., 2014. Personal communication about wind losses and Cp factor with Dr. Gerard Schepers
[Interview] (December 2014).

52
Siemens, 2013. Wind Turbine SWT-6.0-154 Technical specification. [Online]
Available at: http://www.energy.siemens.com/hq/en/renewable-energy/wind-power/platforms/d7-
platform/wind-turbine-swt-6-0-154.htm#content=Technical%20specification
[Geopend 14 August 2015].
TNO, 2016. Nieuwe vorm van duurzame inzet van platforms op zee. [Online]
Available at: https://www.tno.nl/nl/over-tno/nieuws/2016/3/nieuwe-vorm-van-duurzame-inzet-van-
platforms-op-zee/
[Geopend 20 September 2016].
Uehara, I., 2008. Separation and purification of hydrogen. Energy carriers and conversion systems
with emphasis on hydrogen, Volume 1, p. 26.
Veijer, J., 2014. The value of electric storage including real options: The case of Eemsdelta, Groningen:
University of Groningen.
Verhagen, M., 2012. Kamerbrief over het langetermijnbeleid over de gassamenstelling. [Online]
Available at: https://www.rijksoverheid.nl/documenten/kamerstukken/2012/03/13/kamerbrief-
over-het-langetermijnbeleid-over-de-gassamenstelling
[Geopend 21 September 2016].
Wei He, et al., 2010. The Potential of Integrating Wind Power with Offshore Oil and Gas Platforms.
Wind Engineering, 34(2), pp. 125-137.
Wei He, et al., 2013. Case Study of Integrating an Offshore Wind Farm with Offshore Oil and Gas
Platforms and with an Onshore Electrical Grid. Journal of Renewable Energy.
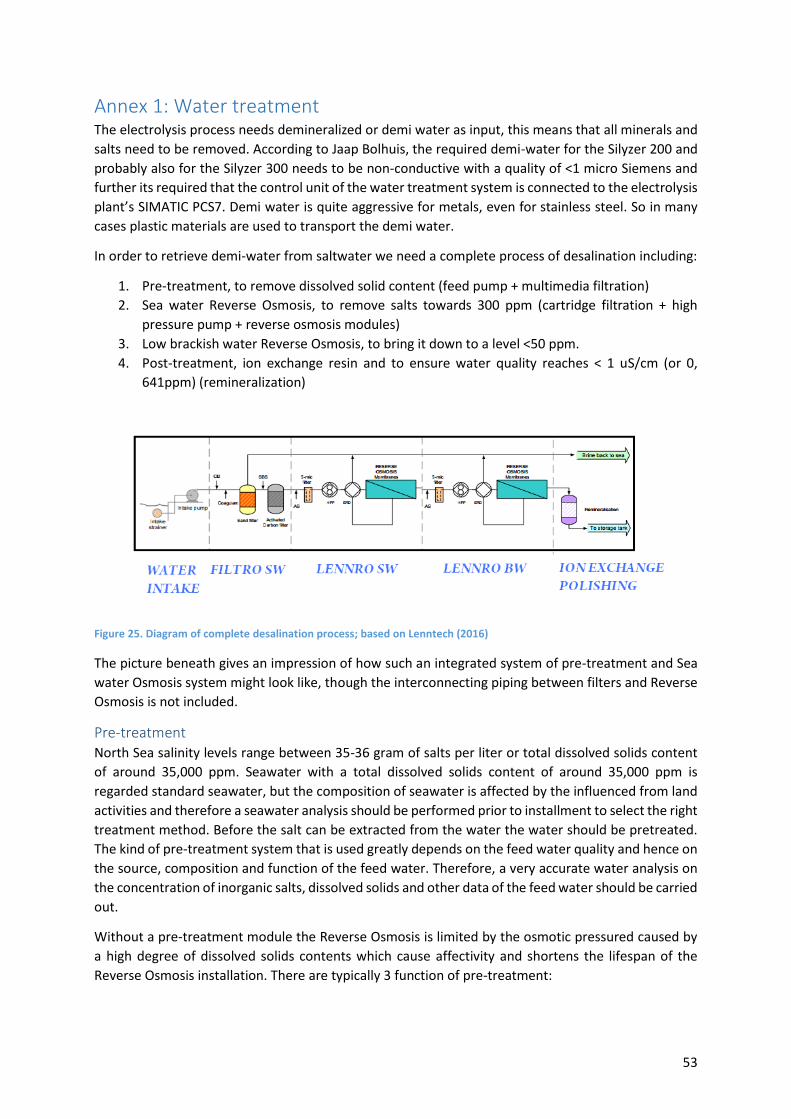
53
Annex 1: Water treatment The electrolysis process needs demineralized or demi water as input, this means that all minerals and
salts need to be removed. According to Jaap Bolhuis, the required demi-water for the Silyzer 200 and
probably also for the Silyzer 300 needs to be non-conductive with a quality of <1 micro Siemens and
further its required that the control unit of the water treatment system is connected to the electrolysis
plant’s SIMATIC PCS7. Demi water is quite aggressive for metals, even for stainless steel. So in many
cases plastic materials are used to transport the demi water.
In order to retrieve demi-water from saltwater we need a complete process of desalination including:
1. Pre-treatment, to remove dissolved solid content (feed pump + multimedia filtration)
2. Sea water Reverse Osmosis, to remove salts towards 300 ppm (cartridge filtration + high
pressure pump + reverse osmosis modules)
3. Low brackish water Reverse Osmosis, to bring it down to a level <50 ppm.
4. Post-treatment, ion exchange resin and to ensure water quality reaches < 1 uS/cm (or 0,
641ppm) (remineralization)
Figure 25. Diagram of complete desalination process; based on Lenntech (2016)
The picture beneath gives an impression of how such an integrated system of pre-treatment and Sea
water Osmosis system might look like, though the interconnecting piping between filters and Reverse
Osmosis is not included.
Pre-treatment North Sea salinity levels range between 35-36 gram of salts per liter or total dissolved solids content
of around 35,000 ppm. Seawater with a total dissolved solids content of around 35,000 ppm is
regarded standard seawater, but the composition of seawater is affected by the influenced from land
activities and therefore a seawater analysis should be performed prior to installment to select the right
treatment method. Before the salt can be extracted from the water the water should be pretreated.
The kind of pre-treatment system that is used greatly depends on the feed water quality and hence on
the source, composition and function of the feed water. Therefore, a very accurate water analysis on
the concentration of inorganic salts, dissolved solids and other data of the feed water should be carried
out.
Without a pre-treatment module the Reverse Osmosis is limited by the osmotic pressured caused by
a high degree of dissolved solids contents which cause affectivity and shortens the lifespan of the
Reverse Osmosis installation. There are typically 3 function of pre-treatment:
54
Scaling prevention and control: Pre-treatment methods help to prevent the scaling or
accumulation of insoluble salts in the Reverse Osmosis Membrane, such as calcium carbonate
(CaCO3) and calcium sulphate (CaSO4). The accumulation of insoluble salts is positively related
to the recovery rate of the RO installation, hence an increase in the salt recovery ratio also
increase the scaling of insoluble salts. Therefore, anti-scalents should be added to the feed
water to prevent the precipitation of insoluble salts. However if the use of anti-scalents is
limited RO membrane elements need to replaced more often (each one to two years) and have
a higher quantity of energy intake.
Prevention of fouling by colloids: Pre-treatment methods help to prevent colloidal pollution
which affect the RO process by diminishing its productivity levels. The sources of feed water
pollution varies from bacteria, clay, and iron corrosion products, however, chemical products
that are used during pre-treatment may also cause fouling of membranes. Fouling can be
detected by MFI (Modified Fouling Index) measurement and if present can be decreased by:
filtration (sand, candle ultra and micro), coagulation, and flocculation.
Biofouling prevention: The feed water contains microorganisms, which are colloidal pollutants,
because they are never larger than 1 to 3 nm. Biological growth within a membrane system
negatively influence the system by increasing the pressure at the supplier side of the
membrane, telescoping (shoving apart of the membrane) and membrane damage.
Sea water Reverse Osmosis Reverse Osmosis, commonly referred to as RO, is a process where you demineralize or deionize water
by pushing it under pressure through a semi-permeable Reverse Osmosis Membrane.30 A semi-
permeable membrane is a membrane that filters salt water by allowing the passage of water molecules
but not the majority of dissolved salts, organics, bacteria and pyrogens. Whereas Osmosis occurs
naturally, the reverse osmosis process requires energy that 'pushes' the water through the semi-
permeable membrane by applying pressure that is greater than the naturally occurring osmotic
pressure in order to desalinate water in the process, allowing pure water through while holding back
a majority of contaminants. Thus, a pump increase the high pressure pump the salty side of the Reverse
Osmosis Membrane and forces the water across the semi-permeable membrane, leaving almost all
(around 95% to 99%) of dissolved salts behind in the reject stream.
The pressure required for the desalination process depends on the salt concentration in the feed
water. The relationship is positive, implying that pressure increases with increments in salt
concentration. The technique of Lenntech usually has around 96% to 99% of the dissolved salts
removed from the feed water, leading to water quality of 300 ppm.
Although the reverse osmosis has high investment cost, it has relatively low operational costs in
comparison with its first best alternative chemical desalination. For instance, energy is recovered by
turbine or pressure exchanges.
For this study, we assumed the implementation of the LennRO-SW system with a production capacity
of 2000 L/H. The integrated system, depicted in the figure below, is equipped with: pre-treatment
installation including feed pump and multimedia filtration, Seawater Reverse Osmosis process
consisting of cartridge filtration, high pressure pump and the reverse osmosis modules and lastly a
post-treatment section for remineralization. The interconnection between systems is very important
and if the pre-treatment process is not geared to the installation it may cause a system overload, which
cause that system parts need cleaning much more often to restore productivity and salt retention.
30 http://puretecwater.com/what-is-reverse-osmosis.html

55
Cleaning costs, system performance and standstill time are very significant in that situation. The total
cost of the integrated system is estimated at €31,000 excl. VAT.
Figure 26. Visual description of pre-treatment and reverse osmosis process; based on Lenntech (2016). Data for information purposes only, and subject to modification depending on water quality
After the complete process of sea water reverse osmosis water quality reaches a level of 300 ppm. A
second desalination process is therefore needed to improve water quality further. According to
Lenntech, this can be done best by a second reverse osmosis plant. However, before water can be fed
into the second desalination process, the LennRO-BW, certain requirements with regard to water
quality should be reached.
The LennRO-BW system should be specially designed to conducted to be coupled with the LennRO-
SW. The cost of the LennRO-BW system are estimated at €14,000 excl. VAT.
Ion exchanger polishing To complete the desalination process the permeate flow from the LennRO-BW systems should pass by
the ion exchanger polishers. Ion exchange recovery are insoluble granular substances which have in
their molecular structure acidic or basic radicals that can exchange. The positive or negative ions fixed
on these radicals are placed by ions of the same sign in solution in the liquid in contact with them.
Lenntech engineers design and build tailor-made mixed bed polishing plants after Reverse Osmosis or
Ion Exchange demi plants to produce demi-water below 0,1 uS/cm. The costs of the ion exchanger
polishers are €3,000 excl. VAT.
Related Documents