University of Arkansas, Fayeeville ScholarWorks@UARK Marketing Undergraduate Honors eses Marketing 5-2012 On Shelf Availability: A Literature Review & Conceptual Framework Kristie Spielmaker University of Arkansas, Fayeeville Follow this and additional works at: hp://scholarworks.uark.edu/mktguht Part of the Marketing Commons , and the Operations and Supply Chain Management Commons is esis is brought to you for free and open access by the Marketing at ScholarWorks@UARK. It has been accepted for inclusion in Marketing Undergraduate Honors eses by an authorized administrator of ScholarWorks@UARK. For more information, please contact [email protected], [email protected]. Recommended Citation Spielmaker, Kristie, "On Shelf Availability: A Literature Review & Conceptual Framework" (2012). Marketing Undergraduate Honors eses. 10. hp://scholarworks.uark.edu/mktguht/10

Welcome message from author
This document is posted to help you gain knowledge. Please leave a comment to let me know what you think about it! Share it to your friends and learn new things together.
Transcript
University of Arkansas, FayettevilleScholarWorks@UARK
Marketing Undergraduate Honors Theses Marketing
5-2012
On Shelf Availability: A Literature Review &Conceptual FrameworkKristie SpielmakerUniversity of Arkansas, Fayetteville
Follow this and additional works at: http://scholarworks.uark.edu/mktguht
Part of the Marketing Commons, and the Operations and Supply Chain Management Commons
This Thesis is brought to you for free and open access by the Marketing at ScholarWorks@UARK. It has been accepted for inclusion in MarketingUndergraduate Honors Theses by an authorized administrator of ScholarWorks@UARK. For more information, please contact [email protected],[email protected].
Recommended CitationSpielmaker, Kristie, "On Shelf Availability: A Literature Review & Conceptual Framework" (2012). Marketing Undergraduate HonorsTheses. 10.http://scholarworks.uark.edu/mktguht/10
1
On-Shelf Availability in Retailing: A Literature Review and
Conceptual Model
By
Kristie Jean Spielmaker
Advisor: Dr. Christian Hofer
An Honors Thesis in partial fulfillment of the requirements for the degree
Bachelor of Science in International Business in Transportation and Logistics.
Sam M. Walton College of Business
University of Arkansas
Fayetteville, Arkansas
May 11, 2012
2
On Shelf Availability in Retailing: A Literature
Review and Conceptual Framework
On-Shelf Availability (OSA) is a key performance indicator for the retail industry,
greatly impacting profit and customer loyalty. Strong competition in the industry
causes retailers and suppliers to put heavy emphasis on improving performance in
an effort to satisfy consumers and keep them coming back to their store or product.
Over 40 years of research has been done on OSA and its complement, out-of
stock (OOS), however very little progress has been made in improving
performance in these areas, leading to the belief that gaps in extant research exist.
In order to solve the OOS problem, the key drivers of OOS events must first be
identified and then addressed. This paper focuses on identifying the drivers of
poor OSA performance through a three step process. First, a comprehensive
literature review was performed to identify the drivers of OOS addressed in
existing literature. Second, interviews with industry professionals revealed
potential drivers of poor OSA performance that have been explored at an industry
level. Finally, the two lists were examined against each other and the potential
drivers identified in the interviews that had yet to be researched were highlighted.
This paper gives strategic direction for future research to help solve the OOS
dilemma facing manufacturers and retailers today.
1. Introduction
Strong competition in the retail environment creates constant pressure on retailers to
continually improve performance. On Shelf Availability (OSA), the probability that a product is
in stock when a customer order arrives (Chopra and Meindl 2007, 77), is a key performance
measure that affects profitability for both retailers and manufacturers (Fernie and Sparks, 2004;
Aastrup and Kotzab, 2009). Out-of-stocks (OOS), a counterpart to OSA, occur when a
consumer at a retail outlet arrives at the shelf and the specific product they are seeking is not
there. Consumer tolerance for OOS is decreasing (Gruen et al, 2002), threatening retailers
through lost sales and declining customer loyalty (Trautrims et al, 2009). OOS events cut deep
into retail profits with some research showing that OOS events can cause the sales of a $1 billion
retailer to be cut by $39 million (Corsten and Gruen, 2003). With the potential for such a high
impact on profit (Katia et al. 2000), improving OSA is a major emphasis of retailers and
manufacturers (Boyle, 2011).
There has been over 40 years of research that specifically addresses the causes of and
consumer responses to OOS (Progressive Grocer, 1968a; Progressive Grocer, 1968b; Walter and
Grabner, 1975; Emmelhainz et al. 1991; Coca Cola Research Council, 1996; Corsten and Gruen,
2003; Fernie and Grant, 2008; Trautrims et al. 2009). Despite this research, however, OOS
levels have stayed relatively the same (Aastrup and Kotzab, 2009), hovering around a worldwide
average of 8% (Corsten and Gruen, 2003). This means that on a given day in a given store, 8%
of items being sought out by shoppers are not on the shelf. The lack of measurable improvement
in OOS levels leads to the belief that there are gaps in the research of the determinants of OOS

3
that need to be filled. This will be the focus of my research. Specifically, the aim of this research
is to identify gaps in extant research and identify factors that could potentially be key root causes
of out-of stocks. Such insights could lead to further developing strategies or practices to aid
retailers at the store and manufacturer level in reducing their OOS levels. For example, product
life cycle is a potential driver of poor OSA performance; however, there has not been detailed
research on product life cycle and its four stages in relation to OSA. Factors such as these that
have not been extensively explored could contain keys to increasing OSA performance.
The body of literature surrounding OSA and OOS can be narrowed down to two major
categories: consumer response to OOS and root causes of OOS events (Astrup and Kotzab,
2009). The first major contribution to OOS research was done in 1968 by the periodical
Progressive Grocer and the two streams developed out of that paper. Since that time, the
majority of the research has fallen into the consumer response stream with many papers aimed at
understanding and evaluating consumer behavior in an OOS situation (Progressive Grocer, 1968;
Walter and Grabner, 1975; Schary and Christopher, 1979; Emmelhainz et al, 1991; Campo et al,
2000; Fitzsimmons, 2000; Corsten and Gruen, 2003; Zinn and Liu, 2008). Corsten and Gruen
(2003) identified five main responses of consumers when faced with an OOS situation:
substitute same brand different size, substitute another brand, delay purchase, purchase at a
different store, or not purchase at all. Each of these responses carries a different cost to the
retailer or manufacturer with the potential of greatly hurting their bottom line. It is to this end
that the second stream of research came into play.
As to the study of the root causes of OOS, the Progressive Grocer (1968) paper addressed the
supply side issues associated with OSA; however literature was scarce for many years. The
Coca Cola Research Council produced a report in 1996 that identified various causes for OOS.
Following that study, Gruen, Corsten, and Bhardawaj (2002) published the most comprehensive
analysis of OOS drivers up to that time (Aastrup and Kotzab, 2009). Their study defined three
general processes as the major causes of OOS: ordering practices, replenishment practices, and
planning practices. Literature addressing root causes of OOS generally assigns responsibility
for poor OSA to either the store level or up-stream supply chain level. According to several
studies, store level issues carry the majority of the weight of responsibility in OOS situations
(Coca Cola Research Council, 1996; Corsten and Gruen, 2003; ECR Europe 2003). However,
fixing this problem will require a holistic approach involving members of the entire supply chain.
Corsten and Gruen (2002) reported that reducing out of stocks would require process changes at
the store, supply chain and supplier level. Trautrims et al. (2009) stated, “there is a cumulative
effect on customer service levels from supplier to manufacturer to distribution center (DC) to
retail store to the shelf that dramatically impact OOS and OSA rates.”
The emphasis of this research will be within the realm of identifying causes of OOS events
through a three step process. First, existing literature is summarized to find currently identified
drivers of OOS. Second, the literature review is complemented by interviews with industry
professionals who outline the industry perspective of the drivers of poor OSA performance.
Finally, a comprehensive conceptual model is created that shows the gaps in existing research on
the drivers of OOS. The findings of this research will benefit other researchers as they endeavor
to investigate possible solutions to poor OSA performance, narrowing down priorities of
research topics. Focused research by Academia on the gaps in extant research will benefit the
retail industry and the consumer. Retail industry professionals, at the store and supplier levels,
will be able to consult this paper to seek resources for identifying problem areas within their
4
supply chain that lead to poor OSA levels. They can then, in turn, use this research to find
strategies for addressing these areas and move toward optimizing OSA within their organizations.
2. Literature Review
This paper is broken into three parts with the literature review at the beginning. To clearly
outline the OOS drivers discussed in existing literature, three major categories of responsibility,
or ownership, of the drivers were created: Supplier, Retailer, and Time. These categories allow
the findings from the review to be streamlined for future examination and research and shows
where the majority of research has been focused up to this point. The literature review will be
presented through examination of these three major categories and the OOS drivers researched
within those categories, starting with Supplier driven causes of OOSs and moving through
manufacturer, and time. The drivers of OOS found within the existing literature will serve as the
foundation for discovery of future research agendas. The potential drivers identified during the
interview process will build upon the drivers found in literature. Drivers that do not fit inside the
areas exposed in the existing literature, the gaps, will be examined as possible areas of future
research.
2.1 Supplier
The retail outlet relies on a number of inputs outside of its organization to make it run
efficiently; perhaps the most significant of those inputs is the supplier. This section of the paper
will focus on three specific supplier controlled drivers of OOS controlled have been evaluated in
current research. Case pack size will be discussed first followed by DSD and then
merchandising coverage.
Case pack size
Case pack size is an issue that has been examined heavily through academic research;
however, it has just recently been evaluated in direct relation to on shelf availability. The size
and quantity of a case pack can have direct impact on the shelf availability of a product. Case
pack size has been looked at from a variety of angles in relation to OSA, specifically in the areas
of shelf space allocation and replenishment needs (Waller et al, 2010; Broekmeulen et al., 2004).
Research shows that 91% of the products in a store are allocated shelf space based on the size
of the case pack (Gruen & Corsten, 2007). Additionally, the relationship between shelf space
and rate of sale should be noted. The more shelf space given to a particular product, the more
sales that product will produce due to the familiarity, or recognition, of the product (Trautrums et
al., 2009). Therefore, the expectation would be that the larger the case pack, the more space
allocated to that product and that product will experience a relatively higher rate of sale than
substitutes with less shelf space. There are two possible implications in regards to shelf
availability. First, the larger the case pack size, there will be less frequent replenishment
requirements leading to a lower risk of OOS occurrences (Waller et all, 2008). However, high
volume items are more susceptible to stock outs (Gruen & Corsten, 2007), therefore that may
countervail the original effect. Another converse effect of a larger case pack size is observed
when partial replenishment occurs; when the store associate goes to restock the shelf and the
current case on the shelf still has product in it (Waller et al., 2008). For example, suppose the
case pack quantity is 20 items and the product is allotted shelf space that accommodates one case
pack. When the store associate goes to restock that product, there are still 10 items on the shelf.
The new case won’t fit on the shelf so the associate fills the existing shelf and takes the
5
remaining case to be stored in the back room; this process is called partial replenishment. This
leads to an immediate concern and increases the likelihood that an out of stock will occur, “Up to
10 per cent of the time, store employees cannot find items when they are replenishing shelves
with product from the back area, even though they are available.” (Waller et al, 2008).
The days of supply contained in a case pack is another issue that can have a bearing on the
OSA level of a product. The days of supply are obviously connected to the demand of the
product. Depending on the product, case packs may have a seven day supply or a four day
supply, requiring different replenishment cycles per product. Gruen and Corsten, in their 2007
paper, A Comprehensive Guide to Retail Out-of-Stock Reduction in the Fast-Moving Consumer
Goods Industry, addressed this very issue by looking at concept called “net shelf space”,
originally studied by TU/e Retail Operations Group. Net shelf space exists when products are
allocated more space than necessary to efficiently sell the product (Gruen & Corsten, 2007).
This all comes down to days of supply in the case pack. One product may have a case pack with
seven days of supply and another in the same category may have a two week supply and another
may only have a two day supply. It seems that it would be best to optimize the shelf space to
hold fewer of the low performing items and more of the higher volume items. This would
require an optimization of the case pack size as it is most efficient to stock shelves with full case
packs. This may not be very practical and when considered on a store wide level may not be cost
effective. In one market, a product case pack may represent a two week supply and in a different
market a case pack may represent a one week supply.
Case pack size cannot be looked at from the singular perspective of OSA. Operational
factors such as packaging machinery capabilities, pallet dimensions, warehouse rack heights, and
transportation are all considered when making case pack attribute decisions (Waller et al, 2008).
Therefore it is not reasonable to suggest case pack size decisions can be made solely based on
OSA. However, literature shows the connection between case pack size and OSA levels and
highlights the importance of considering case pack size when suppliers and retailers plan for the
future.
DSD
Direct store delivery (DSD) is defined as when a supplier delivers the product directly to the
store and is responsible to replenish the shelves. Research in the area of DSD and OSA shows
mixed results. These results range from worse to better to no difference in OSA levels between
DSD delivered merchandise and products delivered from the retailer warehouse.
Recent GMA studies addressed DSD in the retail environment (GMA 2008; GMA 2011). In
the 2011 study “Optimizing the Value of Integrated DSD”, their research showed that the
average in-stock level for the DSD products were 98.2 percent, which is significantly higher than
the in-stock average in-stock level of 94 percent, reported in other studies. Both the 2008 and
2011 studies produced by the GMA strongly support DSD as a method to reduce OOS
occurrences at the shelf. Gruen & Corsten reported in their 2007 paper, A Comprehensive Guide
to Retail Out-of-Stock Reduction in the Fast-Moving Consumer Goods Industry, the absolute
opposite of the previously mentioned study. Products delivered directly to the store had lower
OSA levels than those delivered from the retailer’s warehouse. This was a result of the
unmatched store replenishment and delivery schedules and the inability for store management to
enforce store policies on the supplier’s merchandisers. They went as far to say, “In a large U.S.
retail chain, DSD posed the biggest single problem to reducing OOS….” (Gruen & Corsten,
6
2007). The ECR 2003 report concluded that there was “no significant difference between DC &
DSD (delivered) items.”
The different results reported in the various studies could be attributed to a variety of factors.
One possibility could be whether the product being delivered is vendor managed inventory,
meaning the vendor does the ordering and forecasting for the product, or store/retailer managed
inventory. Items that are vendor managed would have delivery schedules aligned to ensure
proper and timely replenishment. Another possible reason for the discrepancy could be the
products or categories utilized in the studies.
To obtain a clear picture as to whether or not DSD impacts OSA levels across many retail
outlets would require an in-depth analysis of the store practices at the different retail outlets. The
requirement of in-depth analysis points to the clear fact that OSA levels will not be improved
through simply one method, but will require a comprehensive plan of action. DSD could be a
possible piece of the puzzle in decreasing OOS at the shelf level; however there is too much
variability in current research at this point to decisively reach that conclusion.
Merchandising Coverage
Merchandising coverage, as related to supplier attributes that impact OSA performance,
refers to supplier employed merchandisers responsible for the stocking and restocking of product
at the retail outlet. The ECR 2004 report listed in-store merchandising as a potential spoke in the
proverbial wheel of the OSA dilemma.
In the above section regarding DSD, the following comment was included, “In a large U.S.
retail chain, DSD posed the biggest single problem to reducing OOS….” (Gruen & Corsten,
2007). Gruen & Corsten stated that the reason for DSD being such an issue specifically related
to the merchandising coverage that accompanied the direct store delivery setup. They reported
that delivery schedules of the product were not aligned with store replenishment schedules and
that the supplier’s merchandisers were not bound to store policies and therefore it was very
difficult to enforce alignment to store practices.
Emberson et al., in their 2006 study Managing the Supply Chain Using In-Store Supplier
Employed Merchandisers, examined the relationship between supplier employed merchandisers
and the retail outlet. There are many factors that go into making the relationship work between
the retail associates and the merchandisers and the ultimate conclusion is that it is a complex
relationship. The results were worth the effort, as the supplier company examined in the
research experienced a 10% sales increase in the stores where they deployed merchants
(Emberson et al., 2006).
Some suppliers have used a form of merchandising coverage that does not involve stocking
of shelves, but more of a monitoring approach. Throughout the course of this research project,
examples were found where supplier companies are sending merchants into the stores on a
regular (weekly) basis to evaluate the in-stock level of their products. They are not stocking
shelves and they are not delivering product, but they are acquiring actual shelf level performance.
Future research could include case studies where projects of this nature are examined for
effectiveness of improving OSA performance and techniques or processes implemented based on
learnings from the in-store merchants and the data they collected. This could prove valuable for
other companies trying to improve their in-stock position at the shelf level.
Existing research reveals that the use of supplier employed merchandisers can have a positive
impact on the OSA of their products which leads to increased sales. However, both the retailer
and the supplier must be committed to developing the relationship and see the mutual benefit

7
from the relationship. This is certainly an avenue worth exploring when building a
comprehensive approach to improving OSA performance.
2.2 Retailer
Consumer access to products is generally through the retail outlet and if the product isn’t on
the shelf then both the retailer and the manufacturer lose. Over the last several years of research
there has been a focus on “the last 50 yards”, meaning the execution of the supply chain
activities at the store level. Service level deteriorates as it moves through the supply chain;
starting at 99 percent service level from the manufacturer to the retailer DC, reducing to a 98
percent service level from the retailer DC to the retailer storeroom, and finally decreasing to 90
to 93 percent from the storeroom to the shelf (ECR 2003). Corsten & Gruen reported in 2003
that “72 percent of all OOS across the world are caused in the store…” The following section of
this paper will evaluate eleven different root causes identified in the existing literature, including
store ordering, store replenishment, store size, store format, store fixed effects, backroom,
number of facings, modular discipline, shelf maintenance, price promotion, and substitutes.
Forecasting & Ordering
Store forecasting and ordering have been cited as major drivers of OOS by recent literature
(Gruen et al., 2002; Fernie & Grant, 2008; Aastrup & Kotzab, 2009). Research shows that 35
per cent of all OOS can be attributed to store ordering practices (ECR 2003) and if ordering and
forecasting are combined that number can reach up to 47 per cent (Gruen & Corsten, 2003).
These two factors walk hand in hand as wrong forecasts will lead to wrong order quantities. This
leads to a major concern in the retail industry, the accuracy of perpetual inventory (PI) data. PI
drives the forecast which then in turn drives the order.
Inaccuracy in the PI data creates problems all the way up the supply chain (Raman et al.,
2001; ECR 2003, Gruen & Corsten, 2007; Fernie & Grant, 2008). “…physical audits
consistently show that PI data are typically accurate for less than half of the items in the store”
(Gruen & Corsten, 2007). The inaccurate data either leads to phantom inventory, inventory that
shows it is on the shelf but is not there, and hidden inventory, inventory that shows it should be
in the store but cannot be found. One driver of inaccurate PI data discussed often by those in the
industry is item scanning at the checkout. Take jello as an example. Suppose a customer places
six packets of jello on the belt at the register. She has two orange, two strawberries, and two
lime. The cashier picks up one lime packet and scans it six times. The POS data feeds the PI
data and it is wrong. For the supplier of that jello, mistakes like that could be multiplied across
thousands of grocery outlets on a weekly basis. Part of fixing the PI data accuracy will lie in
training cashiers to input data accurately at the register. Accuracy in PI data can also be skewed
when products are in the store, but not on the shelf. Since the product is not on the shelf then
there will be no recorded sales for that data. Therefore, the demand signal is very low and the
forecast will be adjusted to account for lower demand.
The PI data is used to create forecasts which in turn feed into a computer automated ordering
system, used by majority of retailers today. If these orders are sent unadjusted by management
then they will not be accurate and the wrong amount of product will end up at the store,
increasing the opportunity for OOS occurrences.
Even if the PI data is accurate and the orders produced by the system are right, store
managers and associates often adjust the order amount. This leads to either an over or under
order of products. Research shows that the orders generated by a computer automated system
8
are more accurate than the order amounts adjusted by store management (Gruen & Corsten,
2007).
Store Size
Store size has been found to impact OSA levels (Aastrup & Kotzab, 2009; Fernie & Grant, 2008).
Store size can be broken down into two broad categories: large-usually big box chain retailers
but could also be independent and small-generally independent grocery/retail stores. Each store
size carries with it unique characteristics that can either help or harm OSA performance.
Larger stores have more shelf space and are able to give more space to high volume products
without eliminating low demand items thereby reducing variety (something important to the
consumer). The bigger stores also tend to have more associates with a number of them devoted
strictly to replenishing the shelves (Aastrup & Kotzab, 2009). These two characteristics create
an environment for good OSA performance. On the down-side, large stores have more variety
which means more complexity which can possibly reduce OSA.
Small stores, mostly independently owned and managed, perform fairly poorly in regards to
OSA, in comparison to the larger retailers (Aastrup & Kotzab, 2009). The main reason for this
is the processes in place in a small store are so very different than those in the larger retail outlets.
Aastrup & Kotzab found that in the smaller independent stores that shelf replenishment was the
responsibility of one associate or the owner. Of course, they have responsibilities beyond shelf
replenishment and the task of stocking the shelves is done in between completing their other
responsibilities. Aastrup & Kotzab found a wide range of OOS levels among the small
independent stores and attributed the variety to the emphasis of management on shelf
replenishment. In stores where management emphasized this, generally they experienced a
lower OOS level. Another attribute of the small store is their ordering and forecasting processes
are less efficient as they do not have access to sophisticated perpetual replenishment and
forecasting software. Although the use of software alone will not guarantee good OSA
performance it is a tool that can aid in producing more accurate forecasts and corresponding
orders. Much of the ordering in small independent stores is “non-data based” (Aastrup & Kotzab,
2009). This has an obvious impact on OSA.
The benefit of the research on how store size impacts OSA allows store management to be
aware of the potential issues they face within their stores and to address them through various
research driven solutions. As seen in the Aastrup & Kotzab study there are small stores with
really good OSA. They have implemented processes that mitigate the characteristics of smaller
stores that lend to poor OSA performance. Therefore, store size doesn’t dictate OSA
performance, but knowledge of the unique characteristics leads to the ability to perform well and
meet the needs of the consumer.
Store Format
During the course of this research very little literature was found addressing store format as a
root cause of OOS occurrences. The ECR 2003 study briefly reviews this concept, comparing
the stock-out levels of supermarkets versus hypermarkets. They found that there was on average
a difference between the OSA levels in two different store formats. “However, store format
alone does not explain enough to justify different out-of-stock levels among the same type of
store format” (ECR 2003). This mirrors the conclusions drawn in the store size discussion.
Although there are some unique characteristics that can influence the OSA performance of a
store, the format of the store alone does not necessarily dictate OSA.
9
Store Fixed Effects
Store fixed effects, as defined for the purpose of this research, are the unobserved differences
in “store execution”. Specific to this project, we will look at inventory control systems used by
the store, such as RFID or specific shelf replenishment guidelines and processes, and the impact
of they have on OSA. Of course, there are other systems that will be unique to individual stores
that could have a positive or negative impact on OSA. These would have to be observed
throughout the course of research to understand the impact of those unique systems on the OOS
level in a specific store. Some of these could be found by evaluating the specific systems
implemented in stores with very good OSA levels and those with average to very poor OSA
levels and find the key differences. From there, the specific impact of the different practices
could be determined through further research and analysis.
RFID technology has been a part of the discussion in helping to reduce OOSs at the shelf
level. By providing visibility to products throughout the entire supply chain, RFID is said to
have the ability to help retailers, among other things, reduce OOS occurrences (Kamaladevi,
2010; Hardgrave et al., 2008). The key value of RFID is the visibility it provides to the location
of the product. A major issue facing retailers today in the realm of OSA is when the product is
in the store but not on the shelf. RFID technology would help with these types of situations;
sensors would read when a case is received at the store and when it leaves the backroom to go
out to the sales floor. Then store associates could check to see when/if the product was received
and when/if it left the back storeroom. Major retailers have been implementing RFID
technology over the last few years and have seen substantial results in reducing OOS levels in
stores using RFID (Hardgrave et al., 2008).
Retailers around the world use a very wide variety of systems for replenishing their shelves,
from entirely manual to completely automated shelf replenishment systems. These systems,
often designed by consulting companies or software vendors, claim to reduce the number of out-
of stocks at the shelf. There are too many of these systems to evaluate within the scope of this
project. Existing research does not dive deeply into the specific systems. As stated above, future
research could include case study type projects that evaluate the before and after effects of
implementing specific shelf replenishment systems.
Backroom
The existence of a backroom, or storage area, can have a big impact on the efficiency of shelf
replenishment, especially if inventory in these areas is not well organized (Raman et al., 2001).
Remember one major issue with OSA is product that is often in the store, but cannot be found,
leaving the shelf empty. This can often be the result of cluttered backrooms. 10 percent of the
time store associates, when attempting to stock the shelves from storage or backroom areas,
cannot find the product (Waller et al., 2008). Consider a case of product that leaves the
backroom to go out to the shelf and only half of the case will fit on the shelf. The store associate
brings the remaining half of the case to the backroom and sets it on a shelf. If there is not a
systematic way to catalogue the remainder of the case then it gets lost in the backroom, adding to
the phantom inventory problem.
Some research exists showing that reducing the amount of inventory in the backroom, along
with other measures, can positively impact OSA (Fernie & Grant, 2008). This research, Fernie
& Grant, 2008, told of a retailer that implemented a system that extra stock that would not fit on
the shelves went on special carts. The associates on the next shift knew to replenish shelves
10
from those carts first. The result was a significant reduction in the amount of inventory in the
backroom.
Number of Facings
The number of facing given to a specific SKU impacts the number of sales of that item
(Trautrims et al. 2009). This concept closely mirrors the argument made earlier in the Supplier
section of the paper regarding shelf space allocation. More shelf space, or the larger the number
of facings given to a product, will translate into more sales. Allocation of facings, or shelf space,
is a complex opportunity and one that certainly deserves a closer look.
Allocating space is a complex process and often in large retailers requires a lot of
involvement from a variety of sources and inputs. It seems to make sense to give more space to
both higher volume and higher profitability products to help buffer against OOS occurrences.
One recommendation found in the research encourages retailers to determine the necessary days
of supply for a specific product and assign shelf space accordingly (GMA 2011). Another study
researched the impact of eliminating the 14 slowest items and giving more shelf space to the 14
fastest moving items (Gruen & Corsten, 2007). The quandary here is that to increase the shelf
space of the most profitable products will reduce the shelf space allocated to the other products.
In a large store environment, it is the expectation of the consumer/customer that there will be
variety offered. Therefore, it becomes hard to start taking shelf space away as that could lead to
a decrease in variety and dissatisfaction of the consumer (Trautrims et al. 2009). Therefore,
there is an optimal level of shelf space which minimizes the risk for OOSs and maximized
customer satisfaction.
Shelf Maintenance
Keeping shelves straight and accurate is quite important for both addressing OOS and
building a strong OSA level. Shelf Maintenance has had some research linking it to OSA
performance. Corsten and Gruen found four common failures when it comes to item
management: wrong tag, shelf tag missing, product hidden behind another product, and holes
covered (empty facing) covered by another product (Corsten & Gruen, 2007). Their study shows
that when failures in item management are addressed there is significant impact on OOS levels.
The study involved a group of test stores where shelves were “shored-up” each week, meaning
mistakes in tagging, stocking, etc. were fixed. With clean and accurately tagged shelves OOS
were obvious and apparent. The control set of stores were not corrected and their OOS levels
were significantly higher than the test stores OOS levels.
Price Promotion
A very large amount of research exists that shows a connection between price promotions
and poor OSA performance (Corsten & Gruen, 2003, ECR 2003, Taylor & Fawcett, 2001).
Demand for promoted products increases, but there is little reference to how much it will
increase and therefore variability in demand creates an environment where OOS can occur.
In the late 1990’s and early 2000’s, the OOS level of promoted items was reported as higher
than that of non-promoted items (ECR 2003; Coca Cola Research Council, 1996). However, in
recent years the OOS rate of promoted items seems to be improving. In the “case study”
research performed by Fernie and Grant, 2008, they found that promoted items actually had a
higher OSA level than for non-promoted items. Average availability for products not currently
being promoted was 95.5% and for items being promoted it was 97.7%. This has been a huge

11
focus in the UK for the last several years and therefore there is a heightened awareness to ensure
OSA for promoted items. This is an example where emphasis has shifted due to the exposure of
the problem to the industry.
Substitutes
The issue of substitution is thoroughly covered in the large body of literature addressing
consumer responses to stock out occurrences (Coca Cola Research Council, 1996; Gruen et al.,
2002; Aastrup & Kotzab, 2009). However, there is very limited research linking substitution as a
root cause of the OSA problem. The issue of substitution must be looked at from the back door.
The other issues addressed in this research paper can be viewed as negative influences on OSA
and therefore provide opportunities for improvement in those areas leading to a positive impact
on OSA. However, substitution is not a root cause, but the issue of more substitutes may lead to
higher levels of OSA for a “collection” of products. This would not necessarily be true for a
single product, but the OSA level of multiple products in a category or sub-category could have
positive results with higher substitutability of products.
One study was found addressing the issue of substitutes within the bounds of OSA,
Optimizing On-Shelf Availability for Customer Service and Profit (Trautrims et al., 2009). In
this study they looked specifically at OSA in the chilled juice category. This is a highly
substitutable product, meaning that if one juice goes OOS then the demand for the other juices
increases considerably. The ability to substitute either the same brand in a different size or a
different brand that is very similar eases the consumers concerns about the OOS and causes them
to be less likely to switch stores due to frustration with the item they wanted not being on the
shelf.
Further research in this area could yield recommendations on product assortment within
categories or sub-categories, optimizing customer satisfaction customer satisfaction through
category assortment. Of course “optimal assortment” is the key phrase as too much assortment
can lead to uncertain demand, as can be seen in categories with a very large number of SKUs.
2.3 Time
Time is a very significant characteristic that bears consideration when evaluating OSA
performance. The fact that increased demand for a product creates more opportunity for OOS
occurrences has already been established. Demand varies throughout the week based on a
variety of factors and that demand variation can be felt at the shelf. With the majority of adults
working during the week, retail outlets are busiest on the weekends. Additionally, events
throughout the month create peak shopping days. These peak shopping times require an
organized and streamlined supply chain to ensure the needs and desires of the consumer are met.
Day of Week
Research has shown that OOS levels vary by day of week/month and time of day (ECR
Europe, 2003; Taylor & Fawcett, 2001; Fernie & Grant, 2008; van Woensel, et al., 2007). The
usual trend is that in-stock levels decrease as the week progresses (Taylor & Fawcett, 2001).
Sales on Friday and Saturday account for an average 43 per cent of weekly sales, and in some
stores that number can go as high as 50 per cent (ECR 2003). Therefore, the opportunity for
stock-outs increases on the weekend as more products are being purchased.
Store replenishment practices must be aligned to ensure that shelves are restocked to meet
weekend demand. One grocery chain decided to attack the OSA issue, in part, by having

12
nighttime associates do “gap counts”, visually checking the store inventory, on a daily basis
before the store opened in the morning and adjusting the forecast and order accordingly.
However, on the busiest days (Thursday through Sunday) they would have associates do “gap
counts” throughout the day (Fernie & Grant, 2008). This highlighted shelves that needed
immediate replenishment so that back room stock could be taken directly to the shelves.
A variety of drivers of OOS occurrences at the store shelf have been identified within the
literature. These drivers fall within the categories of supplier controlled, retailer controlled and
time controlled. The drivers within each area interact with one another and the impact of it all is
observed at the retail shelf. Retailer controlled drivers dominate the literature and even the
supplier controlled drivers deal with execution at the store level, showing that store execution is
one of the biggest challenges in improving OSA performance. The drivers addressed in existing
literature form a good place to start in addressing OOS, however they have not proved to be
enough to bring OSA to an acceptable level.
3. Interviews
The literature has provided a basis for addressing OSA and the lost revenue experienced by
both the retailer and the supplier. However, even with this research, progress has been slow.
The 1968 Progressive Grocer study reported an average OOS of 12.2 percent. Thirty-five years
later, Corsten & Gruen (2003), reported an average OOS rate of 8 percent, showing there is still
opportunity for vast improvement. There are gaps in the existing literature that need to be filled;
drivers of OOS that have yet to be discussed in research. Filling these gaps with focused
research has the potential to give practitioners the tools they need to bring OSA to an acceptable
level, for both the retailer and the supplier. To begin understanding additional drivers of OOS,
interviews with industry practitioners were conducted. The purpose of these interviews was to
gain industry input as to additional drivers of OOS that have yet to be explored in extant
literature.
The interviewees selected for this research were from the vendor/manufacturer community
and the industry trade organization sector. Both sides have a clear understanding of the OSA
issue and have conducted some forms of research to address the problem. In selecting these
participants, the design was to go beyond issues that have already been researched as drivers for
OOS and to drill down to potential issues that have yet to be discussed. A total of 10 industry
experts were interviewed in a semi-structured format. Prior to the interview, all participants
were sent an overview of the research project and a short video describing the project and the
information desired to be collected during the interview. Each interview lasted between one and
two hours. Detailed notes were taken during the meetings and transcribed following the
interviews. The interviewees and their responses will remain anonymous to protect the
disclosure of any proprietary information shared during the process. The responses of the
industry professionals during the interviews were examined and common themes were extracted.
These themes compose the issues addressed below as potential future research streams.
There were some OOS drivers discussed in the interviews that already had large bodies of
research that had examined them, such as forecasting, shelf space allocation, and the accuracy of
PI data. However, there were several issues brought out during the interviews that warrant the
need for further investigation and should be added to the potential streams of future research.
These issues will be discussed individually in the following section.
13
3.1 Supplier
Supplier Category-specific Market Share
There is a connection between market share of a specific product or category and OSA
performance. Market share is a function of demand and it is well established by this point that
the higher the demand for an item, the higher the volume, which leads to more susceptibility to
OOS situations. In addition, the higher volume items are often given prominent shelf placement
which makes the items more visible to the consumer and therefore lead to even further sales, thus
leading to potential decline in OSA performance.
Further research in this area will provide understanding on the impact of supplier-category
specific market share and will highlight the importance for both suppliers and retailers to
understand the unique demand and flow of the sales of the products they produce and carry. In
this specific example, this allows for more focused attention on the high volume products to
ensure that the product is managed well from both the retailer and supplier perspective and that
OSA levels are monitored to ensure availability when the consumer goes to purchase the product.
The interviewees from the vendor community were quite interested in this as they must ensure
their high volume products with larger market share have the prominence and attention they
require in the store. Research in this area would allow them to better collaborate with the retailer
as they work together to increase OSA performance.
Planogram Compliance
Modular Discipline is a very important topic to in the retail industry and was mentioned in
the interviews as a point that needs addressing. Generally, both suppliers and retailers
collaborate together to develop a modular design. Planograms are designed to attract the
customer, but also contained in their specific design is the intent to have enough product on the
shelf when the consumer wants it. Imperative to the design of the modular, or planogram, is
associate execution in the store. The nature of collecting data on the behavior of store associates
is quite complicated, labor intensive, costly and altogether impractical (as it would require
associates being followed around by someone recording their actions which would bias the result,
among other problems). That being said, there is validity to the argument that store labor, in
regards to planogram compliance, is imperative to accurate shelf replenishment. If a store
employee responsible for stocking shelves has never seen the plan-o-gram for their department
they have no idea the correct staging for the shelf they are replenishing and the likelihood of the
shelf being compliant with the planogram is very slim.
Store Labor
As mentioned above, store labor is integral to excellent store execution. There are many
aspects of store labor that could be drivers to OOS occurrences and analysis of this issue is
important to industry professionals. One of those issues is the scheduling of the associates. Are
they scheduled in alignment with peak shopping hours and also DC deliveries? Management of
store labor and the execution characteristics of store labor are difficult to research. Data is
difficult and expensive to obtain. However, store labor is the front line defense against poor
OSA performance. Therefore, perhaps case studies could be performed to evaluate the
effectiveness of highly trained staff and through the use of similar stores as controls. Another
argument in regards to store labor is that they are very detached from the impact of lost sales due
to OOSs. Perhaps if there was an incentive program in which they understood the connection

14
between accurately stocked shelves that matched the planogram and they were rewarded for
accuracy the retailer would begin to see an increase in OSA levels.
Product Placement
There are certain products, such as batteries, that are placed in various locations throughout a
store. However, the inventory of the product is listed as an aggregate figure and not listed by
location in the store. Therefore, product could be out of stock everywhere in the store but one
location and it will show the product as being in-stock. The interviewees were interested in
understanding whether the placement of a product impacted OSA and if products that are placed
in various locations experience more or less stock-outs. This could possibly have an impact
when designing plan-o-grams and the distribution of the products throughout the store.
Understanding how this affects OSA could lead to more focused assignments of store associates.
For example, using batteries, let’s look at a potential scenario in a large big box retailer. There
are four displays of batteries throughout the store: two in front of the registers, one in toys and
one in electronics. Who is responsible for these? Is there one person assigned to batteries and
they stock all of them or does someone in each department responsible to stock the batteries. If
further research finds that these products are highly susceptible to poor OSA rates then perhaps
retailers would assign a specific associate to be responsible to stock the batteries.
Number of SKUs
The interviewees talked about the decision set of the customer and OOS situations. This led
to the thought that perhaps the number of SKUs in a given category has an impact on OSA.
Research linking the number of SKUs in a category as a driver for OOS was not found
throughout the course of this project. However, research shows that the health and beauty
category consistently performs poorly in the realm of OSA (Gruen et al., 2002). Health and
beauty is a SKU intensive category and there is the feeling that the poor OSA performance can
be linked to the huge number of products in the category. Purchasing behavior is harder to
predict when presented with a very large variety of products (Chernev, 2006). This leads to
greater demand variability and with that comes greater risk for experiencing an OOS.
From a different perspective in relation to the number of SKUs, a lot of research so far has
been done on OSA at the category level. There is an argument to focus more at a product level –
at least in regards to the highest volume items. Corsten and Gruen 2008, argued this exact point.
Their research showed that in general, when evaluating the items that are driving sales at the
retail level, the 80-20 rule is in play. Large grocery stores in the U.S. carry approximately
50,000 SKUs. On a peak day they found that approximately 5,000 items (unique SKUs)
accounted for over 70 percent of the store’s sales. This seems to indicate that focusing on getting
those 5000 items consistently on the shelf would produce a lot of benefit to the retailer. Then,
once the processes associated with those products are streamlined, they can be transferred to
other products within the store.
This area of focus, the number of SKUs, presents a clear path for future research that could
strongly influence overall OSA performance at all levels of retail – store, category, and product.
Payday
Demand variation was talked about by the interviewees in relation to different days of the
week and “events” throughout the month, one of those events being payday. Although some of
this discussion centered around store labor scheduling it became apparent that payday type

15
events could have an impact on OSA. Payday as a driver for OOS occurrences follows an
intuitive pattern. When people receive their paychecks they go out to purchase needs and wants,
from groceries to electronics. Many people do not have a lot of discretionary income and
therefore wait until they are paid to purchase things they need, such as groceries. Therefore, on
days where paychecks are given there is a spike in volume at the retail outlet. Also included in
paycheck references would be social security checks and food stamps. At the time these checks
and allowances are issued customer volume increases leading to a subsequent strain on demand.
This can lead to greater opportunity for OOS occurrences.
Time seems more of a factor than a root cause. If root causes to OOS are being addressed
and comprehensive models for reducing OOS occurrences have been built and implemented,
then peak times of demand will be planned for and the suppliers and retailers will be as ready as
possible. More research in the area of Time as a root cause for poor OSA performance does not
seem to be necessary; rather a perspective shift in regards to time seems more appropriate. The
time of day, day of week/month, etc. is a factor to consider in regards to OSA, but perhaps not a
root cause to be addressed.
Market Size & Competitive Density
During the interviews, the discussion regarding varying performance among stores led to the
question as to whether or not the specific market in which the store was located had an impact on
OSA. Different market sizes have unique characteristics. For the sake of this analysis let’s
consider a large market. Large markets will have greater sales volume due to the larger number
of consumers in the market. As previously stated, higher volumes of sales are associated with an
increased prevalence of OOS occurrences due to increased need for shelf replenishment and
accuracy in order amounts and timing. In addition, there will be a greater breadth of tastes and
preferences, or customer heterogeneity. This has a variety of implications; two of them being
variability of demand and more SKUs on the shelf. Both of these implications can lead to lower
OSA. Variability of demand creates more difficulty in forecasting which has an impact all the
way through the supply chain and certainly on the shelf. More SKUs means less shelf space for
the higher volume items and an increase in shelf replenishment cycles as less product fits on the
shelf.
Competitive Density refers to the number of competing stores within a specific market. This
will impact OSA performance as retailers in markets with fewer retail outlets will experience a
higher demand for their products. This higher demand leads to the opportunity for more OOS
occurrences. Conversely, markets with many retail outlets and more options for consumers
could be more difficult to forecast as demand for the product is spread across all of the retail
outlets. Inaccurate forecasting is a major cause of poor OSA performance (Corsten & Gruen,
2003).
A statement by one of the industry experts clearly states where companies want to be in
respect to out-of-stocks, “In regards to global replenishment there are two views, the windshield
view and the rear view mirror. Right now we are looking through the rear view mirror trying to
chase OOS’s.” Implicit in this statement is the desire to be able to look out the windshield and
address the OOS before it occurs. Perhaps through further research and the implementation of
research based practices, over the next few years retailers and vendors will have a windshield
view of OSA.

16
4. The Model
Once the interviews were completed and the content transcribed, the potential drivers
discussed by the experts in the interviews were compiled based on the three major categories
used for the literature review. An additional category was added after evaluating the feedback
from the interviews as Market issues were brought up that were not discussed in the literature.
The complete list of drivers discussed during the literature review and the interviews is shown in
Table 4-1. Any drivers that overlapped with those that had been addressed in extant research
were removed and what remained were topics with potential for future research. These potential
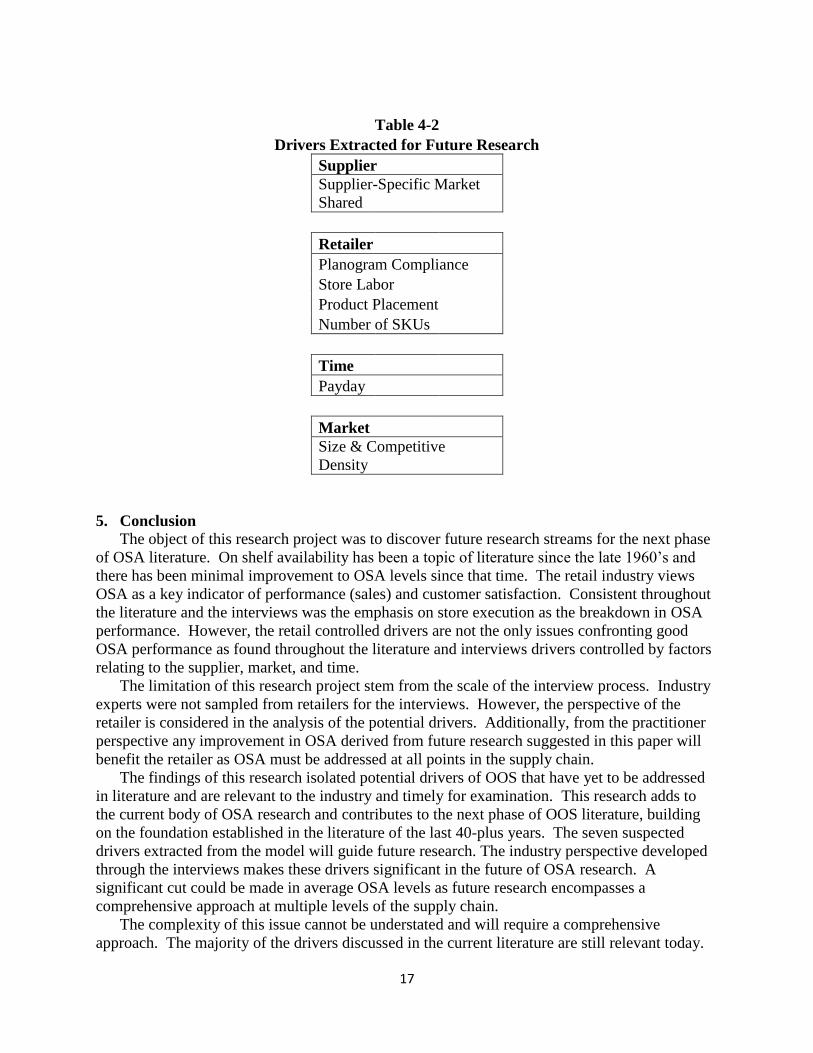
drivers are shown in Table 4-2. The future research topics extracted through this model are very
relevant to the industry as they originated from the experience of current practitioners that
confront the OSA issue on a daily basis.
Table 4-1
Drivers of OOS Addressed in Literature & Interviews
Literature Review
Expert Interviews
Supplier
Supplier
Case Pack Size/Shelf Space
Case Pack Size/Shelf Space
DSD
Supplier-Specific Market Share
Merchandising Coverage
Retailer
Retailer
Forecasting & Ordering
Forecasting
PI Data
PI Data
Store Size
Planogram Compliance
Store Format
Store Labor
Store Fixed Effects
Product Placement
Back Room
Number of SKUs
Number of Facings
Shelf Maintenance
Time
Price Promotions
Payday
Substitutes
Market
Time
Size & Competitive Density
Day of Week
17
Table 4-2
Drivers Extracted for Future Research
Supplier
Supplier-Specific Market
Shared
Retailer
Planogram Compliance
Store Labor
Product Placement
Number of SKUs
Time
Payday
Market
Size & Competitive
Density
5. Conclusion
The object of this research project was to discover future research streams for the next phase
of OSA literature. On shelf availability has been a topic of literature since the late 1960’s and
there has been minimal improvement to OSA levels since that time. The retail industry views
OSA as a key indicator of performance (sales) and customer satisfaction. Consistent throughout
the literature and the interviews was the emphasis on store execution as the breakdown in OSA
performance. However, the retail controlled drivers are not the only issues confronting good
OSA performance as found throughout the literature and interviews drivers controlled by factors
relating to the supplier, market, and time.
The limitation of this research project stem from the scale of the interview process. Industry
experts were not sampled from retailers for the interviews. However, the perspective of the
retailer is considered in the analysis of the potential drivers. Additionally, from the practitioner
perspective any improvement in OSA derived from future research suggested in this paper will
benefit the retailer as OSA must be addressed at all points in the supply chain.
The findings of this research isolated potential drivers of OOS that have yet to be addressed
in literature and are relevant to the industry and timely for examination. This research adds to
the current body of OSA research and contributes to the next phase of OOS literature, building
on the foundation established in the literature of the last 40-plus years. The seven suspected
drivers extracted from the model will guide future research. The industry perspective developed
through the interviews makes these drivers significant in the future of OSA research. A
significant cut could be made in average OSA levels as future research encompasses a
comprehensive approach at multiple levels of the supply chain.
The complexity of this issue cannot be understated and will require a comprehensive
approach. The majority of the drivers discussed in the current literature are still relevant today.
18
However, addressing these current drivers independently of one another is not driving down
OOS rates. As more research is done on OSA and more drivers are discovered, comprehensive
plans engaging multiple drivers must be designed and staged at multiple levels of the supply
chain in order to really see OSA reach acceptable levels.
19
Bibliography
Aastrup, J., & Kotzab, H. (2009). Forty years of out-of-stock research - and shelves are still
empty. The International Review of Retail, Distribution and Consumer
Research, 20(1), 147-164.
Boyle M. 2011. Wal-Mart Brings in Consultants to Help It Keep Shelves Stocked. Bloomberg
Businessweek. Retrieved October 22, 2011, from www.businessweek.com.
Broekmeulen R., van Donselaar K., Fransoo J., and van Woensel, T. (2004). Excess shelf space
in retail stores: An analytical model and empirical assessment. BETA Working paper 109.
Technische Universiteit Eindhoven, Eindhoven.
Campo,K., Gijsbrechts, E. & Nisol, P. (2000). Towards understanding consumer response to
stock-outs. Journal of Retailing. 76(2), 219-242.
Chopra, S. & Meindl, P. (2007). Supply Chain Management: Strategy Planning and Operation,
3 ed. Upper Saddle River, NJ: Pearson Prentice – Hall.
Coca-Cola Research Council/Andersen Consulting. (1996). Where to Look for Incremental Sales
Gains: The Retail Problem of Out-of-Stock Merchandise, The Coca-Cola Research Council.
Atlanta, GA.
Corsten, D. & Gruen T. (2003). Desperately seeking shelf availability: An examination of the
extent, the causes, and the efforts to address retail out-of-stocks. International Journal of
Retail & Distribution Management, 31(11/12), 605-617.
ECR Europe (2003). Optimal Shelf Availability: Increasing Shopper Satisfaction at the Moment
of Truth,ECR Europe and Roland Berger, Kontich, Belgium.
Embherson, C., Storey, J., Godsell, J. & Harrison, A. (2006). Managing the supply chain using
in-store supplier employed merchandisers. International Journal of Retail & Distribution
Management, 34(6), 467-481.
Emmelhainz, L., Emmelhainz, M., and Stock, J. (1991). Logistics Implications of Retail
Stockouts. Journal of Business Logistics, 12(3), 138-147.
Fernie, J., & Grant, D. (2008). On-shelf availability: the case of a UK grocery
retailer. International Journal of Logistics Management, 19(3), 293-308.
Fernie, J. and Sparks, L. (2004). Logistics and Retail Management: Insights into Current
Practice and Trends from Leading Experts. London: Kogan Page.
Fitzsimons, G.J. (2000). Consumer response to stockouts. Journal of Consumer Research. 27(9),
249-66.
Grocery Manufacturers of America. (2008). Powering Growth Through Direct Store Delivery.
Grocery Manufacturers of America (GMA), AMR Research, Clarkston Consulting,
www.gmaonline.org.
Grocery Manufacturers of America. (2011). Optimizing the Value of Integrated DSD. Grocery
Manufacturers of America (GMA), Willard Bishop, www.gmaonline.org.
Grant, D., Lambert, D., Stock, J., Ellram, L. (2006). Fundamentals of Logistics Management:
European Edition. London: McGraw-Hill.
Gruen, T., & Corsten, D. (2007). A Comprehensive Guide to Retail Out-of-stock Reduction in
the Fast Moving Consumer Goods Industry. Grocery Manufacturers Association (GMA),
Food Marketing Institute (FMI), National Association of Chain Drug Stores (NACDS), The
Procter & Gamble Company (P&G), The University of Colorado at Colorado Springs,
Washington, DC.
20
Gruen, T., & Corsten, D., & Bharadwaj, S. (2002). Retail Out of Stocks: A Worldwide
Examination of Extent, Causes, and Consumer Responses. Grocery Manufacturers of
America.
Hardgrave, B., Sangford, S., Waller, M., Miller, R. (2008). Measuring the impact of RFID on
out of stocks at Walmart. MIS Quarterly Executive, 7(4), 181-192.
Kamaladevi B.B. (2010). RFID – The Best Technology in Supply Chain Management.
Advances in Management, 3(2), 45-51.
Katia Campo, Els Gijsbrechts, & Patricia Nisol. (2000). Towards understanding consumer
response to stock-outs. Journal of Retailing, 76(2), 219-242.
Progressive Grocer. 1968a. The out of stock study: Part I, October, pp. 1-16.
Progressive Grocer. 1968b. The out of stock study: Part II, November, pp. 17-32.
Raman, A., DeHoratius, N. & Ton, Z. (2001). Execution: the missing link in retail operations.
California Management Review, 43, 136-152.
Schary, P.B. & Christopher, M. (1979). The anatomy of a stock-out. Journal of Retailing.
55(2), 59-70.
Taylor, J., Fawcett, S. (2001). Retail on-shelf performance of advertised items: an assessment of
supply chain effectiveness at the point of purchase. Journal of Business Logistics, 22(1),
73-89.
Trautrims, A., Grant, D., Fernie, J., & Harrison, T. (2009). Optimizing On-Shelf Availability for
Customer Service and Profit. Journal of Business Logistics, 30(2), 231.
van Woensel, T., van Donselaar, K., Broekmeulen, R., Fransoo J. (2007). Consumer responses
to shelf out-of-stocks of perishable products. International Journal of Physical Distribution
& Logistics Management, 37(9), 704-718.
Waller, M., Tangari, A., Williams, B. (2008). Case pack quantity’s effect on retail market share:
an examination of the backroom logistics effect and the store-level fill rate effect.
International Journal of Physical Distribution & Logistics Management. 38(6), 436-451.
Walter, C. K. & Grabner, J. (1975). Stockout Cost Models: Empirical Tests in a Retail
Situation. Journal of Marketing (pre-1986), 39(000003), 56.
Zinn, W. & Liu, P.C. (2008). A comparison of actual and intended consumer behavior in
response to retail stockouts. Journal of Business Logistics. 29(2), 141-59.
Related Documents