On peculiarities of vertical distribution of 239,240 Pu, 238 Pu and 137 Cs activity concentrations and their ratios in lake sediments and soils B. Luks ˇien _ e • E. Maceika • N. Tarasiuk • E. Koviazina • V. Filistovic ˇ • S ˇ . Buivydas • A. Puzas Received: 28 August 2013 / Published online: 16 February 2014 Ó Akade ´miai Kiado ´, Budapest, Hungary 2014 Abstract Distributions of 239,240 Pu, 238 Pu and 137 Cs activity concentrations in the cores of sediments in the shallow lake, flooded and upland forest soils taken in the vicinity of Vilnius city were analyzed. The radiochemical, a-spectrometric and mass spectrometric methods were used for the plutonium evaluation and c-spectrometry was used for the radiocesium evaluation. The only peak of enhanced radionuclide activity concentrations was determined for the lake bottom sediments, whereas vertical profiles of the radionuclide activity concen- trations in flooded and upland forest soil cores were distin- guished by two peaks. The obtained values of the activity concentration ratio 238 Pu/ 239,240 Pu and the isotopic ratio 240 Pu/ 239 Pu indicated that the global fallout was a source of plutonium in the investigated environment. Chernobyl- derived radiocesium was detected solely in the surface layers (2–11 cm) of the studied sample cores. The contribution of the Chernobyl deposits amounted to about 2.26, 6.11 and 20.9 % of the total radiocesium inventory in the bottom sediments, the upland soil and flooded soil, respectively. Keywords 238 Pu 239,240 Pu 137 Cs Origin Lake sediments Upland and flooded soils Vertical profiles Introduction Soils and bottom sediments of natural water basins are the main abiotic components which accumulate the largest quantities of man-made radionuclides and turn into radio- nuclide depositories [1]. Actinides have entered the envi- ronment as a result of nuclear activities, especially due to atmospheric weapons testing and several accidents in civil and military nuclear facilities. Actinides, and especially plutonium isotopes, are obvious long-term radioactive pollutants due to their high radiotoxicity, long half-lives and high persistence in the environment. Activity ratios of plutonium isotopes, such as the alpha-emitters 238 Pu (T = 87.8 year), 239 Pu (T = 2.4 9 10 4 year), 240 Pu (T = 6.6 9 10 3 year) and the beta-emitter 241 Pu (T = 14.4 year), are useful tools to identify the origin of contamination [2, 3]. To assess the long-term environmental impact of radio- active contaminants on ecosystems, information on source and radionuclide mobility is of high importance. Each plu- tonium contamination source shows an individual compo- sition of plutonium isotopes. Therefore, the 238 Pu/ 239,240 Pu, 240 Pu/ 239 Pu and 241 Pu/ 239 Pu activity ratios are widely used to identify the origin of plutonium contamination. Besides, 239,240 Pu may be used to identify 137 Cs sources according to 239,240 Pu/ 137 Cs or 137 Cs/ 239,240 Pu activity ratios when 134 Cs cannot be detected because of its radioactive disintegration. Eutrophication makes lakes decline, and they accumu- late sludge (silt or sapropel), lake shores get covered with excess vegetation and, consequently, all this causes a serious ecological problem [4]. These processes are espe- cially typical in case of small lakes. In Lithuania there is about 1 billion m 3 of pure sapropel which lies mostly in 1–2 m thick layers but in some places layers are up to 5 m, and there is about 6 billion m 3 of sapropel in mixture with other sediments. About 4.5 billion m 3 of sapropel underlie the peat layer of lacustrine swamps [5]. It is known that sapropel from lakes in Lithuania may be extensively used in agriculture (as bio-compost, growth stimulator for vegetation, fertilizer and forage additive), in industry (for diluents, binders in panel production) and in medicine (as curative mud, bio-preparations and masks), B. Luks ˇien _ e(&) E. Maceika N. Tarasiuk E. Koviazina V. Filistovic ˇ S ˇ . Buivydas A. Puzas State Research Institute Center for Physical Sciences and Technology, Savanoriu ˛ Ave. 231, 02300 Vilnius, Lithuania e-mail: bena@ar.fi.lt 123 J Radioanal Nucl Chem (2014) 300:277–286 DOI 10.1007/s10967-014-3026-0

Welcome message from author
This document is posted to help you gain knowledge. Please leave a comment to let me know what you think about it! Share it to your friends and learn new things together.
Transcript

On peculiarities of vertical distribution of 239,240Pu, 238Puand 137Cs activity concentrations and their ratios in lakesediments and soils
B. Luksien _e • E. Maceika • N. Tarasiuk •
E. Koviazina • V. Filistovic • S. Buivydas •
A. Puzas
Received: 28 August 2013 / Published online: 16 February 2014
� Akademiai Kiado, Budapest, Hungary 2014
Abstract Distributions of 239,240Pu, 238Pu and 137Cs activity
concentrations in the cores of sediments in the shallow lake,
flooded and upland forest soils taken in the vicinity of Vilnius
city were analyzed. The radiochemical, a-spectrometric and
mass spectrometric methods were used for the plutonium
evaluation and c-spectrometry was used for the radiocesium
evaluation. The only peak of enhanced radionuclide activity
concentrations was determined for the lake bottom sediments,
whereas vertical profiles of the radionuclide activity concen-
trations in flooded and upland forest soil cores were distin-
guished by two peaks. The obtained values of the activity
concentration ratio 238Pu/239,240Pu and the isotopic ratio240Pu/239Pu indicated that the global fallout was a source of
plutonium in the investigated environment. Chernobyl-
derived radiocesium was detected solely in the surface layers
(2–11 cm) of the studied sample cores. The contribution of the
Chernobyl deposits amounted to about 2.26, 6.11 and 20.9 %
of the total radiocesium inventory in the bottom sediments, the
upland soil and flooded soil, respectively.
Keywords 238Pu � 239,240Pu � 137Cs � Origin � Lake
sediments � Upland and flooded soils � Vertical profiles
Introduction
Soils and bottom sediments of natural water basins are the
main abiotic components which accumulate the largest
quantities of man-made radionuclides and turn into radio-
nuclide depositories [1]. Actinides have entered the envi-
ronment as a result of nuclear activities, especially due to
atmospheric weapons testing and several accidents in civil
and military nuclear facilities. Actinides, and especially
plutonium isotopes, are obvious long-term radioactive
pollutants due to their high radiotoxicity, long half-lives
and high persistence in the environment. Activity ratios of
plutonium isotopes, such as the alpha-emitters 238Pu
(T� = 87.8 year), 239Pu (T� = 2.4 9 104 year), 240Pu
(T� = 6.6 9 103 year) and the beta-emitter 241Pu
(T� = 14.4 year), are useful tools to identify the origin of
contamination [2, 3].
To assess the long-term environmental impact of radio-
active contaminants on ecosystems, information on source
and radionuclide mobility is of high importance. Each plu-
tonium contamination source shows an individual compo-
sition of plutonium isotopes. Therefore, the 238Pu/239,240Pu,240Pu/239Pu and 241Pu/239Pu activity ratios are widely used to
identify the origin of plutonium contamination. Besides,239,240Pu may be used to identify 137Cs sources according to239,240Pu/137Cs or 137Cs/239,240Pu activity ratios when 134Cs
cannot be detected because of its radioactive disintegration.
Eutrophication makes lakes decline, and they accumu-
late sludge (silt or sapropel), lake shores get covered with
excess vegetation and, consequently, all this causes a
serious ecological problem [4]. These processes are espe-
cially typical in case of small lakes. In Lithuania there is
about 1 billion m3 of pure sapropel which lies mostly in
1–2 m thick layers but in some places layers are up to 5 m,
and there is about 6 billion m3 of sapropel in mixture with
other sediments. About 4.5 billion m3 of sapropel underlie
the peat layer of lacustrine swamps [5].
It is known that sapropel from lakes in Lithuania may be
extensively used in agriculture (as bio-compost, growth
stimulator for vegetation, fertilizer and forage additive), in
industry (for diluents, binders in panel production) and in
medicine (as curative mud, bio-preparations and masks),
B. Luksien _e (&) � E. Maceika � N. Tarasiuk � E. Koviazina �V. Filistovic � S. Buivydas � A. Puzas
State Research Institute Center for Physical Sciences and
Technology, Savanoriu Ave. 231, 02300 Vilnius, Lithuania
e-mail: [email protected]
123
J Radioanal Nucl Chem (2014) 300:277–286
DOI 10.1007/s10967-014-3026-0
but it is indispensable to carry out an extensive analysis of
sapropel before starting to use it [4, 5].
Lake sediments as well as soil cores are an important tool
for reconstructing artificial radionuclide depositional trends in
order to determine changes in local, regional, and global
radionuclide fluxes to the environment. Modeling of the
regional and global effects of radionuclides from these
emission sources and migration properties is based on data
from sediment and soil cores. Furthermore, considering a
probability of sapropel use in agriculture, plutonium and ra-
diocesium investigations in this medium and in soil are of
great relevance from the point of view of radiation protection.
The aim of the present study was to investigate the vertical
profiles of 239,240Pu and 238Pu activity concentrations in lake
sediments as well as in flooded soil and upland forest soil, to
compare distribution of plutonium activity concentration and
inventory in studied profiles with those of 137Cs and, based on
experimental results, to identify the Pu and 137Cs origin in
studied compartments.
Materials and methods
Sampling area
Eutrophic Lake Juodis (54�4604900 N, 25�2602900 E) was
chosen to study the plutonium and radiocesium vertical
distribution in sediment core samples. Lake Juodis (tunnel
Fig. 1 A map of the studied
area with sampling sites:
(a) filled square upland soil
sampling site; (b) filled circle
sediment sampling site; (c) filled
square flooded soil sampling
site
278 J Radioanal Nucl Chem (2014) 300:277–286
123
valley lake, groove type) is located 17 km to the northeast
from Vilnius city (Fig. 1). Its inflows reach their maximum
values of *80 L s-1 in spring, while in summer after rains
they vary in the range of 20–30 L s-1, and during dry periods
they may decrease down to 7–10 L s-1. It has no other
groundwater feeding sources. Banks of the lake are rush-
grown, with large marshy zones. The southern part of the
lake is wider and deeper (up to 3.5 m depth). The northern
one is a shallow bottom terrace (depth *1.0–1.6 m). The
surface area of the lake is equal to 0.1 km2, the drainage
basin -3.5 km2, hydraulic retention time—0.3 year [6].
The typical amount of dry material in the surface layer of
the sapropelic type sediments in Lake Juodis varies in the
range of 23–30 g L-1. The thickness of the sediment layer in
the northern shallow part of the lake was evaluated to be
about 5–7 m. The mineral content of the surface water is
maximum in winter (*174 mg L-1). The organic matter
content of sediments was assessed to be very high (mean
68.8 %). Earlier studies [6] showed that sedimentation in the
lake was mainly affected by the vital cycle of green algae.
Photosynthetic activity of the algae in the northern shallow
part of the lake under permanent aerobic conditions induced
formation of carbonate deposits, which proved to be a barrier
for radiocesium migration. In the deeper southern part of the
lake, radiocesium migration takes place under natural con-
ditions related to the formation of the anaerobic zone in the
near-bottom water in winter.
Sampling and gamma spectrometry
A sediment core was taken on 4 July 2012 in the profundal
southern part of Lake Juodis using an improved version of
the Ekman–Birge type sampler (*40-cm height). It was a
steel tubing with a square cross-section (14 9 14 cm) and
had a manually operated spring bottom shutter. The sam-
pling was carried out with the weight compensation, where
an additional float controlled the depth of the sampler sank
into sediments. Sediment samples without the water layer
above the sediment surface were discarded.
A sediment core was sliced into layers of about
2–2.5 cm thickness. Considering that the sampler was not
waterproof, the slicing was conducted in shallow waters
near the bank using a special spoon to fill the plastic bottles
of standard volume and gradually moving the sampler up to
the bank. Bottles were held for some time for sediments to
settle, and real sediment volumes were determined.
The soil cores on the upland western bank of Lake
Juodis and in the dry but regularly flooded part of an old
channel connecting earlier Lakes Tapeliai and Lydekinis
(Fig. 1) were taken by stabbing a steel tube of 30 cm height
(diameter 12.5 cm) on 25 May 2012.
A sampling site adjacent to Lake Juodis was located in a
dry forestry zone. A sampling site in the old channel was
located about 30 m from the shore of Lake Tapeliai and its
surface was mainly covered with spruce and pine needles.
The channel was blocked about 40 years ago when the road
crossing it was asphalted. Part of the channel adjacent to
Lake Tapeliai soon went dry. In spring and after rains
during warm seasons, this site is flooded but over dry
periods it usually gets more dry and passable.
Sediment and soil samples were air-dried at room tem-
perature. Their weights were determined using VLV-100
scales where samples were held under thermostatic con-
ditions (in the 40–50 �C temperature range) till the con-
stant weight. Results of the organic matter content in soil
and sediment samples in this study were provided using the
loss-on-ignition (700 �C) method.
Sediment and soil samples were analyzed for 137Cs
using a CANBERRA c-spectrometric system with a HPGe
detector (model GC2520, 26.2 % relative efficiency, res-
olution—1.76 keV/1.33 MeV) according to the gamma
line at 661.62 keV of 137mBa (a daughter product of 137Cs).
Measurements were carried out in standard geometry and
calibrated at known efficiencies according to densities of
samples. Measurement errors of radiocesium activity con-
centrations in samples were evaluated by the GENIE
software program. They were less than 5 % (standard
deviation) for active samples and not larger than 15 % for
less active layers of sediment and soil cores. Activity
corrections to the sampling date were not made because
measurements were carried out shortly after the sampling.
Radiochemical method for plutonium analyte
purification and measurement
To determine plutonium analytes the sample destruction is
needed. Organic matter, which interferes with the chemical
separation, was decomposed by heating it at 550 �C
overnight and after that to 700 �C for 2 h. Samples were
spiked with 0.0125 or 0.0250 Bq 242Pu tracer (depending
on the probable plutonium activity concentration in the
sample) as a yield monitor. Acid leaching with aqua regia
and concentrated HNO3 was employed. The leachate was
filtered through a glass-fiber filter and evaporated until wet
residue. The residue was dissolved by adding concentrated
HNO3, then adjusted to the acidity of 8 mol L-1 of HNO3
by adding de-ionized water. The method of chemical sep-
aration was based on two separation column methods. An
initial separation of Pu from uranium/fission products and
other matrix elements was accomplished on a Bio RaD
AG-1X8 anion exchange column followed by the chemical
separation methods described by Talvitie [7] and Holm [8]
J Radioanal Nucl Chem (2014) 300:277–286 279
123
with small modifications. Before loading the sample solu-
tion onto the anion-exchange column, a reduction–oxida-
tion procedure with Na2SO3 and NaNO2 was performed to
convert plutonium into the tetravalent state. Sample solu-
tion was loaded onto the column, which was pre-condi-
tioned with 50 mL of 8 mol L-1 HNO3 with 0.5 g of
NaNO2. This column strongly retained Pu but had affinity
for fission products and some matrix substances. The col-
umn was washed with 80 mL of 8 mol L-1 HNO3 to
remove U, Fe and Pb from the column. Thorium was
removed with 60 mL of 10 mol L-1 HCl. After that, Pu
was eluted with 100 mL of 4 mol L-1 HCl solution with
Na2SO3 (0.6 g), where Pu(IV) was reduced to Pu(III). The
eluted Pu solution was evaporated and processed for further
purification by the extraction chromatography method [9].
Plutonium was purified using TRU and UTEVA resin
columns. The TRU resin showed preferential retention of
tetravalent actinides in a wide range of acidities. The plu-
tonium eluate from the TRU resin was prepared for elec-
trolysis. Electro-deposition was used to obtain thin layer
plutonium sources for alpha spectrometric measurement.
Plutonium was electrodeposited for 1 h under direct
0.6 A cm-2 current onto a one-side polished stainless steel
disc-electrode in sulphate medium.
The plutonium isotopic composition (238Pu and 239,240Pu)
and their amount in the samples were determined by use of
the semiconductor Alpha spectrometer OctetePlus with an
ORTEC large square (450 mm2) Si detectors (BU-020-450-
AS) with the resolution capability of 20 keV. The spectra
were analyzed applying AlphaVision and Maestro programs.
The detection limit for the counting time of 86,400 s was
about 10-3 Bq for plutonium isotopes [10, 11].
After a-spectrometric measurement, electrodeposited
plutonium was re-dissolved from discs with ultra pure
nitric acid to obtain targets suitable for the quantitative
measurements of 239Pu and 240Pu by Inductively Coupled
Plasma Mass Spectrometer (ICP-MS). Noticeable, that
usage of analytical grade HNO3 for this purpose is not
suitable. Pu removal from the discs was controlled by the
measurement of the discs a-spectrometrically.
The mass spectrometric (ICP-MS) analysis was applied to
determine 239Pu and 240Pu at trace or ultra trace levels. The
measurement was performed with a double focusing high
resolution sector field ICP-MS Element 2 (Thermo Fischer
Scientific) with a conical U-Series nebulizer of 1 mL min-1
(Glass Expansion). The conditions of the measurements
were as follows: the forward power—1,100 W; the auxiliary
gas flow rate—0.75 L min-1; the nebulizer gas flow rate—
1.32 L min-1 and the cooling gas flow rate—14.0 L min-1.
The solution uptake rate with a peristaltic pump was
0.70 mL min-1. Prior to the analysis the instrument was
calibrated using a 2 ng g-1 natural uranium solution and was
tuned for the best sensitivity [12, 13].
Results and discussion
Plutonium isotope activity concentrations, their ratios
and inventories
Plutonium isotopes in Lake Juodis sediments
The investigation of anthropogenic plutonium in lake bot-
tom sediments is of great importance since they constitute
the major depositories of this kind of contaminants.
Based on 239,240Pu inventory values in sediment layers
(Table 1) we can observe rather high inventory of pluto-
nium isotopes in each sediment/sapropel layer in the pro-
fundal zone (approximately 3.0 m water depth) of the lake.
Inventory of 239,240Pu of *104.3 Bq m-2 was rather
high compared to the inventory range of 5.14–31.6 Bq m-2
in the sediment cores from four lakes in NW Greenland
(76�330 N, 68�540 W) [14]. Sources of plutonium isotopes
include airborne particulates from nuclear weapon testing
or accidental releases. Artificial radionuclides are deposited
on land or water. Radionuclides deposited on land may also
enter water bodies due to soil erosion and run-off processes
folowed by their accumulation in lake sediments. For
instance, forest canopies are very efficient in the initial
Table 1 Activity concentrations and inventories of 239,240Pu in sed-
iment layers of Lake Juodis in 2012
Thickness of sediment
layer (cm)
Activity
concentration ± r(Bq kg-1)
Inventory
(Bq m-2)
0–1.2 1.54 ± 0.15 0.50
1.2–3.0 1.82 ± 0.16 0.95
3.0–4.8 1.86 ± 0.18 0.94
4.8–6.7 1.70 ± 0.13 0.88
6.7–8.7 3.38 ± 0.28 1.64
8.7–10.5 3.86 ± 0.29 1.79
10.5–12.4 5.12 ± 0.37 2.76
12.4–14.6 7.93 ± 0.65 4.70
14.6–16.5 9.50 ± 0.72 4.90
16.5–18.6 15.70 ± 1.22 9.20
18.6–20.7 16.30 ± 1.23 9.52
20.7–22.3 23.70 ± 1.97 10.41
22.3–23.7 25.00 ± 2.48 14.03
23.7–25.7 22.80 ± 3.04 9.95
25.7–27.8 22.04 ± 1.71 7.19
27.8–29.6 14.07 ± 1.07 12.47
29.6–31.8 9.20 ± 0.73 5.57
31.8–33.8 6.69 ± 0.53 3.58
33.8–35.4 3.86 ± 0.29 1.74
35.4–37.5 1.90 ± 0.16 1.10
37.5–40 0.78 ± 0.08 0.48
Mean: 9.46 ± 0.83 Total: 104.3
280 J Radioanal Nucl Chem (2014) 300:277–286
123
interception of radioactive materials from the contaminated
air [15]. In general, understanding the fate of plutonium
isotopes released to the aquatic environment through the
global fallout, planned disposal and accidents meets con-
siderable difficulties because this radionuclide can exist in
several oxidation states at the same time. In particular, the
concentration of plutonium is significantly influenced by
anoxicity and redox cycles. The oxygen-depleted and iron-
and manganese-rich bottom waters contain dissolved Pu 5
times more than oxygenated surface waters [16].
Usually, the 238Pu/239,240Pu activity concentration ratio
was used to determine the radionuclide origin in soil. For the
Chernobyl accident, based on UNSCEAR (2000) estima-
tions [17] of releases, the 238Pu/239,240Pu activity concen-
tration ratio corrected to January 2006 was 0.392 ± 0.068.
The isotopic composition of Pu (especially the 240Pu/239Pu
ratio) proved to be useful for identifying radioactive pollu-
tion sources, because the 240Pu/239Pu ratios significantly
vary among different sources. For instance, the isotopic ratio
of 240Pu/239Pu in weapon-grade Pu is typically around 0.05,
while that of global fallout is about 0.18 [18], and the debris
of the Chernobyl accident had a ratio of about 0.4 [19]. The238Pu/239,240Pu activity concentration ratio typical values,
which were found to be 0.026 [20], 0.03 [21], 0.041 [22] and
0.046–0.061 [23] in soils, indicated that in studied areas
plutonium deposition was caused by atmospheric nuclear
tests.
Results of investigations of plutonium distribution in
sediments of various lakes have shown that in most lakes
the plutonium origin according to the mean isotopic240Pu/239Pu ratio value of 0.18 [24, 25] or 238Pu/239,240Pu
activity concentration ratio value of 0.026 [14] was
attributed to the global fallout with the exception of Lake
Chenghai in SW China [26].
Ketterer et al. [27] testing forest soils and peat bogs
determined that the 241Pu/239Pu isotopic ratio was more
sensitive than 240Pu/239Pu isotopic ratio or 238Pu/239?240Pu
activity concentration ratio when detecting small Cher-
nobyl 239?240Pu inputs.
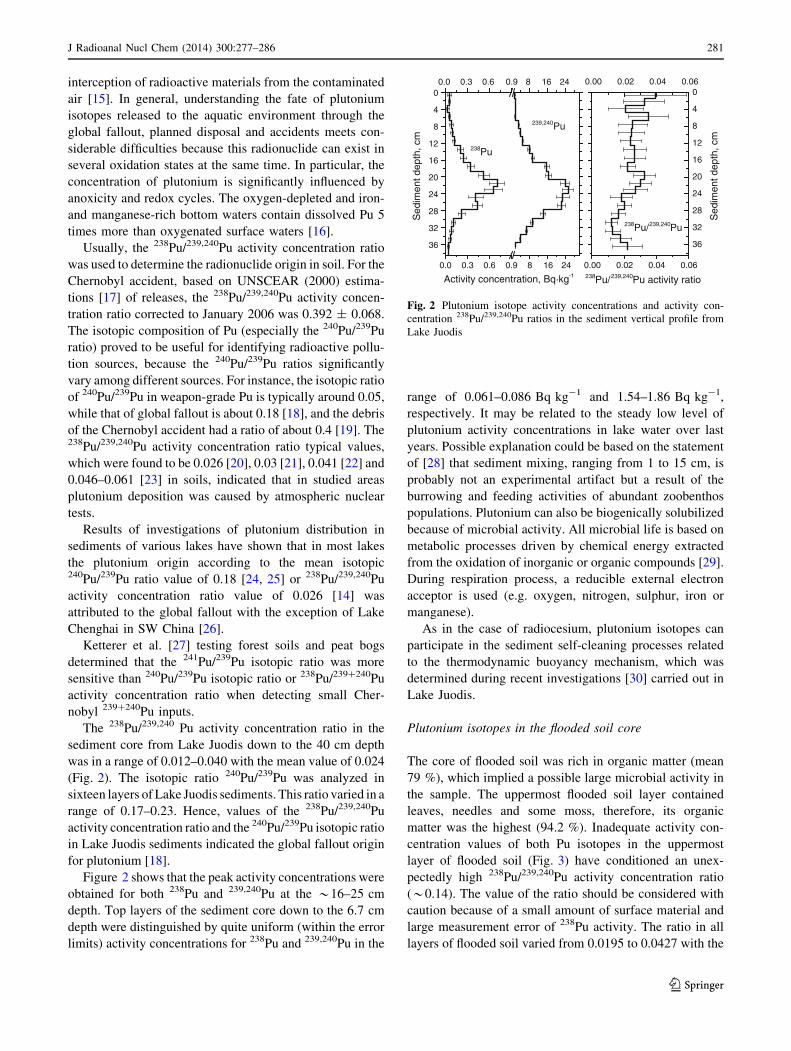
The 238Pu/239,240 Pu activity concentration ratio in the
sediment core from Lake Juodis down to the 40 cm depth
was in a range of 0.012–0.040 with the mean value of 0.024
(Fig. 2). The isotopic ratio 240Pu/239Pu was analyzed in
sixteen layers of Lake Juodis sediments. This ratio varied in a
range of 0.17–0.23. Hence, values of the 238Pu/239,240Pu
activity concentration ratio and the 240Pu/239Pu isotopic ratio
in Lake Juodis sediments indicated the global fallout origin
for plutonium [18].
Figure 2 shows that the peak activity concentrations were
obtained for both 238Pu and 239,240Pu at the *16–25 cm
depth. Top layers of the sediment core down to the 6.7 cm
depth were distinguished by quite uniform (within the error
limits) activity concentrations for 238Pu and 239,240Pu in the
range of 0.061–0.086 Bq kg-1 and 1.54–1.86 Bq kg-1,
respectively. It may be related to the steady low level of
plutonium activity concentrations in lake water over last
years. Possible explanation could be based on the statement
of [28] that sediment mixing, ranging from 1 to 15 cm, is
probably not an experimental artifact but a result of the
burrowing and feeding activities of abundant zoobenthos
populations. Plutonium can also be biogenically solubilized
because of microbial activity. All microbial life is based on
metabolic processes driven by chemical energy extracted
from the oxidation of inorganic or organic compounds [29].
During respiration process, a reducible external electron
acceptor is used (e.g. oxygen, nitrogen, sulphur, iron or
manganese).
As in the case of radiocesium, plutonium isotopes can
participate in the sediment self-cleaning processes related
to the thermodynamic buoyancy mechanism, which was
determined during recent investigations [30] carried out in
Lake Juodis.
Plutonium isotopes in the flooded soil core
The core of flooded soil was rich in organic matter (mean
79 %), which implied a possible large microbial activity in
the sample. The uppermost flooded soil layer contained
leaves, needles and some moss, therefore, its organic
matter was the highest (94.2 %). Inadequate activity con-
centration values of both Pu isotopes in the uppermost
layer of flooded soil (Fig. 3) have conditioned an unex-
pectedly high 238Pu/239,240Pu activity concentration ratio
(*0.14). The value of the ratio should be considered with
caution because of a small amount of surface material and
large measurement error of 238Pu activity. The ratio in all
layers of flooded soil varied from 0.0195 to 0.0427 with the
0.0 0.3 0.6 0.9 8 16 24
36
32
28
24
20
16
12
8
4
0
239,240Pu
238Pu
Sed
imen
t dep
th, c
m
Activity concentration, Bq·kg-1
0.00 0.02 0.04 0.06
0.0 0.3 0.6 0.9 8 16 24 0.00 0.02 0.04 0.06
36
32
28
24
20
16
12
8
4
0
Sed
imen
t dep
th, c
m
238Pu/239,240Pu activity ratio
238Pu/239,240Pu
Fig. 2 Plutonium isotope activity concentrations and activity con-
centration 238Pu/239,240Pu ratios in the sediment vertical profile from
Lake Juodis
J Radioanal Nucl Chem (2014) 300:277–286 281
123
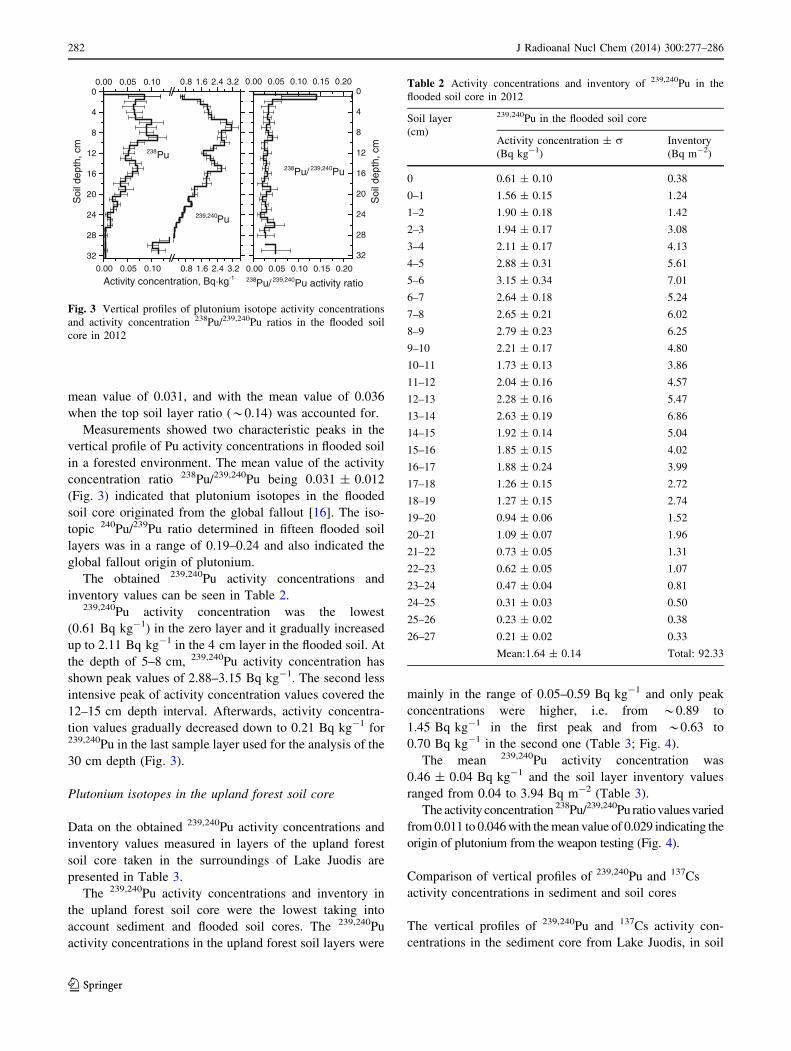
mean value of 0.031, and with the mean value of 0.036
when the top soil layer ratio (*0.14) was accounted for.
Measurements showed two characteristic peaks in the
vertical profile of Pu activity concentrations in flooded soil
in a forested environment. The mean value of the activity
concentration ratio 238Pu/239,240Pu being 0.031 ± 0.012
(Fig. 3) indicated that plutonium isotopes in the flooded
soil core originated from the global fallout [16]. The iso-
topic 240Pu/239Pu ratio determined in fifteen flooded soil
layers was in a range of 0.19–0.24 and also indicated the
global fallout origin of plutonium.
The obtained 239,240Pu activity concentrations and
inventory values can be seen in Table 2.239,240Pu activity concentration was the lowest
(0.61 Bq kg-1) in the zero layer and it gradually increased
up to 2.11 Bq kg-1 in the 4 cm layer in the flooded soil. At
the depth of 5–8 cm, 239,240Pu activity concentration has
shown peak values of 2.88–3.15 Bq kg-1. The second less
intensive peak of activity concentration values covered the
12–15 cm depth interval. Afterwards, activity concentra-
tion values gradually decreased down to 0.21 Bq kg-1 for239,240Pu in the last sample layer used for the analysis of the
30 cm depth (Fig. 3).
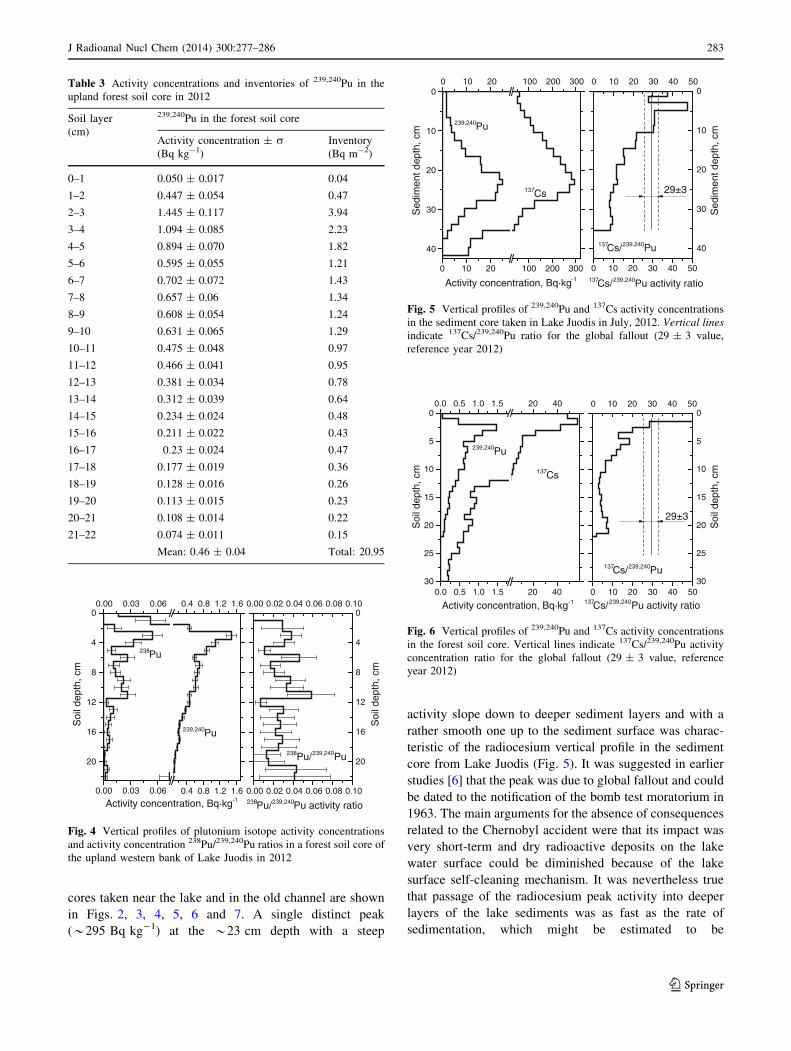
Plutonium isotopes in the upland forest soil core
Data on the obtained 239,240Pu activity concentrations and
inventory values measured in layers of the upland forest
soil core taken in the surroundings of Lake Juodis are
presented in Table 3.
The 239,240Pu activity concentrations and inventory in
the upland forest soil core were the lowest taking into
account sediment and flooded soil cores. The 239,240Pu
activity concentrations in the upland forest soil layers were
mainly in the range of 0.05–0.59 Bq kg-1 and only peak
concentrations were higher, i.e. from *0.89 to
1.45 Bq kg-1 in the first peak and from *0.63 to
0.70 Bq kg-1 in the second one (Table 3; Fig. 4).
The mean 239,240Pu activity concentration was
0.46 ± 0.04 Bq kg-1 and the soil layer inventory values
ranged from 0.04 to 3.94 Bq m-2 (Table 3).
The activity concentration 238Pu/239,240Pu ratio values varied
from 0.011 to 0.046 with the mean value of 0.029 indicating the
origin of plutonium from the weapon testing (Fig. 4).
Comparison of vertical profiles of 239,240Pu and 137Cs
activity concentrations in sediment and soil cores
The vertical profiles of 239,240Pu and 137Cs activity con-
centrations in the sediment core from Lake Juodis, in soil
32
28
24
20
16
12
8
4
0
239,240Pu
238Pu
Soi
l dep
th, c
m
Activity concentration, Bq·kg-10.00 0.05 0.10 0.8 1.6 2.4 3.2 0.00 0.05 0.10 0.15 0.20
0.00 0.05 0.10 0.8 1.6 2.4 3.2 0.00 0.05 0.10 0.15 0.20
32
28
24
20
16
12
8
4
0
Soi
l dep
th, c
m
238Pu/ 239,240Pu activity ratio
238Pu/ 239,240Pu
Fig. 3 Vertical profiles of plutonium isotope activity concentrations
and activity concentration 238Pu/239,240Pu ratios in the flooded soil
core in 2012
Table 2 Activity concentrations and inventory of 239,240Pu in the
flooded soil core in 2012
Soil layer
(cm)
239,240Pu in the flooded soil core
Activity concentration ± r(Bq kg-1)
Inventory
(Bq m-2)
0 0.61 ± 0.10 0.38
0–1 1.56 ± 0.15 1.24
1–2 1.90 ± 0.18 1.42
2–3 1.94 ± 0.17 3.08
3–4 2.11 ± 0.17 4.13
4–5 2.88 ± 0.31 5.61
5–6 3.15 ± 0.34 7.01
6–7 2.64 ± 0.18 5.24
7–8 2.65 ± 0.21 6.02
8–9 2.79 ± 0.23 6.25
9–10 2.21 ± 0.17 4.80
10–11 1.73 ± 0.13 3.86
11–12 2.04 ± 0.16 4.57
12–13 2.28 ± 0.16 5.47
13–14 2.63 ± 0.19 6.86
14–15 1.92 ± 0.14 5.04
15–16 1.85 ± 0.15 4.02
16–17 1.88 ± 0.24 3.99
17–18 1.26 ± 0.15 2.72
18–19 1.27 ± 0.15 2.74
19–20 0.94 ± 0.06 1.52
20–21 1.09 ± 0.07 1.96
21–22 0.73 ± 0.05 1.31
22–23 0.62 ± 0.05 1.07
23–24 0.47 ± 0.04 0.81
24–25 0.31 ± 0.03 0.50
25–26 0.23 ± 0.02 0.38
26–27 0.21 ± 0.02 0.33
Mean:1.64 ± 0.14 Total: 92.33
282 J Radioanal Nucl Chem (2014) 300:277–286
123
cores taken near the lake and in the old channel are shown
in Figs. 2, 3, 4, 5, 6 and 7. A single distinct peak
(*295 Bq kg-1) at the *23 cm depth with a steep
activity slope down to deeper sediment layers and with a
rather smooth one up to the sediment surface was charac-
teristic of the radiocesium vertical profile in the sediment
core from Lake Juodis (Fig. 5). It was suggested in earlier
studies [6] that the peak was due to global fallout and could
be dated to the notification of the bomb test moratorium in
1963. The main arguments for the absence of consequences
related to the Chernobyl accident were that its impact was
very short-term and dry radioactive deposits on the lake
water surface could be diminished because of the lake
surface self-cleaning mechanism. It was nevertheless true
that passage of the radiocesium peak activity into deeper
layers of the lake sediments was as fast as the rate of
sedimentation, which might be estimated to be
0.00 0.03 0.06 0.4 0.8 1.2 1.6
20
16
12
8
4
00.00 0.03 0.06 0.4 0.8 1.2 1.6
239,240Pu
238Pu
Soi
l dep
th, c
m
Activity concentration, Bq·kg-10.00 0.02 0.04 0.06 0.08 0.10
0.00 0.02 0.04 0.06 0.08 0.10
20
16
12
8
4
0
Soi
l dep
th, c
m
238Pu/239,240Pu activity ratio
238Pu/239,240Pu
Fig. 4 Vertical profiles of plutonium isotope activity concentrations
and activity concentration 238Pu/239,240Pu ratios in a forest soil core of
the upland western bank of Lake Juodis in 2012
0 10 20 100 200 300
40
30
20
10
00 10 20 100 200 300
29±3
239,240Pu
137Cs
Sed
imen
t dep
th, c
m
Activity concentration, Bq·kg-1
0 10 20 30 40 50
0 10 20 30 40 50
40
30
20
10
0
Sed
imen
t dep
th, c
m
137Cs/239,240Pu activity ratio
137Cs/239,240Pu
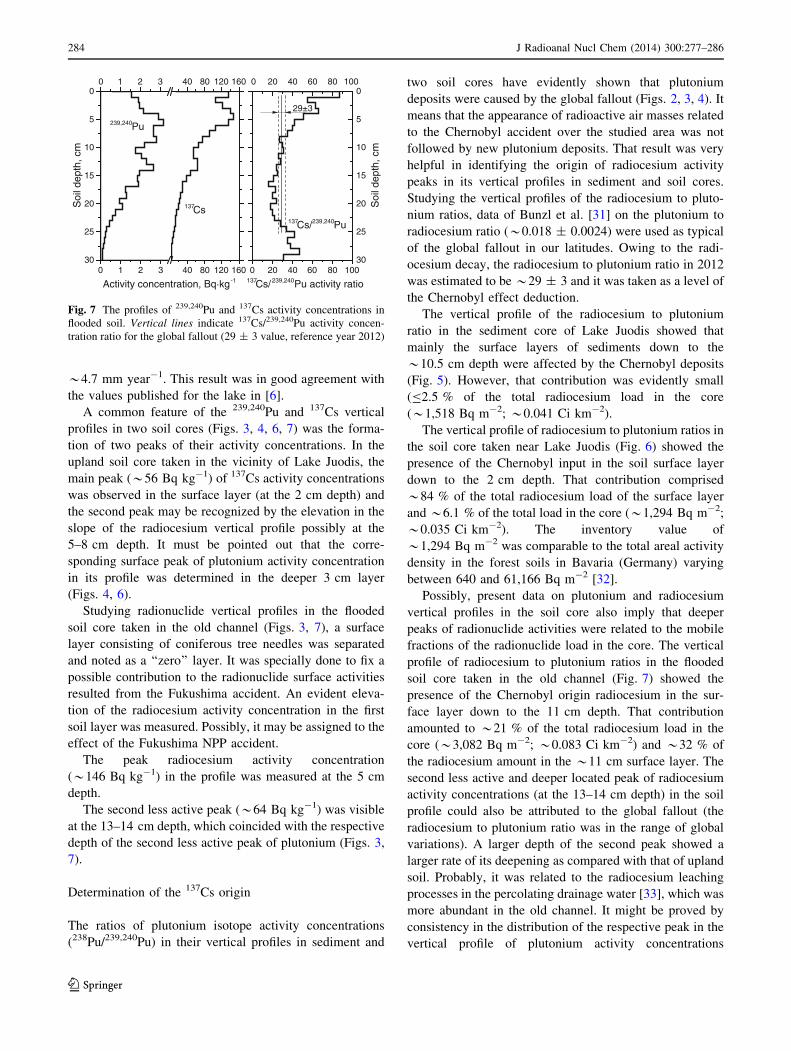
Fig. 5 Vertical profiles of 239,240Pu and 137Cs activity concentrations
in the sediment core taken in Lake Juodis in July, 2012. Vertical lines
indicate 137Cs/239,240Pu ratio for the global fallout (29 ± 3 value,
reference year 2012)
0.0 0.5 1.0 1.5 20 4030
25
20
15
10
5
00.0 0.5 1.0 1.5 20 40
29±3
239,240Pu
137Cs
Soi
l dep
th, c
m
Activity concentration, Bq·kg-1
0 10 20 30 40 50
0 10 20 30 40 50
30
25
20
15
10
5
0
Soi
l dep
th, c
m
137Cs/239,240Pu activity ratio
137Cs/239,240Pu
Fig. 6 Vertical profiles of 239,240Pu and 137Cs activity concentrations
in the forest soil core. Vertical lines indicate 137Cs/239,240Pu activity
concentration ratio for the global fallout (29 ± 3 value, reference
year 2012)
Table 3 Activity concentrations and inventories of 239,240Pu in the
upland forest soil core in 2012
Soil layer
(cm)
239,240Pu in the forest soil core
Activity concentration ± r(Bq kg-1)
Inventory
(Bq m-2)
0–1 0.050 ± 0.017 0.04
1–2 0.447 ± 0.054 0.47
2–3 1.445 ± 0.117 3.94
3–4 1.094 ± 0.085 2.23
4–5 0.894 ± 0.070 1.82
5–6 0.595 ± 0.055 1.21
6–7 0.702 ± 0.072 1.43
7–8 0.657 ± 0.06 1.34
8–9 0.608 ± 0.054 1.24
9–10 0.631 ± 0.065 1.29
10–11 0.475 ± 0.048 0.97
11–12 0.466 ± 0.041 0.95
12–13 0.381 ± 0.034 0.78
13–14 0.312 ± 0.039 0.64
14–15 0.234 ± 0.024 0.48
15–16 0.211 ± 0.022 0.43
16–17 0.23 ± 0.024 0.47
17–18 0.177 ± 0.019 0.36
18–19 0.128 ± 0.016 0.26
19–20 0.113 ± 0.015 0.23
20–21 0.108 ± 0.014 0.22
21–22 0.074 ± 0.011 0.15
Mean: 0.46 ± 0.04 Total: 20.95
J Radioanal Nucl Chem (2014) 300:277–286 283
123
*4.7 mm year-1. This result was in good agreement with
the values published for the lake in [6].
A common feature of the 239,240Pu and 137Cs vertical
profiles in two soil cores (Figs. 3, 4, 6, 7) was the forma-
tion of two peaks of their activity concentrations. In the
upland soil core taken in the vicinity of Lake Juodis, the
main peak (*56 Bq kg-1) of 137Cs activity concentrations
was observed in the surface layer (at the 2 cm depth) and
the second peak may be recognized by the elevation in the
slope of the radiocesium vertical profile possibly at the
5–8 cm depth. It must be pointed out that the corre-
sponding surface peak of plutonium activity concentration
in its profile was determined in the deeper 3 cm layer
(Figs. 4, 6).
Studying radionuclide vertical profiles in the flooded
soil core taken in the old channel (Figs. 3, 7), a surface
layer consisting of coniferous tree needles was separated
and noted as a ‘‘zero’’ layer. It was specially done to fix a
possible contribution to the radionuclide surface activities
resulted from the Fukushima accident. An evident eleva-
tion of the radiocesium activity concentration in the first
soil layer was measured. Possibly, it may be assigned to the
effect of the Fukushima NPP accident.
The peak radiocesium activity concentration
(*146 Bq kg-1) in the profile was measured at the 5 cm
depth.
The second less active peak (*64 Bq kg-1) was visible
at the 13–14 cm depth, which coincided with the respective
depth of the second less active peak of plutonium (Figs. 3,
7).
Determination of the 137Cs origin
The ratios of plutonium isotope activity concentrations
(238Pu/239,240Pu) in their vertical profiles in sediment and
two soil cores have evidently shown that plutonium
deposits were caused by the global fallout (Figs. 2, 3, 4). It
means that the appearance of radioactive air masses related
to the Chernobyl accident over the studied area was not
followed by new plutonium deposits. That result was very
helpful in identifying the origin of radiocesium activity
peaks in its vertical profiles in sediment and soil cores.
Studying the vertical profiles of the radiocesium to pluto-
nium ratios, data of Bunzl et al. [31] on the plutonium to
radiocesium ratio (*0.018 ± 0.0024) were used as typical
of the global fallout in our latitudes. Owing to the radi-
ocesium decay, the radiocesium to plutonium ratio in 2012
was estimated to be *29 ± 3 and it was taken as a level of
the Chernobyl effect deduction.
The vertical profile of the radiocesium to plutonium
ratio in the sediment core of Lake Juodis showed that
mainly the surface layers of sediments down to the
*10.5 cm depth were affected by the Chernobyl deposits
(Fig. 5). However, that contribution was evidently small
(B2.5 % of the total radiocesium load in the core
(*1,518 Bq m-2; *0.041 Ci km-2).
The vertical profile of radiocesium to plutonium ratios in
the soil core taken near Lake Juodis (Fig. 6) showed the
presence of the Chernobyl input in the soil surface layer
down to the 2 cm depth. That contribution comprised
*84 % of the total radiocesium load of the surface layer
and *6.1 % of the total load in the core (*1,294 Bq m-2;
*0.035 Ci km-2). The inventory value of
*1,294 Bq m-2 was comparable to the total areal activity
density in the forest soils in Bavaria (Germany) varying
between 640 and 61,166 Bq m-2 [32].
Possibly, present data on plutonium and radiocesium
vertical profiles in the soil core also imply that deeper
peaks of radionuclide activities were related to the mobile
fractions of the radionuclide load in the core. The vertical
profile of radiocesium to plutonium ratios in the flooded
soil core taken in the old channel (Fig. 7) showed the
presence of the Chernobyl origin radiocesium in the sur-
face layer down to the 11 cm depth. That contribution
amounted to *21 % of the total radiocesium load in the
core (*3,082 Bq m-2; *0.083 Ci km-2) and *32 % of
the radiocesium amount in the *11 cm surface layer. The
second less active and deeper located peak of radiocesium
activity concentrations (at the 13–14 cm depth) in the soil
profile could also be attributed to the global fallout (the
radiocesium to plutonium ratio was in the range of global
variations). A larger depth of the second peak showed a
larger rate of its deepening as compared with that of upland
soil. Probably, it was related to the radiocesium leaching
processes in the percolating drainage water [33], which was
more abundant in the old channel. It might be proved by
consistency in the distribution of the respective peak in the
vertical profile of plutonium activity concentrations
0 1 2 3 40 80 120 16030
25
20
15
10
5
00 1 2 3 40 80 120 160
29±3
239,240Pu
137CsSoi
l dep
th, c
m
Activity concentration, Bq·kg-1
0 20 40 60 80 100
0 20 40 60 80 100
30
25
20
15
10
5
0
Soi
l dep
th, c
m
137Cs/239,240Pu activity ratio
137Cs/239,240Pu
Fig. 7 The profiles of 239,240Pu and 137Cs activity concentrations in
flooded soil. Vertical lines indicate 137Cs/239,240Pu activity concen-
tration ratio for the global fallout (29 ± 3 value, reference year 2012)
284 J Radioanal Nucl Chem (2014) 300:277–286
123
(Figs. 3, 7). Equal rates of deepening in soil of different
radionuclides were also established earlier [34]. In the case
of the former soil core taken in the upland site on the
western bank of Lake Juodis, radionuclide leaching pro-
cesses might be only because of precipitation, which
determined lower rates of deepening of smaller radionu-
clide activity peaks. One of the striking features of the
vertical profile of the radiocesium to plutonium ratio in the
flooded soil core from the old channel (Fig. 7) was
appearance of the ratio values exceeding the global fallout
ones (and their variation limits) at the bottom of the core.
It might be suggested that leaching processes in the
percolating water of radiocesium of the Chernobyl origin
were more intensive and induced the formation of a more
mobile radiocesium fraction. It was known [31] that radi-
ocesium was more mobile in deeper soil layers due to an
increase of its exchangeable fractions with depth. Conse-
quently, this needs further studies. A noticeable increase in
the ratio values might also be seen in the respective data in
the forest soil core (Fig. 6). However, plutonium mea-
surements in the core were carried out only down to the
22 cm depth (Figs. 4, 6).
In general, this study of plutonium isotopes and 137Cs
provided an additional information on their vertical dis-
tributions in lake sediments and soil. Hereafter, it would be
very useful to examine radionuclide mobility dependence
on various geophysical and geochemical factors in more
detail.
Conclusions
Results of investigation of plutonium isotopes and 137Cs in
three different environmental systems showed a differing
radionuclide distribution in sampled cores.
Vertical profiles of plutonium activity concentrations in
the studied soil cores were determined to be formed
because of the global fallout and included two peaks. The
most intensive peaks were formed in the soil surface layers
at the 3–5 and *4–10 cm depth in the cores of the upland
and flooded soil samples, respectively. The less active
plutonium peaks were formed owing to the supposed more
mobile radionuclide fraction in deeper layers (at the
7–10 cm and at the 12–17 cm depth in the cores of the
upland and the flooded soil samples, respectively).238Pu/239,240Pu activity concentration and isotopic240Pu/239Pu ratios have shown that the global fallout from
nuclear weapons testing was the main Pu contamination
source in the studied environmental systems.
Vertical profiles of radiocesium activity concentrations
in the studied soil cores were formed as a result of the
global fallout with the additional impact of the Chernobyl
deposits. These profiles also included two peaks. The most
intensive peaks were formed in the soil surface and rep-
resented a sum of Chernobyl and global fallout deposits.
Chernobyl impacts were observed down to the *2 cm
depth and down to the *11 cm depth in the upland and the
flooded soil cores, respectively. The contribution of the
Chernobyl deposits amounted to *20.9 % and *6.11 %
of the total radiocesium inventory in the old channel
(*3,082 Bq m-2) and the upland soil (*1,294 Bq m-2)
cores, respectively. Due to Chernobyl deposits, a common
most intensive radiocesium peak in the vertical profile of
the upland soil core was also shifted to the 2 cm layer
while a component related to global fallout peaks at the
*2.6 cm depth. Less intensive peaks of radiocesium
activity were also caused by the global fallout and were
observed at larger depths (at the 5–8 cm and 13–14 cm
depth in the upland and in the flooded soil cores, respec-
tively). Probably, these results were mainly related to dif-
ferent radionuclide leaching effects in percolating drainage
waters in both cases.
The single peak at the *17–26 cm depth was charac-
teristic of vertical profiles of plutonium and radiocesium
activity concentrations in Lake Juodis sediments. For both
radionuclides, those peaks were induced by the global
fallout. The depths of peaks were dependent on the rate of
sedimentation (*4.7 mm year-1). Effects of the Cher-
nobyl deposits in the radiocesium vertical profile were
observable down to the *10.5 cm depth and the contri-
bution of that component makes up *2.26 % of the total
radiocesium inventory of the sediment core.
Besides, the inventory of studied radionuclides in the
sediment-sapropelic deposits in Lake Juodis was rather
high (104.3 Bq m-2 for 239,240Pu and *1,518 Bq m-2 for137Cs). Therefore, from the radiological point of view, it
would be harmful to use sapropel from the lake for agri-
cultural needs.
Acknowledgments This research was funded by a Grant (No. MIP-
041/2012) from the Research Council of Lithuania. We also wish to
acknowledge the helpful comments and suggestions of the editors and
of two anonymous referees.
References
1. Toribio M, Garcıa JF, Rauret G, Pilvio R, Bicke M (2001) Anal
Chim Acta 447:179
2. Cooper LW, Kelley JM, Bond LA, Orlandini KA, Grebmeier JM
(2000) Mar Chem 69:253
3. Varga Z (2007) Anal Bioanal Chem 389:725
4. Kozlovska-Kedziora J, Petraitis E, Valancius K, Grabas K (2011)
In: Cygas D, Froehner KD (eds) Environmental Engineering,
Vilnius Gediminas Technical University Press ‘‘Technika’’ http://
leidykla.vgtu.lt/conferences/Enviro2011/Articles/1/169_173_Ked
ziora_others.pdf. Accessed 27 Jan 2014
5. Liuzinas R, Jankevicius K, Salkauskas M (2005) Ann Geo-
graphicae (Vilnius, Lithuania) 38:44
J Radioanal Nucl Chem (2014) 300:277–286 285
123
6. Tarasiuk N, Koviazina E, Kubarevicien _e V, Shliahtich E (2007) J
Environ Radioact 93:100
7. Talvitie NA (1971) Anal Chem 43:1827
8. Holm E (1984) Int J Appl Rad Isot 35:285
9. Horwitz EP, Dietz ML, Chiarizia R, Diamond H, Maxwell SL III,
Nelson MR (1995) Anal Chim Acta 310:63
10. Luksien _e B, Druteikien _e R, Gvozdait _e R, Gudelis A (2006) J
Environ Radioact 87:305
11. Druteikien _e R, Morkunien _e R, Luksien _e B (2011) Lithuanian J
Phys 51:75
12. Puzas A, Remeikis V, Ezerinskis Z, Serapinas P, Plukis A,
Duskesas G (2010) Lith J Phys 50(4):445
13. Plukien _e R, Plukis A, Puzas A, Remeikis V, Duskesas G, Ger-
manas D (2011) Progr Nucl Sci Technol 2:421
14. Eriksson M, Holm E, Roos P, Dahlgaard H (2004) J Environ
Radioact 75:285
15. Kruse-Irmer S, Giani L (2003) J Plant Nutr Soil Sci 166:635
16. Sholkovitz ER, Carey AE, Cochran JK (1982) Nature 300:159
17. UNSCEAR (2000) Sources, effects and risks of ionizing radia-
tion, Annex J: Exposures and effects of the Chernobyl accident,
United Nations, New York. http://www.unscear.org/docs/reports/
2000/VolumeII_Effects/AnnexJ_pages451-566.pdf. Accessed 01
Mar 2010
18. Koide M, Bertine KK, Chow TJ, Goldberg ED (1985) Earth
Planet Sci Lett 72:1
19. Muramatsu Y, Uchida S, Tagami K, Yoshida S, Fujikawa T
(1999) J Anal At Spectrom 14:859
20. Lehto J, Vaaramaa K, Leskinen A (2013) J Environ Radioact
116:124
21. Antovic NM, Vukotic P, Svrkota N, Andrukhovich SK (2012) J
Environ Radioact 110:90
22. Holgye Z, Schlesingerova E, Tecl J, Filgas R (2004) J Environ
Radioact 71:115
23. Popov L, Mihailova G, Naidenov I (2010) J Radioanal Nucl
Chem 285:223
24. Liao H, Zheng J, Wu F, Yamada M, Tan M, Chen J (2008) Appl
Radiat Isot 66:1138
25. Ueda S, Ohtsuka Y, Kondo K, Hisamatsu S (2009) J Environ
Radioact 100:835
26. Zheng J, Liao H, Wu F, Yamada M, Fu P, Liu C, Wan G (2008) J
Radioanal Nucl Chem 275:37
27. Ketterer ME, Hafer KM, Mietelski JW (2004) J Environ Radioact
73:183
28. Robbins JA, Mudroch A, Oliver BG (1990) Can J Fisher Aquat
Sci 47:572
29. Pedersen K (2005) J Nucl Radiochem Sci 6:11
30. Tarasiuk N, Moisejenkova A, Koviazina E (2010) J Environ
Radioact 101:883
31. Bunzl K, Kracke W (1988) J Environ Radioact 8:1
32. Winkelbauer J, Volkel J, Leopold M, Hurkamp K, Dehos R
(2012) Eur J Forest Res 131:1585
33. Copplestone D, Johnson MS, Jones SR (2001) J Environ Radioact
55:93
34. Anspaugh LR, Simon SL, Gordeev KI, Likhtarev IA, Maxwell
RM, Shinkarev SM (2002) Health Phys 82:669
286 J Radioanal Nucl Chem (2014) 300:277–286
123
Related Documents