† CNRS and UPMC Sorbonne Université, 4 place Jussieu, 75005 Paris, France * International Computer Science Institute, 1947 Center St., Ste. 600, Berkeley, California, 94704 § Lawrence Berkeley National Laboratory, 1 Cyclotron Road, Berkeley, California, 94720 This work was partially funded by the National Science Foundation (NSF) through grant number CNS: 1065240 (“TC: Medium: Understanding and Managing the Impact of Global Inference on Online Privacy”). Any opinions, findings, and conclusions or recommendations expressed in this material are those of the author(s) and do not necessarily reflect the views of the National Science Foundation. On Exploiting Innocuous User Activity for Correlating Accounts Across Social Network Sites Oana Goga † , Howard Lei * , Sree Hari Krishnan Parthasarathi * , Gerald Friedland * , Robin Sommer *§ , and Renata Teixeira † TR‐12‐008 May 2012 Abstract This paper studies whether it is possible to identify accounts on different social networks that belong to the same user just by using publicly available information in a user's posts. In particular, we explore three features to capture a user's online activity: the geo‐location attached to a user's posts, the timestamp of posts, and the user's writing style as captured by language models. Our analysis, based on correlating user accounts across Yelp, Flickr, and Twitter, shows that such otherwise innocuous features can indeed enable attackers to track users across site boundaries. This result has significant privacy implications as users tend to rely on an implicit notion that social networks remain separate realms. Moreover, current privacy controls remain insufficient to contain the risk of cross‐site correlation.

Welcome message from author
This document is posted to help you gain knowledge. Please leave a comment to let me know what you think about it! Share it to your friends and learn new things together.
Transcript
† CNRS and UPMC Sorbonne Université, 4 place Jussieu, 75005 Paris, France *International Computer Science Institute, 1947 Center St., Ste. 600, Berkeley, California, 94704 § Lawrence Berkeley National Laboratory, 1 Cyclotron Road, Berkeley, California, 94720
This work was partially funded by the National Science Foundation (NSF) through grant number CNS: 1065240 (“TC: Medium: Understanding and Managing the Impact of Global Inference on Online Privacy”). Any opinions, findings, and conclusions or recommendations expressed in this material are those of the author(s) and do not necessarily reflect the views of the National Science Foundation.
On Exploiting Innocuous User Activity for Correlating Accounts Across
Social Network Sites
Oana Goga†, Howard Lei*, Sree Hari Krishnan Parthasarathi*, Gerald Friedland*, Robin Sommer*§, and Renata Teixeira†
TR‐12‐008
May 2012
Abstract
This paper studies whether it is possible to identify accounts on different social networks that belong to the same user just by using publicly available information in a user's posts. In particular, we explore three features to capture a user's online activity: the geo‐location attached to a user's posts, the timestamp of posts, and the user's writing style as captured by language models. Our analysis, based on correlating user accounts across Yelp, Flickr, and Twitter, shows that such otherwise innocuous features can indeed enable attackers to track users across site boundaries. This result has significant privacy implications as users tend to rely on an implicit notion that social networks remain separate realms. Moreover, current privacy controls remain insufficient to contain the risk of cross‐site correlation.

1. INTRODUCTIONUsers of online social networks increasingly scrutinize pri-
vacy protections as they realize the risks that sharing per-sonal content entails. Typically, however, much of the atten-tion focuses on properties pertaining to individual sites, suchas specific sharing settings Facebook o↵ers or Google’s termsof service. What users tend to miss, though, is a broaderthreat of attackers correlating personal information acrosssite boundaries. While on a per-site basis, a user may deemfine what she posts to her Facebook, Twitter, and LinkedInaccounts, she might be revealing much more than she real-izes when considering them in aggregate. As one example,a social engineering attack could first identify employees ofa victim organization on LinkedIn, and then examine theirFacebook accounts for personal background to exploit whilealso following their tweets to understand travel patterns.Indeed, we already see legitimate business models based onsuch correlation techniques, such as services o↵ering “socialmedia screening” to weed out job applicants (e.g., [1]).
In this work we set out to advance understanding of suchcorrelation attacks. In general, it is much harder to defendagainst cross-site inference than to protect personal infor-mation on individual social networks where privacy settingsdirectly control what becomes public. As combined data setscan often reveal non-obvious relationships—as prior work ondeanonymization [2] convincingly demonstrates—it remainschallenging to assess the correlation threat even for sophisti-cated users. More fundamentally, as a research communitywe lack insight into what precisely enables correlation at-tacks to succeed, along with counter-measures one can takefor protection.
To further our understanding, we pursue a case study thatexamines the initial step of any correlation attack: identify-ing accounts on di↵erent social networks that belong to thesame user. In contrast to past work, we focus on exploitingimplicit features derived from a user’s activity, rather thanleveraging information explicitly provided—and hence moreeasily controlled—such as name or date of birth. Specifi-cally, we explore matching accounts based on where, whenand what a user is posting. As it turns out, combining thesethree types of features provides attackers with a powerfultool for targeting individuals.
As our example setting, we examine account correlationacross Twitter, Flickr, and Yelp, for which we demonstratethat they provide su�cient public information for us to linkuser accounts. For our study, we deliberately choose socialnetworks where account correlation is unlikely to cause muchconcern. However, similar techniques apply to more sensi-tive targets as well, in particular to sites where users expectto remain anonymous such as on dating sites, job portals,and special-interest forums.
Furthermore, we devise a possible set of attack heuristics,yet we emphasize that our choices are far from exhaustive.We also do not strive to fully automate our attacks, butrather take the perspective of an attacker targeting a specificindividual. In that setting, identifying a small candidate setof accounts on other networks is su�cient to allow for manu-ally sifting through for the correct match. Finally, extensiveground truth is hard to come by for commercial social net-works, and we thus limit our evaluation to a reduced set ofusers for whom we can externally determine their accountrelationships.
We profile users with three implicit features of their activ-
ity: the geo-location attached to a user’s posts; the times-tamps of a user’s posts; and the user’s writing style modeledwith a probabilistic approach. After discussing our method-ology in §2, we first evaluate the potential of each of thesethree features individually to match a user’s accounts acrosssites (in §3, §4, and §5, respectively). Then, we evaluatethe improvements in accuracy that result from combiningall three features (§6). Our results show that, when avail-able, location and timestamps are powerful for correlatingaccounts across sites. Although we cannot necessarily findan exact match between a user’s accounts on two di↵erentsites, we can often narrow down to a relatively small set ofpossible matches. For example, for 70% of users for whomwe have ground truth we can match their Yelp account witha set of at most 1,000 possible accounts in Twitter, whichis small compared to the total number of Twitter accounts.For 35% of the users, this set can even be reduced to 250possible Twitter accounts.
A user’s language model is not as e↵ective by itself, butit helps further reduce the set of candidate matches whencombined with other features. Generally, we find that ourattacks work better for some users than for others, which weleverage for gaining insight into the properties that enablesuccessful correlation and, hence, for giving recommenda-tions on what users may do to undermine it.
2. METHODOLOGYOur overall goal concerns understanding how user activity
on one social network can implicitly reveal their identity onother sites. In §2.1, we first discuss features that we derivefrom user activity to build characteristic activity profiles. In§2.2 we then introduce our basic threat model: an attackerwith moderate resources targeting a specific individual. Wediscuss the data sets we use for evaluation in §2.3, and met-rics for measuring attack performance in §2.4.
2.1 FeaturesFor our case study, we choose three types of features for
building activity profiles that are present on many social net-works: location, timestamps and language characteristics.
Location: Many social networks provide location infor-mation directly in the form of geotags attached to user con-tent, potentially with high accuracy if generated by GPS-enabled devices like mobile phones. However, even with-out geotags, one can often derive locations implicitly fromposted content (e.g., when users review a place on Yelp, thatgives us an address). Furthermore, a number of online ser-vices map images and textual descriptions to locations orgeographic regions (e.g., by identifying landmarks) [3, 4, 5,6]. For our study, we use the location profile of a user, i.e.,the list of all locations associated with her posts on a specificsocial network. The intuition behind that choice is that thecombination of locations a user posts from may su�cientlyfingerprint an individual across sites.
Timestamps: Many mobile services and applications suchas Foursquare, Gowalla, and Instagram allow users to au-tomatically send content to multiple sites simultaneously.The resulting posts then have almost identical timestamps,which we can exploit to link the corresponding accounts.
Language: The natural language community has demon-strated that users tend to have characteristic writing stylesthat identify them with high confidence [7]. While thesemethods typically work best with longer texts, such as blog

posting or articles, we also examine them with shorter inputsto understand if they can contribute to correlation attackson sites such as Twitter.
2.2 Attacker ModelAs our basic threat model, we assume a targeted individ-
ual : the attacker knows the identity of his victim on onesocial network, and she wants to find further accounts else-where that belong to the same individual. More precisely,for two social networks SN1 and SN2, we assume having oneaccount a 2 SN1 and aiming to identify account b 2 SN2 sothat user(a) = user(b).
We assume that we are facing an attacker with moderateresources–e.g., with access to a small number of computersand the ability to rent further cloud services for a limitedperiod of time. For such an attacker, it is not practical tocompare the known account a with all accounts of SN2 asthat would require exhaustively crawling the target network.Hence, we assume an attack that proceeds in three steps.First, the attacker selects a subset of accounts g
SN2 ⇢ SN2
that will plausibly include b. She then measures the simi-larity between a and all the bi 2
gSN2 using an appropriate
metric (a, b) 2 SN1 ⇥
gSN2 �! s(a, b) 2 R. Finally, he
selects the account b 2 gSN2 that is most similar with a:
b := argmaxbi
2gSN2
s(a, bi),
The attack is successful if b equals b.Besides defining an appropriate metric (which we discuss
in the following sections), a successful attack requires select-
ing a candidate set gSN2 so that b 2
gSN2 while keeping its
size su�ciently small to allow for collecting features fromall of the included accounts. The key to that is selectingthe accounts in g
SN2 based on the features considered. Forexample, if the attacker aims to link accounts by their lo-cation, she may assume that users who post regularly fromwithin a certain region will most likely live there, and thustheir postings on other sites will originate there as well. Hecan then build g
SN2 by extracting all users from SN2 whohave posted from that region. Likewise, if she strives tolink accounts based on timestamps, he may select g
SN2 asthose accounts for which she finds a temporal overlap withpostings from a 2 SN1. Furthermore, one can also selectaccounts based on multiple features at once.
2.3 Data SetsFor our case study, we analyze correlation attacks with
data collected from the three social networks Flickr, Twit-ter, and Yelp. We choose these sites because of their popu-larity and because they represent di↵erent types of socialnetworks: photo sharing, micro-blogging, and service re-viewing. We note that users will not necessarily consideraccount linking across these networks as a compromise oftheir privacy; however, a similar approach would apply toother, more sensitive sites as well. In the following, we de-scribe the sets of users we select for our evaluation and theinformation we collect about them.To assess the performance of our attacks, we collect a
ground truth set of users for whom we know their accountson the three sites. We obtain this set by exploiting the“Friend Finder”mechanism present on many social network-ing sites, including the three we examine. As the Finders of-
GTActive
GTLocation
GTBayArea
Twitter 93,839 4,311 239Flickr 59,476 4,826 379Yelp 24,176 24,176 4,937
Twitter-Flickr 6,196 396 27Twitter-Yelp 2,363 342 57Flickr-Yelp 2,497 476 75
Twitter-Flickr-Yelp 569 70 8
Table 1: Number of users in the GT dataset.
ten return pages that embed HTML in extensive Javascript,we use browser automation tools (Watir and Selenuim) toextract the results. We give the Friend Finders an existinglist of 10 millions emails1 and check if the emails correspondto accounts on any of the networks. Table 1 shows the num-ber of active2 accounts we have identified for each socialnetwork, as well as the corresponding number for the inter-sections. The second column, GTLocation, shows the numberof accounts that have location information attached to atleast one post, either as geotags or, for Yelp, in the form ofaddresses.
Given the ground truth set, we could evaluate correlationattacks by directly following the attacker model discussedin §2.2: for each ground truth user, we collect correspond-ing sets g
SN2 from a target social network; and our attackwould then identify an account b 2
gSN2 as a likely match.
However, this would require us to collect separate sets gSN2
for each ground truth user, which is not feasible.Instead, we limit our evaluation to users living in the San
Francisco Bay Area, which allows us to use a single setgSN2 for all of them. We identify this subset GTBayArea ⇢
GTLocation as those users who have more posts inside theSan Francisco Bay Area than outside of it. We also limitthe language and timestamp analyses to this subset. Wenote that such a geographical pre-filtering is consistent withwhat an attacker in the wild might do as well: inferringwhere a victim lives tends to be easy and hence locationgives an obvious hint to reduce the size of the candidate setfor language and timestamp.
We obtain the corresponding sets SNBayArea2 by crawling
the three social networks for users from the Bay Area. We donot strive for completeness but instead emulate an attackeraiming to get a su�cient set of accounts from the targetedregion that likely includes his victim. In this paper, our focusis to correlate Yelp and Flickr accounts to Twitter accounts.Thus, we only present how we obtain the SN
BayArea2 set for
Twitter.Twitter provides a search API to get the posts around
a specific longitude/latitude but it only returns results fora maximum of one week. This makes it unusable to get asatisfying set of users who live in the BayArea. Instead, weuse the Streaming API3 to collect in real-time all the tweetstagged with a Bay Area location. We collect all the tweetsfrom the Bay Area during October 2011 to November 2011.
1This list comes from an earlier study by colleagues ana-lyzing email spam. The local IRB approved collection andusage.2Users often create accounts on social networks but neverpost anything; we only include accounts with at least oneposting.3While the Streaming API generally returns only a sampleof tweets, limiting a query to a region the size of the BayArea seems to indeed return the complete set.

We then use all 26,204 users who have sent at least one ofthese tweets. We find 75% of the Twitter GTBayArea usersare already included in this set 4.
Finally, for all the GTBayArea and SN
BayArea2 accounts,
we download the publicly available profile information fromthe corresponding social network, including text, timestamps,and location of each posting. For Twitter, we use its APIto get all the tweets and the metadata attached. Flickr’sAPI likewise provides us the metadata attached to the pho-tos. For Yelp, we again manually crawl and parse the profilepages.5 The median number of tweets in GTBayArea andSN
BayArea2 is 26 and 49 per user, respectively. For Yelp, we
find 4 and 33 reviews per user, respectively. For Flickr, themedians are 10 (GTBayArea) and 151 (SNBayArea
2 ) photos.The total set of tweets, reviews, and images covers the timeinterval from 2007 and 2011.
2.4 Performance MetricsWe use two metrics to measure the performance of an
attack. Recall from §2.2 that an attacker chooses b from allbi 2
gSN2 so that it maximizes similarity with a 2 SN1. If
successful, b = b.Our primary performance metric determines the number
of similarity scores higher than s(a, b), which we term auser’s rank for a given attack:
rank(a, b) := #{bi 2gSN2 : s(a, bi) � s(a, b)} (1)
rank(a, b) = 1 means the matching is perfect and the at-tacker will pick the right account b = b directly. Since a per-fect matching is however hard to obtain, we typically checkif the rank is below a threshold X, i.e., the correct answeris part of the top X matches. For small X, an attacker caninspect that set manually.
The second metric is a verification metric, which considersfalse alarm rate and miss verification error given all pairs ofsimilarity scores. Here, we consider the set of all similar-ity scores s(ai, bi), where ai 2 SN1 and bi 2
gSN2. Some
of these pairs correspond to user matches, i.e., user(ai) =user(bi). After first establishing a threshold for s(ai, bi), weconsider matches below as misses and non-matches above asfalse alarms. Tuning for a low false alarm rate allows attack-ers to target a larger set of users simultaneously, with highprobability that reported matches will be correct. Hence,we primarily consider the threshold at a 1% false alarm rateand then examine the miss rate. In addition, we also ex-amine the Equal Error Rate (EER), for which we establishthe threshold such that miss rate and false alarm rate areequal. The EER is informative in terms of the general dis-criminability of our correlation approaches, but may not betoo useful in narrowing down the range of user pairs thatare matches.
2.5 LimitationsWe emphasize that we see our work as an initial step to-
wards a better understanding of cross-site correlation. Pri-marily, we aim to explore the potential and provide evidencethat such attacks are feasible when relying on activity fea-
4A set of users taken from the Bay Area from August 2010to December 2011 achieves 95% coverage.5Our collection is subject to the limits that the Twitter andFlickr API impose on the number of query results; 3200 and1500, respectively.
tures that are hard to control for users. As such, we are lessconcerned about the specific tuning at which our heuristicsyield their best results, nor do we claim that, e.g, thresh-olds we derive apply universally. Our set of ground truth is,in fact, too small to come to such conclusions. Rather, weexplore the qualitative nature of our correlation techniques,and we make headway towards understanding the character-istics of the features we capture that facilitates their success.
Furthermore, we note that the approaches we use assumethat we have an entire set of accounts for pairs of social net-works, with which we can apply any technique or analysis todetermine matches between user pairs. Due to the limitedamount of data, our approaches do not assume the exis-tence of an independent dataset for developing and tuningour techniques. The results we provide in this paper sug-gest certain best-case scenarios, and future implications forthe power of our approaches when more data would likelybecome available. Nevertheless, our results are useful inidentifying important directions that attackers can take incorrelating social network accounts.
3. LOCATION PROFILESWe first examine location information in more detail. Our
goal is to understand the degree to which locations attachedto user content are su�ciently unique to identify an individ-ual. Matching locations involves two parts, which we discussin turn: (i) representing a user’s location profile in the formof a fingerprint suitable for comparison; and (ii) defininga similarity measure between two such profiles. For eval-uation, we focus on matching accounts from the Yelp andFlickr GTBayArea sets to the Twitter SN
BayArea2 . Based
on the results, we also investigate what properties enablecorrelating users successfully by their location profiles.
3.1 Building ProfilesTo motivate the use of locations, we start by examining
the set of zip codes that user content originates from. Out ofthe 26,204 Twitter users in SN
BayArea2 , 23,395 exhibit sets
of zip codes that are unique. Almost all the users withoutunique sets come with only a very small number of zip codes:2,155 have only one zip code, 571 have two zip codes, 66 thathave three, and 12 have four. For more than four zip codes,all the sets are unique except for 5 accounts that have morethan 14 zip codes. We manually investigated these, and wefound them to belong to 2 users both maintaining separatepersonas—which, incidentally, means we just linked relatedaccounts by their location information. For Flickr, out of1,907 users (we collected from the BayArea) only 66 don’thave a unique set of zip codes. Out of them, 61 have onlyone zip code and 5 have two. For Yelp, out of 10,076, only181 are not unique; 26 of them have one zip code, 120 havetwo, 31 have three, and 4 have four zip codes. Thus, giventhe large number of unique sets, we conclude that locationsmay indeed fingerprint users well.
Encouraged by that observation, we define a user’s loca-tion profile as a histogram that records how often we observeeach location in her posts. The histogram’s bins represent“location units”, such as zip code, city, or coordinates in anappropriate longitude/latitude grid. We normalize all his-tograms such that they represent probability distributionsof posts in a particular “location unit”. We also investi-gated other ways than histograms to represent location pro-files but found them less e↵ective. In particular, using lat-

itude/longitude directly and computing the Euclidean ge-ographical distance is sensitive to the small deviations ofgeo-coordinates within a user’s activity profile.
As location units, we test three di↵erent types of choices:
Administrative Region: We map each latitude/longitudegeo-coordinate to an address using the Bing Maps API.Trying alternative address granularities (streets, zip codes,cities, counties, states), we find zip codes yielding the bestresults.
Grid: We map each latitude/longitude geo-coordinate tothe cell within a spatial grid with the center closest to thecoordinate. Considering cell sizes ranging from 1x1 km2 to12x12 km2, 10x10 km2 proves most e↵ective in our experi-ments.
Clusters: As a more dynamic scheme to group geo-coordinatesinto regions, we use a clustering approach that considerspopulation densities. A small cluster represents a popularsmall area (e.g., blocks of downtown San Francisco), whilelarger clusters represent bigger, less populous regions (e.g.,a park or forest). Using the k-means algorithm with an Eu-clidean distance, we group latitude/longitude geo-coordinatesfrom all users in SN
BayArea2 into corresponding clusters. We
then associate a specific location with the N closest clusters.We found that using N=20 produces the optimal results. Weassign weights to each of the N clusters based on a Gaussiandistribution.
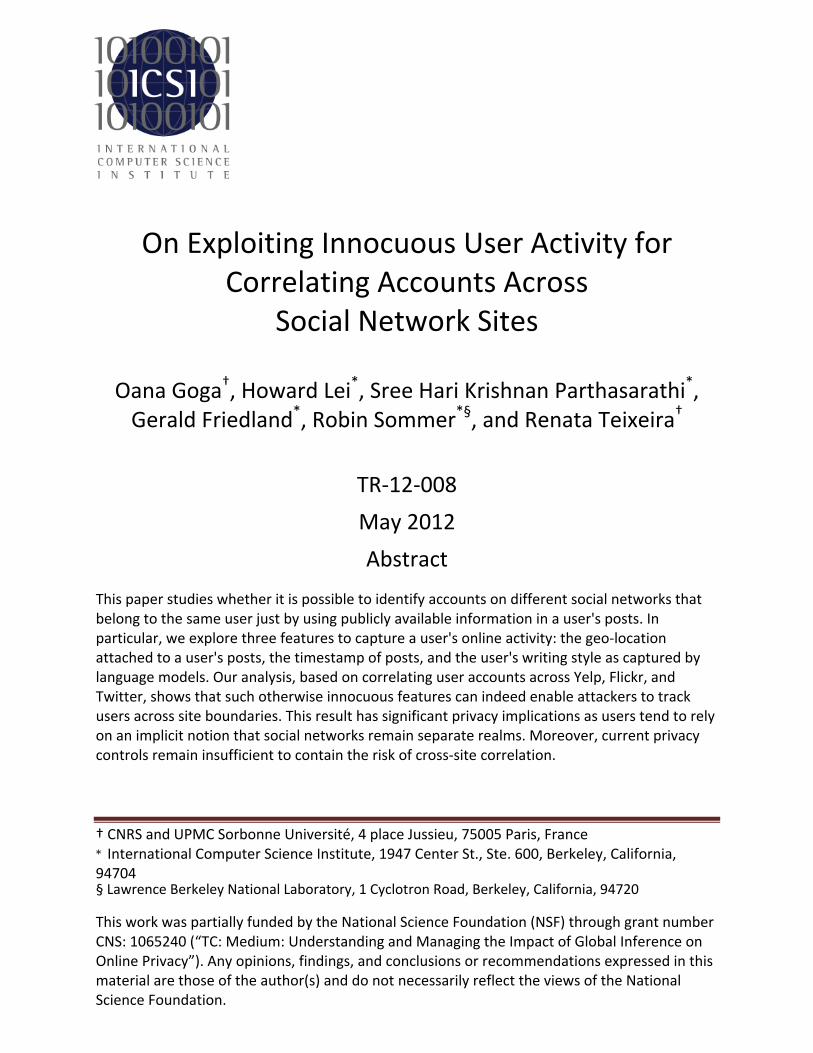
Figures 1a and 1b compare the performance of di↵erentlocation representations at their best configurations. Theplots show the cumulative distribution function (CDF) ofthe rank (see §2.4) for all pairs (a, b) corresponding toGTBayArea
users, matching Yelp and Flickr with Twitter, respectively.The plots use a standard Cosine distance to measure thesimilarity between histograms (in the next section, we ex-plore alternative choices). The solid line represents the min-imum rank (the number of scores strictly greater than theGT score), the dashed line represents the maximum rank(the number of scores that are greater or equal to the GTscore).
We see that the zip code profiles perform the best for Yelpto Twitter, and the longitude/latitude clusters perform thebest for Flickr to Twitter. The grid-based profiles performworse than zip codes, perhaps due to the fact that the lat-ter better reflects population densities and places of interestthan uniform grid cells. The cluster-based profiles performworst for Yelp to Twitter matching and slightly better forFlickr to Twitter matching than the zip codes, but are farmore expensive to compute. We believe, the cluster ap-proach might get better results for countries and regionswhere zip codes do not reflect population density.
We also examine the verification EERs and miss rates atthe 1% false alarm (FA) rate for the zip code and longi-tude/latitude clusters and grid approaches for Yelp to Twit-ter and Flickr to Twitter, shown in Table 2. The resultsconfirm that the zip code and longitude/latitude clusters ap-proach perform better in general. We note that the Flickrto Twitter correlations have lower FA rates than Yelp toTwitter correlations, implying that the former is easier.
We also examine di↵erent time intervals over which tobuild location profiles: one month, one year, two years, threeyears, and everything. Our results show that by aggregat-ing at smaller time intervals we remove many data pointsfrom the profiles, such that the profiles become less precise.
Table 2: EER and miss rate (at 1% false alarm) verificationresults for Yelp to Twitter and Flickr to Twitter correlationsbased on location profiles.
Yelp to TwitterMethod EER(%) Miss rate at 1% FAZip code 32.3 70.2
Long/Lat clusters 28.1 73.7Long/Lat grid 28.1 89.5
Flickr to TwitterMethod EER(%) Miss rate at 1% FAZip code 29.6 85.2
Long/Lat clusters 31.8 66.7Long/Lat grid 29.6 85.2
While doing so helps to better identify a few prolific users,it impacts most others negatively.
Conclusion: Zip code-based profile representation pro-vides the best trade-o↵ between accuracy and computationalcost. Building profiles over all of the available time rangegenerally performs best and allow lower miss rates.
3.2 Similarity MetricsSo far we have used a Cosine distance to compare the
histogram-based location profiles. We now investigate fur-ther choices to compare histograms of zip codes. The statis-tics literature o↵ers a variety of metrics for measuring thesimilarity between two probability density functions P andQ [8]. We test a series of candidates, including Cosineand Jaccard from the Inner Product family; Euclidean andManhattan from the Minkowski family; Hellinger from theSquared-chord family and Kullback-Leibler (KL) divergencefrom the Shannon Entropy family (see formulas in §A).
Our analysis shows that Cosine, Jaccard and Hellinger dis-tances have similar performances, ⇡ 20% of users with rank-ing less than 50, 35% less than 250, and 70% less than 1000.The Euclidean distance has much higher rankings than otherdistances (75% of users have ranking above 1000). This isbecause the Euclidean distance is sensitive to the di↵erencebetween the two values of a histogram’s bin, and especiallysensitive to large di↵erences. In contrast, similarity metricssuch as Cosine are sensitive to bins with non-zero valuesin both profiles, which better suites our goal. We use theCosine distance for the rest of the experiments.
One issue with similarity metrics is that some accountsbi 2
gSN2 have high scores even when they do not share many
locations with the account a 2 SN1. This happens becauseall the metrics normalize their results by the total numberof data points, which would give a higher score to bi withfewer locations over another account, say bj 2
gSN2, with
more locations. This occurs even if bj has more locations incommon with a than bi.
We address this issue by introducing two weights to pe-nalize accounts with few common locations with accounta 2 SN1. The mathematical definition of these weights arein Appendix B. The first weight, weight1, considers if theset of common locations between a and bi 2
gSN2 is popu-
lar in other accounts bj 2
gSN2, j 6= i and a. It gives lower
weight if the set of common locations is popular, because itis harder to uniquely identifying a good match. The secondweight, weight2, accounts for the popularity of each loca-
10 100250 1000 100000
0.2
0.4
0.6
0.8
1
Rank of the ground truth score
CD
F u
sers
Zip CodeClusterGrid
(a) CDFs for Yelp to Twitter.
10 100250 1000 100000
0.2
0.4
0.6
0.8
1
Rank of the ground truth score
CD
F u
sers
Zip CodeClusterGrid
(b) CDFs for Flickr to Twitter.
Figure 1: CDF of the rank of the ground truth score for GTBayArea users for di↵erent location representations for Yelp toTwitter, and Flickr to Twitter. The solid and dashed lines represent the minimum and maximum ranks of the Twitter usersfor each approach.
tion within the sets of common locations across all accountpairs (a, bi). For example, if a and bi have a very popu-lar location in common such as Downtown San Francisco,weight2 will give less weight to this location than if a andbi shared a less popular location such as East Palo Alto.Applying weight1 to the Cosine distance increases the num-ber of users with ranking less than 50 by ⇡ 7% and applyingweight2 increases the number of users with ranking less than250 with ⇡ 10%. As we discuss in the next section, the mainadvantage of applying the weights is that the weighted met-rics lead to more consistent predictions of the ranking fromsimple parameters.
Conclusion: The Cosine, Jaccard, and Hellinger dis-tances perform best in our experiments. We modify thesemetrics with two weights to account for di↵erences in pop-ularity of locations.
3.3 ImplicationsThe previous sections show that location profiles based on
zip codes using cosine*weight as similarity metric performthe best to match accounts that belong to a single user inYelp and Twitter, as well as in Flickr and Twitter. We fo-cus on the zip code curves in Figures 1a and 1b to study theperformance of correlating accounts with location alone. Saythat an attacker is willing to search more exhaustively at aset of at most 1,000 candidate Twitter accounts. By search-ing the first 1,000 accounts based on the location rankingusing the location profile of a user’s Flickr account, he wouldfind the correct Twitter account for 60% of our ground truthusers; this percentage increases to 70% for Yelp accounts.
Our verification miss rates of 70.2% and 66.7% at 1% falsealarms for Yelp to Twitter and Flickr to Twitter also havestrong implications. Consider as a toy example a small com-pany with 10 employees, each having a Flickr and Twitteraccount. There is a total of 100 Flickr vs Twitter accountpairs, among which 10 correspond to matches between theusers and 90 correspond to mis-matched users. Roughly oneof those scores fall above the 1% false alarm scoring thresh-old. Given the 66.7% miss rate, roughly 7 out of the 10scores of matching users fall below the threshold, while 3
fall above the threshold. Hence, if we only consider scoresabove the 1% false alarm threshold, 3 of them are matches,while 1 is a mismatch. This means that, in this simple sce-nario, 30% (3 out of 10) of the actual matches are detectedand 75% (3 out of 4) of the retained pairs correspond toactual matches. Given the volume of information on the in-ternet, there are likely many other scenarios in which ourtechniques can be used by a layman attacker targeting a setof users rather than a particular individual.
From the user’s perspective, it is important to understandthe properties of her location profiles which help or preventthe attacker from successfully correlating her accounts. Al-though the location profile is a powerful feature to correlateaccounts of a single user across sites, some of our groundtruth users in Figures 1a and 1b have high rank and so theattacker would have to search tens of thousands of accountsbefore finding the correct match. A user concerned abouthis privacy would like to fall in this category.
We now investigate the impact that an account’s locationproperties have on the success of our matchings to developa set of guidelines for users to avoid falling victim to suchattacks. Take an individual user with two accounts a 2 SN1
and b 2
gSN2. We study the following parameters that could
impact an attacker’s ability to match a and b: number ofposts on each (#a, #b), the number of zip codes in their lo-cation profiles (#za,#zb), the minimum number of posts oneither account (min(#a,#b)), and the number of commonzip codes between the location profiles (#zab). To establishthe importance of each of these parameters, we computethe Pearson correlation between the similarity scores andeach of these parameters for Yelp ground truth users in theBay Area (i.e., GTBayArea) versus all Twitter users in theBay Area (all users, not only ground truth). We find that#zab and #za (as well as #a, which is strongly correlatedwith #za) show the highest correlation. This result is in-tuitive given our definition of similarity metric incorporatesthe number of common locations directly, but it helps usunderstand possible defenses for users.
For that, we consider the probability that a user with #za
zip codes in SN1 and #zab common zip codes between SN1
and SN2 will be within the first M best matches:
P
�rank(a, b) M | #za,#zab
�. (2)
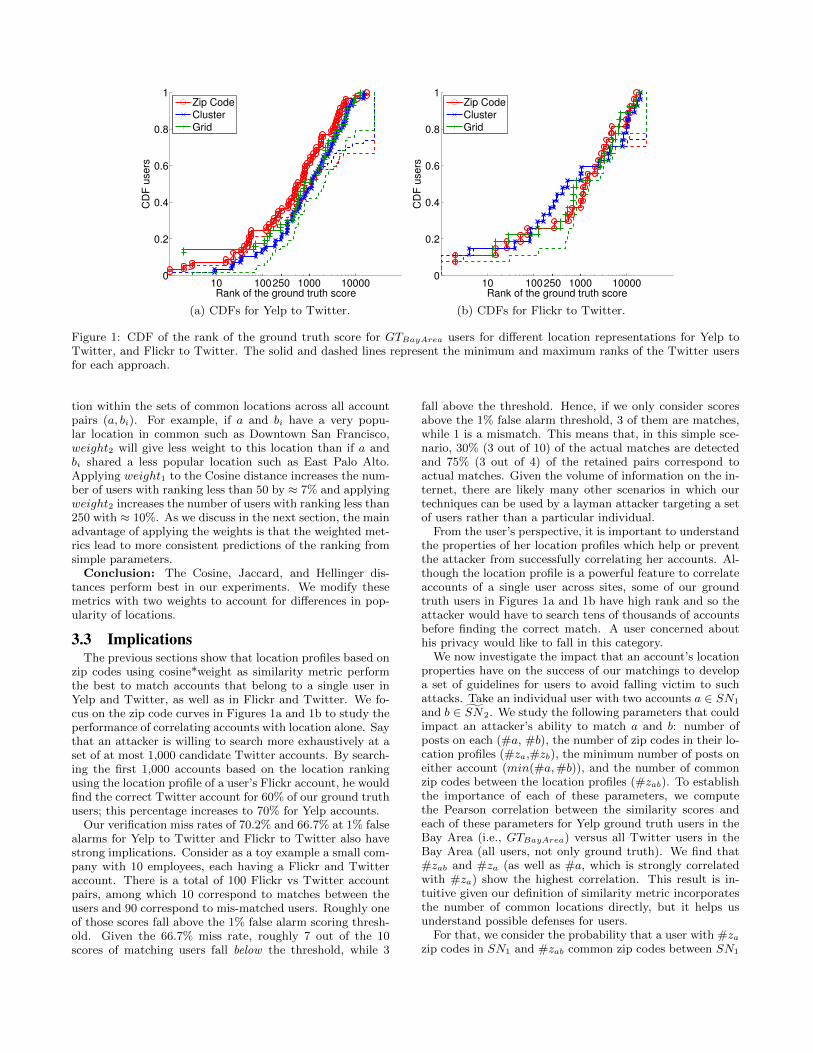
Figure 2 plots the probability that rank(a, b) threshold
as a function of the number of zip codes shared between thetwo accounts (each line corresponds to a di↵erent thresh-old value: 50, 250, 500, and 1000). Figure 2a shows theprobability for accounts with #za 10; Figure 2b shows10 < #za 100, and Figure 2c shows #za > 100. We seethat (i) as expected, the match quality increase with largernumbers of common zip codes; and (ii) an increase of #za
inversely impacts the probability of a good match for a givennumber of common zip codes.
These results are interesting as they allow a consistentprediction of the matching performance from simple param-eters of the accounts. For instance, for a pair with at most10 review zip codes and 7 common zip codes, the rankingis less than 50 with probability 40% and the ranking is lessthan 500 with probability almost one (see Figure 2). Thisinteresting feature is due to the weight that we added tothe cosine metric to account for the di↵erent location pop-ularity. Using the cosine metric alone does not give suchconsistent results. For instance, for a pair with at most10 review zip codes and 7 common zip codes, the ranking isless than 50 with probability 3% and the ranking is less than500 with probability 10%. This is because many accountsbi 2
gSN2 can have a good similarity score if they share a
few common locations with a and do not have many tweets.In contrast, using the weight will give low scores to theseaccounts. The trade-o↵ is: with the cosine metric alone,some pairs with few frequent common locations will be wellmatched“by chance”but some pairs with rare common loca-tions will be badly matched, whereas with the weight, pairswith frequent common locations may be missed but pairswith rare common locations will be well matched. As wehave discussed in the previous section, the overall matchingperformance is fairly similar. However, the weight allowsmuch more predictable matching performance.Guidelines: From a user’s perspective, these results sug-
gest two strategies to avoid being vulnerable to matching.The first, obvious one is that it helps to avoid posting fromthe same zip code to separate social networks. The second,more interesting one suggests that one can correct past mis-takes (i.e., already having many common zip code betweenaccounts) by adding further locations to the first social net-work SN1 (i.e., where one assumes the attacker to alreadyknow one’s identity). Doing so e↵ectively blurs the link toother networks by adding noise. A corollary is that postingfrom a series of di↵erent locations, like when on travel, re-mains unproblematic as long as one updates only one socialnetwork.
4. TIMING PROFILESMany third-party applications, in particular on mobile de-
vices, allow users to automatically send updates to di↵erentsocial networks simultaneously. For example, when Insta-gram uploads to Flickr, it can automatically tweet a pointerto the photo. We exploit this behavior to correlate the in-volved accounts, based on the timestamps of such automatedpostings.In this section, we focus on our Flickr and Twitter data
sets as Yelp does not provide su�ciently accurate timing in-formation. Generally, we aim to find accounts where one or
more timestamps of Flickr photos equals the timestamps ofthe tweets. However, even for simultaneous postings, times-tamps may di↵er slightly due to processing delays and desyn-chronized clocks. Hence, we allow for a small window aroundtwo values when matching. The main question then is whatan appropriate threshold is; a choice too small might missactual post matches, while a larger threshold will reportmany matches corresponding in fact to unrelated posts.
To answer that question, we investigate the timestampdi↵erences we see in our ground truth set, considering allthe GTBayArea Twitter-Flickr pairs. For each pair (a, b),a 2 Twitter, b 2 Flickr where user(a) = user(b), we de-fine the set of timestamp di↵erences td(a, b) as the set ofdi↵erences between timestamps of two consecutive posts ondi↵erent social networks. This set contains all the times-tamp di↵erences between posts on the two social networkspotentially corresponding to the same content (e.g., a photoon Flickr and its link on Twitter). For example, assumethat tstmps(a) = {t1, t2, t3}, tstmps(b) = {T1, T2, T3} andthe combined timeline is {t1, t2, T1, t3, T2, T3}; then the setof timestamp di↵erences is td(a, b) = {T1 � t2, t3 � T1, T2 �
t3}. We want to choose a threshold as small as possible tominimize matches that do not actually correspond to au-tomated posts, but while still minimizing the missed au-tomated posts. First, we discard all timestamp di↵erenceslarger than 30 s, as a rough estimate of an upper bound forthe maximal delay between automated posts. Within the re-maining timestamp di↵erences, we found that 85% are lowerthan 5 s. We conclude that a threshold of 5 s ensures to missat most 15% of the automated posts (we suggest that theactual percentage of missed automated posts will actually bemuch lower since some fast users can write non-automatedposts within 5-30 s). Moreover, we observed that, out of allthe GT users that have at least one post at an interval lessthan 30 s ( which is 13 users), all of them have also one postat an interval less than 5 s.
We simply define here the similarity metric between twoaccounts as the number of timestamp matches (within a cho-sen threshold). We also performed the analysis with a sim-ilarity metric defined as the number of timestamp matchesdivided by the cardinality of the set of timestamp di↵er-ences td(a, b), but the results were not as good so we willnot present them here.
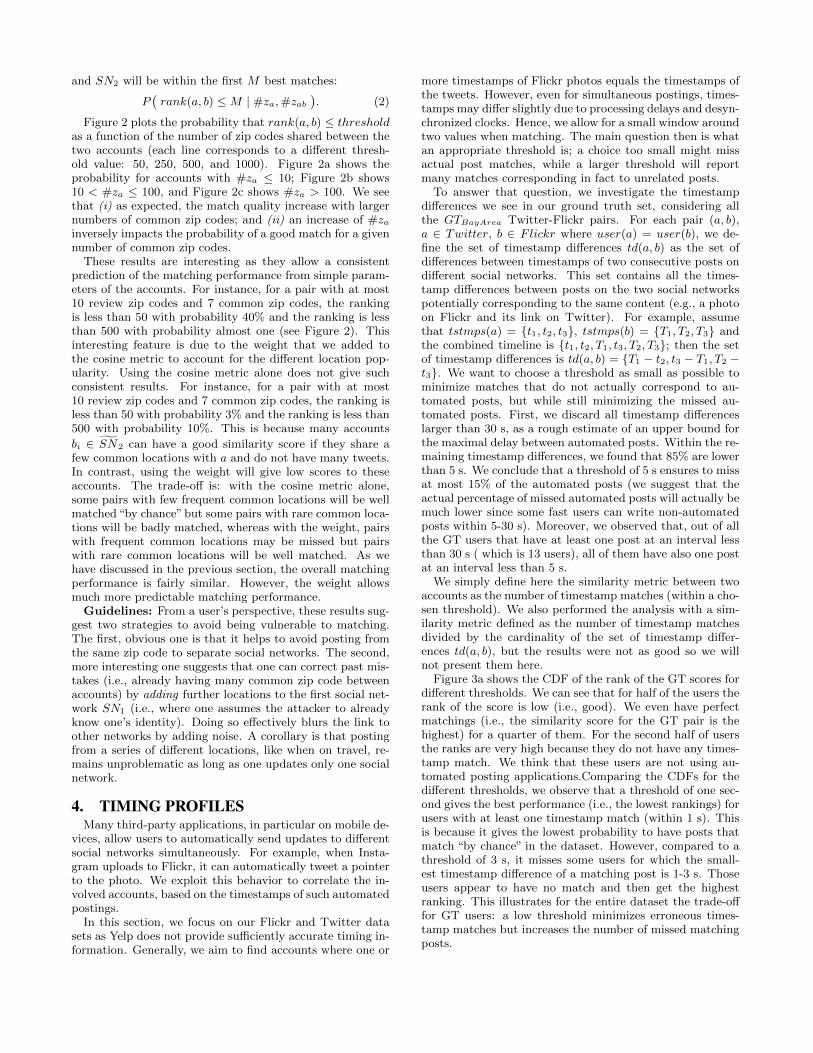
Figure 3a shows the CDF of the rank of the GT scores fordi↵erent thresholds. We can see that for half of the users therank of the score is low (i.e., good). We even have perfectmatchings (i.e., the similarity score for the GT pair is thehighest) for a quarter of them. For the second half of usersthe ranks are very high because they do not have any times-tamp match. We think that these users are not using au-tomated posting applications.Comparing the CDFs for thedi↵erent thresholds, we observe that a threshold of one sec-ond gives the best performance (i.e., the lowest rankings) forusers with at least one timestamp match (within 1 s). Thisis because it gives the lowest probability to have posts thatmatch “by chance” in the dataset. However, compared to athreshold of 3 s, it misses some users for which the small-est timestamp di↵erence of a matching post is 1-3 s. Thoseusers appear to have no match and then get the highestranking. This illustrates for the entire dataset the trade-o↵for GT users: a low threshold minimizes erroneous times-tamp matches but increases the number of missed matchingposts.

0 2 4 6 8 100
0.2
0.4
0.6
0.8
1
# zab
P(
ran
k(a
,b)
! M
| #
z a,
#z a
b )
100050025050
(a) #za 10 zip codes
0 5 10 15 200
0.2
0.4
0.6
0.8
1
# zab
P(
ran
k(a
,b)
! M
| #
z a,
#z a
b )
100050025050
(b) 10 < #za 100 zip codes
0 20 40 600
0.2
0.4
0.6
0.8
1
# zab
P(
ran
k(a
,b)
! M
| #
z a,
#z a
b )
100050025050
(c) #za > 100 zip codes
Figure 2: Probability of the rank(a, b) of a pair of accounts to be smaller than 50, 250, 500 and 1000 as a function of thenumber of common zip codes between two accounts.
10 100250 1000 100000
0.2
0.4
0.6
0.8
1
Rank of the ground truth score
CD
F u
sers
1s3s5s
(a) Rank of the GT pairs.
0 5 10 15 2010
0
101
102
103
# timestamp matches
Rank
<600600!1300>1300
(b) Pair rank as a function of the num-ber of timestamp matches for all pairsfor di↵erent number of Flickr photos(< 600, 600� 1, 300 and > 1, 300).
0 2 4 6 8 100
0.2
0.4
0.6
0.8
1
# timestamp matches
P(
ran
k(a
,b)
! M
)
10050101
(c) Probability that the rank(a, b) of apair of accounts is smaller than 1, 10,50 and 100 as a function of the numberof timestamp matches.
Figure 3: Results for matching based on timestamps.
Implications: We conclude that if one uses applicationsthat trigger automated postings, we can link their accountswith high confidence, we have a perfect matching for 20%of our GTBayArea users for a threshold of one second. Asfor the location profiles, we investigate the correlation be-tween simple properties of two accounts such as the numberof timestamp matches with the ranking of the score, Fig-ure 3b. The di↵erent symbols correspond to pairs that haveless thank 600, between 600 and 1300 and more than 1300Flickr photos. We see: (i) a good correlation between thenumber of timestamp matches and the rank; and (ii) for thesame number of timestamp matches, a Flickr account withmore timestamps will have a worse rank than an accountwith fewer timestamps. Figure 3c shows the probability tonarrow down to a set of 1, 10, 50 and 100 users as a func-tion of the number of timestamp matches. We see that,for instance, even with only 4 timestamp matches, the setof possible matching accounts can be narrowed down to 50accounts with probability 50%. This implies that even ifpeople are not frequent users of such applications (e.g, theymight have just tested one briefly) they still match well. Inother words, automated postings are generally a clear give-away as the probability that timestamps match closely justby chance is low.
5. LANGUAGE PROFILES
Textual metadata is the final type of feature that we con-sider for correlating accounts. This approach builds on ex-isting work demonstrating that free-form text can exhibitcharacteristics su�ciently unique to identify an author. Toexplore this potential, we examined correlating Yelp reviewswith Twitter postings.6 Reviews tend to consist of multipleparagraphs of text, and for each Twitter account we consid-ered the joint set of all its tweets, typically containing oneor two sentences each. A challenge here, however, is thatthe same user may adopt drastically di↵erent kinds of tex-tual structure when writing Yelp reviews (typically completeparagraphs using words mostly found in the English lexicon)versus when tweeting (typically short sentences with fewerstandard words).
We found an average of 18,307 words amongst all tweetsper Twitter user, and 4,153 words amongst all reviews perYelp user, amongst GTBayArea and SN
BayArea2 datasets.
Furthermore, we found a total of 13,556 distinct words amongstall Yelp reviews, and 11,025,682 among all tweets. To ac-count for the large averages and remove common words with-out much discriminative power, we applied a simple filter bycreating a list of words to keep, and discarding the rest of
6We skip Flickr for this analysis as its images come with onlyfew textual metadata in comparison to two other networks.
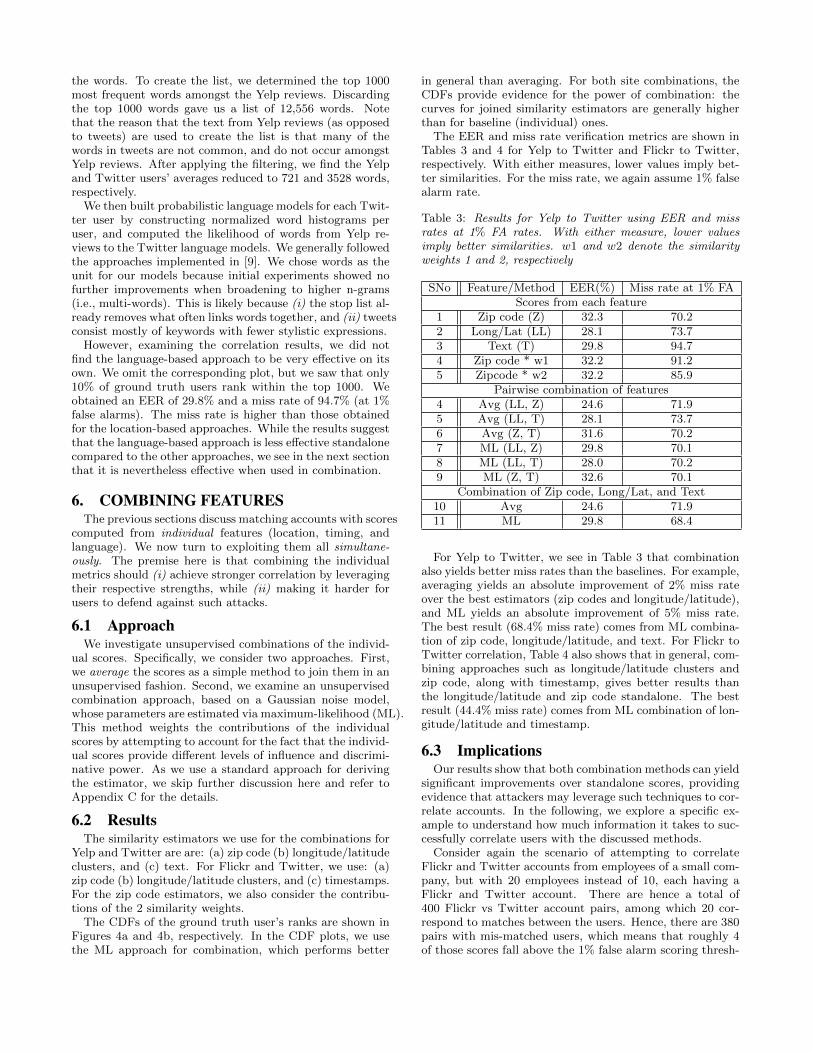
the words. To create the list, we determined the top 1000most frequent words amongst the Yelp reviews. Discardingthe top 1000 words gave us a list of 12,556 words. Notethat the reason that the text from Yelp reviews (as opposedto tweets) are used to create the list is that many of thewords in tweets are not common, and do not occur amongstYelp reviews. After applying the filtering, we find the Yelpand Twitter users’ averages reduced to 721 and 3528 words,respectively.
We then built probabilistic language models for each Twit-ter user by constructing normalized word histograms peruser, and computed the likelihood of words from Yelp re-views to the Twitter language models. We generally followedthe approaches implemented in [9]. We chose words as theunit for our models because initial experiments showed nofurther improvements when broadening to higher n-grams(i.e., multi-words). This is likely because (i) the stop list al-ready removes what often links words together, and (ii) tweetsconsist mostly of keywords with fewer stylistic expressions.
However, examining the correlation results, we did notfind the language-based approach to be very e↵ective on itsown. We omit the corresponding plot, but we saw that only10% of ground truth users rank within the top 1000. Weobtained an EER of 29.8% and a miss rate of 94.7% (at 1%false alarms). The miss rate is higher than those obtainedfor the location-based approaches. While the results suggestthat the language-based approach is less e↵ective standalonecompared to the other approaches, we see in the next sectionthat it is nevertheless e↵ective when used in combination.
6. COMBINING FEATURESThe previous sections discuss matching accounts with scores
computed from individual features (location, timing, andlanguage). We now turn to exploiting them all simultane-ously. The premise here is that combining the individualmetrics should (i) achieve stronger correlation by leveragingtheir respective strengths, while (ii) making it harder forusers to defend against such attacks.
6.1 ApproachWe investigate unsupervised combinations of the individ-
ual scores. Specifically, we consider two approaches. First,we average the scores as a simple method to join them in anunsupervised fashion. Second, we examine an unsupervisedcombination approach, based on a Gaussian noise model,whose parameters are estimated via maximum-likelihood (ML).This method weights the contributions of the individualscores by attempting to account for the fact that the individ-ual scores provide di↵erent levels of influence and discrimi-native power. As we use a standard approach for derivingthe estimator, we skip further discussion here and refer toAppendix C for the details.
6.2 ResultsThe similarity estimators we use for the combinations for
Yelp and Twitter are are: (a) zip code (b) longitude/latitudeclusters, and (c) text. For Flickr and Twitter, we use: (a)zip code (b) longitude/latitude clusters, and (c) timestamps.For the zip code estimators, we also consider the contribu-tions of the 2 similarity weights.
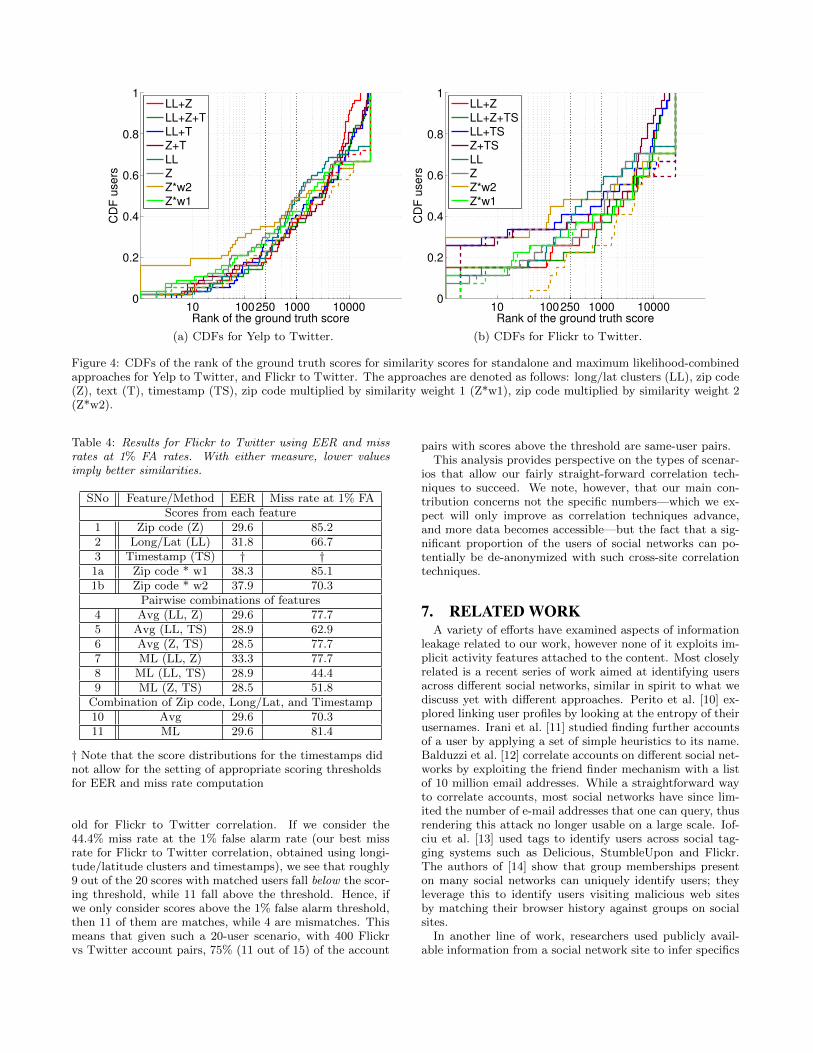
The CDFs of the ground truth user’s ranks are shown inFigures 4a and 4b, respectively. In the CDF plots, we usethe ML approach for combination, which performs better
in general than averaging. For both site combinations, theCDFs provide evidence for the power of combination: thecurves for joined similarity estimators are generally higherthan for baseline (individual) ones.
The EER and miss rate verification metrics are shown inTables 3 and 4 for Yelp to Twitter and Flickr to Twitter,respectively. With either measures, lower values imply bet-ter similarities. For the miss rate, we again assume 1% falsealarm rate.
Table 3: Results for Yelp to Twitter using EER and missrates at 1% FA rates. With either measure, lower valuesimply better similarities. w1 and w2 denote the similarityweights 1 and 2, respectively
SNo Feature/Method EER(%) Miss rate at 1% FAScores from each feature
1 Zip code (Z) 32.3 70.22 Long/Lat (LL) 28.1 73.73 Text (T) 29.8 94.74 Zip code * w1 32.2 91.25 Zipcode * w2 32.2 85.9
Pairwise combination of features4 Avg (LL, Z) 24.6 71.95 Avg (LL, T) 28.1 73.76 Avg (Z, T) 31.6 70.27 ML (LL, Z) 29.8 70.18 ML (LL, T) 28.0 70.29 ML (Z, T) 32.6 70.1
Combination of Zip code, Long/Lat, and Text10 Avg 24.6 71.911 ML 29.8 68.4
For Yelp to Twitter, we see in Table 3 that combinationalso yields better miss rates than the baselines. For example,averaging yields an absolute improvement of 2% miss rateover the best estimators (zip codes and longitude/latitude),and ML yields an absolute improvement of 5% miss rate.The best result (68.4% miss rate) comes from ML combina-tion of zip code, longitude/latitude, and text. For Flickr toTwitter correlation, Table 4 also shows that in general, com-bining approaches such as longitude/latitude clusters andzip code, along with timestamp, gives better results thanthe longitude/latitude and zip code standalone. The bestresult (44.4% miss rate) comes from ML combination of lon-gitude/latitude and timestamp.
6.3 ImplicationsOur results show that both combination methods can yield
significant improvements over standalone scores, providingevidence that attackers may leverage such techniques to cor-relate accounts. In the following, we explore a specific ex-ample to understand how much information it takes to suc-cessfully correlate users with the discussed methods.
Consider again the scenario of attempting to correlateFlickr and Twitter accounts from employees of a small com-pany, but with 20 employees instead of 10, each having aFlickr and Twitter account. There are hence a total of400 Flickr vs Twitter account pairs, among which 20 cor-respond to matches between the users. Hence, there are 380pairs with mis-matched users, which means that roughly 4of those scores fall above the 1% false alarm scoring thresh-
10 100250 1000 100000
0.2
0.4
0.6
0.8
1
Rank of the ground truth score
CD
F u
sers
LL+ZLL+Z+TLL+TZ+TLLZZ*w2Z*w1
(a) CDFs for Yelp to Twitter.
10 100250 1000 100000
0.2
0.4
0.6
0.8
1
Rank of the ground truth score
CD
F u
sers
LL+ZLL+Z+TSLL+TSZ+TSLLZZ*w2Z*w1
(b) CDFs for Flickr to Twitter.
Figure 4: CDFs of the rank of the ground truth scores for similarity scores for standalone and maximum likelihood-combinedapproaches for Yelp to Twitter, and Flickr to Twitter. The approaches are denoted as follows: long/lat clusters (LL), zip code(Z), text (T), timestamp (TS), zip code multiplied by similarity weight 1 (Z*w1), zip code multiplied by similarity weight 2(Z*w2).
Table 4: Results for Flickr to Twitter using EER and missrates at 1% FA rates. With either measure, lower valuesimply better similarities.
SNo Feature/Method EER Miss rate at 1% FAScores from each feature
1 Zip code (Z) 29.6 85.22 Long/Lat (LL) 31.8 66.73 Timestamp (TS) † †
1a Zip code * w1 38.3 85.11b Zip code * w2 37.9 70.3
Pairwise combinations of features4 Avg (LL, Z) 29.6 77.75 Avg (LL, TS) 28.9 62.96 Avg (Z, TS) 28.5 77.77 ML (LL, Z) 33.3 77.78 ML (LL, TS) 28.9 44.49 ML (Z, TS) 28.5 51.8
Combination of Zip code, Long/Lat, and Timestamp10 Avg 29.6 70.311 ML 29.6 81.4
† Note that the score distributions for the timestamps didnot allow for the setting of appropriate scoring thresholdsfor EER and miss rate computation
old for Flickr to Twitter correlation. If we consider the44.4% miss rate at the 1% false alarm rate (our best missrate for Flickr to Twitter correlation, obtained using longi-tude/latitude clusters and timestamps), we see that roughly9 out of the 20 scores with matched users fall below the scor-ing threshold, while 11 fall above the threshold. Hence, ifwe only consider scores above the 1% false alarm threshold,then 11 of them are matches, while 4 are mismatches. Thismeans that given such a 20-user scenario, with 400 Flickrvs Twitter account pairs, 75% (11 out of 15) of the account
pairs with scores above the threshold are same-user pairs.This analysis provides perspective on the types of scenar-
ios that allow our fairly straight-forward correlation tech-niques to succeed. We note, however, that our main con-tribution concerns not the specific numbers—which we ex-pect will only improve as correlation techniques advance,and more data becomes accessible—but the fact that a sig-nificant proportion of the users of social networks can po-tentially be de-anonymized with such cross-site correlationtechniques.
7. RELATED WORKA variety of e↵orts have examined aspects of information
leakage related to our work, however none of it exploits im-plicit activity features attached to the content. Most closelyrelated is a recent series of work aimed at identifying usersacross di↵erent social networks, similar in spirit to what wediscuss yet with di↵erent approaches. Perito et al. [10] ex-plored linking user profiles by looking at the entropy of theirusernames. Irani et al. [11] studied finding further accountsof a user by applying a set of simple heuristics to its name.Balduzzi et al. [12] correlate accounts on di↵erent social net-works by exploiting the friend finder mechanism with a listof 10 million email addresses. While a straightforward wayto correlate accounts, most social networks have since lim-ited the number of e-mail addresses that one can query, thusrendering this attack no longer usable on a large scale. Iof-ciu et al. [13] used tags to identify users across social tag-ging systems such as Delicious, StumbleUpon and Flickr.The authors of [14] show that group memberships presenton many social networks can uniquely identify users; theyleverage this to identify users visiting malicious web sitesby matching their browser history against groups on socialsites.
In another line of work, researchers used publicly avail-able information from a social network site to infer specifics

about its users, without however correlating it with furtheraccounts elsewhere. Hecht et al. [15] derived user locationsfrom tweets using basic machine learning techniques that as-sociated tweets with geotagged articles on Wikipedia. Sim-ilarly, Kinsella et al. [6] leveraged tweets with geotags tobuild language models for specific places; they found thattheir model can predict country, state and city with simi-lar performance as IP geolocation, and zip code with muchhigher accuracy. Crandall et al. [5] located Flickr photosby identifying landmarks via visual, temporal and textualfeatures. Chaabane et al. [16] leverage interests and likes onFacebook to infer otherwise hidden information about users,such as gender, relationship status, and age. Further similarwork includes [17, 18].
Language models have been used for data de-anonymization.For example, Nanavati et al.[7] used language distribution atthe n-gram level to de-anonymize reviews in an anonymousreview process. A recent study showed how text posted onblogs can be de-anonymized [19]. More generally, a num-ber of de-anonymization e↵orts demonstrated the power ofcorrelation. Sweeney [20] de-anonymized medical recordswith the help of external auxiliary information. Likewise,Narayanan et al. de-anonymized Netflix movie ratings. In [21],a similar approach attacks a social network graph by corre-lating it with known identities on another. On a more fun-damental level, Bishop et al. [22] discuss the need to considerexternal knowledge when when sanitizing a data set.
8. CONCLUSIONIn this work we present a set of experiments that use
straightforward data mining techniques to correlate user ac-counts across social networks, based on otherwise innocu-ous information like time patterns or location of the posts.Our approaches work independent of standard privacy mea-sures, such as disabling tracking cookies or using anonymiz-ing proxies. They demonstrate that tracking users just bytheir posting activity is a real threat. As such, the privacyimplications of our results are two-fold. First, we point outthat it is the aggregate set of a user’s complete online foot-print that needs protection, not just content on individualsites. Second, we find that it is hard to defend against suchattacks as it is the very activity one wants to publish thatenables correlation to succeed.
While our work remains a case study for a particularsetting, it demonstrates the potential of cross-site correla-tion. Our approaches are conceptually simple, yet we pre-dict that we will soon see more sophisticated—and furtherautomated—variants in the wild that will exploit the in-creasing volume of user information that social networksnow o↵er via convenient APIs. In particular, we expect thatautomated content analysis technology—such as face recog-nizers and natural language processing—will enable correla-tions much beyond what we demonstrate in this work.
From a research perspective, we encourage our communityto devise novel privacy protections that take such threatsinto account and, where hard to prevent, at least supportusers in understanding their vulnerability. For example, weare investigating building tools that help users to identify asubset of their published content that contributes most tocross-site attacks, allowing them to modify or even deletethose parts as necessary.
9. REFERENCES
[1] Social Intelligence Corp., http://www.socialintel.com/.[2] A. Narayanan and V. Shmatikov, “Robust
de-anonymization of large sparse datasets,” inProceedings of the 2008 IEEE Symposium on Securityand Privacy, ser. SP ’08, 2008, pp. 111–125.
[3] “Yahoo! placemaker,”http://developer.yahoo.com/geo/placemaker/.
[4] “geonames.org,” http://geonames.org.[5] D. J. Crandall, L. Backstrom, D. Huttenlocher, and
J. Kleinberg, “Mapping the world’s photos,” inProceedings of the 18th international conference onWorld Wide Web, ser. WWW ’09, 2009, pp. 761–770.
[6] S. Kinsella, V. Murdock, and N. O’Hare, ““i’m eatinga sandwich in glasgow”: modeling locations withtweets,” in Proceedings of the 3rd internationalworkshop on Search and mining user-generatedcontents, ser. SMUC ’11, 2011, pp. 61–68.
[7] M. Nanavati, N. Taylor, W. Aiello, and A. Warfield,“Herbert west: deanonymizer,” in Proceedings of the6th USENIX conference on Hot topics in security, ser.HotSec ’11, 2011.
[8] S.-h. Cha, “Comprehensive survey on distance /similarity measures between probability densityfunctions,” International Journal of MathematicalModels and Methods in Applied Sciences, vol. 1, no. 4,pp. 300–307, 2007.
[9] A. Stolcke, “Srilm-an extensible language modelingtoolkit,” in Proceedings International Conference onSpoken Language Processing, November 2002, pp.257–286.
[10] D. Perito, C. Castelluccia, M. Ali Kaafar, andP. Manils, “How unique and traceable are usernames?”in Proceedings of the 11th Privacy EnhancingTechnologies Symposium, ser. PETS’11, 2011, pp.1–17.
[11] D. Irani, S. Webb, K. Li, and C. Pu, “Large onlinesocial footprints–an emerging threat,” in Proceedingsof the 2009 International Conference onComputational Science and Engineering - Volume 03,ser. CSE ’09, 2009, pp. 271–276.
[12] M. Balduzzi, C. Platzer, T. Holz, E. Kirda,D. Balzarotti, and C. Kruegel, “Abusing socialnetworks for automated user profiling,” in Proceedingsof 13th International Symposium on Recent Advancesin Intrusion Detection, ser. RAID’10, 2010, pp.422–441.
[13] T. Iofciu, P. Fankhauser, F. Abel, and K. Bischo↵,“Identifying users across social tagging systems,” inProceedings of the 6th International AAAI Conferenceon Weblogs and Social Media, ser. ICWSM ’11, 2011,pp. 522–525.
[14] G. Wondracek, T. Holz, E. Kirda, and C. Kruegel, “Apractical attack to de-anonymize social networkusers,” in Proceedings of the 31st IEEE Symposium onSecurity and Privacy, ser. SP ’10, 2010, pp. 223–238.
[15] B. Hecht, L. Hong, B. Suh, and E. H. Chi, “Tweetsfrom justin bieber’s heart: the dynamics of thelocation field in user profiles,” in Proceedings of the2011 annual conference on Human factors incomputing systems, ser. CHI ’11, 2011, pp. 237–246.
[16] A. Chaabane, G. Acs, and M. A. Kaafar, “You arewhat you like! information leakage through users’
interests,” in Proceedings of the 19th Annual Network& Distributed System Security Symposium, ser. NDSS’12, 2012.
[17] E. Zheleva and L. Getoor, “To join or not to join: theillusion of privacy in social networks with mixedpublic and private user profiles,” in Proceedings of the18th international conference on World wide web, ser.WWW ’09, 2009, pp. 531–540.
[18] D. Gayo Avello, “All liaisons are dangerous when allyour friends are known to us,” in Proceedings of the22nd ACM conference on Hypertext and hypermedia,ser. HT ’11, 2011, pp. 171–180.
[19] A. Narayanan, H. Paskov, N. Z. Gong, J. Bethencourt,E. Stefanov, E. C. R. Shin, and D. Song, “On thefeasibility of internet-scale author identification,” inProceedings of the 33st IEEE Symposium on Securityand Privacy, ser. SP ’12, 2012, to appear.
[20] L. Sweeney, “Weaving technology and policy togetherto maintain confidentiality,” Journal of Law, Medicine,and Ethics, vol. 25, no. 2–3, pp. 98–110, 1997.
[21] A. Narayanan and V. Shmatikov, “De-anonymizingsocial networks,” in Proceedings of the 2009 30th IEEESymposium on Security and Privacy, ser. SP ’09, 2009,pp. 173–187.
[22] M. Bishop, J. Cummins, S. Peisert, A. Singh,B. Bhumiratana, D. Agarwal, D. Frincke, andM. Hogarth, “Relationships and data sanitization: Astudy in scarlet,” in Proceedings of the 2010 Workshopon New Security Paradigms, ser. NSPW ’10, 2010, pp.151–164.
APPENDIXA. SIMILARITY METRICSWe note, SIP as the inner product metric, SCos as the
cosine distance, SJac as the Jaccard distance, SH as theHellinger distance, dEuc as the Euclidian distance, dM asthe Manhattan distance, and dKL as the Kullback-Leiblerdivergence. Amongst these metrics, SIP , SCos, SJac repre-sent similarity metrics, where higher values denote greatersimilarity between distributions P and Q. The other met-rics are distance metrics, where higher values denote greaterdis-similarity between the distributions. Pi and Qi representthe set of probabilities corresponding to discrete probabilitydistributions P and Q.
SIP =dP
i=1PiQi dEuc =
sdP
i=1|Pi �Qi|
2
SCos =
dP
i=1Pi
Qi
sdP
i=1P2i
sdP
i=1Q2
i
dM =dP
i=1|Pi �Qi|
SJac =
dP
i=1Pi
Qi
dP
i=1P2i
+dP
i=1Q2
i
�dP
i=1Pi
Qi
dKL =dP
i=1Piln
Pi
Qi
dH =
s
2dP
i=1(p
Pi �p
Qi)2
B. SIMILARITY WEIGHTS
In §3.2, we discuss the need for adding weights to thesimilarity functions. The first weight is the probability ofthe set of common locations of two accounts (a, b) to appear
between the other pairs (a, bi), bi 2 gSN2. For each pair (a, b)
the set of common locations between their location profiles isCLk = LP (a)\LP (b). The unique sets of common locationsfrom the list (CLk)kN are denoted by clj , j = 1, . . . ,M .We denote the frequency of a unique set of common locationsby
f(clj) =# {k : CLk = clj}
N
, j = 1, . . . ,M,
and we define for each pair (a, b) the first weight
weight1(a, b) = f(clj)�1
, for j s.t. CLk = clj . (3)
The second weight is the product of the probability of eachlocation in the set of common locations of two accounts (a, b)to appear in the list of common locations between all (a, bi)pairs. All the locations that appear in the list (CLk)kN
are denoted by ai, i = 1, . . . , P . We denote the frequency ofa location by
f(li) =# {k : li 2 CLk}P
k #CLk, i = 1, . . . , P,
and we define for each pair (a, b) the second weight
weight2(a, b) =
0
@Y
li
2CLk
f(li)
1
A�1
. (4)
C. UNSUPERVISED COMBINATIONWe propose a technique based on the assumption that
the output of the similarity estimators can be viewed asnoisy versions of an underlying ground truth similarity score;furthermore, we assume that this “noise” is Gaussian. Weshall discuss this method in detail.
Let sji be random variables denoting the output of jth sim-ilarity score estimator for a pair of accounts (i). We shallassume a simplistic model where we consider that these sim-ilarity scores are perturbed around a mean score si, with avariance �
2j . Furthermore, we assume the errors committed
by each estimator around the true score (si) are Gaussiandistributed with zero mean and variance (�2
j ). More for-
mally, ✏j ⇠ N (0,�2j ), s
ji = si + ✏j ,
p(sji |si,�j) ⇠ N (sji |si,�2j ) (5)
For estimating the model parameters, we use the maxi-mum likelihood (ML) formulation.
Let D denote the set of scores, and let ⇥ denote the set ofparameters si,�j , where i 2 1 · · ·N , and j 2 1 · · ·M . Thenthe likelihood function can be written as,
L(⇥) = p(D|⇥) =NY
i=1
MY
j=1
p(sji |si,�j) =NY
i=1
MY
j=1
N (sji ,�2j )

The ML estimate of the parameters can be formulated as,
b⇥ML = argmax⇥
�ln p(D|⇥)
�
= arg max{s
i
,�j
}
NX
i=1
MX
j=1
ln⇣ 1p
2⇡�j
e
�(s
j
i
�s
i
)2
2�2j
⌘
= arg max{s
i
,�j
}�
NX
i=1
MX
j=1
⇣12ln 2⇡�2
j +(sji � si)
2
2�2j
⌘(6)
Computing the derivatives of L with respect to the param-eter set {si,�j} and solving, we get
c�
2jML
=1N
NX
i=1
(sji � si)2 (7)
bsiML =
PMj=1
sj
i
�2jPM
j=11�2j
(8)
As the parameters b�j and bsi are coupled, we iterate the twosteps (4,5) till convergence. The result is intuitive as it es-timates the ground truth as a weighted combination of theoutput of the estimators. The weights themselves are esti-mated as the inverse of the variance of the estimators. Wenote here, that regularization can be done to prevent over-fitting of the model parameters. However, for simplicity, weavoid this and use early stopping.
We found that the distributions of the similarity scores arepeaky, and the second mode of these bimodal distributionsare barely perceptible. To reduce the dynamic range of thesimilarity scores we use the transformation,
f(sji ) = log�
s
ji
1� s
ji
�. (9)
Related Documents