On concentration polarisation in a fluidized bed membrane reactor for biogas steam reforming Citation for published version (APA): de Nooijer, N., Gallucci, F., Pellizzari, E., Melendez, J., Pacheco Tanaka, D. A., Manzolini, G., & van Sint Annaland, M. (2018). On concentration polarisation in a fluidized bed membrane reactor for biogas steam reforming: modelling and experimental validation. Chemical Engineering Journal, 348, 232-243. https://doi.org/10.1016/j.cej.2018.04.205 Document license: CC BY DOI: 10.1016/j.cej.2018.04.205 Document status and date: Published: 15/09/2018 Document Version: Publisher’s PDF, also known as Version of Record (includes final page, issue and volume numbers) Please check the document version of this publication: • A submitted manuscript is the version of the article upon submission and before peer-review. There can be important differences between the submitted version and the official published version of record. People interested in the research are advised to contact the author for the final version of the publication, or visit the DOI to the publisher's website. • The final author version and the galley proof are versions of the publication after peer review. • The final published version features the final layout of the paper including the volume, issue and page numbers. Link to publication General rights Copyright and moral rights for the publications made accessible in the public portal are retained by the authors and/or other copyright owners and it is a condition of accessing publications that users recognise and abide by the legal requirements associated with these rights. • Users may download and print one copy of any publication from the public portal for the purpose of private study or research. • You may not further distribute the material or use it for any profit-making activity or commercial gain • You may freely distribute the URL identifying the publication in the public portal. If the publication is distributed under the terms of Article 25fa of the Dutch Copyright Act, indicated by the “Taverne” license above, please follow below link for the End User Agreement: www.tue.nl/taverne Take down policy If you believe that this document breaches copyright please contact us at: [email protected] providing details and we will investigate your claim. Download date: 20. Mar. 2020

Welcome message from author
This document is posted to help you gain knowledge. Please leave a comment to let me know what you think about it! Share it to your friends and learn new things together.
Transcript
On concentration polarisation in a fluidized bed membranereactor for biogas steam reformingCitation for published version (APA):de Nooijer, N., Gallucci, F., Pellizzari, E., Melendez, J., Pacheco Tanaka, D. A., Manzolini, G., & van SintAnnaland, M. (2018). On concentration polarisation in a fluidized bed membrane reactor for biogas steamreforming: modelling and experimental validation. Chemical Engineering Journal, 348, 232-243.https://doi.org/10.1016/j.cej.2018.04.205
Document license:CC BY
DOI:10.1016/j.cej.2018.04.205
Document status and date:Published: 15/09/2018
Document Version:Publisher’s PDF, also known as Version of Record (includes final page, issue and volume numbers)
Please check the document version of this publication:
• A submitted manuscript is the version of the article upon submission and before peer-review. There can beimportant differences between the submitted version and the official published version of record. Peopleinterested in the research are advised to contact the author for the final version of the publication, or visit theDOI to the publisher's website.• The final author version and the galley proof are versions of the publication after peer review.• The final published version features the final layout of the paper including the volume, issue and pagenumbers.Link to publication
General rightsCopyright and moral rights for the publications made accessible in the public portal are retained by the authors and/or other copyright ownersand it is a condition of accessing publications that users recognise and abide by the legal requirements associated with these rights.
• Users may download and print one copy of any publication from the public portal for the purpose of private study or research. • You may not further distribute the material or use it for any profit-making activity or commercial gain • You may freely distribute the URL identifying the publication in the public portal.
If the publication is distributed under the terms of Article 25fa of the Dutch Copyright Act, indicated by the “Taverne” license above, pleasefollow below link for the End User Agreement:www.tue.nl/taverne
Take down policyIf you believe that this document breaches copyright please contact us at:[email protected] details and we will investigate your claim.
Download date: 20. Mar. 2020

Contents lists available at ScienceDirect
Chemical Engineering Journal
journal homepage: www.elsevier.com/locate/cej
On concentration polarisation in a fluidized bed membrane reactor forbiogas steam reforming: Modelling and experimental validation
Niek de Nooijera, Fausto Galluccia,⁎, Emma Pellizzaria,b, Jon Melendezc,David Alfredo Pacheco Tanakac, Giampaolo Manzolinib, Martin van Sint Annalanda
a Chemical Process Intensification, Department of Chemical Engineering and Chemistry, Eindhoven University of Technology, De Rondom 70, 5612 AZ Eindhoven, TheNetherlandsbDepartment of Energy, Politecnico di Milano, via Lambruschini 4, 20156 Milano, Italyc Tecnalia Energy and Environment Division, Mikeletegi Pasealekua 2, 20009 San Sebastian-Donostia, Spain
H I G H L I G H T S
• Fluidized bed reactor model accounting for concentration polarization.
• Reduction of concentration polarization in fluidized bed is demonstrated.
• Experimental demonstration and model validation of biogas steam reforming in a FBMR.
• The H2 productivity is proportionally related to the concentration polarization.
A R T I C L E I N F O
Keywords:BiogasSteam reformingMembrane reactorHydrogen production
A B S T R A C T
The production of pure hydrogen through the steam reforming of biogas in a fluidized bed membrane reactor hasbeen studied. A phenomenological one-dimensional two-phase fluidized bed reactor model accounting forconcentration polarisation with a stagnant film model has been developed and used to investigate the systemperformance. The validation of the model was performed with steam reforming experiments at temperaturesranging from 435 °C up to 535 °C, pressures between 2 and 5 bar and CO2/CH4 ratios up to 0.9. The permeationperformance of the ceramic-supported PdAg thin-film membrane was first characterized separately for both puregas and gas mixtures. Subsequently, the membrane was immersed into a fluidized bed containing Rh supportedon alumina particles and the reactor performance, viz. the methane conversion, hydrogen recovery and hy-drogen purity, was evaluated under biogas steam reforming conditions. The resulting hydrogen purity underbiogas steam reforming conditions was up to 99.8%. The model results were in very good agreement with theexperimental results, when assuming a thickness of the stagnant mass transfer boundary layer around themembrane equal to 0.54 cm. It is shown that the effects of concentration polarisation in a fluidized bed mem-brane reactor can be well described with the implementation of a film layer description in the two-phase model.
1. Introduction
The increasing energy demand over the last decades, in combinationwith the need to reduce greenhouse gas (GHG) emissions, has given riseto the development of more efficient conversion technologies and al-ternative energy carriers. Hydrogen is the most promising energy car-rier, as it can be produced from renewable energy sources and no CO2 isemitted at the end user. Most of the hydrogen produced nowadays ismade via steam reforming of natural gas, producing significant GHGemissions. The current demand for hydrogen and its potential use in thenew energy systems requires the development of a sustainable route for
its production. Biogas is one of the renewable sources that could beused in the production of hydrogen.
Biogas is produced from biomass, which consists of organic matter(that captured carbon form atmospheric CO2 over a relatively shorttimescale), mainly through anaerobic digestion of organic substrates(manure, sewage sludge, organic fractions of industry waste and energycrops) [1]. The composition of biogas varies significantly depending onthe source of biomass. Typical biogas compositions from an anaerobicdigester and landfill production are shown in Table 1.
The methane in the biogas can be converted into a hydrogen richgas by steam reforming (SR): methane reacts with steam at high
https://doi.org/10.1016/j.cej.2018.04.205Received 10 March 2018; Received in revised form 27 April 2018; Accepted 28 April 2018
⁎ Corresponding author.E-mail address: [email protected] (F. Gallucci).
Chemical Engineering Journal 348 (2018) 232–243
Available online 30 April 20181385-8947/ © 2018 The Author(s). Published by Elsevier B.V. This is an open access article under the CC BY license (http://creativecommons.org/licenses/BY/4.0/).
T

temperatures over a nickel-based catalyst to produce CO and H2 via theSteam Methane Reforming reaction (SMR), Eq. (1). To increase thehydrogen yield this process is combined with Water Gas Shift (WGS),Eq. (2). Because of the high CO2 content, Dry Reforming (DR), Eq. (3),is likely to take place as well.
CH H O CO H H3 Δ 206kJ molrθ
4 2 21+ ⇄ + = + − (1)
CO H O CO H HΔ 41kJ molrθ
2 2 21+ ⇄ + = − − (2)
CH CO CO H H2 2 Δ 247kJ molrθ
4 2 21+ ⇄ + = + − (3)
The reforming of methane is highly endothermic and requires hightemperatures (> 900 °C) and is favoured at low pressures. Moreover, toobtain high purity hydrogen from the SR process, downstream separa-tion and purification steps are required. The application of biogas in theSR process has significant challenges: (i) the combination of the nickelcatalyst and high operation temperatures makes the system prone to
coking, (ii) the high CO2 content of biogas induces equilibrium lim-itations and (iii) the presence of H2S even if present in trace amountsrequires intensive cleaning of the biogas. The development of reformingcatalysts with a high resistancy to carbon formation have increased thepotential for hydrogen production from biogas [3]. Noble metal cata-lysts, such as Rh, Ru, Pt and Pd show a high activity and selectivity forhydrogen production [4]. Generally Rh has been found to have the bestperformance along the different noble metal catalysts. To remove theH2S, the biogas can be upgraded by cleaning using e.g. pressurizedwater scrubbing, pressure swing adsorption, amine absorption ormembrane absorption [2]. However, these methods significantly in-crease the energy consumption and costs of hydrogen [2]. The emer-ging technology of palladium-based membrane reactors shows a highdegree of process intensification for the production of hydrogen and hasdemonstrated significant advantages over the conventional SR process[5]. The hydrogen is selectively extracted from the reaction system,thus combining the SMR, WGS and H2 separation (and purification) inone single unit. The in-situ extraction of hydrogen can overcome theequilibrium limitations of the biogas reforming thanks to the productrecovery. The shift in equilibrium also allows operation at lower tem-peratures and higher pressures. Finally, pure hydrogen is obtained di-rectly from the membranes without the requirement of downstreamseparations, hence reducing the process complexity and the associatedcapital costs. These advantages of membrane reactors can make hy-drogen production on smaller scales from a decentralized source such asbiogas attractive. Previous works investigated the application of biogassteam reforming in a membrane reactor. Sato et al. [6] identified themembrane reactor as a promising technology for hydrogen productionfrom biogas. Steam reforming of a biogas mixture derived from super-critical water gasification of glucose was performed using a PdAg
Nomenclature
Ar Archimedes numberAj Arrhenius pre-exponential factorAT Area of bed cross section [m2]db,0 Initial bubble diameter [m]db Bubble diameter [m]db avg, Average bubble diameter [m]db,max Maximum bubble diameter [m]dp Particle diameter [m]Dg Gas diffusivity [m2 s−1]DT Bed diameter [m]Eact j, Activation energy for reaction jfk Fraction of phase kFi Molar flow of species i [mol s−1]g Gravitational acceleration [m s−2]Hmf Height of the bed at minimum fluidization velocity [m]Hf Height of the fluidized bed [m]Hs Height of the packed bed [m]Kce Volumetric interchange coefficient between cloud and
emulsion [s−1]Kbc Volumetric interchange coefficient between bubble and
cloud [s−1]Kbe i n, , Volumetric interchange coefficient between bubble and
emulsion phase [s−1]K j
eq Equilibrium constant for reaction jMw i, Molar weight of component I [kgmol−1]Ni Molar flux component i [mol m−2 s−1]p0 Pre-exponential factor for permeability of membrane
[mol m−1 s−1 Pa−n]Pi Partial pressure of species i [bar]rj Reaction rate of reaction j [mol kg−1 s−1]Rmemb. Radius of the membrane
SF Q( ) Heaviside function of Qt Thickness of Membrane selective layer thickness [m]uk n
s, Superficial velocity of phase j in cell k [m s−1]
umf Minimum fluidization velocity [m s−1]u0 Superficial gas velocity at inletub Bubble rise velocityub avg, Average bubble rise velocityVD i, Diffusion volume for component iVk n, Volume of phase k in cell n [m3]wk i n, , Weight fraction of phase k, component i in cell nxi bulk, Molar fraction of species i in the bulkxi memb, . Molar fraction of species i adjacent to the membrane
Greek symbols
δ Thickness of the stagnant film layer [m]HΔ r
θ Reaction enthalpy at standard conditions [kJ/mol]εk n, Fraction of phase k in cell nεmf Bed voidage at minimum fluidization velocityμg Gas viscosity [Pa s]νj i, Stoichiometric coefficient of reaction j component iρk n, Density of phase k in cell n [kgm−3]
Subscripts
b Bubble phasee Emulsion phaseg Gas phasei Speciesj Reactionn Number of CSTR in emulsion or bubble phases Solid phase
Table 1Anaerobic digestion or landfill biogas composition [2].
Component AD biogas Landfill biogas Unit
CH4 53–70 30–65 vol%CO2 30–50 25–47 vol%N2 2–6 <1–17 vol%O2 0–5 <1–3 vol%H2 NA 0–3 vol%CxHy NA NA vol%H2S 0–2000 30–500 ppmNH3 <100 0–5 ppmChlorines < 0.25 0.3–225 mgNm3
Siloxane < 0.08–0.5 µg/g-dry
N. de Nooijer et al. Chemical Engineering Journal 348 (2018) 232–243
233

supported on stainless steel membrane in a fixed bed containing a Ru/Al2O3 catalyst. Iulianelli et al. [7] studied the steam reforming of biogasin a Pd-based membrane on a porous Al2O3 support over a Ni catalyst.Methane conversion of 34% and separation of the produced hydrogenup to 70% were reported. However, the process required regenerationof the catalyst deactivated by carbon formation, and the hydrogenpurity was decreased rapidly due to the formation of pinholes. Vasquezet al. [8] investigated the effect of the temperature and pressure on thesteam reforming in a fixed bed and described their experiments with aone-dimensional model. However, the use of fixed-bed reactors hassome drawbacks, in particular when applied to membrane reactors withhigh fluxes. First of all, the poor heat transfer in the packed bed resultsin large temperature gradients, which can be detrimental for themembrane flux and membrane stability. Moreover, when high-fluxmembranes are used, mass transfer limitations, known as concentrationpolarisation, become dominant and negatively impact the reactor per-formance [9,10]. The mass transfer limitations depend on the hydrogendepletion close the membrane surface and prevails when the hydrogentransport from the bulk in the fixed bed to the membrane surface isrelatively slow. As a result, concentration polarisation decreases thetrans-membrane driving force for the hydrogen transport. These aspectscan be reduced by using fluidized bed membrane reactors, which havesignificantly higher heat transfer rates compared to fixed bed mem-brane reactors, resulting in advantages in terms of heat managementand a much more even temperature distribution [11]. Moreover, it isexpected that the higher mass transfer rates also result in a reduction ofthe concentration polarisation.
However, when describing the steam reforming of biogas in a flui-dized bed membrane reactor, the concentration polarisation is stillexpected to influence the system performance significantly. These ef-fects are a result of the low methane and consequently hydrogen con-centrations and cannot be ignored. The present work evaluates a flui-dized bed membrane reactor for biogas steam reforming and theinfluence of concentration polarisation on the system performance. Theeffect of concentration polarisation is first analysed experimentally forhydrogen/nitrogen mixtures with and without the fluidized bed. Thesteam reforming of synthetic biogas mixtures (mainly CO2 and CH4) aswell as pure methane is evaluated for temperatures between 430 °C and530 °C and pressures up to 5 bar. The results are discussed, followed bythe description and validation of a developed phenomenological, one-dimensional, two-phase fluidized bed membrane reactor model. Themodel is then used to quantify the influence of the concentration po-larisation and its significance for the design of fluidized bed membranereactors for biogas reforming.
2. Experimental
2.1. Experimental setup
Single and mixed gas permeation tests to characterize the mem-brane performance and reforming experiments, were conducted in amembrane reactor consisting of a shell-and-tube configuration (seeFig. 1) where the reactor has a diameter of 4.27 cm and a total length of44 cm. The membrane is made of a thin PdAg layer deposited byelectroless plating onto an alumina porous tube from Rauschert. Themembrane was sealed using a graphite sealing method developed byFernandez et al. and the leakage was subsequently measured using anhelium/ethanol system [12]. The length of the membrane was 14.35 cmand with a diameter of 14.26mm resulting in a total membrane surfacearea of 64.3 cm2. The membrane thickness was measured by SEM(Phenom) analysis on a cross section of the membrane and was found tobe 5.2 µm. The membrane was integrated from the top flange of thereactor with a stainless-steel tube, such that a distance of 2 cm re-mained between the bottom gas distributor and the bottom membraneseal. Single and mix gas experiments were performed first withoutcatalyst particles, here referred to as empty tube. After these experi-ments the catalyst, a Rh based catalyst supplied by Johnson Matthey(particle size of 170 µm), was loaded into the reactor to perform the mixgas test under fluidized conditions and subsequently the (steam) re-forming experiments. The reactor system could be operated in twoconfigurations, viz. as a normal fluidized bed reformer and as a flui-dized bed membrane reactor, simply by opening and closing of themembrane permeate line. The minimum fluidization velocity of thecatalyst was experimentally determined at different temperatures andatmospheric pressure using the standard pressure-drop method. Thefeed flow rate for reactive experiments was selected in such a way thatthe fluidized bed was in the bubbling fluidization regime. The amountof catalyst was selected to cover the full active membrane surface, re-sulting in 165 g of catalyst. The reactor was placed inside an oven toensure isothermal operation. In the reforming experiments the tem-perature, pressure and feed gas composition was varied. The systemperformance was evaluated in terms of methane conversion (Eq. (4)),separation factor (SF, Eq. (5)) and hydrogen recovery factor (HRF, Eq.(6)) as defined below:
( )Methane conversion
F FF
CH CH out
CH in
,
,
in4, 4
4
=−
(4)
Fig. 1. Schematic representation of the experimental setup.
N. de Nooijer et al. Chemical Engineering Journal 348 (2018) 232–243
234

( )Separation factor
FF F
H perm
H perm H ret
,
, , .
2
2 2
=+ (5)
Hydrogen recovery factorF
F4H perm
CH in
,
,
2
4
=(6)
The gas feed to the reactor was controlled by Bronkhorst® digitalmass flow controllers. The feed of water was controlled by aBronkhorst® Coriflow liquid meter and steam was produced using aBronkhorst® controlled evaporator mixer. The pressure was controlledby a back pressure regulator supplied by Bronkhorst®. The permeateside was either operated at atmospheric pressure or at vacuum. Thevolumetric flow rate at the permeate side was measured using a Horibafilm flow meter. The composition of both the permeate and retentatestreams were measured using a Varian micro GC equipped with twomolecular sieve 5A columns and a PoraPlot Q column. The retentateflow rate is obtained from the nitrogen balance. The carbon balancewas satisfied with± 5% error for all experiments reported hereafter.The system has been tested at CH4/H2O ratios high enough such thatcarbon formation is thermodynamically unlikely to occur. The mem-brane has been visually inspected after the test and no carbon formationwas found. The catalyst has been analysed using thermogravimetricanalyses and no carbon formation was found.
2.2. Membrane performance characterization
Once the membrane was placed in the reactor, the nitrogen leakagewas monitored periodically. To activate the membrane, the system washeated up to 400 °C in nitrogen, once at this temperature the membranewas exposed to 2 Nl/min of air for 2min. Subsequently, the system wasflushed with nitrogen and heated up to 550 °C and left in a hydrogenenvironment until a stable hydrogen flux was obtained. After reachingstable conditions, the permeation tests were performed decreasing theoven temperature from 550 °C to 400 °C with steps of 50 °C; the resultsare shown in Fig. 2. The hydrogen permeability of the membrane couldbe well described as a function of the driving force using an exponent nequal to 0.5 (i.e. Sieverts’ law), as shown in Fig. 2. An activation energyand a pre-exponential factor of respectively 9.23 kJ/mol and4.57·10−8 mol m−1 s−1 Pa−0.5 were fitted to the experimental data.These values are comparable with the 9.99 kJ/mol and6.93·10−8 mol m−1 s−1 Pa−0.5 reported earlier by Fernandez et al. for asimilar membrane [13]. The initial ideal H2/N2 perm-selectivity wasfound to be 18,000 at 545 °C and 4576 at 384 °C with a transmembranepressure difference of 1 bar.
3. Model description
The reactor model developed in this work describes a membranefluidized bed section in which a dead-end perm-selective membranecan be integrated. It is an improvement of the model described byGallucci et al. [14]. The model was firstly developed by Deshmukh et al.and based on the frequently used bubble assemblage model proposed byKato and Wen [15,16]. In this approach, both the bubble and emulsionphases are divided into a number of CSTRs along the reactor. In par-ticular, Kato and Wen related the volume of the CSTR to the localbubble size, whereas Deshmukh et al. adopted a different approachwhere the CSTRs all have the same volume and the number of CSTRs isused describe the amount of gas back mixing in the system [15,17].
The steady state overall (bubble and emulsion phases) componentmass conservation equations, the total volume balance and the overallbalances for each component used in the model are formulated inTable 2. These equations consider the chemical transformations in theemulsion phase and a net gas production due to the chemical reactionsand gas extraction via the membrane. The equations are solved for eachsection in the fluidized bed reactor. Since the introduction of membranereduces the extent of back mixing, a large number of CSTRs is selected
representing plug flow behaviour. The empirical correlations for thedescription of the system hydrodynamics and mass transfer are ob-tained from literature and are described in Appendix I [16,18–20].Although these equations are developed for fluidized beds withoutmembranes, it is shown in prior works that a reasonable description ofthe system with immersed membranes can also be obtained [14,17].The chemical reactions are described using the kinetic rate laws byNumaguchi and Kikuchi for the steam reforming and water gas shiftreactions [21]. The kinetic parameters for the Rh based catalyst areobtained from Marra et al. [22]. The rate expressions and kineticparameters are provided in Appendix II. Because of the high steam-to-carbon ratio applied in the experimental conditions the dry reformingreaction can be assumed to be of negligible influence in the reactionsystem (this was also confirmed by separate kinetic tests not reportedhere for brevity).
The selective extraction of hydrogen in the model is described bySieverts’ law, Eq. (7), using the experimentally obtained parameters ofthe membrane.
Npt
e P P( )iE RT
H Retn
H Permn0 /
, . , .a2 2= − (7)
When describing hydrogen extraction from a mixture through ahighly selective and permeable membrane, Sieverts’ law is found to beinsufficient to predict the transmembrane flux [24,25]. Due to the de-pletion of the permeable species near the membrane and accumulationof the non-permeable species, a mass transfer boundary layer is formedalong the membrane (phenomena known as concentration polarisa-tion). To account for the mass transfer limitations induced and accu-rately describe the membrane permeation, the concentration at themembrane surface is required. In this work, the stagnant film model isapplied to determine the concentration at the membrane surface [26].In the stagnant film model, the following assumptions are applied:
• Steady state conditions;
• No axial convection in the film layer;
• No axial dispersion, only radial dispersion.
• The thickness of the stagnant film is assumed to remain constantalong the length of the membrane.
The boundary layer thickness is indicated with δ , see Fig. 3. Thesteady state mass balance of the shell around a cylindrical membrane inthe radial direction, as shown in Fig. 3, leads to Eq. (8), where Ni r, is theflux in the radial direction.
Fig. 2. Single gas test permeation results of hydrogen.
N. de Nooijer et al. Chemical Engineering Journal 348 (2018) 232–243
235

rddr
rN1 ( ) 0i r,− = (8)
The total flux through the film layer in the radial direction can bewritten as the sum of the drift flux and diffusive mass flux, Eq. (9), usingthe generalised Fick’s law, where Di represents the effective diffusivityof component i and Ctot the total concentration.
N D C dxdr
x Ni r i toti
i tot, = − + (9)
Since the membrane can be approximated as fully permselective forH2, Ntot equals Ni r, , so further rearranging Eq. (9) leads to Eq. (10).
N D Cx
dxdr
11i r i tot
i
i, = −
− (10)
From the steady state mass balance, it follows that the term rNi r, isconstant over the layer.
rN c r R δ N Nat ,i r memb i r i r δ, . , , m= = + = + (11)
Combining this and Eq. (10) and integrating over the boundarylayer of thickness δ yields Eq. (12)
( )N D C
R δ
xxln 1
ln11i r δ
i tot
membδ
R
i memb
i bulk,
.
, .
,m
memb.
⎜ ⎟=+ +
⎛⎝
−−
⎞⎠
+
(12)
Since the flux through film layer and membrane are equal, Eq. (12)can be used to find xi memb, . and obtain the partial pressure of hydrogenat the surface of the membrane.
4. Results and discussion
4.1. Permeation of N2 and H2 mixtures
Gas permeation experiments were performed to determine the in-fluence of the concentration polarisation on the membrane separationand to validate the implementation of the stagnant film in the model.Hydrogen permeation in the empty tube system (no catalyst bed) from a75% H2/N2 mixture was measured at different pressures. After theseexperiments the catalyst was loaded into the system. The presence ofthe catalyst should not influence the hydrogen permeation from a purehydrogen mixture. However, the experiment with the 75% H2/N2
mixture showed that the flux was increased compared to the empty tubesystem. In Fig. 4, the experimental results are shown together with themodel results.
The extent of the concentration polarisation can be represented bythe Concentration Polarisation Coefficient (CPC). Several definitions ofthe CPC exist in literature however in this work the definition presentedby Caravella et al. is used [24]. Taking the logarithmic average intoaccount in determining the pressure difference over the module. TheCPC for both the results of the empty and fluidized bed system per-meation test are shown in Fig. 5. The concentration polarisation coef-ficient is reduced by the introduction of the fluidized bed from 0.41 to0.32 at 3 bar, at 5 bar is decreased from 0.52 to 0.34.
Because the model without concentration polarisation does not takemass transfer limitations into account, the hydrogen flux is over-pre-dicted. This shows that a description taking the concentration polar-isation into account is indeed required in the model. To describe thepermeation results in the empty tube system, a δ of 1.125 cm was fittedto the experiment at 4 bar total pressure. In the work of Helmi et al.[27] it is shown that the radial dispersion in the fluidized bed is largerthan the molecular gas diffusion coefficient Di. Since there is no generalcorrelation available for the radial dispersion in membrane fluidizedbeds its value was estimated using CFD simulations at 1·10−4, whichwas also adopted in this work. Accordingly, a δ of 0.975 cm was foundto correctly describe the hydrogen flux. The increase in the hydrogen
Table 2Mass balance equations for each CSTR in each section of the fluidized bedmembrane reactor [23].
Total mass balance
u A ρ u A ρ u A ρ u A ρ
N M A ε N M A ε( (1 )) 0b ns T b n b n
s T b n e ns
T e n e ns
T e n
inc
i molmembrane w i membrane b n i mol
membrane w i membrane b n
, 1 , 1 , , , 1 , 1 , ,
1 , , , , , ,
− + −
+ ∑ + − =− − − −
=Bubble phase component mass balance
u A ρ u A ρ K V ρ w w
N M A ε w SF Q w SF Q
( )
[ ( ) ( )] 0b ns T b n b n
s T b n inc
be i n b n b n b i n e i n
inc
i molmembrane w i membrane b n e i n b i n
, 1 , 1 , , 1 , , , , , , , ,
1 , , , , , , ,
− − ∑ −
+ ∑ + − − =− − =
=Emulsion phase component mass balance
( )u A ρ u A ρ K V ρ w w
N M A ε ν r V ρ ε
w SF Q w SF Q
( )
(1 ) (1 )
[ ( ) ( )] 0
e ns
T e n e ns
T e n inc
be i n b n b n b i n e i n
inc
i molmembrane w i membrane b n j
nrxnj i j e n p n e
e i n b i n
, 1 , 1 , , 1 , , , , , , , ,
1 , , , 1 , , ,
, , , ,
− + ∑ −
+ ∑ − − ∑ −
+ − − =
− − =
= =
Transfer term
Q u A ρ u A ρ K V ρ w w
N M A ε
( )
(1 )
e ns
T e n e ns
T e n inc
be i n b n b n b i n e i n
inc
i molmembrane w i membrane b n
, 1 , 1 , , 1 , , , , , , , ,
1 , , ,
= − + ∑ −
± ∑ −
− − =
=
u A u A εu A u A εu A u A ε
(1 )
(1 )
e ns
T e n T b n
bs T tot T b n
bs T tot T b n
, , ,
,0 ,
,0 ,
= −== −
Fig. 3. Schematic description of the film around the membrane.
Fig. 4. Permeated hydrogen flux at different total pressures from a 75% H2/N2
mixture at 380 °C, with a total feed flow of 3.6 Nl/min.
N. de Nooijer et al. Chemical Engineering Journal 348 (2018) 232–243
236

flux in the fluidized bed compared to the empty system can thus beexplained by the increase of the radial dispersion of the system due tothe bubbling behaviour of the fluidized bed corresponding to a decreasein δ.
Fig. 5a shows the film layer thickness at 3 bar fitted for differentfeed fractions of hydrogen in the system without fluidized bed for dif-ferent total feed flow rates. To indicate the effect of hydrogen depletionon the results, the bars in Fig. 5 show the inlet and outlet fraction ofhydrogen of the system. The film layer thickness increases with an in-crease in the partial pressure of hydrogen, roughly between 6 and12mm. Analysis of the conditions of these results show that the de-crease in δ with a decrease of the partial pressure of hydrogen andfluidization velocity is related to the increase in the Reynolds number ofthe system, as shown in Fig. 5b, demonstrating the strong influence ofthe hydrodynamics on the extent of the concentration polarisation.However, for the fluidized bed there is no correlation available to get agood estimation of the δ as a function of the different operating con-ditions. Therefore, in this work δ is an adjustable parameter of themodel and obtained by fitting to the results of a base case reforming
experiment performed at the following conditions: 480 °C, a totalpressure of 3 bar, a total feed flow rate of 3.6 Nl/min and a feed dis-tribution of CH4:CO2:H2O=1:0.7:3. The δ obtained from the fittingwas 0.54 cm as a result of the more vigorous hydrodynamics of thefluidized bed; this constant δ is further used to describe all reformingexperiments presented in the following analysis. The CPC for the systemwith biogas reforming was found to be 0.78, with the use of the hy-drogen concentrations obtained from the model.
4.2. Biogas steam reforming
To validate the model for the reforming of synthetic biogas, ex-periments were carried out at temperatures between 430 °C and 540 °C,with CO2/CH4 feed ratios ranging from 0 to 0.9, pressures from 2 bar upto 5 bar and a range of steam-to-carbon ratios (SCR) from 2 to 4. Thestability of the system was monitored using the prior mentioned basecase experiment together with the performance of the membrane. Thenitrogen and hydrogen permeability of the membrane increased overtime: the fluidization roughens the membrane surface increasing theactive area for hydrogen permeation but also creating defects for ni-trogen to pass. The discrepancy between the model and experimentswas therefore higher for the experiments varying the SCR, as they wereperformed in a later stage of the system. All other results showed goodagreement with the model and the use of one single δ showed to besufficient over the investigated experimental ranges. From Figs. 6 to 9the experimental results together with the model predictions are shownin terms of methane conversion, SF and HRF. The effects of the studiedparameters will be further elaborated to show the effects and the dif-ferences between methane steam reforming (MSR) and biogas steamreforming (BSR). The impact of the temperature is studied for threedifferent values, a comparison is made between MSR and BSR, all theother parameters are studied with and without the selective extractionof hydrogen. In all cases, the experimental results and the model pre-diction fit with the predicted equilibrium conversion. The cases withoutextraction of hydrogen behaved as expected for SMR: the methaneconversion increases with temperature due to the endothermic natureof the system (Fig. 6); a decrease in methane conversion with increasingpressure as a result of the negative effect of pressure on the SMR re-action (Fig. 7) and when CO2 in the feed is increased, to form thesynthetic biogas mixture, the conversion reduces due to the high con-centration of CO2 (Figs. 6 and 8). The increase in H2O content on theother hand had a positive effect on the methane conversion, since this is
Fig. 5. Concentration polarisation coefficient for the empty tube and the flui-dized bed system at different pressures.
Fig. 6. A: Film layer thickness for different hydrogen fractions at 3 bar and 370 °C for different total feed flow rates in system without fluidized bed. B: the thicknessof the boundary layer as function of the Reynolds number.
N. de Nooijer et al. Chemical Engineering Journal 348 (2018) 232–243
237

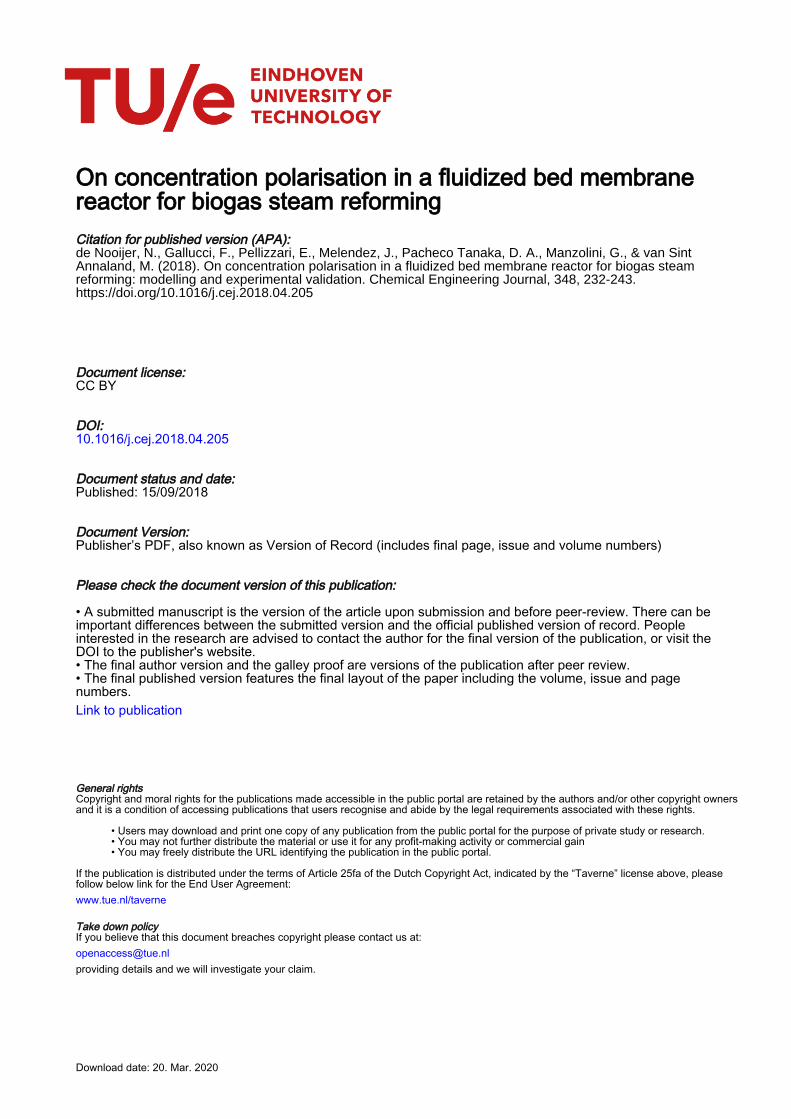
a reactant forcing the equilibrium to the product side (Fig. 9). Whenhydrogen was extracted from the system the equilibrium was shiftedupwards. The extent of this shift depends on the permeability of themembrane and the transmembrane driving force. Focusing on tem-perature, the permeability of the membrane increases with temperatureshowing a higher SF and HRF and thus shift of the conversion. Amaximum methane conversion of 72% and 68% for respectively MSRand BSR at 533 °C was obtained. The transmembrane pressure is strictlyrelated to the system pressure, therefore increasing the pressure resultsin an increase of SF as well as HRF. Over the tested range, the con-version increased by 50% to 105% with respect to the conversionwithout membrane. Although, it was not possible to work at higherpressures in the experimental system it can be expected that at higherpressure, hence higher HRF, the conversion would increase with pres-sure. In this way, the system can overcome the negative effect of thepressure on the SMR reaction. The study of different BSR mixtures withdifferent CO2/CH4 ratios showed a constant shift in equilibrium, as theSF was not affected by the higher feed of CO2. The equilibrium
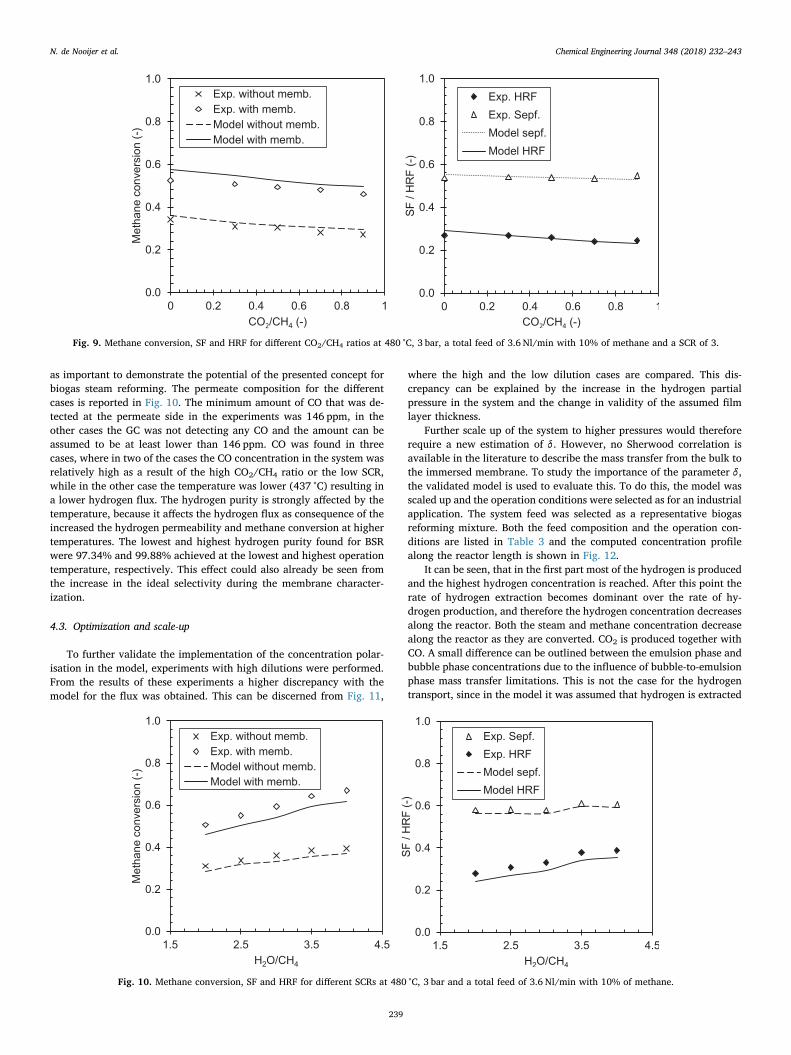
conversion and HRF still decreased with an increase in the CO2 fractionand also the concentration of CO was increased on the retentate sidewith increasing CO2/CH4, showing the effect of the CO2 on the WGSequilibrium. CO poisoning could be assumed to be negligible, as the SFwas not affected and considering the temperature the experimentswhere performed at [28]. The dilution effect of CO2 could not be stu-died well in these experiments since the system feed was balanced withCO2, later performed experiments with lower dilutions also showed nosignificant effect of an increase in the CO2 content in the feed on the SF.As mentioned before, the methane conversion increases with higherSCR, however, also the shift showed a small increase. This increase inshift can be explained as follows: as more hydrogen is produced, alsothe transmembrane pressure difference is increased, which can be seenfrom a slight increase in SF. During the experiments, there was no in-dication of carbon formation, and after the experiment no carbon wasvisible in the system or on the membrane.
The methane conversion, SF and HRF are important parameters toassess the reactor performance, although the purity of the hydrogen is
Fig. 7. Methane conversion, SF and HRF of SMR and BSR (CO2/CH4=0.7) as a function of temperature at 3 bar, a total feed of 3.6 Nl/min with 10% of methane anda SCR of 3.
Fig. 8. Methane conversion, SF and HRF for different pressures at 480 °C, a total feed of 3.6 Nl/min with 10% of methane and a SCR of 3.
N. de Nooijer et al. Chemical Engineering Journal 348 (2018) 232–243
238
as important to demonstrate the potential of the presented concept forbiogas steam reforming. The permeate composition for the differentcases is reported in Fig. 10. The minimum amount of CO that was de-tected at the permeate side in the experiments was 146 ppm, in theother cases the GC was not detecting any CO and the amount can beassumed to be at least lower than 146 ppm. CO was found in threecases, where in two of the cases the CO concentration in the system wasrelatively high as a result of the high CO2/CH4 ratio or the low SCR,while in the other case the temperature was lower (437 °C) resulting ina lower hydrogen flux. The hydrogen purity is strongly affected by thetemperature, because it affects the hydrogen flux as consequence of theincreased the hydrogen permeability and methane conversion at highertemperatures. The lowest and highest hydrogen purity found for BSRwere 97.34% and 99.88% achieved at the lowest and highest operationtemperature, respectively. This effect could also already be seen fromthe increase in the ideal selectivity during the membrane character-ization.
4.3. Optimization and scale-up
To further validate the implementation of the concentration polar-isation in the model, experiments with high dilutions were performed.From the results of these experiments a higher discrepancy with themodel for the flux was obtained. This can be discerned from Fig. 11,
where the high and the low dilution cases are compared. This dis-crepancy can be explained by the increase in the hydrogen partialpressure in the system and the change in validity of the assumed filmlayer thickness.
Further scale up of the system to higher pressures would thereforerequire a new estimation of δ . However, no Sherwood correlation isavailable in the literature to describe the mass transfer from the bulk tothe immersed membrane. To study the importance of the parameter δ,the validated model is used to evaluate this. To do this, the model wasscaled up and the operation conditions were selected as for an industrialapplication. The system feed was selected as a representative biogasreforming mixture. Both the feed composition and the operation con-ditions are listed in Table 3 and the computed concentration profilealong the reactor length is shown in Fig. 12.
It can be seen, that in the first part most of the hydrogen is producedand the highest hydrogen concentration is reached. After this point therate of hydrogen extraction becomes dominant over the rate of hy-drogen production, and therefore the hydrogen concentration decreasesalong the reactor. Both the steam and methane concentration decreasealong the reactor as they are converted. CO2 is produced together withCO. A small difference can be outlined between the emulsion phase andbubble phase concentrations due to the influence of bubble-to-emulsionphase mass transfer limitations. This is not the case for the hydrogentransport, since in the model it was assumed that hydrogen is extracted
Fig. 9. Methane conversion, SF and HRF for different CO2/CH4 ratios at 480 °C, 3 bar, a total feed of 3.6 Nl/min with 10% of methane and a SCR of 3.
Fig. 10. Methane conversion, SF and HRF for different SCRs at 480 °C, 3 bar and a total feed of 3.6 Nl/min with 10% of methane.
N. de Nooijer et al. Chemical Engineering Journal 348 (2018) 232–243
239

from both the emulsion and bubble phase. To evaluate the importanceof the thickness δ, the system was evaluated for three different cases: δequal to 0.54 cm as resulted from the permeation experiments, a δ of0.25 cm and 0.75 cm. The results of these calculations are shown inFig. 13. The thickness δ has a significant influence on the system per-formance. The conversion is shown as function of the membrane pro-ductivity, indicating the amount of hydrogen that can be obtained permembrane area. The productivity of the membranes reduces pro-portionally with the thickness of δ . Which means that a decrease inthickness δ of 25% leads in an increase of 25% in the productivity.These results not only highlight the importance of the film layerthickness in the design of fluidized bed membrane reactors, but alsoindicate the potential of improving a membrane system by decreasingthe concentration polarisation (See Fig 14).
Fig. 11. Permeate composition for: (a) CO2/CH4 ratio, (b) temperature, (c) pressure and (d) SCR.
Table 3Conditions and feed composition used for the analyses of the scaled-up system.
Parameter value Unit
Pressure 12 barTemperature 550 °CPermeate pressure 0.1 barH2O/CH4 2.4 –CO2/CH4 0.76 –N2/CH4 0.37 –u/umf 7.41 –
Fig. 12. Parity plot of the predicted and measured hydrogen flow for high andlow dilution conditions.
N. de Nooijer et al. Chemical Engineering Journal 348 (2018) 232–243
240

5. Conclusions
Hydrogen production via steam reforming of biogas has been ex-perimentally investigated in a fluidized bed membrane reactor and theresults were used to validate a phenomenological, one-dimensional,two-phase model, that was extended to account for concentration po-larisation using a stagnant boundary layer film model. A PdAg mem-brane supported on Al2O3 has been used both in an empty shell-and-tube configuration and in a fluidized bed with a Jonson Matthey Rhbased catalyst. Permeation results in the various system configurationswere used to determine the thickness of the mass transfer boundarylayer (δ). The importance of the hydrogen concentration and fluidiza-tion velocity on the extent of concentration polarisation is shown. Agood description of the reforming experiments over the entire range ofexperimental conditions was obtained by the model when using thesame thickness δ of 0.54 cm. Experiments with synthetic biogas
mixtures showed lower conversions, however, the hydrogen separationwas not affected and the previous estimation of δ was sufficient.However, when scaling up the system to lower dilutions showed alarger error in the model predictions. The model was used to furtherscale up the system and study the dependency of the thickness δ. It wasshown that the thickness significantly influenced the system pro-ductivity and δ scaled proportionally with the productivity.
Acknowledgements
The presented work is funded within BIONICO. This project hasreceived funding from the Fuel Cells and Hydrogen 2 Joint Undertakingunder grant agreement No 671459. This Joint Undertaking receivessupport from the European Union’s Horizon 2020 Research andInnovation Programme, Hydrogen Europe and N.ERGHY.
Appendix
Appendix I. Empirical correlation used in the model for the description of the system hydrodynamics and mass transfer
Parameter Equation Refs.
Archimedes numberAr g
d ρ ρ ρ
μ
( )p g p g
g
3
2=−
Minimum fluidization velocityu Ar( (27.2) 0.0408 27.2)mf
μ
ρ d2g
g p= ⎛
⎝⎞⎠
+ −[19]
Bed voidage at minimum fluidization velocityε Ar0.586mf
ρ
ρ0.29
0.021g
p= ⎛
⎝⎞⎠
−[19]
Projected reactor area A DTπ
T42=
Bubble diameter ( )d d d d e( )b b b b,max ,max ,0z
DT0.3
= − −[18]
Initial bubble diameter d u u0.376( )b mf,0 02= − [20]
Maximum bubble diameter d A u u Dmin(1.6374 ( ); )b T mf T,max 0= −Average bubble diameter
d e eb avgd d d
H H,( ) 0.3 0.3b b b
DT HDT
HDT
,max ,max ,0 0.32 1
2 1= ⎛
⎝− ⎞
⎠
+ −
−− −
Average bubble rise u u u gd0.711( )b avg mf b avg, 0 ,0.5= − +
Emulsion velocity ueu f u
f1b b
b
0= −−
Fig. 13. Composition along the reactor at 550 °C, 12 bar, load-to-surface ratioof 3 m3
CH₄-−2memb. h−1, continues lines and dashed lines represent respectively
emulsion and bubble phase gas fractions.Fig. 14. Membrane productivity as function of methane conversion for threedifferent thicknesses of δ .
N. de Nooijer et al. Chemical Engineering Journal 348 (2018) 232–243
241

Bubble phase fraction fbu u
umf
b avg
0
,=
− [16]
Emulsion phase fraction f f1e b= −Initial superficial bubble gas velocity
u u fbs
b b o,0 ,0 ,= ( )f 1bHH,0mf
f= −
Height of the bed at min. fluid. Velocity H Hmf sε
ε1
1s
mf= −
−[18]
Height of bed expansion H Hf mfc
c c1
1 2= −
C e1 uu1
b
b avgDT
,0
,
0.275= − −
( )C e1u
u2bs
b avgDT
,0
,
0.275= − −
Gas exchange coefficientBubble to cloud ( )K 4.5 5.85bcu
dD g
dmf
b avg
g
b avg,
0.5 0.25
,5/4⎜ ⎟= + ⎛
⎝⎞⎠
[20]
Cloud to emulsionK 6.77ce
D ε ud
0.5g mf b avg
b avg
,
,3⎜ ⎟= ⎛
⎝⎞⎠
Bubble to emulsion mass transfer resistanceK K K
1 1 1be bc ce
= +
Binary diffusivities
Dg
T
P V V
10Mw i Mw j
D i D j
3 1.75 1,
1,
12
,
13
,
13
2=⎜ ⎟⎛⎝
+ ⎞⎠
⎡
⎣⎢ + ⎤
⎦⎥
−[29]
Appendix II. Reaction rate laws and kinetic parameters
Reaction Stoichiometry and reaction rate equation Refs.
Methane steam reforming Eq. (1)
rSMR
k P P
P
SMR CH H OPH PCO
KSMReq
H O
4 22
3
21.596=
⎛
⎝⎜ −
⎞
⎠⎟
[21]
Water gas shift Eq. (2)
rWGS
k P P
P
WGS CO H OPH PCO
KWGSeq
H O
22 2
2=
⎛
⎝⎜ − ⎞
⎠⎟
k A ei i
Eact iRT
,=
⎛⎝
− ⎞⎠
Constant Value Unit
ASMR 9.74·104 mol bar−0.404 kgcat−1 s−1 [22]AWGS 17.2·102 Mol bar−1 kgcat−1 s−1
Eact SMR, 83.6·103 J/molEact WGS, 54.53·103 J/mol
References
[1] F. Van Foreest, Perspectives for Biogas in Europe, (2012).[2] L. Yang, X. Ge, C. Wan, F. Yu, Y. Li, Progress and perspectives in converting biogas
to transportation fuels, Renew. Sustain. Energy Rev. 40 (2014) 1133–1152, http://dx.doi.org/10.1016/j.rser.2014.08.008.
[3] J. Xuan, M.K.H. Leung, D.Y.C. Leung, M. Ni, A review of biomass-derived fuelprocessors for fuel cell systems, Renew. Sustain. Energy Rev. 13 (2009) 1301–1313,http://dx.doi.org/10.1016/j.rser.2008.09.027.
[4] S.D. Angeli, G. Monteleone, A. Giaconia, A.A. Lemonidou, ScienceDirect State-of-the-art catalysts for CH 4 steam reforming at low temperature, Int. J. HydrogenEnergy. 39 (2013) 1979–1997, http://dx.doi.org/10.1016/j.ijhydene.2013.12.001.
[5] F. Gallucci, E. Fernandez, P. Corengia, M. van Sint Annaland, Recent advances onmembranes and membrane reactors for hydrogen production, Chem. Eng. Sci. 92(2013) 40–66, http://dx.doi.org/10.1016/j.ces.2013.01.008.
[6] T. Sato, T. Suzuki, M. Aketa, Y. Ishiyama, K. Mimura, N. Itoh, Steam reforming ofbiogas mixtures with a palladium membrane reactor system, Chem. Eng. Sci. 65(2010) 451–457, http://dx.doi.org/10.1016/j.ces.2009.04.013.
[7] A. Iulianelli, S. Liguori, Y. Huang, A. Basile, Model biogas steam reforming in a thinPd-supported membrane reactor to generate clean hydrogen for fuel cells, J. PowerSources 273 (2015) 25–32, http://dx.doi.org/10.1016/j.jpowsour.2014.09.058.
[8] J.M. Vásquez Castillo, T. Sato, N. Itoh, Effect of temperature and pressure on hy-drogen production from steam reforming of biogas with Pd-Ag membrane reactor,Int. J. Hydrogen Energy 40 (2015) 3582–3591, http://dx.doi.org/10.1016/j.ijhydene.2014.11.053.
[9] S. Hara, K. Sakaki, N. Itoh, Decline in hydrogen permeation due to concentration
polarization and CO hindrance in a palladium membrane reactor, Ind. Eng. Chem.Res. 38 (1999) 4913–4918, http://dx.doi.org/10.1021/ie990200n.
[10] N. Mori, T. Nakamura, K.I. Noda, O. Sakai, A. Takahashi, N. Ogawa, et al., Reactorconfiguration and concentration polarization in methane steam reforming by amembrane reactor with a highly hydrogen-permeable membrane, Ind. Eng. Chem.Res. 46 (2007) 1952–1958, http://dx.doi.org/10.1021/ie060989j.
[11] S.H. Volkers, Kuipers Heat Transfer in a Membrane Assisted Bubbling Fluidized Bedwith Immersed Horizontal Tubes Heat Transfer in a Membrane Assisted BubblingFluidized Bed with Immersed Horizontal Tubes, (2005).
[12] E. Fernandez, A. Helmi, K. Coenen, J. Melendez, J.L. Viviente, D.A. Pacheco,Tanaka, et al., Development of thin Pd–Ag supported membranes for fluidized bedmembrane reactors including WGS related gases, Int. J. Hydrogen Energy 40 (2015)3506–3519, http://dx.doi.org/10.1016/j.ijhydene.2014.08.074.
[13] E. Fernandez, K. Coenen, A. Helmi, J. Melendez, J. Zuñiga, D.A. Pacheco, Tanaka,et al., Preparation and characterization of thin-film Pd–Ag supported membranesfor high-temperature applications, Int. J. Hydrogen Energy (2015), http://dx.doi.org/10.1016/j.ijhydene.2015.08.050.
[14] F. Gallucci, M. van Sint Annaland, J.A.M. Kuipers, Autothermal reforming of me-thane with integrated CO2 capture in a novel fluidized bed membrane reactor. Part1: experimental demonstration, Top. Catal. 51 (2008) 133–145, http://dx.doi.org/10.1007/s11244-008-9126-8.
[15] S.A.R.K. Deshmukh, J.A. Laverman, A.H.G. Cents, M. Van Sint Annaland,J.A.M. Kuipers, Development of a membrane-assisted fluidized bed reactor. 1. Gasphase back-mixing and bubble-to-emulsion phase mass transfer using tracer injec-tion and ultrasound experiments, Ind. Eng. Chem. Res. (2005) 5955–5965.
[16] K. Kato, C.Y. Wen, Bubble assemblage model for fluidized bed catalytic reactors,
N. de Nooijer et al. Chemical Engineering Journal 348 (2018) 232–243
242

Chem. Eng. Sci. 24 (1969) 1351–1369, http://dx.doi.org/10.1016/0009-2509(69)85055-4.
[17] S.A.R.K. Deshmukh, J.A. Laverman, M. Van Sint Annaland, J.A.M. Kuipers,Development of a membrane-assisted fluidized bed reactor. 2. Experimental de-monstration and modeling for the partial oxidation of methanol, Ind. Eng. Chem.Res. (2005) 5966–5976.
[18] S. Mori, C.Y. Wen, Estimation of bubble diameter in gaseous fluidized beds, AIChEJ. 21 (1975) 109–115, http://dx.doi.org/10.1002/aic.690210114.
[19] C.-Y. Shiau, C.-J. Lin, Equation for the superficial bubble-phase gas velocity influidized beds, AIChE J. 37 (1991) 953–954, http://dx.doi.org/10.1002/aic.690370619.
[20] D. Kunii, O. Levenspiel, Fluidization Engineering, Elsevier, 1991, , http://dx.doi.org/10.1016/B978-0-08-050664-7.50012-3.
[21] T. Numaguchi, K. Kikuchi, Intrinsic kinetics and design simulation in a complexreaction network; steam-methane reforming, Chem. Eng. Sci. 43 (1988)2295–2301, http://dx.doi.org/10.1016/0009-2509(88)87118-5.
[22] L. Marra, P.F. Wolbers, F. Gallucci, M. van Sint Annaland, Development of aRhZrO2 catalyst for low temperature autothermal reforming of methane in mem-brane reactors, Catal. Today 236 (2014) 23–33, http://dx.doi.org/10.1016/j.cattod.2013.10.069.
[23] F. Gallucci, M. van Sint Annaland, J. Kuipers, Autothermal reforming of methanewith integrated CO2 capture in a novel fluidized bed membrane reactor. Part 2
comparison of reactor configurations, Top. Catal. 51 (2008) 146–157, http://dx.doi.org/10.1007/s11244-008-9127-7.
[24] A. Caravella, G. Barbieri, E. Drioli, Concentration polarization analysis in self-supported Pd-based membranes, Sep. Purif. Technol. 66 (2009) 613–624, http://dx.doi.org/10.1016/j.seppur.2009.01.008.
[25] F. Gallucci, M. Van Sint Annaland, J.A.M. Kuipers, Theoretical comparison ofpacked bed and fluidized bed membrane reactors for methane reforming, Int. J.Hydrogen Energy, Elsevier Ltd, 2010, pp. 7142–7150, , http://dx.doi.org/10.1016/j.ijhydene.2010.02.050.
[26] A.L. Zydney, Stagnant film model for concentration polarization in membranesystems, J. Membr. Sci. 130 (1997) 275–281, http://dx.doi.org/10.1016/S0376-7388(97)00006-9.
[27] A. Helmi, R.J.W. Voncken, A.J. Raijmakers, I. Roghair, F. Gallucci, M. van SintAnnaland, On concentration polarization in fluidized bed membrane reactors,Chem. Eng. J. 332 (2018) 464–478, http://dx.doi.org/10.1016/j.cej.2017.09.045.
[28] H. Amandusson, L.G. Ekedahl, H. Dannetun, Effect of CO and O2 on hydrogenpermeation through a palladium membrane, Appl. Surf. Sci. 153 (2000) 259–267,http://dx.doi.org/10.1016/S0169-4332(99)00357-8.
[29] E.N. Fuller, P.D. Schettler, J.C. Giddings, A new method for prediction of binarygas-phase diffusion coefficients, Ind. Eng. Chem. 58 (1966) 18–27, http://dx.doi.org/10.1021/ie50677a007.
N. de Nooijer et al. Chemical Engineering Journal 348 (2018) 232–243
243
Related Documents