* Correspondence to: Giovanni Fiengo, Dipartimento di Informatica e Sistemistica, Universita` di Napoli Federico II, Italy. E-mail: gi"engo@unina.it Copyright 2001 John Wiley & Sons, Ltd. INTERNATIONAL JOURNAL OF ROBUST AND NONLINEAR CONTROL Int. J. Robust Nonlinear Control 2001; 11:1073 } 1094 (DOI: 10.1002/rnc.645) On-board diagnosis for three-way catalytic converters Giovanni Fiengo*, Luigi Glielmo and Stefania Santini Dipartimento di Informatica e Sistemistica, Universita ` di Napoli Federico II, Italy Facolta ` di Ingegneria, Universita ` del Sannio, Benevento, Italy SUMMARY On-board fault diagnosis is critical for the automotive industry. Recently, new on-board diagnostic system requirements (OBD II) have been enforced on California vehicles and new legislation will become stricter and stricter; moreover such requirements have also been extended in Europe (EOBD). Government regulations will require monitoring vehicle emissions and alerting the driver if the exhaust after-treatment system is not working properly. To meet these requirement, sophisticated diagnostic algorithms have to be developed. This paper presents a model-based stochastic approach for fault detection with application to automotive exhaust-gas after-treatment systems. The algorithm, based on relatively simple control-oriented models of the three-way catalytic converter and the oxygen sensor, is suitable for real-time, on-board applications. The overall strategy has been tuned and validated on the basis of experimental data. Copyright 2001 John Wiley & Sons, Ltd. KEY WORDS: fault detection; TWC modeling; exhaust-gas after-treatment; automotive control. 1. INTRODUCTION Strict automotive emissions standards required the introduction on the vehicle of a three-way catalytic converter (TWC) in order to post-treat the polluting gases produced by combustion (Figure 1). As is well known, the converter chemically enables the removal of carbon monoxide, oxides of nitrogen and hydrocarbons (see Figure 2). To let the catalyzed reactions proceed simultaneously with satisfactory e$ciency in a warmed-up converter, the mixture supplied to the catalyst has to be stoichiometric (Figure 3). In current technology gasoline engines, an oxygen sensor (-sensor), placed in the exhaust pipe before the catalyst, is used as a feedback control signal for the fuel injection system in order to ensure stoichiometry of the mixture. Unfortunately, emission performance can be compromised by the durability of emission control components, failures, component malfunctions or improper maintenance. It is apparent that the emission performance of a vehicle has to be constantly monitored by checking certain parameters that are crucial for e$ciency of the after-treatment system.

Welcome message from author
This document is posted to help you gain knowledge. Please leave a comment to let me know what you think about it! Share it to your friends and learn new things together.
Transcript
*Correspondence to: Giovanni Fiengo, Dipartimento di Informatica e Sistemistica, Universita di Napoli Federico II,Italy.
�E-mail: gi"[email protected]
Copyright � 2001 John Wiley & Sons, Ltd.
INTERNATIONAL JOURNAL OF ROBUST AND NONLINEAR CONTROLInt. J. Robust Nonlinear Control 2001; 11:1073}1094 (DOI: 10.1002/rnc.645)
On-board diagnosis for three-way catalytic converters
Giovanni Fiengo��*��, Luigi Glielmo� and Stefania Santini�
�Dipartimento di Informatica e Sistemistica, Universita di Napoli Federico II, Italy�Facolta di Ingegneria, Universita del Sannio, Benevento, Italy
SUMMARY
On-board fault diagnosis is critical for the automotive industry. Recently, new on-board diagnostic systemrequirements (OBD II) have been enforced on California vehicles and new legislation will become stricterand stricter; moreover such requirements have also been extended in Europe (EOBD). Governmentregulations will require monitoring vehicle emissions and alerting the driver if the exhaust after-treatmentsystem is not working properly. To meet these requirement, sophisticated diagnostic algorithms have to bedeveloped. This paper presents a model-based stochastic approach for fault detection with application toautomotive exhaust-gas after-treatment systems. The algorithm, based on relatively simple control-orientedmodels of the three-way catalytic converter and the oxygen sensor, is suitable for real-time, on-boardapplications. The overall strategy has been tuned and validated on the basis of experimental data. Copyright� 2001 John Wiley & Sons, Ltd.
KEY WORDS: fault detection; TWC modeling; exhaust-gas after-treatment; automotive control.
1. INTRODUCTION
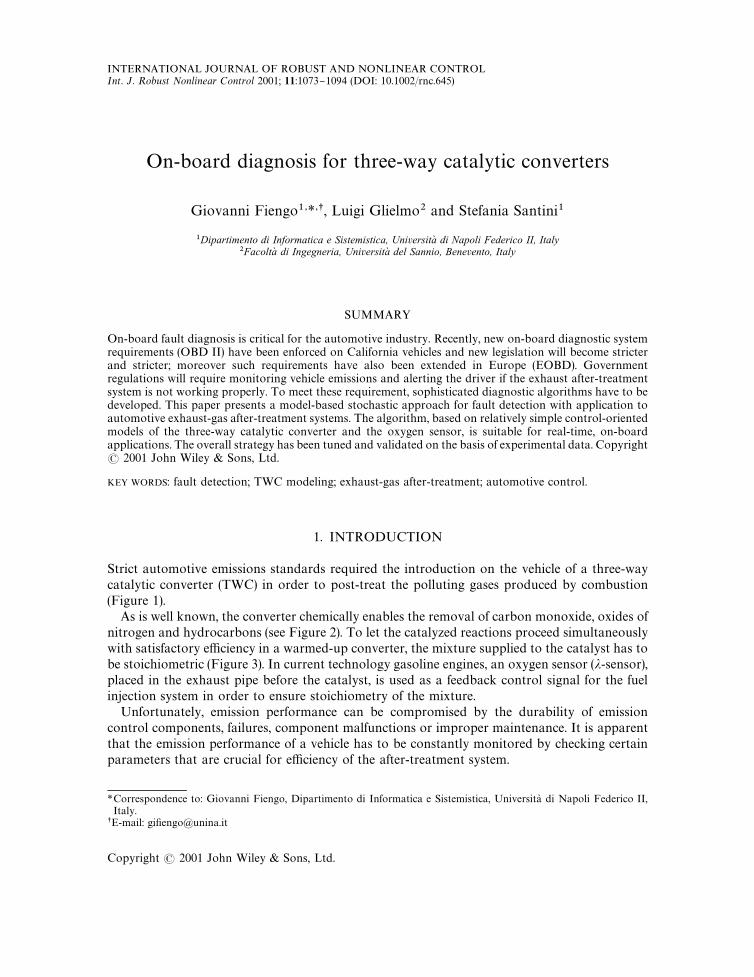
Strict automotive emissions standards required the introduction on the vehicle of a three-waycatalytic converter (TWC) in order to post-treat the polluting gases produced by combustion(Figure 1).As is well known, the converter chemically enables the removal of carbon monoxide, oxides of
nitrogen and hydrocarbons (see Figure 2). To let the catalyzed reactions proceed simultaneouslywith satisfactory e$ciency in a warmed-up converter, the mixture supplied to the catalyst has tobe stoichiometric (Figure 3). In current technology gasoline engines, an oxygen sensor (�-sensor),placed in the exhaust pipe before the catalyst, is used as a feedback control signal for the fuelinjection system in order to ensure stoichiometry of the mixture.Unfortunately, emission performance can be compromised by the durability of emission
control components, failures, component malfunctions or improper maintenance. It is apparentthat the emission performance of a vehicle has to be constantly monitored by checking certainparameters that are crucial for e$ciency of the after-treatment system.
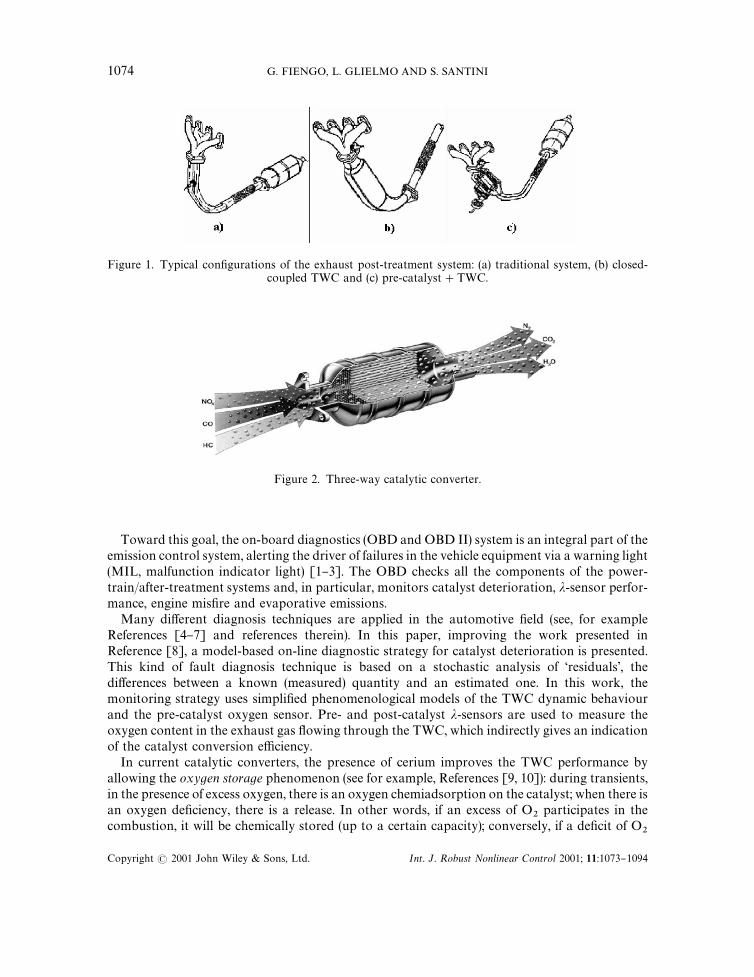
Figure 1. Typical con"gurations of the exhaust post-treatment system: (a) traditional system, (b) closed-coupled TWC and (c) pre-catalyst#TWC.
Figure 2. Three-way catalytic converter.
Toward this goal, the on-board diagnostics (OBD and OBD II) system is an integral part of theemission control system, alerting the driver of failures in the vehicle equipment via a warning light(MIL, malfunction indicator light) [1}3]. The OBD checks all the components of the power-train/after-treatment systems and, in particular, monitors catalyst deterioration, �-sensor perfor-mance, engine mis"re and evaporative emissions.Many di!erent diagnosis techniques are applied in the automotive "eld (see, for example
References [4}7] and references therein). In this paper, improving the work presented inReference [8], a model-based on-line diagnostic strategy for catalyst deterioration is presented.This kind of fault diagnosis technique is based on a stochastic analysis of &residuals', thedi!erences between a known (measured) quantity and an estimated one. In this work, themonitoring strategy uses simpli"ed phenomenological models of the TWC dynamic behaviourand the pre-catalyst oxygen sensor. Pre- and post-catalyst �-sensors are used to measure theoxygen content in the exhaust gas #owing through the TWC, which indirectly gives an indicationof the catalyst conversion e$ciency.In current catalytic converters, the presence of cerium improves the TWC performance by
allowing the oxygen storage phenomenon (see for example, References [9, 10]): during transients,in the presence of excess oxygen, there is an oxygen chemiadsorption on the catalyst; when there isan oxygen de"ciency, there is a release. In other words, if an excess of O
�participates in the
combustion, it will be chemically stored (up to a certain capacity); conversely, if a de"cit of O�
1074 G. FIENGO, L. GLIELMO AND S. SANTINI
Copyright � 2001 John Wiley & Sons, Ltd. Int. J. Robust Nonlinear Control 2001; 11:1073}1094
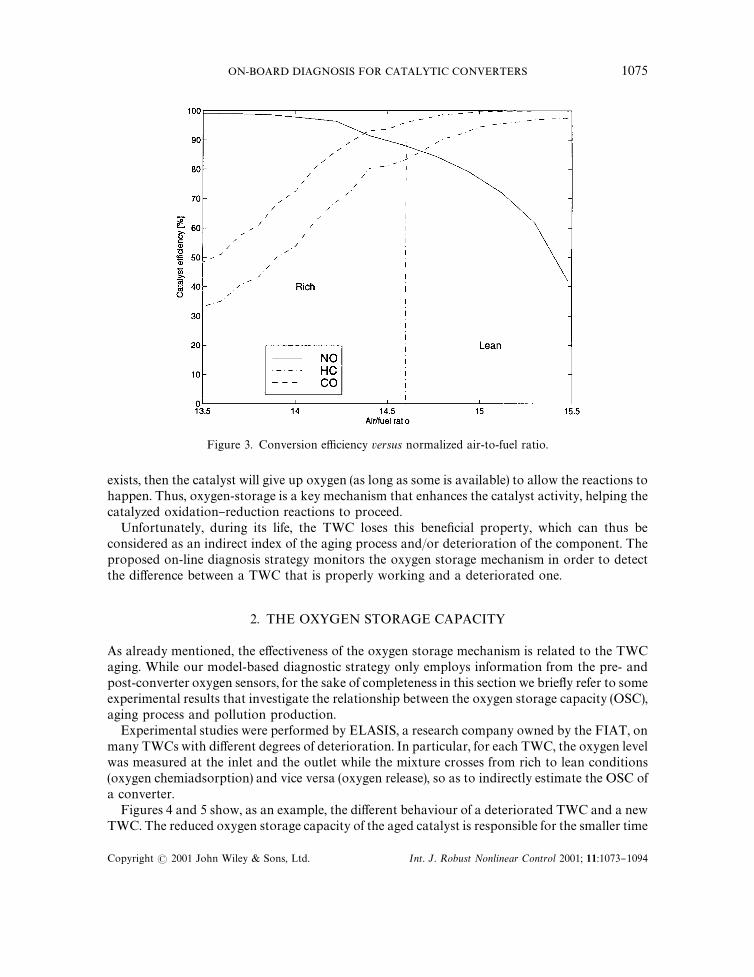
Figure 3. Conversion e$ciency versus normalized air-to-fuel ratio.
exists, then the catalyst will give up oxygen (as long as some is available) to allow the reactions tohappen. Thus, oxygen-storage is a key mechanism that enhances the catalyst activity, helping thecatalyzed oxidation}reduction reactions to proceed.Unfortunately, during its life, the TWC loses this bene"cial property, which can thus be
considered as an indirect index of the aging process and/or deterioration of the component. Theproposed on-line diagnosis strategy monitors the oxygen storage mechanism in order to detectthe di!erence between a TWC that is properly working and a deteriorated one.
2. THE OXYGEN STORAGE CAPACITY
As already mentioned, the e!ectiveness of the oxygen storage mechanism is related to the TWCaging. While our model-based diagnostic strategy only employs information from the pre- andpost-converter oxygen sensors, for the sake of completeness in this section we brie#y refer to someexperimental results that investigate the relationship between the oxygen storage capacity (OSC),aging process and pollution production.Experimental studies were performed by ELASIS, a research company owned by the FIAT, on
many TWCs with di!erent degrees of deterioration. In particular, for each TWC, the oxygen levelwas measured at the inlet and the outlet while the mixture crosses from rich to lean conditions(oxygen chemiadsorption) and vice versa (oxygen release), so as to indirectly estimate the OSC ofa converter.Figures 4 and 5 show, as an example, the di!erent behaviour of a deteriorated TWC and a new
TWC. The reduced oxygen storage capacity of the aged catalyst is responsible for the smaller time
ON-BOARD DIAGNOSIS FOR CATALYTIC CONVERTERS 1075
Copyright � 2001 John Wiley & Sons, Ltd. Int. J. Robust Nonlinear Control 2001; 11:1073}1094
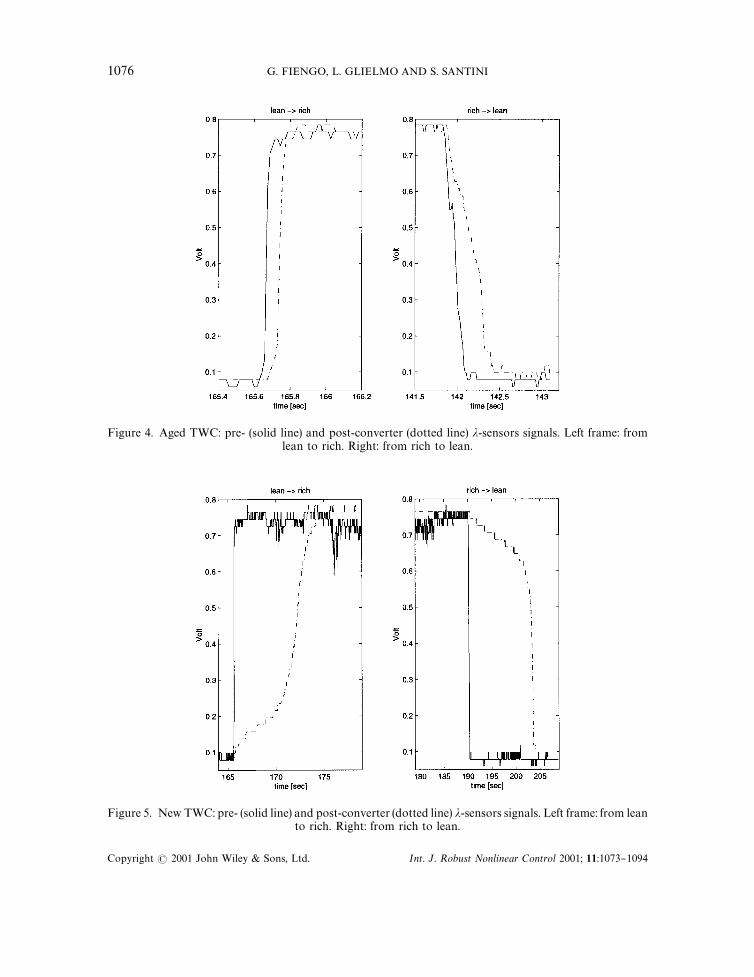
Figure 4. Aged TWC: pre- (solid line) and post-converter (dotted line) �-sensors signals. Left frame: fromlean to rich. Right: from rich to lean.
Figure 5. New TWC: pre- (solid line) and post-converter (dotted line) �-sensors signals. Left frame: from leanto rich. Right: from rich to lean.
1076 G. FIENGO, L. GLIELMO AND S. SANTINI
Copyright � 2001 John Wiley & Sons, Ltd. Int. J. Robust Nonlinear Control 2001; 11:1073}1094
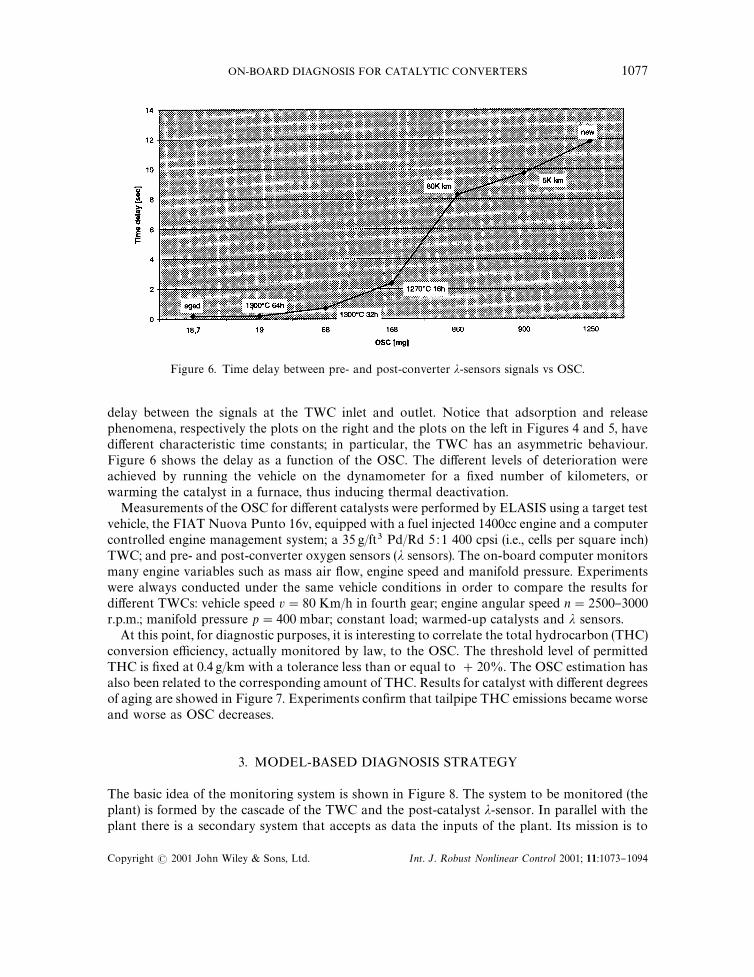
Figure 6. Time delay between pre- and post-converter �-sensors signals vs OSC.
delay between the signals at the TWC inlet and outlet. Notice that adsorption and releasephenomena, respectively the plots on the right and the plots on the left in Figures 4 and 5, havedi!erent characteristic time constants; in particular, the TWC has an asymmetric behaviour.Figure 6 shows the delay as a function of the OSC. The di!erent levels of deterioration wereachieved by running the vehicle on the dynamometer for a "xed number of kilometers, orwarming the catalyst in a furnace, thus inducing thermal deactivation.Measurements of the OSC for di!erent catalysts were performed by ELASIS using a target test
vehicle, the FIAT Nuova Punto 16v, equipped with a fuel injected 1400cc engine and a computercontrolled engine management system; a 35 g/ft� Pd/Rd 5 :1 400 cpsi (i.e., cells per square inch)TWC; and pre- and post-converter oxygen sensors (� sensors). The on-board computer monitorsmany engine variables such as mass air #ow, engine speed and manifold pressure. Experimentswere always conducted under the same vehicle conditions in order to compare the results fordi!erent TWCs: vehicle speed v"80 Km/h in fourth gear; engine angular speed n"2500}3000r.p.m.; manifold pressure p"400 mbar; constant load; warmed-up catalysts and � sensors.At this point, for diagnostic purposes, it is interesting to correlate the total hydrocarbon (THC)
conversion e$ciency, actually monitored by law, to the OSC. The threshold level of permittedTHC is "xed at 0.4 g/km with a tolerance less than or equal to #20%. The OSC estimation hasalso been related to the corresponding amount of THC. Results for catalyst with di!erent degreesof aging are showed in Figure 7. Experiments con"rm that tailpipe THC emissions became worseand worse as OSC decreases.
3. MODEL-BASED DIAGNOSIS STRATEGY
The basic idea of the monitoring system is shown in Figure 8. The system to be monitored (theplant) is formed by the cascade of the TWC and the post-catalyst �-sensor. In parallel with theplant there is a secondary system that accepts as data the inputs of the plant. Its mission is to
ON-BOARD DIAGNOSIS FOR CATALYTIC CONVERTERS 1077
Copyright � 2001 John Wiley & Sons, Ltd. Int. J. Robust Nonlinear Control 2001; 11:1073}1094
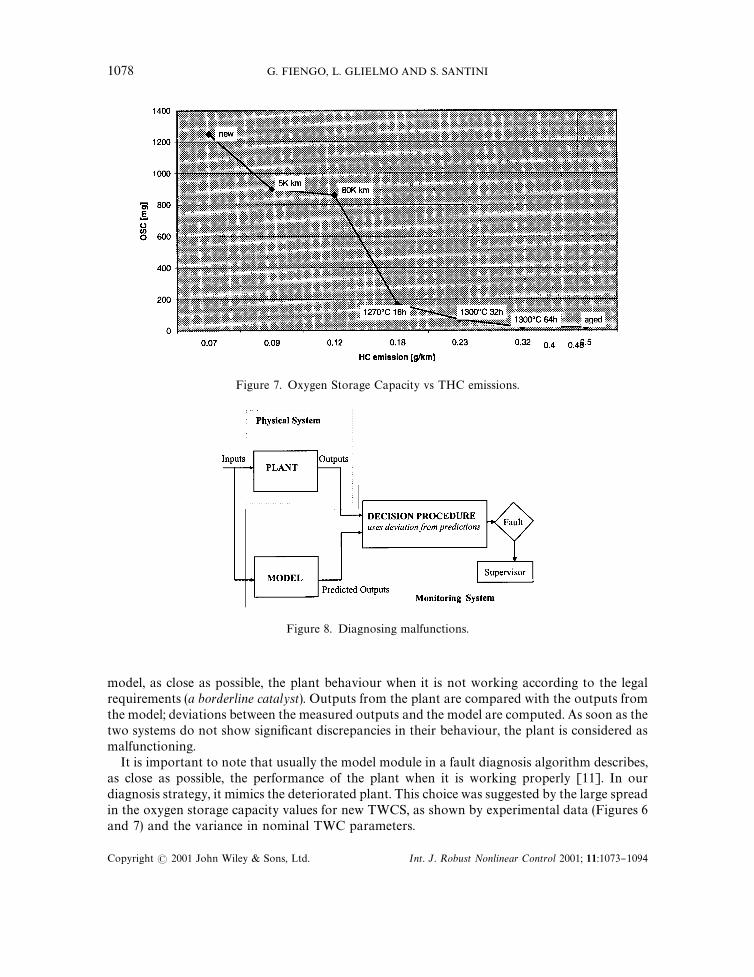
Figure 7. Oxygen Storage Capacity vs THC emissions.
Figure 8. Diagnosing malfunctions.
model, as close as possible, the plant behaviour when it is not working according to the legalrequirements (a borderline catalyst). Outputs from the plant are compared with the outputs fromthe model; deviations between the measured outputs and the model are computed. As soon as thetwo systems do not show signi"cant discrepancies in their behaviour, the plant is considered asmalfunctioning.It is important to note that usually the model module in a fault diagnosis algorithm describes,
as close as possible, the performance of the plant when it is working properly [11]. In ourdiagnosis strategy, it mimics the deteriorated plant. This choice was suggested by the large spreadin the oxygen storage capacity values for new TWCS, as shown by experimental data (Figures 6and 7) and the variance in nominal TWC parameters.
1078 G. FIENGO, L. GLIELMO AND S. SANTINI
Copyright � 2001 John Wiley & Sons, Ltd. Int. J. Robust Nonlinear Control 2001; 11:1073}1094

As a practical matter, the real-time diagnosis is performed only under particular conditions forthe engine and the after-treatment system. For example, it is not enabled during fuel cut-o!s,rapid accelerations or warm-up phases. The algorithm runs once for each trip (single tripstrategy), and it is active along a "nite time horizon (diagnosis range). During the test duration nospecial excitation of the air/fuel is needed, i.e. the algorithm is not &intrusive'.In the following sections, the diagnostic algorithm, the decision procedure, and the TWC and
�-sensor models used in this work will be described in detail.
4. A SIMPLIFIED TWC DYNAMICAL MODEL
For diagnosis purposes, a simple TWC dynamic model has been designed and validated. Itcaptures the phenomenon of the oxygen storage, since as already mentioned, it can be related tothe catalyst aging and/or deteriorating process.Models of a warmed-up TWC are usually based on the hypothesis that, once warmed up, the
catalyst dynamics are dominated by the oxygen storage phenomenon and that the otherphenomena occur on a much shorter time scale. This allows description of the catalyst activityonly in terms of the oxygen bu!er dynamics using the pre- and post-catalyst air fuel ratio (AFR)and a transport delay (see, for example, References [12}14]). Even though based on the sameapproach, all these basic phenomenological models di!er signi"cantly in their internal structure,dynamic equations and state variable de"nition.In this work, the oxygen storage phenomenon is simulated in two steps: the "rst one modi"es
the quantity of oxygen in the gas, while the second step "lters a certain signal in order to calculatethe AFR at the TWC outlet. To this aim, two state variables are used: � (0)�)1), the fraction ofthe oxygen sites occupied in the catalyst, and �
��, the air/fuel ratio of the gas at the TWC outlet.
Following References [12] and [13], the "rst state variable is tied to the quantity of air #ow inexcess or de"cit with respect to the stoichiometric value (S&14.6), de"ned as
SmR�(�
��!1), (1)
where m��(g/s) is the fuel #ow rate and �
��is the air/fuel ratio in the feedgas at the TWC inlet.
Multiplying Equation (1) by 0.23, the mass fraction of oxygen in air, and dividing it by C, thestorage capacity of the catalyst, the fraction of the total oxygen that under lean conditions can bestored or, under rich conditions, can be released, is given by
0.23S
CmR
�(�
��!1). (2)
Taking into account the above considerations, the di!erential equation describing the dynam-ics of oxygen storage and release can be written as follows:
�Q "� �0.23S
CmR
�(�
��!1)� f
(�) when �
��*1,
�0.23S
CmR
�(�
��!1)� f
(�) when �
��(1,
(3)
ON-BOARD DIAGNOSIS FOR CATALYTIC CONVERTERS 1079
Copyright � 2001 John Wiley & Sons, Ltd. Int. J. Robust Nonlinear Control 2001; 11:1073}1094
where the functions fand f
, de"ned as
f(�)"(1!��), (4a)
f(�)"[1!(1!�)�], (4b)
determine the percentage of O�actually stored/released as a function of the oxygen quantity in
the TWC. Notice that, in lean conditions, if the catalyst is full (�"1), the oxygen is not stored( f
"0); on the contrary, if the catalyst is empty (�"0), all the oxygen available is stored ( f
"1).
Vice versa, in rich conditions, when the catalyst is full (�"1), all the oxygen requested is released( f
"1), and if it is empty (�"0), it is not possible to release any oxygen ( f
"0).
Once the quantity of oxygen stored or released in the TWC is computed, it is possible tocalculate the air/fuel ratio of the gas modi"ed by the oxygen dynamics (Equations (3)) as inReferences [12] and [13]
������
"����
!� (���
!1) f(�) when �
��*1,
���
!� (���
!1) f(�) when �
��(1,
(5)
where � is a sensitivity parameter to be identi"ed. This quantity is used here for computing theair-to-fuel ratio at the tailpipe according to the following nonlinear di!erential equation:
�����
"!
����
�(���, �
���)#
������
�(���, �
���), (6a)
���(t)"�
���(t!�(n)), (6b)
where
z �(n) is the transport delay of the gas
�(n)"�
�n
#��; (7)
z �(���, �
���) is the time constant of Equation (6), depending on the air/fuel ratio of the gas at the
inlet and the outlet of the catalyst (see also Figure 9):
�"���
#
����
!��
������
!1(�
�����!�
��)
��������������*
�(�
���) when �
��*1,
��
#
����
!��
1!����
(���
!����
)
��������������*
�(�
���) when �
��(1.
(8)
In Equation (8), �(�
���) , �
(�
���) are sigmoidal functions that help to simulate the plateau
occurring near the stoichiometric value during fast transitions from rich to lean and vice versa(stoichiometric plateau).
The parameters C, �, ��, �
�, �
�, �
���, �
�����, and �
���have to be identi"ed in order to model
the behaviour of a speci"c catalytic converter.
1080 G. FIENGO, L. GLIELMO AND S. SANTINI
Copyright � 2001 John Wiley & Sons, Ltd. Int. J. Robust Nonlinear Control 2001; 11:1073}1094
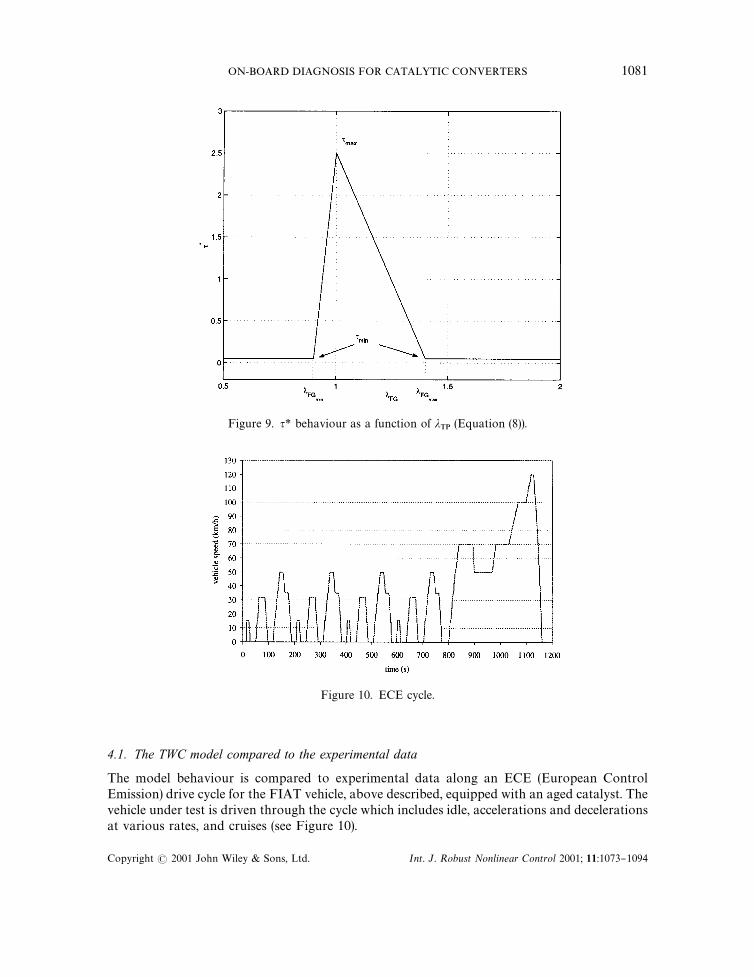
Figure 9. �* behaviour as a function of ���
(Equation (8)).
Figure 10. ECE cycle.
4.1. The TWC model compared to the experimental data
The model behaviour is compared to experimental data along an ECE (European ControlEmission) drive cycle for the FIAT vehicle, above described, equipped with an aged catalyst. Thevehicle under test is driven through the cycle which includes idle, accelerations and decelerationsat various rates, and cruises (see Figure 10).
ON-BOARD DIAGNOSIS FOR CATALYTIC CONVERTERS 1081
Copyright � 2001 John Wiley & Sons, Ltd. Int. J. Robust Nonlinear Control 2001; 11:1073}1094
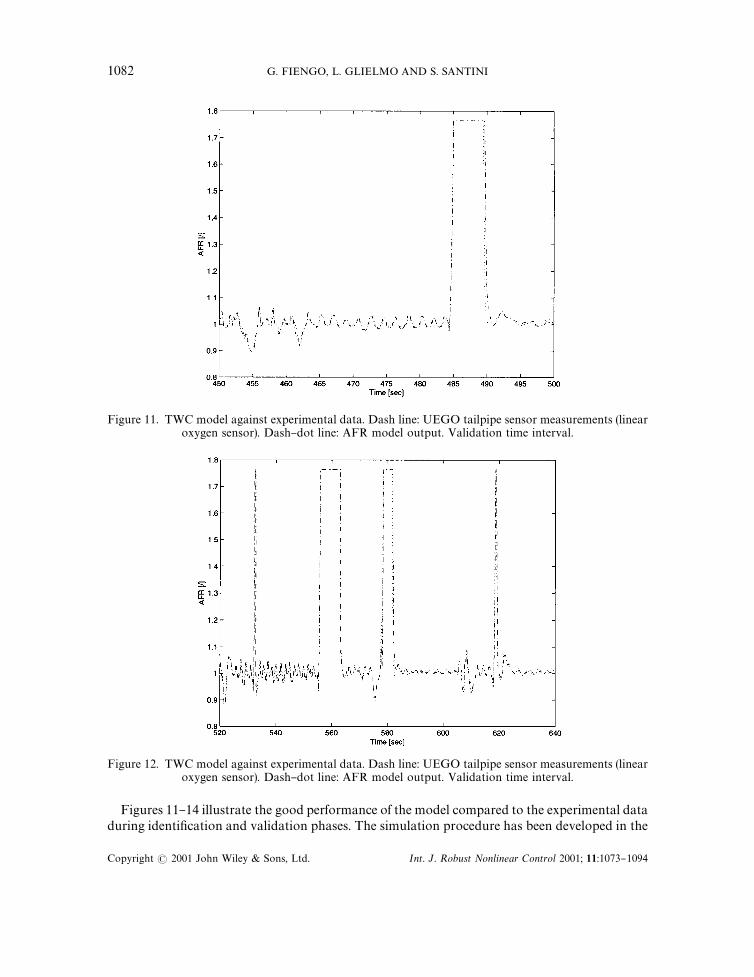
Figure 11. TWC model against experimental data. Dash line: UEGO tailpipe sensor measurements (linearoxygen sensor). Dash}dot line: AFR model output. Validation time interval.
Figure 12. TWC model against experimental data. Dash line: UEGO tailpipe sensor measurements (linearoxygen sensor). Dash}dot line: AFR model output. Validation time interval.
Figures 11}14 illustrate the good performance of the model compared to the experimental dataduring identi"cation and validation phases. The simulation procedure has been developed in the
1082 G. FIENGO, L. GLIELMO AND S. SANTINI
Copyright � 2001 John Wiley & Sons, Ltd. Int. J. Robust Nonlinear Control 2001; 11:1073}1094
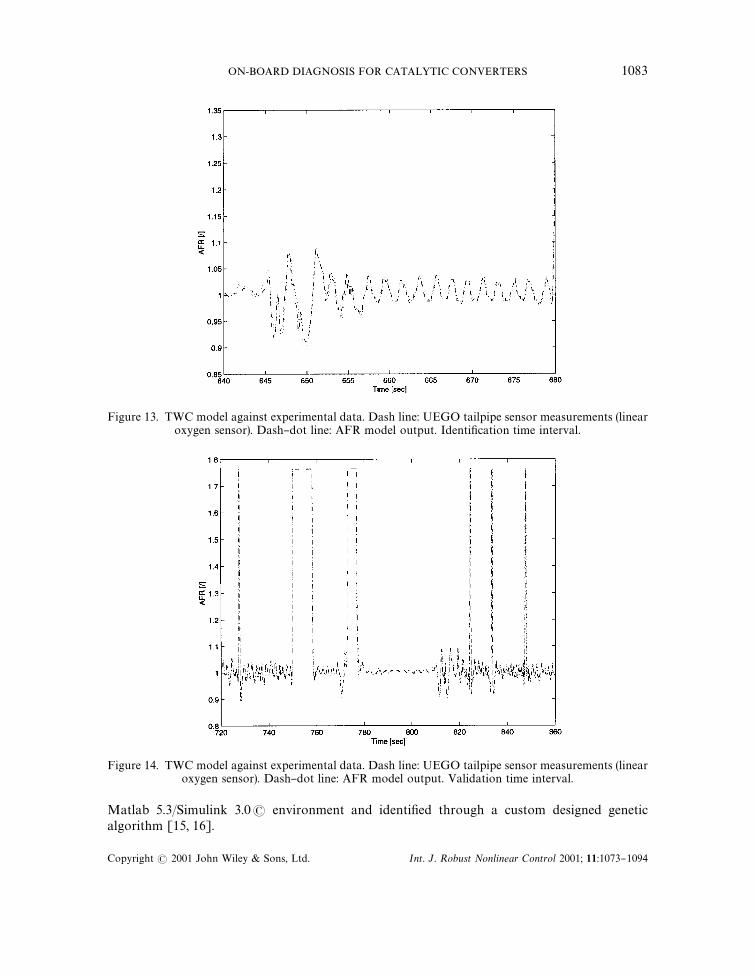
Figure 13. TWC model against experimental data. Dash line: UEGO tailpipe sensor measurements (linearoxygen sensor). Dash}dot line: AFR model output. Identi"cation time interval.
Figure 14. TWC model against experimental data. Dash line: UEGO tailpipe sensor measurements (linearoxygen sensor). Dash}dot line: AFR model output. Validation time interval.
Matlab 5.3/Simulink 3.0� environment and identi"ed through a custom designed geneticalgorithm [15, 16].
ON-BOARD DIAGNOSIS FOR CATALYTIC CONVERTERS 1083
Copyright � 2001 John Wiley & Sons, Ltd. Int. J. Robust Nonlinear Control 2001; 11:1073}1094
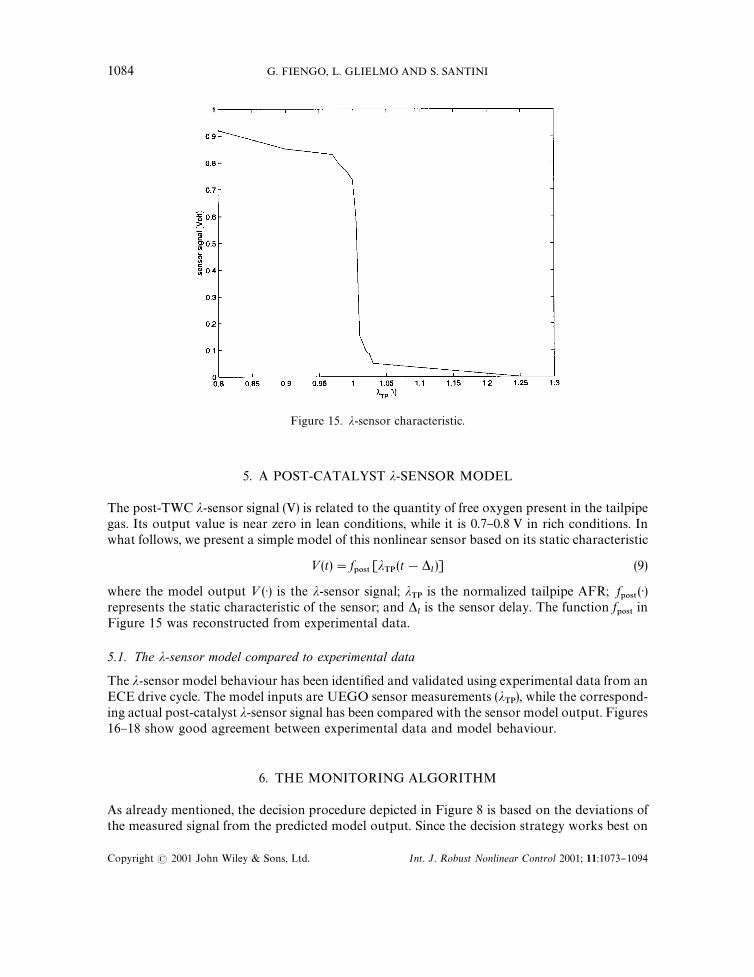
Figure 15. �-sensor characteristic.
5. A POST-CATALYST �-SENSOR MODEL
The post-TWC �-sensor signal (V) is related to the quantity of free oxygen present in the tailpipegas. Its output value is near zero in lean conditions, while it is 0.7}0.8 V in rich conditions. Inwhat follows, we present a simple model of this nonlinear sensor based on its static characteristic
<(t)"f ���
[���(t!�
�)] (9)
where the model output <()) is the �-sensor signal; ���
is the normalized tailpipe AFR; f ���
())represents the static characteristic of the sensor; and �
�is the sensor delay. The function f
���in
Figure 15 was reconstructed from experimental data.
5.1. The �-sensor model compared to experimental data
The �-sensor model behaviour has been identi"ed and validated using experimental data from anECE drive cycle. The model inputs are UEGO sensor measurements (�
��), while the correspond-
ing actual post-catalyst �-sensor signal has been compared with the sensor model output. Figures16}18 show good agreement between experimental data and model behaviour.
6. THE MONITORING ALGORITHM
As already mentioned, the decision procedure depicted in Figure 8 is based on the deviations ofthe measured signal from the predicted model output. Since the decision strategy works best on
1084 G. FIENGO, L. GLIELMO AND S. SANTINI
Copyright � 2001 John Wiley & Sons, Ltd. Int. J. Robust Nonlinear Control 2001; 11:1073}1094
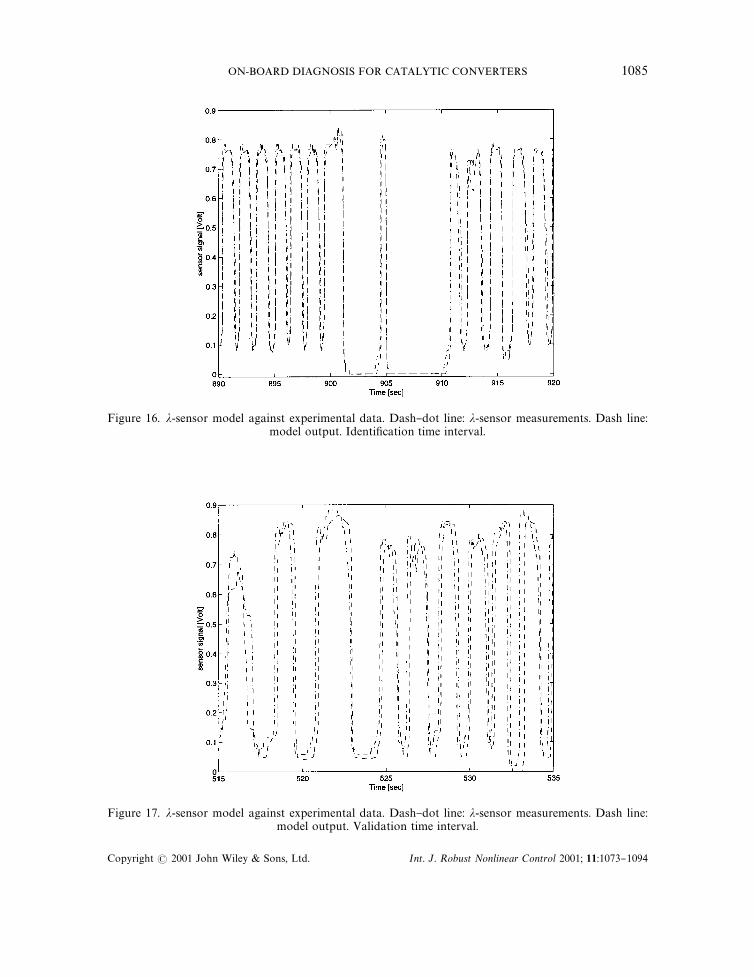
Figure 16. �-sensor model against experimental data. Dash}dot line: �-sensor measurements. Dash line:model output. Identi"cation time interval.
Figure 17. �-sensor model against experimental data. Dash}dot line: �-sensor measurements. Dash line:model output. Validation time interval.
ON-BOARD DIAGNOSIS FOR CATALYTIC CONVERTERS 1085
Copyright � 2001 John Wiley & Sons, Ltd. Int. J. Robust Nonlinear Control 2001; 11:1073}1094
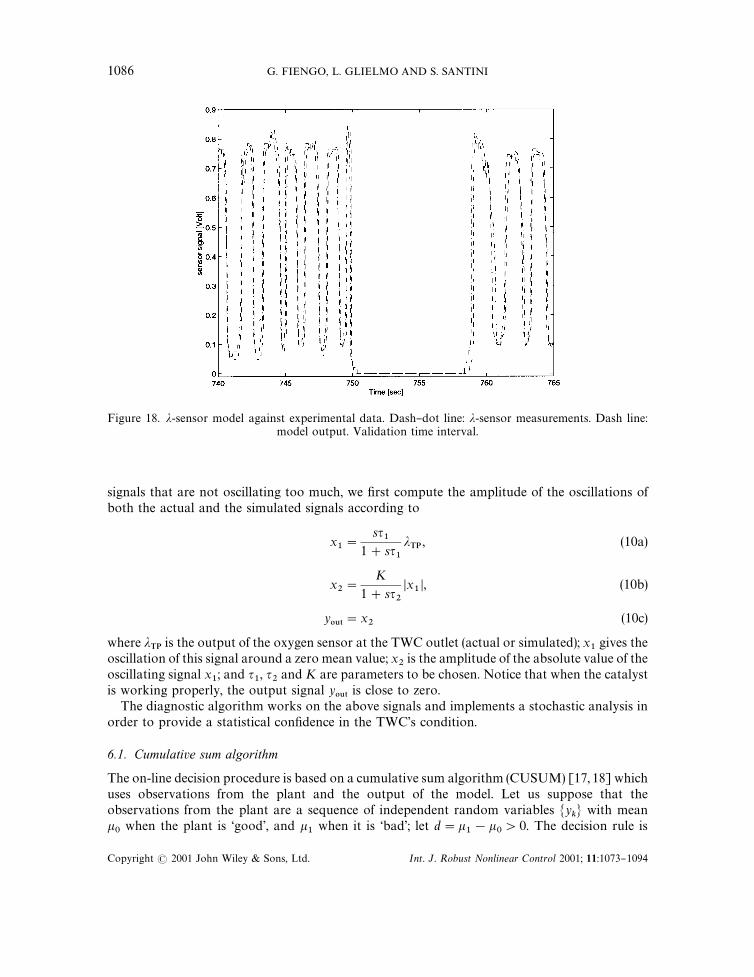
Figure 18. �-sensor model against experimental data. Dash}dot line: �-sensor measurements. Dash line:model output. Validation time interval.
signals that are not oscillating too much, we "rst compute the amplitude of the oscillations ofboth the actual and the simulated signals according to
x�"
s��
1#s��
���, (10a)
x�"
K
1#s��
x�, (10b)
y���
"x�
(10c)
where ���is the output of the oxygen sensor at the TWC outlet (actual or simulated); x
�gives the
oscillation of this signal around a zero mean value; x�is the amplitude of the absolute value of the
oscillating signal x�; and �
�, �
�and K are parameters to be chosen. Notice that when the catalyst
is working properly, the output signal y���
is close to zero.The diagnostic algorithm works on the above signals and implements a stochastic analysis in
order to provide a statistical con"dence in the TWC's condition.
6.1. Cumulative sum algorithm
The on-line decision procedure is based on a cumulative sum algorithm (CUSUM) [17, 18] whichuses observations from the plant and the output of the model. Let us suppose that theobservations from the plant are a sequence of independent random variables y
�� with mean
��when the plant is &good', and �
�when it is &bad'; let d"�
�!�
�'0. The decision rule is
1086 G. FIENGO, L. GLIELMO AND S. SANTINI
Copyright � 2001 John Wiley & Sons, Ltd. Int. J. Robust Nonlinear Control 2001; 11:1073}1094

designed to test, on the sequence of the plant observations y��, the following two hypotheses:
H�
H�
if the mean is around the value ��,
if the mean is around the value ��
In our case, the value ��is computed on-line as the average of the corresponding sequence of
the model observations yL��, where the model mimics the borderline catalyst behaviour. As long
as the decision gives a result H�, the sampling and the test keep on going; on the contrary, a fault
is declared for the "rst observation sample that gives an H�decision.
Let
S�"
��� �
s�, (12)
be the log-likelihood ratio for the observations from y�to y
�, with s
�being the su.cient statistic
for the observation y�of the plant de"ned as
s�"ln
p��(y
�)
p��(y
�), (13)
where p��and p�
�are the probability densities of the random variables y
�� for mean values �
�and �
�, respectively. As a consequence of the Neyman}Pearson lemma, the optimal decision is
given by [17, 19]:
at step k�hypothesis H
�hypothesis H
�
if S�(h ;
if S�*h;
(14)
where h is a threshold to be selected.Notice that the su$cient statistic can be easily computed in the particular case of Gaussian
distributions with variance �. In this case the probability density is
p� (y)"1
�2�e���������� (15)
and, consequently, the CUSUM index becomes
S�"
d
�
��� ��y
�!�
�!
d
2�. (16)
This index has a growing behaviour (with rate d/2) when the plant is &bad' and, on the contrary,it decreases (with rate !d/2) when the plant is &good'. Unfortunately, if the plant is &good' fora long period, the index S
�assumes a huge negative value. Therefore, when monitoring the
malfunction by the comparison of the S�level with a "xed threshold, one must wait a long time for
the failure to be detected.To overcome this drawback and have reasonable alarm settings, in this work we used
a modi"ed CUSUM algorithm [17]. Notice that the relevant information for the diagnosisalgorithm is the di!erence between the value of the log-likelihood ratio S
�and its minimum value;
in this way, it is possible to take a decision comparing this di!erence to a certain threshold as
g�"S
�!m
�*h, (17)
ON-BOARD DIAGNOSIS FOR CATALYTIC CONVERTERS 1087
Copyright � 2001 John Wiley & Sons, Ltd. Int. J. Robust Nonlinear Control 2001; 11:1073}1094
where
m�O min
1)j)kS�. (18)
It is evident that now the detection rule compares the cumulative sum S�to an adaptive threshold
m�#h modi"ed on-line when the algorithm runs.Extended theoretical studies have investigated the optimality of CUSUM algorithms in terms
of detectability and false alarms rates (see for example, References [17, 20, 21]). In particular, it isknown that the CUSUM algorithm is optimal when it is tuned with the true values of theparameters before and after the change (in our case the �
�and �
�values of the distribution before
and after the malfunction). Normally, the loss of optimality is a consequence of the lack of a prioriinformation about �
�and �
�; in our case, this is avoided by the knowledge of the model (which
provides the ��value) and the plant behaviour (which shows a mean �
�value approximately
equal to zero when the TWC is working properly).
6.2. The �� test
As already mentioned, the su.cient statistic on which the CUSUM decision procedure is basedcan be easily computed and used in practical applications under the hypothesis that data aregoverned by a Gaussian distribution. For this reason, we developed an on-line �� test of theGaussian nature of the sequence of plant observations y
��. In particular, the test selects windows
of Gaussian distributed data and only on these windows the CUSUM decision procedure isapplied. In the following, the formulation of the �� test will be brie#y illustrated.The �� test helps to determine the degree of statistical con"dence in approximating a generic
observed distribution with a Gaussian distribution. Given N observations y�(N is the width of the
window), let us construct a particular Gaussian bell with mean >, variance �, and probability
density p�(y) de"ned on the basics of the samples y
�as
>"
1
N
��� �
y�,
�"�
��� �
(y�!>)�
N!1, p
�(y)"
1
��2�
e�����������. (19)
Now we divide this Gaussian bell into M intervals (see Figure 19) and then compute theprobabilities p
�for ( j"1,2 , M) that a generic observation y
�belongs to the j}th interval
( j"1,2, M). We de"ne
z E�ONp
�, the expected number of observations belonging to the kth interval if the distribution
were actually given by Equation (19);z O
�, the number of observations actually belonging to the k}th interval.
The ���index can now be constructed as
���O
��� �
(O�!E
�)�
E�
. (20)
From the above de"nition, it is apparent that ���is an indicator of the error committed in
approximating the observation sequence by a Gaussian distribution. For ���(M the approxima-
tion is acceptable, while it is unacceptable for ���much greater than M. Notice that this test
formulation does not give useful indications for intermediate values of ���. For this reason, in this
work, we used a normalized index well known as the reduced ���[22].
1088 G. FIENGO, L. GLIELMO AND S. SANTINI
Copyright � 2001 John Wiley & Sons, Ltd. Int. J. Robust Nonlinear Control 2001; 11:1073}1094
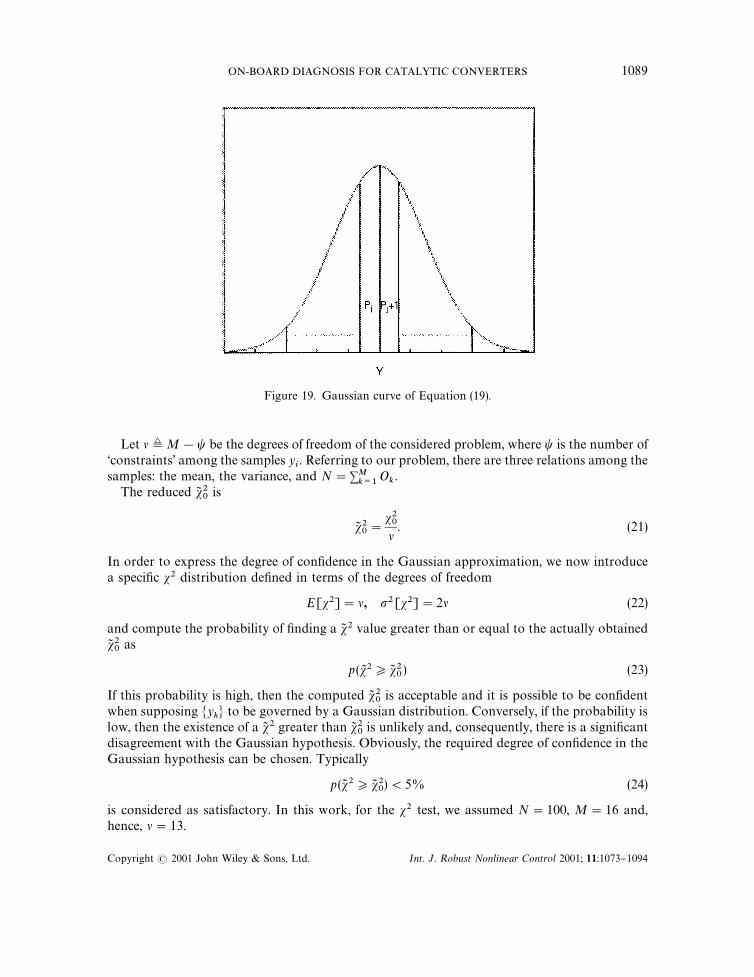
Figure 19. Gaussian curve of Equation (19).
Let �OM!� be the degrees of freedom of the considered problem, where � is the number of&constraints' among the samples y
�. Referring to our problem, there are three relations among the
samples: the mean, the variance, and N"��� �
O�.
The reduced �� ��is
�� ��"
����. (21)
In order to express the degree of con"dence in the Gaussian approximation, we now introducea speci"c �� distribution de"ned in terms of the degrees of freedom
E[��]"�, �[��]"2� (22)
and compute the probability of "nding a �� � value greater than or equal to the actually obtained�� ��as
p (�J �*�� ��) (23)
If this probability is high, then the computed �� ��is acceptable and it is possible to be con"dent
when supposing y�� to be governed by a Gaussian distribution. Conversely, if the probability is
low, then the existence of a �� � greater than �� ��is unlikely and, consequently, there is a signi"cant
disagreement with the Gaussian hypothesis. Obviously, the required degree of con"dence in theGaussian hypothesis can be chosen. Typically
p(�� �*�� ��)(5% (24)
is considered as satisfactory. In this work, for the �� test, we assumed N"100, M"16 and,hence, �"13.
ON-BOARD DIAGNOSIS FOR CATALYTIC CONVERTERS 1089
Copyright � 2001 John Wiley & Sons, Ltd. Int. J. Robust Nonlinear Control 2001; 11:1073}1094
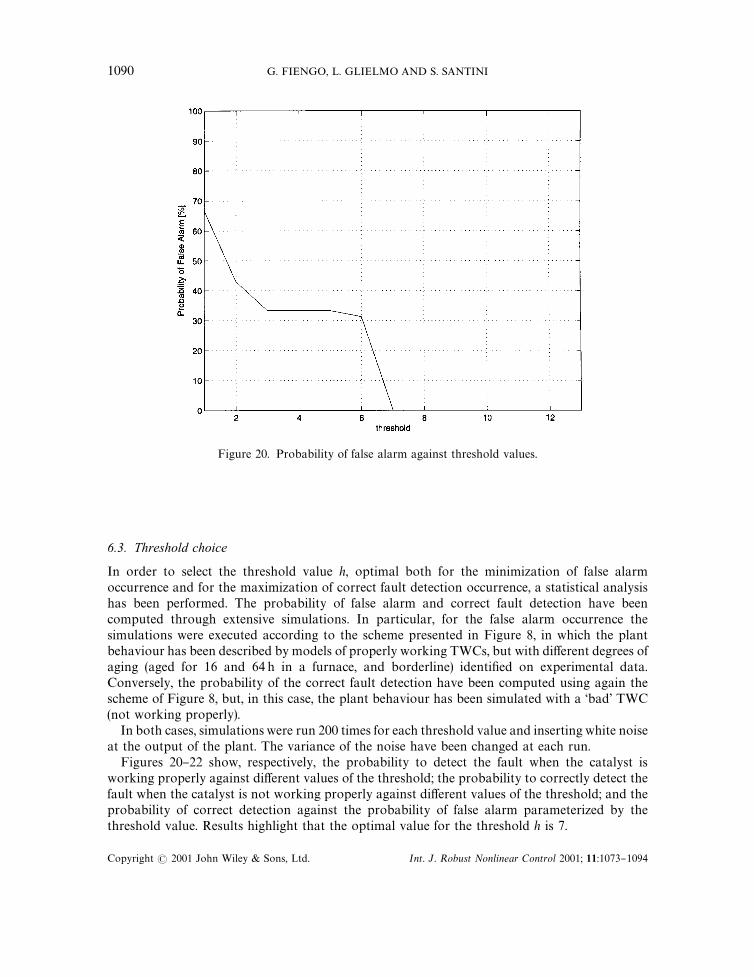
Figure 20. Probability of false alarm against threshold values.
6.3. Threshold choice
In order to select the threshold value h, optimal both for the minimization of false alarmoccurrence and for the maximization of correct fault detection occurrence, a statistical analysishas been performed. The probability of false alarm and correct fault detection have beencomputed through extensive simulations. In particular, for the false alarm occurrence thesimulations were executed according to the scheme presented in Figure 8, in which the plantbehaviour has been described by models of properly working TWCs, but with di!erent degrees ofaging (aged for 16 and 64 h in a furnace, and borderline) identi"ed on experimental data.Conversely, the probability of the correct fault detection have been computed using again thescheme of Figure 8, but, in this case, the plant behaviour has been simulated with a &bad' TWC(not working properly).In both cases, simulations were run 200 times for each threshold value and inserting white noise
at the output of the plant. The variance of the noise have been changed at each run.Figures 20}22 show, respectively, the probability to detect the fault when the catalyst is
working properly against di!erent values of the threshold; the probability to correctly detect thefault when the catalyst is not working properly against di!erent values of the threshold; and theprobability of correct detection against the probability of false alarm parameterized by thethreshold value. Results highlight that the optimal value for the threshold h is 7.
1090 G. FIENGO, L. GLIELMO AND S. SANTINI
Copyright � 2001 John Wiley & Sons, Ltd. Int. J. Robust Nonlinear Control 2001; 11:1073}1094
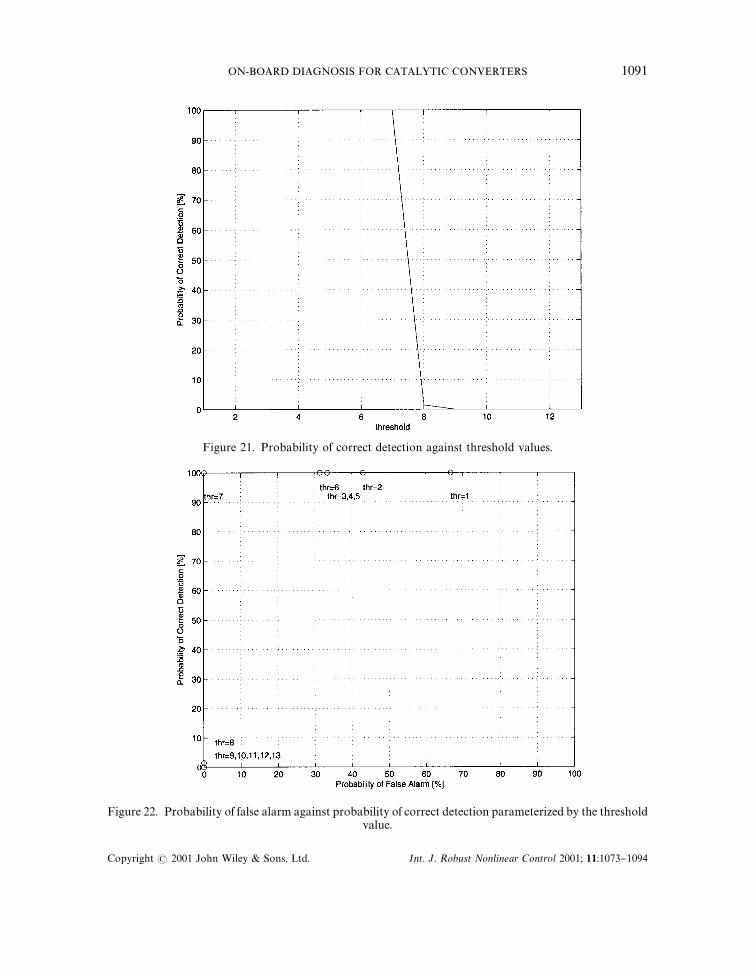
Figure 21. Probability of correct detection against threshold values.
Figure 22. Probability of false alarm against probability of correct detection parameterized by the thresholdvalue.
ON-BOARD DIAGNOSIS FOR CATALYTIC CONVERTERS 1091
Copyright � 2001 John Wiley & Sons, Ltd. Int. J. Robust Nonlinear Control 2001; 11:1073}1094
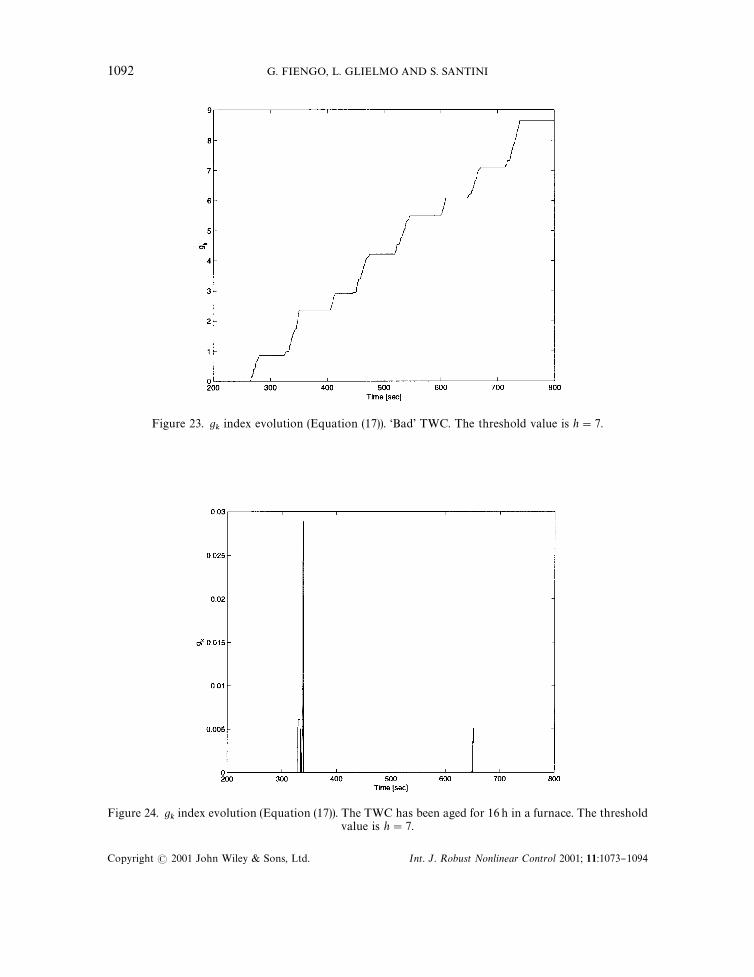
Figure 23. g�index evolution (Equation (17)). &Bad' TWC. The threshold value is h"7.
Figure 24. g�index evolution (Equation (17)). The TWC has been aged for 16 h in a furnace. The threshold
value is h"7.
1092 G. FIENGO, L. GLIELMO AND S. SANTINI
Copyright � 2001 John Wiley & Sons, Ltd. Int. J. Robust Nonlinear Control 2001; 11:1073}1094
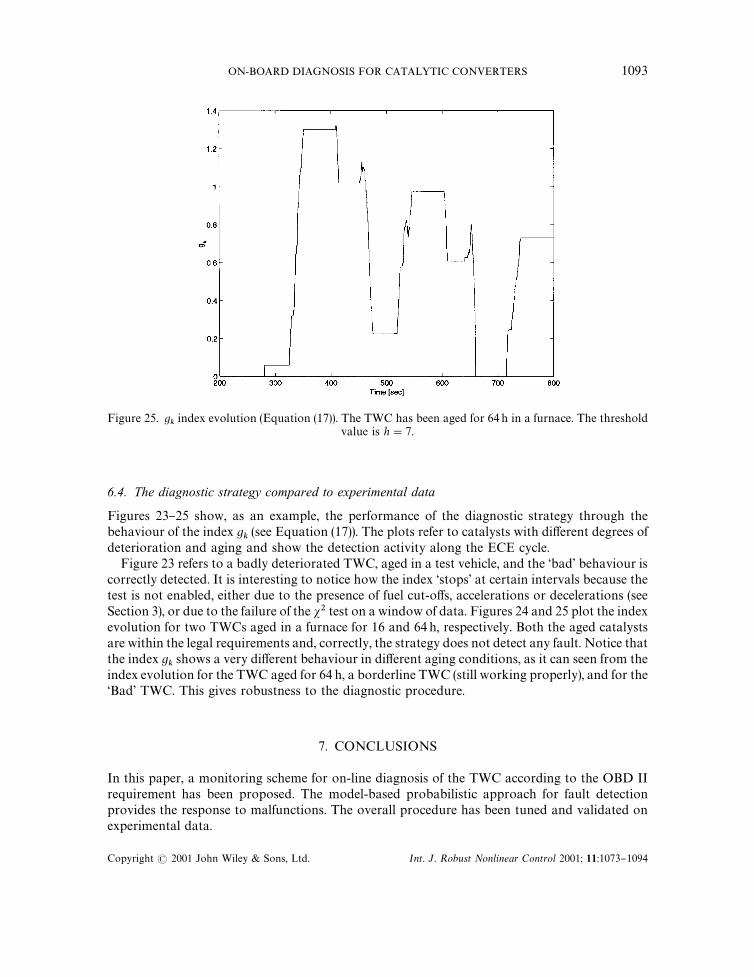
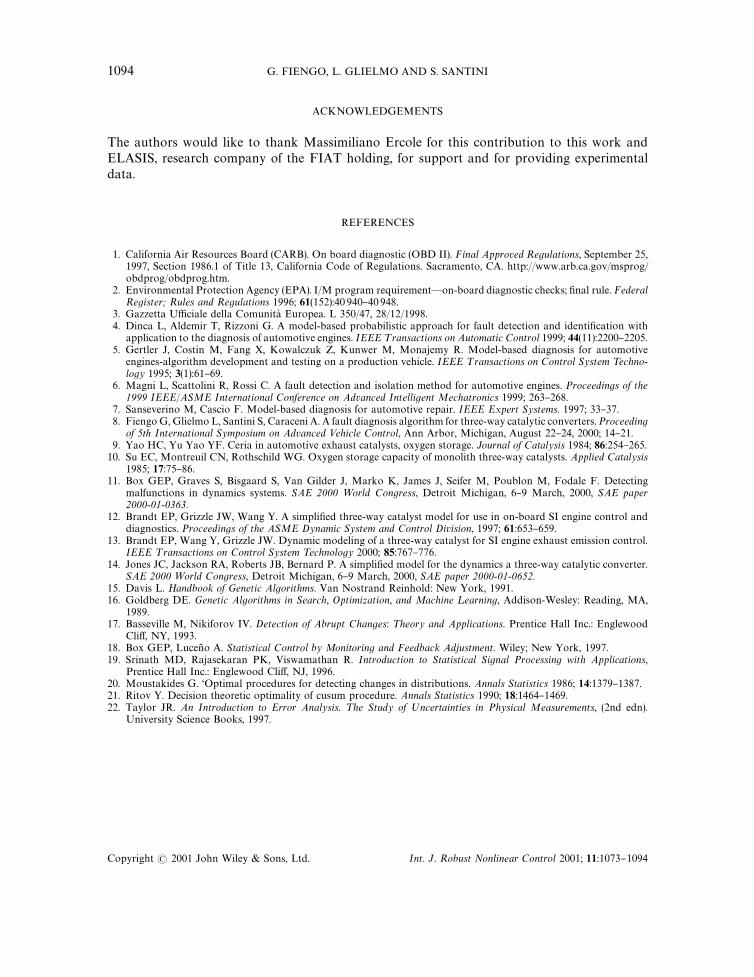
Figure 25. g�index evolution (Equation (17)). The TWC has been aged for 64 h in a furnace. The threshold
value is h"7.
6.4. The diagnostic strategy compared to experimental data
Figures 23}25 show, as an example, the performance of the diagnostic strategy through thebehaviour of the index g
�(see Equation (17)). The plots refer to catalysts with di!erent degrees of
deterioration and aging and show the detection activity along the ECE cycle.Figure 23 refers to a badly deteriorated TWC, aged in a test vehicle, and the &bad' behaviour is
correctly detected. It is interesting to notice how the index &stops' at certain intervals because thetest is not enabled, either due to the presence of fuel cut-o!s, accelerations or decelerations (seeSection 3), or due to the failure of the �� test on a window of data. Figures 24 and 25 plot the indexevolution for two TWCs aged in a furnace for 16 and 64 h, respectively. Both the aged catalystsare within the legal requirements and, correctly, the strategy does not detect any fault. Notice thatthe index g
�shows a very di!erent behaviour in di!erent aging conditions, as it can seen from the
index evolution for the TWC aged for 64 h, a borderline TWC (still working properly), and for the&Bad' TWC. This gives robustness to the diagnostic procedure.
7. CONCLUSIONS
In this paper, a monitoring scheme for on-line diagnosis of the TWC according to the OBD IIrequirement has been proposed. The model-based probabilistic approach for fault detectionprovides the response to malfunctions. The overall procedure has been tuned and validated onexperimental data.
ON-BOARD DIAGNOSIS FOR CATALYTIC CONVERTERS 1093
Copyright � 2001 John Wiley & Sons, Ltd. Int. J. Robust Nonlinear Control 2001; 11:1073}1094
ACKNOWLEDGEMENTS
The authors would like to thank Massimiliano Ercole for this contribution to this work andELASIS, research company of the FIAT holding, for support and for providing experimentaldata.
REFERENCES
1. California Air Resources Board (CARB). On board diagnostic (OBD II). Final Approved Regulations, September 25,1997, Section 1986.1 of Title 13, California Code of Regulations. Sacramento, CA. http://www.arb.ca.gov/msprog/obdprog/obdprog.htm.
2. Environmental Protection Agency (EPA). I/M program requirement*on-board diagnostic checks; "nal rule. FederalRegister; Rules and Regulations 1996; 61(152):40 940}40948.
3. Gazzetta U$ciale della Comunita Europea. L 350/47, 28/12/1998.4. Dinca L, Aldemir T, Rizzoni G. A model-based probabilistic approach for fault detection and identi"cation with
application to the diagnosis of automotive engines. IEEE ¹ransactions on Automatic Control 1999; 44(11):2200}2205.5. Gertler J, Costin M, Fang X, Kowalczuk Z, Kunwer M, Monajemy R. Model-based diagnosis for automotive
engines-algorithm development and testing on a production vehicle. IEEE ¹ransactions on Control System ¹echno-logy 1995; 3(1):61}69.
6. Magni L, Scattolini R, Rossi C. A fault detection and isolation method for automotive engines. Proceedings of the1999 IEEE/ASME International Conference on Advanced Intelligent Mechatronics 1999; 263}268.
7. Sanseverino M, Cascio F. Model-based diagnosis for automotive repair. IEEE Expert Systems. 1997; 33}37.8. FiengoG, Glielmo L, Santini S, Caraceni A. A fault diagnosis algorithm for three-way catalytic converters.Proceeding
of 5th International Symposium on Advanced <ehicle Control, Ann Arbor, Michigan, August 22}24, 2000; 14}21.9. Yao HC, Yu Yao YF. Ceria in automotive exhaust catalysts, oxygen storage. Journal of Catalysis 1984; 86:254}265.10. Su EC, Montreuil CN, Rothschild WG. Oxygen storage capacity of monolith three-way catalysts. Applied Catalysis
1985; 17:75}86.11. Box GEP, Graves S, Bisgaard S, Van Gilder J, Marko K, James J, Seifer M, Poublon M, Fodale F. Detecting
malfunctions in dynamics systems. SAE 2000 =orld Congress, Detroit Michigan, 6}9 March, 2000, SAE paper2000-01-0363.
12. Brandt EP, Grizzle JW, Wang Y. A simpli"ed three-way catalyst model for use in on-board SI engine control anddiagnostics. Proceedings of the ASME Dynamic System and Control Division, 1997; 61:653}659.
13. Brandt EP, Wang Y, Grizzle JW. Dynamic modeling of a three-way catalyst for SI engine exhaust emission control.IEEE ¹ransactions on Control System ¹echnology 2000; 85:767}776.
14. Jones JC, Jackson RA, Roberts JB, Bernard P. A simpli"ed model for the dynamics a three-way catalytic converter.SAE 2000=orld Congress, Detroit Michigan, 6}9 March, 2000, SAE paper 2000-01-0652.
15. Davis L. Handbook of Genetic Algorithms. Van Nostrand Reinhold: New York, 1991.16. Goldberg DE. Genetic Algorithms in Search, Optimization, and Machine ¸earning, Addison-Wesley: Reading, MA,
1989.17. Basseville M, Nikiforov IV. Detection of Abrupt Changes: ¹heory and Applications. Prentice Hall Inc.: Englewood
Cli!, NY, 1993.18. Box GEP, Lucen� o A. Statistical Control by Monitoring and Feedback Adjustment. Wiley; New York, 1997.19. Srinath MD, Rajasekaran PK, Viswamathan R. Introduction to Statistical Signal Processing with Applications,
Prentice Hall Inc.: Englewood Cli!, NJ, 1996.20. Moustakides G. &Optimal procedures for detecting changes in distributions. Annals Statistics 1986; 14:1379}1387.21. Ritov Y. Decision theoretic optimality of cusum procedure. Annals Statistics 1990; 18:1464}1469.22. Taylor JR. An Introduction to Error Analysis. ¹he Study of ;ncertainties in Physical Measurements, (2nd edn).
University Science Books, 1997.
1094 G. FIENGO, L. GLIELMO AND S. SANTINI
Copyright � 2001 John Wiley & Sons, Ltd. Int. J. Robust Nonlinear Control 2001; 11:1073}1094
Related Documents


![Catalogue PGM CONTENT[1] of Catalytic Converters](https://static.cupdf.com/doc/110x72/5571f39949795947648e4bf2/catalogue-pgm-content1-of-catalytic-converters.jpg)