on Atlas and Mercury User Manual V1.1.83

Welcome message from author
This document is posted to help you gain knowledge. Please leave a comment to let me know what you think about it! Share it to your friends and learn new things together.
Transcript

on Atlas and Mercury
User Manual V1.1.83
Osiris / Atlas / Mercury | User Manual v1.1.83 | July 2019 | © PROCENTEC 2/97
Safety Guidelines
This manual contains notices which you should observe to ensure your own personal safety, as well as to
protect the product and connected equipment. These notices are highlighted in the manual by a warning sign
and are marked as followed according to the level of danger:
Draws your attention to important information on handling the product, a particular part of the
documentation or the correct functioning of the product.
Warning
This device and its components may only be used for the applications described in this manual and only in
connection with devices or components that comply with Industrial Ethernet interfaces.
This product can only function correctly and safely if it is transported, stored, set up, installed, operated and
maintained as recommended. Atlas and/ or Mercury is a CE class A product. In a domestic environment it may
cause radio interference in which case the user may be required to take adequate measures.
Warranty
Warranty is void if you open Atlas and/or Mercury.
Qualified Technicians
Only qualified technicians should be allowed to install and work with this equipment. Qualified technicians are
defined as persons who are authorized to commission, to ground, to tag circuits and systems in accordance
with established safety practices and standards. It is recommended that the technicians carry a Certified
PROFINET Installer or Certified PROFINET Engineer certificate.
Disclaimer of Liability
We have checked the contents of this manual as much as possible. Since deviations cannot be precluded
entirely, we cannot guarantee full agreement. However, the content in this manual is reviewed regularly and
necessary corrections will be included in subsequent editions. Suggestions for improvements are welcome.
Copyright © 2019 PROCENTEC
All rights reserved. No part of this publication may be reproduced, stored in a retrieval system, or transmitted,
in any form or by any means, electronic, mechanical, photocopying, recording or otherwise, without the prior
written permission of the publisher.
Osiris / Atlas / Mercury | User Manual v1.1.83 | July 2019 | © PROCENTEC 3/97
Important information
Purpose of the Manual
This user manual provides information how to work with Atlas and/or Mercury.
This manual does not describe the usage of the tablet itself. For the manual of the tablet, refer to the manual
of FZ-M1 on the Panasonic website.
Support
In case of a defective product or unanswered questions, please get in contact with the support department:
Recycling and Disposal
The parts of the Mercury can be recycled.
“WARNING, BATTERY INSIDE; Battery may explode if mistreated. Do not disassemble or dispose of
in fire. Dispose product according to the instructions"
For further information about environment-friendly recycling and the procedure for the disposing of your old
equipment, please contact:
Document Updates
You can obtain constantly updated information on PROCENTEC products on the Internet at
www.procentec.com
T: +31 (0)174 671 800
F: +31 (0)174 671 801
PROCENTEC
Klopperman 16
2292 JD WATERINGEN
The Netherlands
T: +31 (0)174 671 800
F: +31 (0)174 671 801
Osiris / Atlas / Mercury | User Manual v1.1.83 | July 2019 | © PROCENTEC 4/97
Table of contents
Important information ........................................................................................... 3
1. Product description ....................................................................................... 9
1.1 Introduction ................................................................................................... 9
1.2 Your benefits.................................................................................................. 9
1.3 Product features ............................................................................................ 9
1.4 System requirements .................................................................................... 9
2. Atlas ............................................................................................................. 10
2.1 Quick Start ................................................................................................... 10
2.2 Atlas installation instructions ...................................................................... 10
2.2.1 Location ....................................................................................................... 10
2.2.2 Position ........................................................................................................ 11
2.2.3 Power supply ............................................................................................... 11
2.2.4 Ethernet connections .................................................................................. 11
3. Mercury ....................................................................................................... 13
3.1 Quick Start ................................................................................................... 13
4. Osiris User interface .................................................................................... 14
4.1 Terminology and definitions ........................................................................ 14
4.2 System Bar ................................................................................................... 15
4.3 System buttons ............................................................................................ 15
4.4 Measurement Button .................................................................................. 16
4.5 Current User ................................................................................................ 16
4.6 Notifications ................................................................................................ 16
4.7 Delphi Help .................................................................................................. 16
4.8 Application Menu ........................................................................................ 17
5. Setup Wizard ............................................................................................... 18
Osiris / Atlas / Mercury | User Manual v1.1.83 | July 2019 | © PROCENTEC 5/97
6. Device mode (Mercury only) ....................................................................... 19
7. Device mode: Industrial Ethernet ................................................................ 20
7.1 Dashboard ................................................................................................... 20
7.1.1 Dashboard organization .............................................................................. 20
7.1.2 Customize Dashboard .................................................................................. 20
7.1.3 User administration ..................................................................................... 21
7.1.4 Default users ................................................................................................ 22
7.1.5 Password best practice ................................................................................ 23
7.2 Starting a measurement .............................................................................. 23
7.3 Topology ...................................................................................................... 23
7.3.1 View types ................................................................................................... 23
7.3.2 Galaxy view .................................................................................................. 24
7.3.3 Tree view ..................................................................................................... 24
7.3.4 Custom view ................................................................................................ 25
7.3.5 Graph search ............................................................................................... 26
7.3.6 Device types in the Topology view .............................................................. 26
7.3.7 Device status indicators in the Topology view ............................................ 28
7.3.8 Link indicators in the Topology view ........................................................... 28
7.3.9 Protocol indicators in the Topology view .................................................... 29
7.3.10 .....................................................................................................................................................Device details 29
7.4 Q-Factor ....................................................................................................... 32
7.4.1 Multiple Q-Factors ....................................................................................... 32
7.5 Traffic Light .................................................................................................. 33
7.5.1 Traffic light state explained ......................................................................... 33
7.5.2 Traffic light triggers ...................................................................................... 33
7.6 Device list ..................................................................................................... 34
Osiris / Atlas / Mercury | User Manual v1.1.83 | July 2019 | © PROCENTEC 6/97
7.6.1 Table customization ..................................................................................... 34
7.6.2 Available columns ........................................................................................ 35
7.7 Trending ....................................................................................................... 37
7.8 Report .......................................................................................................... 38
7.9 OPC UA ........................................................................................................ 39
7.10 E-mail Notifications...................................................................................... 39
7.11 IXON VPN service (Atlas only) ...................................................................... 39
7.11.1 ...................................................................................... Configure a VPN Service on your device 40
7.11.2 ................................................................................................................................. How to use IXON VPN 41
8. Commissioning Wizard ................................................................................ 44
8.1.1 Starting the Commissioning Wizard ............................................................ 44
8.1.2 Quickscan ..................................................................................................... 44
8.1.3 Commissioning ............................................................................................ 44
9. EtherTAP ...................................................................................................... 45
9.1.1 EtherTAP – Message Analysis ...................................................................... 45
9.2 PROFINET analysis ....................................................................................... 46
9.2.1 Network overview and device details .......................................................... 46
9.2.2 Alarms .......................................................................................................... 47
9.2.3 Message Recording ...................................................................................... 47
9.3 Ethernet analysis ......................................................................................... 49
9.3.1 Overview ...................................................................................................... 49
9.3.2 Trending ....................................................................................................... 49
10. Device mode: PROFIBUS (Mercury only) ..................................................... 50
10.1 Dashboard ................................................................................................... 50
10.1.1 ................................................................................................................................................. Network status 50
10.1.2 ................................................................................................................................................................. Q-Factor 55
Osiris / Atlas / Mercury | User Manual v1.1.83 | July 2019 | © PROCENTEC 7/97
10.1.3 ........................................................................................................................................................................ Scope 56
10.1.4 ................................................................................................................................................................ Bargraph 57
10.1.5 .............................................................................................................................................................. Messages 58
10.1.6 .......................................................................................................................................... GSD Management 59
11. Settings ........................................................................................................ 61
11.1 General tab .................................................................................................. 61
11.2 User tab ....................................................................................................... 62
11.3 Date & time ................................................................................................. 62
11.4 Ethernet (office) (Atlas only) & Ethernet (factory) ...................................... 63
11.5 Network monitoring .................................................................................... 63
11.6 SNMP Communities ..................................................................................... 64
11.7 Email ............................................................................................................ 64
11.8 System ......................................................................................................... 65
11.9 Updates........................................................................................................ 65
11.10 .........................................................................................................................................................................About 66
11.11 .............................................................................................................................................. License Manager 66
11.11.1 .................................................................................................... How to upload a new license file 67
12. Updating the firmware ................................................................................ 68
12.1 How to find your current version ................................................................ 68
12.2 How to update ............................................................................................. 69
12.3 Updating Atlas( > 1.0.32 ) ............................................................................ 69
12.4 Updating Mercury ........................................................................................ 72
12.5 Updating Atlas Version 1.0.32 ..................................................................... 77
13. Resetting Osiris to factory defaults ............................................................. 78
13.1 On Atlas ....................................................................................................... 78
13.2 On Mercury .................................................................................................. 78
Osiris / Atlas / Mercury | User Manual v1.1.83 | July 2019 | © PROCENTEC 8/97
13.3 Using the Settings in the web interface ....................................................... 79
14. Firewall settings ........................................................................................... 80
15. Technical specifications Atlas ...................................................................... 81
16. Technical specifications Mercury ................................................................ 83
17. Order codes ................................................................................................. 85
18. Certificates ................................................................................................... 89
19. Sales offices and distributors ....................................................................... 90
20. About PROCENTEC ....................................................................................... 95
21. Notes ........................................................................................................... 96
Osiris / Atlas / Mercury | User Manual v1.1.83 | July 2019 | © PROCENTEC 9/97
1. Product description
1.1 Introduction
PROCENTEC’s Osiris on Atlas and Mercury is the solution for monitoring and diagnosing Ethernet networks,
where innovative simplicity and predictive capabilities are desired. The tool is perfect for preventing
unexpected and expensive downtime within PROFIBUS, PROFINET and industrial Ethernet networks.
PROCENTEC’s Osiris provides unique insight in your networks health and topology. With PROCENTEC Osiris
operators and engineers can easily detect problems and find their causes within your network. This prevents
costly down times.
The ease of use and clear overview makes this an ideal solution for the complete understanding of networks,
always and anywhere. Atlas is a compact device that can be installed on a DIN rail and plugged in to the
network for permanent network monitoring, and Mercury is the portable version. Osiris does not require
additional and time-consuming software installations on the PC. You can get all the information using a custom
designed web application. All the information Osiris provides can be viewed on the central, customizable
dashboard page.
1.2 Your benefits
• Ease of use
• Use of Industrial Ethernet
• Topology
• Standalone device, 24/7 available
• Safe use
• Customizable dashboard
• Resistant to all environmental factors
• No software required
1.3 Product features
• Network Topology
• Customizable dashboard
• Network Quality Factor
• Alarms
• Not vendor or protocol specific
1.4 System requirements
Osiris runs on any browser-enabled computer; the interface is fully web based.
HTML5 and JavaScript must be supported by the browser.
The minimum version requirements for web browsers are:
• Chrome version 46 or higher
• Edge version 25 or higher
• Firefox version 42 or higher
• Safari version 5 or higher For optimal experience it is recommended to use Chrome. Internet Explorer versions are not supported.
Osiris / Atlas / Mercury | User Manual v1.1.83 | July 2019 | © PROCENTEC 10/97
2. Atlas
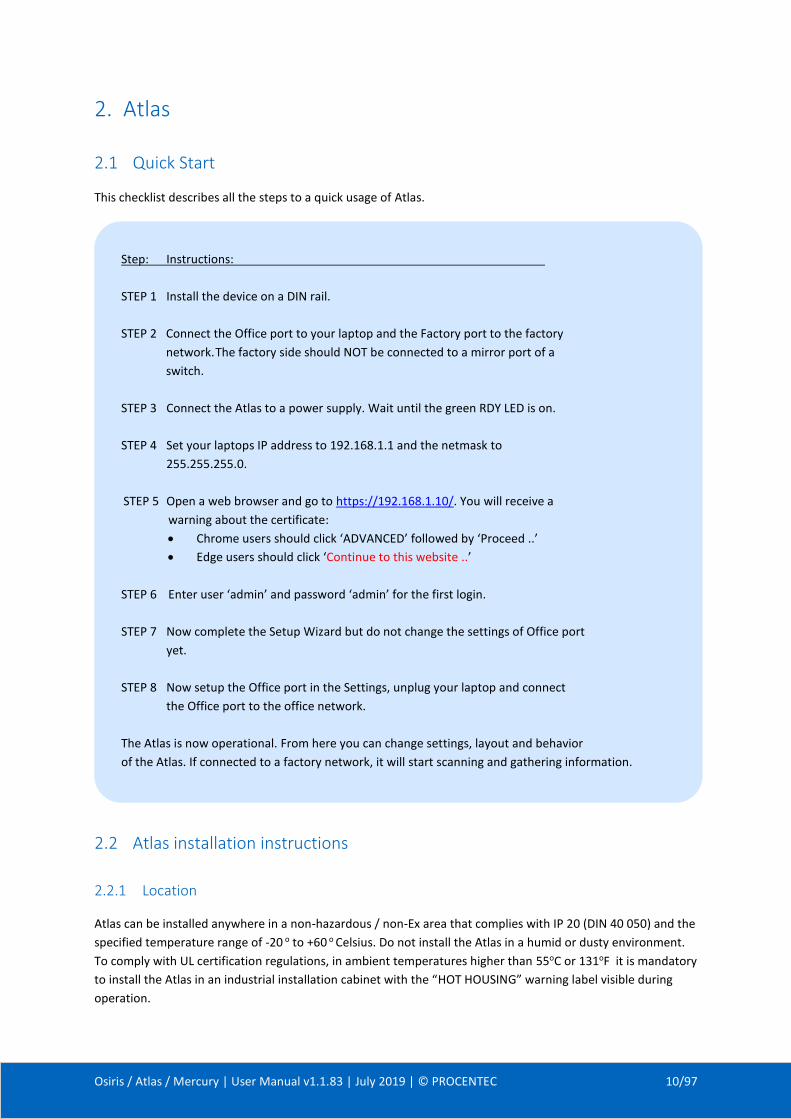
2.1 Quick Start
This checklist describes all the steps to a quick usage of Atlas.
2.2 Atlas installation instructions
2.2.1 Location
Atlas can be installed anywhere in a non-hazardous / non-Ex area that complies with IP 20 (DIN 40 050) and the
specified temperature range of -20 o to +60 o Celsius. Do not install the Atlas in a humid or dusty environment.
To comply with UL certification regulations, in ambient temperatures higher than 55oC or 131oF it is mandatory
to install the Atlas in an industrial installation cabinet with the “HOT HOUSING” warning label visible during
operation.
Step: Instructions:
STEP 1 Install the device on a DIN rail.
STEP 2 Connect the Office port to your laptop and the Factory port to the factory
network. The factory side should NOT be connected to a mirror port of a
switch.
STEP 3 Connect the Atlas to a power supply. Wait until the green RDY LED is on.
STEP 4 Set your laptops IP address to 192.168.1.1 and the netmask to
255.255.255.0.
STEP 5 Open a web browser and go to https://192.168.1.10/. You will receive a
warning about the certificate:
• Chrome users should click ‘ADVANCED’ followed by ‘Proceed ..’
• Edge users should click ‘Continue to this website ..’
STEP 6 Enter user ‘admin’ and password ‘admin’ for the first login.
STEP 7 Now complete the Setup Wizard but do not change the settings of Office port
yet.
STEP 8 Now setup the Office port in the Settings, unplug your laptop and connect
the Office port to the office network.
The Atlas is now operational. From here you can change settings, layout and behavior
of the Atlas. If connected to a factory network, it will start scanning and gathering information.
Osiris / Atlas / Mercury | User Manual v1.1.83 | July 2019 | © PROCENTEC 11/97
“WARNING, HOT HOUSING. When in use at an ambient temperature higher than
55oC or 131oF, the housing of the Atlas will be hot. Do not touch the housing!”
To comply with UL certification regulations the Atlas is to be used at altitudes not exceeding 2000m and in non-
tropical climate regions only.
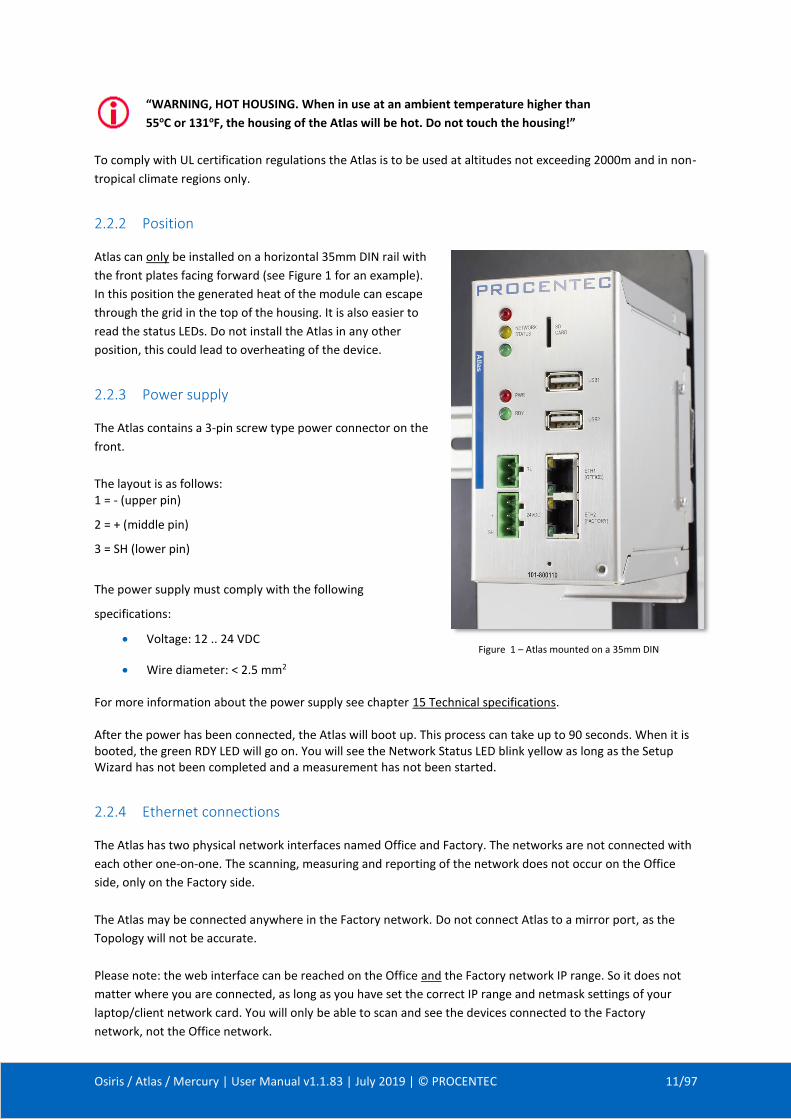
2.2.2 Position
Atlas can only be installed on a horizontal 35mm DIN rail with
the front plates facing forward (see Figure 1 for an example).
In this position the generated heat of the module can escape
through the grid in the top of the housing. It is also easier to
read the status LEDs. Do not install the Atlas in any other
position, this could lead to overheating of the device.
2.2.3 Power supply
The Atlas contains a 3-pin screw type power connector on the
front.
The layout is as follows: 1 = - (upper pin)
2 = + (middle pin)
3 = SH (lower pin)
The power supply must comply with the following
specifications:
• Voltage: 12 .. 24 VDC
• Wire diameter: < 2.5 mm2 For more information about the power supply see chapter 15 Technical specifications. After the power has been connected, the Atlas will boot up. This process can take up to 90 seconds. When it is booted, the green RDY LED will go on. You will see the Network Status LED blink yellow as long as the Setup Wizard has not been completed and a measurement has not been started.
2.2.4 Ethernet connections
The Atlas has two physical network interfaces named Office and Factory. The networks are not connected with
each other one-on-one. The scanning, measuring and reporting of the network does not occur on the Office
side, only on the Factory side.
The Atlas may be connected anywhere in the Factory network. Do not connect Atlas to a mirror port, as the
Topology will not be accurate.
Please note: the web interface can be reached on the Office and the Factory network IP range. So it does not
matter where you are connected, as long as you have set the correct IP range and netmask settings of your
laptop/client network card. You will only be able to scan and see the devices connected to the Factory
network, not the Office network.
Figure 1 – Atlas mounted on a 35mm DIN
rail
Osiris / Atlas / Mercury | User Manual v1.1.83 | July 2019 | © PROCENTEC 12/97
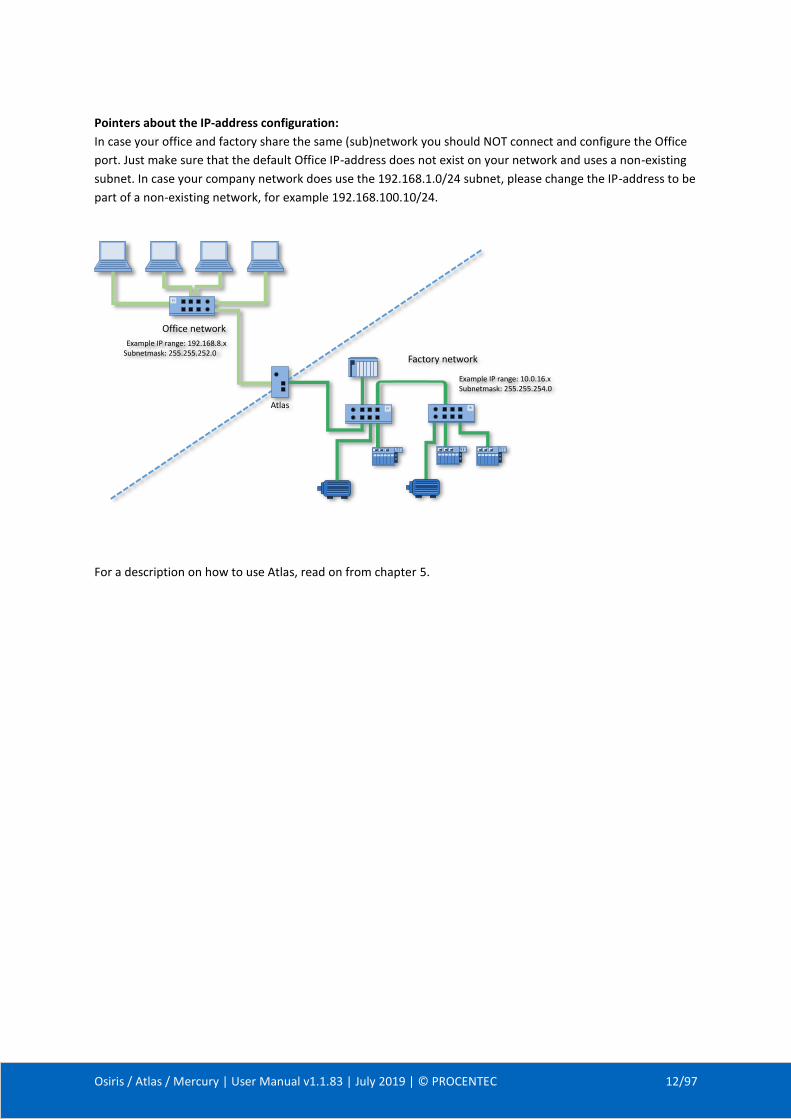
Pointers about the IP-address configuration:
In case your office and factory share the same (sub)network you should NOT connect and configure the Office
port. Just make sure that the default Office IP-address does not exist on your network and uses a non-existing
subnet. In case your company network does use the 192.168.1.0/24 subnet, please change the IP-address to be
part of a non-existing network, for example 192.168.100.10/24.
For a description on how to use Atlas, read on from chapter 5.
Factory network
Office network
Atlas
Example IP range: 192.168.8.xSubnetmask: 255.255.252.0
Example IP range: 10.0.16.xSubnetmask: 255.255.254.0
Osiris / Atlas / Mercury | User Manual v1.1.83 | July 2019 | © PROCENTEC 13/97
3. Mercury
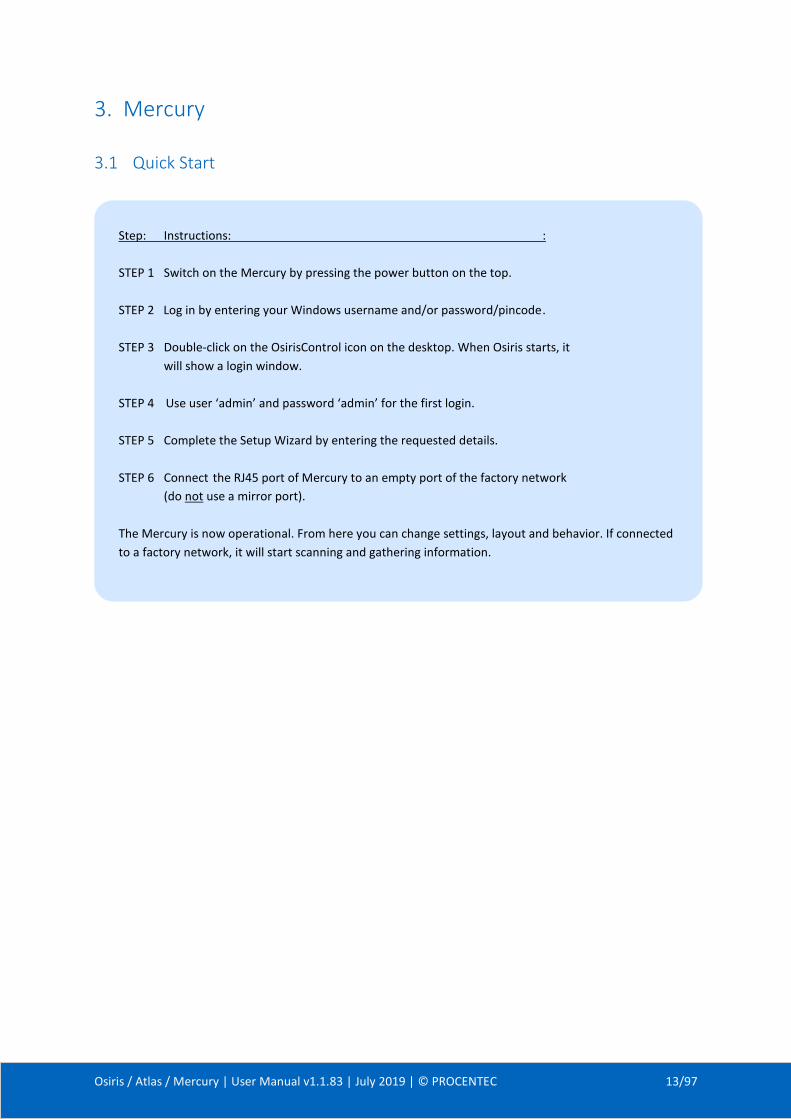
3.1 Quick Start
Step: Instructions: :
STEP 1 Switch on the Mercury by pressing the power button on the top.
STEP 2 Log in by entering your Windows username and/or password/pincode .
STEP 3 Double-click on the OsirisControl icon on the desktop. When Osiris starts, it
will show a login window.
STEP 4 Use user ‘admin’ and password ‘admin’ for the first login.
STEP 5 Complete the Setup Wizard by entering the requested details.
STEP 6 Connect the RJ45 port of Mercury to an empty port of the factory network
(do not use a mirror port).
The Mercury is now operational. From here you can change settings, layout and behavior. If connected
to a factory network, it will start scanning and gathering information.
Osiris / Atlas / Mercury | User Manual v1.1.83 | July 2019 | © PROCENTEC 14/97
4. Osiris User interface
Osiris displays all information by means of a web page. To access this information, simply open a web browser
and type in the IP-address of your device (for Atlas the default address is 192.168.1.10 for the Office side and
192.168.0.10 for the Factory side; for Mercury, simply double-click on the OsirisControl icon on the desktop,
Osiris webpage will appear as soon as the system has started).
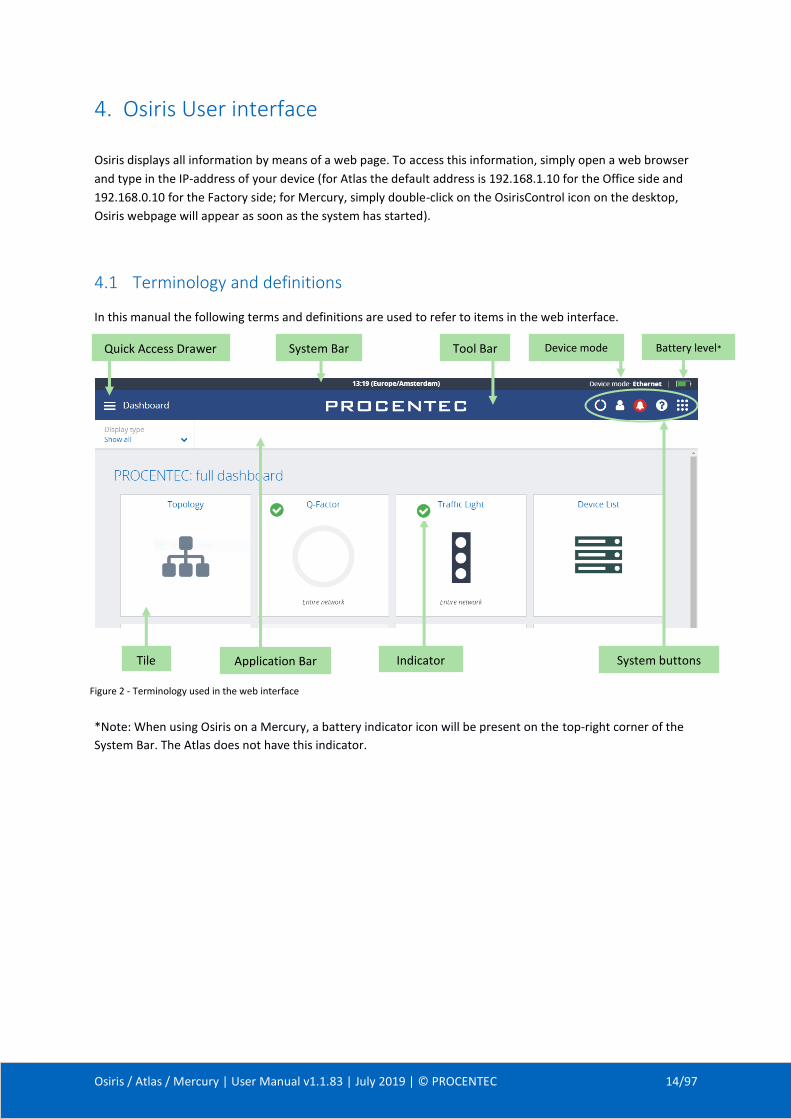
4.1 Terminology and definitions
In this manual the following terms and definitions are used to refer to items in the web interface.
*Note: When using Osiris on a Mercury, a battery indicator icon will be present on the top-right corner of the
System Bar. The Atlas does not have this indicator.
Tool Bar
Tile Indicator System buttons
Quick Access Drawer System Bar Device mode
Application Bar
Battery level*
Figure 2 - Terminology used in the web interface
Osiris / Atlas / Mercury | User Manual v1.1.83 | July 2019 | © PROCENTEC 15/97
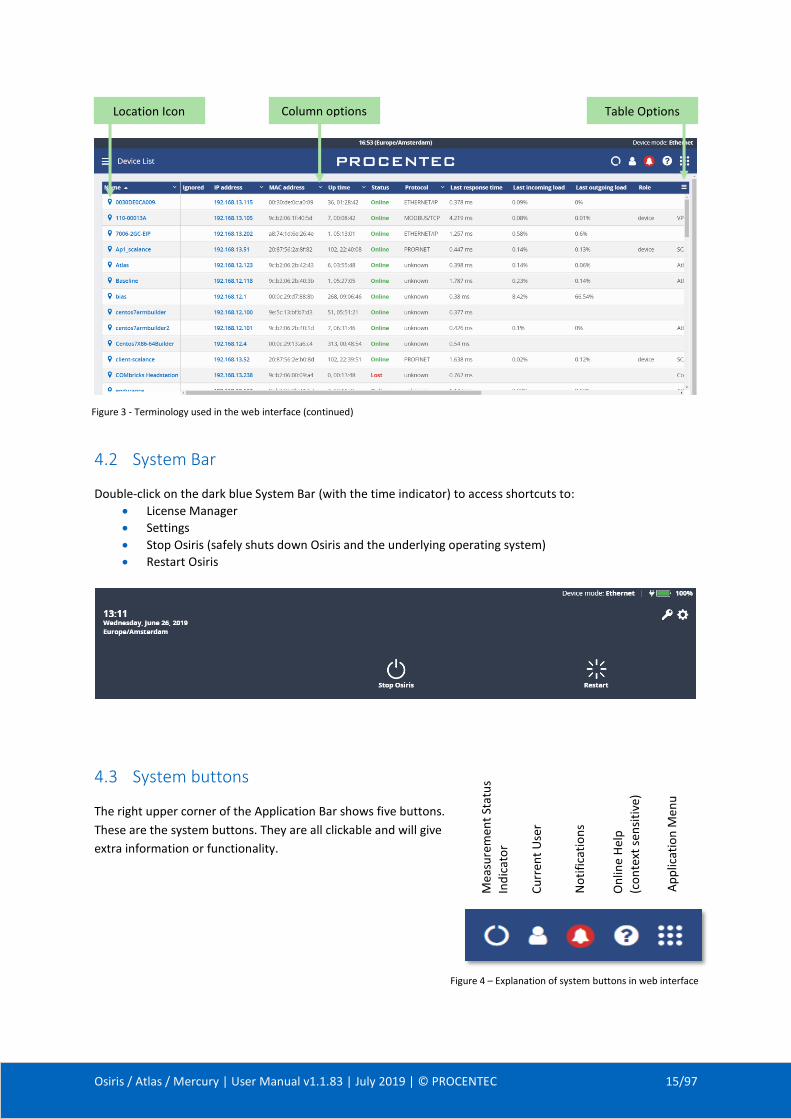
Figure 4 – Explanation of system buttons in web interface
4.2 System Bar
Double-click on the dark blue System Bar (with the time indicator) to access shortcuts to:
• License Manager
• Settings
• Stop Osiris (safely shuts down Osiris and the underlying operating system)
• Restart Osiris
4.3 System buttons
The right upper corner of the Application Bar shows five buttons.
These are the system buttons. They are all clickable and will give
extra information or functionality.
Table Options
BarApplication
Location Icon Column options
Figure 3 - Terminology used in the web interface (continued)
Mea
sure
men
t St
atu
s
Ind
icat
or
On
line
Hel
p
(co
nte
xt s
ensi
tive
)
No
tifi
cati
on
s
Cu
rren
t U
ser
Ap
plic
atio
n M
enu
Osiris / Atlas / Mercury | User Manual v1.1.83 | July 2019 | © PROCENTEC 16/97
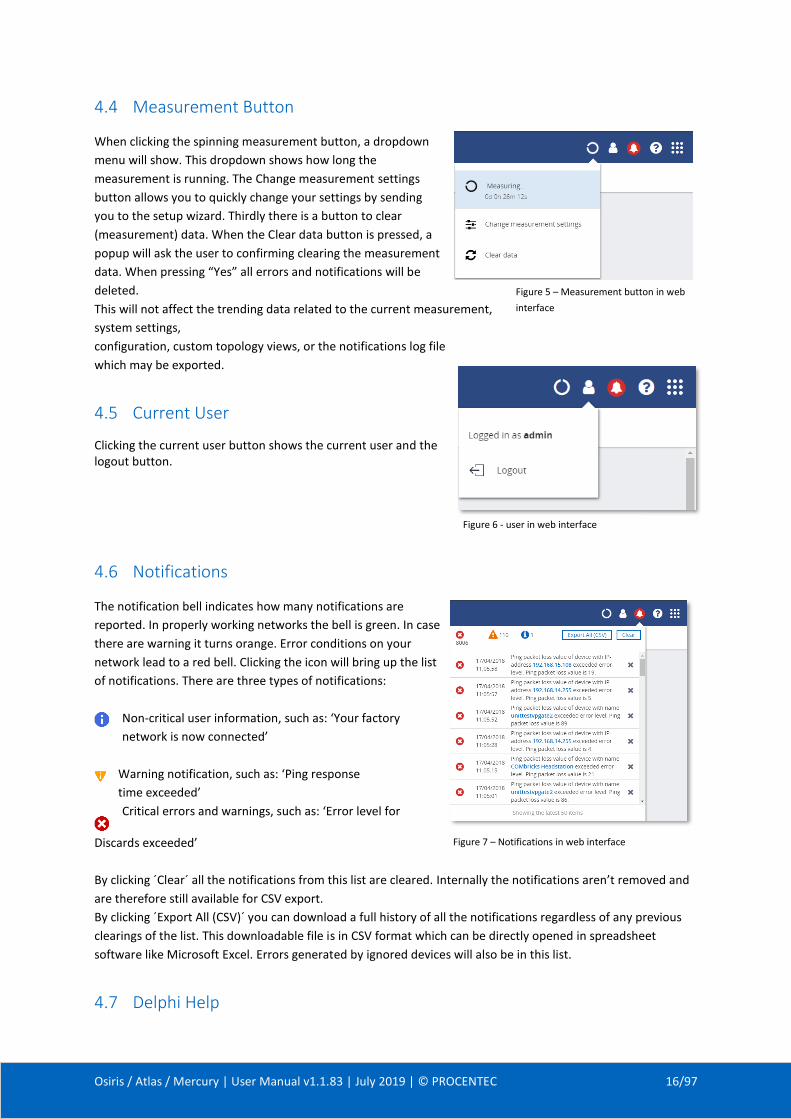
4.4 Measurement Button
When clicking the spinning measurement button, a dropdown
menu will show. This dropdown shows how long the
measurement is running. The Change measurement settings
button allows you to quickly change your settings by sending
you to the setup wizard. Thirdly there is a button to clear
(measurement) data. When the Clear data button is pressed, a
popup will ask the user to confirming clearing the measurement
data. When pressing “Yes” all errors and notifications will be
deleted.
This will not affect the trending data related to the current measurement,
system settings,
configuration, custom topology views, or the notifications log file
which may be exported.
4.5 Current User
Clicking the current user button shows the current user and the logout button.
4.6 Notifications
The notification bell indicates how many notifications are
reported. In properly working networks the bell is green. In case
there are warning it turns orange. Error conditions on your
network lead to a red bell. Clicking the icon will bring up the list
of notifications. There are three types of notifications:
Non-critical user information, such as: ‘Your factory
network is now connected’
Warning notification, such as: ‘Ping response
time exceeded’
Critical errors and warnings, such as: ‘Error level for
Discards exceeded’
By clicking ´Clear´ all the notifications from this list are cleared. Internally the notifications aren’t removed and
are therefore still available for CSV export.
By clicking ´Export All (CSV)´ you can download a full history of all the notifications regardless of any previous
clearings of the list. This downloadable file is in CSV format which can be directly opened in spreadsheet
software like Microsoft Excel. Errors generated by ignored devices will also be in this list.
4.7 Delphi Help
Figure 5 – Measurement button in web
interface
Figure 6 - user in web interface
Figure 7 – Notifications in web interface
Osiris / Atlas / Mercury | User Manual v1.1.83 | July 2019 | © PROCENTEC 17/97
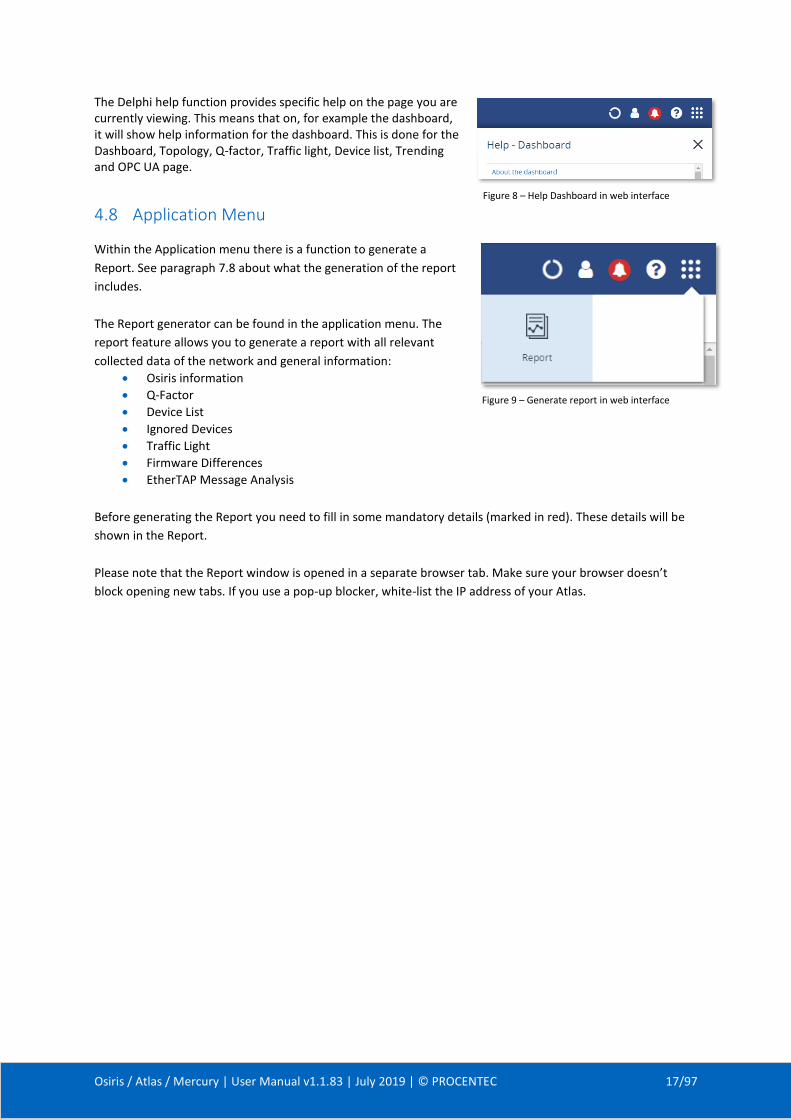
The Delphi help function provides specific help on the page you are currently viewing. This means that on, for example the dashboard, it will show help information for the dashboard. This is done for the Dashboard, Topology, Q-factor, Traffic light, Device list, Trending and OPC UA page.
4.8 Application Menu
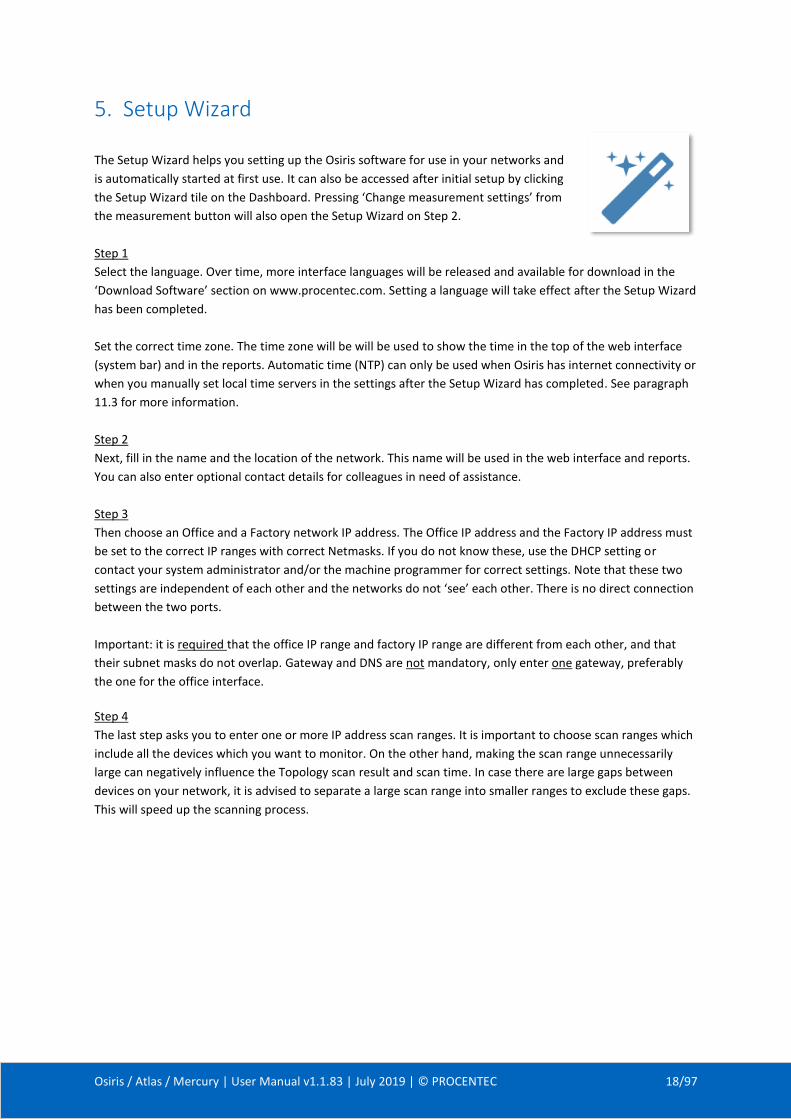
Within the Application menu there is a function to generate a
Report. See paragraph 7.8 about what the generation of the report
includes.
The Report generator can be found in the application menu. The
report feature allows you to generate a report with all relevant
collected data of the network and general information:
• Osiris information
• Q-Factor
• Device List
• Ignored Devices
• Traffic Light
• Firmware Differences
• EtherTAP Message Analysis
Before generating the Report you need to fill in some mandatory details (marked in red). These details will be
shown in the Report.
Please note that the Report window is opened in a separate browser tab. Make sure your browser doesn’t
block opening new tabs. If you use a pop-up blocker, white-list the IP address of your Atlas.
Figure 8 – Help Dashboard in web interface
Figure 9 – Generate report in web interface
Osiris / Atlas / Mercury | User Manual v1.1.83 | July 2019 | © PROCENTEC 18/97
5. Setup Wizard
The Setup Wizard helps you setting up the Osiris software for use in your networks and
is automatically started at first use. It can also be accessed after initial setup by clicking
the Setup Wizard tile on the Dashboard. Pressing ‘Change measurement settings’ from
the measurement button will also open the Setup Wizard on Step 2.
Step 1
Select the language. Over time, more interface languages will be released and available for download in the
‘Download Software’ section on www.procentec.com. Setting a language will take effect after the Setup Wizard
has been completed.
Set the correct time zone. The time zone will be will be used to show the time in the top of the web interface
(system bar) and in the reports. Automatic time (NTP) can only be used when Osiris has internet connectivity or
when you manually set local time servers in the settings after the Setup Wizard has completed. See paragraph
11.3 for more information.
Step 2
Next, fill in the name and the location of the network. This name will be used in the web interface and reports.
You can also enter optional contact details for colleagues in need of assistance.
Step 3
Then choose an Office and a Factory network IP address. The Office IP address and the Factory IP address must
be set to the correct IP ranges with correct Netmasks. If you do not know these, use the DHCP setting or
contact your system administrator and/or the machine programmer for correct settings. Note that these two
settings are independent of each other and the networks do not ‘see’ each other. There is no direct connection
between the two ports.
Important: it is required that the office IP range and factory IP range are different from each other, and that
their subnet masks do not overlap. Gateway and DNS are not mandatory, only enter one gateway, preferably
the one for the office interface.
Step 4
The last step asks you to enter one or more IP address scan ranges. It is important to choose scan ranges which
include all the devices which you want to monitor. On the other hand, making the scan range unnecessarily
large can negatively influence the Topology scan result and scan time. In case there are large gaps between
devices on your network, it is advised to separate a large scan range into smaller ranges to exclude these gaps.
This will speed up the scanning process.
Osiris / Atlas / Mercury | User Manual v1.1.83 | July 2019 | © PROCENTEC 19/97
6. Device mode (Mercury only)
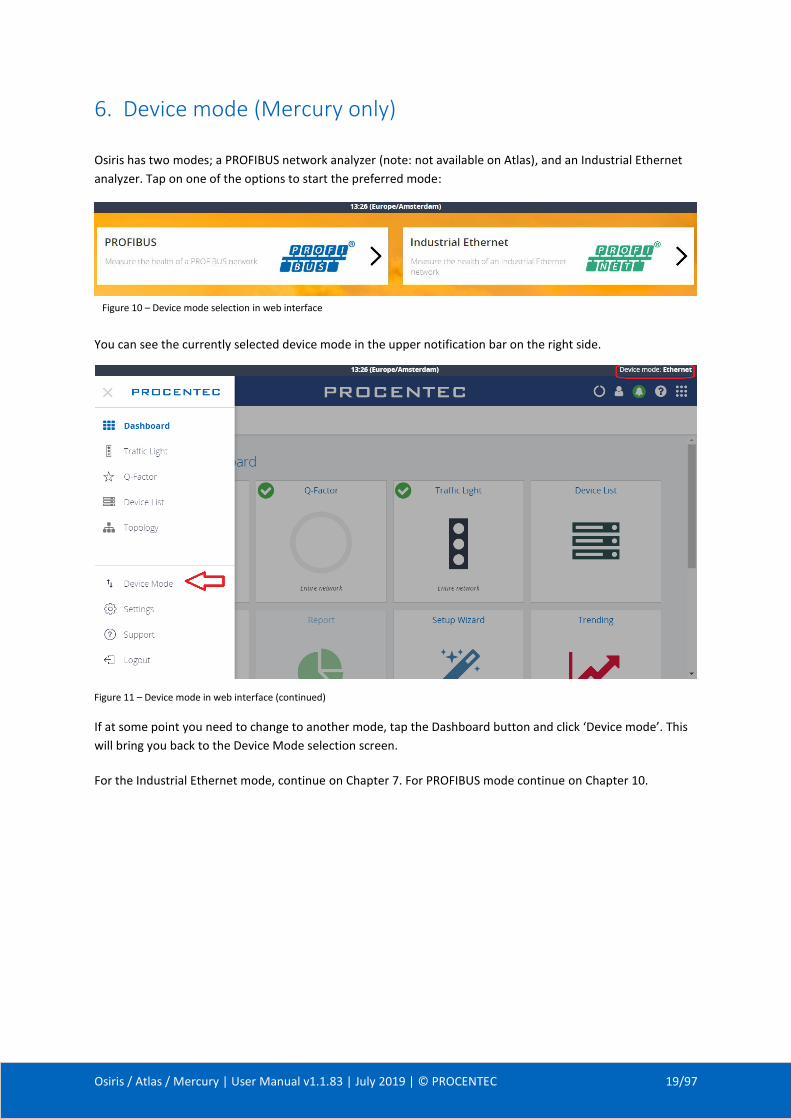
Osiris has two modes; a PROFIBUS network analyzer (note: not available on Atlas), and an Industrial Ethernet
analyzer. Tap on one of the options to start the preferred mode:
You can see the currently selected device mode in the upper notification bar on the right side.
If at some point you need to change to another mode, tap the Dashboard button and click ‘Device mode’. This
will bring you back to the Device Mode selection screen.
For the Industrial Ethernet mode, continue on Chapter 7. For PROFIBUS mode continue on Chapter 10.
Figure 11 – Device mode in web interface (continued)
Figure 10 – Device mode selection in web interface
Osiris / Atlas / Mercury | User Manual v1.1.83 | July 2019 | © PROCENTEC 20/97
7. Device mode: Industrial Ethernet
7.1 Dashboard
The dashboard is a one-stop-shop and overview with access to all available functions through Tiles.
Tiles can be a static picture, but some are also dynamic. These dynamic tiles show an online summary of its
information. This way you have a quick and intuitive way to access information. Some tiles also have a general
status indication in the upper left corner of the tile (green checkmark, orange exclamation or red cross). This is
a uniform way, so you can see quickly if there are problems which need attention.
7.1.1 Dashboard organization
The dashboard is a matrix of tiles and can be organized in 3 different ways:
• Show all: All available tiles are shown in a fixed arrangement
• Show recommended: Only tiles are shown which PROCENTEC deems most important
• Show customized (see paragraph 7.1.2)
7.1.2 Customize Dashboard
To customize the Dashboard, follow the next steps:
• In the Dashboard, go to the upper left corner and click on ‘Display type’. Then choose ‘Show customized’.
• On the upper right part, select ‘Edit dashboard’.
• An empty tile placeholder(s) will appear, marked with a ‘+’ sign.
• By clicking on the ‘+’ sign a popup window will appear.
• Select the tile you would like to place by clicking on it.
• The popup will close and the tile will be placed.
• During edit mode you can drag and drop to a desired grid location.
• By pressing the ‘trashcan’ icon in the lower right part of the tile you can delete the tile.
• When all changes have been made, select ‘Save changes’ in the upper right corner This saved personalized dashboard will remain available after a logout or restart. These settings are stored in a browser session, so this is a personalized setting for a specific user, computer and browser. Opening a customized Dashboard on a different computer or browser will result in a default view.

Osiris / Atlas / Mercury | User Manual v1.1.83 | July 2019 | © PROCENTEC 21/97
7.1.3 User administration
Osiris can be protected against unauthorized access or changing of settings. With means of user rights
administration you can control the level of authentication a certain user (or group of users) has.
The default password for an account is the same as the username. So the password for the admin account is
admin. All letters are lowercase, also for the username.
The default passwords can be changed in the Settings menu. Click on the Quick Drawer Access button and ,
click ‘Settings’ or double-click on the System Bar (admin only) and click on the icon. Then choose the ‘User’
tab.
Osiris / Atlas / Mercury | User Manual v1.1.83 | July 2019 | © PROCENTEC 22/97
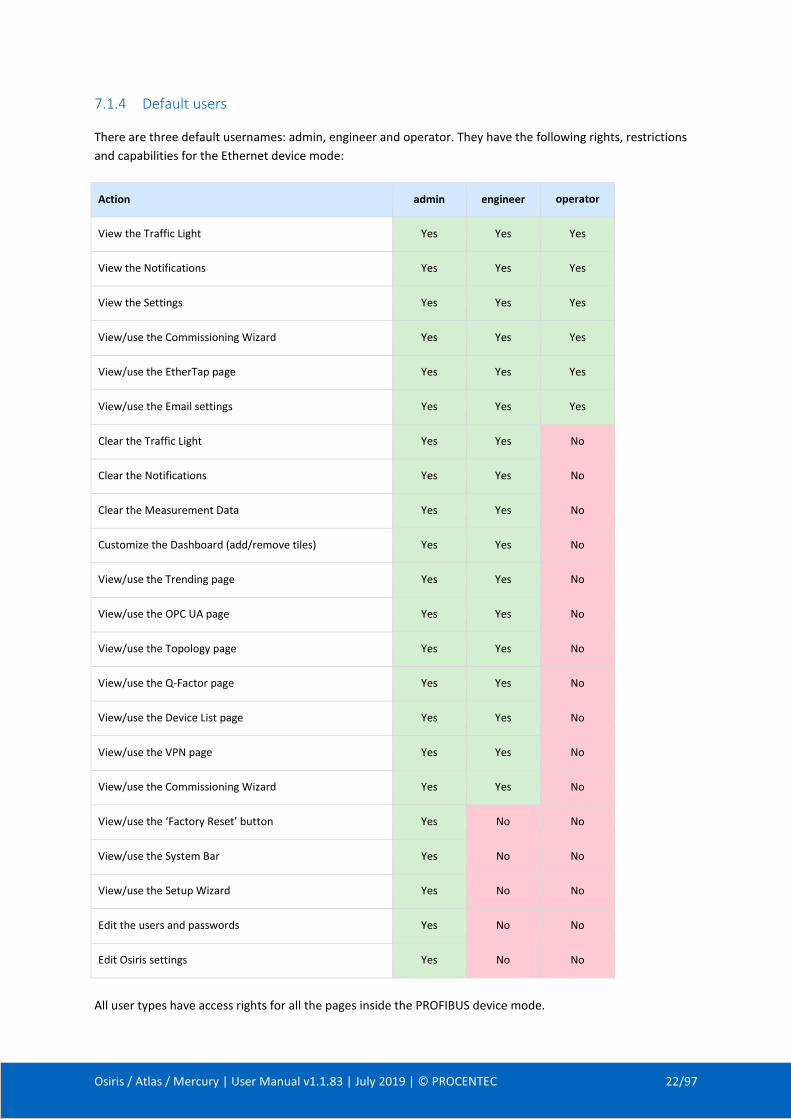
7.1.4 Default users
There are three default usernames: admin, engineer and operator. They have the following rights, restrictions
and capabilities for the Ethernet device mode:
Action admin engineer operator
View the Traffic Light Yes Yes Yes
View the Notifications Yes Yes Yes
View the Settings Yes Yes Yes
View/use the Commissioning Wizard Yes Yes Yes
View/use the EtherTap page Yes Yes Yes
View/use the Email settings Yes Yes Yes
Clear the Traffic Light Yes Yes No
Clear the Notifications Yes Yes No
Clear the Measurement Data Yes Yes No
Customize the Dashboard (add/remove tiles) Yes Yes No
View/use the Trending page Yes Yes No
View/use the OPC UA page Yes Yes No
View/use the Topology page Yes Yes No
View/use the Q-Factor page Yes Yes No
View/use the Device List page Yes Yes No
View/use the VPN page Yes Yes No
View/use the Commissioning Wizard Yes Yes No
View/use the ‘Factory Reset’ button Yes No No
View/use the System Bar Yes No No
View/use the Setup Wizard Yes No No
Edit the users and passwords Yes No No
Edit Osiris settings Yes No No
All user types have access rights for all the pages inside the PROFIBUS device mode.
Osiris / Atlas / Mercury | User Manual v1.1.83 | July 2019 | © PROCENTEC 23/97
7.1.5 Password best practice
We encourage you to change the default Administrator password after purchase.
• Change the password(s) immediately after installation or at the office before it is transported to the final destination.
• Never share passwords with anyone.
• Always use strong passwords. Avoid: test, 123456, <your company name>, <your first name>, Atlas, PROCENTEC, etc.
• Change passwords immediately if they may have been compromised.
• If passwords must be written down, store it in a secure place and destroy it when it is no longer needed.
• Be careful about where passwords are saved on computers. Some dialog boxes, such as those for remote access, present an option to save or remember passwords. Selecting this option poses a potential security threat.
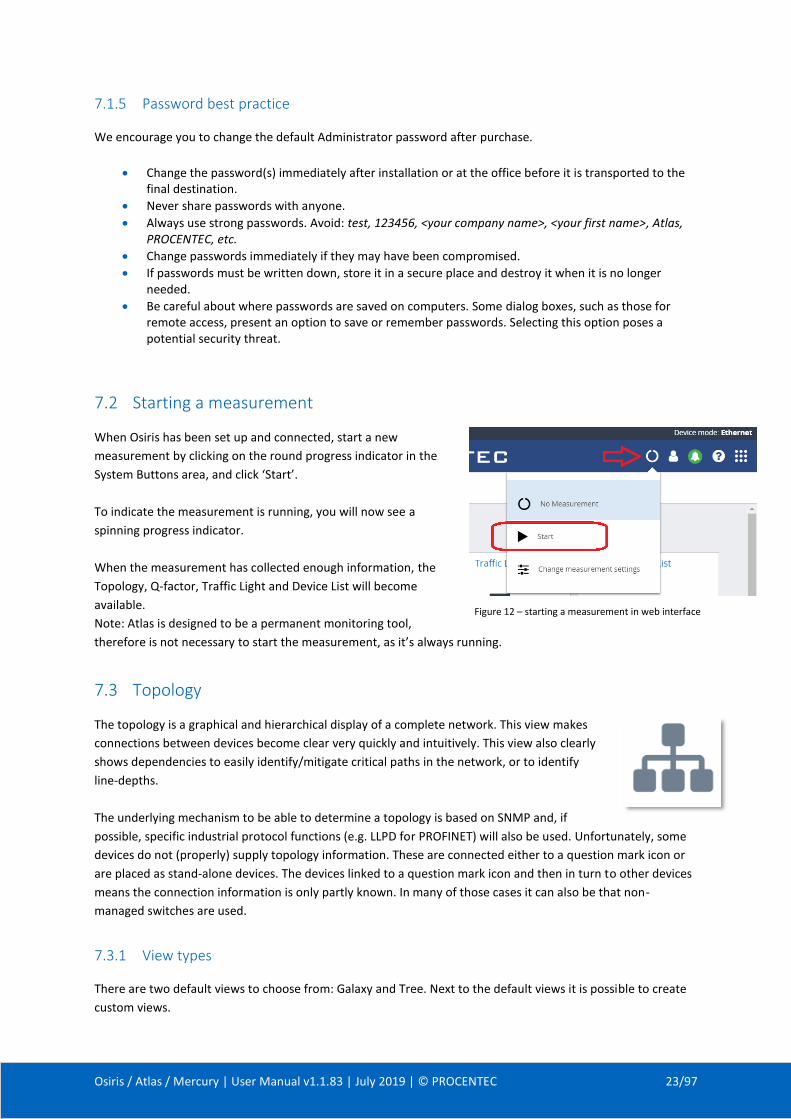
7.2 Starting a measurement
When Osiris has been set up and connected, start a new
measurement by clicking on the round progress indicator in the
System Buttons area, and click ‘Start’.
To indicate the measurement is running, you will now see a
spinning progress indicator.
When the measurement has collected enough information, the
Topology, Q-factor, Traffic Light and Device List will become
available.
Note: Atlas is designed to be a permanent monitoring tool,
therefore is not necessary to start the measurement, as it’s always running.
7.3 Topology
The topology is a graphical and hierarchical display of a complete network. This view makes
connections between devices become clear very quickly and intuitively. This view also clearly
shows dependencies to easily identify/mitigate critical paths in the network, or to identify
line-depths.
The underlying mechanism to be able to determine a topology is based on SNMP and, if
possible, specific industrial protocol functions (e.g. LLPD for PROFINET) will also be used. Unfortunately, some
devices do not (properly) supply topology information. These are connected either to a question mark icon or
are placed as stand-alone devices. The devices linked to a question mark icon and then in turn to other devices
means the connection information is only partly known. In many of those cases it can also be that non-
managed switches are used.
7.3.1 View types
There are two default views to choose from: Galaxy and Tree. Next to the default views it is possible to create
custom views.
Figure 12 – starting a measurement in web interface
Osiris / Atlas / Mercury | User Manual v1.1.83 | July 2019 | © PROCENTEC 24/97
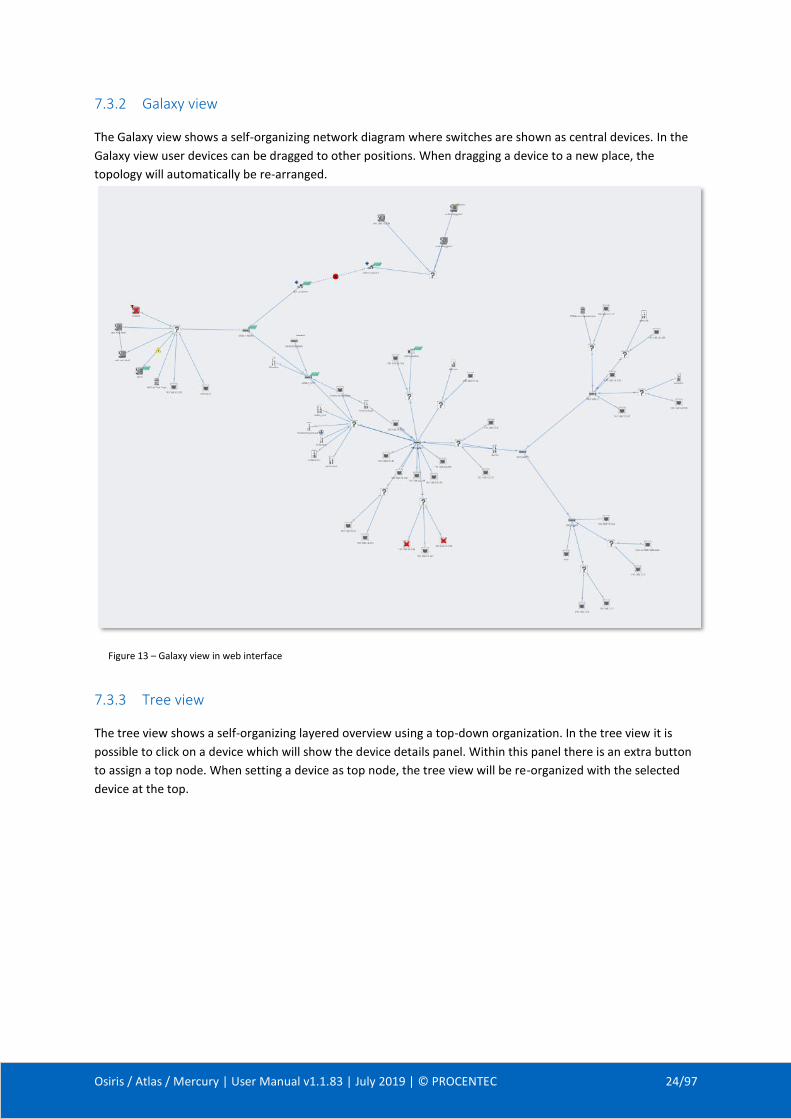
7.3.2 Galaxy view
The Galaxy view shows a self-organizing network diagram where switches are shown as central devices. In the
Galaxy view user devices can be dragged to other positions. When dragging a device to a new place, the
topology will automatically be re-arranged.
7.3.3 Tree view
The tree view shows a self-organizing layered overview using a top-down organization. In the tree view it is
possible to click on a device which will show the device details panel. Within this panel there is an extra button
to assign a top node. When setting a device as top node, the tree view will be re-organized with the selected
device at the top.
Figure 13 – Galaxy view in web interface

Osiris / Atlas / Mercury | User Manual v1.1.83 | July 2019 | © PROCENTEC 25/97
7.3.4 Custom view
From within the galaxy view it is possible to create custom views. Click ‘Create view’ and assign a name to the
view. A grid appears on the background: now all devices have a fixed position which can be changed by
dragging them around. The positions will be saved automatically, can be viewed and edited in multiple
browsers and are persistent over a restart. Also it is possible to rename or delete a custom view the Delete and
Rename buttons
In all views, devices are connected to each other with lines. These connections between devices show how
these are connected to each other and how they are co-dependent. In this overview it is much easier to
understand that if a device is lost, it will affect the connection to other devices behind it. Lost devices are
indicated with a red cross over the device icon.
Figure 14 – Tree view in web interface
Figure 15 – custom view in web interface
Osiris / Atlas / Mercury | User Manual v1.1.83 | July 2019 | © PROCENTEC 26/97
Link problems between devices are indicated with a red cross on that particular link. The two numbers shown
on both ends of the link lines, specify the port number used for this link.
7.3.5 Graph search
To easily find devices in the Topology view, click on the magnifier icon in the top left of the Topology view. This will show an input field, where you can enter a name, IP address or MAC address of the desired device. Autocomplete will help you to quickly find the device you’re looking for. When clicked on, the topology zooms in on the requested device and opens the device details.
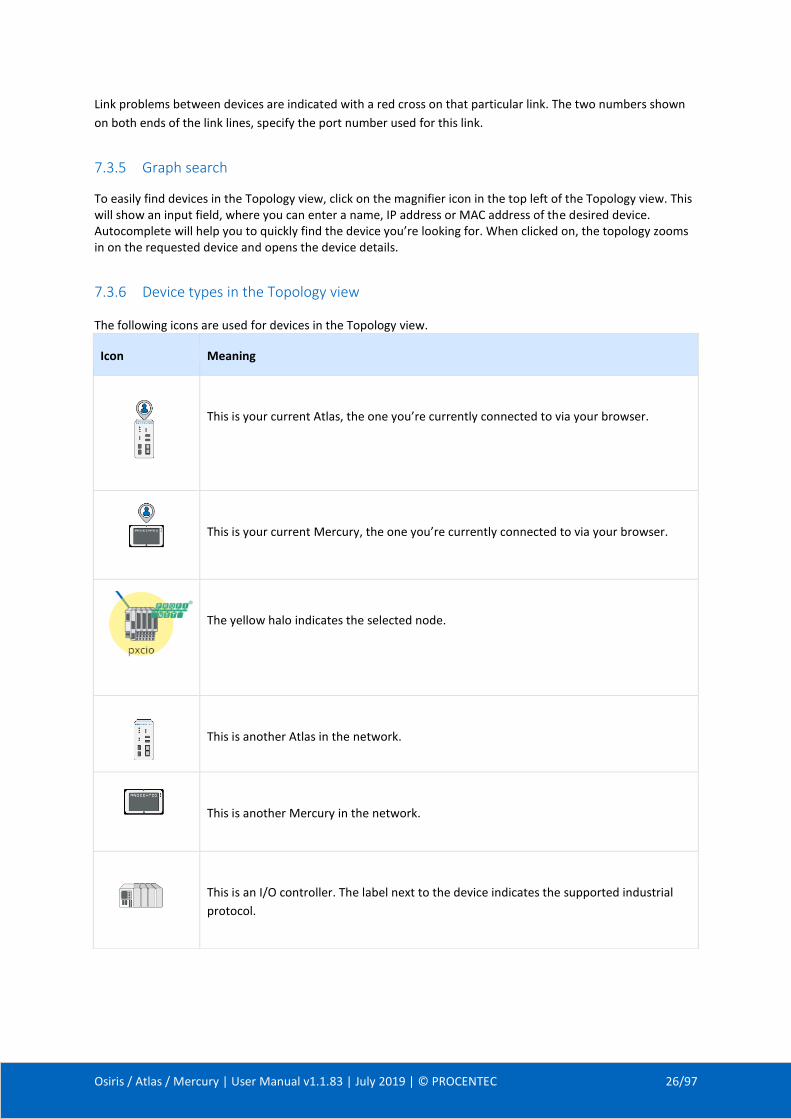
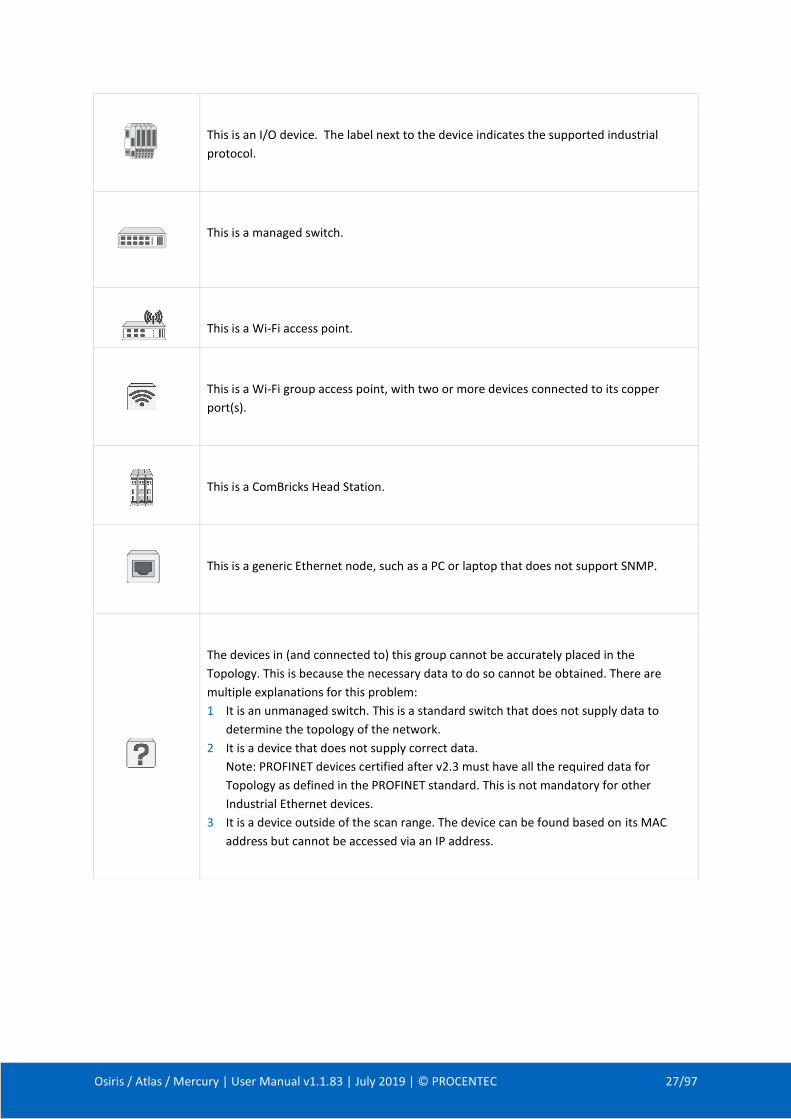
7.3.6 Device types in the Topology view
The following icons are used for devices in the Topology view.
Icon Meaning
This is your current Atlas, the one you’re currently connected to via your browser.
This is your current Mercury, the one you’re currently connected to via your browser.
The yellow halo indicates the selected node.
This is another Atlas in the network.
This is another Mercury in the network.
This is an I/O controller. The label next to the device indicates the supported industrial
protocol.
Osiris / Atlas / Mercury | User Manual v1.1.83 | July 2019 | © PROCENTEC 27/97
This is an I/O device. The label next to the device indicates the supported industrial
protocol.
This is a managed switch.
This is a Wi-Fi access point.
This is a Wi-Fi group access point, with two or more devices connected to its copper
port(s).
This is a ComBricks Head Station.
This is a generic Ethernet node, such as a PC or laptop that does not support SNMP.
The devices in (and connected to) this group cannot be accurately placed in the
Topology. This is because the necessary data to do so cannot be obtained. There are
multiple explanations for this problem:
1 It is an unmanaged switch. This is a standard switch that does not supply data to
determine the topology of the network.
2 It is a device that does not supply correct data.
Note: PROFINET devices certified after v2.3 must have all the required data for
Topology as defined in the PROFINET standard. This is not mandatory for other
Industrial Ethernet devices.
3 It is a device outside of the scan range. The device can be found based on its MAC
address but cannot be accessed via an IP address.
Osiris / Atlas / Mercury | User Manual v1.1.83 | July 2019 | © PROCENTEC 28/97
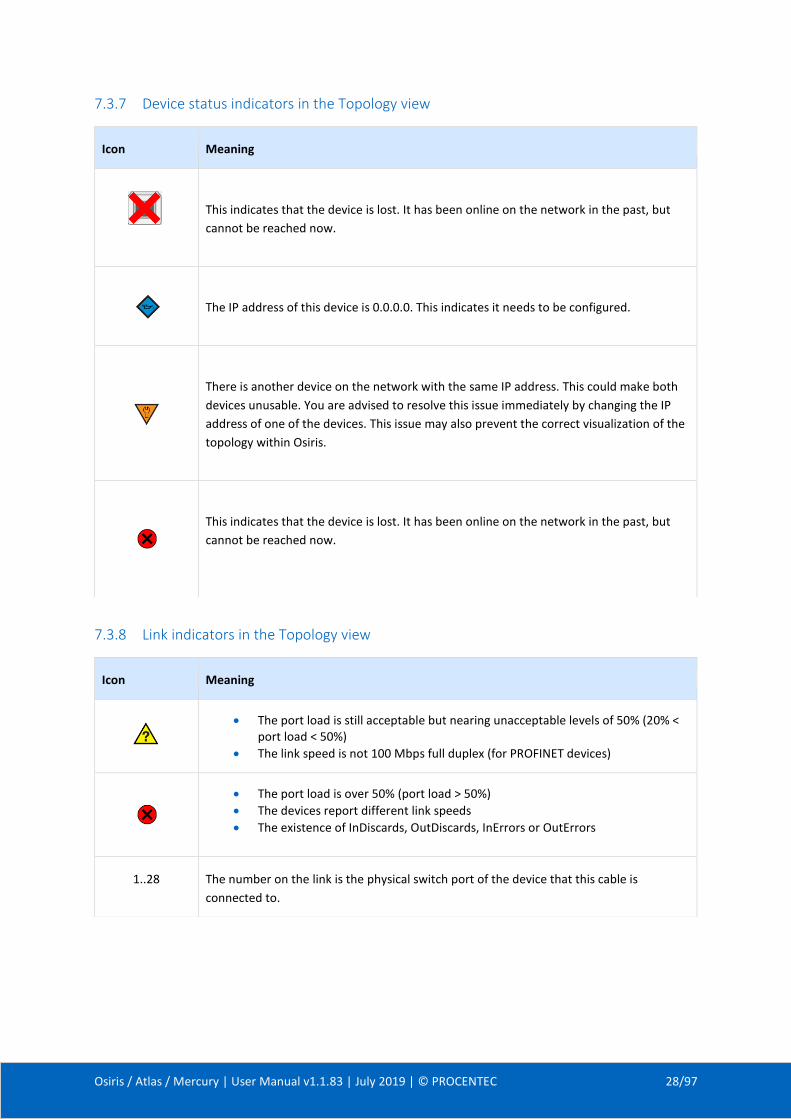
7.3.7 Device status indicators in the Topology view
7.3.8 Link indicators in the Topology view
Icon Meaning
This indicates that the device is lost. It has been online on the network in the past, but
cannot be reached now.
The IP address of this device is 0.0.0.0. This indicates it needs to be configured.
There is another device on the network with the same IP address. This could make both
devices unusable. You are advised to resolve this issue immediately by changing the IP
address of one of the devices. This issue may also prevent the correct visualization of the
topology within Osiris.
This indicates that the device is lost. It has been online on the network in the past, but
cannot be reached now.
Icon Meaning
• The port load is still acceptable but nearing unacceptable levels of 50% (20% < port load < 50%)
• The link speed is not 100 Mbps full duplex (for PROFINET devices)
• The port load is over 50% (port load > 50%)
• The devices report different link speeds
• The existence of InDiscards, OutDiscards, InErrors or OutErrors
1..28
The number on the link is the physical switch port of the device that this cable is
connected to.
Osiris / Atlas / Mercury | User Manual v1.1.83 | July 2019 | © PROCENTEC 29/97
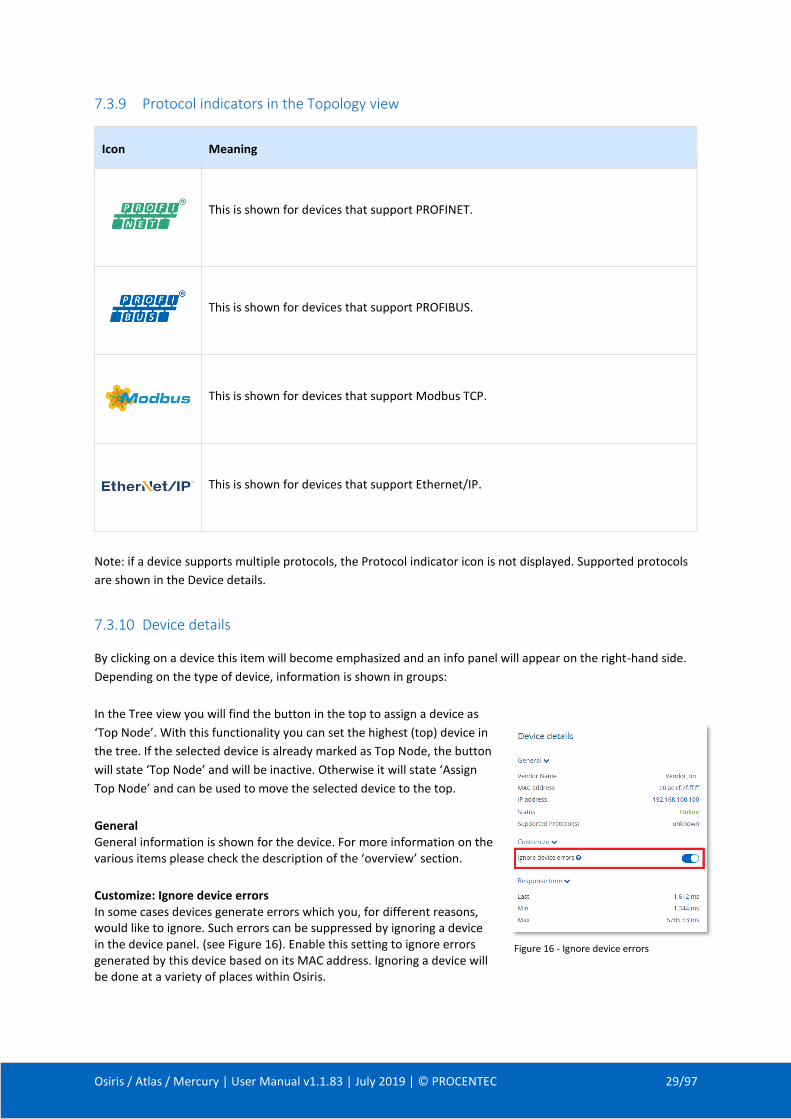
7.3.9 Protocol indicators in the Topology view
Note: if a device supports multiple protocols, the Protocol indicator icon is not displayed. Supported protocols
are shown in the Device details.
7.3.10 Device details
By clicking on a device this item will become emphasized and an info panel will appear on the right-hand side.
Depending on the type of device, information is shown in groups:
In the Tree view you will find the button in the top to assign a device as
‘Top Node’. With this functionality you can set the highest (top) device in
the tree. If the selected device is already marked as Top Node, the button
will state ‘Top Node’ and will be inactive. Otherwise it will state ‘Assign
Top Node’ and can be used to move the selected device to the top.
General General information is shown for the device. For more information on the various items please check the description of the ‘overview’ section.
Customize: Ignore device errors In some cases devices generate errors which you, for different reasons, would like to ignore. Such errors can be suppressed by ignoring a device in the device panel. (see Figure 16). Enable this setting to ignore errors generated by this device based on its MAC address. Ignoring a device will be done at a variety of places within Osiris.
Icon Meaning
This is shown for devices that support PROFINET.
This is shown for devices that support PROFIBUS.
This is shown for devices that support Modbus TCP.
This is shown for devices that support Ethernet/IP.
Figure 16 - Ignore device errors

Osiris / Atlas / Mercury | User Manual v1.1.83 | July 2019 | © PROCENTEC 30/97
Where Effects of ignoring device errors
Device details • Errors are still visible in the device details except for firmware differences.
Device List • When a device is ignored they receive a check in the Ignore column
• All errors and warnings of the device are hidden
Notifications • New errors will not be shown
• Old errors will be removed from the dropdown under the bell. This potentially means that the bell can go back to green
• Errors of ignored devices will still show up in CSV export of the Notifications
Q-Factor • Devices will be marked as ignored
• Errors will no longer influence the Q-Factor of the device. The device will always have Q-Factor 5000 and therefore have no influence on the overall Q-Factor of the network
Report • The device will appear in the Ignored Device list in the report.
Topology • Lost devices are still visible but the usual the red cross which indicates that the device is lost, will be faded
• Double IP-addresses are ignored
• Firmware difference are ignored
• Link errors and warnings will not be shown if you ignore device errors of the device causing the link errors
• A device with IP-address 0.0.0.0 will generate a warning. When ignoring the errors of such a device, it will not generate errors anymore
• Devices which don’t supply correct SNMP data will show a blue NAMUR icon. When ignoring the errors of such a device, this icon will disappear
Traffic Light • Errors will no longer influence the traffic light (both on the web interface as on the physical Atlas itself).
Device errors will still be visible in this Device Details view but will be hidden from the Device List and Topology,
and errors related to this device will not influence the Traffic Light or Q-Factor, or be displayed in the
notifications log. Ignored devices are labelled in the Q-Factor. Notifications which are generated by the device
are stored and downloadable as CSV but are not shown.
Osiris / Atlas / Mercury | User Manual v1.1.83 | July 2019 | © PROCENTEC 31/97
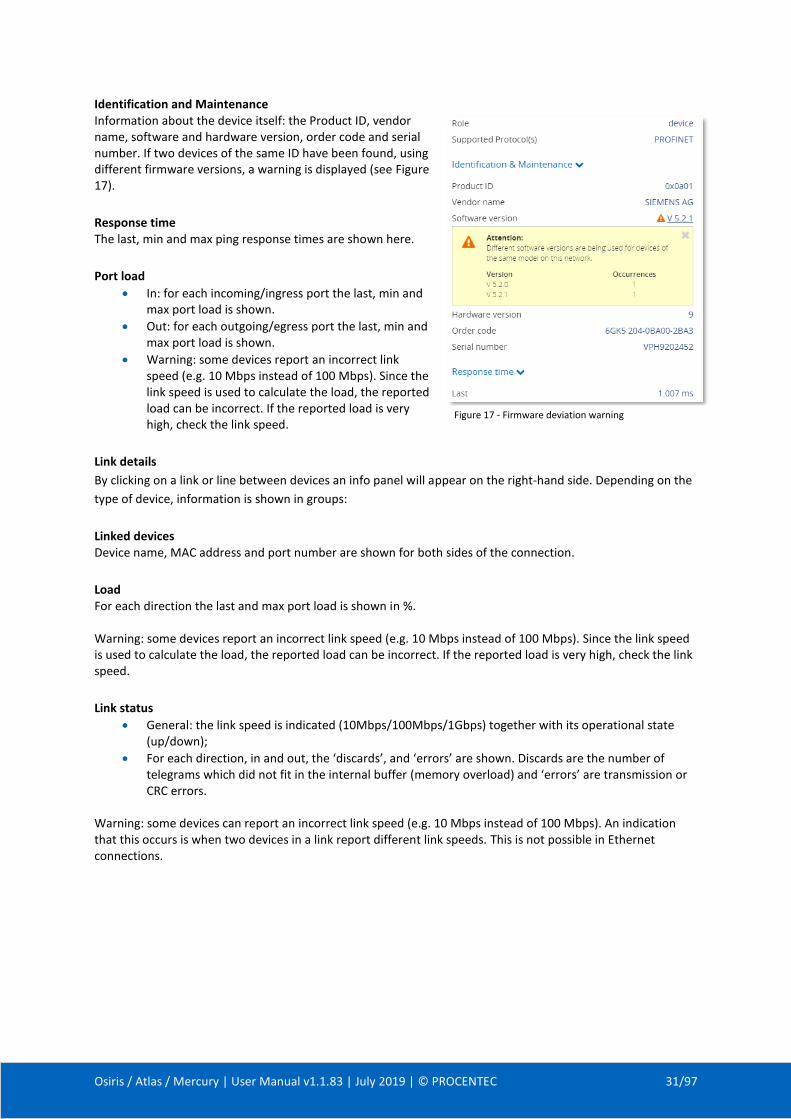
Identification and Maintenance Information about the device itself: the Product ID, vendor name, software and hardware version, order code and serial number. If two devices of the same ID have been found, using different firmware versions, a warning is displayed (see Figure 17).
Response time The last, min and max ping response times are shown here.
Port load
• In: for each incoming/ingress port the last, min and max port load is shown.
• Out: for each outgoing/egress port the last, min and max port load is shown.
• Warning: some devices report an incorrect link speed (e.g. 10 Mbps instead of 100 Mbps). Since the link speed is used to calculate the load, the reported load can be incorrect. If the reported load is very high, check the link speed.
Link details
By clicking on a link or line between devices an info panel will appear on the right-hand side. Depending on the
type of device, information is shown in groups:
Linked devices Device name, MAC address and port number are shown for both sides of the connection.
Load For each direction the last and max port load is shown in %. Warning: some devices report an incorrect link speed (e.g. 10 Mbps instead of 100 Mbps). Since the link speed is used to calculate the load, the reported load can be incorrect. If the reported load is very high, check the link speed.
Link status
• General: the link speed is indicated (10Mbps/100Mbps/1Gbps) together with its operational state (up/down);
• For each direction, in and out, the ‘discards’, and ‘errors’ are shown. Discards are the number of telegrams which did not fit in the internal buffer (memory overload) and ‘errors’ are transmission or CRC errors.
Warning: some devices can report an incorrect link speed (e.g. 10 Mbps instead of 100 Mbps). An indication that this occurs is when two devices in a link report different link speeds. This is not possible in Ethernet connections.
Figure 17 - Firmware deviation warning

Osiris / Atlas / Mercury | User Manual v1.1.83 | July 2019 | © PROCENTEC 32/97
7.4 Q-Factor
The Q-Factor is a number that represents the quality of the network. You can
choose if you want to use the 0 to 5000 range, commonly used in the Automotive
industry, or a percentage.
A value of 5000 or a percentage of 100 is excellent and 0 is critical or unmeasurable.
Additionally, a color coding is used to emphasize the severity. Normally the color
should be green, meaning excellent or good. Yellow is subpar but not critical, e.g.
attention recommended. Red means a bad, critical or urgent issue.
7.4.1 Multiple Q-Factors
There are multiple Q-Factors in use in the tool:
• A Q-Factor for each network device, which indicates the quality for a single network device. Calculation of this Q-Factor is based on a weight of: o Network link load: the bandwidth usage on a certain port of a device, is used to determine the
value. In general, the lower the load, the higher the Q-Factor. o In/Out errors: the number of errors per port of a device. o Ping packet loss: the number of unanswered ping requests.
• A single overall Q-Factor, indicating the quality of a complete network. Currently the overall Q-Factor equals to the lowest Q-Factor of an individual network device.
Figure 18 - Multiple Q-Factors: Overall Q-Factor on the left, individual Q-Factors in the middle and on the right
Osiris / Atlas / Mercury | User Manual v1.1.83 | July 2019 | © PROCENTEC 33/97
7.5 Traffic Light
The Traffic Light is an overall color coded status to indicate the degree of network status. As it
so purposefully describes, the state is in the form of a traffic light. The Network indicator on
the front of the Atlas unit (LEDs) corresponds with the traffic light state in the web browser.
The traffic light can also be read in the live tile in the Dashboard.
7.5.1 Traffic light state explained
• Red light: a serious problem is present in the network, user attention required.
• Yellow light: a situation is present which is important but not serious, user attention recommended.
• Green light: all seems to be working correctly, no important or critical situation.
7.5.2 Traffic light triggers
The following situations cause the traffic light to turn orange:
• A ping response time between 25 and 50 milliseconds
• The occurrence of PROFINET alarms that are not communication alarms
• PROFINET Jitter higher than 50%
• PROFINET Dropped packets
The following situations cause the traffic light to turn red:
• A ping response time higher than 50 milliseconds
• A device previously seen (e.g. by ping) is not responding anymore
• In or Out discards (the number of telegrams which did not fit in the internal buffer of a switch)
• In or Out Errors (transmission errors or CRC errors)
• The occurrence of PROFINET communication alarms

Osiris / Atlas / Mercury | User Manual v1.1.83 | July 2019 | © PROCENTEC 34/97
7.6 Device list
The device list shows a list of all detected network devices. Also, unavailable devices
(detected in the past) are listed here. It provides a full overview of all important
properties of devices in the network.
The entire list is downloadable as a CSV file which can be directly opened in
spreadsheet software like Microsoft Excel.
7.6.1 Table customization
Generally, the table columns can be customized with the following features:
• The left column is pinned, meaning if the scrollbar is horizontally scrolled the leftmost column does not move.
• The list can be sorted by clicking on the column header (ascending, descending or none).
• Columns can be resized by placing the mouse between columns and then selecting/dragging the splitter.
• Columns can be hidden by selecting the icon on the far right of the table. A list will drop down in which you can select which columns are to be shown/hidden.
• Certain columns can be filtered (mainly text fields) by clicking on the ‘sorting options’ button on the right of the column, and then choosing ‘Show filter’. Note: these columns can also be optionally pinned left.
• It is also possible to combine two or more filters. Simply enable a filter for each column that you want to filter, for example an IP address filter and a MAC address filter:
Figure 20 – Combined IP and MAC address filter
Show sorting options for this column
Quick-sort button to sort ascending or descending
Figure 19 - Sorting
Combined filter
Osiris / Atlas / Mercury | User Manual v1.1.83 | July 2019 | © PROCENTEC 35/97
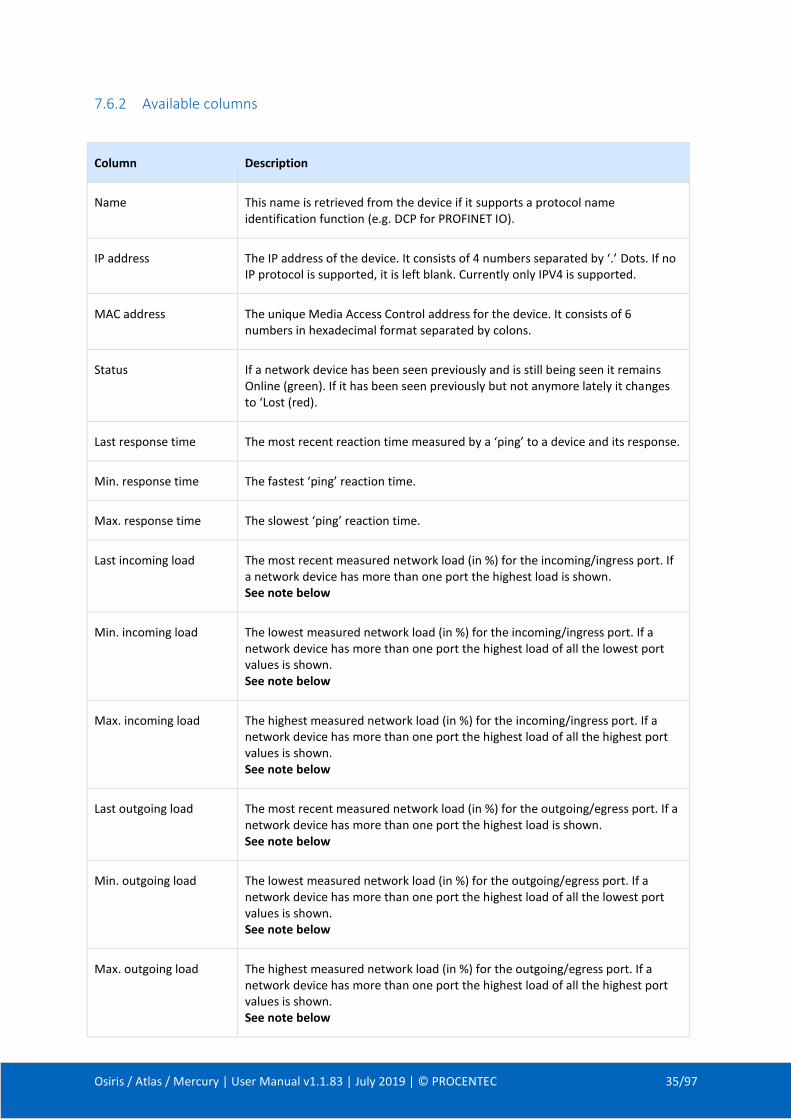
7.6.2 Available columns
Column Description
Name This name is retrieved from the device if it supports a protocol name identification function (e.g. DCP for PROFINET IO).
IP address The IP address of the device. It consists of 4 numbers separated by ‘.’ Dots. If no IP protocol is supported, it is left blank. Currently only IPV4 is supported.
MAC address The unique Media Access Control address for the device. It consists of 6 numbers in hexadecimal format separated by colons.
Status If a network device has been seen previously and is still being seen it remains Online (green). If it has been seen previously but not anymore lately it changes to ‘Lost (red).
Last response time The most recent reaction time measured by a ‘ping’ to a device and its response.
Min. response time The fastest ‘ping’ reaction time.
Max. response time The slowest ‘ping’ reaction time.
Last incoming load The most recent measured network load (in %) for the incoming/ingress port. If a network device has more than one port the highest load is shown. See note below
Min. incoming load The lowest measured network load (in %) for the incoming/ingress port. If a network device has more than one port the highest load of all the lowest port values is shown. See note below
Max. incoming load The highest measured network load (in %) for the incoming/ingress port. If a network device has more than one port the highest load of all the highest port values is shown. See note below
Last outgoing load The most recent measured network load (in %) for the outgoing/egress port. If a network device has more than one port the highest load is shown. See note below
Min. outgoing load The lowest measured network load (in %) for the outgoing/egress port. If a network device has more than one port the highest load of all the lowest port values is shown. See note below
Max. outgoing load The highest measured network load (in %) for the outgoing/egress port. If a network device has more than one port the highest load of all the highest port values is shown. See note below
Osiris / Atlas / Mercury | User Manual v1.1.83 | July 2019 | © PROCENTEC 36/97
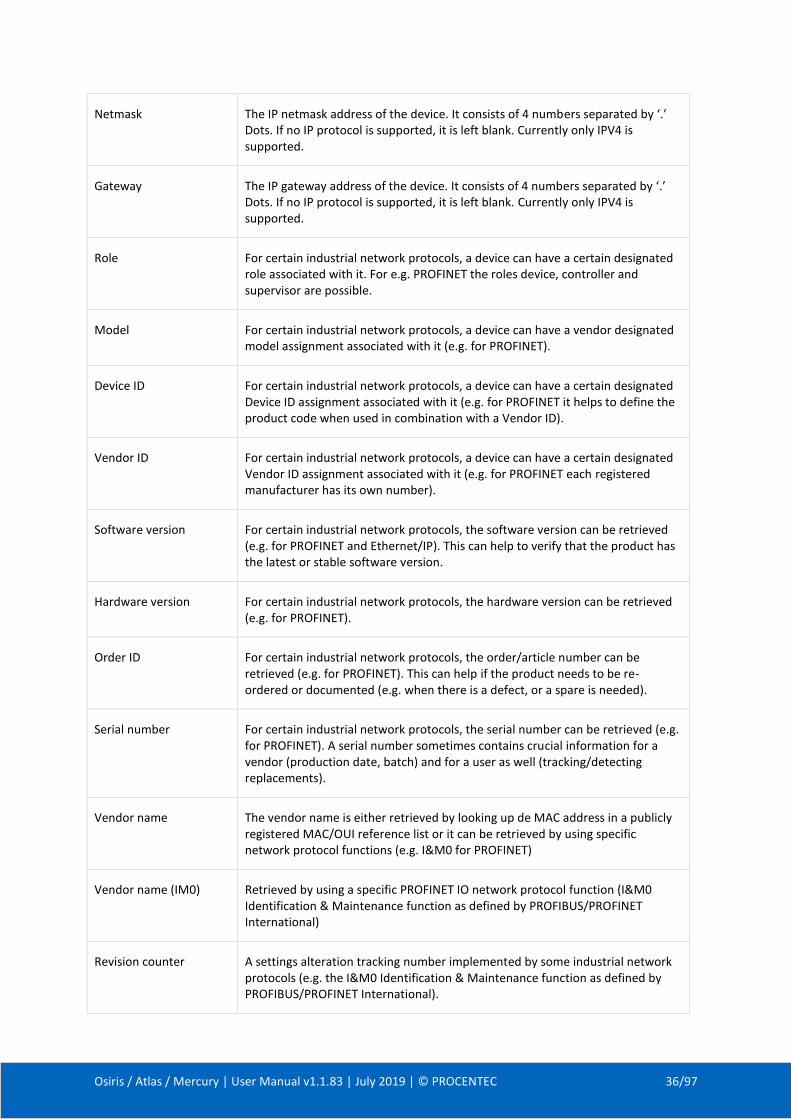
Netmask The IP netmask address of the device. It consists of 4 numbers separated by ‘.’ Dots. If no IP protocol is supported, it is left blank. Currently only IPV4 is supported.
Gateway The IP gateway address of the device. It consists of 4 numbers separated by ‘.’ Dots. If no IP protocol is supported, it is left blank. Currently only IPV4 is supported.
Role For certain industrial network protocols, a device can have a certain designated role associated with it. For e.g. PROFINET the roles device, controller and supervisor are possible.
Model For certain industrial network protocols, a device can have a vendor designated model assignment associated with it (e.g. for PROFINET).
Device ID For certain industrial network protocols, a device can have a certain designated Device ID assignment associated with it (e.g. for PROFINET it helps to define the product code when used in combination with a Vendor ID).
Vendor ID For certain industrial network protocols, a device can have a certain designated Vendor ID assignment associated with it (e.g. for PROFINET each registered manufacturer has its own number).
Software version For certain industrial network protocols, the software version can be retrieved (e.g. for PROFINET and Ethernet/IP). This can help to verify that the product has the latest or stable software version.
Hardware version For certain industrial network protocols, the hardware version can be retrieved (e.g. for PROFINET).
Order ID For certain industrial network protocols, the order/article number can be retrieved (e.g. for PROFINET). This can help if the product needs to be re-ordered or documented (e.g. when there is a defect, or a spare is needed).
Serial number For certain industrial network protocols, the serial number can be retrieved (e.g. for PROFINET). A serial number sometimes contains crucial information for a vendor (production date, batch) and for a user as well (tracking/detecting replacements).
Vendor name The vendor name is either retrieved by looking up de MAC address in a publicly registered MAC/OUI reference list or it can be retrieved by using specific network protocol functions (e.g. I&M0 for PROFINET)
Vendor name (IM0) Retrieved by using a specific PROFINET IO network protocol function (I&M0 Identification & Maintenance function as defined by PROFIBUS/PROFINET International)
Revision counter A settings alteration tracking number implemented by some industrial network protocols (e.g. the I&M0 Identification & Maintenance function as defined by PROFIBUS/PROFINET International).
Osiris / Atlas / Mercury | User Manual v1.1.83 | July 2019 | © PROCENTEC 37/97
Ethernet/IP Profile Describes the type of Ethernet/IP device
Note: Some devices report an incorrect link speed (e.g. 10 Mbps instead of 100 Mbps). Since the link speed is used to calculate the load, the reported load can be incorrect. If the reported load is very high, check the link speed in the topology overview.
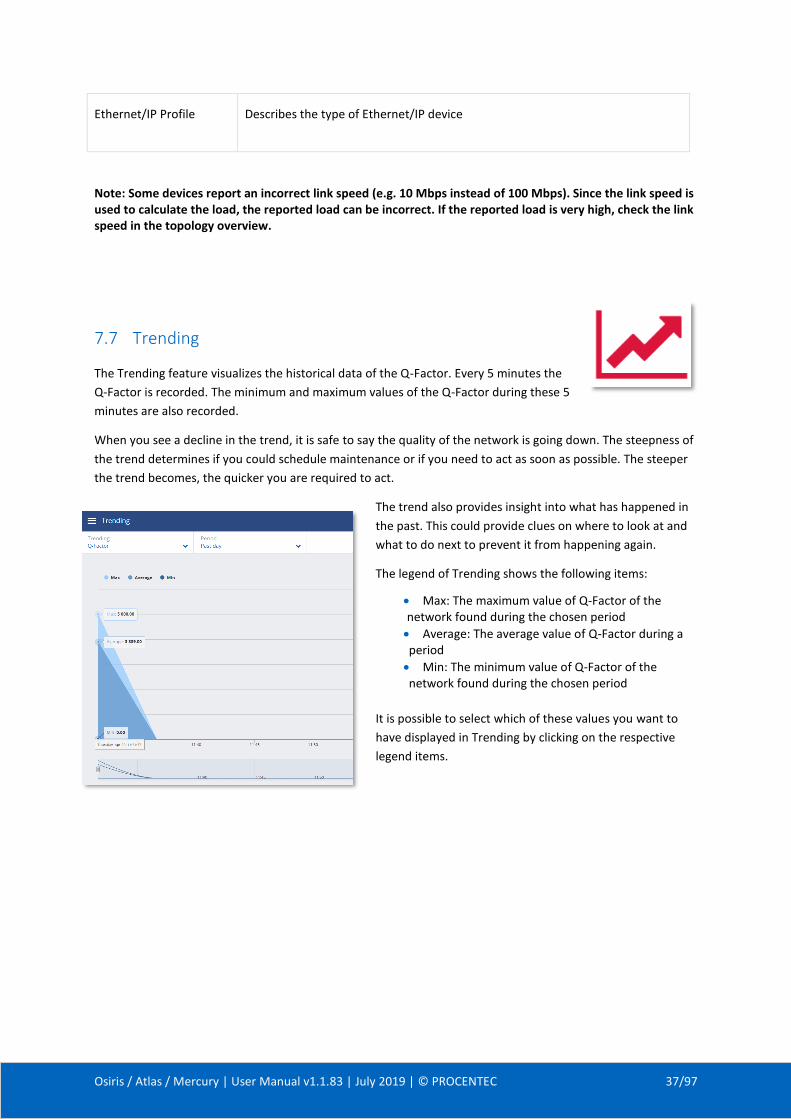
7.7 Trending
The Trending feature visualizes the historical data of the Q-Factor. Every 5 minutes the
Q-Factor is recorded. The minimum and maximum values of the Q-Factor during these 5
minutes are also recorded.
When you see a decline in the trend, it is safe to say the quality of the network is going down. The steepness of
the trend determines if you could schedule maintenance or if you need to act as soon as possible. The steeper
the trend becomes, the quicker you are required to act.
The trend also provides insight into what has happened in
the past. This could provide clues on where to look at and
what to do next to prevent it from happening again.
The legend of Trending shows the following items:
• Max: The maximum value of Q-Factor of the network found during the chosen period
• Average: The average value of Q-Factor during a period
• Min: The minimum value of Q-Factor of the network found during the chosen period
It is possible to select which of these values you want to
have displayed in Trending by clicking on the respective
legend items.
Osiris / Atlas / Mercury | User Manual v1.1.83 | July 2019 | © PROCENTEC 38/97
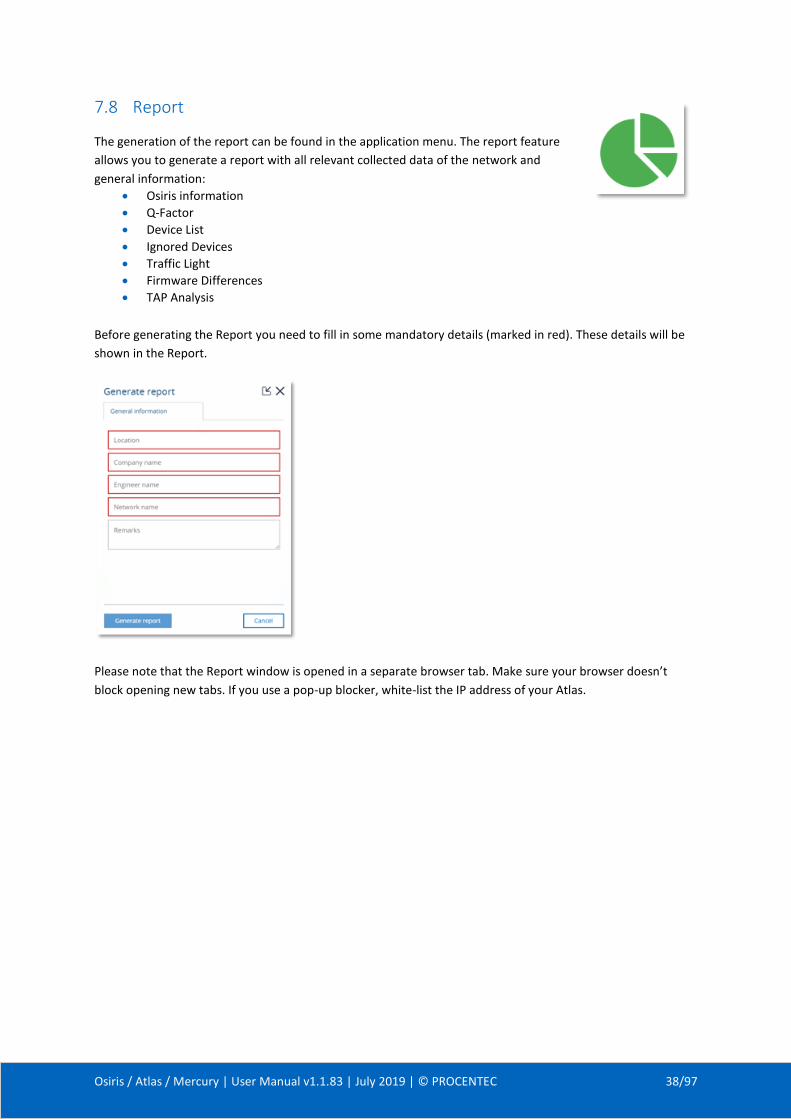
7.8 Report
The generation of the report can be found in the application menu. The report feature
allows you to generate a report with all relevant collected data of the network and
general information:
• Osiris information
• Q-Factor
• Device List
• Ignored Devices
• Traffic Light
• Firmware Differences
• TAP Analysis
Before generating the Report you need to fill in some mandatory details (marked in red). These details will be
shown in the Report.
Please note that the Report window is opened in a separate browser tab. Make sure your browser doesn’t
block opening new tabs. If you use a pop-up blocker, white-list the IP address of your Atlas.
Osiris / Atlas / Mercury | User Manual v1.1.83 | July 2019 | © PROCENTEC 39/97
7.9 OPC UA
OPC UA has been selected as the foundation of Industry 4.0 and it
allows for integration with SCADA systems.
The OPC UA server functionality is switched off by default.
On the OPC UA page you will see the address you can use to connect from a client to Osiris and the ability to
start the server. Once the OPC UA server is started the button will change into ‘Stop server’. This means the
OPC UA server is active.
When a connection has been established, the following information can be discovered:
• Device information
• Traffic Light – entire network
• Q-Factor – entire network
• Measurement Status Warning: this connection is currently not encrypted.
7.10 E-mail Notifications
The E-mail Notifications tile is a shortcut to the Email settings.
See paragraph 11.7 for more information.
7.11 IXON VPN service (Atlas only)
A VPN (Virtual Private Network) service makes it possible to connect to a system or
network with a secure connection, remotely. As long as both devices are connected to
the internet they can securely communicate over the VPN.
PROCENTEC has a partnership with IXON, a secure VPN services provider. You can
benefit of the integration of IXON VPN in PROCENTEC products. Currently this service is
limited to Atlas only.
Atlas is equipped with IXON VPN Service. This makes it possible to view and use the Atlas web interface from
outside the company network. Every function you are used to use in the local network also works via the
remote connection of the VPN. A dedicated tile is present by default on the dashboard of Osiris in order to
access VPN functionality.
To make the VPN Service available make sure you have:
• An Atlas with firmware 1.1.70 or higher
• An internet connection
• An IXON Cloud account (a one-time fee for each Atlas applies)
You can register a new IXON Cloud account on https://connect.ixon.cloud/.
Osiris / Atlas / Mercury | User Manual v1.1.83 | July 2019 | © PROCENTEC 40/97
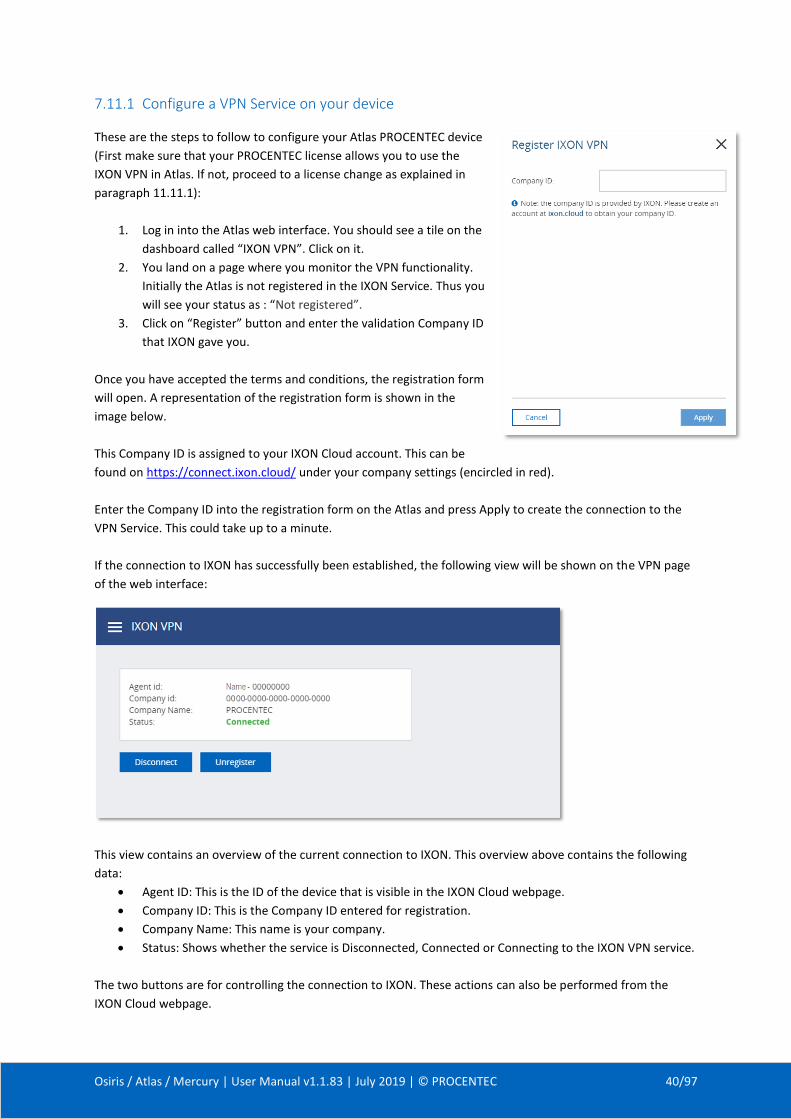
7.11.1 Configure a VPN Service on your device
These are the steps to follow to configure your Atlas PROCENTEC device
(First make sure that your PROCENTEC license allows you to use the
IXON VPN in Atlas. If not, proceed to a license change as explained in
paragraph 11.11.1):
1. Log in into the Atlas web interface. You should see a tile on the
dashboard called “IXON VPN”. Click on it.
2. You land on a page where you monitor the VPN functionality.
Initially the Atlas is not registered in the IXON Service. Thus you
will see your status as : “Not registered”.
3. Click on “Register” button and enter the validation Company ID
that IXON gave you.
Once you have accepted the terms and conditions, the registration form
will open. A representation of the registration form is shown in the
image below.
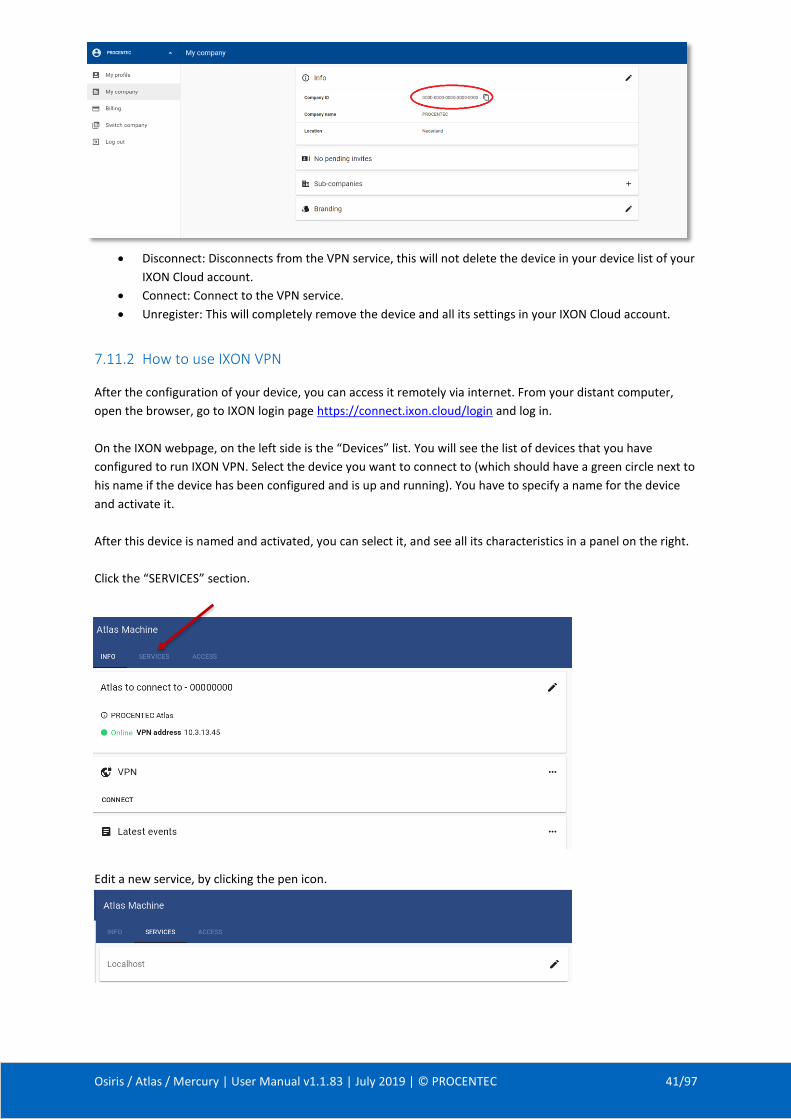
This Company ID is assigned to your IXON Cloud account. This can be
found on https://connect.ixon.cloud/ under your company settings (encircled in red).
Enter the Company ID into the registration form on the Atlas and press Apply to create the connection to the
VPN Service. This could take up to a minute.
If the connection to IXON has successfully been established, the following view will be shown on the VPN page
of the web interface:
This view contains an overview of the current connection to IXON. This overview above contains the following
data:
• Agent ID: This is the ID of the device that is visible in the IXON Cloud webpage.
• Company ID: This is the Company ID entered for registration.
• Company Name: This name is your company.
• Status: Shows whether the service is Disconnected, Connected or Connecting to the IXON VPN service.
The two buttons are for controlling the connection to IXON. These actions can also be performed from the
IXON Cloud webpage.
Osiris / Atlas / Mercury | User Manual v1.1.83 | July 2019 | © PROCENTEC 41/97
• Disconnect: Disconnects from the VPN service, this will not delete the device in your device list of your
IXON Cloud account.
• Connect: Connect to the VPN service.
• Unregister: This will completely remove the device and all its settings in your IXON Cloud account.
7.11.2 How to use IXON VPN
After the configuration of your device, you can access it remotely via internet. From your distant computer,
open the browser, go to IXON login page https://connect.ixon.cloud/login and log in.
On the IXON webpage, on the left side is the “Devices” list. You will see the list of devices that you have
configured to run IXON VPN. Select the device you want to connect to (which should have a green circle next to
his name if the device has been configured and is up and running). You have to specify a name for the device
and activate it.
After this device is named and activated, you can select it, and see all its characteristics in a panel on the right.
Click the “SERVICES” section.
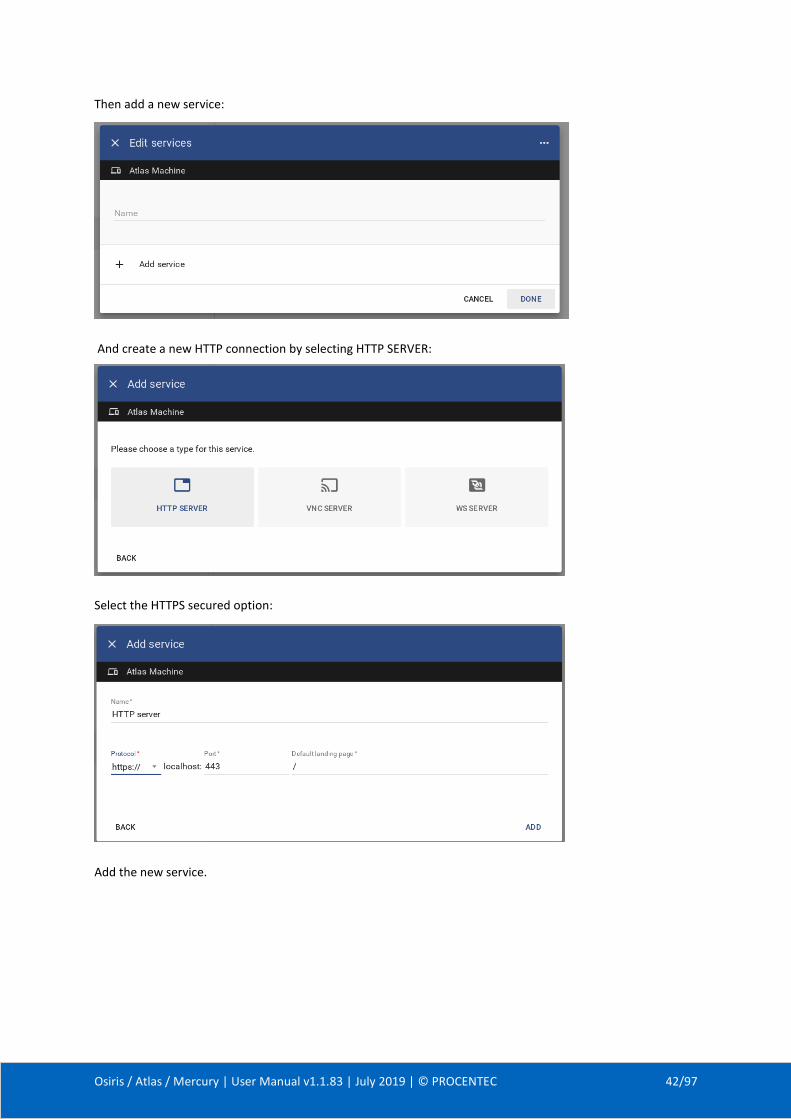
Edit a new service, by clicking the pen icon.
Osiris / Atlas / Mercury | User Manual v1.1.83 | July 2019 | © PROCENTEC 42/97
Then add a new service:
And create a new HTTP connection by selecting HTTP SERVER:
Select the HTTPS secured option:
Add the new service.
Osiris / Atlas / Mercury | User Manual v1.1.83 | July 2019 | © PROCENTEC 43/97
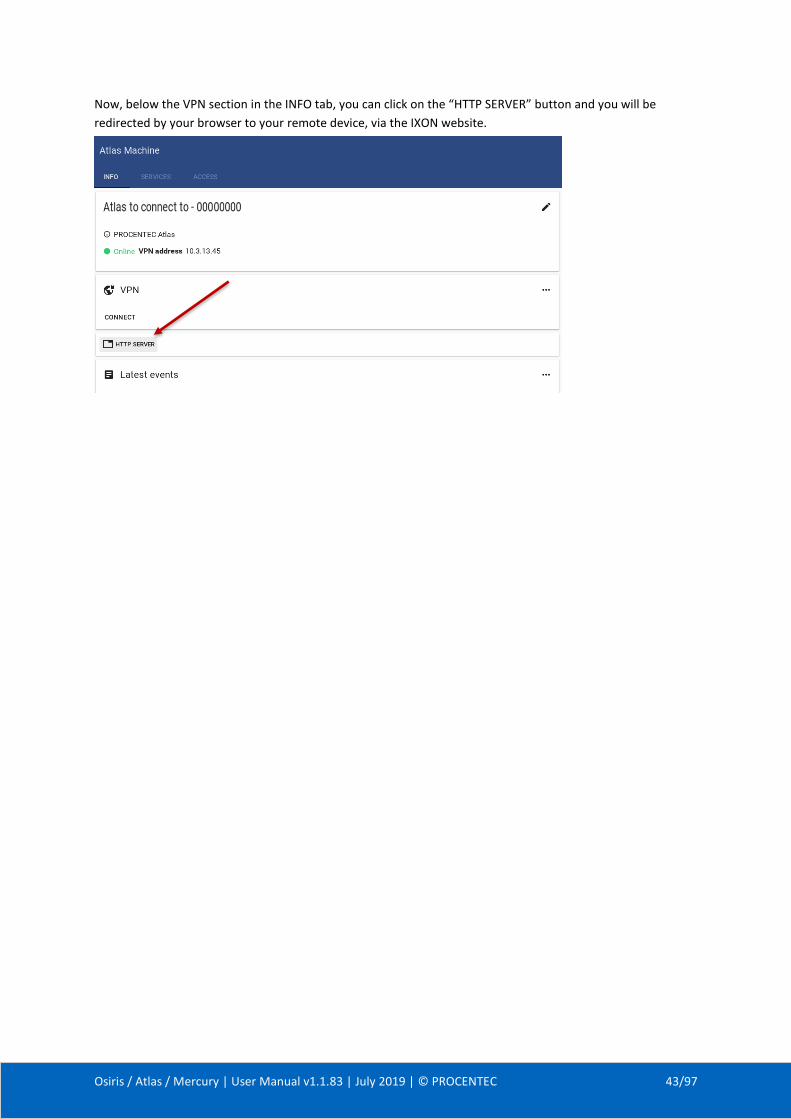
Now, below the VPN section in the INFO tab, you can click on the “HTTP SERVER” button and you will be
redirected by your browser to your remote device, via the IXON website.

Osiris / Atlas / Mercury | User Manual v1.1.83 | July 2019 | © PROCENTEC 44/97
8. Commissioning Wizard
The PROCENTEC Commissioning Wizard is a series of automated checks to see if the network is in compliance
with the guidelines of the used protocol. The checks are according to the Commissioning Guidelines of the
respective protocol.
Each item can be confirmed as successful or it can be declined after the checks have been performed. When
the wizard has finished, an optional report can be generated.
8.1.1 Starting the Commissioning Wizard
Make sure a measurement is already running before starting the Commissioning Wizard; the wizard cannot run
without a measurement. Also make sure to have a valid license for Commissioning.
When starting the Wizard, you need to select the protocol that you wish to run the Commissioning Wizard on,
and also a mode. Two modes can be selected, Quickscan and Commissioning. These modes are described in the
paragraphs below.
8.1.2 Quickscan
Quickscan will perform only automatic checks. No user interaction is required. Performed checks:
• Check for double IP addresses
• Discarded messages check
• PROFINET device name check
• DCP broadcasts check
• Firmware differences between devices of the same type
• ARP broadcasts check
• Network load check
8.1.3 Commissioning
Checks the network without the need for an EtherTAP. It will perform all the check of the Quickscan and will
also perform a:
• Topology check
• Device details check
• Device count
At the end of the wizard you can press ‘Generate Report’ to create an automated report of all checked items. This is an HTML based report and can be directly printed from the browser or exported to PDF (you need to install a PDF generator first). You can also save as an HTML page. This Report also contains a section called ‘Visual Inspection’ with items that can be manually filled in later.
Osiris / Atlas / Mercury | User Manual v1.1.83 | July 2019 | © PROCENTEC 45/97
9. EtherTAP
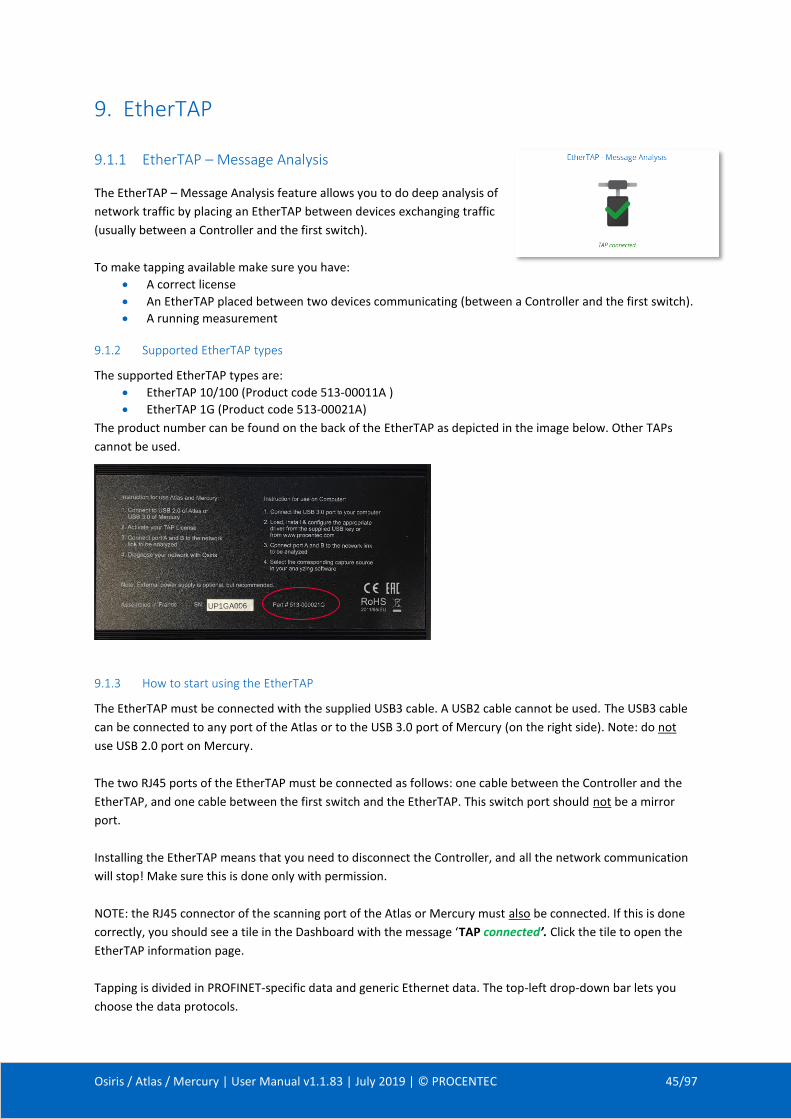
9.1.1 EtherTAP – Message Analysis
The EtherTAP – Message Analysis feature allows you to do deep analysis of
network traffic by placing an EtherTAP between devices exchanging traffic
(usually between a Controller and the first switch).
To make tapping available make sure you have:
• A correct license
• An EtherTAP placed between two devices communicating (between a Controller and the first switch).
• A running measurement
9.1.2 Supported EtherTAP types
The supported EtherTAP types are:
• EtherTAP 10/100 (Product code 513-00011A )
• EtherTAP 1G (Product code 513-00021A)
The product number can be found on the back of the EtherTAP as depicted in the image below. Other TAPs
cannot be used.
9.1.3 How to start using the EtherTAP
The EtherTAP must be connected with the supplied USB3 cable. A USB2 cable cannot be used. The USB3 cable
can be connected to any port of the Atlas or to the USB 3.0 port of Mercury (on the right side). Note: do not
use USB 2.0 port on Mercury.
The two RJ45 ports of the EtherTAP must be connected as follows: one cable between the Controller and the
EtherTAP, and one cable between the first switch and the EtherTAP. This switch port should not be a mirror
port.
Installing the EtherTAP means that you need to disconnect the Controller, and all the network communication
will stop! Make sure this is done only with permission.
NOTE: the RJ45 connector of the scanning port of the Atlas or Mercury must also be connected. If this is done
correctly, you should see a tile in the Dashboard with the message ‘TAP connected’. Click the tile to open the
EtherTAP information page.
Tapping is divided in PROFINET-specific data and generic Ethernet data. The top-left drop-down bar lets you
choose the data protocols.
Osiris / Atlas / Mercury | User Manual v1.1.83 | July 2019 | © PROCENTEC 46/97
9.2 PROFINET analysis
9.2.1 Network overview and device details
The Tapping for PROFINET requires a specific license.
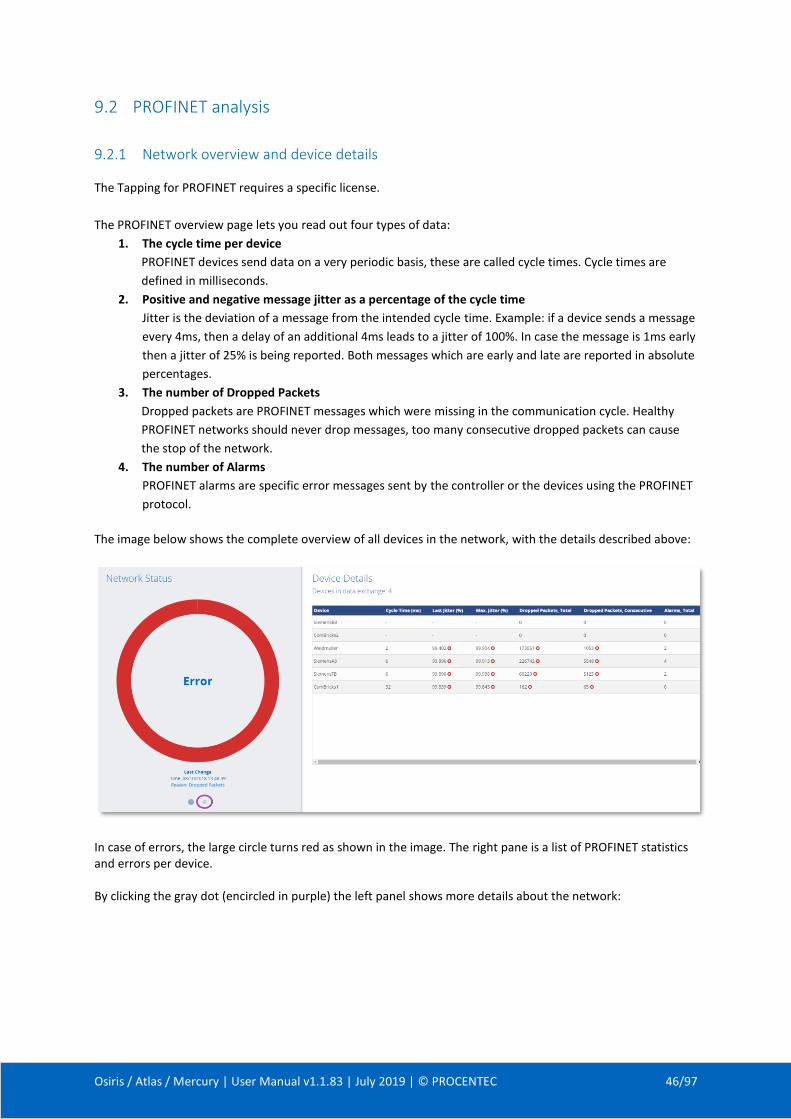
The PROFINET overview page lets you read out four types of data:
1. The cycle time per device
PROFINET devices send data on a very periodic basis, these are called cycle times. Cycle times are
defined in milliseconds.
2. Positive and negative message jitter as a percentage of the cycle time
Jitter is the deviation of a message from the intended cycle time. Example: if a device sends a message
every 4ms, then a delay of an additional 4ms leads to a jitter of 100%. In case the message is 1ms early
then a jitter of 25% is being reported. Both messages which are early and late are reported in absolute
percentages.
3. The number of Dropped Packets
Dropped packets are PROFINET messages which were missing in the communication cycle. Healthy
PROFINET networks should never drop messages, too many consecutive dropped packets can cause
the stop of the network.
4. The number of Alarms
PROFINET alarms are specific error messages sent by the controller or the devices using the PROFINET
protocol.
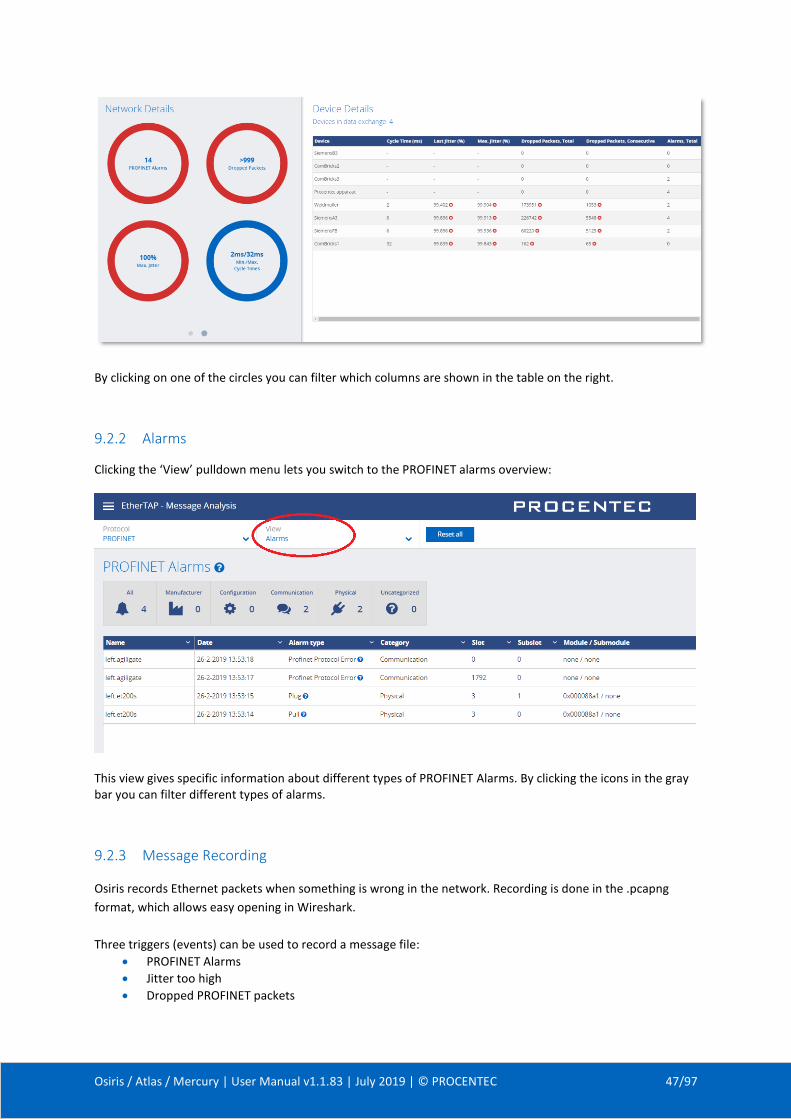
The image below shows the complete overview of all devices in the network, with the details described above:
In case of errors, the large circle turns red as shown in the image. The right pane is a list of PROFINET statistics and errors per device. By clicking the gray dot (encircled in purple) the left panel shows more details about the network:
Osiris / Atlas / Mercury | User Manual v1.1.83 | July 2019 | © PROCENTEC 47/97
By clicking on one of the circles you can filter which columns are shown in the table on the right.
9.2.2 Alarms
Clicking the ‘View’ pulldown menu lets you switch to the PROFINET alarms overview:
This view gives specific information about different types of PROFINET Alarms. By clicking the icons in the gray bar you can filter different types of alarms.
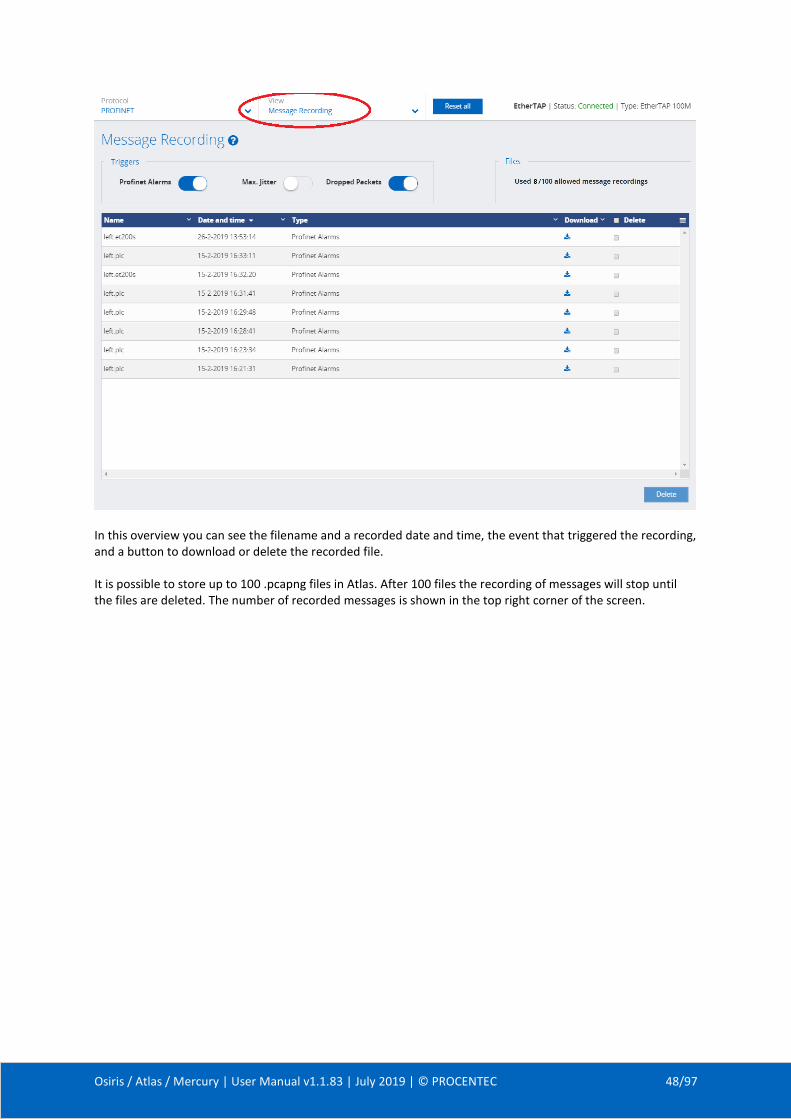
9.2.3 Message Recording
Osiris records Ethernet packets when something is wrong in the network. Recording is done in the .pcapng
format, which allows easy opening in Wireshark.
Three triggers (events) can be used to record a message file:
• PROFINET Alarms
• Jitter too high
• Dropped PROFINET packets
Osiris / Atlas / Mercury | User Manual v1.1.83 | July 2019 | © PROCENTEC 48/97
In this overview you can see the filename and a recorded date and time, the event that triggered the recording, and a button to download or delete the recorded file. It is possible to store up to 100 .pcapng files in Atlas. After 100 files the recording of messages will stop until the files are deleted. The number of recorded messages is shown in the top right corner of the screen.

Osiris / Atlas / Mercury | User Manual v1.1.83 | July 2019 | © PROCENTEC 49/97
9.3 Ethernet analysis
9.3.1 Overview
Select ‘Ethernet’ as the protocol in the
top-left drop-down bar to view the
Ethernet statistics.
These statistics are collected by the
EtherTAP of the link it is currently
monitoring.
Here is possible to analyze the amount of
Network load and communication errors
happening on the Ethernet link with the
timestamp of the last change.
The EtherTAP has a Port A and Port B,
which are separately listed, each with their
individual statistics.
Click the blue Question Mark ‘?’ sign for
detailed information about the shown
statistics.
9.3.2 Trending
The information displayed in the previous chapter can also be displayed in a trending graph. This makes it clear
to see when problems occurred, or when load was abnormally high or low.
The Min, Max and average load can be enabled for each port. Trending is keeping in memory the last 2h of communication, and a new sample is added every second. For detailed information please refer to the Delphi Help, by clicking on the question mark ‘?’ sign.
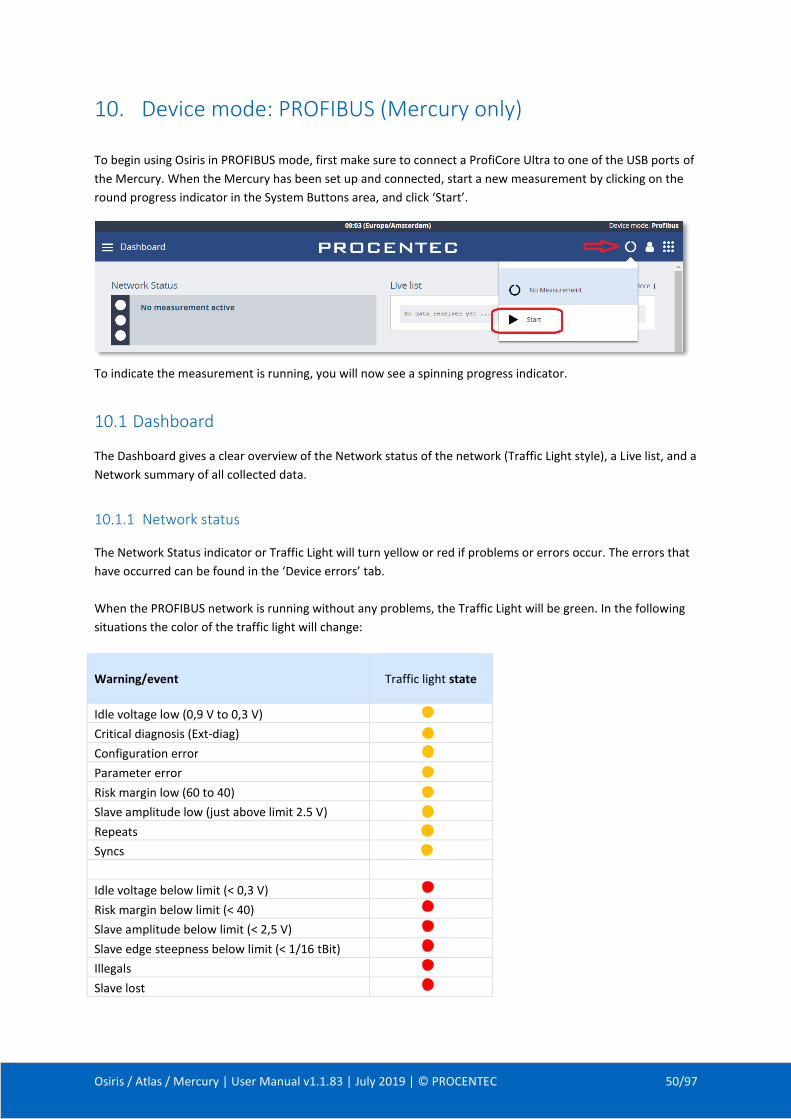
Osiris / Atlas / Mercury | User Manual v1.1.83 | July 2019 | © PROCENTEC 50/97
10. Device mode: PROFIBUS (Mercury only)
To begin using Osiris in PROFIBUS mode, first make sure to connect a ProfiCore Ultra to one of the USB ports of
the Mercury. When the Mercury has been set up and connected, start a new measurement by clicking on the
round progress indicator in the System Buttons area, and click ‘Start’.
To indicate the measurement is running, you will now see a spinning progress indicator.
10.1 Dashboard
The Dashboard gives a clear overview of the Network status of the network (Traffic Light style), a Live list, and a
Network summary of all collected data.
10.1.1 Network status
The Network Status indicator or Traffic Light will turn yellow or red if problems or errors occur. The errors that
have occurred can be found in the ‘Device errors’ tab.
When the PROFIBUS network is running without any problems, the Traffic Light will be green. In the following
situations the color of the traffic light will change:
Warning/event
Traffic light state
Idle voltage low (0,9 V to 0,3 V)
Critical diagnosis (Ext-diag)
Configuration error
Parameter error
Risk margin low (60 to 40)
Slave amplitude low (just above limit 2.5 V)
Repeats
Syncs
Idle voltage below limit (< 0,3 V)
Risk margin below limit (< 40)
Slave amplitude below limit (< 2,5 V)
Slave edge steepness below limit (< 1/16 tBit)
Illegals
Slave lost
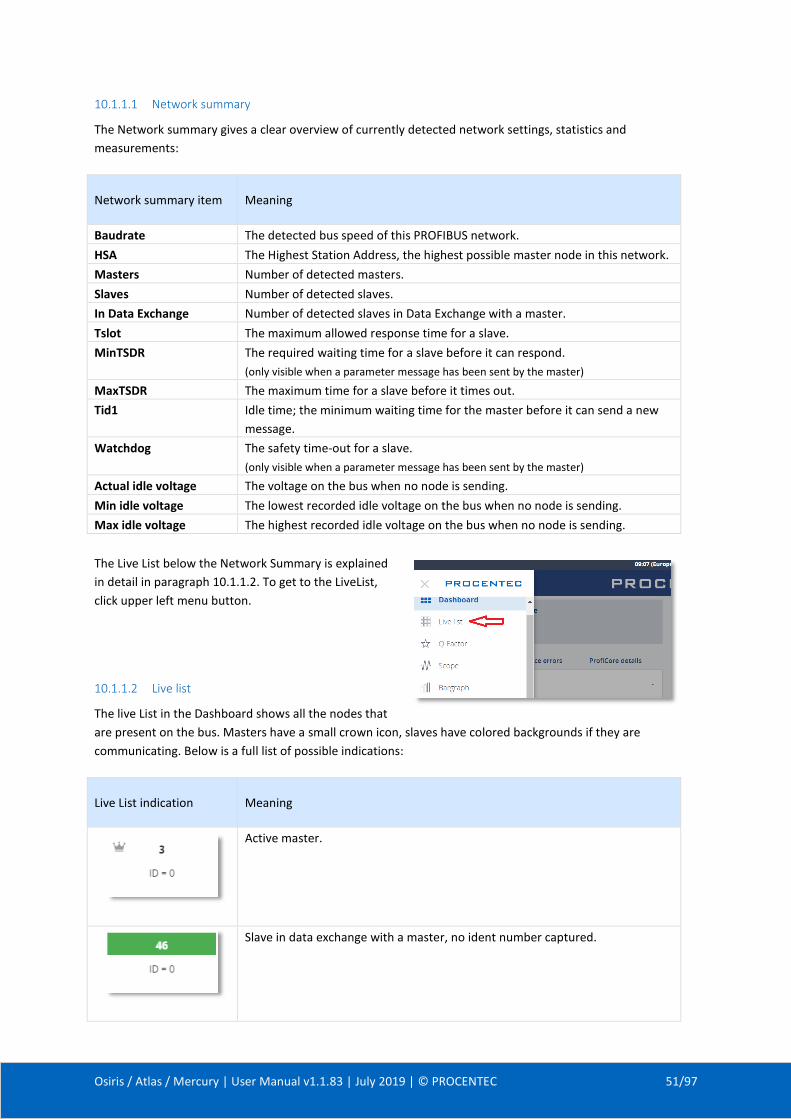
Osiris / Atlas / Mercury | User Manual v1.1.83 | July 2019 | © PROCENTEC 51/97
10.1.1.1 Network summary
The Network summary gives a clear overview of currently detected network settings, statistics and
measurements:
Network summary item
Meaning
Baudrate The detected bus speed of this PROFIBUS network.
HSA The Highest Station Address, the highest possible master node in this network.
Masters Number of detected masters.
Slaves Number of detected slaves.
In Data Exchange Number of detected slaves in Data Exchange with a master.
Tslot The maximum allowed response time for a slave.
MinTSDR The required waiting time for a slave before it can respond.
(only visible when a parameter message has been sent by the master)
MaxTSDR The maximum time for a slave before it times out.
Tid1 Idle time; the minimum waiting time for the master before it can send a new
message.
Watchdog The safety time-out for a slave.
(only visible when a parameter message has been sent by the master)
Actual idle voltage The voltage on the bus when no node is sending.
Min idle voltage The lowest recorded idle voltage on the bus when no node is sending.
Max idle voltage The highest recorded idle voltage on the bus when no node is sending.
The Live List below the Network Summary is explained
in detail in paragraph 10.1.1.2. To get to the LiveList,
click upper left menu button.
10.1.1.2 Live list
The live List in the Dashboard shows all the nodes that
are present on the bus. Masters have a small crown icon, slaves have colored backgrounds if they are
communicating. Below is a full list of possible indications:
Live List indication
Meaning
Active master.
Slave in data exchange with a master, no ident number captured.
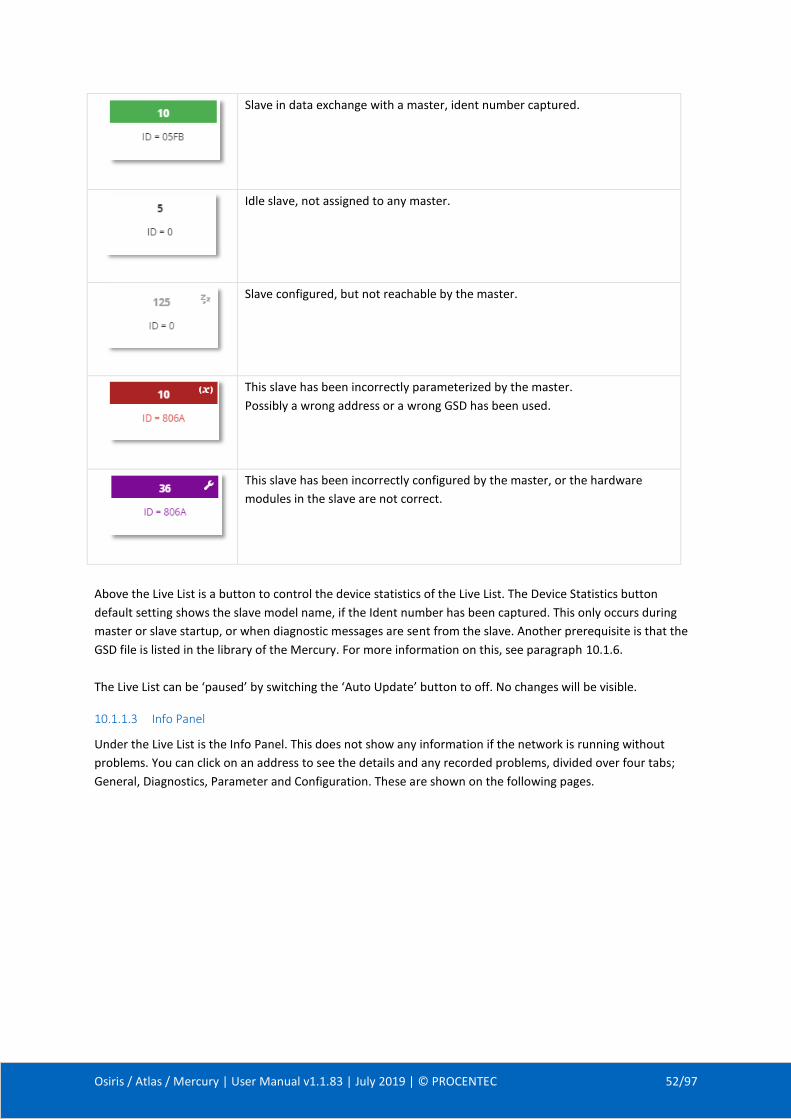
Osiris / Atlas / Mercury | User Manual v1.1.83 | July 2019 | © PROCENTEC 52/97
Slave in data exchange with a master, ident number captured.
Idle slave, not assigned to any master.
Slave configured, but not reachable by the master.
This slave has been incorrectly parameterized by the master.
Possibly a wrong address or a wrong GSD has been used.
This slave has been incorrectly configured by the master, or the hardware
modules in the slave are not correct.
Above the Live List is a button to control the device statistics of the Live List. The Device Statistics button
default setting shows the slave model name, if the Ident number has been captured. This only occurs during
master or slave startup, or when diagnostic messages are sent from the slave. Another prerequisite is that the
GSD file is listed in the library of the Mercury. For more information on this, see paragraph 10.1.6.
The Live List can be ‘paused’ by switching the ‘Auto Update’ button to off. No changes will be visible.
10.1.1.3 Info Panel
Under the Live List is the Info Panel. This does not show any information if the network is running without
problems. You can click on an address to see the details and any recorded problems, divided over four tabs;
General, Diagnostics, Parameter and Configuration. These are shown on the following pages.
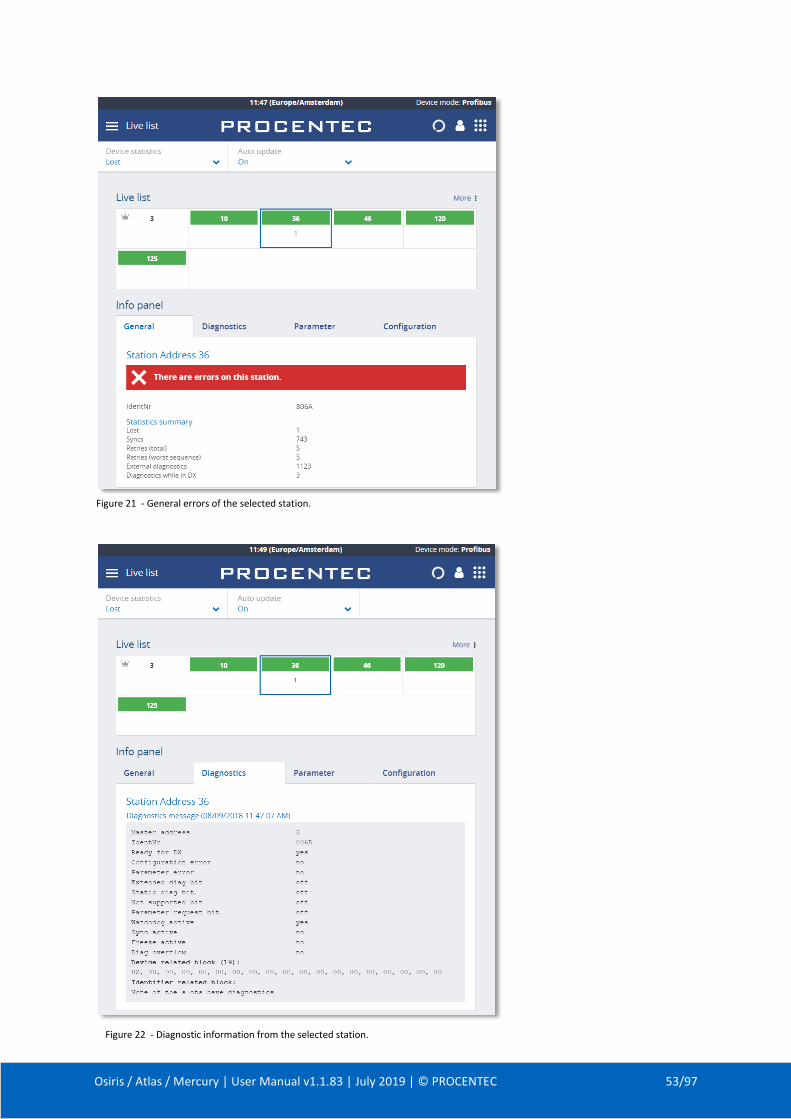
Osiris / Atlas / Mercury | User Manual v1.1.83 | July 2019 | © PROCENTEC 53/97
Figure 21 - General errors of the selected station.
Figure 22 - Diagnostic information from the selected station.
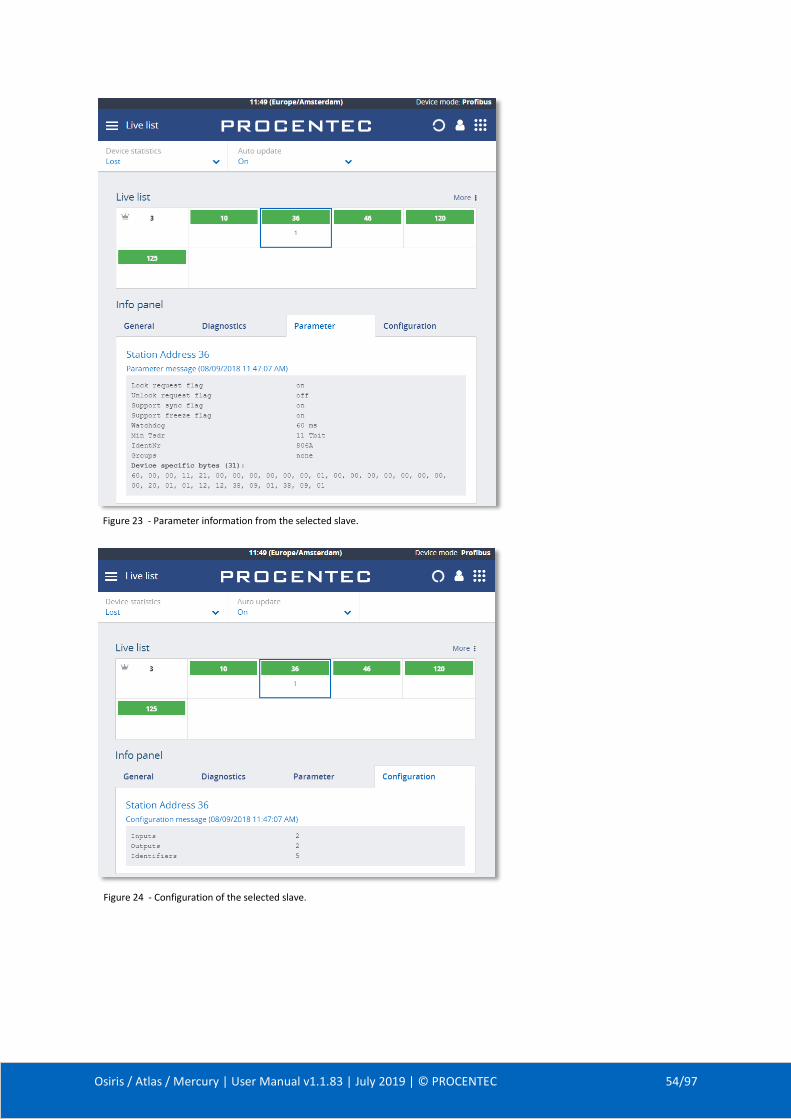
Osiris / Atlas / Mercury | User Manual v1.1.83 | July 2019 | © PROCENTEC 54/97
Figure 23 - Parameter information from the selected slave.
Figure 24 - Configuration of the selected slave.
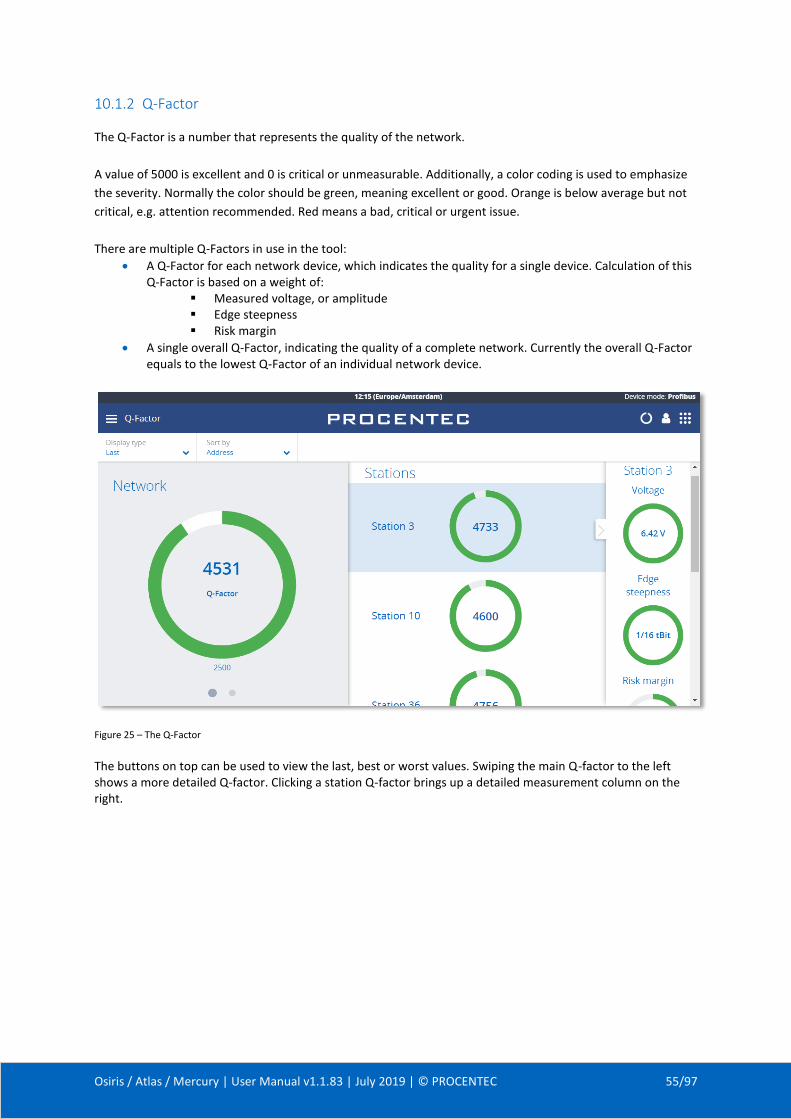
Osiris / Atlas / Mercury | User Manual v1.1.83 | July 2019 | © PROCENTEC 55/97
10.1.2 Q-Factor
The Q-Factor is a number that represents the quality of the network.
A value of 5000 is excellent and 0 is critical or unmeasurable. Additionally, a color coding is used to emphasize
the severity. Normally the color should be green, meaning excellent or good. Orange is below average but not
critical, e.g. attention recommended. Red means a bad, critical or urgent issue.
There are multiple Q-Factors in use in the tool:
• A Q-Factor for each network device, which indicates the quality for a single device. Calculation of this Q-Factor is based on a weight of:
Measured voltage, or amplitude Edge steepness Risk margin
• A single overall Q-Factor, indicating the quality of a complete network. Currently the overall Q-Factor equals to the lowest Q-Factor of an individual network device.
The buttons on top can be used to view the last, best or worst values. Swiping the main Q-factor to the left shows a more detailed Q-factor. Clicking a station Q-factor brings up a detailed measurement column on the right.
Figure 25 – The Q-Factor
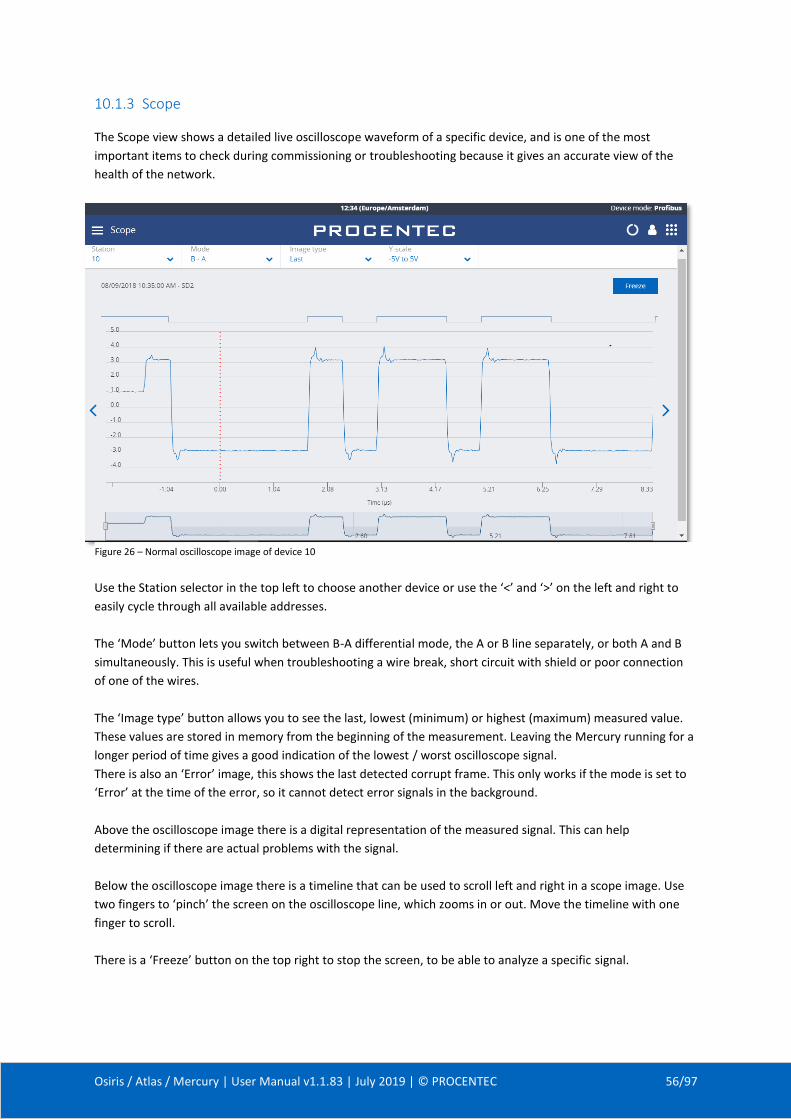
Osiris / Atlas / Mercury | User Manual v1.1.83 | July 2019 | © PROCENTEC 56/97
10.1.3 Scope
The Scope view shows a detailed live oscilloscope waveform of a specific device, and is one of the most
important items to check during commissioning or troubleshooting because it gives an accurate view of the
health of the network.
Use the Station selector in the top left to choose another device or use the ‘<’ and ‘>’ on the left and right to
easily cycle through all available addresses.
The ‘Mode’ button lets you switch between B-A differential mode, the A or B line separately, or both A and B
simultaneously. This is useful when troubleshooting a wire break, short circuit with shield or poor connection
of one of the wires.
The ‘Image type’ button allows you to see the last, lowest (minimum) or highest (maximum) measured value.
These values are stored in memory from the beginning of the measurement. Leaving the Mercury running for a
longer period of time gives a good indication of the lowest / worst oscilloscope signal.
There is also an ‘Error’ image, this shows the last detected corrupt frame. This only works if the mode is set to
‘Error’ at the time of the error, so it cannot detect error signals in the background.
Above the oscilloscope image there is a digital representation of the measured signal. This can help
determining if there are actual problems with the signal.
Below the oscilloscope image there is a timeline that can be used to scroll left and right in a scope image. Use
two fingers to ‘pinch’ the screen on the oscilloscope line, which zooms in or out. Move the timeline with one
finger to scroll.
There is a ‘Freeze’ button on the top right to stop the screen, to be able to analyze a specific signal.
Figure 26 – Normal oscilloscope image of device 10
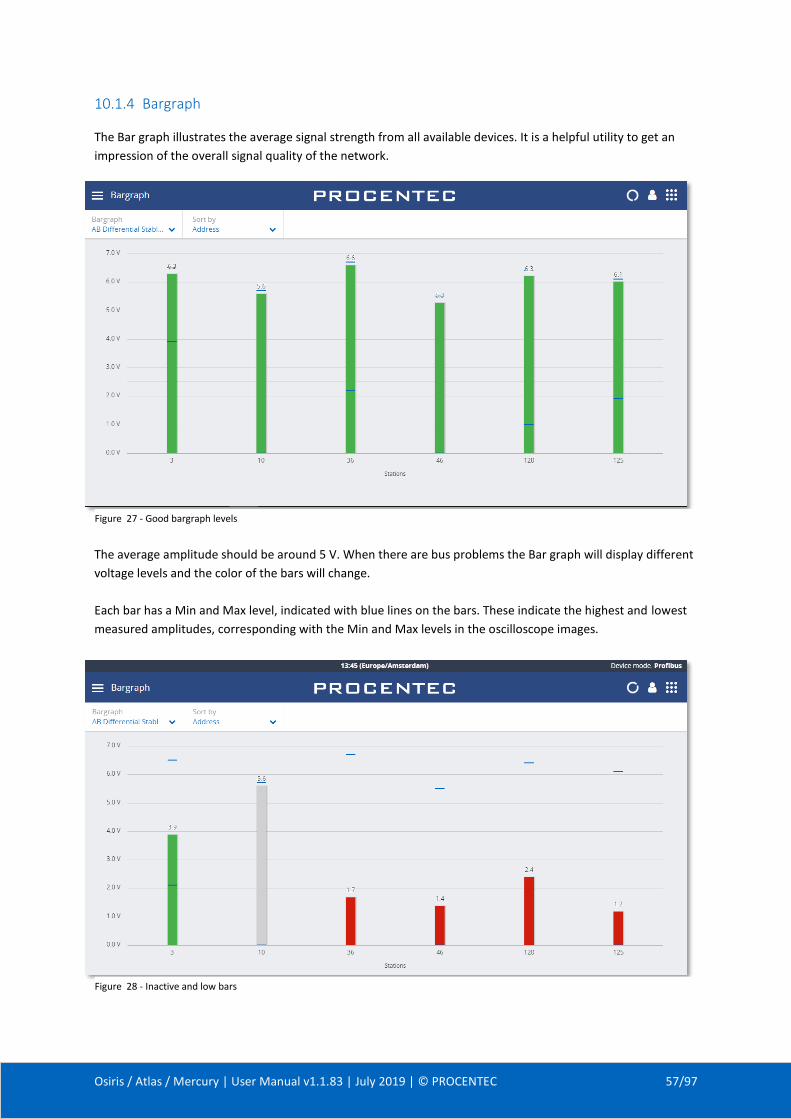
Osiris / Atlas / Mercury | User Manual v1.1.83 | July 2019 | © PROCENTEC 57/97
10.1.4 Bargraph
The Bar graph illustrates the average signal strength from all available devices. It is a helpful utility to get an
impression of the overall signal quality of the network.
The average amplitude should be around 5 V. When there are bus problems the Bar graph will display different
voltage levels and the color of the bars will change.
Each bar has a Min and Max level, indicated with blue lines on the bars. These indicate the highest and lowest
measured amplitudes, corresponding with the Min and Max levels in the oscilloscope images.
Figure 27 - Good bargraph levels
Figure 28 - Inactive and low bars
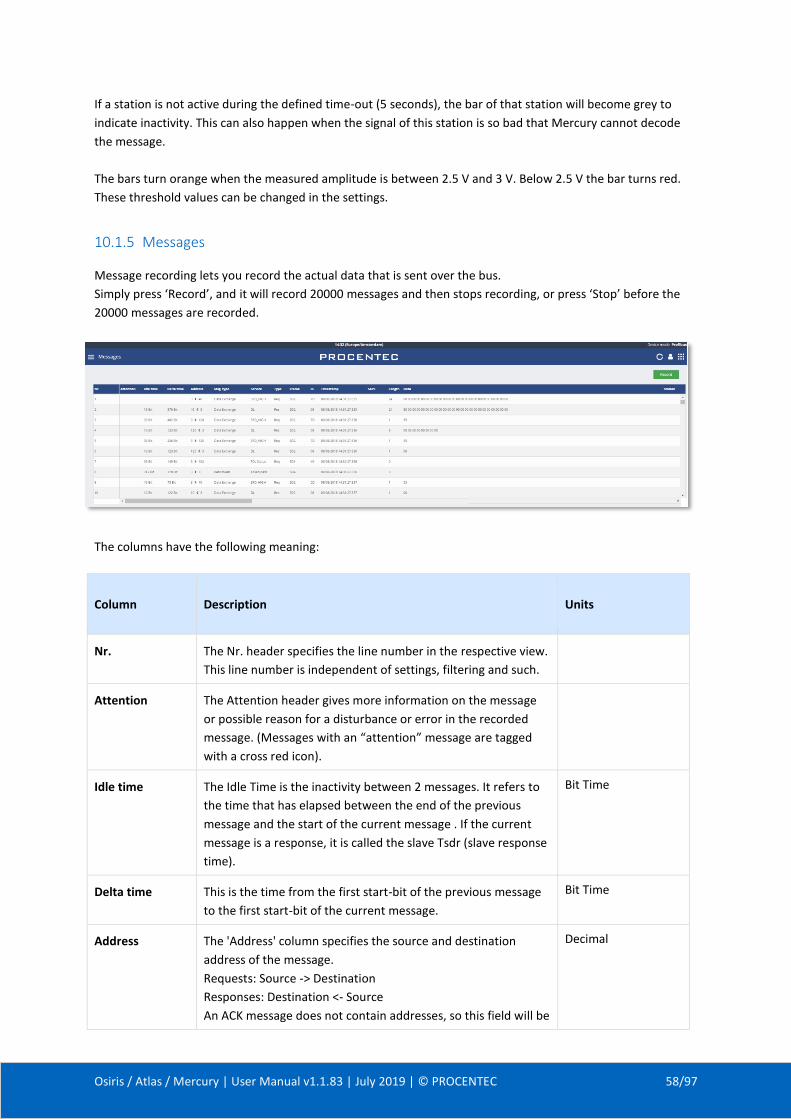
Osiris / Atlas / Mercury | User Manual v1.1.83 | July 2019 | © PROCENTEC 58/97
If a station is not active during the defined time-out (5 seconds), the bar of that station will become grey to
indicate inactivity. This can also happen when the signal of this station is so bad that Mercury cannot decode
the message.
The bars turn orange when the measured amplitude is between 2.5 V and 3 V. Below 2.5 V the bar turns red.
These threshold values can be changed in the settings.
10.1.5 Messages
Message recording lets you record the actual data that is sent over the bus.
Simply press ‘Record’, and it will record 20000 messages and then stops recording, or press ‘Stop’ before the
20000 messages are recorded.
The columns have the following meaning:
Column
Description
Units
Nr. The Nr. header specifies the line number in the respective view.
This line number is independent of settings, filtering and such.
Attention The Attention header gives more information on the message
or possible reason for a disturbance or error in the recorded
message. (Messages with an “attention” message are tagged
with a cross red icon).
Idle time The Idle Time is the inactivity between 2 messages. It refers to
the time that has elapsed between the end of the previous
message and the start of the current message . If the current
message is a response, it is called the slave Tsdr (slave response
time).
Bit Time
Delta time This is the time from the first start-bit of the previous message
to the first start-bit of the current message.
Bit Time
Address The 'Address' column specifies the source and destination
address of the message.
Requests: Source -> Destination
Responses: Destination <- Source
An ACK message does not contain addresses, so this field will be
Decimal
Osiris / Atlas / Mercury | User Manual v1.1.83 | July 2019 | © PROCENTEC 59/97
Column
Description
Units
empty.
Msg Type The Msg Type column specifies the higher level DP, DP-V1 and
DP-V2 messages.
Service The Service column specifies the type of service of a message.
The information is extracted from the FC byte when available
(only valid for SD1,SD2 or SD3 messages).
Type The Type column indicates a request or response message. • Req
• Res
Frame The 'Frame' specifies the frame type of the message. • SD1
• SD2
• SD3
• SD4
• ACK
FC Frame Control byte of the message. Hex
Timestamp The timestamp is calculated on the basis of a starting moment
the user has defined and subsequent messages add to a delta-
bittime to this beginning. This means that the timestamp
internally consists of 2 parts: the time/date and the delta-
bittimes that have passed.
SAPs The SAPs column specifies the source and destination SAP of
the message.
Requests: Source SAP -> Destination SAP
Responses: Destination SAP <- Source SAP
Decimal
Length The Length column specifies length of the user data of a
message (only valid for SD2 and SD3 messages and does not
include SAPs).
Decimal
Data The Data column contains the USER DATA or Outputs and
Inputs of messages.
Hex
Station Model name of the device. Can only be displayed if the ident
number was captured and the GSD is known (paragraph 10.1.6)
10.1.6 GSD Management
Mercury features a GSD library with all relevant information from PROFIBUS slaves, such as the device
capabilities, device name, manufacturer, version, diagnostic information and possible configurations. This
information is used in other parts of the Mercury. Press the Upload button to select a folder containing GSD files.
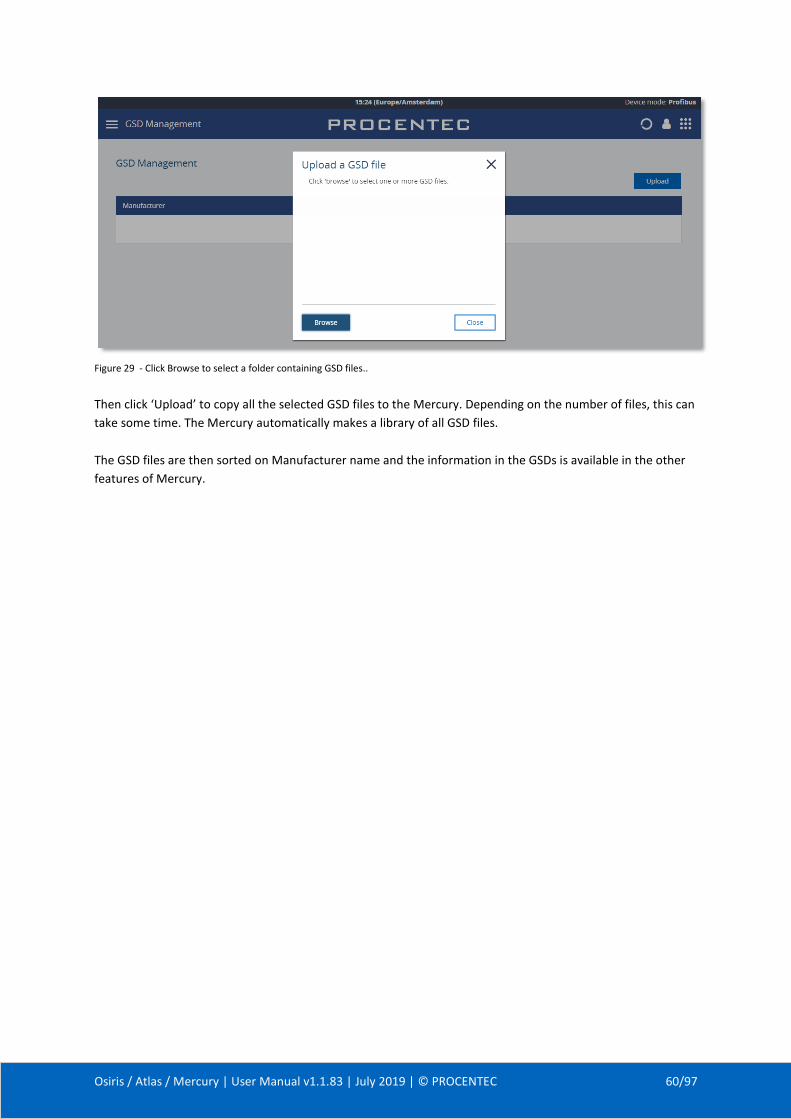
Osiris / Atlas / Mercury | User Manual v1.1.83 | July 2019 | © PROCENTEC 60/97
Figure 29 - Click Browse to select a folder containing GSD files..
Then click ‘Upload’ to copy all the selected GSD files to the Mercury. Depending on the number of files, this can
take some time. The Mercury automatically makes a library of all GSD files.
The GSD files are then sorted on Manufacturer name and the information in the GSDs is available in the other
features of Mercury.
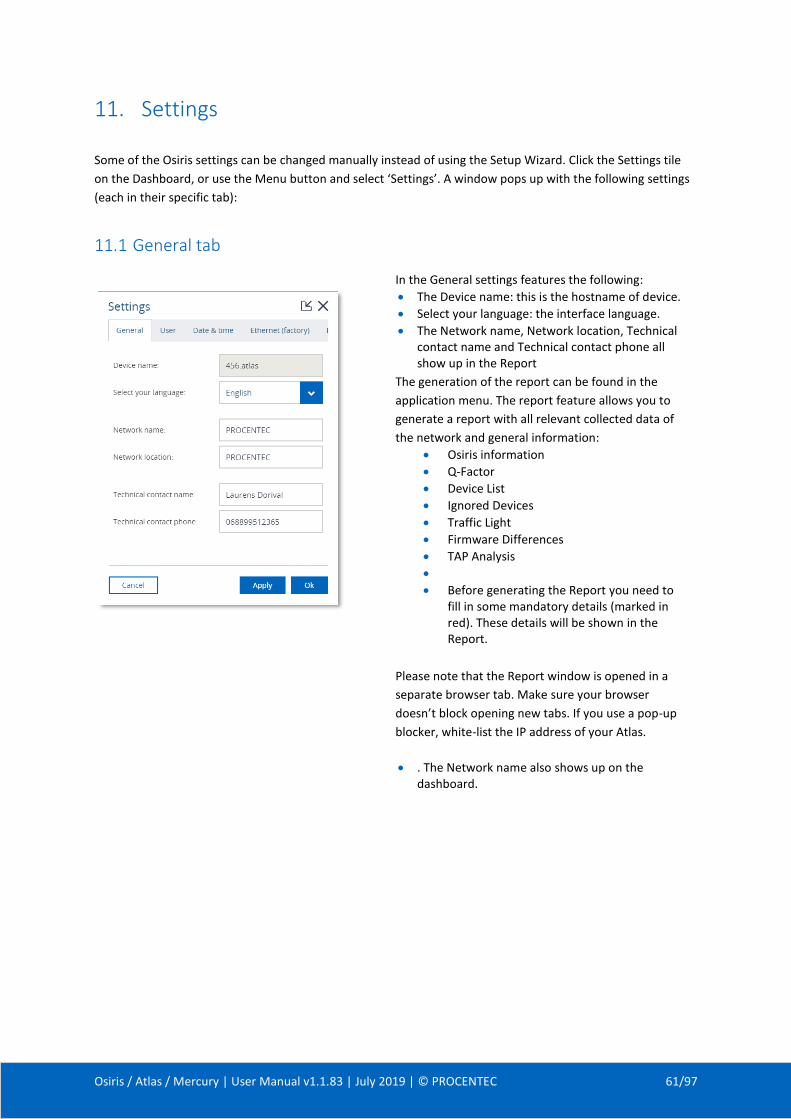
Osiris / Atlas / Mercury | User Manual v1.1.83 | July 2019 | © PROCENTEC 61/97
11. Settings
Some of the Osiris settings can be changed manually instead of using the Setup Wizard. Click the Settings tile
on the Dashboard, or use the Menu button and select ‘Settings’. A window pops up with the following settings
(each in their specific tab):
11.1 General tab
In the General settings features the following:
• The Device name: this is the hostname of device.
• Select your language: the interface language.
• The Network name, Network location, Technical contact name and Technical contact phone all show up in the Report
The generation of the report can be found in the
application menu. The report feature allows you to
generate a report with all relevant collected data of
the network and general information:
• Osiris information
• Q-Factor
• Device List
• Ignored Devices
• Traffic Light
• Firmware Differences
• TAP Analysis
•
• Before generating the Report you need to fill in some mandatory details (marked in red). These details will be shown in the Report.
Please note that the Report window is opened in a
separate browser tab. Make sure your browser
doesn’t block opening new tabs. If you use a pop-up
blocker, white-list the IP address of your Atlas.
• . The Network name also shows up on the dashboard.
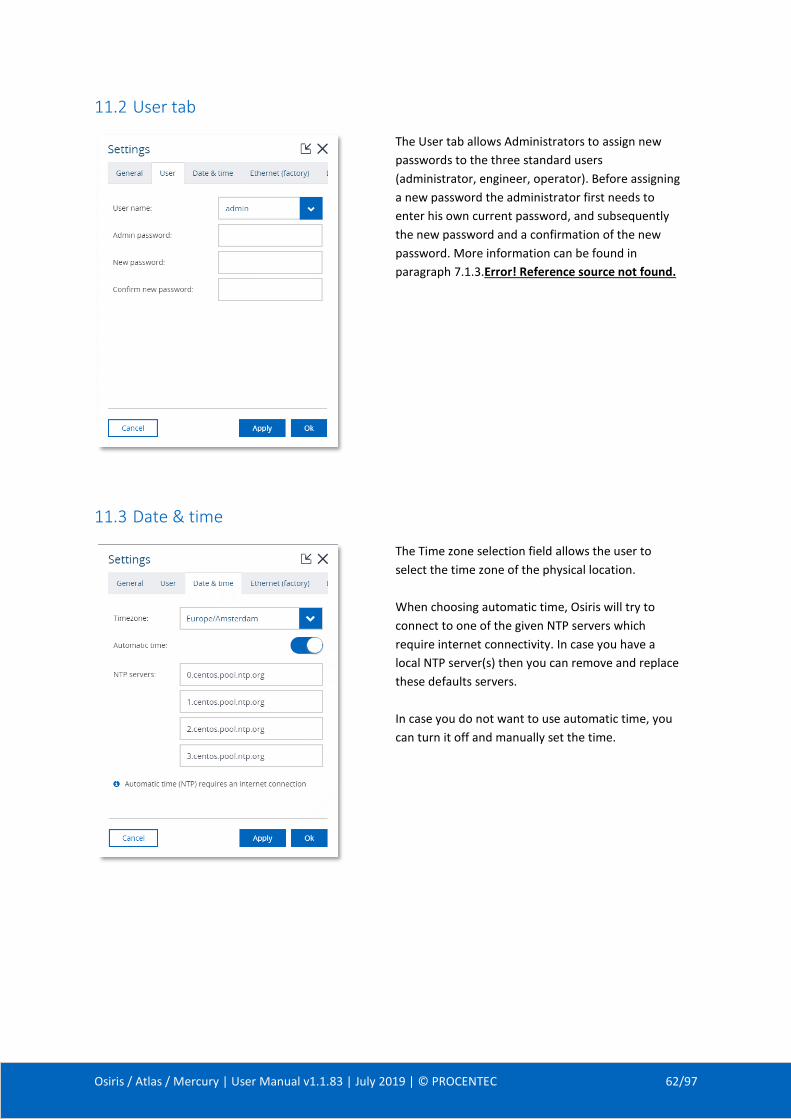
Osiris / Atlas / Mercury | User Manual v1.1.83 | July 2019 | © PROCENTEC 62/97
11.2 User tab
The User tab allows Administrators to assign new
passwords to the three standard users
(administrator, engineer, operator). Before assigning
a new password the administrator first needs to
enter his own current password, and subsequently
the new password and a confirmation of the new
password. More information can be found in
paragraph 7.1.3.Error! Reference source not found.
11.3 Date & time
The Time zone selection field allows the user to
select the time zone of the physical location.
When choosing automatic time, Osiris will try to
connect to one of the given NTP servers which
require internet connectivity. In case you have a
local NTP server(s) then you can remove and replace
these defaults servers.
In case you do not want to use automatic time, you
can turn it off and manually set the time.
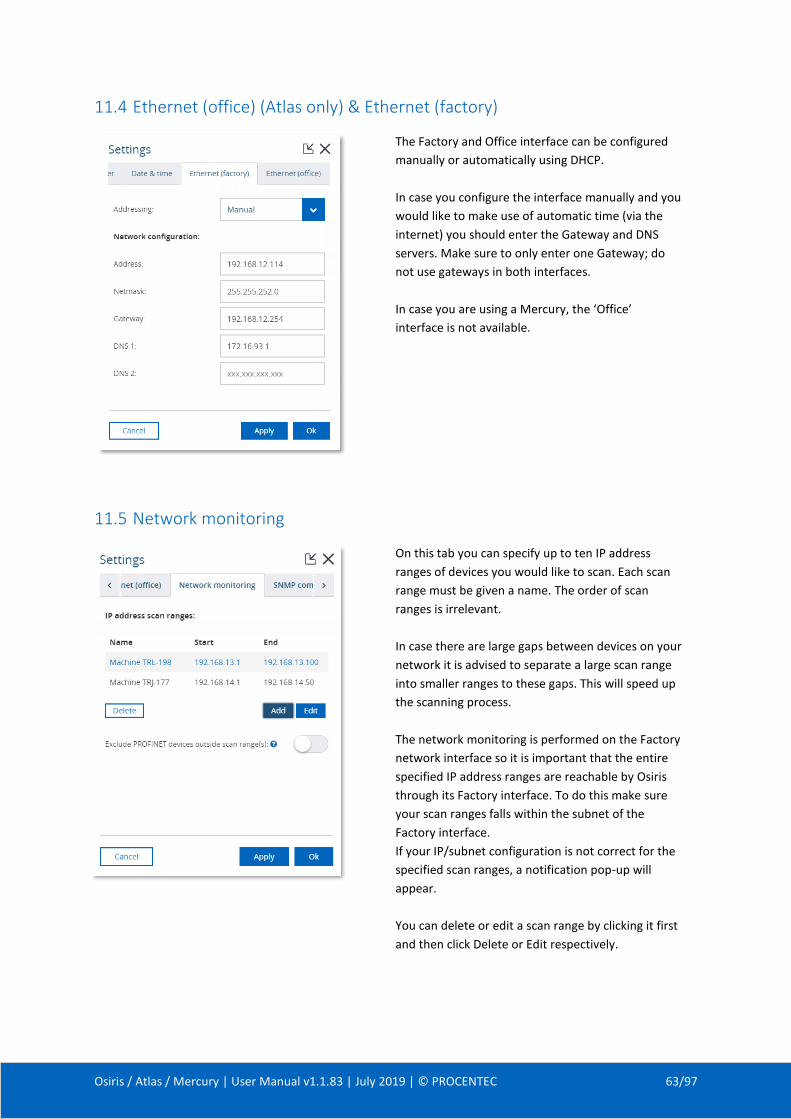
Osiris / Atlas / Mercury | User Manual v1.1.83 | July 2019 | © PROCENTEC 63/97
11.4 Ethernet (office) (Atlas only) & Ethernet (factory)
The Factory and Office interface can be configured
manually or automatically using DHCP.
In case you configure the interface manually and you
would like to make use of automatic time (via the
internet) you should enter the Gateway and DNS
servers. Make sure to only enter one Gateway; do
not use gateways in both interfaces.
In case you are using a Mercury, the ‘Office’
interface is not available.
11.5 Network monitoring
On this tab you can specify up to ten IP address
ranges of devices you would like to scan. Each scan
range must be given a name. The order of scan
ranges is irrelevant.
In case there are large gaps between devices on your
network it is advised to separate a large scan range
into smaller ranges to these gaps. This will speed up
the scanning process.
The network monitoring is performed on the Factory
network interface so it is important that the entire
specified IP address ranges are reachable by Osiris
through its Factory interface. To do this make sure
your scan ranges falls within the subnet of the
Factory interface.
If your IP/subnet configuration is not correct for the
specified scan ranges, a notification pop-up will
appear.
You can delete or edit a scan range by clicking it first
and then click Delete or Edit respectively.
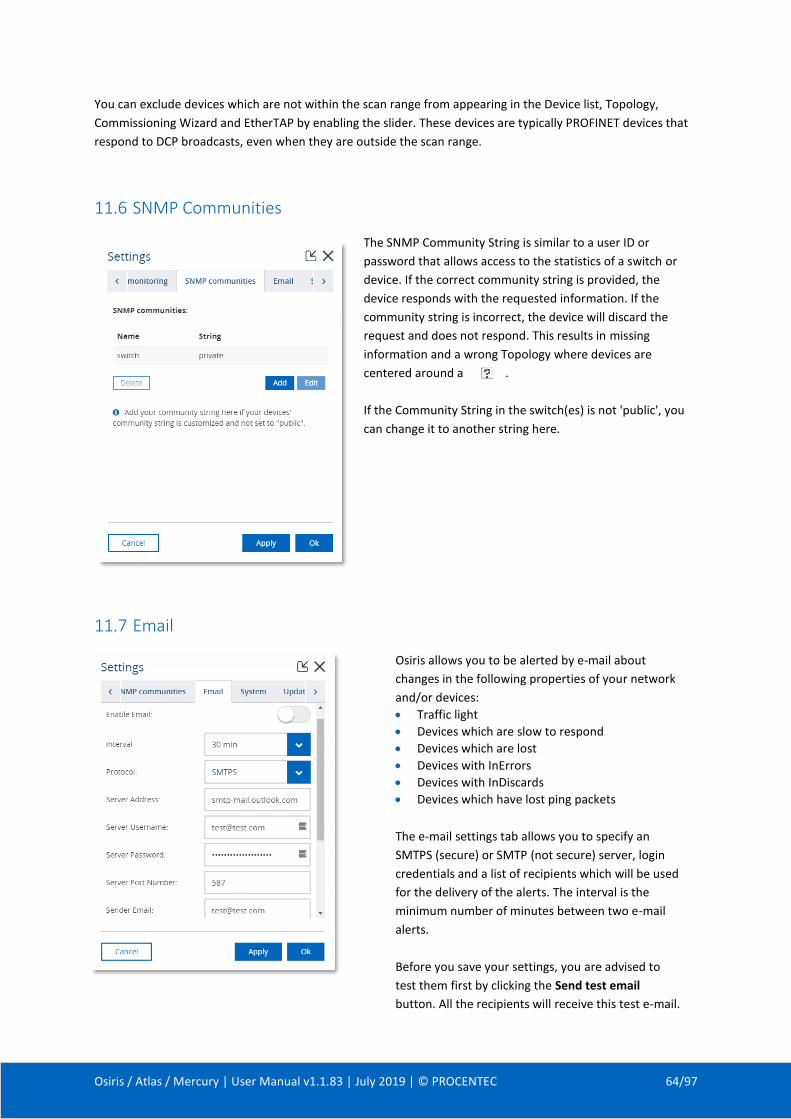
Osiris / Atlas / Mercury | User Manual v1.1.83 | July 2019 | © PROCENTEC 64/97
You can exclude devices which are not within the scan range from appearing in the Device list, Topology,
Commissioning Wizard and EtherTAP by enabling the slider. These devices are typically PROFINET devices that
respond to DCP broadcasts, even when they are outside the scan range.
11.6 SNMP Communities
The SNMP Community String is similar to a user ID or
password that allows access to the statistics of a switch or
device. If the correct community string is provided, the
device responds with the requested information. If the
community string is incorrect, the device will discard the
request and does not respond. This results in missing
information and a wrong Topology where devices are
centered around a .
If the Community String in the switch(es) is not 'public', you
can change it to another string here.
11.7 Email
Osiris allows you to be alerted by e-mail about
changes in the following properties of your network
and/or devices:
• Traffic light
• Devices which are slow to respond
• Devices which are lost
• Devices with InErrors
• Devices with InDiscards
• Devices which have lost ping packets
The e-mail settings tab allows you to specify an
SMTPS (secure) or SMTP (not secure) server, login
credentials and a list of recipients which will be used
for the delivery of the alerts. The interval is the
minimum number of minutes between two e-mail
alerts.
Before you save your settings, you are advised to
test them first by clicking the Send test email
button. All the recipients will receive this test e-mail.
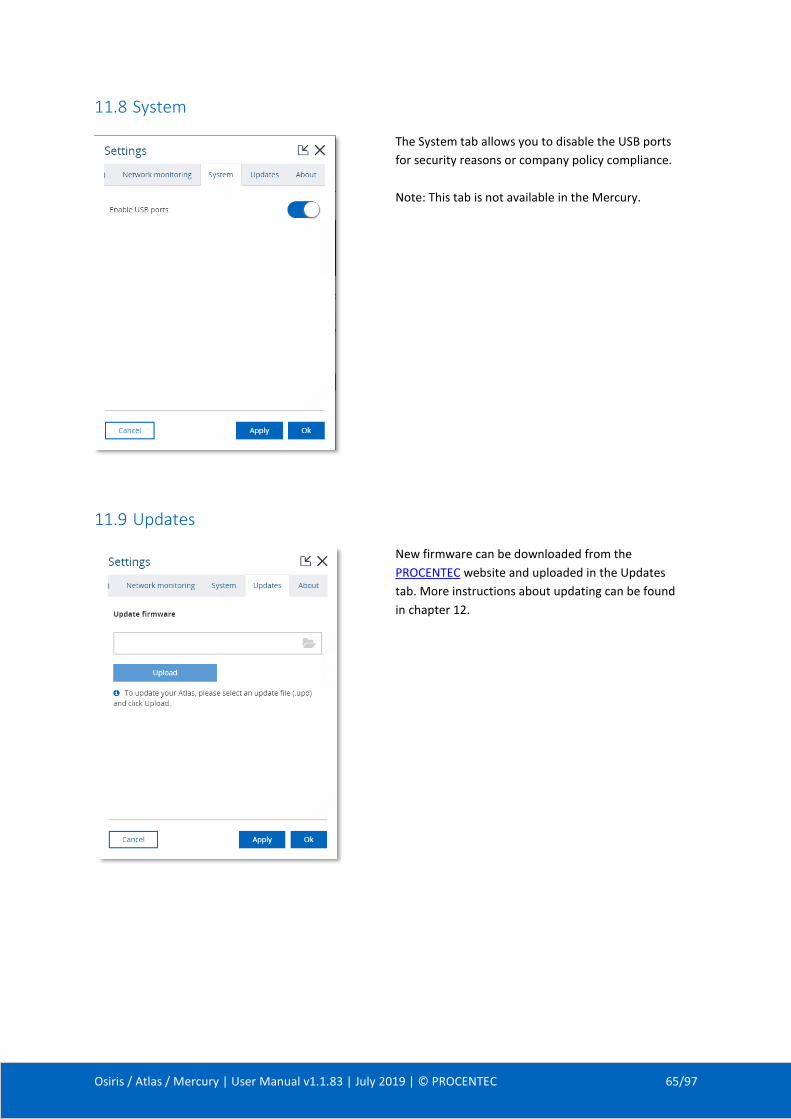
Osiris / Atlas / Mercury | User Manual v1.1.83 | July 2019 | © PROCENTEC 65/97
11.8 System
The System tab allows you to disable the USB ports
for security reasons or company policy compliance.
Note: This tab is not available in the Mercury.
11.9 Updates
New firmware can be downloaded from the
PROCENTEC website and uploaded in the Updates
tab. More instructions about updating can be found
in chapter 12.
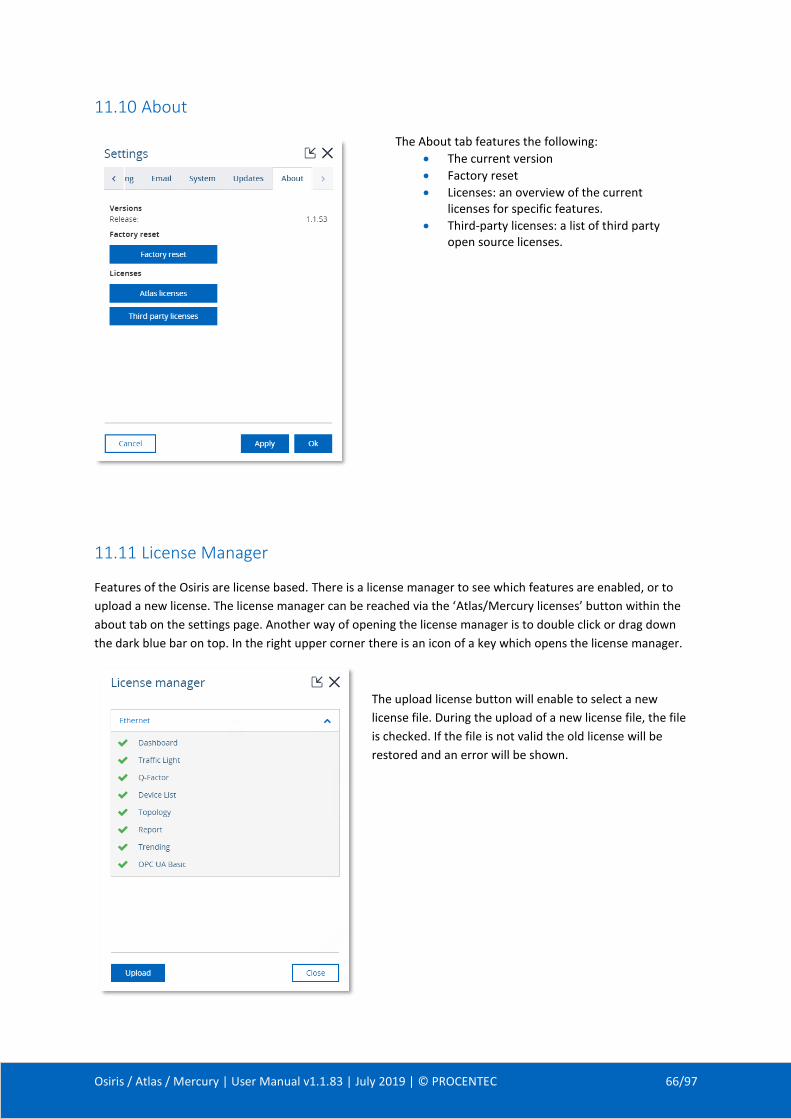
Osiris / Atlas / Mercury | User Manual v1.1.83 | July 2019 | © PROCENTEC 66/97
11.10 About
The About tab features the following:
• The current version
• Factory reset
• Licenses: an overview of the current licenses for specific features.
• Third-party licenses: a list of third party open source licenses.
11.11 License Manager
Features of the Osiris are license based. There is a license manager to see which features are enabled, or to
upload a new license. The license manager can be reached via the ‘Atlas/Mercury licenses’ button within the
about tab on the settings page. Another way of opening the license manager is to double click or drag down
the dark blue bar on top. In the right upper corner there is an icon of a key which opens the license manager.
The upload license button will enable to select a new
license file. During the upload of a new license file, the file
is checked. If the file is not valid the old license will be
restored and an error will be shown.
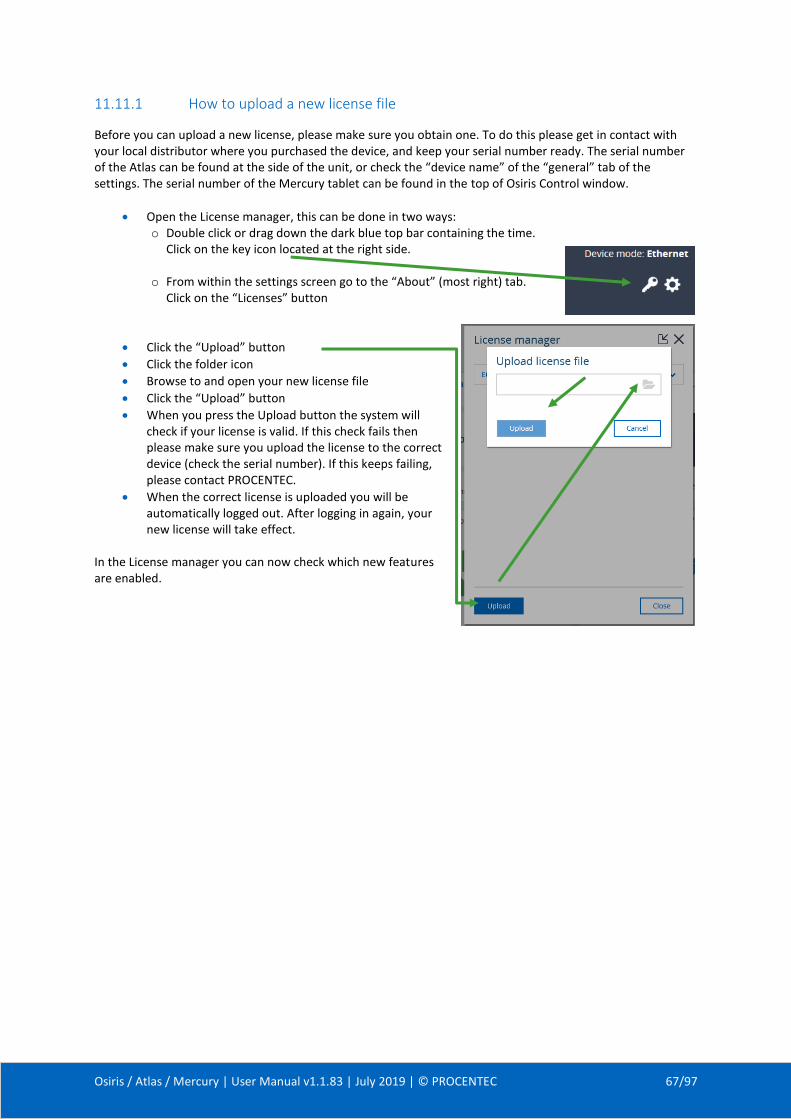
Osiris / Atlas / Mercury | User Manual v1.1.83 | July 2019 | © PROCENTEC 67/97
11.11.1 How to upload a new license file
Before you can upload a new license, please make sure you obtain one. To do this please get in contact with your local distributor where you purchased the device, and keep your serial number ready. The serial number of the Atlas can be found at the side of the unit, or check the “device name” of the “general” tab of the settings. The serial number of the Mercury tablet can be found in the top of Osiris Control window.
• Open the License manager, this can be done in two ways: o Double click or drag down the dark blue top bar containing the time.
Click on the key icon located at the right side. o From within the settings screen go to the “About” (most right) tab.
Click on the “Licenses” button
• Click the “Upload” button
• Click the folder icon
• Browse to and open your new license file
• Click the “Upload” button
• When you press the Upload button the system will check if your license is valid. If this check fails then please make sure you upload the license to the correct device (check the serial number). If this keeps failing, please contact PROCENTEC.
• When the correct license is uploaded you will be automatically logged out. After logging in again, your new license will take effect.
In the License manager you can now check which new features are enabled.
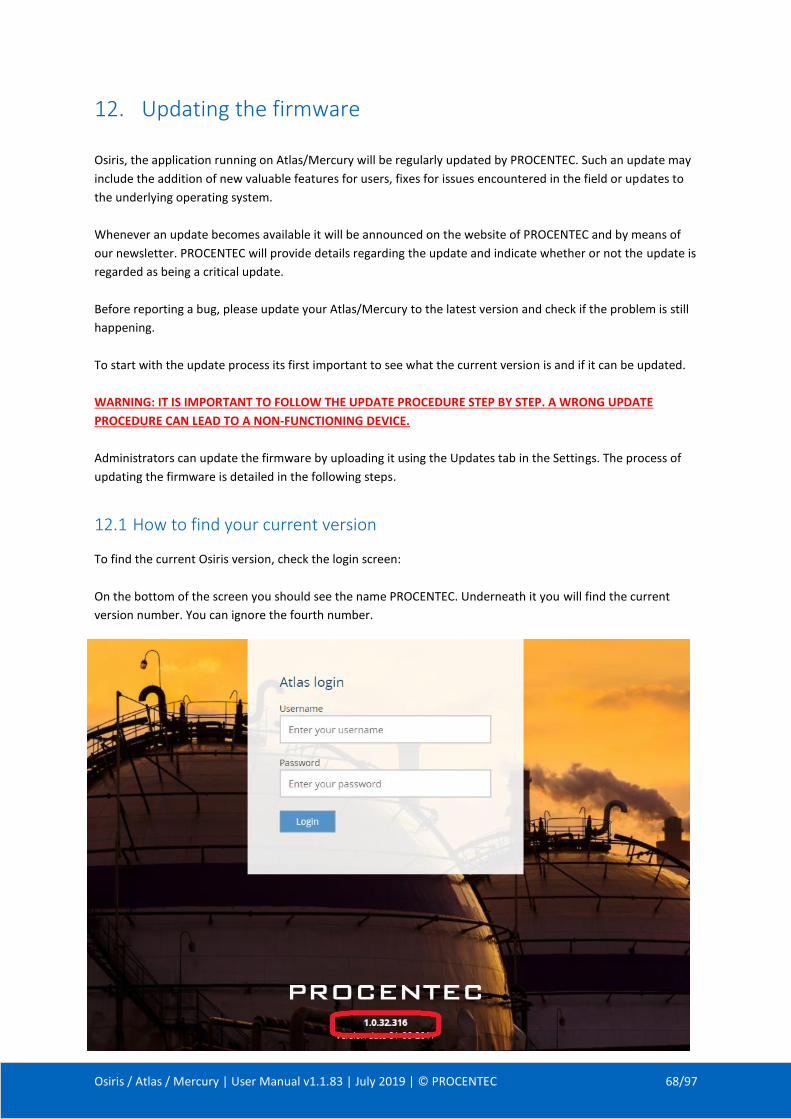
Osiris / Atlas / Mercury | User Manual v1.1.83 | July 2019 | © PROCENTEC 68/97
12. Updating the firmware
Osiris, the application running on Atlas/Mercury will be regularly updated by PROCENTEC. Such an update may
include the addition of new valuable features for users, fixes for issues encountered in the field or updates to
the underlying operating system.
Whenever an update becomes available it will be announced on the website of PROCENTEC and by means of
our newsletter. PROCENTEC will provide details regarding the update and indicate whether or not the update is
regarded as being a critical update.
Before reporting a bug, please update your Atlas/Mercury to the latest version and check if the problem is still
happening.
To start with the update process its first important to see what the current version is and if it can be updated.
WARNING: IT IS IMPORTANT TO FOLLOW THE UPDATE PROCEDURE STEP BY STEP. A WRONG UPDATE
PROCEDURE CAN LEAD TO A NON-FUNCTIONING DEVICE.
Administrators can update the firmware by uploading it using the Updates tab in the Settings. The process of
updating the firmware is detailed in the following steps.
12.1 How to find your current version
To find the current Osiris version, check the login screen:
On the bottom of the screen you should see the name PROCENTEC. Underneath it you will find the current
version number. You can ignore the fourth number.
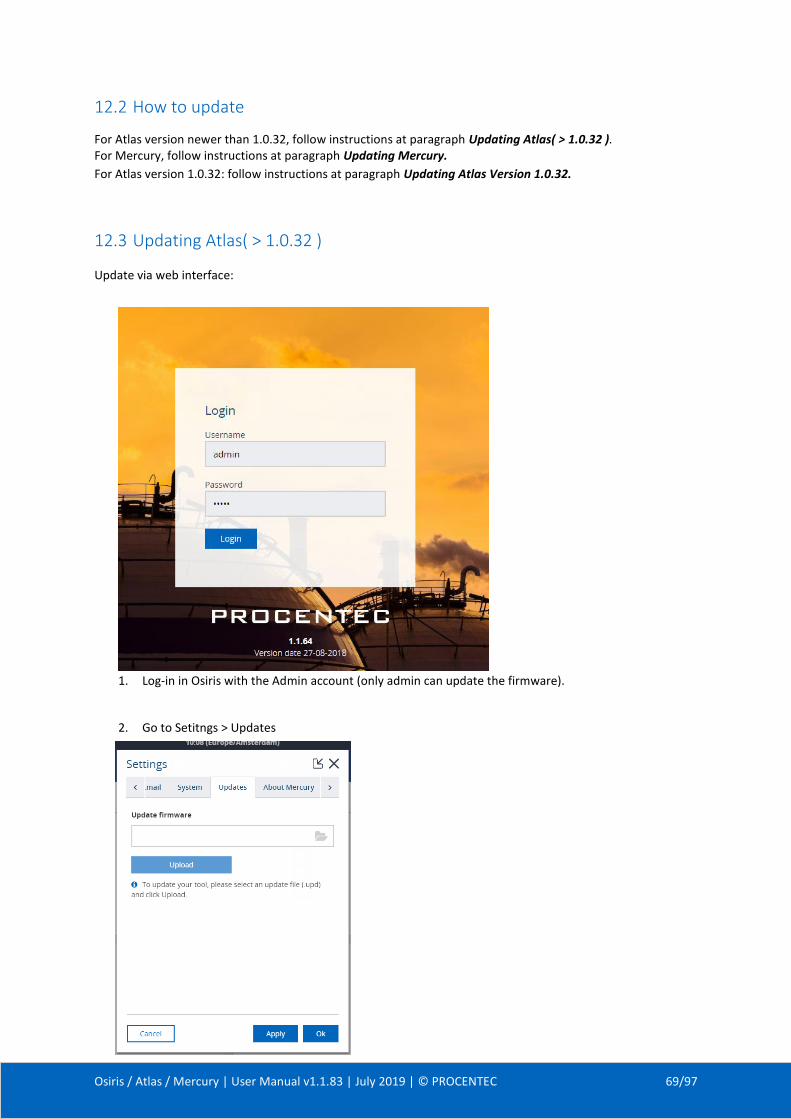
Osiris / Atlas / Mercury | User Manual v1.1.83 | July 2019 | © PROCENTEC 69/97
12.2 How to update
For Atlas version newer than 1.0.32, follow instructions at paragraph Updating Atlas( > 1.0.32 ). For Mercury, follow instructions at paragraph Updating Mercury.
For Atlas version 1.0.32: follow instructions at paragraph Updating Atlas Version 1.0.32.
12.3 Updating Atlas( > 1.0.32 )
Update via web interface:
1. Log-in in Osiris with the Admin account (only admin can update the firmware).
2. Go to Setitngs > Updates

Osiris / Atlas / Mercury | User Manual v1.1.83 | July 2019 | © PROCENTEC 70/97
3. Select the update file .upd
Atlas and Mercury updates have different .upd files, use the specific Atlas update file!
4. Press upload
5. Wait until the file is uploaded – this usually takes about 10 minutes. If it is still loading after an hour
please try again.
6. When the update is loaded, a green message will appear, press OK
7. A reboot button on the system clock will appear. Click on Restart to Update and click on yes on the
popup

Osiris / Atlas / Mercury | User Manual v1.1.83 | July 2019 | © PROCENTEC 71/97
8. Wait until Osiris code is back online! This can take up to one hour, the entire OS and the software will
be updated. DO NOT POWER OFF THE ATLAS. POWERING OFF WILL DAMAGE THE UPDATE AND THE
ATLAS.
9. Once the update is done you will see the login page. Log in and go to settings, where you should see
the newest version. If it still shows the previous version, try to refresh the page:
Your Atlas is now updated, enjoy the new functionalities!
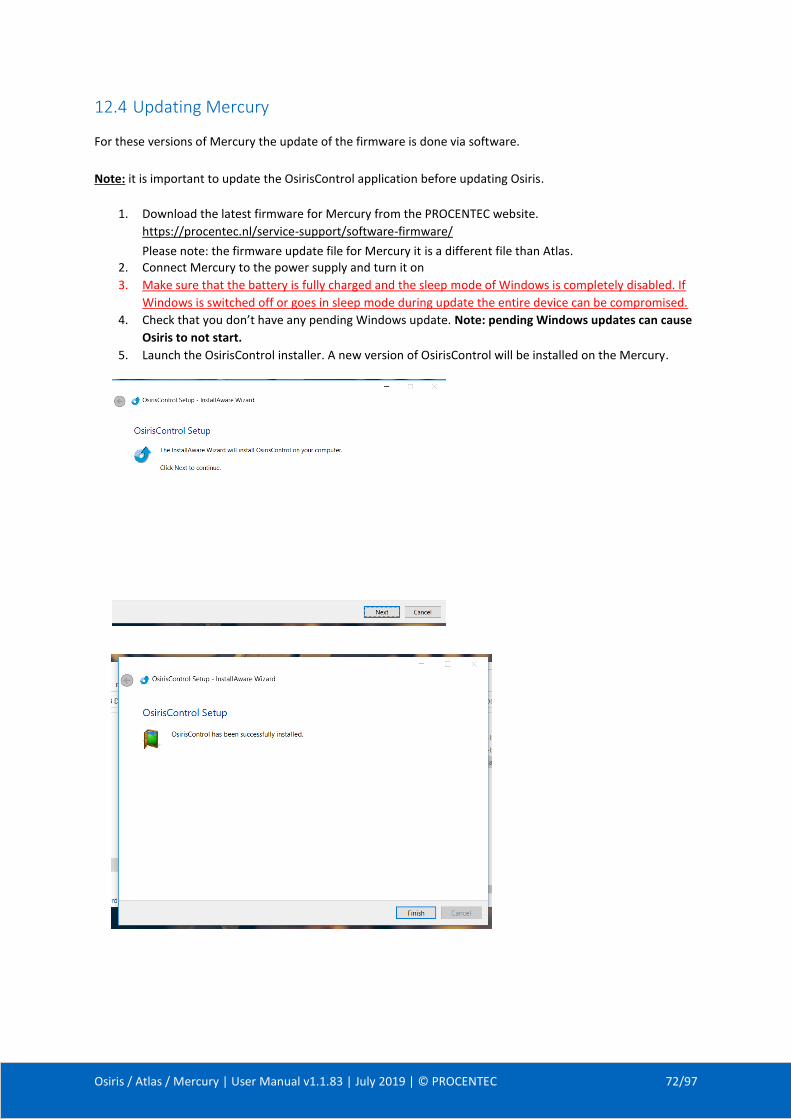
Osiris / Atlas / Mercury | User Manual v1.1.83 | July 2019 | © PROCENTEC 72/97
12.4 Updating Mercury
For these versions of Mercury the update of the firmware is done via software.
Note: it is important to update the OsirisControl application before updating Osiris.
1. Download the latest firmware for Mercury from the PROCENTEC website.
https://procentec.nl/service-support/software-firmware/
Please note: the firmware update file for Mercury it is a different file than Atlas. 2. Connect Mercury to the power supply and turn it on
3. Make sure that the battery is fully charged and the sleep mode of Windows is completely disabled. If
Windows is switched off or goes in sleep mode during update the entire device can be compromised.
4. Check that you don’t have any pending Windows update. Note: pending Windows updates can cause
Osiris to not start.
5. Launch the OsirisControl installer. A new version of OsirisControl will be installed on the Mercury.
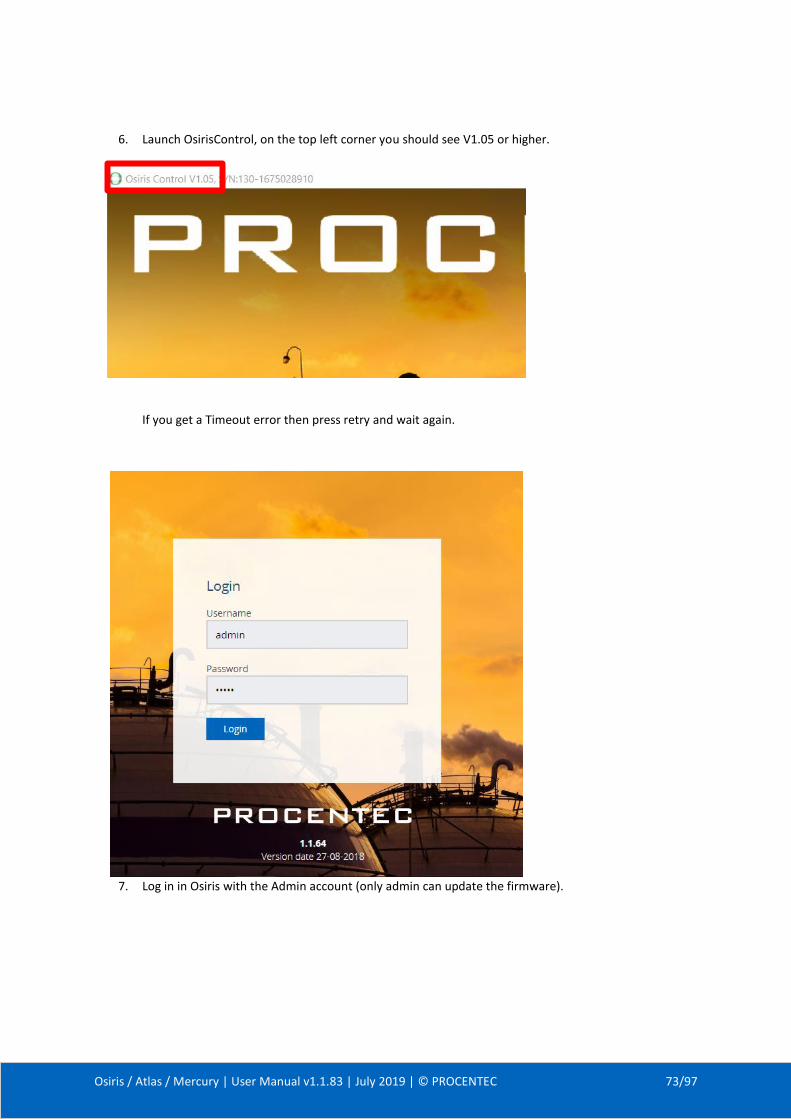
Osiris / Atlas / Mercury | User Manual v1.1.83 | July 2019 | © PROCENTEC 73/97
6. Launch OsirisControl, on the top left corner you should see V1.05 or higher.
If you get a Timeout error then press retry and wait again.
7. Log in in Osiris with the Admin account (only admin can update the firmware).
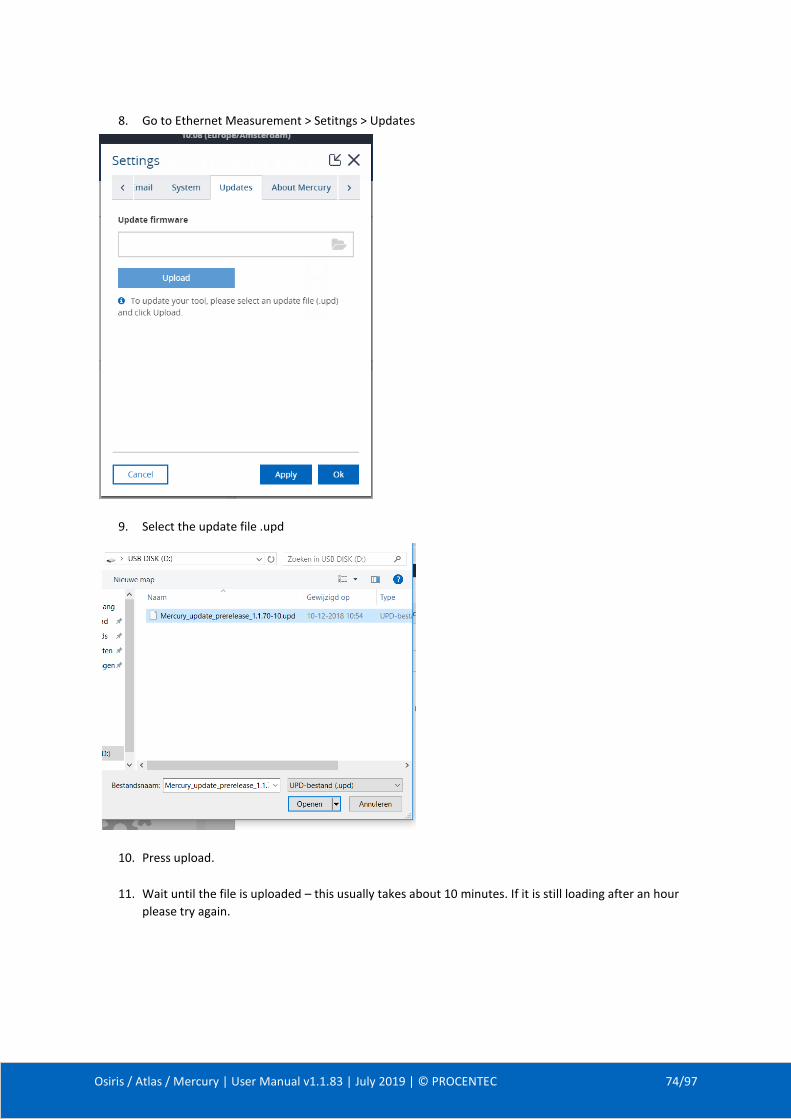
Osiris / Atlas / Mercury | User Manual v1.1.83 | July 2019 | © PROCENTEC 74/97
8. Go to Ethernet Measurement > Setitngs > Updates
9. Select the update file .upd
10. Press upload.
11. Wait until the file is uploaded – this usually takes about 10 minutes. If it is still loading after an hour
please try again.
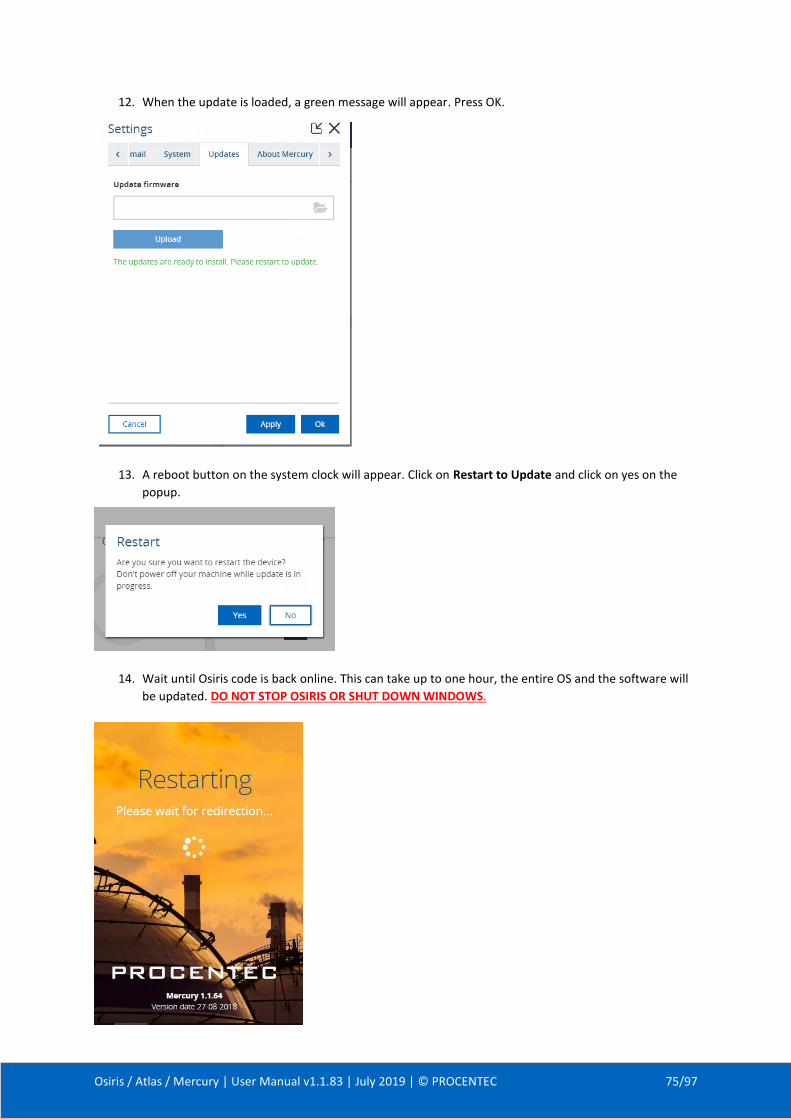
Osiris / Atlas / Mercury | User Manual v1.1.83 | July 2019 | © PROCENTEC 75/97
12. When the update is loaded, a green message will appear. Press OK.
13. A reboot button on the system clock will appear. Click on Restart to Update and click on yes on the
popup.
14. Wait until Osiris code is back online. This can take up to one hour, the entire OS and the software will
be updated. DO NOT STOP OSIRIS OR SHUT DOWN WINDOWS.
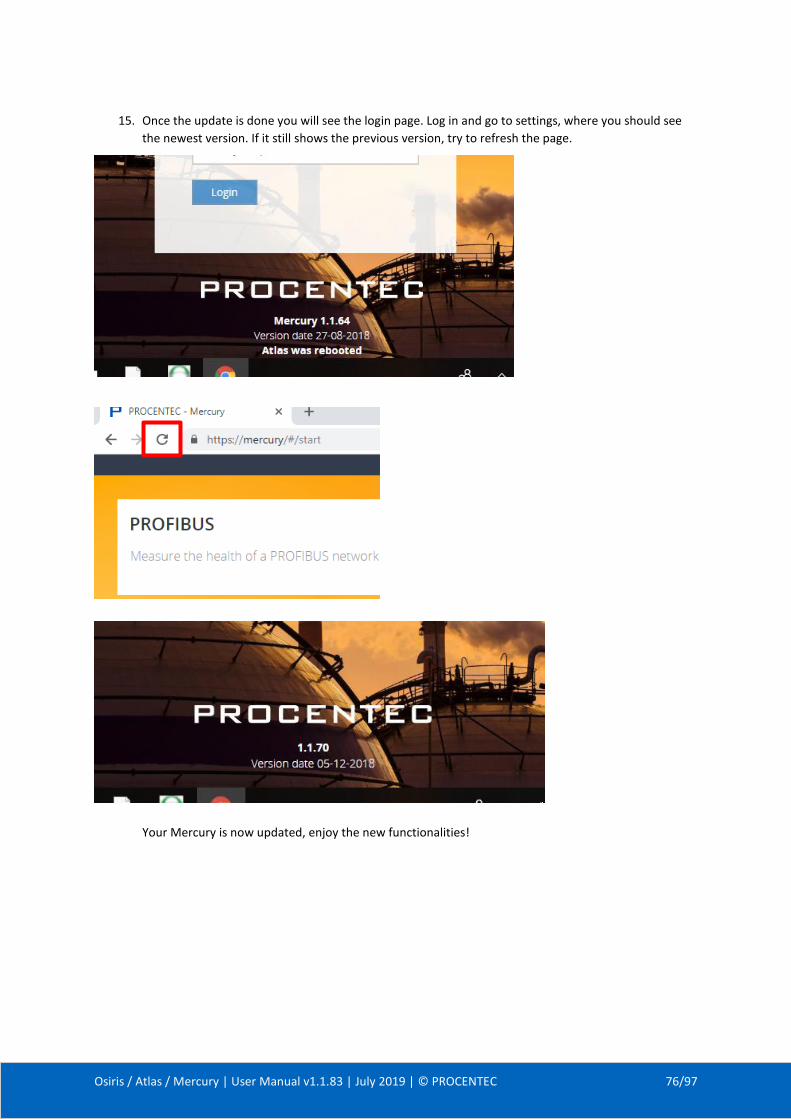
Osiris / Atlas / Mercury | User Manual v1.1.83 | July 2019 | © PROCENTEC 76/97
15. Once the update is done you will see the login page. Log in and go to settings, where you should see
the newest version. If it still shows the previous version, try to refresh the page.
Your Mercury is now updated, enjoy the new functionalities!
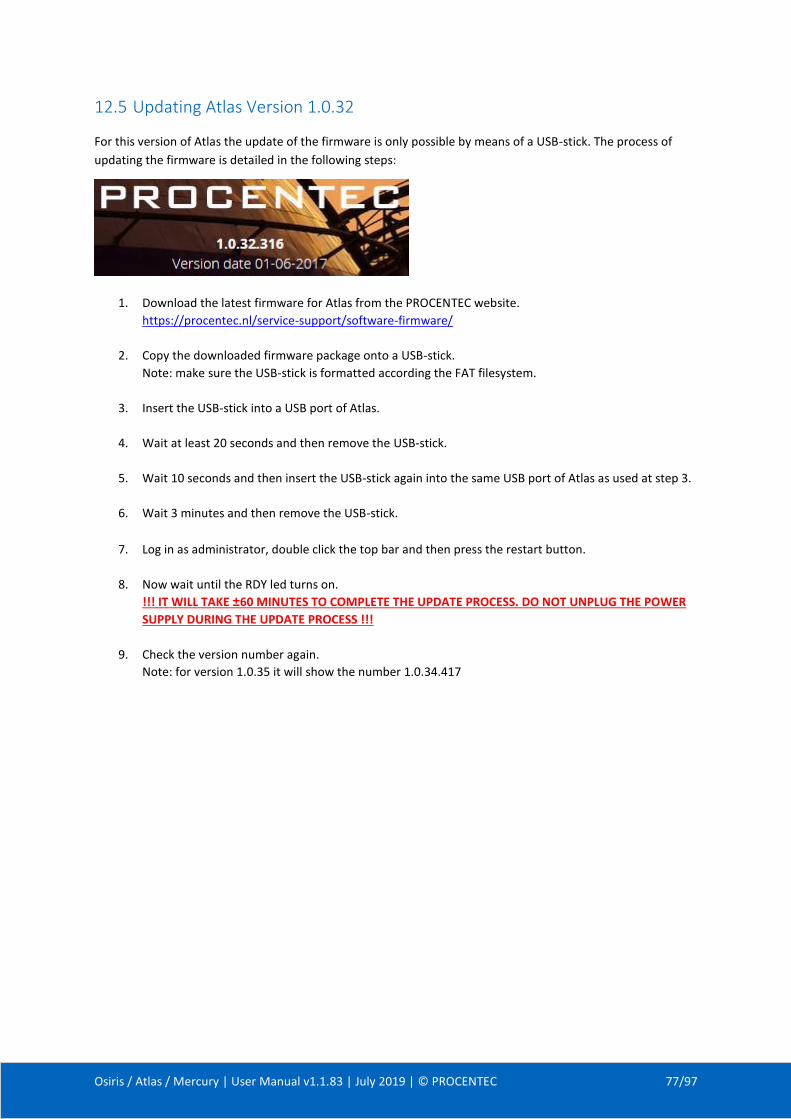
Osiris / Atlas / Mercury | User Manual v1.1.83 | July 2019 | © PROCENTEC 77/97
12.5 Updating Atlas Version 1.0.32
For this version of Atlas the update of the firmware is only possible by means of a USB-stick. The process of
updating the firmware is detailed in the following steps:
1. Download the latest firmware for Atlas from the PROCENTEC website.
https://procentec.nl/service-support/software-firmware/
2. Copy the downloaded firmware package onto a USB-stick.
Note: make sure the USB-stick is formatted according the FAT filesystem.
3. Insert the USB-stick into a USB port of Atlas.
4. Wait at least 20 seconds and then remove the USB-stick.
5. Wait 10 seconds and then insert the USB-stick again into the same USB port of Atlas as used at step 3.
6. Wait 3 minutes and then remove the USB-stick.
7. Log in as administrator, double click the top bar and then press the restart button.
8. Now wait until the RDY led turns on.
!!! IT WILL TAKE ±60 MINUTES TO COMPLETE THE UPDATE PROCESS. DO NOT UNPLUG THE POWER
SUPPLY DURING THE UPDATE PROCESS !!!
9. Check the version number again.
Note: for version 1.0.35 it will show the number 1.0.34.417
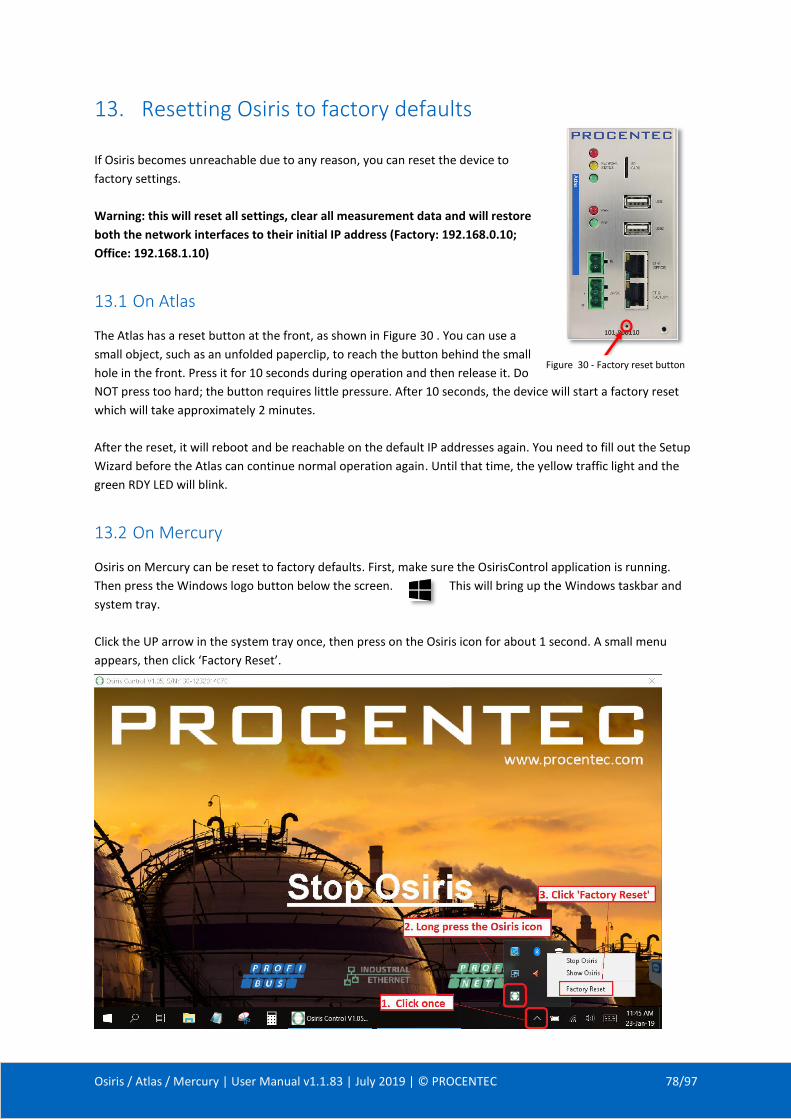
Osiris / Atlas / Mercury | User Manual v1.1.83 | July 2019 | © PROCENTEC 78/97
13. Resetting Osiris to factory defaults
If Osiris becomes unreachable due to any reason, you can reset the device to
factory settings.
Warning: this will reset all settings, clear all measurement data and will restore
both the network interfaces to their initial IP address (Factory: 192.168.0.10;
Office: 192.168.1.10)
13.1 On Atlas
The Atlas has a reset button at the front, as shown in Figure 30 . You can use a
small object, such as an unfolded paperclip, to reach the button behind the small
hole in the front. Press it for 10 seconds during operation and then release it. Do
NOT press too hard; the button requires little pressure. After 10 seconds, the device will start a factory reset
which will take approximately 2 minutes.
After the reset, it will reboot and be reachable on the default IP addresses again. You need to fill out the Setup
Wizard before the Atlas can continue normal operation again. Until that time, the yellow traffic light and the
green RDY LED will blink.
13.2 On Mercury
Osiris on Mercury can be reset to factory defaults. First, make sure the OsirisControl application is running.
Then press the Windows logo button below the screen. This will bring up the Windows taskbar and
system tray.
Click the UP arrow in the system tray once, then press on the Osiris icon for about 1 second. A small menu
appears, then click ‘Factory Reset’.
Figure 30 - Factory reset button
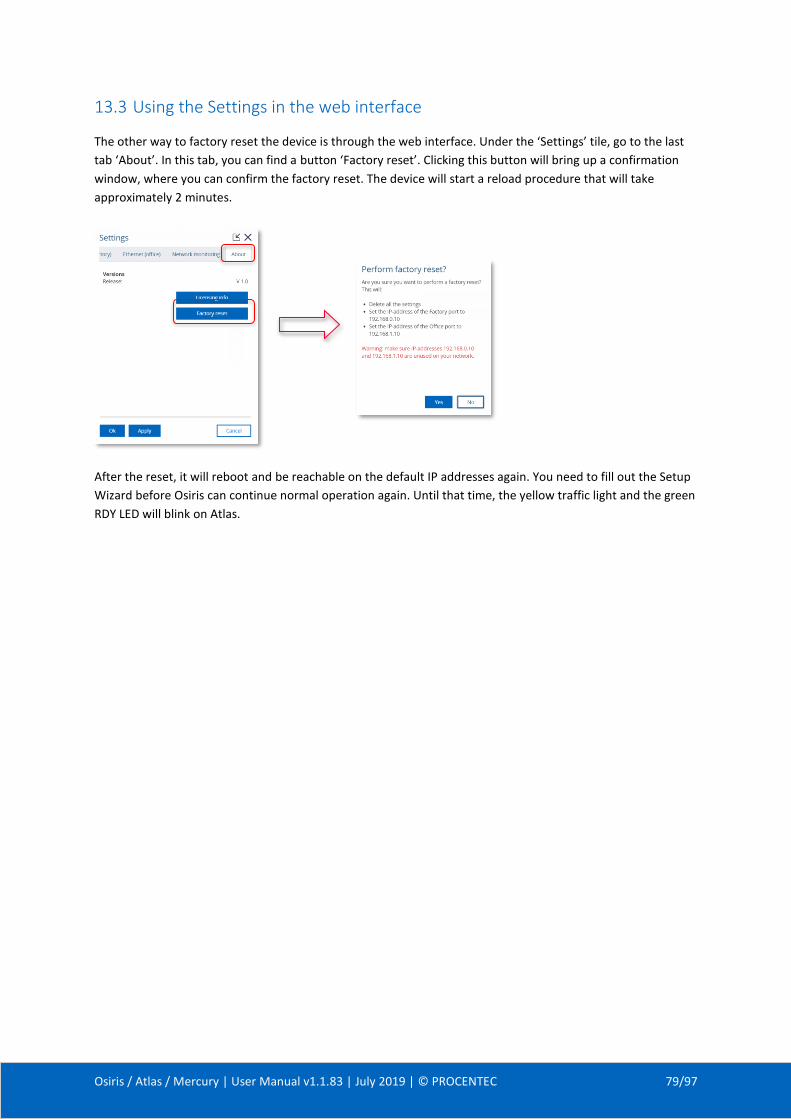
Osiris / Atlas / Mercury | User Manual v1.1.83 | July 2019 | © PROCENTEC 79/97
13.3 Using the Settings in the web interface
The other way to factory reset the device is through the web interface. Under the ‘Settings’ tile, go to the last
tab ‘About’. In this tab, you can find a button ‘Factory reset’. Clicking this button will bring up a confirmation
window, where you can confirm the factory reset. The device will start a reload procedure that will take
approximately 2 minutes.
After the reset, it will reboot and be reachable on the default IP addresses again. You need to fill out the Setup
Wizard before Osiris can continue normal operation again. Until that time, the yellow traffic light and the green
RDY LED will blink on Atlas.
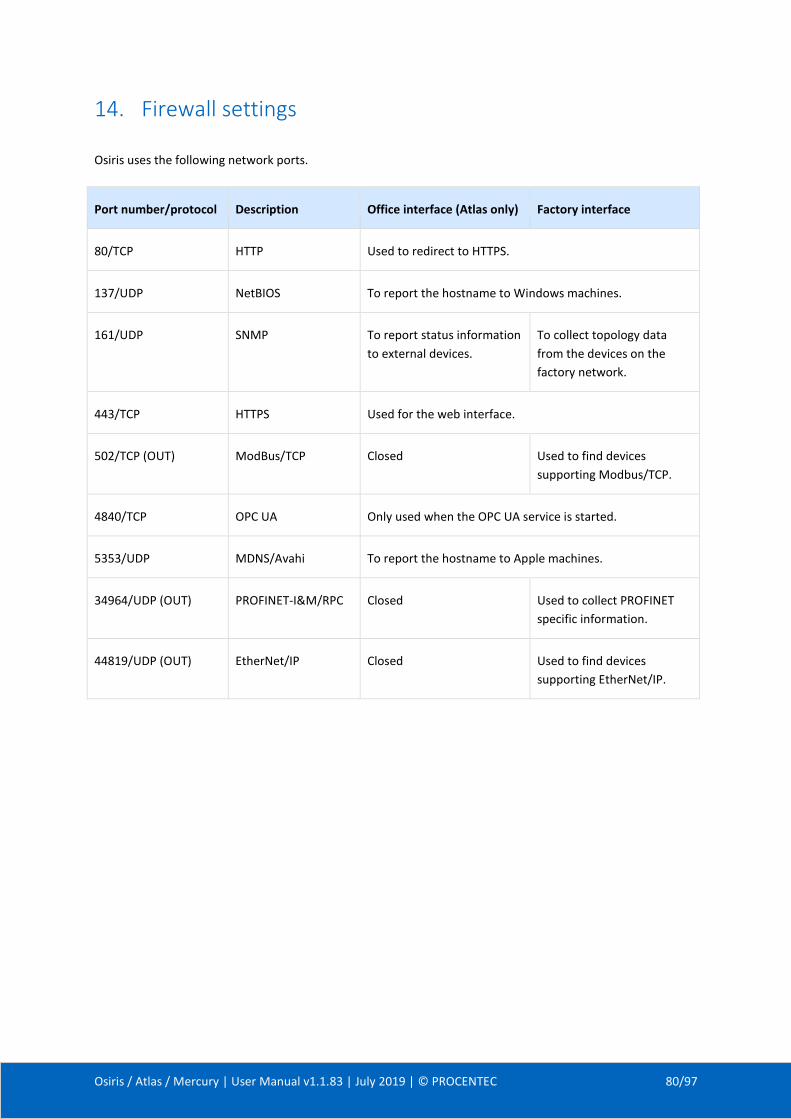
Osiris / Atlas / Mercury | User Manual v1.1.83 | July 2019 | © PROCENTEC 80/97
14. Firewall settings
Osiris uses the following network ports.
Port number/protocol Description Office interface (Atlas only) Factory interface
80/TCP HTTP Used to redirect to HTTPS.
137/UDP NetBIOS To report the hostname to Windows machines.
161/UDP SNMP To report status information
to external devices.
To collect topology data
from the devices on the
factory network.
443/TCP HTTPS Used for the web interface.
502/TCP (OUT) ModBus/TCP Closed Used to find devices
supporting Modbus/TCP.
4840/TCP OPC UA Only used when the OPC UA service is started.
5353/UDP MDNS/Avahi To report the hostname to Apple machines.
34964/UDP (OUT) PROFINET-I&M/RPC Closed Used to collect PROFINET
specific information.
44819/UDP (OUT) EtherNet/IP Closed Used to find devices
supporting EtherNet/IP.
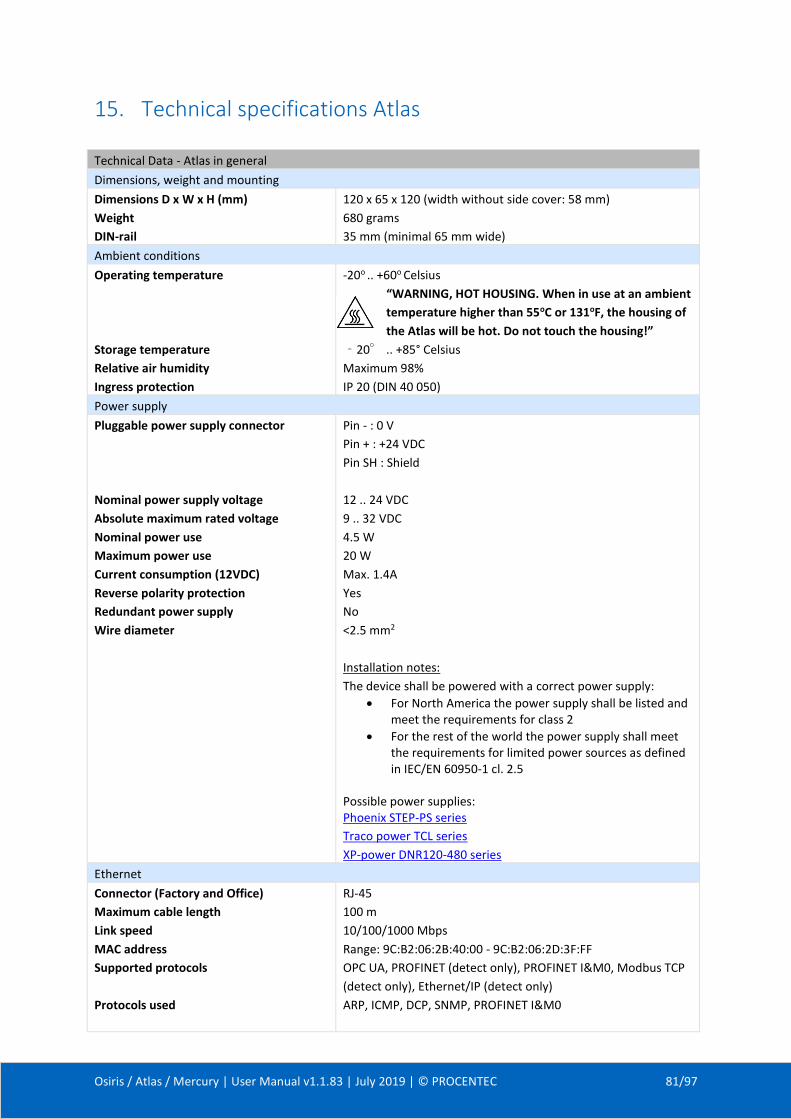
Osiris / Atlas / Mercury | User Manual v1.1.83 | July 2019 | © PROCENTEC 81/97
15. Technical specifications Atlas
Technical Data - Atlas in general
Dimensions, weight and mounting
Dimensions D x W x H (mm)
Weight
DIN-rail
120 x 65 x 120 (width without side cover: 58 mm)
680 grams
35 mm (minimal 65 mm wide)
Ambient conditions
Operating temperature
Storage temperature
Relative air humidity
Ingress protection
-20o .. +60o Celsius
“WARNING, HOT HOUSING. When in use at an ambient
temperature higher than 55oC or 131oF, the housing of
the Atlas will be hot. Do not touch the housing!”
‐20° .. +85° Celsius
Maximum 98%
IP 20 (DIN 40 050)
Power supply
Pluggable power supply connector
Nominal power supply voltage
Absolute maximum rated voltage
Nominal power use
Maximum power use
Current consumption (12VDC)
Reverse polarity protection
Redundant power supply
Wire diameter
Pin - : 0 V
Pin + : +24 VDC
Pin SH : Shield
12 .. 24 VDC
9 .. 32 VDC
4.5 W
20 W
Max. 1.4A
Yes
No
<2.5 mm2
Installation notes:
The device shall be powered with a correct power supply:
• For North America the power supply shall be listed and meet the requirements for class 2
• For the rest of the world the power supply shall meet the requirements for limited power sources as defined in IEC/EN 60950-1 cl. 2.5
Possible power supplies: Phoenix STEP-PS series
Traco power TCL series
XP-power DNR120-480 series
Ethernet
Connector (Factory and Office)
Maximum cable length
Link speed
MAC address
Supported protocols
Protocols used
RJ-45
100 m
10/100/1000 Mbps
Range: 9C:B2:06:2B:40:00 - 9C:B2:06:2D:3F:FF
OPC UA, PROFINET (detect only), PROFINET I&M0, Modbus TCP
(detect only), Ethernet/IP (detect only)
ARP, ICMP, DCP, SNMP, PROFINET I&M0
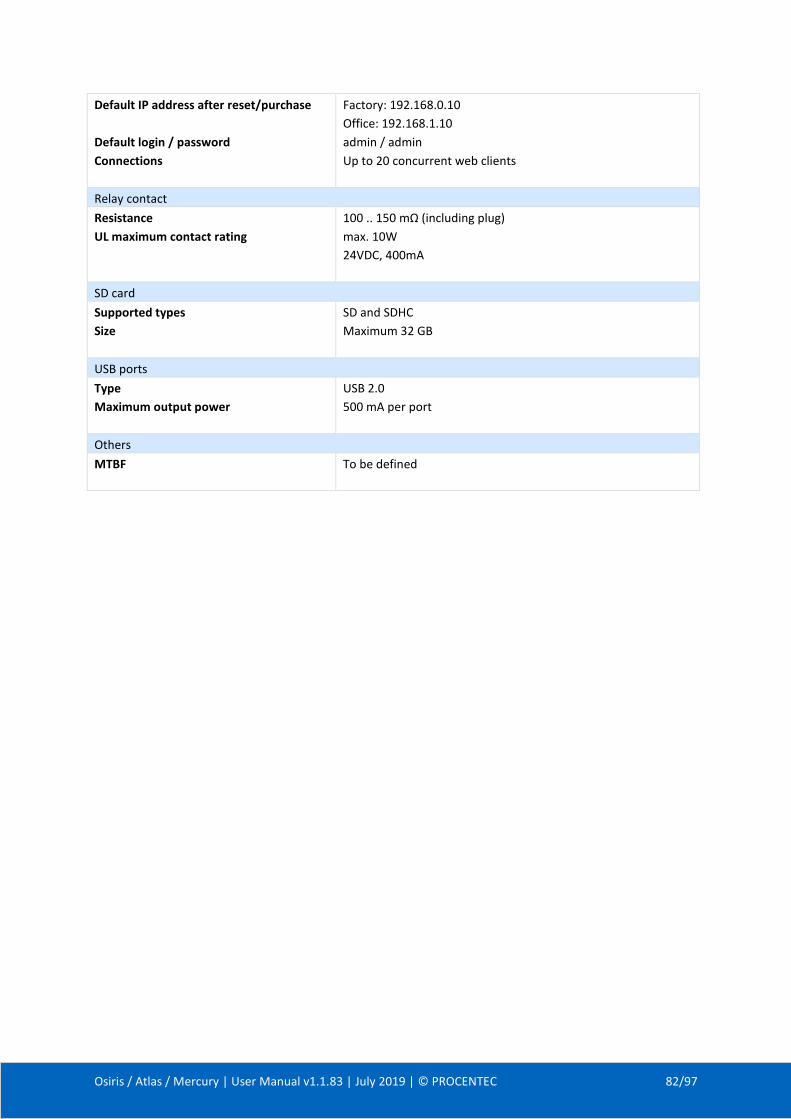
Osiris / Atlas / Mercury | User Manual v1.1.83 | July 2019 | © PROCENTEC 82/97
Default IP address after reset/purchase
Default login / password
Connections
Factory: 192.168.0.10
Office: 192.168.1.10
admin / admin
Up to 20 concurrent web clients
Relay contact
Resistance
UL maximum contact rating
100 .. 150 mΩ (including plug)
max. 10W
24VDC, 400mA
SD card
Supported types
Size
SD and SDHC
Maximum 32 GB
USB ports
Type
Maximum output power
USB 2.0
500 mA per port
Others
MTBF To be defined
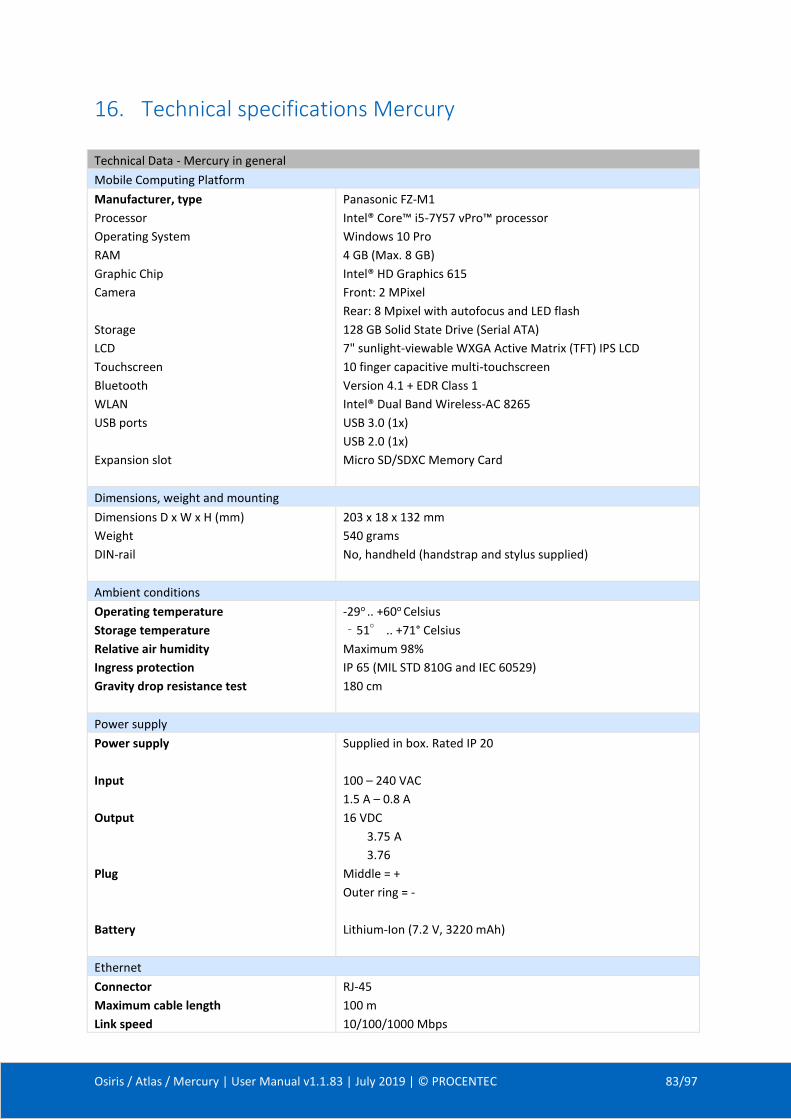
Osiris / Atlas / Mercury | User Manual v1.1.83 | July 2019 | © PROCENTEC 83/97
16. Technical specifications Mercury
Technical Data - Mercury in general
Mobile Computing Platform
Manufacturer, type
Processor
Operating System
RAM
Graphic Chip
Camera
Storage
LCD
Touchscreen
Bluetooth
WLAN
USB ports
Expansion slot
Panasonic FZ-M1
Intel® Core™ i5-7Y57 vPro™ processor
Windows 10 Pro
4 GB (Max. 8 GB)
Intel® HD Graphics 615
Front: 2 MPixel
Rear: 8 Mpixel with autofocus and LED flash
128 GB Solid State Drive (Serial ATA)
7" sunlight-viewable WXGA Active Matrix (TFT) IPS LCD
10 finger capacitive multi-touchscreen
Version 4.1 + EDR Class 1
Intel® Dual Band Wireless-AC 8265
USB 3.0 (1x)
USB 2.0 (1x)
Micro SD/SDXC Memory Card
Dimensions, weight and mounting
Dimensions D x W x H (mm)
Weight
DIN-rail
203 x 18 x 132 mm
540 grams
No, handheld (handstrap and stylus supplied)
Ambient conditions
Operating temperature
Storage temperature
Relative air humidity
Ingress protection
Gravity drop resistance test
-29o .. +60o Celsius
‐51° .. +71° Celsius
Maximum 98%
IP 65 (MIL STD 810G and IEC 60529)
180 cm
Power supply
Power supply
Input
Output
Plug
Battery
Supplied in box. Rated IP 20
100 – 240 VAC
1.5 A – 0.8 A
16 VDC
3.75 A
3.76
Middle = +
Outer ring = -
Lithium-Ion (7.2 V, 3220 mAh)
Ethernet
Connector
Maximum cable length
Link speed
RJ-45
100 m
10/100/1000 Mbps
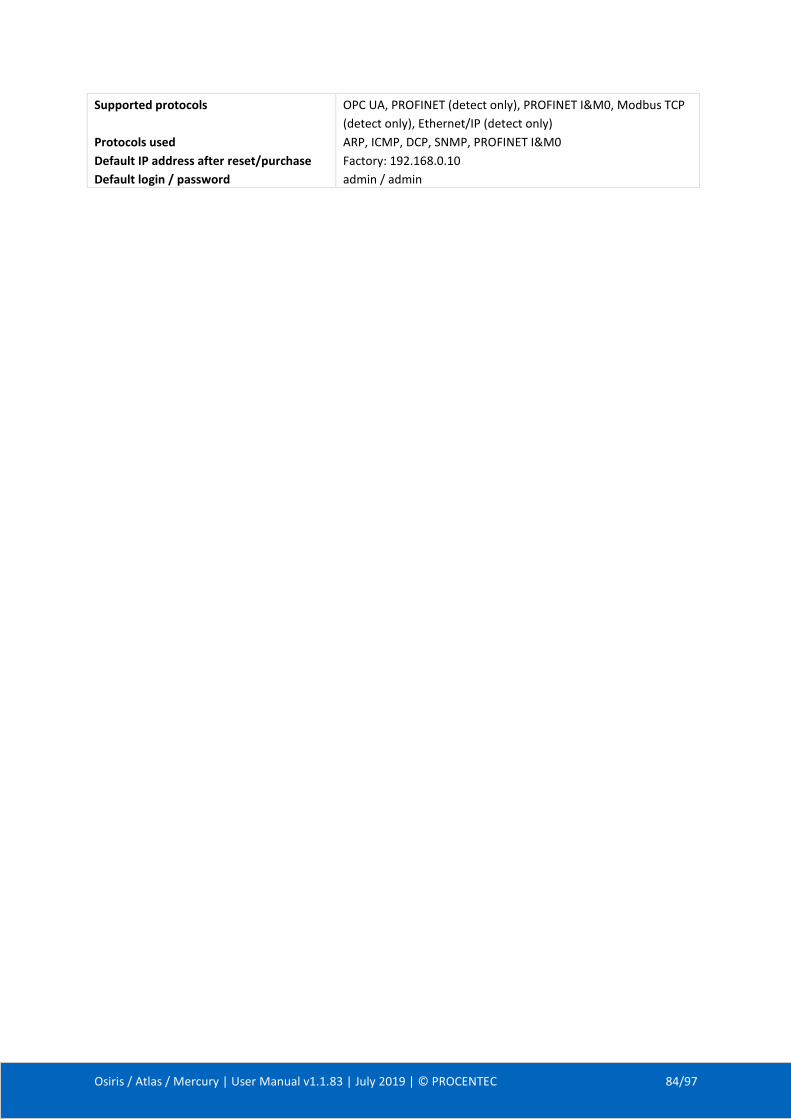
Osiris / Atlas / Mercury | User Manual v1.1.83 | July 2019 | © PROCENTEC 84/97
Supported protocols
Protocols used
Default IP address after reset/purchase
Default login / password
OPC UA, PROFINET (detect only), PROFINET I&M0, Modbus TCP
(detect only), Ethernet/IP (detect only)
ARP, ICMP, DCP, SNMP, PROFINET I&M0
Factory: 192.168.0.10
admin / admin
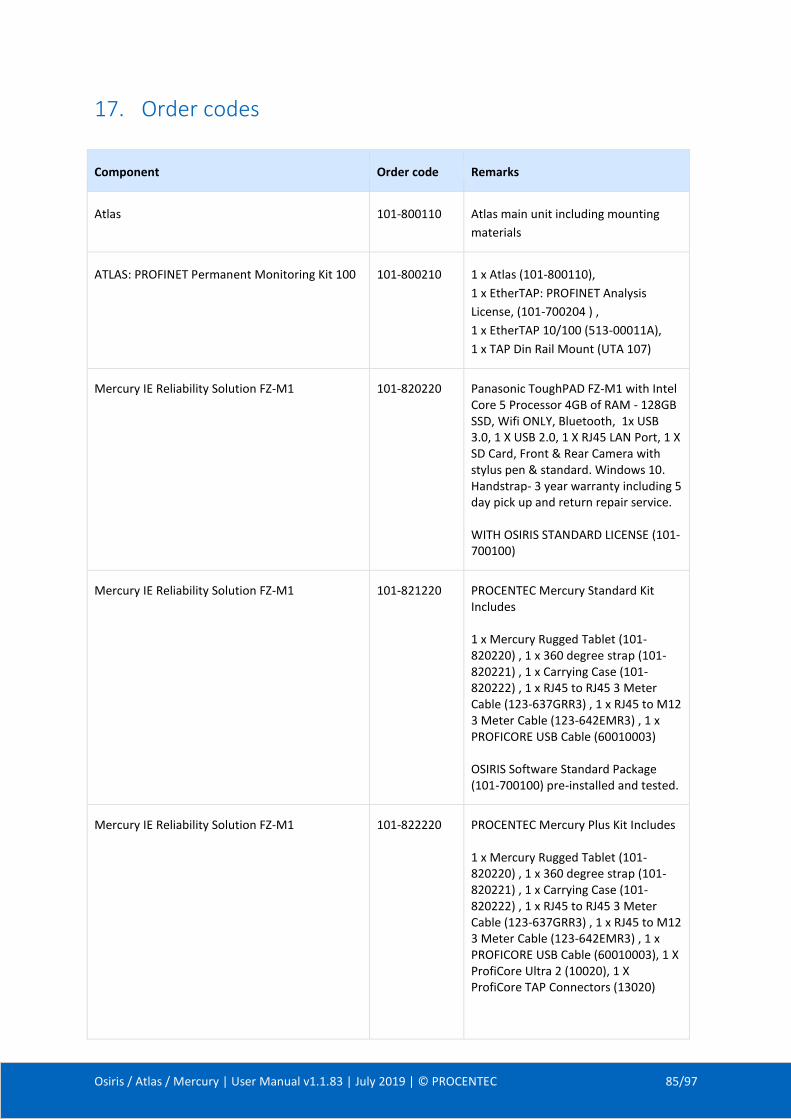
Osiris / Atlas / Mercury | User Manual v1.1.83 | July 2019 | © PROCENTEC 85/97
17. Order codes
Component Order code Remarks
Atlas 101-800110 Atlas main unit including mounting
materials
ATLAS: PROFINET Permanent Monitoring Kit 100 101-800210 1 x Atlas (101-800110),
1 x EtherTAP: PROFINET Analysis
License, (101-700204 ) ,
1 x EtherTAP 10/100 (513-00011A),
1 x TAP Din Rail Mount (UTA 107)
Mercury IE Reliability Solution FZ-M1
101-820220 Panasonic ToughPAD FZ-M1 with Intel Core 5 Processor 4GB of RAM - 128GB SSD, Wifi ONLY, Bluetooth, 1x USB 3.0, 1 X USB 2.0, 1 X RJ45 LAN Port, 1 X SD Card, Front & Rear Camera with stylus pen & standard. Windows 10. Handstrap- 3 year warranty including 5 day pick up and return repair service. WITH OSIRIS STANDARD LICENSE (101-700100)
Mercury IE Reliability Solution FZ-M1
101-821220
PROCENTEC Mercury Standard Kit Includes 1 x Mercury Rugged Tablet (101-820220) , 1 x 360 degree strap (101-820221) , 1 x Carrying Case (101-820222) , 1 x RJ45 to RJ45 3 Meter Cable (123-637GRR3) , 1 x RJ45 to M12 3 Meter Cable (123-642EMR3) , 1 x PROFICORE USB Cable (60010003) OSIRIS Software Standard Package (101-700100) pre-installed and tested.
Mercury IE Reliability Solution FZ-M1
101-822220
PROCENTEC Mercury Plus Kit Includes 1 x Mercury Rugged Tablet (101-820220) , 1 x 360 degree strap (101-820221) , 1 x Carrying Case (101-820222) , 1 x RJ45 to RJ45 3 Meter Cable (123-637GRR3) , 1 x RJ45 to M12 3 Meter Cable (123-642EMR3) , 1 x PROFICORE USB Cable (60010003), 1 X ProfiCore Ultra 2 (10020), 1 X ProfiCore TAP Connectors (13020)
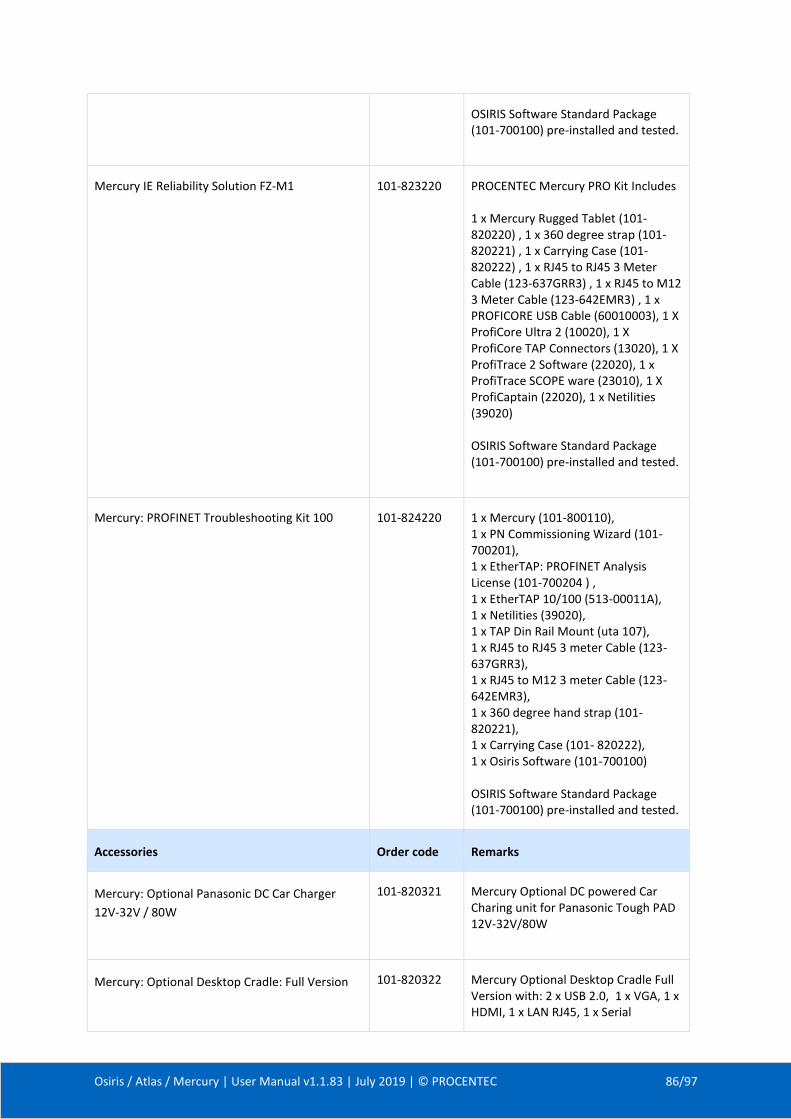
Osiris / Atlas / Mercury | User Manual v1.1.83 | July 2019 | © PROCENTEC 86/97
OSIRIS Software Standard Package (101-700100) pre-installed and tested.
Mercury IE Reliability Solution FZ-M1
101-823220
PROCENTEC Mercury PRO Kit Includes 1 x Mercury Rugged Tablet (101-820220) , 1 x 360 degree strap (101-820221) , 1 x Carrying Case (101-820222) , 1 x RJ45 to RJ45 3 Meter Cable (123-637GRR3) , 1 x RJ45 to M12 3 Meter Cable (123-642EMR3) , 1 x PROFICORE USB Cable (60010003), 1 X ProfiCore Ultra 2 (10020), 1 X ProfiCore TAP Connectors (13020), 1 X ProfiTrace 2 Software (22020), 1 x ProfiTrace SCOPE ware (23010), 1 X ProfiCaptain (22020), 1 x Netilities (39020) OSIRIS Software Standard Package (101-700100) pre-installed and tested.
Mercury: PROFINET Troubleshooting Kit 100 101-824220 1 x Mercury (101-800110), 1 x PN Commissioning Wizard (101-700201), 1 x EtherTAP: PROFINET Analysis License (101-700204 ) , 1 x EtherTAP 10/100 (513-00011A), 1 x Netilities (39020), 1 x TAP Din Rail Mount (uta 107), 1 x RJ45 to RJ45 3 meter Cable (123-637GRR3), 1 x RJ45 to M12 3 meter Cable (123-642EMR3), 1 x 360 degree hand strap (101-820221), 1 x Carrying Case (101- 820222), 1 x Osiris Software (101-700100) OSIRIS Software Standard Package (101-700100) pre-installed and tested.
Accessories Order code Remarks
Mercury: Optional Panasonic DC Car Charger
12V-32V / 80W
101-820321
Mercury Optional DC powered Car Charing unit for Panasonic Tough PAD 12V-32V/80W
Mercury: Optional Desktop Cradle: Full Version 101-820322 Mercury Optional Desktop Cradle Full Version with: 2 x USB 2.0, 1 x VGA, 1 x HDMI, 1 x LAN RJ45, 1 x Serial
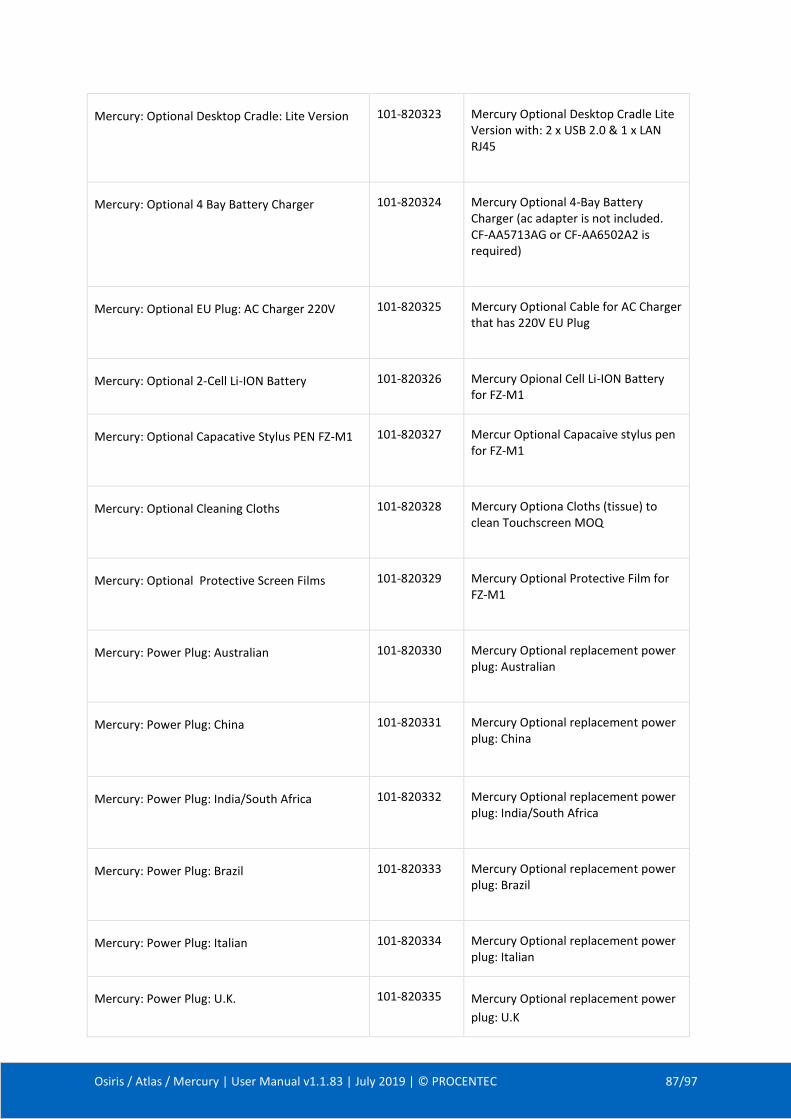
Osiris / Atlas / Mercury | User Manual v1.1.83 | July 2019 | © PROCENTEC 87/97
Mercury: Optional Desktop Cradle: Lite Version 101-820323
Mercury Optional Desktop Cradle Lite Version with: 2 x USB 2.0 & 1 x LAN RJ45
Mercury: Optional 4 Bay Battery Charger 101-820324
Mercury Optional 4-Bay Battery Charger (ac adapter is not included. CF-AA5713AG or CF-AA6502A2 is required)
Mercury: Optional EU Plug: AC Charger 220V 101-820325
Mercury Optional Cable for AC Charger that has 220V EU Plug
Mercury: Optional 2-Cell Li-ION Battery 101-820326
Mercury Opional Cell Li-ION Battery for FZ-M1
Mercury: Optional Capacative Stylus PEN FZ-M1 101-820327
Mercur Optional Capacaive stylus pen for FZ-M1
Mercury: Optional Cleaning Cloths 101-820328
Mercury Optiona Cloths (tissue) to clean Touchscreen MOQ
Mercury: Optional Protective Screen Films 101-820329
Mercury Optional Protective Film for FZ-M1
Mercury: Power Plug: Australian 101-820330
Mercury Optional replacement power plug: Australian
Mercury: Power Plug: China 101-820331
Mercury Optional replacement power plug: China
Mercury: Power Plug: India/South Africa 101-820332
Mercury Optional replacement power plug: India/South Africa
Mercury: Power Plug: Brazil 101-820333
Mercury Optional replacement power plug: Brazil
Mercury: Power Plug: Italian 101-820334
Mercury Optional replacement power plug: Italian
Mercury: Power Plug: U.K. 101-820335
Mercury Optional replacement power
plug: U.K

Osiris / Atlas / Mercury | User Manual v1.1.83 | July 2019 | © PROCENTEC 88/97
Mercury: Power Plug: US 101-820336
Mercury Optional replacement power plug: US

Osiris / Atlas / Mercury | User Manual v1.1.83 | July 2019 | © PROCENTEC 89/97
18. Certificates
Iso9001 certificate
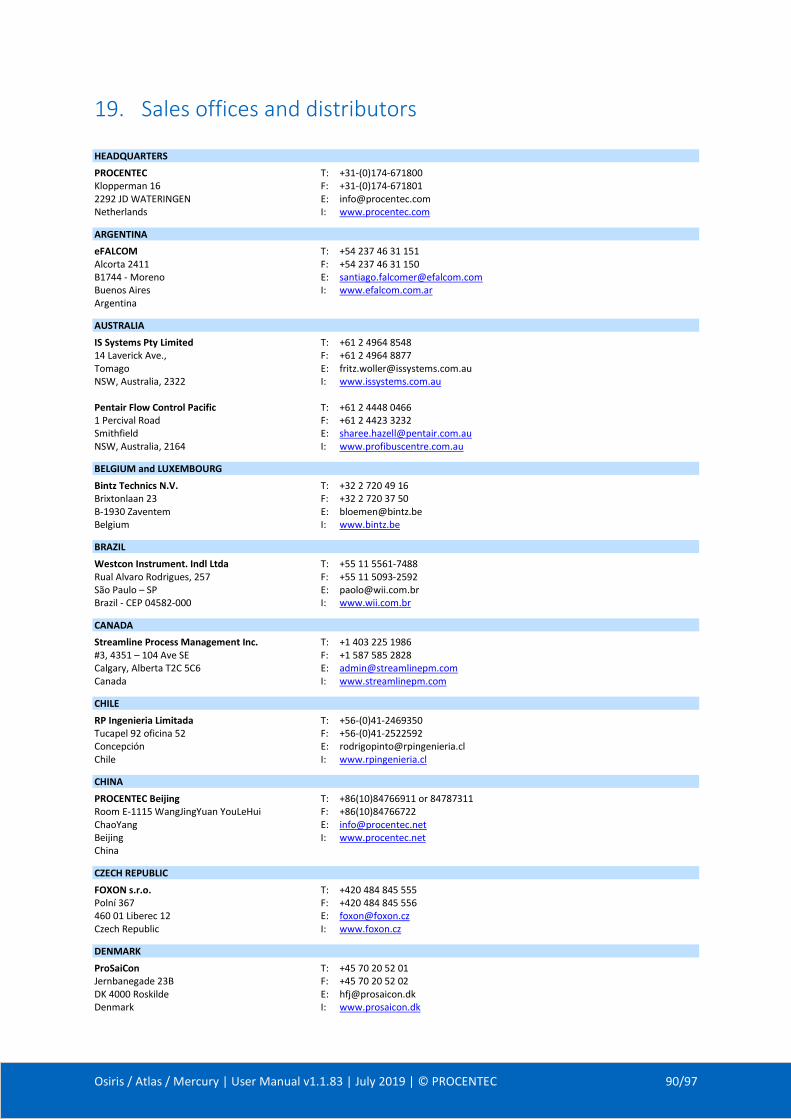
Osiris / Atlas / Mercury | User Manual v1.1.83 | July 2019 | © PROCENTEC 90/97
19. Sales offices and distributors
HEADQUARTERS
PROCENTEC T: +31-(0)174-671800 Klopperman 16 F: +31-(0)174-671801 2292 JD WATERINGEN E: [email protected] Netherlands I: www.procentec.com
ARGENTINA
eFALCOM T: +54 237 46 31 151 Alcorta 2411 F: +54 237 46 31 150 B1744 - Moreno E: [email protected] Buenos Aires I: www.efalcom.com.ar Argentina
AUSTRALIA
IS Systems Pty Limited T: +61 2 4964 8548 14 Laverick Ave., F: +61 2 4964 8877 Tomago E: [email protected] NSW, Australia, 2322 I: www.issystems.com.au Pentair Flow Control Pacific T: +61 2 4448 0466 1 Percival Road F: +61 2 4423 3232 Smithfield E: [email protected] NSW, Australia, 2164 I: www.profibuscentre.com.au
BELGIUM and LUXEMBOURG
Bintz Technics N.V. T: +32 2 720 49 16 Brixtonlaan 23 F: +32 2 720 37 50 B-1930 Zaventem E: [email protected] Belgium I: www.bintz.be
BRAZIL
Westcon Instrument. Indl Ltda T: +55 11 5561-7488 Rual Alvaro Rodrigues, 257 F: +55 11 5093-2592 São Paulo – SP E: [email protected] Brazil - CEP 04582-000 I: www.wii.com.br
CANADA
Streamline Process Management Inc. T: +1 403 225 1986 #3, 4351 – 104 Ave SE F: +1 587 585 2828 Calgary, Alberta T2C 5C6 E: [email protected] Canada I: www.streamlinepm.com
CHILE
RP Ingenieria Limitada T: +56-(0)41-2469350 Tucapel 92 oficina 52 F: +56-(0)41-2522592 Concepción E: [email protected] Chile I: www.rpingenieria.cl
CHINA
PROCENTEC Beijing T: +86(10)84766911 or 84787311 Room E-1115 WangJingYuan YouLeHui F: +86(10)84766722 ChaoYang E: [email protected] Beijing I: www.procentec.net China
CZECH REPUBLIC
FOXON s.r.o. T: +420 484 845 555 Polní 367 F: +420 484 845 556 460 01 Liberec 12 E: [email protected] Czech Republic I: www.foxon.cz
DENMARK
ProSaiCon T: +45 70 20 52 01 Jernbanegade 23B F: +45 70 20 52 02 DK 4000 Roskilde E: [email protected] Denmark I: www.prosaicon.dk
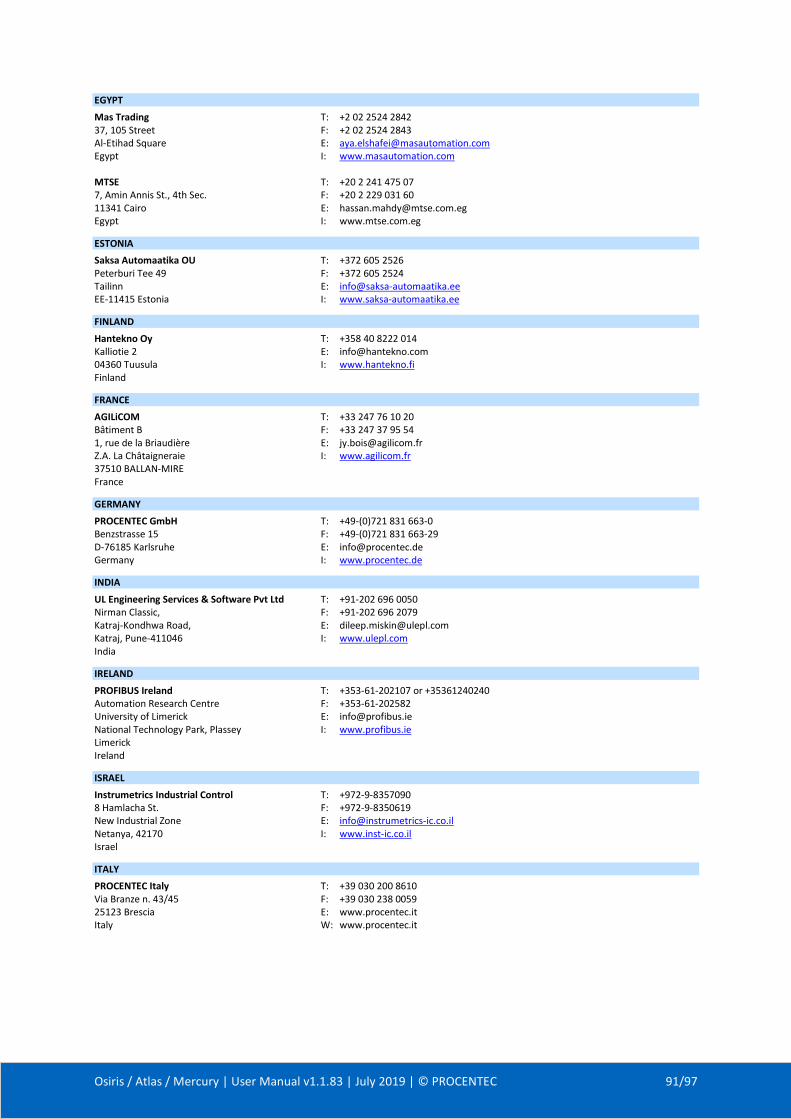
Osiris / Atlas / Mercury | User Manual v1.1.83 | July 2019 | © PROCENTEC 91/97
EGYPT
Mas Trading T: +2 02 2524 2842 37, 105 Street F: +2 02 2524 2843 Al-Etihad Square E: [email protected] Egypt I: www.masautomation.com MTSE T: +20 2 241 475 07 7, Amin Annis St., 4th Sec. F: +20 2 229 031 60 11341 Cairo E: [email protected] Egypt I: www.mtse.com.eg
ESTONIA
Saksa Automaatika OU T: +372 605 2526 Peterburi Tee 49 F: +372 605 2524 Tailinn E: [email protected] EE-11415 Estonia I: www.saksa-automaatika.ee
FINLAND
Hantekno Oy T: +358 40 8222 014 Kalliotie 2 E: [email protected] 04360 Tuusula I: www.hantekno.fi Finland
FRANCE
AGILiCOM T: +33 247 76 10 20 Bâtiment B F: +33 247 37 95 54 1, rue de la Briaudière E: [email protected] Z.A. La Châtaigneraie I: www.agilicom.fr 37510 BALLAN-MIRE France
GERMANY
PROCENTEC GmbH T: +49-(0)721 831 663-0 Benzstrasse 15 F: +49-(0)721 831 663-29 D-76185 Karlsruhe E: [email protected] Germany I: www.procentec.de
INDIA
UL Engineering Services & Software Pvt Ltd T: +91-202 696 0050 Nirman Classic, F: +91-202 696 2079 Katraj-Kondhwa Road, E: [email protected] Katraj, Pune-411046 I: www.ulepl.com India
IRELAND
PROFIBUS Ireland T: +353-61-202107 or +35361240240 Automation Research Centre F: +353-61-202582 University of Limerick E: [email protected] National Technology Park, Plassey I: www.profibus.ie Limerick Ireland
ISRAEL
Instrumetrics Industrial Control T: +972-9-8357090 8 Hamlacha St. F: +972-9-8350619 New Industrial Zone E: [email protected] Netanya, 42170 I: www.inst-ic.co.il Israel
ITALY
PROCENTEC Italy T: +39 030 200 8610 Via Branze n. 43/45 F: +39 030 238 0059 25123 Brescia E: www.procentec.it Italy W: www.procentec.it
Osiris / Atlas / Mercury | User Manual v1.1.83 | July 2019 | © PROCENTEC 92/97
JAPAN
TJ Group T: +81-3-6450-3739 C/O Japanese PROFIBUS Organisation F: +81-3-6450-3739 West World Building 4F E: [email protected] 3-1-6 Higashi-Gotanda, Shinagawa-ku, Tokyo, 141-0022 Japan
KOREA
Hi-PRO Tech. Co., Ltd. T: +82 82-31-216-2640 #2802, U-Tower, 1029 F: +82 82-31-216-2644 Youngduk-dong, Giheung-gu E: [email protected] Yongin-Si, Kyunggi-do, I: www.profibus.co.kr 446-908 Korea
LEBANON
Industrial Technologies S.A.L. (ITEC) T: +961 1 491161 Point Center, Boulevard Fouad Chehab F: +961 1 491162 Sin El Fil E: [email protected] Beirut I: www.iteclb.com Lebanon
MEXICO
Grid Connect Inc. T: +1 530-219-2565 (Spanish) E: [email protected] I: www.gridconnect.com
NETHERLANDS
PROCENTEC B.V. T: +31 (0)174 671800 Klopperman 16 F: +31 (0)174 671 801 2292 JD Wateringen E: [email protected] Netherlands I: www.procentec.com
NEW ZEALAND
Mantis Systems T: +643 455 6072 34 Glasgow St. F: +31 (0)174 671 801 Dunedis E: [email protected] New Zealand I: www.mantis-sys.co.nz
NIGERIA
PowerPro Company Limited T: +234 909 019 8004 DTN Complex, Off Lateef Jakande Road E: [email protected] Ikeja, Lagos I: www.powerpro.ng Nigeria
NORWAY
Nortelco Automation AS T: +47 22 57 61 00 Johan Scharffenbergs vei 95 E: [email protected] N-0694 Oslo I: www.nortelcoautomation.no Norway
PAKISTAN
OTC T: +92 42 3587 2667-9 Ext. 117 Suite No. 4, 1st Floor Liberty Heights F: +92 42 3587 2670 Main Boulevard Gulberg E: [email protected] Lahore - 54660 I: www.otc.com.pk Pakistan
PERU
ControlWare T: +51 1637 3735 Jr. Los Silicios 5409 F: +51 1528 0454 Los Olivos - L39 E: [email protected] Peru I: www.controlware.com.pe
POLAND
INTEX Sp. z o.o. T: +48 32 230 75 16 ul. Portowa 4 F: +48 32 230 75 17 44-102 Gliwice E: [email protected] Poland I: www.intex.com.pl
Osiris / Atlas / Mercury | User Manual v1.1.83 | July 2019 | © PROCENTEC 93/97
ROMANIA
S.C. SVT Electronics S.R.L. T: +40 365 809 305 Brǎila 7 F: +40 365 809 305 540331 Tg-Mure E: [email protected] Romania I: www.svt.ro
SAUDI ARABIA
ASM Process Automation T: +966 2 691 2741 Al-Zahra Dist. – Attas st. F: +966 2 682 8943 cross section with helmy Kutby St. E: [email protected] Villa no.25 I: www.asmestablishment.com Jeddah-21553 Saudi Arabia
SINGAPORE / SOUTH EAST ASIA
Allegro Electronics T: +65 628 780 63 236 Serangoon Avenue 3 07-98 E: [email protected] Singapore 550236 I: www.allegro.com.sg Gissmatic Automatisierung Pte Ltd T: +65 900 912 76 318 Tanglin Road 01-34 E: [email protected] Singapore 247979 I: www.gissmatic.com
SOUTH AFRICA
IDX ONLINE CC T: +27(11) 548 9960 1 Weaver Street F: +27(11) 465-8890 Fourways E: [email protected] Johannesburg I: www.idxonline.com South Africa - 2191
SPAIN
LOGITEK, S.A T: +34 93 588 6767 Ctra. de Sant Cugat, 63 Esc. B Planta 1ª E: [email protected] Rubí (BARCELONA), 08191 I: www.logitek.es Spain
SWEDEN
P&L Nordic AB T: +46 451 74 44 00 Box 252 F: +46 451 89 833 S-281 23 Hässleholm E: [email protected] Sweden I: www.pol.se/profibus
SWITZERLAND
EME AG T: +41 44 982 11 11 Lohwisstrasse 50 E: [email protected] CH-8123 Ebmatingen I: www.eme.ch
Switzerland
TAIWAN
Orion Eneergy Technology T: +886 9 370 270 96 3F, No. 2, Aly. 6, Ln. 109, Sec. 2, Huanshan Rd. E: [email protected] Neihu District, Tapei City 114, Taiwan
TURKEY
Emikon Otomasyon T: +90 216 420 8347 DES Sanayi sitesi 103 sokak F: +90 216 420 8348 B-7 blok No:16 Yukari Dudullu / Umraniye E: [email protected] Istanbul 34776 I: www.emikonotomasyon.com Turkey
UNITED ARAB EMIRATES
Synergy Controls T: +971 4 3262692 907, IT Plaza Silicon Oasis : F: +971 4 3262693 DubaiI E: [email protected] United Arab Emirates
Osiris / Atlas / Mercury | User Manual v1.1.83 | July 2019 | © PROCENTEC 94/97
UNITED KINGDOM and N. Ireland
Hi-Port Software T: +44 (0)8452 90 20 30 The Hub 2 Martin Close F: +44 (0)2392 552880 Lee-on-Solent E: [email protected] Hampshire PO13 8LG I: www.hiport.co.uk United Kingdom iTech T: +44 (0)1292 311 613 Unit 1 F: +44 (0)1292 311 578 Dukes Road E: [email protected] Troon I: www.itech-troon.co.uk Ayrshire KA10 6QR United Kingdom Parkelect Ltd. T: +44 2890 777743 84 Dargan Road F: +44 2890 777794 Belfast E: [email protected] BT3 9JU I: www.parkelect.co.uk N. Ireland
UNITED STATES
Grid Connect Inc. T: +1 630 245-1445 1630 W. Diehl Road F: +1 630 245-1717 Naperville, Illinois 60563 E: [email protected] USA I: www.gridconnect.com/procentec.html
VIETNAM
Bavitech Corporation T: +84-8-3547 0976 42 Truong Son Street F: +84-8-3547 0977 Ward 2, Tan Binh District E: [email protected] Ho Chi Minh City I: www.bavitech.com Vietnam
For the complete list of our Sales Offices and Distributors see www.procentec.com/company/distributors.
If your country or region is not listed, please contact us. We are still searching for distributors who can cover complete areas or countries.

Osiris / Atlas / Mercury | User Manual v1.1.83 | July 2019 | © PROCENTEC 95/97
20. About PROCENTEC
PROCENTEC are an independent Dutch company that supply products, training and consultancy to
the Industrial Automation Market. Of primary focus is the development and manufacturing of
automation products for PROFIBUS, PROFINET and Industrial Ethernet.
Some of our products are the most recognized solutions on the Market today. ProfiTrace, our mobile
troubleshooting and maintenance tool has established itself as one of the most pioneering, yet essential tools
available to engineers. In contrast our robust ProfiHub has, over the last decade, established itself as the go-to
solution for ensuring a reliable network infrastructure. The combination of these products within
our ComBricks solution has seen PPROCENTEC become the primary manufacturer of network components with
the integrated capability for remote monitoring and remote asset-management.
Our training facility, the PROCENTEC Academy, has certified over 4000 engineers to implement and maintain
their PROFIBUS and PROFINET networks to the highest standards available.
The PROCENTEC Competence Centre has established itself as the leading consultancy on PROFIBUS and
PROFINET projects worldwide, advising on architecture, engineering, training and commissioning. Once a
network is commissioned, we have experts available 24/7, to answer questions with maintenance or help
troubleshooting a problem.
Products Services Training • Atlas and Mercury • On-site & Online Support • PROFIBUS training courses
• ComBricks • Network Audit • PROFINET training courses
• ProfiHub • Network Certification • Product training courses
• ProfiTrace • Consultancy
• VPSwitch • Testlab & Democenter
• VPGate • Competence Center
• PROFINET tools
• Cables & Connectors

Osiris / Atlas / Mercury | User Manual v1.1.83 | July 2019 | © PROCENTEC 96/97
21. Notes
PROCENTEC BV
Klopperman 16
2292 JD Wateringen
The Netherlands
T: +31 (0)174 671 800
F: +31 (0)174 671 801
W: www.procentec.com
Related Documents