INITIATING COVERAGE BOB Capital Markets Ltd is a wholly owned subsidiary of Bank of Baroda Important disclosures, including any required research certifications, are provided at the end of this report. SELL TP: Rs 2,080 | 18% INFO EDGE | IT Services | 12 March 2020 On a slippery slope – initiate with SELL We begin coverage on Info Edge (INFOE) with SELL and a Mar’21 TP of Rs 2,080. INFOE’s mainstay Naukri business (>70% revenue share) faces a structural threat to leadership in the online jobs market from Microsoft-backed LinkedIn. Over FY14- FY19, LinkedIn has clocked an 18% CAGR in user base vs. 11% for Naukri, backed by a unique networking proposition and high innovation spends. Profitability looks elusive in property portal 99acres as well. We expect INFOE’s revenue/adj. PAT CAGR to slow to 14%/4% (FY20-FY22) and thus find core P/E rich at 54x FY22E. Ruchi Burde Ticker/Price INFOE IN/Rs 2,548 Market cap US$ 4.3bn Shares o/s 123mn 3M ADV US$ 9.4mn 52wk high/low Rs 3,130/Rs 1,777 Promoter/FPI/DII 40%/36%/23% Source: NSE STOCK PERFORMANCE Source: NSE Structural threat to Naukri: INFOE is a clear leader among online job listing platforms in India with 85% market share at Naukri.com (ex-LinkedIn). But we believe an inability to evolve beyond job listings puts Naukri at serious risk of competitive headwinds – reminiscent of the decline at erstwhile US market leader Monster.com post LinkedIn’s entry. Our view is premised on (1) LinkedIn’s clear edge as a professional networking platform (vs. a plain vanilla job listing portal), (2) its steady user base growth in India (at nearly double Naukri’s run-rate for FY14-FY19), and (3) parent Microsoft’s deep pockets for product innovation. Elusive profitability in 99acres: INFOE’s portal 99acres.com is also the No. 1 property platform in India, but persistent weakness in the residential property market and stiff competition – marked by a narrowing traffic-share lead over the second-largest peer – hinder predictable, profitable growth. In 9MFY20, 99acres posted EBITDA of ~Rs 90mn. We expect future profitability to be elusive as rising competition from MagicBricks.com and Housing.com drive up advertising and marketing spends moving into FY21. Initiate with SELL: We bake in a 330bps EBITDA margin slide and a 4% CAGR in adj. PAT at INFOE over FY20-FY22 as competition and macro weakness crimp growth. Naukri and 99acres comprise ~63% of our SOTP-based TP of Rs 2, 080. KEY FINANCIALS Y/E 31 Mar FY18A FY19A FY20E FY21E FY22E Total revenue (Rs mn) 9,155 10,982 12,776 14,591 16,599 EBITDA (Rs mn) 2,973 3,414 4,500 4,872 5,299 Adj. net profit (Rs mn) 2,737 3,152 3,862 3,865 4,153 Adj. EPS (Rs) 22.3 25.6 31.4 31.4 33.8 Adj. EPS growth (%) 31.4 15.2 22.5 0.1 7.5 Adj. ROAE (%) 13.4 14.2 15.9 14.4 13.9 Adj. P/E (x) 114.4 99.4 81.1 81.0 75.4 EV/EBITDA (x) 105.2 91.6 69.5 63.9 58.1 Source: Company, BOBCAPS Research 760 1,230 1,700 2,17 0 2,640 3,110 Mar-17 Jun-17 Sep-17 Dec-17 Mar-18 Jun-18 Sep-18 Dec-18 Mar-19 Jun-19 Sep-19 Dec-19 Mar-20 (Rs) INFOE [email protected]

Welcome message from author
This document is posted to help you gain knowledge. Please leave a comment to let me know what you think about it! Share it to your friends and learn new things together.
Transcript

INITIATING COVERAGE
BOB Capital Markets Ltd is a wholly owned subsidiary of Bank of Baroda
Important disclosures, including any required research certifications, are provided at the end of this report.
SELL
TP: Rs 2,080 | 18% INFO EDGE | IT Services | 12 March 2020
On a slippery slope – initiate with SELL
We begin coverage on Info Edge (INFOE) with SELL and a Mar’21 TP of Rs 2,080.
INFOE’s mainstay Naukri business (>70% revenue share) faces a structural threat
to leadership in the online jobs market from Microsoft-backed LinkedIn. Over FY14-
FY19, LinkedIn has clocked an 18% CAGR in user base vs. 11% for Naukri, backed
by a unique networking proposition and high innovation spends. Profitability looks
elusive in property portal 99acres as well. We expect INFOE’s revenue/adj. PAT
CAGR to slow to 14%/4% (FY20-FY22) and thus find core P/E rich at 54x FY22E.
Ruchi Burde
Ticker/Price INFOE IN/Rs 2,548
Market cap US$ 4.3bn
Shares o/s 123mn
3M ADV US$ 9.4mn
52wk high/low Rs 3,130/Rs 1,777
Promoter/FPI/DII 40%/36%/23%
Source: NSE
STOCK PERFORMANCE
Source: NSE
Structural threat to Naukri: INFOE is a clear leader among online job listing
platforms in India with 85% market share at Naukri.com (ex-LinkedIn). But we
believe an inability to evolve beyond job listings puts Naukri at serious risk of
competitive headwinds – reminiscent of the decline at erstwhile US market leader
Monster.com post LinkedIn’s entry. Our view is premised on (1) LinkedIn’s clear
edge as a professional networking platform (vs. a plain vanilla job listing portal),
(2) its steady user base growth in India (at nearly double Naukri’s run-rate for
FY14-FY19), and (3) parent Microsoft’s deep pockets for product innovation.
Elusive profitability in 99acres: INFOE’s portal 99acres.com is also the No. 1
property platform in India, but persistent weakness in the residential property
market and stiff competition – marked by a narrowing traffic-share lead over
the second-largest peer – hinder predictable, profitable growth. In 9MFY20,
99acres posted EBITDA of ~Rs 90mn. We expect future profitability to be
elusive as rising competition from MagicBricks.com and Housing.com drive up
advertising and marketing spends moving into FY21.
Initiate with SELL: We bake in a 330bps EBITDA margin slide and a 4% CAGR
in adj. PAT at INFOE over FY20-FY22 as competition and macro weakness crimp
growth. Naukri and 99acres comprise ~63% of our SOTP-based TP of Rs 2,080.
KEY FINANCIALS
Y/E 31 Mar FY18A FY19A FY20E FY21E FY22E
Total revenue (Rs mn) 9,155 10,982 12,776 14,591 16,599
EBITDA (Rs mn) 2,973 3,414 4,500 4,872 5,299
Adj. net profit (Rs mn) 2,737 3,152 3,862 3,865 4,153
Adj. EPS (Rs) 22.3 25.6 31.4 31.4 33.8
Adj. EPS growth (%) 31.4 15.2 22.5 0.1 7.5
Adj. ROAE (%) 13.4 14.2 15.9 14.4 13.9
Adj. P/E (x) 114.4 99.4 81.1 81.0 75.4
EV/EBITDA (x) 105.2 91.6 69.5 63.9 58.1
Source: Company, BOBCAPS Research
7601,2301,7002,1702,6403,110
Mar-17
Jun-
17Se
p-17
Dec
-17
Mar-18
Jun-18
Sep-
18Dec
-18
Mar-19
Jun-
19Sep
-19
Dec
-19
Mar-2
0
(Rs) INFOE
INFO EDGE
EQUITY RESEARCH 2 12 March 2020
Contents
Focus charts ................................................................................................. 3
Challenges on all fronts ............................................................................... 4
Naukri – structural threat to leadership ................................................................. 4
99acres – elusive profitability ............................................................................... 15
Jeevansathi – poor prospects ................................................................................. 17
Rising competition to subdue earnings ................................................................. 19
Investee companies – exit strategy holds key ...................................................... 19
Valuation methodology ............................................................................... 21
Key risks ..................................................................................................... 22
Annexure A ................................................................................................ 23

INFO EDGE
EQUITY RESEARCH 3 12 March 2020
Focus charts
FIG 1 – NAUKRI’S JOBSEEKER BASE INCREASED AT 11%
CAGR OVER THE LAST SIX YEARS
FIG 2 – LINKEDIN COMPOUNDED ITS SUBSCRIBER
BASE AT 18% CAGR OVER THE SAME PERIOD
Source: Company, BOBCAPS Research Source: Company, BOBCAPS Research
FIG 3 – PRODUCT INNOVATION & ENHANCEMENTS
LAG AT NAUKRI
FIG 4 – LINKEDIN DISLODGED MONSTER.COM AS
USA MARKET LEADER IN ONLINE RECRUITMENT
Parameters LinkedIn Naukri
R&D investments
Capex and M&A
User experience enhancement
Recruiter experience enhancement
New product/services rollout
Overall score
Source: BOBCAPS Research |
Source: Company, BOBCAPS Research
FIG 5 – AGGRESSIVE ADVERTISING SPEND BY PEERS
OF 99ACRES FIG 6 – EXPECT REVENUE GROWTH MODERATION AT
INFOE TO WEIGH ON OPERATING MARGINS
Competitive intensity based on
marketing spends by competitors Q4 FY19
Q1 FY20
Q2 FY20
Q3 FY20
MagicBricks
Housing
CommonFloor
Source: Company, BOBCAPS Research Source: Company, BOBCAPS Research
Aggressive Moderate Low
37
6367
0
20
40
60
80
Mar-14 Mar-19 Dec-19
(Jobseekers
in mn)Naukri (Resume)
24
5562
0
20
40
60
80
Mar-14 Mar-19 Dec-19
(Subscribers
in mn)LinkedIn (Subscribers)
707 638407 422 485 463 446 437 413
26 6188 177
354619
942
1,334
1,846
0
500
1,000
1,500
2,000
2,500
CY07 CY08 CY09 CY10 CY11 CY12 CY13 CY14 CY15
(US$ mn) North America revenue
Monster LinkedIn
32.5
31.1
35.2
33.4
31.9
30
31
32
33
34
35
36
FY18 FY19 FY20E FY21E FY22E
EBITDA margin(%)

INFO EDGE
EQUITY RESEARCH 4 12 March 2020
Challenges on all fronts
Naukri – structural threat to leadership
INFOE’s cash cow Naukri.com (72% revenue share in FY19) remains the
undisputed leader among job listing peers – Monster India, TimesJobs, Shine and
Indeed. However, we believe LinkedIn’s steady progress in India poses a structural
challenge to Naukri’s leadership, given (1) LinkedIn’s unmatched edge as a
professional networking platform, (2) its steady user base expansion in India (at
21% CAGR vs. 12% for Naukri over FY14-FY19), and (3) deep pockets for
product innovation backed by parent Microsoft.
Naukri currently dominates the mass hiring segment (candidates with 2-10 years
of experience) and LinkedIn leads in senior executive recruitment. While we
expect both players to coexist in the medium-to-long term, we model for a steep
slowdown in revenue growth at Naukri to 13.1% CAGR over FY20-FY22 vs. 16.9%
in 9MFY20 and 17.5% in FY19.
FIG 7 – EXPECT COMPETITIVE STRESS TO TAKE A TOLL
ON REVENUE FIG 8 – BILLING GROWTH FELL TO 8.5% IN Q3FY20 –
LOWEST SINCE DISCLOSURES BEGAN IN Q1FY15
Source: Company, BOBCAPS Research Source: Company, BOBCAPS Research
Business model losing sheen
Naukri pioneered online job listings in India and successfully leveraged its first-
mover advantage to secure market leadership. A concurrent increase in internet
penetration in India and shift of recruitment advertising from print to online led to
a 16.7% revenue CAGR for Naukri over FY10-FY19. The company’s consistent
investment in sales & marketing efforts and IP creation continue to support 85%+
market share (excluding LinkedIn) among traditional job listing portals such as
Monster India, TimesJobs, Shine and Indeed.
11.4
17.5 15.5
13.4 12.8
10
12
14
16
18
FY18 FY19 FY20 FY21 FY22
(%) Naukri revenue, YoY growth
21.3
11.1
12.3
12.8
12.3 14.0
13.2
9.1
15.4
25.8
18.6 20.1
19.8
14.0
8.5
0
5
10
15
20
25
30
0
500
1,000
1,500
2,000
2,500
3,000
Jun-16
Sep
-16
Dec
-16
Mar-1
7
Jun-17
Sep
-17
Dec
-17
Mar-1
8
Jun-18
Sep
-18
Dec
-18
Mar-1
9
Jun-19
Sep
-19
Dec
-19
(%)(Rs mn) Naukri billing YoY growth (R)
Inability to evolve beyond job
listings leaves Naukri
vulnerable to competition

INFO EDGE
EQUITY RESEARCH 5 12 March 2020
FIG 9 – 85%+ MARKET SHARE EXCLUDING LINKEDIN FIG 10 – EXTENSIVE SALES PRESENCE IN INDIA
Overall traffic (from desktops, web mobile& app) on time spent
Source: Company, SimilarWeb, BOBCAPS Research | Above chart excludes
LinkedIn since much of the traffic may not pertain to jobs Source: Company, BOBCAPS Research | 3,041 sales staff as at end-Dec’19
However, we believe Naukri’s business model could lose its sheen as non-
traditional peer LinkedIn, backed by Microsoft, builds muscle in India. In our view,
LinkedIn India’s rapidly growing userbase has reached critical mass (62mn vs.
67mn jobseekers on Naukri) and now poses a serious risk to the incumbent leader.
Steady inroads by LinkedIn in India
Despite a late start in India in 2009 as against Naukri’s launch in 1997, LinkedIn
has made steady inroads into India over the last five years – building its second
largest market by user base after the US. Over FY14-FY19, LinkedIn has
expanded its customer base at 18% CAGR vs. 11% for Naukri, with user additions
of 38mn (vs. 30mn) during FY14-9MFY20. At the same pace of growth, we
estimate that the professional networking player will surpass Naukri’s user base
over the next two years.
FIG 11 – NAUKRI’S JOBSEEKER BASE INCREASED AT
11% CAGR OVER THE LAST SIX YEARS FIG 12 – LINKEDIN COMPOUNDED ITS SUBSCRIBER
BASE AT 18% CAGR OVER THE SAME PERIOD
Source: Company, BOBCAPS Research Source: Company, BOBCAPS Research
37
6367
0
20
40
60
80
Mar-14 Mar-19 Dec-19
(Jobseekers
in mn)Naukri (Resume)
24
5562
0
20
40
60
80
Mar-14 Mar-19 Dec-19
(Subscribers
in mn)LinkedIn (Subscribers)
LinkedIn expanding user base
faster than incumbent
Info Edge sales offices illustrative map

INFO EDGE
EQUITY RESEARCH 6 12 March 2020
FIG 13 – SIMILARLY, NAUKRI’S REVENUE GREW AT 16%
CAGR OVER FY14-FY18… FIG 14 – …AND LINKEDIN INDIA’S REVENUE GREW AT
43% CAGR OVER SAME PERIOD
Source: Company, BOBCAPS Research Source: RoC, Company, BOBCAPS Research
Social networking – a moat for LinkedIn…
Both Naukri and LinkedIn centre their business around jobseekers and employers,
enabling users to look for employment and employers to shortlist suitable
candidates. Despite this similarity, the founding premise of both platforms is
radically different. Naukri was founded with the objective of organising job listings
and resumes on an online platform, while LinkedIn’s vision was to build a
professional social network. Thus, both players have created vastly different
products for the same end-use, targeting the same category of users.
LinkedIn’s job classifieds-cum-social network proposition offers enhanced value to
platform users, empowering them to develop a professional network. This
distinguishing feature yields a clear edge over mere job listing platforms, including
Naukri, as it amplifies the ‘network’ effect – crucial for the success of internet
businesses. At LinkedIn, each new subscriber adds value to corporates (more
candidates to choose from) as well as jobseekers (opportunity to expand
connections).
Further, LinkedIn’s sales and marketing solutions offer significant benefits to
corporate users, adding to the network effect and opening up new monetisation
channels to tap into the advertising budgets of enterprise clients. The social
networking model also creates an entry barrier for new professional network start-
ups as well as a barrier to exit for subscribers/users, adding to the company’s
sustainable moat.
3,7204,449
5,312 6,0046,688
9.8
19.6
19.4
13.011.4
0
5
10
15
20
25
0
2,000
4,000
6,000
8,000
FY14 FY15 FY16 FY17 FY18
(%)(Rs mn)Naukri
Revenue YoY growth (R)
1,307
2,517
3,678
4,573
5,471
91.8 92.6
46.1
24.3 19.6
0
50
100
150
0
2,000
4,000
6,000
FY14 FY15 FY16 FY17 FY18
(%)(Rs mn)
LinkedIn India
Revenue YoY growth (R)
Social networking creates a
wide moat and competitive
advantage for LinkedIn
INFO EDGE
EQUITY RESEARCH 7 12 March 2020
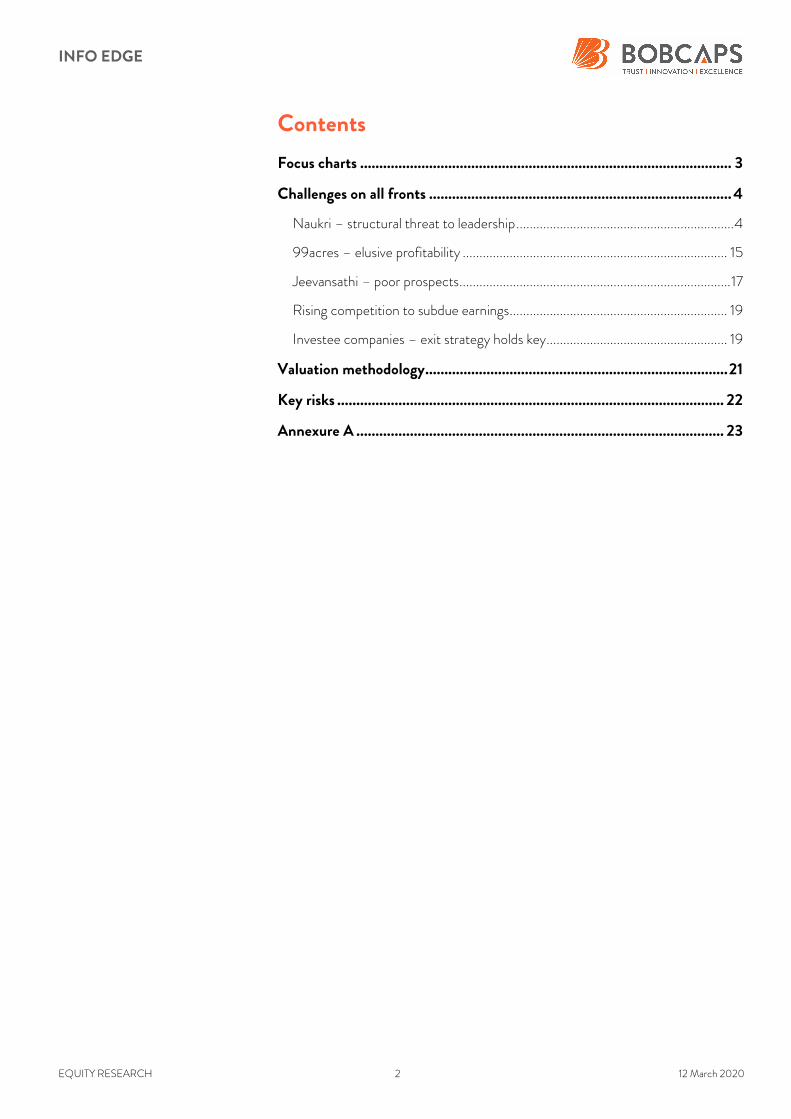
FIG 15 – ADVANTAGES OF A PROFESSIONAL NETWORK OVER JOB LISTINGS
Source: Company, BOBCAPS Research
…a miss for Naukri
In contrast, Naukri has had limited success enhancing the network effect as
services on the platform remain confined to recruitment or talent solutions.
Organised listings of this nature served well when the internet was gaining ground
and jobseekers began moving their job search online. But in today’s era of
widespread social media connections, job classifieds alone are unlikely to engage or
retain users.
In response to the changing market dynamics, INFOE did launch Brijj.com – a
professional networking platform – in Aug’07. But this business failed to scale up
despite the company’s leadership in the online recruitment advertising industry
and its large cache of jobseekers. Brijj.com was eventually wound up.
FIG 16 – LINKEDIN VS. NAUKRI
Particulars Naukri LinkedIn (India)
No. of users (as at end-Dec’19)
67mn 62mn+
No. of companies (as at end-Dec’19)
59,265 (paying clients)
557,000+ (companies with a presence on the site)
Jobs ~500,000 ~500,000 (weekly active jobs)
Services
Talent solutions Talent solutions
NA Marketing solutions
NA Sales solutions
NA Learning solutions
Talent solution product
Job posting services Job posting services
Resume database access (Resdex) Recruiter / Recruiter lite (access to jobseekers)
Naukri
Morecorporates & recruiters
Morejobs
More jobseekers
Moretraffic
More user engagement
Morecontent
More data& analyticservices
More corporates
Moreconnections
Morejobs
More professionals
MoretrafficNetwork
effect
Naukri unable to fully tap
into the network effect due to
its limited talent solution

INFO EDGE
EQUITY RESEARCH 8 12 March 2020
Particulars Naukri LinkedIn (India)
NA* Talent insights (analytics service)
Assisted search Pipeline builder
Employer branding solution Career pages / Work with us ads
Recruitment management system NA
Employee referral NA
User features
Job listing platform Professional network
NA Professional content
No networking opportunity Empowers users
Takes effort to locate relevant job More relevant opportunities
Type of users Active jobseekers Active jobseekers
NA Non-jobseekers
Usage High during job search, Low in other situations
More frequent
Cost of switching Nil Loss of professional network, recommendations, testimonials, etc.
Source: Company, BOBCAPS Research | *INFOE did publish two Naukri Trend reports for Q1 and Q2FY20 on an
experimental basis, whereas LinkedIn’s Talent Insight service offers biannual bespoke data-driven talent insights
Naukri’s business moat vulnerable to LinkedIn juggernaut
Naukri.com is currently the platform of choice for bulk hiring in India. Its products
(Resdex, Job Postings) make it a cost-efficient proposition for this market
segment in comparison to LinkedIn – the cheapest comparable LinkedIn hiring
solution, Recruiter Lite, offers only 30 InMail credits for US$ 9.99/month (i.e. 30
direct messages by recruiters to LinkedIn members they’re not connected to).
As per our channel checks, the contact details of prospective jobseekers available
with Naukri’s Resdex solution help generate quick responses for recruiters –
serving to augment the platform’s popularity for mass hiring. In contrast, LinkedIn’s
products offer selective access at premium prices to members through InMail.
Thus, whereas Naukri is the leader in mass recruitment, LinkedIn’s product
positioning has helped it become a leader in India’s executive hiring market
(candidates with 10 years of experience and above). But as both players cater to
the same target groups of jobseekers and employers, an eventual face-off appears
inevitable – one we believe Naukri’s moats will prove unequal to counter given
LinkedIn’s innovative products, aggressive marketing and track record of
market disruption.

INFO EDGE
EQUITY RESEARCH 9 12 March 2020
FIG 17 – BASIC RESDEX PRODUCT STARTS FROM RS 4,000
Source: Company, BOBCAPS Research | Note: Above prices as on 20 Feb 2020
LinkedIn has a track record of disrupting the market
LinkedIn’s steady expansion in India is worrisome for Naukri, especially against the
backdrop of its disruptive impact on incumbent leaders in other markets such as
the US (Monster.com) and Australia (Seek.com).
Case study 1: Monster.com and LinkedIn
US-based Monster.com listed in 1996 and was a pioneer of the job search website,
the online resume database and the job alerts concept – it stood at the top of the
US online recruitment classifieds market for more than a decade. However, an
inability to evolve in tandem with fast-changing internet trends took a toll on
business – North America revenue and operating profits declined at a 6.5% and
13.3% CAGR respectively over CY07-CY15, while LinkedIn’s innovative networking
model enabled it to become the jobs marketplace of choice, reporting a 71% North
America revenue CAGR over the same period.
FIG 18 – LINKEDIN DISLODGED MONSTER.COM AS
USA MARKET LEADER IN ONLINE RECRUITMENT FIG 19 – N. AMERICA REVENUE FELL AT –6.5% CAGR AT
MONSTER (CY07-CY15) VS. +71% GROWTH AT LINKEDIN
Source: Company, BOBCAPS Research Source: Company, BOBCAPS Research
707 638407 422 485 463 446 437 413
26 6188 177
354619
942
1,334
1,846
0
500
1,000
1,500
2,000
2,500
CY07 CY08 CY09 CY10 CY11 CY12 CY13 CY14 CY15
(US$ mn) North America revenue
Monster LinkedIn
14045
100100
7552
4238
7(10)
(36)
415
(5)(4)(2)(5)
(50) 0 50 100 150
CY07
CY08
CY09
CY10
CY11
CY12
CY13
CY14
CY15
(%)
North America revenue, YoY change
Monster LinkedIn
Naukri’s predicament
reminiscent of erstwhile US
leader Monster.com

INFO EDGE
EQUITY RESEARCH 10 12 March 2020
Case study 2: Seek.com and LinkedIn
Over the last decade, Australia’s No. 1 online employment marketplace SEEK
invested in several similar assets across the globe (employment platforms in 18
countries globally with market leading positions in 14 of these). In FY19,
international business accounted for 64% of revenues, cushioning SEEK against
the slow and volatile growth in its domicile Australian and New Zealand markets. In
both markets, SEEK holds a leadership position with a total of ~13.2mn profiles vs.
~10mn profiles on Linkedin. The company commands pricing power on the back
of its market leadership, but increasing competition has impaired pricing growth.
FIG 20 – SEEK: HIGHER COMPETITION SLOWED GROWTH IN NATIVE
MARKET
Source: Company, BOBCAPS Research | Note: ANZ = Australia & New Zealand
FIG 21 – SEEK’S ONLINE EMPLOYMENT MARKETPLACE LEADS IN 14 OF 18
COUNTRIES: DIVERSIFICATION CUSHIONS HOME MARKET CHALLENGES
Source: Company, BOBCAPS Research
49.9 47.3
35.5
(10.1)
1.1
29.7
10.6
(5.2)2.3
13.7 14.6 14.0 16.06.2
(20)
0
20
40
60
FY06 FY07 FY08 FY09 FY10 FY11 FY12 FY13 FY14 FY15 FY16 FY17 FY18 FY19
(%) SEEK - ANZ employment revenue growth (Local currency)
Seek’s pricing power in home
markets has been dented by
INFO EDGE
EQUITY RESEARCH 11 12 March 2020
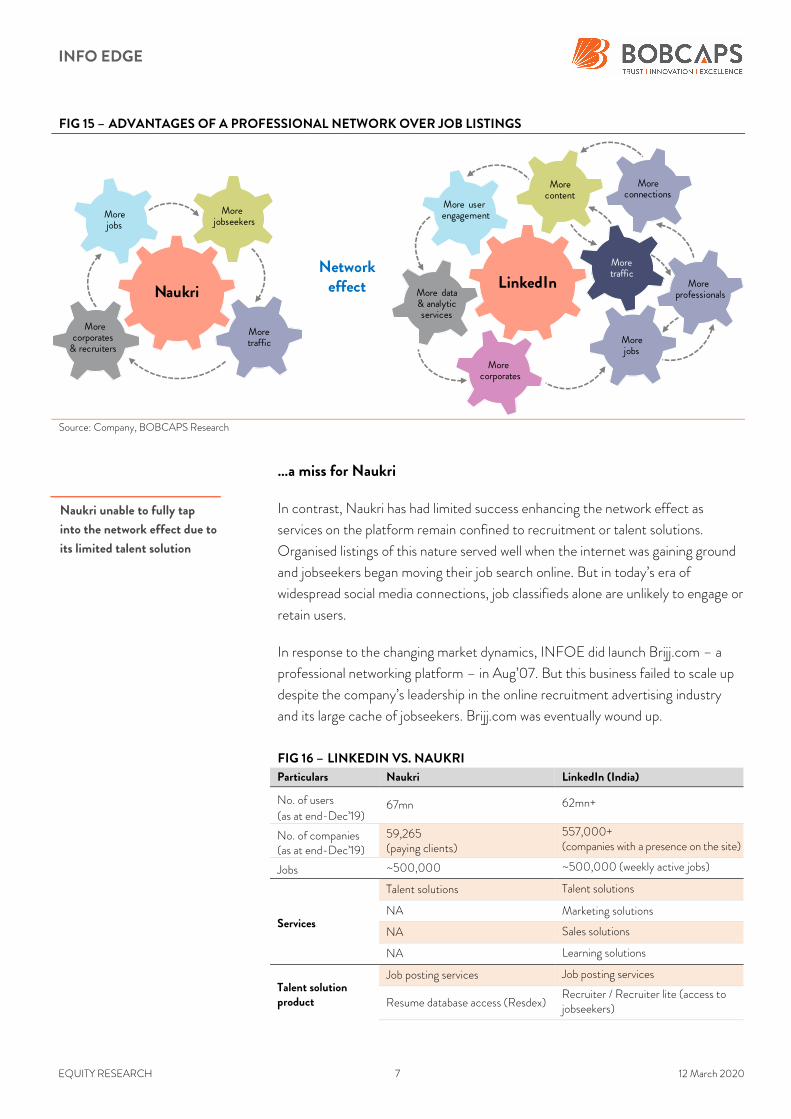
Parent Microsoft’s deep pockets for innovation difficult to match
In the fast-evolving technology space, R&D spend on product/service upgrades
and innovation as well as the acquisition of niche disruptive entities are crucial to
keep tech firms competitive. Over the last decade, both LinkedIn and Naukri have
invested to enhance job matching algorithms, semantic searches and intuitive
suggestions. However, our product innovation and engineering scoreboard
(Fig 22) suggests that INFOE scores far lower than LinkedIn.
Backed by a strong cash-rich parent in Microsoft, LinkedIn spent US$ 4bn on
research and development over the last three fiscal years, focused at parity between
users and recruiters/corporates. This included user experience enhancement and
extensive analytics-driven recruitment features for recruiters and corporates. In
contrast, we believe Naukri’s product innovation and engineering initiatives have
been skewed towards an enhanced experience for recruiters.
FIG 22 – PRODUCT INNOVATION AND ENHANCEMENTS LAG AT NAUKRI
Parameters LinkedIn Naukri
R&D investments
Capex and M&A
User experience enhancement
Recruiter experience enhancement
New product/services rollout
Overall score
Source: BOBCAPS Research |
FIG 23 – LINKEDIN SPENT US$ 1.7BN+ ON R&D IN FY19 FIG 24 – INFOE SPENT US$ 69MN COLLECTIVELY ON
CAPEX AND WAGES IN FY19
Source: Company, BOBCAPS Research | *FY19 data is our estimate calculated at
15% YoY growth, similar to Microsoft’s overall R&D expense growth of 15% in FY19 Source: Company, BOBCAPS Research
745
1,507
1,733
0
500
1,000
1,500
2,000
FY17 FY18 FY19*
(US$ mn) LinkedIn R&D expenses
1 2 4
5661
6557
6369
0
20
40
60
80
FY17 FY18 FY19
(US$ mn) INFOE (standalone) Capex (A)
Employee expenses (standalone) (B)
(A) + (B)
LinkedIn spent US$ 4bn on
R&D in last three fiscal years
INFO EDGE
EQUITY RESEARCH 12 12 March 2020
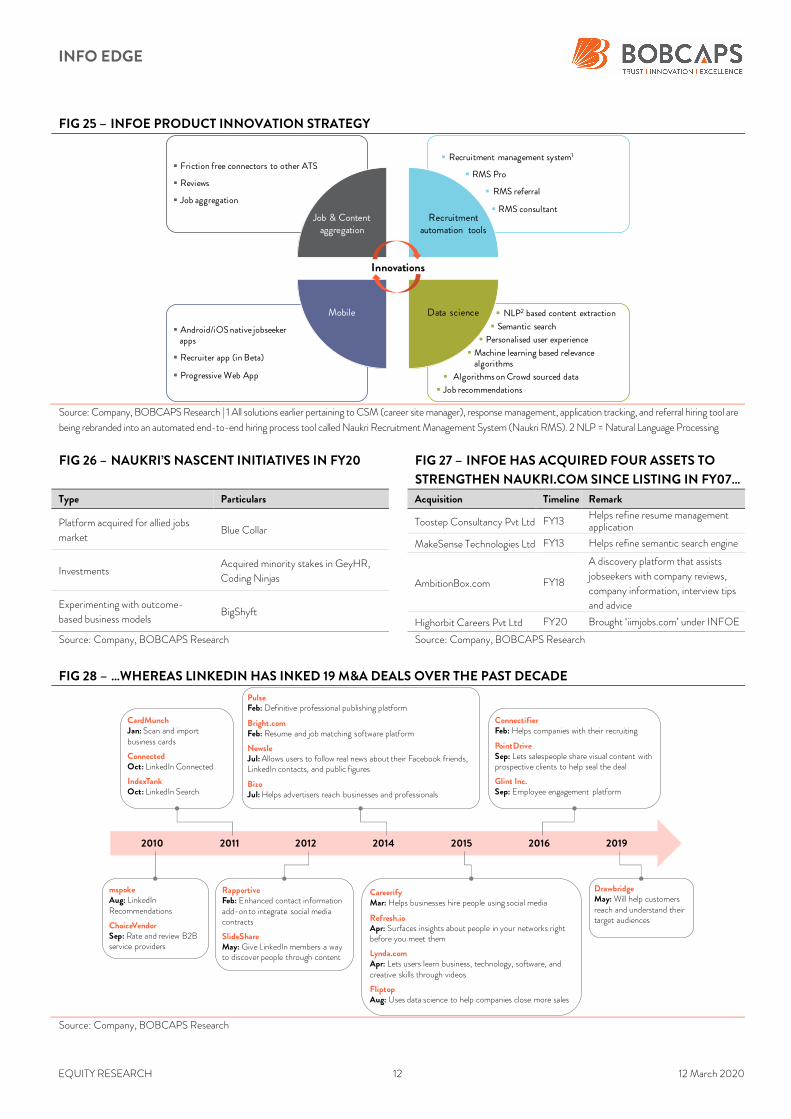
FIG 25 – INFOE PRODUCT INNOVATION STRATEGY
Source: Company, BOBCAPS Research | 1 All solutions earlier pertaining to CSM (career site manager), response management, application tracking, and referral hiring tool are
being rebranded into an automated end-to-end hiring process tool called Naukri Recruitment Management System (Naukri RMS). 2 NLP = Natural Language Processing
FIG 26 – NAUKRI’S NASCENT INITIATIVES IN FY20 FIG 27 – INFOE HAS ACQUIRED FOUR ASSETS TO
STRENGTHEN NAUKRI.COM SINCE LISTING IN FY07…
Type Particulars
Platform acquired for allied jobs
market Blue Collar
Investments Acquired minority stakes in GeyHR,
Coding Ninjas
Experimenting with outcome-
based business models BigShyft
Acquisition Timeline Remark
Toostep Consultancy Pvt Ltd FY13 Helps refine resume management application
MakeSense Technologies Ltd FY13 Helps refine semantic search engine
AmbitionBox.com FY18
A discovery platform that assists
jobseekers with company reviews,
company information, interview tips
and advice
Highorbit Careers Pvt Ltd FY20 Brought ‘iimjobs.com’ under INFOE
Source: Company, BOBCAPS Research Source: Company, BOBCAPS Research
FIG 28 – …WHEREAS LINKEDIN HAS INKED 19 M&A DEALS OVER THE PAST DECADE
Source: Company, BOBCAPS Research
Innovations
Job & Contentaggregation
Recruitmentautomation tools
Mobile Data science
Recruitment management system1
RMS Pro
RMS referral
RMS consultant
NLP2 based content extraction
Semantic search
Personalised user experience
Machine learning based relevance algorithms
Algorithms on Crowd sourced data
Job recommendations
Friction free connectors to other ATS
Reviews
Job aggregation
Android/iOS native jobseekerapps
Recruiter app (in Beta)
Progressive Web App
2010 2011 2012 2014 2015 2016 2019
mspokeAug: LinkedIn Recommendations
ChoiceVendorSep: Rate and review B2Bservice providers
CardMunchJan: Scan and import business cards
ConnectedOct: LinkedIn Connected
IndexTankOct: LinkedIn Search
RapportiveFeb: Enhanced contact information add-on to integrate social media contracts
SlideShareMay: Give LinkedIn members a way to discover people through content
PulseFeb: Definitive professional publishing platform
Bright.comFeb: Resume and job matching software platform
NewsleJul:Allows users to follow real news about their Facebook friends, LinkedIn contacts, and public figures
BizoJul: Helps advertisers reach businesses and professionals
CareerifyMar: Helps businesses hire people using social media
Refresh.ioApr: Surfaces insights about people in your networks right before you meet them
Lynda.comApr: Lets users learn business, technology, software, and creative skills through videos
FliptopAug: Uses data science to help companies close more sales
ConnectifierFeb: Helps companies with their recruiting
PointDriveSep: Lets salespeople share visual content with prospective clients to help seal the deal
Glint Inc.Sep: Employee engagement platform
DrawbridgeMay:Will help customers reach and understand their target audiences

INFO EDGE
EQUITY RESEARCH 13 12 March 2020
FIG 29 – IN OCT’18 MICROSOFT ANNOUNCED THAT LINKEDIN SESSIONS
WILL HAVE 6% WEIGHT FOR ESOP AWARD VS. NIL EARLIER
Weights for Stock options Prior to FY18 FY18-FY20
(Jun ending)
Commercial cloud revenue 34 34
Commercial cloud subscribers 33 33
Windows 10 monthly active devices 11 11
Consumer post-sales monetisation gross margin 11 11
LinkedIn sessions NA 6
Surface gross margin 11 5
Total 100 100
Source: Company, BOBCAPS Research
Higher competitive intensity pushing up advertising spends
In CY19, LinkedIn and Naukri both increased marketing and advertisement
spends. LinkedIn India launched it second branding campaign in the country
(#InItTogether) and scaled up its television advertisement spend two-and-a-half
times over CY18 (as per TMS Media Search). Its brand campaign in India kicked
off with the Indian Premier League (IPL) in Apr’19. Naukri followed suit, ramping
up marketing and advertising including television commercials in FY20 after a long
hiatus from media – raising A&P spends 36% YoY in H1.
FIG 30 – LINKEDIN SCALED UP TV ADVERTISEMENT 2.5X IN CY19 VS. CY18
LinkedIn Brand Campaigns – CY19
Campaign #InItTogether
India Launch IPL 2019 (23-Mar)
Aired on 49 TV channels in 2019 vs. 17 in 2018
Spots on premium English channels (news, movies, entertainment, infotainment) and Hotstar
Rs 290mn spent during first few days of IPL
Outdoor advertising, which includes billboards, bus shelters, metro wraps, airports in Mumbai, Delhi and Bangalore
Campaign LinkedIn MTV Get a Job
Launch 2015 (running to date)
Target Students and career starters
Source: BOBCAPS Research
FIG 31 – NAUKRI FOLLOWED SUIT WITH AGGRESSIVE MARKETING IN H1FY20 (POST A LONG GAP IN ADVERTISING)
Timeline INFOE management commentary
Q4FY19 May’19
Expect FY20 spends to be higher than FY19 in all verticals
Have invested aggressively with a mix of television and media advertising in key cities
Spent a lot more on marketing in Naukri this year over last year
Higher strategic focus under
tech giant Microsoft – pay of
top 5 executives linked to
LinkedIn performance
Naukri advertising
aggressively after a long
hiatus

INFO EDGE
EQUITY RESEARCH 14 12 March 2020
Timeline INFOE management commentary
Q1FY20 Aug’19
Increased marketing spend substantially in all businesses, specifically in Naukri and Jeevansathi. Overall spend on
marketing for the quarter was ~Rs 550mn, up 46% YoY
Also invested aggressively in marketing last quarter, especially in television, brand building and outdoor
campaigns. New ad film made for television a few months ago. Results have been very encouraging
Spend will continue for two quarters at least
Advertisements spread over multiple platforms – Facebook, YouTube, Google, app marketing campaigns, TV
Q2FY20 Nov’19 Marketing and brand building have been limited for several years, with a lack of a media presence – hence, very
aggressive in Naukri in the first half this year
Source: Company, BOBCAPS Research
FIG 32 – 36% YOY INCREASE IN INFOE’S MARKETING AND ADVERTISING
EXPENSES IN H1FY20
Source: Company, BOBCAPS Research
Expect sharp growth slowdown at Naukri
Naukri’s billing growth, a near-term lead indicator, fell sharply in the Dec’19
quarter to 8.5% – this marks a low since the company started disclosures in
Q1FY15, as economic weakness spread beyond auto and manufacturing to IT/ITES
segment hiring. We expect rising competitive pressures and a weak macro climate
to slow revenue growth for the business to 13.4%/12.8% YoY in FY21/FY22 vs.
17.5% in FY19 and 16.9% in 9MFY20.
FIG 33 – NAUKRI REVENUE AND EBITDA ESTIMATES
Particulars FY18* FY19* FY20E FY21E FY22E
Revenue (Rs mn) 6,688 7,859 9,077 10,290 11,608
Revenue growth (%) 11.4 17.5 15.5 13.4 12.8
EBITDA margin (%) 57.1 55.3 56.9 56.0 55.5
Source: Company, BOBCAPS Research | *Assumes depreciation charge in similar proportion to revenue as at
companywide level
780
1,063
14.9
16.9
13
14
15
16
17
18
0
200
400
600
800
1,000
1,200
H1FY19 H1FY20
(%)(Rs mn) Marketing and advertising expenses % of revenue (R)
Economic weakness and
competition to mute Naukri
revenue growth

INFO EDGE
EQUITY RESEARCH 15 12 March 2020
99acres – elusive profitability
INFOE’s real estate search portal 99acres (17% revenue share in FY19) is the
leading online marketplace for property listings in India. Revenue from 99acres.com
has surged nearly 14-fold over FY09-FY19, but the business lacks profitability.
Over 80% of the portal’s listings are for residential property – a segment facing
persistent weakness. Further, high competition marked by a narrowing traffic-share
lead over the second largest peer impedes the path to predictable, profitable growth.
In 9MFY20, 99acres reported positive EBITDA of ~Rs 90mn. We expect future
profitability to be elusive as increased competition from MagicBricks.com and
Housing.com will drive up advertising and marketing spend moving into FY21. We
bake in a revenue CAGR of 17.7% over FY20-FY22 vs. 42%/25% YoY growth in
FY19/9MFY20, accompanied by 10ppt EBITDA margin contraction.
FIG 34 – 99ACRES REVENUE AND EBITDA MARGIN ESTIMATE
Particulars FY18* FY19* FY20E FY21E FY22E
Revenue (Rs mn) 1,354 1,919 2,280 2,708 3,159
Revenue growth (%) 9.8 41.7 18.8 18.8 16.6
EBITDA margin (%) (24.2) (12.5) 0.0 (5.0) (10.0)
Source: Company, BOBCAPS Research
FIG 35 – 99ACRES HAD 52% MARKET SHARE IN FY19… FIG 36 – …BUT ONLY A NARROW LEAD OVER NO. 2
PLAYER MAGICBRICKS
Overall traffic (from desktops & laptops, web mobile and App) based on time spent
Source: Company, BOBCAPS Research | *99acres ended FY17 with 60%
market share; average market share considered for FY18 and FY19 Source: SimilarWeb, Company, BOBCAPS Research
60
55
52
48
50
52
54
56
58
60
62
FY17* FY18 FY19
(%) 99acres.com traffic share
Falling traffic-share lead to
inflate A&P spend at 99acres

INFO EDGE
EQUITY RESEARCH 16 12 March 2020
FIG 37 – ONLINE PROPERTY PORTALS ACCOUNT FOR
15%+ SHARE OF REAL ESTATE ADVERTISING SPEND FIG 38 – IN ABSENCE OF INNOVATION, COMPETITION
& REAL ESTATE MARKET CLIMATE ARE KEY DRIVERS
Online real estate portal market drivers
Source: Company, BOBCAPS Research | Based on INFOE FY17 estimates Source: Company, BOBCAPS Research
FIG 39 – 99ACRES HAS 83% OF ITS LISTINGS IN RESIDENTIAL REAL ESTATE–
A SEGMENT SEEING PERSISTENT WEAKNESS
Source: Company, BOBCAPS Research
FIG 40 – 99ACRES BILLING GROWTH MODERATED IN
DEC’19 QUARTER FIG 41 – BROKERS/CHANNEL PARTNERS NOW
CONTRIBUTE MAJORITY OF REVENUE AT 99ACRES
Source: Company, BOBCAPS Research Source: Company, BOBCAPS Research | *Data not available for FY16; FY15 is
sourced from management comment in Mar’15 quarter earnings call transcript
Real estate
advertising industry
85%
Online real
estate portals
15%
875
653 660 648 585 614 612 616 631 637 624 636 700 726 752 756836
130
121 122 115104 112 116 115 115 118 123 125
139 144 155 153168
0100200300400500600700800900
1,0001,100
Dec
-15
Mar-16
Jun-16
Sep
-16
Dec
-16
Mar-17
Jun-17
Sep
-17
Dec
-17
Mar-18
Jun-18
Dec
-18
Dec
-18
Mar-19
Jun-19
Sep
-19
Dec
-19
('000) Residential listings Commercial listings
(10)
10
30
50
70
90
Jun-17
Sep
-17
Dec
-17
Mar-18
Jun-18
Sep
-18
Dec
-18
Mar-19
Jun-19
Sep
-19
Dec
-19
(%)
Billing, YoY growth
Brokers Builder 99acres
55.0
44.048.9
43.640.0
53.047.1
51.1
0
20
40
60
FY15* FY17 FY18 FY19
(%)Builder (99acres billing breakup)
Broker (99acres bi lling breakup)

INFO EDGE
EQUITY RESEARCH 17 12 March 2020
FIG 42 – BROKERS DRIVING GROWTH… FIG 43 – …BUILDERS RELATIVELY SUBDUED
Source: Company, BOBCAPS Research Source: Company, BOBCAPS Research
FIG 44 – AGGRESSIVE ADVERTISING SPEND BY PEERS Competitive intensity based on marketing spends by competitors
Q4FY19 Q1FY20 Q2FY20 Q3FY20
MagicBricks
Housing
CommonFloor
Source: Company, BOBCAPS Research Aggressive Moderate Low
FIG 45 – PROFITABILITY TYPICALLY UNDERPINNED BY MARKET DOMINANCE
Company Revenue (last financial year)
Profitability Market share lead
Rightmove GBP 268mn 74.1% EBIT margin ~80% market share in H1CY19, more than 5x that of the second largest peer
REA Group AUD 875mn
57.3% adj. EBITDA margin*
28.9% reported EBIT margin
56% traffic share in Australia (residential & commercial real estate sites), over 2x that of the second largest peer
Asian operations include market-leading property sites in Malaysia, Indonesia, Hong Kong and Thailand, with prominent portals in Singapore and China
Zillow USD 1.3bn
0.8% EBIT margin ex-impairment costs
5.4% reported EBIT losses
50%+ market share spread across two large online portals, but the second portal (owned by Zillow) has a sub-5% market share lead over the No. 3 peer
Source: Company, BOBCAPS Research | *Excludes significant non-recurring items such as revaluation, unwind and finance costs of contingent consideration,
transaction costs relating to acquisitions by associates, and impairment of goodwill and investments in associates.
Jeevansathi – poor prospects
Backed by aggressive advertising spends, INFOE’s matrimony website
Jeevansathi.com (6.6% revenue share in FY19) is likely to deliver healthy topline
traction, but widening operating losses. An inherently fragmented market and the
chase for market share saw EBITDA losses surge from Rs 79mn in FY17 to Rs
338mn in FY19. While we build in an FY20-FY22 revenue CAGR of 15%
compared to 5%/14% YoY growth in FY19/9MFY20, we expect the profit bleed to
continue.
17.7
17.7
14.4
14.4
14.4
14.4 15.3
14.7
14.7 15
.7 16.2
16.2 16.9 18
.0 18.7 19
.7 20.9 22.2
12
14
16
18
20
22
24
Sep
-15
Dec
-15
Mar-1
6
Jun-16
Sep
-16
Dec
-16
Mar-1
7
Jun-17
Sep
-17
Dec
-17
Mar-18
Jun-18
Sep
-18
Dec
-18
Mar-1
9
Jun-19
Sep
-19
Dec
-19
('000) Brokers
6.6
6.6
6.5
6.5
6.5
6.5
6.5
5.0
5.0
4.3
4.1 4.3 4.6 4.8
4.8 4.9 5.0 5.2
3
4
5
6
7
8
9
10
Sep
-15
Dec
-15
Mar-1
6
Jun-16
Sep
-16
Dec
-16
Mar-1
7
Jun-17
Sep
-17
Dec
-17
Mar-1
8
Jun-18
Sep
-18
Dec
-18
Mar-1
9
Jun-19
Sep
-19
Dec
-19
('000) Builders
EBITDA bleed in Jeevansathi
to continue
INFO EDGE
EQUITY RESEARCH 18 12 March 2020
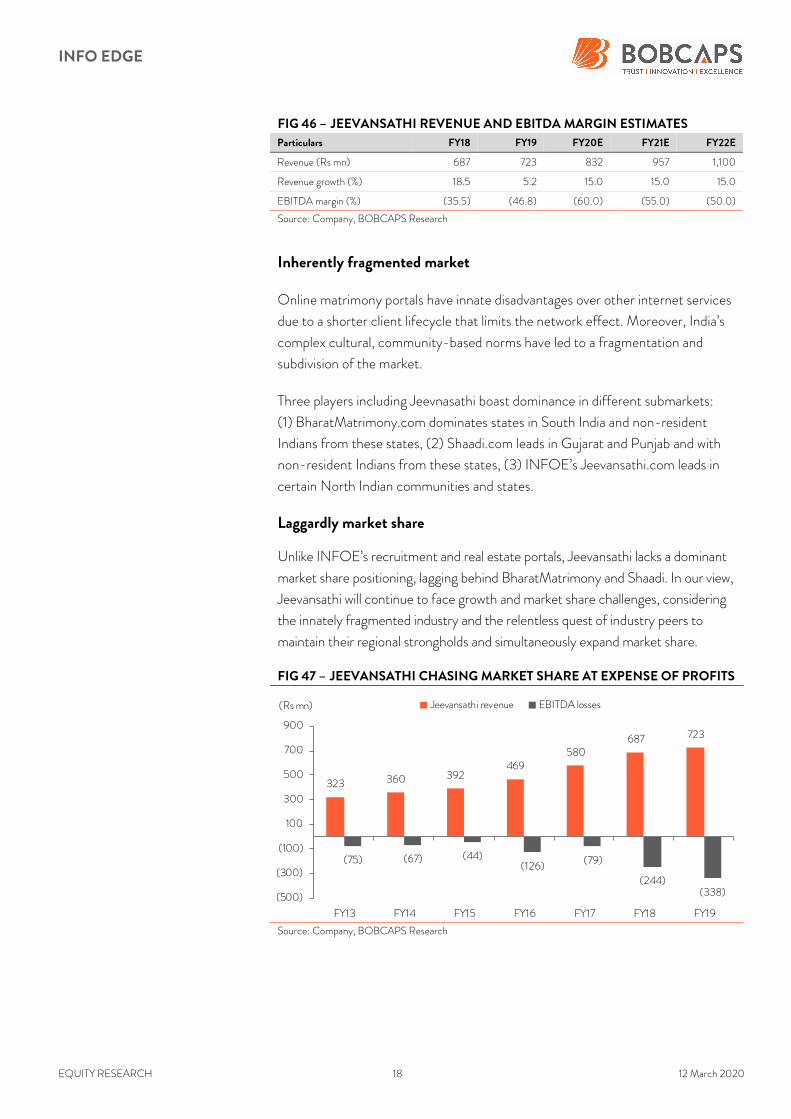
FIG 46 – JEEVANSATHI REVENUE AND EBITDA MARGIN ESTIMATES
Particulars FY18 FY19 FY20E FY21E FY22E
Revenue (Rs mn) 687 723 832 957 1,100
Revenue growth (%) 18.5 5.2 15.0 15.0 15.0
EBITDA margin (%) (35.5) (46.8) (60.0) (55.0) (50.0)
Source: Company, BOBCAPS Research
Inherently fragmented market
Online matrimony portals have innate disadvantages over other internet services
due to a shorter client lifecycle that limits the network effect. Moreover, India’s
complex cultural, community-based norms have led to a fragmentation and
subdivision of the market.
Three players including Jeevnasathi boast dominance in different submarkets:
(1) BharatMatrimony.com dominates states in South India and non-resident
Indians from these states, (2) Shaadi.com leads in Gujarat and Punjab and with
non-resident Indians from these states, (3) INFOE’s Jeevansathi.com leads in
certain North Indian communities and states.
Laggardly market share
Unlike INFOE’s recruitment and real estate portals, Jeevansathi lacks a dominant
market share positioning, lagging behind BharatMatrimony and Shaadi. In our view,
Jeevansathi will continue to face growth and market share challenges, considering
the innately fragmented industry and the relentless quest of industry peers to
maintain their regional strongholds and simultaneously expand market share.
FIG 47 – JEEVANSATHI CHASING MARKET SHARE AT EXPENSE OF PROFITS
Source: Company, BOBCAPS Research
323 360 392469
580687 723
(75) (67) (44)(126) (79)
(244)(338)(500)
(300)
(100)
100
300
500
700
900
FY13 FY14 FY15 FY16 FY17 FY18 FY19
(Rs mn) Jeevansathi revenue EBITDA losses

INFO EDGE
EQUITY RESEARCH 19 12 March 2020
Rising competition to subdue earnings
As revenue growth slows, we expect lower operating leverage to drive 330bps
contraction in INFOE’s EBITDA margin over FY20-FY22 to 31.9%. Any
unexpected increase in competitive intensity may necessitate higher
advertisement and marketing spend, further putting margins at risk. We thus
expect earnings to lag revenue growth over FY20-FY22 and model for an
EBITDA/adj. EPS (excl. non-recurring expense) CAGR of 12%/4% vs. a revenue
CAGR of 14%. Moreover, a widespread hiring slowdown on weak macro will also
weigh on INFOE’s growth.
FIG 48 – OPERATING LEVERAGE AT PLAY IN LAST
FIVE YEARS
FIG 49 – EXPECT REVENUE GROWTH MODERATION
TO WEIGH ON OPERATING MARGINS
Source: Company, BOBCAPS Research | *Gross profits refer to revenue less
employee expenses, network and direct charges, and other expenses Source: Company, BOBCAPS Research
Investee companies – exit strategy holds key
INFOE’s investments in technology companies are reminiscent of the venture
capital investment approach, characterised by high-risk high-returns, equity
participation for capital gains and lack of liquidity. Successful exits hold the key for
value unlocking of such investments.
However, INFOE has a limited monetisation track record – of 31 investments
totalling Rs 14.6bn (listed in Annexure A), the company has only part-monetised
two, viz. Zomato for US$ 50mn in FY18 and PolicyBazaar for Rs 1.3bn in FY16,
and announced a full exit from one, viz. Meritnation for Rs 500mn. The
Meritnation sale was concluded this quarter at a loss of Rs 1bn.
FIG 50 – LIMITED MONETISATION TRACK RECORD
Timeline Portfolio company
Consideration Comment
FY18 Zomato US$ 50mn Part-monetised stake in Zomato by selling 6.66% for US$ 50mn to Ant Financial. Secondary stake sale carried out only to provide sizeable stake to Ant Financial, per management
FY16 PolicyBazaar Rs 1.3bn Sold 49.9% of its stake in PolicyBazaar to Temasek (routed through subsidiaries)
FY20 Meritnation Rs 500mn Announced the sale of its entire stake in Meritnation to Aakash Educational Services for Rs 500mn (loss of ~Rs 1bn)
Source: Company, BOBCAPS Research
43.6
40.139.3
45.2
47.120.9
18.3
10.9
14.1
20.0
10
12
14
16
18
20
22
35
37
39
41
43
45
47
49
FY15 FY16 FY17 FY18 FY19
(%)(%) Gross margin* Revenue growth (R)
32.5
31.1
35.2
33.4
31.9
30
31
32
33
34
35
36
FY18 FY19 FY20E FY21E FY22E
EBITDA margin(%)
We model for a 4% adj. EPS
CAGR for INFOE
INFOE has a poor investment
monetisation record

INFO EDGE
EQUITY RESEARCH 20 12 March 2020
Moreover, unlike many street participants, we believe the stakes in investee
portfolio companies warrant discounted valuations to factor in implicit associate
entity discount for potential tax liability on monetisation, lack of control and
limited liquidity.
FIG 51 – RS 14.6BN IN INVESTEE COMPANIES SO FAR FIG 52 – 40%+ OF INVESTMENTS EX-ZOMATO AND
POLICYBAZAAR WRITTEN OFF OR PROVIDED FOR
Source: Company, BOBCAPS Research Source: Company, BOBCAPS Research | Note: Chart depicts INFOE’s
portfolio investments of Rs 7.4bn excluding Zomato and PolicyBazaar
FIG 53 – ZOMATO VALUATIONS IN VARIOUS FUNDING ROUNDS
Date Valuation (US$ mn)
Aug-10 3
Sep-11 15
Sep-12 112
Feb-13 54
Oct-13 159
Nov-14 624
Mar-15 789
Sep-15 951
Feb-18 1,100
Oct-18 2,000
Jan-20 3,000
Source: VCC Edge, Company, BOBCAPS Research
FIG 54 – POLICYBAZAAR VALUATIONS IN VARIOUS FUNDING ROUNDS
Date Valuation (US$ mn)
Sep-08 9
Apr-11 21
Mar-13 30
May-14 95
Mar-15 210
Sep-17 485
Jun-18 1,000
Dec-19 1,497
Source: VCC Edge, Company, BOBCAPS Research
1,522
5,758
7,407
0
1,000
2,000
3,000
4,000
5,000
6,000
7,000
8,000
Zomato Policy Bazaar Other investmsnts
(Rs mn)
Active
59%
Written off
41%

INFO EDGE
EQUITY RESEARCH 21 12 March 2020
Valuation methodology
Street not factoring in risk to INFOE’s mainstay business
INFOE’s stock price has increased at a 30%+ CAGR over the last decade (FY10
to date) backed by (1) strong growth and cash generation in Naukri, (2) asset
diversification (99acres, Jeevansathi, active investments in internet startups), and
(3) successes in select investee companies (Zomato and PolicyBazar.com).
Current core business valuations of 58.2x/54.2x FY21E/FY22E EPS (assuming
Rs 718/sh of embedded value for non-core business) fully factor in Naukri and
99acres’s industry dominance, in our view.
The recent stock correction in Feb’20 (down 15%+ from its peak) is largely due to
growth concerns led by slow macro dynamics. In our view, the street is not
adequately factoring in the structural risk to Naukri’s leadership (71% of INFOE’s
FY19 revenue and its sole cash generating business) from the LinkedIn juggernaut.
Initiate with SELL
We initiate coverage on INFOE with SELL and a Mar’21 sum-of-the-parts
(SOTP) target price of Rs 2,080. Our SOTP model includes (1) Rs 1,101/sh for
Naukri (30x FY22E EPS), (2) Rs 218/sh for 99acres (8.5x sales), (3) Rs 45/sh
for Jeevansathi (5x sales), and (4) Rs 531/sh stakes in key investee companies
(Zomato and PolicyBazaar) based on their latest funding rounds. A reverse DCF
value of Rs 1,101/sh for Naukri implies a steep 15.7% revenue CAGR for the
business over the next ten years (vs. 16.7% CAGR over FY10-FY19).
FIG 55 – SOTP VALUATION SNAPSHOT
SOTP valuation Method Value
(Rs mn) % stake
Value of stake
(Rs mn)
Value per share
(Rs) % of total value
Naukri 30x FY22E P/E 1,35,457 100 1,35,457 1,101 53
99acres 8.5x FY22E sales 26,852 100 26,852 218 10
Jeevansathi 5x FY22E sales 5,502 100 5,502 45 2
Zomato Valued at US$ 3bn* 2,13,000 23 48,351 393 19
PolicyBazaar Valued at US$ 1.5bn* 1,06,500 16 16,934 138 7
Other investments Book value 4392 NA 4,392 36 2
Cash and Cash equivalents Book value 18,690 100 18,690 152 7
Target price (Rs/sh) 2,080
Source: BOBCAPS Research | *As implied by Dec’19 and Jan’20 funding rounds
FIG 56 – REVERSE DCF VALUATION FOR NAUKRI IMPLIES STEEP REVENUE
ASK (15.7% CAGR OVER NEXT 10 YEARS VS. 16.7% CAGR OVER FY10-FY19) Naukri reverse DCF
Cost of equity (%) 12.5
Terminal growth rate (%) 4.5
Total value of discounted cash flow (Rs mn) 54,220
Terminal value (Rs mn) 80,858
Total EV (Rs mn) 1,35,078
Value per share (Rs/sh) 1,100
Source: BOBCAPS Research
Core valuations of 58x/53x
FY21E/FY22E fully price in
Naukri’s dominance
Initiate with SELL and a TP of
Rs 2,080
INFO EDGE
EQUITY RESEARCH 22 12 March 2020
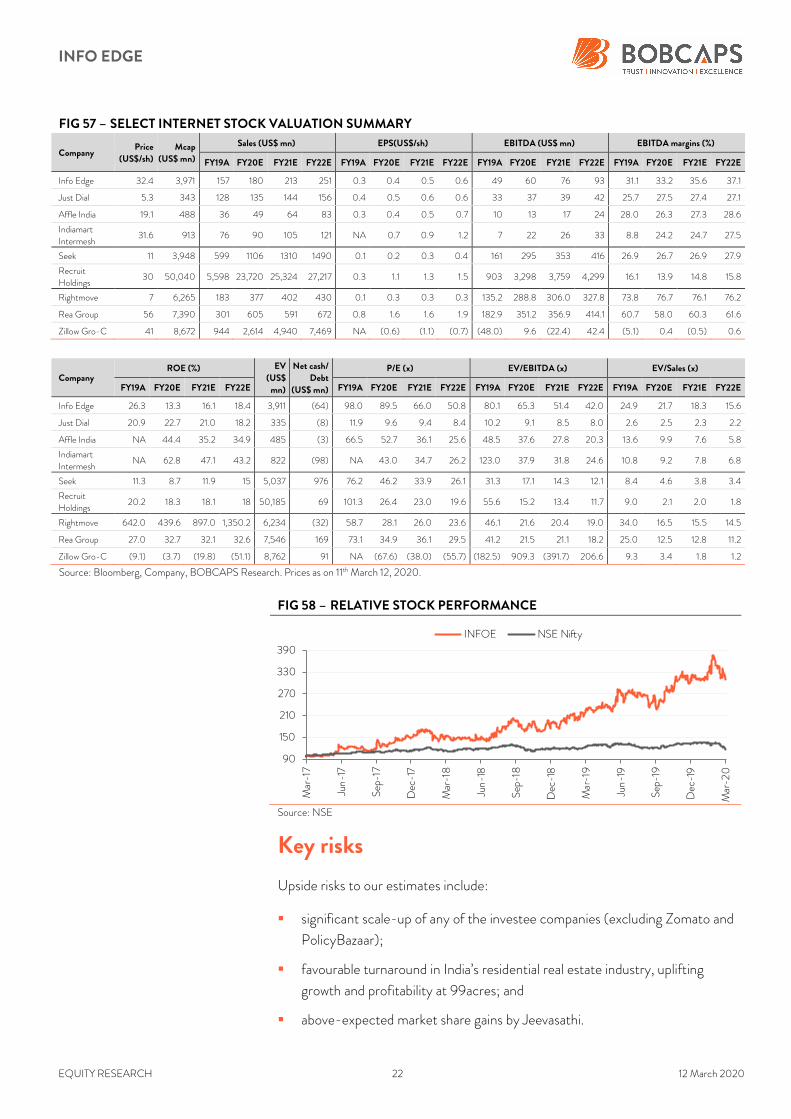
FIG 57 – SELECT INTERNET STOCK VALUATION SUMMARY
Company Price
(US$/sh) Mcap
(US$ mn)
Sales (US$ mn) EPS(US$/sh) EBITDA (US$ mn) EBITDA margins (%)
FY19A FY20E FY21E FY22E FY19A FY20E FY21E FY22E FY19A FY20E FY21E FY22E FY19A FY20E FY21E FY22E
Info Edge 32.4 3,971 157 180 213 251 0.3 0.4 0.5 0.6 49 60 76 93 31.1 33.2 35.6 37.1
Just Dial 5.3 343 128 135 144 156 0.4 0.5 0.6 0.6 33 37 39 42 25.7 27.5 27.4 27.1
Affle India 19.1 488 36 49 64 83 0.3 0.4 0.5 0.7 10 13 17 24 28.0 26.3 27.3 28.6
Indiamart Intermesh
31.6 913 76 90 105 121 NA 0.7 0.9 1.2 7 22 26 33 8.8 24.2 24.7 27.5
Seek 11 3,948 599 1106 1310 1490 0.1 0.2 0.3 0.4 161 295 353 416 26.9 26.7 26.9 27.9
Recruit Holdings
30 50,040 5,598 23,720 25,324 27,217 0.3 1.1 1.3 1.5 903 3,298 3,759 4,299 16.1 13.9 14.8 15.8
Rightmove 7 6,265 183 377 402 430 0.1 0.3 0.3 0.3 135.2 288.8 306.0 327.8 73.8 76.7 76.1 76.2
Rea Group 56 7,390 301 605 591 672 0.8 1.6 1.6 1.9 182.9 351.2 356.9 414.1 60.7 58.0 60.3 61.6
Zillow Gro-C 41 8,672 944 2,614 4,940 7,469 NA (0.6) (1.1) (0.7) (48.0) 9.6 (22.4) 42.4 (5.1) 0.4 (0.5) 0.6
Company ROE (%) EV
(US$ mn)
Net cash/ Debt
(US$ mn)
P/E (x) EV/EBITDA (x) EV/Sales (x)
FY19A FY20E FY21E FY22E FY19A FY20E FY21E FY22E FY19A FY20E FY21E FY22E FY19A FY20E FY21E FY22E
Info Edge 26.3 13.3 16.1 18.4 3,911 (64) 98.0 89.5 66.0 50.8 80.1 65.3 51.4 42.0 24.9 21.7 18.3 15.6
Just Dial 20.9 22.7 21.0 18.2 335 (8) 11.9 9.6 9.4 8.4 10.2 9.1 8.5 8.0 2.6 2.5 2.3 2.2
Affle India NA 44.4 35.2 34.9 485 (3) 66.5 52.7 36.1 25.6 48.5 37.6 27.8 20.3 13.6 9.9 7.6 5.8
Indiamart Intermesh
NA 62.8 47.1 43.2 822 (98) NA 43.0 34.7 26.2 123.0 37.9 31.8 24.6 10.8 9.2 7.8 6.8
Seek 11.3 8.7 11.9 15 5,037 976 76.2 46.2 33.9 26.1 31.3 17.1 14.3 12.1 8.4 4.6 3.8 3.4
Recruit Holdings
20.2 18.3 18.1 18 50,185 69 101.3 26.4 23.0 19.6 55.6 15.2 13.4 11.7 9.0 2.1 2.0 1.8
Rightmove 642.0 439.6 897.0 1,350.2 6,234 (32) 58.7 28.1 26.0 23.6 46.1 21.6 20.4 19.0 34.0 16.5 15.5 14.5
Rea Group 27.0 32.7 32.1 32.6 7,546 169 73.1 34.9 36.1 29.5 41.2 21.5 21.1 18.2 25.0 12.5 12.8 11.2
Zillow Gro-C (9.1) (3.7) (19.8) (51.1) 8,762 91 NA (67.6) (38.0) (55.7) (182.5) 909.3 (391.7) 206.6 9.3 3.4 1.8 1.2
Source: Bloomberg, Company, BOBCAPS Research. Prices as on 11th March 12, 2020.
FIG 58 – RELATIVE STOCK PERFORMANCE
Source: NSE
Key risks
Upside risks to our estimates include:
significant scale-up of any of the investee companies (excluding Zomato and
PolicyBazaar);
favourable turnaround in India’s residential real estate industry, uplifting
growth and profitability at 99acres; and
above-expected market share gains by Jeevasathi.
90
150
210
270
330
390
Mar-17
Jun-17
Sep
-17
Dec
-17
Mar-18
Jun-18
Sep
-18
Dec
-18
Mar-1
9
Jun-19
Sep
-19
Dec
-19
Mar-2
0
INFOE NSE Nifty

INFO EDGE
EQUITY RESEARCH 23 12 March 2020
Annexure A
FIG 1 – INFOE’S INVESTMENTS
SN Investee company Website Book value of
investments (Rs mn) % stake
Active
1 Zomato Media Pvt Ltd www.zomato.com 1,522 22.7
2 Applect Learning Systems Pvt Ltd www.meritnation.com 775 65.7
3 Etechaces Marketing and Consulting Pvt Ltd www.policybazaar.com 5,758 15.9
4 Happily Unmarried Marketing Pvt Ltd www.happilyunmarried.com 323 42.3
5 Unnati Online Pvt Ltd www.unnatihelpers.com 40 28.6
6 Ideaclicks Infolabs Pvt Ltd www.zippserv.com 54 45.3
7 Wishbook Infoservices Pvt Ltd www.wishbooks.io 59 30.2
8 NoPaperForms Solutions Pvt Ltd www.nopaperforms.com 337 48.1
9 International Educational Gateway Pvt Ltd www.univariety.com 135 29.6
10 Agstack Technologies Pvt Ltd www.gramophone.in/ 204 33.2
11 Bizcrum Infotech Pvt Ltd www.shoekonnect.com 160 32.9
12 Medcords Healthcare Solutions Pvt Ltd www.medcords.com/ 52 11.4
13 Printo Document Services Pvt Ltd www.printo.in/ 250 25.1
14 Shop Kirana E Trading Pvt Ltd shopkirana.com/ 604 25.4
15 Greytip Software Pvt Ltd www.greythr.com/ 350 20.3
16 Metis Eduventures Pvt Ltd (Adda_24*7) www.adda247.com/ 280 17.0
17 Terralytics Analysis Pvt Ltd (Teal) 50 20.0
18 LQ Global Services Pvt Ltd www.legitquest.com/ 15 16.7
19 Llama Logisol Pvt Ltd (Shipsy) www.shipsy.in/ 50 10.0
20 Sunrise Mentors Pvt Ltd (Coding Ninja) www.codingninjas.com/ 370 25.0
21 Qyuki Digital Media Pvt Ltd 180 7.0
22 Dotpe Pvt Ltd 104 7.5
Total 11,672
Written-off or exited
1 VCARE Technologies Pvt Ltd dirolabs.com 40
2 Kinobeo Software Pvt Ltd www.mydala.com 270
3 Canvera Digital Technologies Pvt Ltd www.canvera.com 1,210
4 Studyplaces www.studyplaces.com 45
5 Ninety Nine Labels Pvt Ltd www.99labels.com 285
6 Nogle Technologies www.floost.com 26
7 Green Leaves Consumer Services (Bigstylist) www.bigstylist.com 174
8 Rare Media Co www.bluedolph.in 109
9 Mint Bird Tech (Vacationlabs) www.vacationlabs.com 60
Sub Total 2,219
Provisioned for
Applect Learning 796
Total write down 3,015
Source: Company, BOBCAPS Research

INFO EDGE
EQUITY RESEARCH 24 12 March 2020
FINANCIALS
Income Statement
Y/E 31 Mar (Rs mn) FY18A FY19A FY20E FY21E FY22E
Total revenue 9,155 10,982 12,776 14,591 16,599
EBITDA 2,973 3,414 4,500 4,872 5,299
Depreciation 215 204 447 511 581
EBIT 2,758 3,210 4,053 4,361 4,718
Net interest income/(expenses) (1) (1) (67) (77) (87)
Other income/(expenses) 971 1,112 885 880 920
Exceptional items (913) (160) (861) 0 0
EBT 2,814 4,162 4,010 5,164 5,550
Income taxes 991 1,169 1,009 1,300 1,397
Extraordinary items 0 0 0 0 0
Min. int./Inc. from associates 0 0 0 0 0
Reported net profit 1,824 2,992 3,001 3,865 4,153
Adjustments 913 160 861 0 0
Adjusted net profit 2,737 3,152 3,862 3,865 4,153
Balance Sheet
Y/E 31 Mar (Rs mn) FY18A FY19A FY20E FY21E FY22E
Accounts payables 506 617 700 800 910
Other current liabilities 4,197 5,011 5,780 6,601 7,508
Provisions 456 496 496 496 496
Debt funds 3 4 4 4 4
Other liabilities 41 42 42 42 42
Equity capital 1,216 1,220 1,220 1,220 1,220
Reserves & surplus 19,859 22,019 24,128 27,035 30,159
Shareholders’ fund 21,074 23,239 25,348 28,255 31,379
Total liabilities and equities 26,278 29,410 32,370 36,197 40,340
Cash and cash eq. 740 683 3,595 7,368 11,450
Accounts receivables 44 60 70 80 91
Inventories 0 0 0 0 0
Other current assets 13,886 14,826 14,826 14,826 14,826
Investments 8,263 10,333 10,333 10,333 10,333
Net fixed assets 506 500 538 582 632
CWIP 0 20 20 20 20
Intangible assets 23 49 49 49 49
Deferred tax assets, net 359 416 416 416 416
Other assets 2,457 2,524 2,524 2,524 2,524
Total assets 26,278 29,410 32,370 36,197 40,340
Source: Company, BOBCAPS Research
INFO EDGE
EQUITY RESEARCH 25 12 March 2020
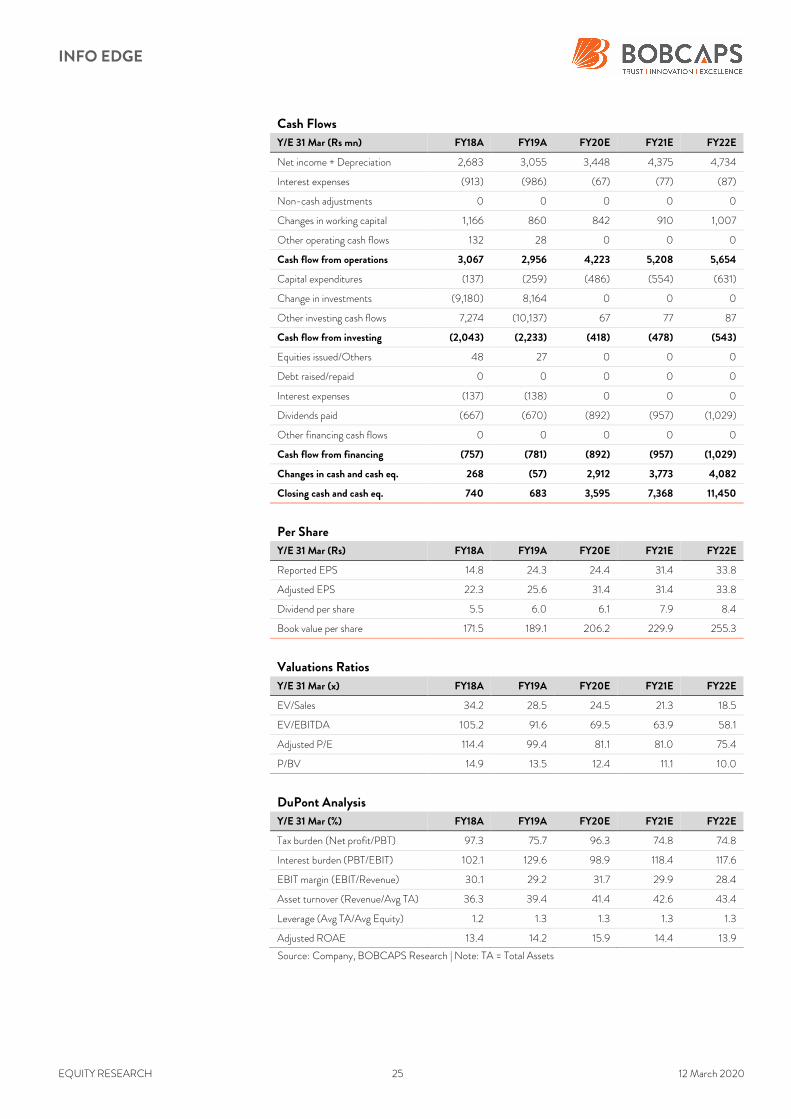
Cash Flows
Y/E 31 Mar (Rs mn) FY18A FY19A FY20E FY21E FY22E
Net income + Depreciation 2,683 3,055 3,448 4,375 4,734
Interest expenses (913) (986) (67) (77) (87)
Non-cash adjustments 0 0 0 0 0
Changes in working capital 1,166 860 842 910 1,007
Other operating cash flows 132 28 0 0 0
Cash flow from operations 3,067 2,956 4,223 5,208 5,654
Capital expenditures (137) (259) (486) (554) (631)
Change in investments (9,180) 8,164 0 0 0
Other investing cash flows 7,274 (10,137) 67 77 87
Cash flow from investing (2,043) (2,233) (418) (478) (543)
Equities issued/Others 48 27 0 0 0
Debt raised/repaid 0 0 0 0 0
Interest expenses (137) (138) 0 0 0
Dividends paid (667) (670) (892) (957) (1,029)
Other financing cash flows 0 0 0 0 0
Cash flow from financing (757) (781) (892) (957) (1,029)
Changes in cash and cash eq. 268 (57) 2,912 3,773 4,082
Closing cash and cash eq. 740 683 3,595 7,368 11,450
Per Share
Y/E 31 Mar (Rs) FY18A FY19A FY20E FY21E FY22E
Reported EPS 14.8 24.3 24.4 31.4 33.8
Adjusted EPS 22.3 25.6 31.4 31.4 33.8
Dividend per share 5.5 6.0 6.1 7.9 8.4
Book value per share 171.5 189.1 206.2 229.9 255.3
Valuations Ratios
Y/E 31 Mar (x) FY18A FY19A FY20E FY21E FY22E
EV/Sales 34.2 28.5 24.5 21.3 18.5
EV/EBITDA 105.2 91.6 69.5 63.9 58.1
Adjusted P/E 114.4 99.4 81.1 81.0 75.4
P/BV 14.9 13.5 12.4 11.1 10.0
DuPont Analysis
Y/E 31 Mar (%) FY18A FY19A FY20E FY21E FY22E
Tax burden (Net profit/PBT) 97.3 75.7 96.3 74.8 74.8
Interest burden (PBT/EBIT) 102.1 129.6 98.9 118.4 117.6
EBIT margin (EBIT/Revenue) 30.1 29.2 31.7 29.9 28.4
Asset turnover (Revenue/Avg TA) 36.3 39.4 41.4 42.6 43.4
Leverage (Avg TA/Avg Equity) 1.2 1.3 1.3 1.3 1.3
Adjusted ROAE 13.4 14.2 15.9 14.4 13.9
Source: Company, BOBCAPS Research | Note: TA = Total Assets

INFO EDGE
EQUITY RESEARCH 26 12 March 2020
Ratio Analysis
Y/E 31 Mar FY18A FY19A FY20E FY21E FY22E
YoY growth (%)
Revenue 14.1 20.0 16.3 14.2 13.8
EBITDA 30.7 14.8 31.8 8.3 8.8
Adjusted EPS 31.4 15.2 22.5 0.1 7.5
Profitability & Return ratios (%)
EBITDA margin 32.5 31.1 35.2 33.4 31.9
EBIT margin 30.1 29.2 31.7 29.9 28.4
Adjusted profit margin 29.9 28.7 30.2 26.5 25.0
Adjusted ROAE 13.4 14.2 15.9 14.4 13.9
ROCE 8.7 13.2 12.1 14.1 13.7
Working capital days (days)
Receivables 2 2 2 2 2
Inventory 0 0 0 0 0
Payables 18 19 19 19 19
Ratios (x)
Gross asset turnover 16.8 21.8 24.6 26.1 27.4
Current ratio 2.8 2.5 2.7 2.8 3.0
Net interest coverage ratio 0.0 0.0 0.0 0.0 0.0
Adjusted debt/equity 0.0 0.0 (0.1) (0.3) (0.4)
Source: Company, BOBCAPS Research

INFO EDGE
EQUITY RESEARCH 27 12 March 2020
Disclaimer
Recommendations and Absolute returns (%) over 12 months
BUY – Expected return >+15%
ADD – Expected return from >+5% to +15%
REDUCE – Expected return from -5% to +5%
SELL – Expected return <-5%
Note: Recommendation structure changed with effect from 1 January 2018 (Hold rating discontinued and replaced by Add / Reduce)
HISTORICAL RATINGS AND TARGET PRICE: INFO EDGE (INFOE IN)
B – Buy, A – Add, R – Reduce, S – Sell
Rating distribution
As of 29 February 2020, out of 85 rated stocks in the BOB Capital Markets Limited (BOBCAPS) coverage universe, 50 have BUY ratings, 17 are rated ADD, 9 are
rated REDUCE and 9 are rated SELL. None of these companies have been investment banking clients in the last 12 months.
Analyst certification
The research analyst(s) authoring this report hereby certifies that (1) all of the views expressed in this research report accurately reflect his/her personal views about the
subject company or companies and its or their securities, and (2) no part of his/her compensation was, is, or will be, directly or indirectly, related to the specific
recommendation(s) or view(s) in this report. Analysts are not registered as research analysts by FINRA and are not associated persons of BOBCAPS.
General disclaimers
BOBCAPS is engaged in the business of Institutional Stock Broking and Investment Banking. BOBCAPS is a member of the National Stock Exchange of India Limited
and BSE Limited and is also a SEBI-registered Category I Merchant Banker. BOBCAPS is a wholly owned subsidiary of Bank of Baroda which has its various subsidiaries
engaged in the businesses of stock broking, lending, asset management, life insurance, health insurance and wealth management, among others.
BOBCAPS’s activities have neither been suspended nor has it defaulted with any stock exchange authority with whom it has been registered in the last five years.
BOBCAPS has not been debarred from doing business by any stock exchange or SEBI or any other authority. No disciplinary action has been taken by any regulatory
authority against BOBCAPS affecting its equity research analysis activities.
BOBCAPS has obtained registration as a Research Entity under SEBI (Research Analysts) Regulations, 2014, having registration No.: INH000000040 valid till
03 February 2020. BOBCAPS is also a SEBI-registered intermediary for the broking business having SEBI Single Registration Certificate No.: INZ000159332 dated
20 November 2017.
BOBCAPS prohibits its analysts, persons reporting to analysts, and members of their households from maintaining a financial interest in the securities or derivatives of
any companies that the analysts cover. Additionally, BOBCAPS prohibits its analysts and persons reporting to analysts from serving as an officer, director, or advisory
board member of any companies that the analysts cover.
Our salespeople, traders, and other professionals may provide oral or written market commentary or trading strategies to our clients that reflect opinions contrary to the
opinions expressed herein, and our proprietary trading and investing businesses may make investment decisions that are inconsistent with the recommendations
760
1,230
1,700
2,170
2,640
3,110
Apr-17
May
-17
Jun-
17
Jul-17
Aug
-17
Sep
-17
Oct-17
Nov
-17
Dec
-17
Jan-
18
Feb
-18
Mar-18
Apr-18
May
-18
Jun-
18
Jul-18
Aug
-18
Sep
-18
Oct-18
Nov
-18
Dec
-18
Jan-
19
Feb
-19
Mar-19
Apr-19
May
-19
Jun-
19
Jul-19
Aug
-19
Sep
-19
Oct-19
Nov
-19
Dec
-19
Jan-
20
Feb
-20
Mar-2
0
(Rs) INFOE stock price

INFO EDGE
EQUITY RESEARCH 28 12 March 2020
expressed herein. In reviewing these materials, you should be aware that any or all of the foregoing, among other things, may give rise to real or potential conflicts of
interest. Additionally, other important information regarding our relationships with the company or companies that are the subject of this material is provided herein.
This material should not be construed as an offer to sell or the solicitation of an offer to buy any security in any jurisdiction where such an offer or solicitation would be
illegal. We are not soliciting any action based on this material. It is for the general information of BOBCAPS’s clients. It does not constitute a personal recommendation
or take into account the particular investment objectives, financial situations, or needs of individual clients. Before acting on any advice or recommendation in this
material, clients should consider whether it is suitable for their particular circumstances and, if necessary, seek professional advice.
The price and value of the investments referred to in this material and the income from them may go down as well as up, and investors may realize losses on any
investments. Past performance is not a guide for future performance, future returns are not guaranteed and a loss of original capital may occur. BOBCAPS does not
provide tax advice to its clients, and all investors are strongly advised to consult with their tax advisers regarding any potential investment in certain transactions —
including those involving futures, options, and other derivatives as well as non-investment-grade securities —that give rise to substantial risk and are not suitable for all
investors. The material is based on information that we consider reliable, but we do not represent that it is accurate or complete, and it should not be relied on as such.
Opinions expressed are our current opinions as of the date appearing on this material only. We endeavour to update on a reasonable basis the information discussed in
this material, but regulatory, compliance, or other reasons may prevent us from doing so.
We and our affiliates, officers, directors, and employees, including persons involved in the preparation or issuance of this material, may from time to time have “long” or
“short” positions in, act as principal in, and buy or sell the securities or derivatives thereof of companies mentioned herein and may from time to time add to or dispose
of any such securities (or investment). We and our affiliates may act as market makers or assume an underwriting commitment in the securities of companies discussed
in this document (or in related investments), may sell them to or buy them from customers on a principal basis, and may also perform or seek to perform investment
banking or advisory services for or relating to these companies and may also be represented in the supervisory board or any other committee of these companies.
For the purpose of calculating whether BOBCAPS and its affiliates hold, beneficially own, or control, including the right to vote for directors, one per cent or more of
the equity shares of the subject company, the holdings of the issuer of the research report is also included.
BOBCAPS and its non-US affiliates may, to the extent permissible under applicable laws, have acted on or used this research to the extent that it relates to non-US
issuers, prior to or immediately following its publication. Foreign currency denominated securities are subject to fluctuations in exchange rates that could have an adverse
effect on the value or price of or income derived from the investment. In addition, investors in securities such as ADRs, the value of which are influenced by foreign
currencies, effectively assume currency risk. In addition, options involve risks and are not suitable for all investors. Please ensure that you have read and understood the
Risk disclosure document before entering into any derivative transactions.
In the US, this material is only for Qualified Institutional Buyers as defined under rule 144(a) of the Securities Act, 1933. No part of this document may be distributed
in Canada or used by private customers in the United Kingdom.
No part of this material may be (1) copied, photocopied, or duplicated in any form by any means or (2) redistributed without BOBCAPS’s prior written consent.
Company-specific disclosures under SEBI (Research Analysts) Regulations, 2014
The research analyst(s) or his/her relatives do not have any material conflict of interest at the time of publication of this research report.
BOBCAPS or its research analyst(s) or his/her relatives do not have any financial interest in the subject company. BOBCAPS or its research analyst(s) or his/her
relatives do not have actual/beneficial ownership of one per cent or more securities in the subject company at the end of the month immediately preceding the date of
publication of this report.
The research analyst(s) has not received any compensation from the subject company in the past 12 months. Compensation of the research analyst(s) is not based on
any specific merchant banking, investment banking or brokerage service transactions.
BOBCAPS or its research analyst(s) is not engaged in any market making activities for the subject company.
The research analyst(s) has not served as an officer, director or employee of the subject company.
BOBCAPS or its associates may have material conflict of interest at the time of publication of this research report.
BOBCAPS’s associates may have financial interest in the subject company. BOBCAPS’s associates may hold actual / beneficial ownership of one per cent or more
securities in the subject company at the end of the month immediately preceding the date of publication of this report.
BOBCAPS or its associates may have managed or co-managed a public offering of securities for the subject company or may have been mandated by the subject
company for any other assignment in the past 12 months.
BOBCAPS may have received compensation from the subject company in the past 12 months. BOBCAPS may from time to time solicit or perform investment banking
services for the subject company. BOBCAPS or its associates may have received compensation from the subject company in the past 12 months for services in respect
of managing or co-managing public offerings, corporate finance, investment banking or merchant banking, brokerage services or other advisory services in a merger or
specific transaction. BOBCAPS or its associates may have received compensation for products or services other than investment banking or merchant banking or
brokerage services from the subject company in the past 12 months.
Related Documents