Document Release Date: March, 2017 OMi Management Pack User Guide

Welcome message from author
This document is posted to help you gain knowledge. Please leave a comment to let me know what you think about it! Share it to your friends and learn new things together.
Transcript

Document Release Date: March, 2017
OMi Management Pack
User Guide
Evolution Guide Page 3
Legal Notices Warranty The only warranties for Hewlett Packard Enterprise products and services are set forth in the express warranty statements accompanying such products and services. Nothing herein should be construed as constituting an additional warranty. Hewlett Packard Enterprise shall not be liable for technical or editorial errors or omissions contained herein.
The information contained herein is subject to change without notice.
Restricted Rights Legend Confidential computer software. Valid license from Hewlett Packard Enterprise required for possession, use or copying. Consistent with FAR 12.211 and 12.212, Commercial Computer Software, Computer Software Documentation, and Technical Data for Commercial Items are licensed to the U.S. Government under vendor's standard commercial license.
Copyright Notice © 2015-2017 Hewlett Packard Enterprise Development LP
Trademark Notices Adobe® is a trademark of Adobe Systems Incorporated.
Microsoft® and Windows® are U.S. registered trademarks of Microsoft Corporation.
UNIX® is a registered trademark of The Open Group.
Documentation Updates The title page of this document contains the following identifying information:
Software Version number, which indicates the software version.
Document Release Date, which changes each time the document is updated.
Software Release Date, which indicates the release date of this version of the software.
To check for recent updates or to verify that you are using the most recent edition of a document, go to: https://softwaresupport.hpe.com/.
This site requires that you register for an HP Passport and to sign in. To register for an HP Passport ID, click Register on the HPE Software Support site or click Create an Account on the HP Passport login page.
You will also receive updated or new editions if you subscribe to the appropriate product support service. Contact your HPE sales representative for details.
Support Visit the HPE Software Support site at: https://softwaresupport.hpe.com.
This website provides contact information and details about the products, services, and support that HP Software offers.
HP Software online support provides customer self-solve capabilities. It provides a fast and efficient way to access interactive technical support tools needed to manage your business. As a valued support customer, you can benefit by using the support website to:
Search for knowledge documents of interest
Submit and track support cases and enhancement requests
Download software patches
Manage support contracts
Look up HPE support contacts
Review information about available services
Enter into discussions with other software customers
Research and register for software training
Most of the support areas require that you register as an HPE Passport user and to sign in. Many also require a support contract. To register for an HPE Passport ID, click Register on the HPE Support site or click Create an Account on the HPE Passport login page.
To find more information about access levels, go to: https://softwaresupport.hpe.com/web/softwaresupport/access-levels.
HPE Software Solutions Now accesses the HPESW Solution and Integration Portal website. This site enables you to explore HPE Product Solutions to meet your business needs, includes a full list of Integrations between HPE Products, as well as a listing of ITIL Processes. The URL for this website is https://softwaresupport.hpe.com/km/KM01702731.

Evolution Guide Page 4
Contents
Preface ...................................................................................................................................................................... 5
Audience ................................................................................................................................................................... 5
Conventions .............................................................................................................................................................. 5
Introduction ................................................................................................................................................................ 6
Overview ................................................................................................................................................................ 6
Prerequisites for Using OMi Management Packs .................................................................................................. 6
Conceptual Differences between SPIs and MPs ................................................................................................... 6
Recommended Steps for Moving from a SPI to MP .............................................................................................. 7
License Entitlement and Licensing for OMi Management Packs .......................................................................... 8
Smart Plug-ins (SPIs) and Corresponding Management Packs (MPs) .................................................................... 8
Best Practices for Customizing Management Packs ........................................................................................... 10
Infrastructure SPI and Management Pack ........................................................................................................... 11
Oracle Database SPI and Management Pack ..................................................................................................... 28
Microsoft SQL Server SPI and Management Pack ............................................................................................. 45
Sybase SPI and Management Pack .................................................................................................................... 59
SAP SPI and Management Pack ......................................................................................................................... 72
Active Directory SPI and Management Pack ....................................................................................................... 98
Microsoft Exchange Server SPI and Management Pack .................................................................................. 113
Apache Web Server SPI and Management Pack .............................................................................................. 128
WebSphere SPI and OMi Management Pack for IBM WebSphere Application Server .................................... 134
WebLogic SPI and OMi Management Pack for Oracle WebLogic Application Server ...................................... 148
IIS SPI and Management Pack.......................................................................................................................... 163
Microsoft Enterprise Server SPI for SharePoint and Management Pack .......................................................... 172
JBoss SPI and OMi Management Pack for JBoss Application Server .............................................................. 182
Appendix A – Mapping of Infrastructure SPI MT Policy Parameters to Infrastructure MP Parameters ................ 198
Useful resources ................................................................................................................................................... 213
Send documentation feedback.............................................................................................................................. 213
Evolution Guide Page 5
Preface This guide explains how the OMi Management Pack (MP) can be used to replace the HP Operations Manager (HPOM) Smart Plug-in (SPI). It then provides detailed information for each MP, which will help you to understand differences between the SPI and MP and to retain customizations that you might have done in the SPI.
Audience This guide is for HPE OMi Management Pack Implementers who want to replace an existing HPOM Smart Plug-in installation with the equivalent HPE OMi Management Pack.
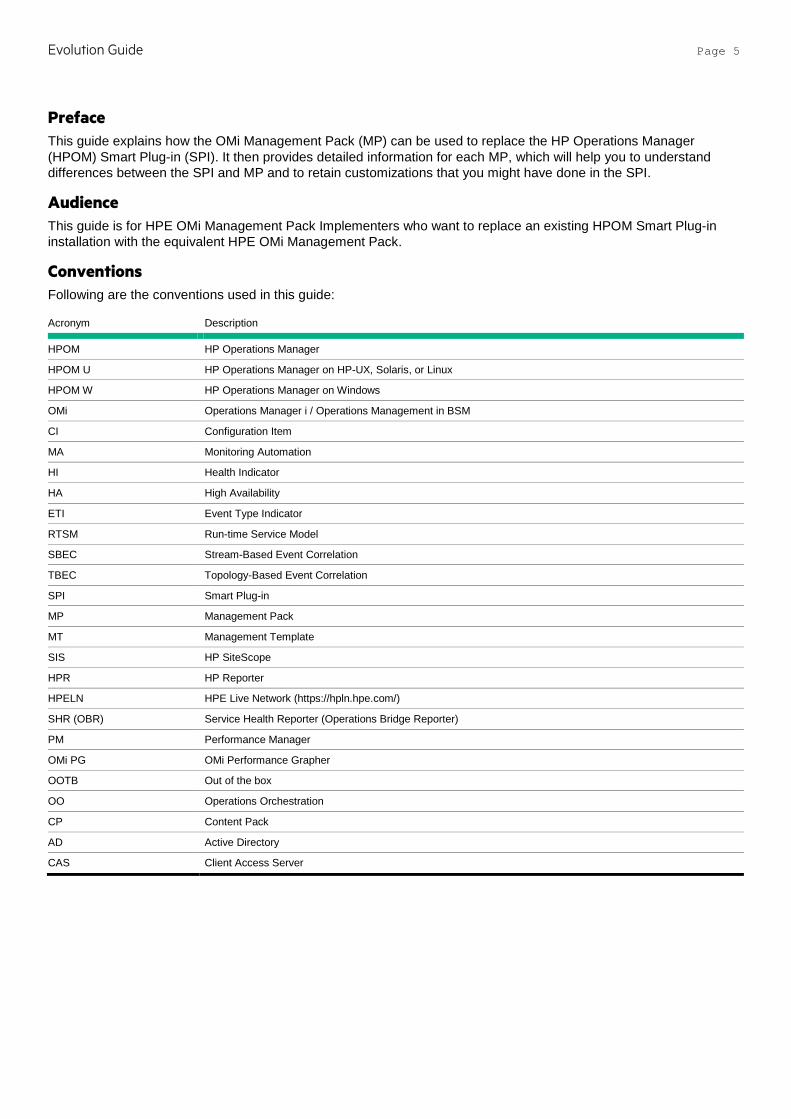
Conventions Following are the conventions used in this guide:
Acronym Description
HPOM HP Operations Manager
HPOM U HP Operations Manager on HP-UX, Solaris, or Linux
HPOM W HP Operations Manager on Windows
OMi Operations Manager i / Operations Management in BSM
CI Configuration Item
MA Monitoring Automation
HI Health Indicator
HA High Availability
ETI Event Type Indicator
RTSM Run-time Service Model
SBEC Stream-Based Event Correlation
TBEC Topology-Based Event Correlation
SPI Smart Plug-in
MP Management Pack
MT Management Template
SIS HP SiteScope
HPR HP Reporter
HPELN HPE Live Network (https://hpln.hpe.com/)
SHR (OBR) Service Health Reporter (Operations Bridge Reporter)
PM Performance Manager
OMi PG OMi Performance Grapher
OOTB Out of the box
OO Operations Orchestration
CP Content Pack
AD Active Directory
CAS Client Access Server
Evolution Guide Page 6
Introduction Overview OMi Management Packs (MPs) offer out-of-the-box content for monitoring infrastructure and applications. MPs harness the power of HPE OMi such as the Topology-Based Event Correlation (TBEC) and Monitoring Automation features. MPs support advanced monitoring configuration concepts such as aspects and parameterized policies that are not available with Smart Plug-ins (SPIs) for HP Operations Manager (HPOM).
This guide helps you transition from HPOM SPIs to OMi MPs when moving responsibilities from an HPOM server to OMi. It explains the conceptual differences between SPIs and MPs, describes the MP licensing model, and provides an overview of the steps for replacing a SPI with the corresponding MP including how to retain customizations that you might have done in the SPI.
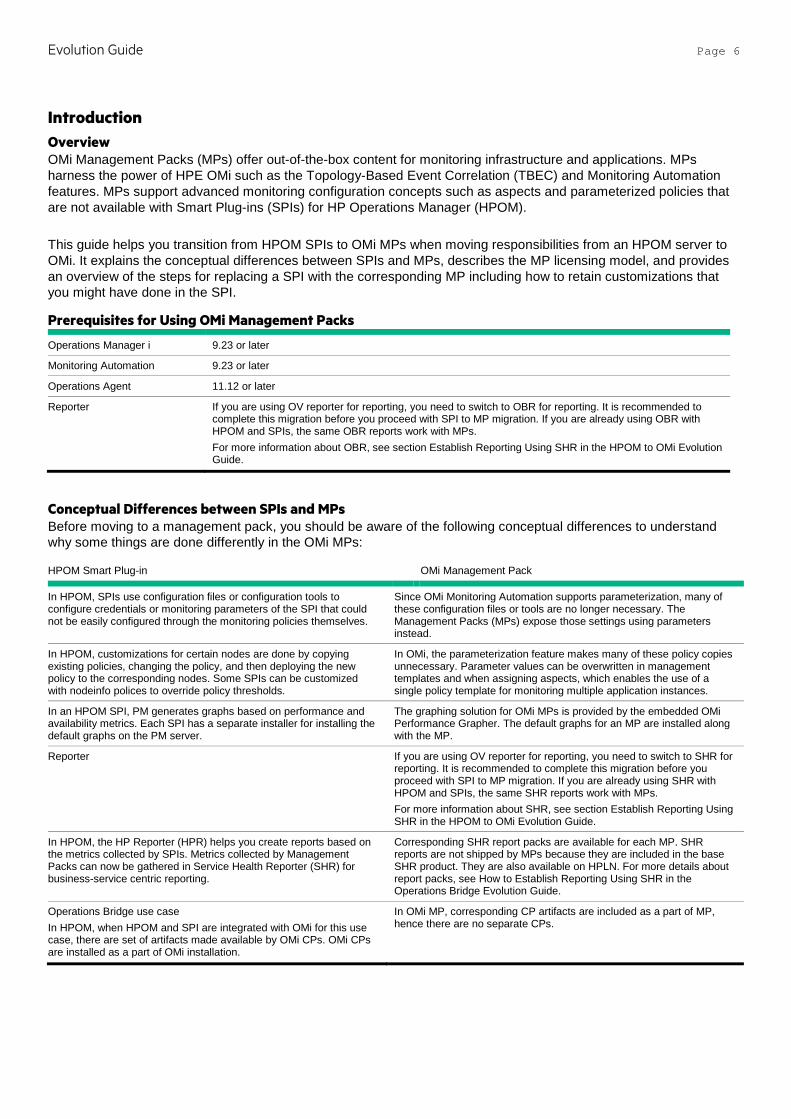
Prerequisites for Using OMi Management Packs
Operations Manager i 9.23 or later
Monitoring Automation 9.23 or later
Operations Agent 11.12 or later
Reporter If you are using OV reporter for reporting, you need to switch to OBR for reporting. It is recommended to complete this migration before you proceed with SPI to MP migration. If you are already using OBR with HPOM and SPIs, the same OBR reports work with MPs. For more information about OBR, see section Establish Reporting Using SHR in the HPOM to OMi Evolution Guide.
Conceptual Differences between SPIs and MPs Before moving to a management pack, you should be aware of the following conceptual differences to understand why some things are done differently in the OMi MPs:
HPOM Smart Plug-in OMi Management Pack
In HPOM, SPIs use configuration files or configuration tools to configure credentials or monitoring parameters of the SPI that could not be easily configured through the monitoring policies themselves.
Since OMi Monitoring Automation supports parameterization, many of these configuration files or tools are no longer necessary. The Management Packs (MPs) expose those settings using parameters instead.
In HPOM, customizations for certain nodes are done by copying existing policies, changing the policy, and then deploying the new policy to the corresponding nodes. Some SPIs can be customized with nodeinfo polices to override policy thresholds.
In OMi, the parameterization feature makes many of these policy copies unnecessary. Parameter values can be overwritten in management templates and when assigning aspects, which enables the use of a single policy template for monitoring multiple application instances.
In an HPOM SPI, PM generates graphs based on performance and availability metrics. Each SPI has a separate installer for installing the default graphs on the PM server.
The graphing solution for OMi MPs is provided by the embedded OMi Performance Grapher. The default graphs for an MP are installed along with the MP.
Reporter If you are using OV reporter for reporting, you need to switch to SHR for reporting. It is recommended to complete this migration before you proceed with SPI to MP migration. If you are already using SHR with HPOM and SPIs, the same SHR reports work with MPs. For more information about SHR, see section Establish Reporting Using SHR in the HPOM to OMi Evolution Guide.
In HPOM, the HP Reporter (HPR) helps you create reports based on the metrics collected by SPIs. Metrics collected by Management Packs can now be gathered in Service Health Reporter (SHR) for business-service centric reporting.
Corresponding SHR report packs are available for each MP. SHR reports are not shipped by MPs because they are included in the base SHR product. They are also available on HPLN. For more details about report packs, see How to Establish Reporting Using SHR in the Operations Bridge Evolution Guide.
Operations Bridge use case In HPOM, when HPOM and SPI are integrated with OMi for this use case, there are set of artifacts made available by OMi CPs. OMi CPs are installed as a part of OMi installation.
In OMi MP, corresponding CP artifacts are included as a part of MP, hence there are no separate CPs.
Evolution Guide Page 7
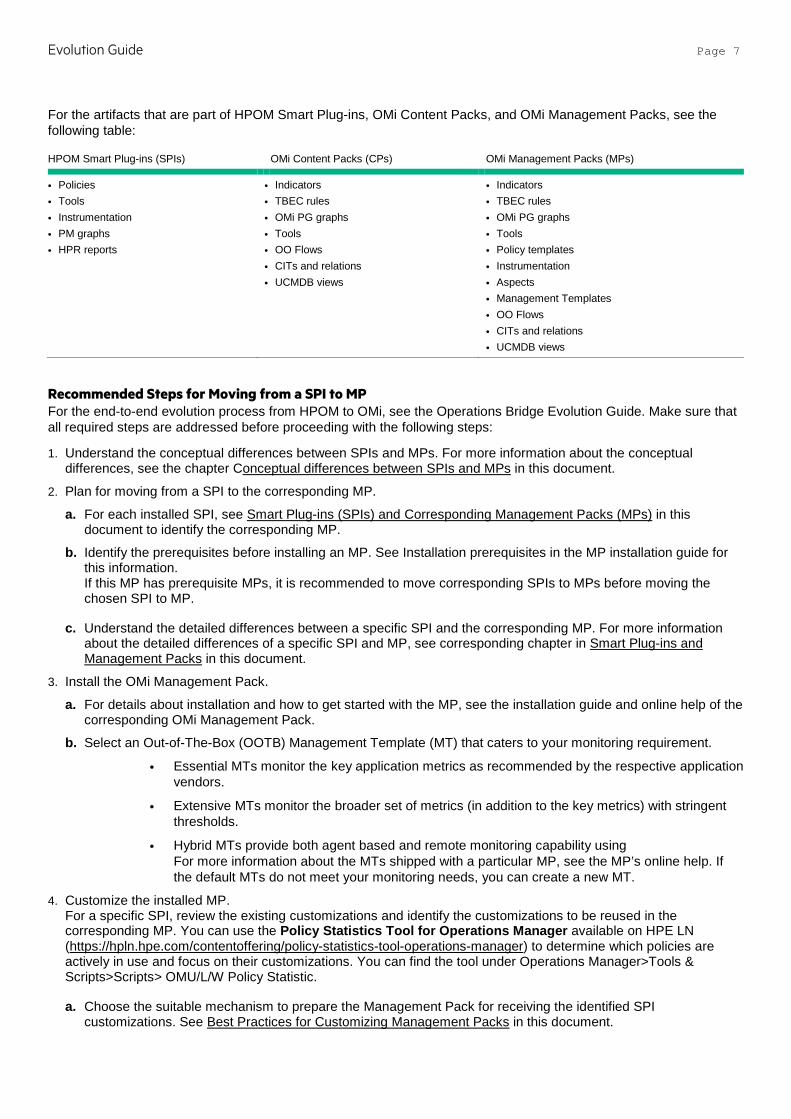
For the artifacts that are part of HPOM Smart Plug-ins, OMi Content Packs, and OMi Management Packs, see the following table:
HPOM Smart Plug-ins (SPIs) OMi Content Packs (CPs) OMi Management Packs (MPs)
• Policies • Tools • Instrumentation • PM graphs • HPR reports
• Indicators • TBEC rules • OMi PG graphs • Tools • OO Flows • CITs and relations • UCMDB views
• Indicators • TBEC rules • OMi PG graphs • Tools • Policy templates • Instrumentation • Aspects • Management Templates • OO Flows • CITs and relations • UCMDB views
Recommended Steps for Moving from a SPI to MP For the end-to-end evolution process from HPOM to OMi, see the Operations Bridge Evolution Guide. Make sure that all required steps are addressed before proceeding with the following steps:
1. Understand the conceptual differences between SPIs and MPs. For more information about the conceptual differences, see the chapter Conceptual differences between SPIs and MPs in this document.
2. Plan for moving from a SPI to the corresponding MP.
a. For each installed SPI, see Smart Plug-ins (SPIs) and Corresponding Management Packs (MPs) in this document to identify the corresponding MP.
b. Identify the prerequisites before installing an MP. See Installation prerequisites in the MP installation guide for this information. If this MP has prerequisite MPs, it is recommended to move corresponding SPIs to MPs before moving the chosen SPI to MP.
c. Understand the detailed differences between a specific SPI and the corresponding MP. For more information about the detailed differences of a specific SPI and MP, see corresponding chapter in Smart Plug-ins and Management Packs in this document.
3. Install the OMi Management Pack.
a. For details about installation and how to get started with the MP, see the installation guide and online help of the corresponding OMi Management Pack.
b. Select an Out-of-The-Box (OOTB) Management Template (MT) that caters to your monitoring requirement.
• Essential MTs monitor the key application metrics as recommended by the respective application vendors.
• Extensive MTs monitor the broader set of metrics (in addition to the key metrics) with stringent thresholds.
• Hybrid MTs provide both agent based and remote monitoring capability using For more information about the MTs shipped with a particular MP, see the MP’s online help. If the default MTs do not meet your monitoring needs, you can create a new MT.
4. Customize the installed MP. For a specific SPI, review the existing customizations and identify the customizations to be reused in the corresponding MP. You can use the Policy Statistics Tool for Operations Manager available on HPE LN (https://hpln.hpe.com/contentoffering/policy-statistics-tool-operations-manager) to determine which policies are actively in use and focus on their customizations. You can find the tool under Operations Manager>Tools & Scripts>Scripts> OMU/L/W Policy Statistic.
a. Choose the suitable mechanism to prepare the Management Pack for receiving the identified SPI customizations. See Best Practices for Customizing Management Packs in this document.

Evolution Guide Page 8
b. Copy customizations manually from the SPI policies to the corresponding MP artifacts (parameters, policy templates or MTs). For more information about the SPI policy to MP policy template mapping, see the section Smart Plug-ins and Management Packs in this document.
c. Perform any additional customization required to the MP. For example, you might need to perform additional customizations to the OOTB MTs, aspects, parameters list, and so on. For the recommended approach, see the section Best Practices for Customizing Management Packs in this document. For information on the supported platforms, see HPE Software Support Online.
5. Prepare nodes for deployment.
a. Identify the nodes to be monitored by the MP.
b. Disable topology synchronization on the OMi Server.
Note: Removing SPI discovery policy from a node deletes services in HPOM and CIs in the OMi’s RTSM. Therefore disabling topology synchronization on the OMi Server is essential to prevent CIs getting deleted. When you have identified a node that is monitored by any of the SPIs listed below, then topology synchronization should NOT be disabled. In these cases, due to changes in CI attribute values in the corresponding Management Packs, disabling topology synchronization may result in CI duplication on the OMi Server.
• HPOM Smart Plug-in for WebSphere
• HPOM Smart Plug-in for WebLogic
• HPOM Smart Plug-in for Apache
c. Undeploy the Discovery policy and all other policies deployed to the identified nodes from the HPOM Server.
d. Remove SPI artifacts from the nodes. For more information about the artifacts to be removed, see Node Cleanup for an MP for this SPI in Smart Plug-ins and Management Packs in this document.
e. Assign the node to the OMi Server. See Manage Operations Agents from OMi step-by-step in the Operations Bridge Evolution Guide.
f. If you have disabled the topology synchronization on the OMi Server in Step 5.b then enable it.
6. Start monitoring the application by deploying MTs. See the deployment information in the corresponding MP’s Installation Guide.
7. Repeat steps 2 to 6 for each additional SPI.
License Entitlement and Licensing for OMi Management Packs All the existing HP Operations Smart Plug-in customers are entitled to exchange their HPOM SPI licenses for the OMi Management Pack licenses. Contact your HP support renewal executive to receive this license entitlement. Infrastructure and the Apache Web Server MPs are free with OMi.
Licensing in SPIs and MPs:
HPOM Smart Plug-ins (SPIs) OMi Management Packs (OMi MPs)
Instance based counting. Each application instance monitored by SPIs are counted for licensing. Example: On an OS instance, if two MSSQL Server instances and two Web server instances are monitored by corresponding SPIs, it would be counted as four.
OS instance based counting. On an OS instance, whether one or more instance of same or different applications are monitored by MPs, that would be counted as one. Example: On an OS instance, if two MSSQL Server instances and two Web server instances are monitored by corresponding MPs, it would be counted as one.
Smart Plug-ins (SPIs) and Corresponding Management Packs (MPs) This chapter explains the detailed differences between a specific SPI and the corresponding MP.
Evolution Guide Page 9
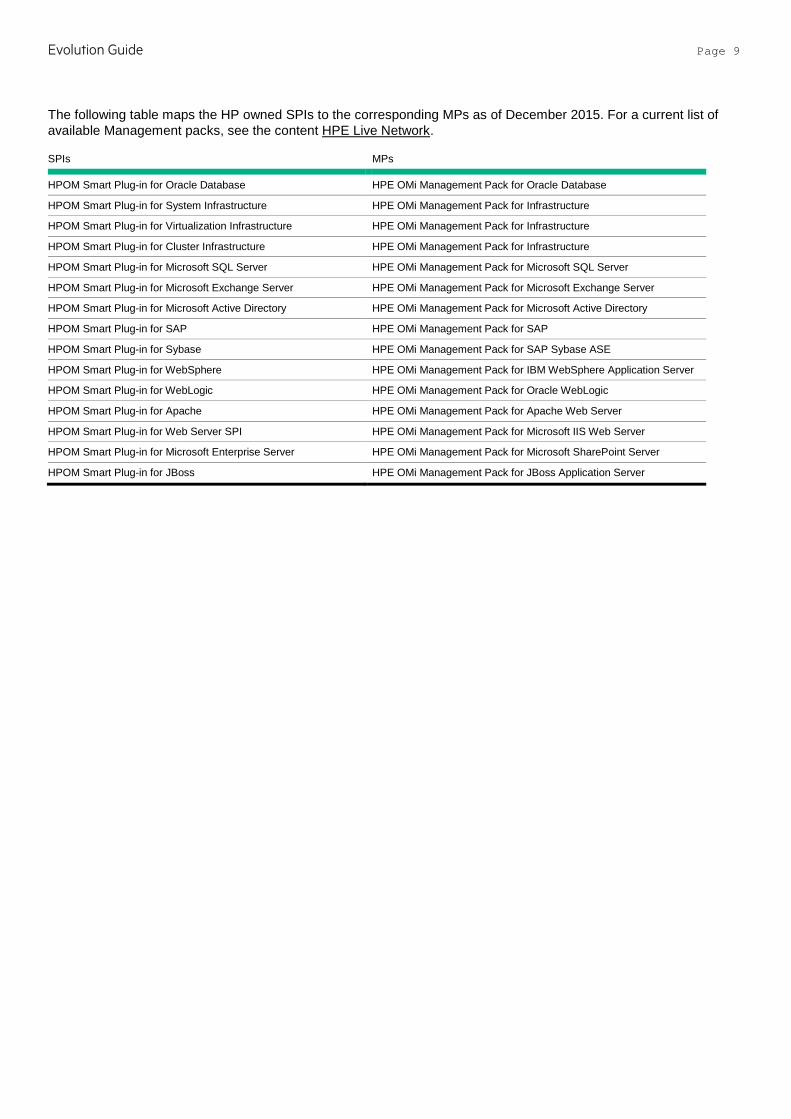
The following table maps the HP owned SPIs to the corresponding MPs as of December 2015. For a current list of available Management packs, see the content HPE Live Network.
SPIs MPs
HPOM Smart Plug-in for Oracle Database HPE OMi Management Pack for Oracle Database
HPOM Smart Plug-in for System Infrastructure HPE OMi Management Pack for Infrastructure
HPOM Smart Plug-in for Virtualization Infrastructure HPE OMi Management Pack for Infrastructure
HPOM Smart Plug-in for Cluster Infrastructure HPE OMi Management Pack for Infrastructure
HPOM Smart Plug-in for Microsoft SQL Server HPE OMi Management Pack for Microsoft SQL Server
HPOM Smart Plug-in for Microsoft Exchange Server HPE OMi Management Pack for Microsoft Exchange Server
HPOM Smart Plug-in for Microsoft Active Directory HPE OMi Management Pack for Microsoft Active Directory
HPOM Smart Plug-in for SAP HPE OMi Management Pack for SAP
HPOM Smart Plug-in for Sybase HPE OMi Management Pack for SAP Sybase ASE
HPOM Smart Plug-in for WebSphere HPE OMi Management Pack for IBM WebSphere Application Server
HPOM Smart Plug-in for WebLogic HPE OMi Management Pack for Oracle WebLogic
HPOM Smart Plug-in for Apache HPE OMi Management Pack for Apache Web Server
HPOM Smart Plug-in for Web Server SPI HPE OMi Management Pack for Microsoft IIS Web Server
HPOM Smart Plug-in for Microsoft Enterprise Server HPE OMi Management Pack for Microsoft SharePoint Server
HPOM Smart Plug-in for JBoss HPE OMi Management Pack for JBoss Application Server
Evolution Guide Page 10
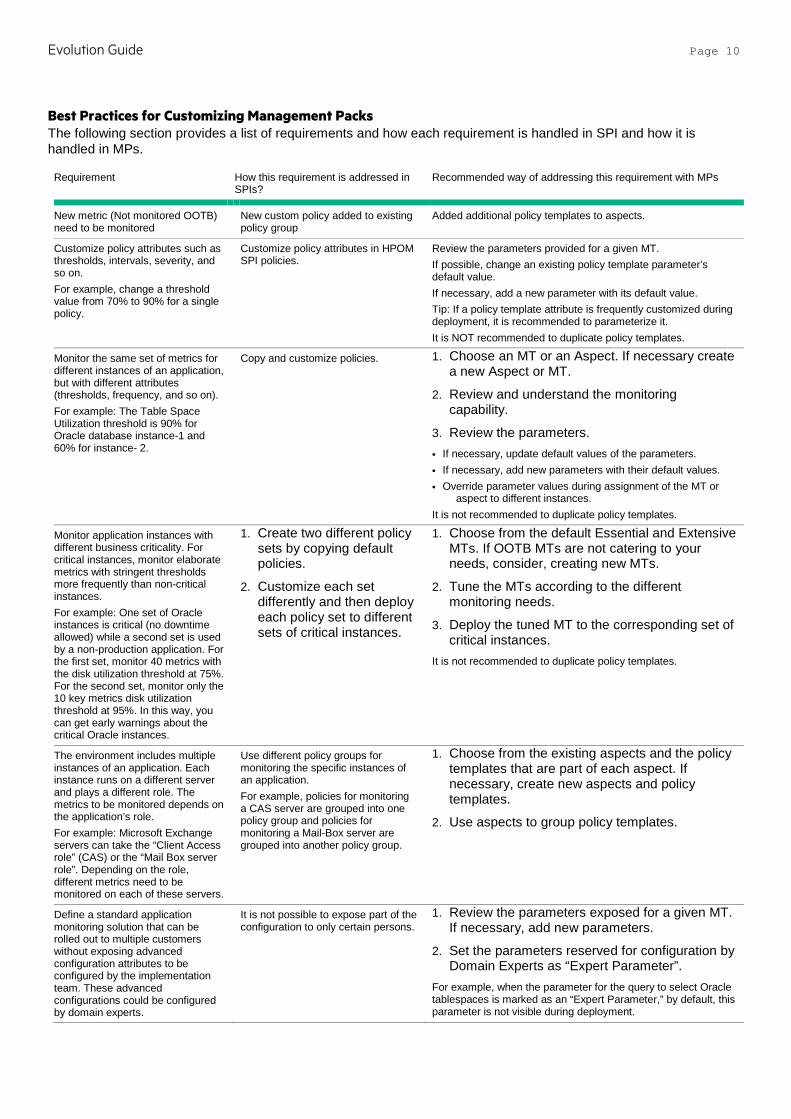
Best Practices for Customizing Management Packs The following section provides a list of requirements and how each requirement is handled in SPI and how it is handled in MPs.
Requirement How this requirement is addressed in SPIs?
Recommended way of addressing this requirement with MPs
New metric (Not monitored OOTB) need to be monitored
New custom policy added to existing policy group
Added additional policy templates to aspects.
Customize policy attributes such as thresholds, intervals, severity, and so on. For example, change a threshold value from 70% to 90% for a single policy.
Customize policy attributes in HPOM SPI policies.
Review the parameters provided for a given MT. If possible, change an existing policy template parameter’s default value. If necessary, add a new parameter with its default value. Tip: If a policy template attribute is frequently customized during deployment, it is recommended to parameterize it. It is NOT recommended to duplicate policy templates.
Monitor the same set of metrics for different instances of an application, but with different attributes (thresholds, frequency, and so on). For example: The Table Space Utilization threshold is 90% for Oracle database instance-1 and 60% for instance- 2.
Copy and customize policies. 1. Choose an MT or an Aspect. If necessary create a new Aspect or MT.
2. Review and understand the monitoring capability.
3. Review the parameters. • If necessary, update default values of the parameters. • If necessary, add new parameters with their default values. • Override parameter values during assignment of the MT or
aspect to different instances. It is not recommended to duplicate policy templates.
Monitor application instances with different business criticality. For critical instances, monitor elaborate metrics with stringent thresholds more frequently than non-critical instances. For example: One set of Oracle instances is critical (no downtime allowed) while a second set is used by a non-production application. For the first set, monitor 40 metrics with the disk utilization threshold at 75%. For the second set, monitor only the 10 key metrics disk utilization threshold at 95%. In this way, you can get early warnings about the critical Oracle instances.
1. Create two different policy sets by copying default policies.
2. Customize each set differently and then deploy each policy set to different sets of critical instances.
1. Choose from the default Essential and Extensive MTs. If OOTB MTs are not catering to your needs, consider, creating new MTs.
2. Tune the MTs according to the different monitoring needs.
3. Deploy the tuned MT to the corresponding set of critical instances.
It is not recommended to duplicate policy templates.
The environment includes multiple instances of an application. Each instance runs on a different server and plays a different role. The metrics to be monitored depends on the application’s role. For example: Microsoft Exchange servers can take the “Client Access role” (CAS) or the “Mail Box server role”. Depending on the role, different metrics need to be monitored on each of these servers.
Use different policy groups for monitoring the specific instances of an application. For example, policies for monitoring a CAS server are grouped into one policy group and policies for monitoring a Mail-Box server are grouped into another policy group.
1. Choose from the existing aspects and the policy templates that are part of each aspect. If necessary, create new aspects and policy templates.
2. Use aspects to group policy templates.
Define a standard application monitoring solution that can be rolled out to multiple customers without exposing advanced configuration attributes to be configured by the implementation team. These advanced configurations could be configured by domain experts.
It is not possible to expose part of the configuration to only certain persons.
1. Review the parameters exposed for a given MT. If necessary, add new parameters.
2. Set the parameters reserved for configuration by Domain Experts as “Expert Parameter”.
For example, when the parameter for the query to select Oracle tablespaces is marked as an “Expert Parameter,” by default, this parameter is not visible during deployment.

Evolution Guide Page 11
For example, a query to select Oracle tablespaces for monitoring can be only set by an Oracle SME or domain expert.
Monitor different metrics of an application based on certain attributes of a CI. For example, between two SAP versions, provide different metrics. Some metrics are not provided in a particular version.
Create policies specific to application version, and then deploy those policies to the appropriate nodes.
Choose from the available policy templates. If necessary, create new policy templates and add them as part of an aspect pertaining to a particular application version. Use conditional deployment to automatically deploy this aspect to the CIs of a particular application version only.
Monitor a composite application 1. Use different SPIs.
2. Customize each SPI individually.
3. Deploy SPI policy groups to the appropriate node groups
You must know the policy groups that need to be deployed to a given node group.
Choose from the default MTs, aspects, and policy templates. If necessary, create a new MT and add aspects for monitoring various components that are part of the composite application. MTs are assigned to a view with all components of an application topology. As a result, it is simple to assign, deploy and undeploy monitoring for the whole topology. When new CIs are added to the view or CIs are removed from a view, monitoring deployment and undeployment happens automatically
Infrastructure SPI and Management Pack This section explains the evolution of the HPOM Smart Plug-in for System Infrastructure 11.11 or higher to HPE OMi Management Pack for Infrastructure 1.10.
SPI and MP Comparison This section provides an overview of similarities and differences between HPOM Smart Plug-in for System Infrastructure (Infrastructure SPI) and OMi MP for Infrastructure (Infrastructure MP). For information about working with an OMi MP for Infrastructure (Infrastructure MP), see the HPE OMi Management Pack for Infrastructure User Guide.
Features Infrastructure SPI 11.11 or higher Infrastructure MP 1.10
Pre-requisites • HPOM W 8.16, HPOM W 9.x, HPOM U/S/L 9.1 or higher
• HP Operations Agent 11.0x or higher
• BSM/MA 9.22 or higher • HP Operations Agent 11.12 or higher
Product Delivery The Infrastructure SPI Is shipped as part of the Operations Agent media and updates are delivered through the Operations Agent patches.
The Infrastructure MP is shipped with OMi 10. It is also available for download from the OMi try now webpage. Updates can be downloaded from My Software updates (SUM) portal. For the links to the above mentioned locations, see the section Useful resources in this document.
Installation Mount the ISO and use the OS specific installer: • HPOM UNIX and Linux: oainstall.sh • HPOM Windows: oainstall.vbs Separate graph and report packages are available for Infrastructure SPI. These can be installed separately on the appropriate PM or Reporter server systems.
1. The Infrastructure MP can be installed in any of the following methods:
2. Use the OMi ConfigWizard to install OMi 10.x. Use this option when you want to install the MP during OMi 10.x installation. Install using the command line interface. Use this option when you want to install the MP after installing OMi 10.x. For information about opr-mp-installer Command-Line Interface, see the OMi Administration Guide.
3. Download the MP bits from the OMi try now webpage. Then mount ISO and use the OS specific installer:
• Linux: mpinstall.sh-i • Windows: cscript mpinstall.vbs-i Use this option, when the latest version of this MP is available on the OMi try now webpage.
Evolution Guide Page 12
Infrastructure MP ships graphs that can be launched in OMi PG (OMi Performance Graph). For long-term reporting, it is recommended to use the HP Service Health Reporter (SHR). SHR ships several report packs as part of the standard media. For additional content and content pack updates, see HP Live Network.
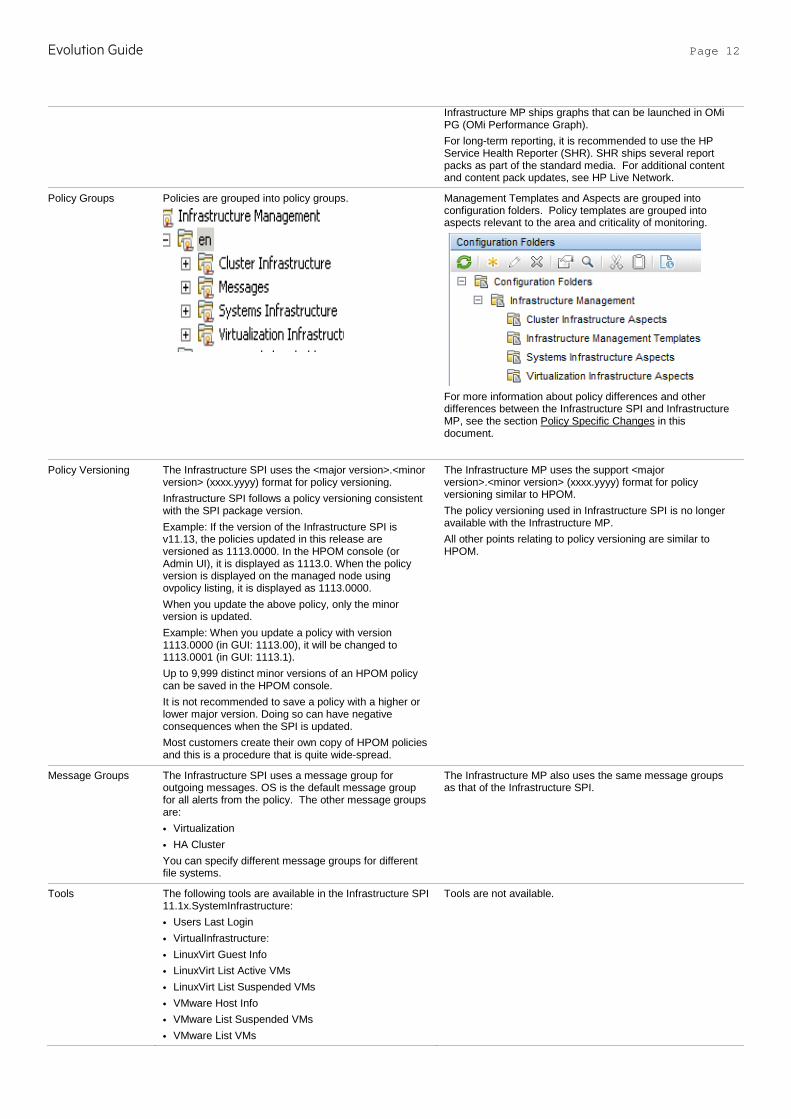
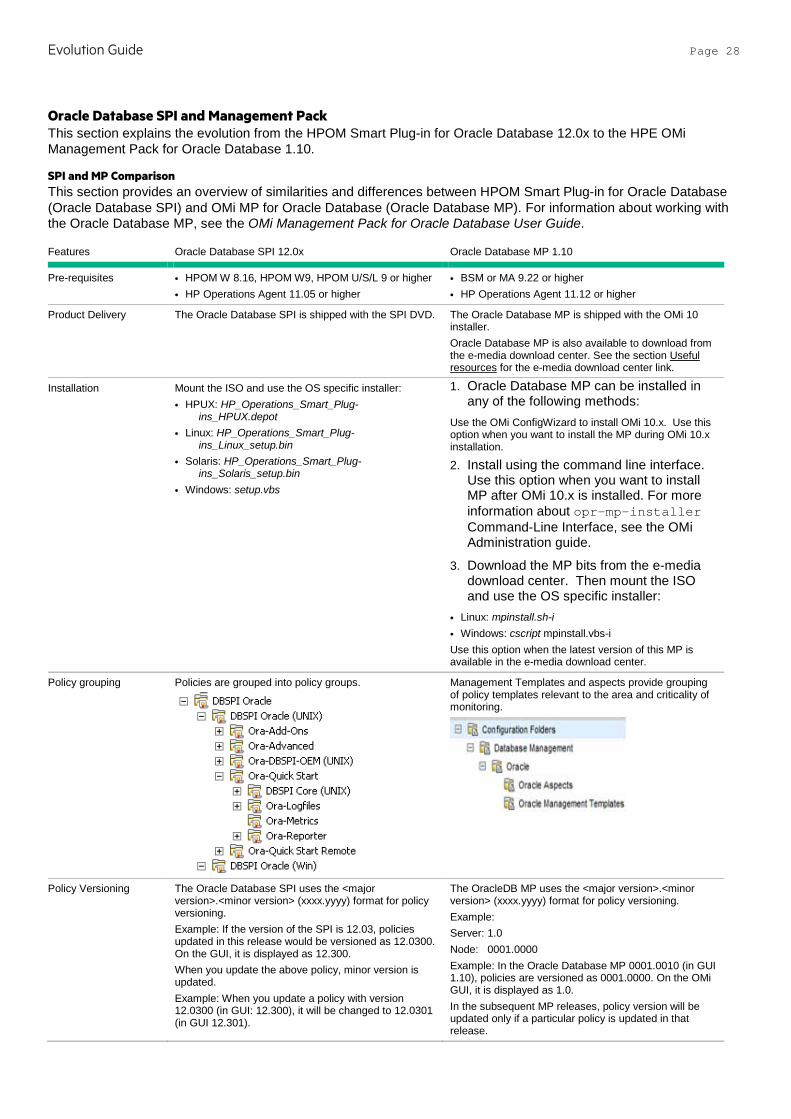
Policy Groups Policies are grouped into policy groups.
Management Templates and Aspects are grouped into configuration folders. Policy templates are grouped into aspects relevant to the area and criticality of monitoring.
For more information about policy differences and other differences between the Infrastructure SPI and Infrastructure MP, see the section Policy Specific Changes in this document.
Policy Versioning The Infrastructure SPI uses the <major version>.<minor version> (xxxx.yyyy) format for policy versioning. Infrastructure SPI follows a policy versioning consistent with the SPI package version. Example: If the version of the Infrastructure SPI is v11.13, the policies updated in this release are versioned as 1113.0000. In the HPOM console (or Admin UI), it is displayed as 1113.0. When the policy version is displayed on the managed node using ovpolicy listing, it is displayed as 1113.0000. When you update the above policy, only the minor version is updated. Example: When you update a policy with version 1113.0000 (in GUI: 1113.00), it will be changed to 1113.0001 (in GUI: 1113.1). Up to 9,999 distinct minor versions of an HPOM policy can be saved in the HPOM console. It is not recommended to save a policy with a higher or lower major version. Doing so can have negative consequences when the SPI is updated. Most customers create their own copy of HPOM policies and this is a procedure that is quite wide-spread.
The Infrastructure MP uses the support <major version>.<minor version> (xxxx.yyyy) format for policy versioning similar to HPOM. The policy versioning used in Infrastructure SPI is no longer available with the Infrastructure MP. All other points relating to policy versioning are similar to HPOM.
Message Groups The Infrastructure SPI uses a message group for outgoing messages. OS is the default message group for all alerts from the policy. The other message groups are: • Virtualization • HA Cluster You can specify different message groups for different file systems.
The Infrastructure MP also uses the same message groups as that of the Infrastructure SPI.
Tools The following tools are available in the Infrastructure SPI 11.1x.SystemInfrastructure: • Users Last Login • VirtualInfrastructure: • LinuxVirt Guest Info • LinuxVirt List Active VMs • LinuxVirt List Suspended VMs • VMware Host Info • VMware List Suspended VMs • VMware List VMs
Tools are not available.
Evolution Guide Page 13
• VMware Resource Pool Info • VMware vMA OverAll Status
Instrumentation HPOM Server: SPI Instrumentation is copied to following locations on the HPOM server: UNIX: Instrumentation is copied first to:
<OvInstallDir>/install/INFRASPI/C.utf8/instrumentation
And later moved to the following directory:
<OvDataDir>/share/databases/OpC/mgd_node/instrumentation
Windows: %OvInstallDir%/Install
Node: SPI Instrumentation will be deployed to node with respective policy deployment to the following directory:
UNIX: <OvDataDir>/bin/instrumentation/
Windows: %OvDataDir%/bin/instrumentation
SPI instrumentation provides the following categories updated with each version update:
ClusterInfrastructure_v200
SystemsInfrastructure_v200
VirtualInfrastructure_v200
ClusterInfrastructure_v1110
SystemsInfrastructure_v1110
VirtualInfrastructure_v1110
ClusterInfrastructure_v1113
SystemsInfrastructure_v1113
VirtualInfrastructure_v1113
This structure supports the use of multiple versions of Infrastructure SPI policies and instrumentation in parallel for different nodes in their environment, depending on the Infrastructure SPI and Operations Agent support matrix and feature updates.
OMi Server: Instrumentation is uploaded into the OMi database. The instrumentation categories are: • SystemsInfrastructure • ClusterInfrastructure • VirtualInfrastructure This may change in future to accommodate customer needs to run multiple agents and Infrastructure MP policy versions in parallel.
Note: There is no difference with the instrumentation locations on managed nodes. Instrumentation is deployed to the same directories on the managed node whether deployed from HPOM or OMi.
Discovery Deploy policies from the following groups to each managed node: • Messages • Agent Settings • AutoDiscovery To discover an HPOM managed node and its components, deploy SI-SystemDiscovery. To discover HA clusters, deploy CI-ClusterDiscovery to one or more HA cluster nodes.
Note: Do not deploy the discovery policy to the virtual (HARG) node of the cluster. Deploy to the actual nodes participating in the cluster.
To discover virtual environments, deploy VI-Discovery. When the Discovery policy is removed from a node, the elements created in RTSM through Topology Sync / D-MoM by the discovery policy are removed. Re-deploying the aspect recreates the elements with different CI IDs. Removing a Discovery policy from a managed node or proxy provides a clean agent side repository and removes the corresponding CIs from RTSM (for an operations bridge (ops bridge) setup).
There is no difference in topology that is discovered by Infrastructure SPI and Infrastructure MP. Following aspects need to be deployed on the managed node. • To discover physical nodes, deploy the System
Infrastructure Discovery aspect. • To discover HA clusters, deploy the Cluster Infrastructure
Discovery aspect to one or more HA cluster nodes.
Note: Do not deploy the Discovery policy to the virtual (HARG) node of the cluster. Deploy the Discovery policy to the actual nodes participating in the cluster.
• To discover Virtual environments running on VMware vSphere, IBM AIX, Oracle Solaris, Linux-KVM and Linux-Xen infrastructure, deploy the Virtual Infrastructure Discovery aspect.
Note: The VMware vMA is not supported as a monitoring proxy node with the Infrastructure MP. The method to monitor VMware VMs is by
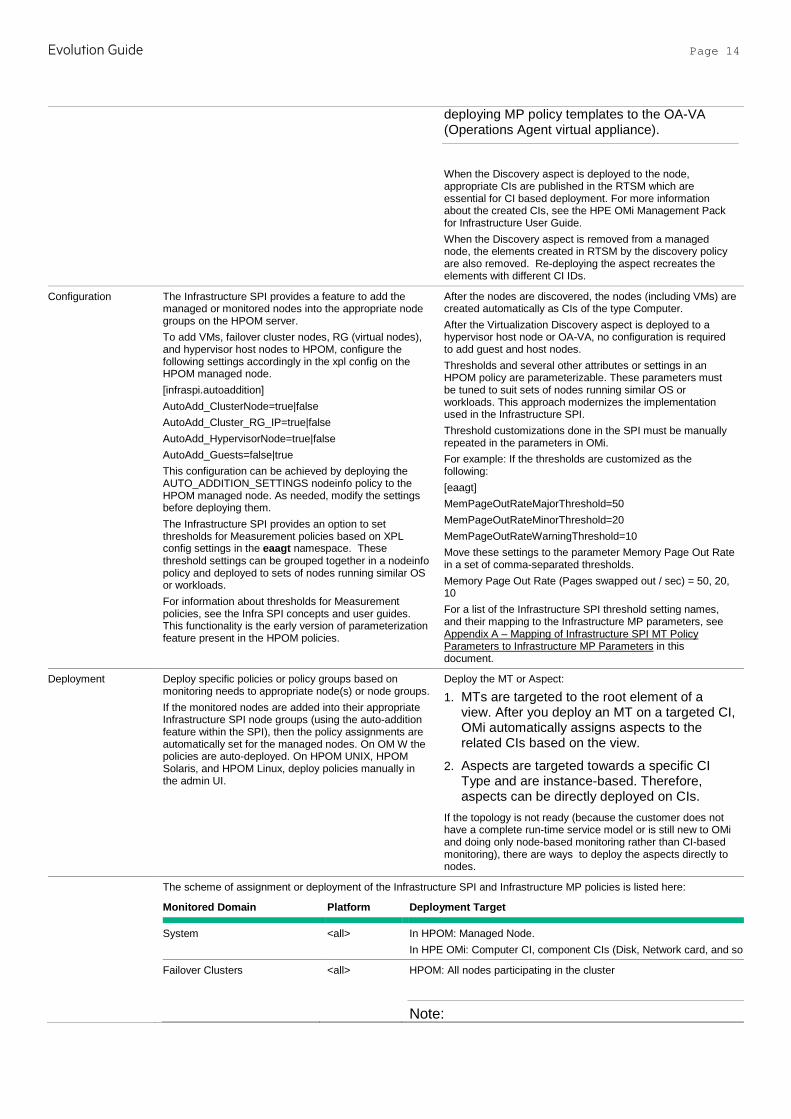
Evolution Guide Page 14
deploying MP policy templates to the OA-VA (Operations Agent virtual appliance).
When the Discovery aspect is deployed to the node, appropriate CIs are published in the RTSM which are essential for CI based deployment. For more information about the created CIs, see the HPE OMi Management Pack for Infrastructure User Guide. When the Discovery aspect is removed from a managed node, the elements created in RTSM by the discovery policy are also removed. Re-deploying the aspect recreates the elements with different CI IDs.
Configuration The Infrastructure SPI provides a feature to add the managed or monitored nodes into the appropriate node groups on the HPOM server. To add VMs, failover cluster nodes, RG (virtual nodes), and hypervisor host nodes to HPOM, configure the following settings accordingly in the xpl config on the HPOM managed node. [infraspi.autoaddition] AutoAdd_ClusterNode=true|false AutoAdd_Cluster_RG_IP=true|false AutoAdd_HypervisorNode=true|false AutoAdd_Guests=false|true This configuration can be achieved by deploying the AUTO_ADDITION_SETTINGS nodeinfo policy to the HPOM managed node. As needed, modify the settings before deploying them. The Infrastructure SPI provides an option to set thresholds for Measurement policies based on XPL config settings in the eaagt namespace. These threshold settings can be grouped together in a nodeinfo policy and deployed to sets of nodes running similar OS or workloads. For information about thresholds for Measurement policies, see the Infra SPI concepts and user guides. This functionality is the early version of parameterization feature present in the HPOM policies.
After the nodes are discovered, the nodes (including VMs) are created automatically as CIs of the type Computer. After the Virtualization Discovery aspect is deployed to a hypervisor host node or OA-VA, no configuration is required to add guest and host nodes. Thresholds and several other attributes or settings in an HPOM policy are parameterizable. These parameters must be tuned to suit sets of nodes running similar OS or workloads. This approach modernizes the implementation used in the Infrastructure SPI. Threshold customizations done in the SPI must be manually repeated in the parameters in OMi. For example: If the thresholds are customized as the following: [eaagt] MemPageOutRateMajorThreshold=50 MemPageOutRateMinorThreshold=20 MemPageOutRateWarningThreshold=10 Move these settings to the parameter Memory Page Out Rate in a set of comma-separated thresholds. Memory Page Out Rate (Pages swapped out / sec) = 50, 20, 10 For a list of the Infrastructure SPI threshold setting names, and their mapping to the Infrastructure MP parameters, see Appendix A – Mapping of Infrastructure SPI MT Policy Parameters to Infrastructure MP Parameters in this document.
Deployment Deploy specific policies or policy groups based on monitoring needs to appropriate node(s) or node groups. If the monitored nodes are added into their appropriate Infrastructure SPI node groups (using the auto-addition feature within the SPI), then the policy assignments are automatically set for the managed nodes. On OM W the policies are auto-deployed. On HPOM UNIX, HPOM Solaris, and HPOM Linux, deploy policies manually in the admin UI.
Deploy the MT or Aspect:
1. MTs are targeted to the root element of a view. After you deploy an MT on a targeted CI, OMi automatically assigns aspects to the related CIs based on the view.
2. Aspects are targeted towards a specific CI Type and are instance-based. Therefore, aspects can be directly deployed on CIs.
If the topology is not ready (because the customer does not have a complete run-time service model or is still new to OMi and doing only node-based monitoring rather than CI-based monitoring), there are ways to deploy the aspects directly to nodes.
The scheme of assignment or deployment of the Infrastructure SPI and Infrastructure MP policies is listed here:
Monitored Domain Platform Deployment Target
System <all> In HPOM: Managed Node. In HPE OMi: Computer CI, component CIs (Disk, Network card, and so
Failover Clusters <all> HPOM: All nodes participating in the cluster
Note:
Evolution Guide Page 15
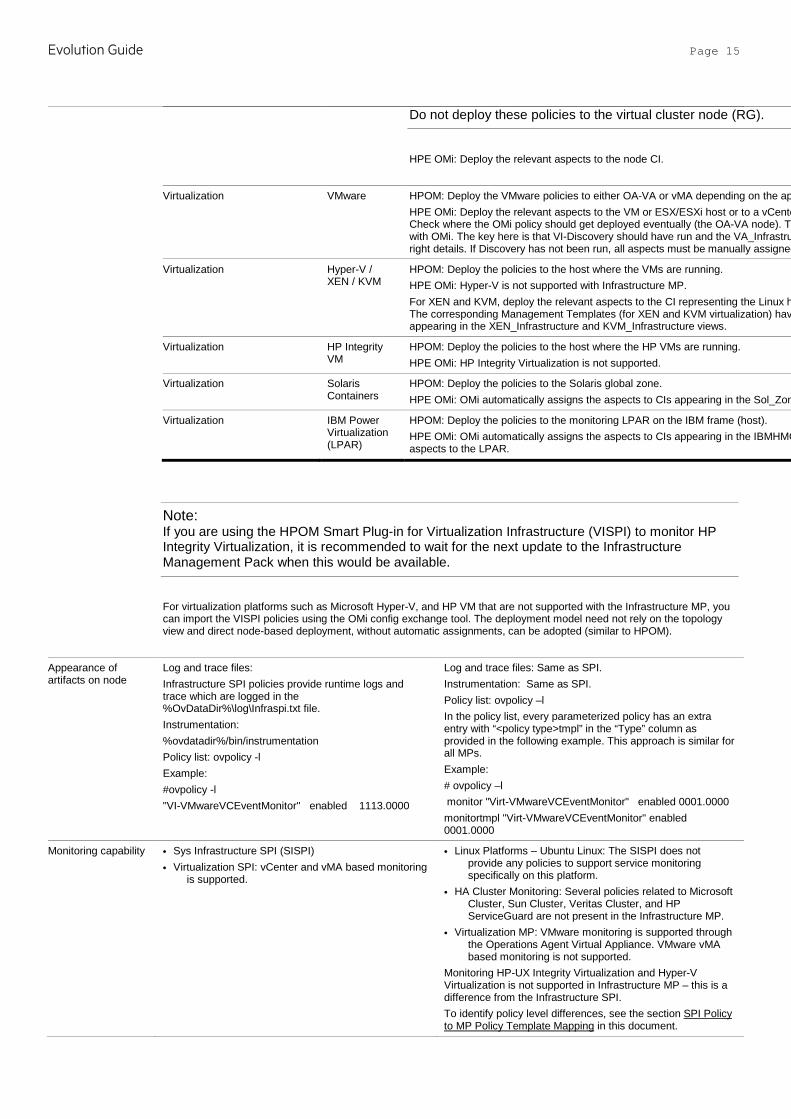
Do not deploy these policies to the virtual cluster node (RG).
HPE OMi: Deploy the relevant aspects to the node CI.
Virtualization VMware HPOM: Deploy the VMware policies to either OA-VA or vMA depending on the ap HPE OMi: Deploy the relevant aspects to the VM or ESX/ESXi host or to a vCente Check where the OMi policy should get deployed eventually (the OA-VA node). Th with OMi. The key here is that VI-Discovery should have run and the VA_Infrastru right details. If Discovery has not been run, all aspects must be manually assigned
Virtualization Hyper-V / XEN / KVM
HPOM: Deploy the policies to the host where the VMs are running. HPE OMi: Hyper-V is not supported with Infrastructure MP. For XEN and KVM, deploy the relevant aspects to the CI representing the Linux h The corresponding Management Templates (for XEN and KVM virtualization) hav appearing in the XEN_Infrastructure and KVM_Infrastructure views.
Virtualization HP Integrity VM
HPOM: Deploy the policies to the host where the HP VMs are running. HPE OMi: HP Integrity Virtualization is not supported.
Virtualization Solaris Containers
HPOM: Deploy the policies to the Solaris global zone. HPE OMi: OMi automatically assigns the aspects to CIs appearing in the Sol_Zon
Virtualization IBM Power Virtualization (LPAR)
HPOM: Deploy the policies to the monitoring LPAR on the IBM frame (host). HPE OMi: OMi automatically assigns the aspects to CIs appearing in the IBMHMC aspects to the LPAR.
Note: If you are using the HPOM Smart Plug-in for Virtualization Infrastructure (VISPI) to monitor HP Integrity Virtualization, it is recommended to wait for the next update to the Infrastructure Management Pack when this would be available.
For virtualization platforms such as Microsoft Hyper-V, and HP VM that are not supported with the Infrastructure MP, you can import the VISPI policies using the OMi config exchange tool. The deployment model need not rely on the topology view and direct node-based deployment, without automatic assignments, can be adopted (similar to HPOM).
Appearance of artifacts on node
Log and trace files: Infrastructure SPI policies provide runtime logs and trace which are logged in the %OvDataDir%\log\Infraspi.txt file. Instrumentation: %ovdatadir%/bin/instrumentation Policy list: ovpolicy -l Example: #ovpolicy -l "VI-VMwareVCEventMonitor" enabled 1113.0000
Log and trace files: Same as SPI. Instrumentation: Same as SPI. Policy list: ovpolicy –l In the policy list, every parameterized policy has an extra entry with “<policy type>tmpl” in the “Type” column as provided in the following example. This approach is similar for all MPs. Example: # ovpolicy –l monitor "Virt-VMwareVCEventMonitor" enabled 0001.0000 monitortmpl "Virt-VMwareVCEventMonitor" enabled 0001.0000
Monitoring capability • Sys Infrastructure SPI (SISPI) • Virtualization SPI: vCenter and vMA based monitoring
is supported.
• Linux Platforms – Ubuntu Linux: The SISPI does not provide any policies to support service monitoring specifically on this platform.
• HA Cluster Monitoring: Several policies related to Microsoft Cluster, Sun Cluster, Veritas Cluster, and HP ServiceGuard are not present in the Infrastructure MP.
• Virtualization MP: VMware monitoring is supported through the Operations Agent Virtual Appliance. VMware vMA based monitoring is not supported.
Monitoring HP-UX Integrity Virtualization and Hyper-V Virtualization is not supported in Infrastructure MP – this is a difference from the Infrastructure SPI. To identify policy level differences, see the section SPI Policy to MP Policy Template Mapping in this document.
Evolution Guide Page 16
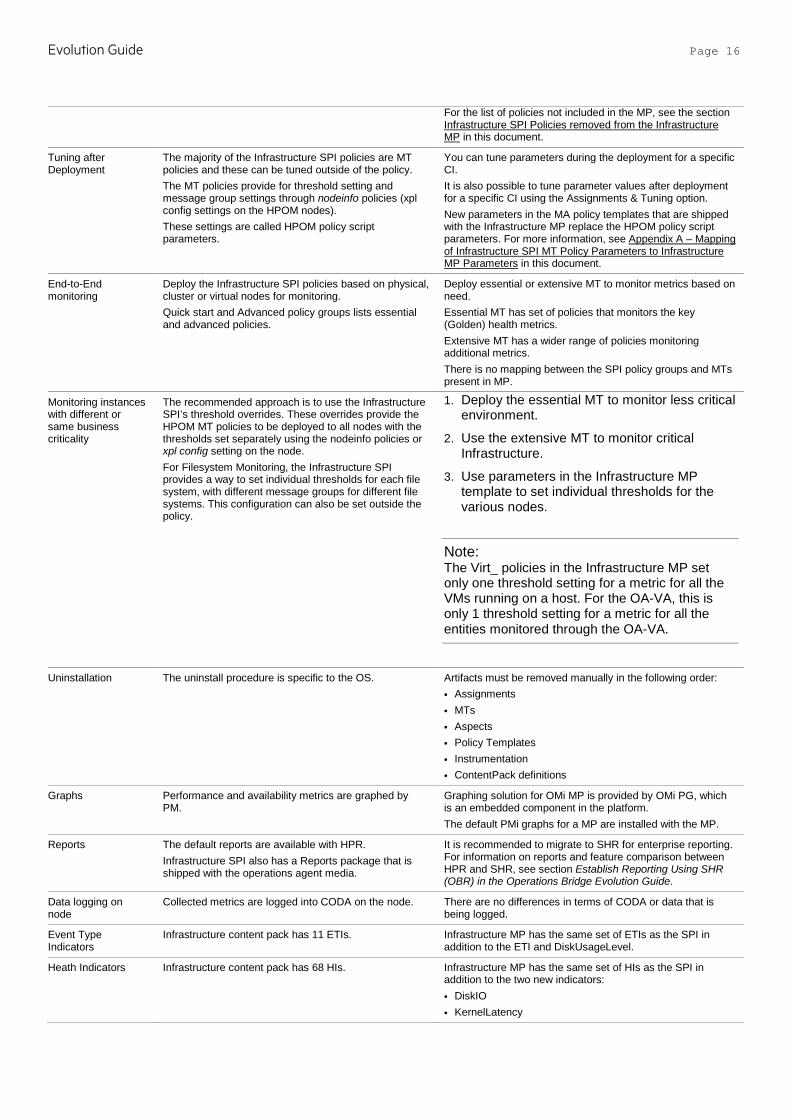
For the list of policies not included in the MP, see the section Infrastructure SPI Policies removed from the Infrastructure MP in this document.
Tuning after Deployment
The majority of the Infrastructure SPI policies are MT policies and these can be tuned outside of the policy. The MT policies provide for threshold setting and message group settings through nodeinfo policies (xpl config settings on the HPOM nodes). These settings are called HPOM policy script parameters.
You can tune parameters during the deployment for a specific CI. It is also possible to tune parameter values after deployment for a specific CI using the Assignments & Tuning option. New parameters in the MA policy templates that are shipped with the Infrastructure MP replace the HPOM policy script parameters. For more information, see Appendix A – Mapping of Infrastructure SPI MT Policy Parameters to Infrastructure MP Parameters in this document.
End-to-End monitoring
Deploy the Infrastructure SPI policies based on physical, cluster or virtual nodes for monitoring. Quick start and Advanced policy groups lists essential and advanced policies.
Deploy essential or extensive MT to monitor metrics based on need. Essential MT has set of policies that monitors the key (Golden) health metrics. Extensive MT has a wider range of policies monitoring additional metrics. There is no mapping between the SPI policy groups and MTs present in MP.
Monitoring instances with different or same business criticality
The recommended approach is to use the Infrastructure SPI’s threshold overrides. These overrides provide the HPOM MT policies to be deployed to all nodes with the thresholds set separately using the nodeinfo policies or xpl config setting on the node. For Filesystem Monitoring, the Infrastructure SPI provides a way to set individual thresholds for each file system, with different message groups for different file systems. This configuration can also be set outside the policy.
1. Deploy the essential MT to monitor less critical environment.
2. Use the extensive MT to monitor critical Infrastructure.
3. Use parameters in the Infrastructure MP template to set individual thresholds for the various nodes.
Note: The Virt_ policies in the Infrastructure MP set only one threshold setting for a metric for all the VMs running on a host. For the OA-VA, this is only 1 threshold setting for a metric for all the entities monitored through the OA-VA.
Uninstallation The uninstall procedure is specific to the OS. Artifacts must be removed manually in the following order: • Assignments • MTs • Aspects • Policy Templates • Instrumentation • ContentPack definitions
Graphs Performance and availability metrics are graphed by PM.
Graphing solution for OMi MP is provided by OMi PG, which is an embedded component in the platform. The default PMi graphs for a MP are installed with the MP.
Reports The default reports are available with HPR. Infrastructure SPI also has a Reports package that is shipped with the operations agent media.
It is recommended to migrate to SHR for enterprise reporting. For information on reports and feature comparison between HPR and SHR, see section Establish Reporting Using SHR (OBR) in the Operations Bridge Evolution Guide.
Data logging on node
Collected metrics are logged into CODA on the node. There are no differences in terms of CODA or data that is being logged.
Event Type Indicators
Infrastructure content pack has 11 ETIs. Infrastructure MP has the same set of ETIs as the SPI in addition to the ETI and DiskUsageLevel.
Heath Indicators Infrastructure content pack has 68 HIs. Infrastructure MP has the same set of HIs as the SPI in addition to the two new indicators: • DiskIO • KernelLatency
Evolution Guide Page 17
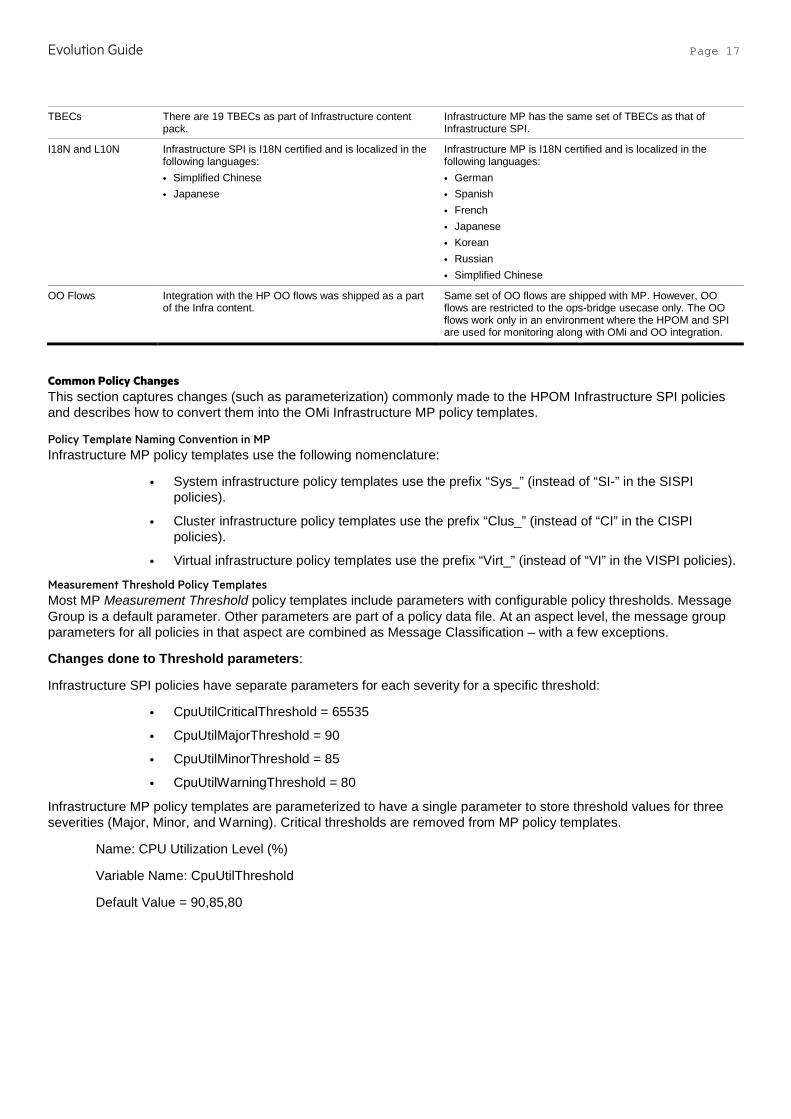
TBECs There are 19 TBECs as part of Infrastructure content pack.
Infrastructure MP has the same set of TBECs as that of Infrastructure SPI.
I18N and L10N Infrastructure SPI is I18N certified and is localized in the following languages: • Simplified Chinese • Japanese
Infrastructure MP is I18N certified and is localized in the following languages: • German • Spanish • French • Japanese • Korean • Russian • Simplified Chinese
OO Flows Integration with the HP OO flows was shipped as a part of the Infra content.
Same set of OO flows are shipped with MP. However, OO flows are restricted to the ops-bridge usecase only. The OO flows work only in an environment where the HPOM and SPI are used for monitoring along with OMi and OO integration.
Common Policy Changes This section captures changes (such as parameterization) commonly made to the HPOM Infrastructure SPI policies and describes how to convert them into the OMi Infrastructure MP policy templates.
Policy Template Naming Convention in MP Infrastructure MP policy templates use the following nomenclature:
• System infrastructure policy templates use the prefix “Sys_” (instead of “SI-” in the SISPI policies).
• Cluster infrastructure policy templates use the prefix “Clus_” (instead of “CI” in the CISPI policies).
• Virtual infrastructure policy templates use the prefix “Virt_” (instead of “VI” in the VISPI policies).
Measurement Threshold Policy Templates Most MP Measurement Threshold policy templates include parameters with configurable policy thresholds. Message Group is a default parameter. Other parameters are part of a policy data file. At an aspect level, the message group parameters for all policies in that aspect are combined as Message Classification – with a few exceptions.
Changes done to Threshold parameters:
Infrastructure SPI policies have separate parameters for each severity for a specific threshold:
• CpuUtilCriticalThreshold = 65535
• CpuUtilMajorThreshold = 90
• CpuUtilMinorThreshold = 85
• CpuUtilWarningThreshold = 80
Infrastructure MP policy templates are parameterized to have a single parameter to store threshold values for three severities (Major, Minor, and Warning). Critical thresholds are removed from MP policy templates.
Name: CPU Utilization Level (%)
Variable Name: CpuUtilThreshold
Default Value = 90,85,80
Evolution Guide Page 18
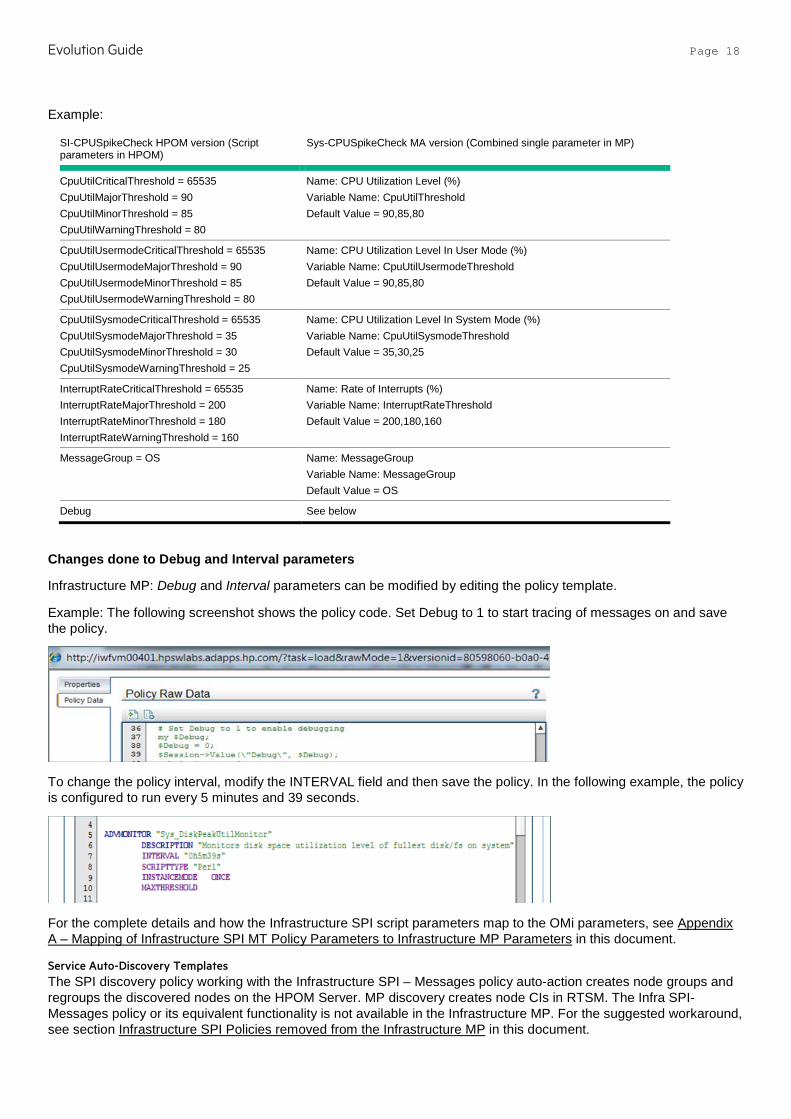
Example:
SI-CPUSpikeCheck HPOM version (Script parameters in HPOM)
Sys-CPUSpikeCheck MA version (Combined single parameter in MP)
CpuUtilCriticalThreshold = 65535 CpuUtilMajorThreshold = 90 CpuUtilMinorThreshold = 85 CpuUtilWarningThreshold = 80
Name: CPU Utilization Level (%) Variable Name: CpuUtilThreshold Default Value = 90,85,80
CpuUtilUsermodeCriticalThreshold = 65535 CpuUtilUsermodeMajorThreshold = 90 CpuUtilUsermodeMinorThreshold = 85 CpuUtilUsermodeWarningThreshold = 80
Name: CPU Utilization Level In User Mode (%) Variable Name: CpuUtilUsermodeThreshold Default Value = 90,85,80
CpuUtilSysmodeCriticalThreshold = 65535 CpuUtilSysmodeMajorThreshold = 35 CpuUtilSysmodeMinorThreshold = 30 CpuUtilSysmodeWarningThreshold = 25
Name: CPU Utilization Level In System Mode (%) Variable Name: CpuUtilSysmodeThreshold Default Value = 35,30,25
InterruptRateCriticalThreshold = 65535 InterruptRateMajorThreshold = 200 InterruptRateMinorThreshold = 180 InterruptRateWarningThreshold = 160
Name: Rate of Interrupts (%) Variable Name: InterruptRateThreshold Default Value = 200,180,160
MessageGroup = OS Name: MessageGroup Variable Name: MessageGroup Default Value = OS
Debug See below
Changes done to Debug and Interval parameters
Infrastructure MP: Debug and Interval parameters can be modified by editing the policy template.
Example: The following screenshot shows the policy code. Set Debug to 1 to start tracing of messages on and save the policy.
To change the policy interval, modify the INTERVAL field and then save the policy. In the following example, the policy is configured to run every 5 minutes and 39 seconds.
For the complete details and how the Infrastructure SPI script parameters map to the OMi parameters, see Appendix A – Mapping of Infrastructure SPI MT Policy Parameters to Infrastructure MP Parameters in this document.
Service Auto-Discovery Templates The SPI discovery policy working with the Infrastructure SPI – Messages policy auto-action creates node groups and regroups the discovered nodes on the HPOM Server. MP discovery creates node CIs in RTSM. The Infra SPI-Messages policy or its equivalent functionality is not available in the Infrastructure MP. For the suggested workaround, see section Infrastructure SPI Policies removed from the Infrastructure MP in this document.
Evolution Guide Page 19
Policy Specific Changes This section maps the Infrastructure MP’s aspects to the corresponding Infrastructure SPI policies. It includes information about policies that are dropped or are added and describes any differences.
The policy-specific changes described here are in addition to the common changes described in the previous section.
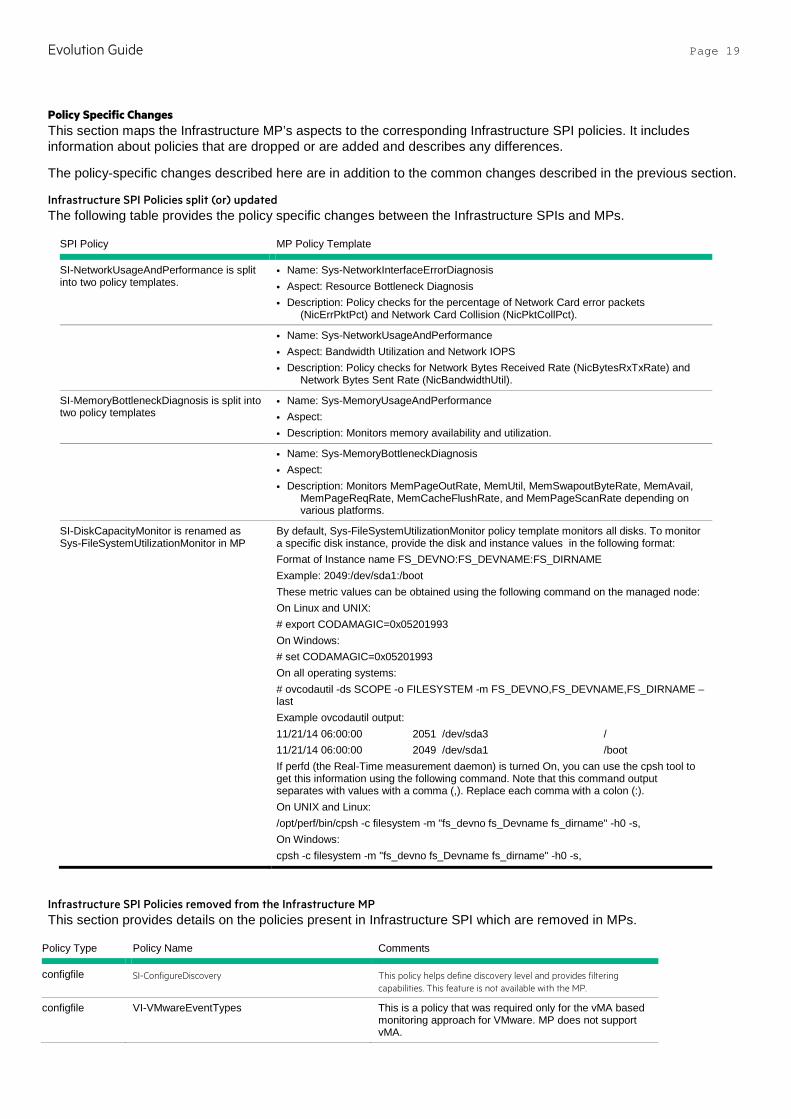
Infrastructure SPI Policies split (or) updated The following table provides the policy specific changes between the Infrastructure SPIs and MPs.
SPI Policy MP Policy Template
SI-NetworkUsageAndPerformance is split into two policy templates.
• Name: Sys-NetworkInterfaceErrorDiagnosis • Aspect: Resource Bottleneck Diagnosis • Description: Policy checks for the percentage of Network Card error packets
(NicErrPktPct) and Network Card Collision (NicPktCollPct).
• Name: Sys-NetworkUsageAndPerformance • Aspect: Bandwidth Utilization and Network IOPS • Description: Policy checks for Network Bytes Received Rate (NicBytesRxTxRate) and
Network Bytes Sent Rate (NicBandwidthUtil).
SI-MemoryBottleneckDiagnosis is split into two policy templates
• Name: Sys-MemoryUsageAndPerformance • Aspect: • Description: Monitors memory availability and utilization.
• Name: Sys-MemoryBottleneckDiagnosis • Aspect: • Description: Monitors MemPageOutRate, MemUtil, MemSwapoutByteRate, MemAvail,
MemPageReqRate, MemCacheFlushRate, and MemPageScanRate depending on various platforms.
SI-DiskCapacityMonitor is renamed as Sys-FileSystemUtilizationMonitor in MP
By default, Sys-FileSystemUtilizationMonitor policy template monitors all disks. To monitor a specific disk instance, provide the disk and instance values in the following format: Format of Instance name FS_DEVNO:FS_DEVNAME:FS_DIRNAME Example: 2049:/dev/sda1:/boot These metric values can be obtained using the following command on the managed node: On Linux and UNIX: # export CODAMAGIC=0x05201993 On Windows: # set CODAMAGIC=0x05201993 On all operating systems: # ovcodautil -ds SCOPE -o FILESYSTEM -m FS_DEVNO,FS_DEVNAME,FS_DIRNAME –last Example ovcodautil output: 11/21/14 06:00:00 2051 /dev/sda3 / 11/21/14 06:00:00 2049 /dev/sda1 /boot If perfd (the Real-Time measurement daemon) is turned On, you can use the cpsh tool to get this information using the following command. Note that this command output separates with values with a comma (,). Replace each comma with a colon (:). On UNIX and Linux: /opt/perf/bin/cpsh -c filesystem -m "fs_devno fs_Devname fs_dirname" -h0 -s, On Windows: cpsh -c filesystem -m "fs_devno fs_Devname fs_dirname" -h0 -s,
Infrastructure SPI Policies removed from the Infrastructure MP This section provides details on the policies present in Infrastructure SPI which are removed in MPs.
Policy Type Policy Name Comments
configfile SI-ConfigureDiscovery This policy helps define discovery level and provides filtering capabilities. This feature is not available with the MP.
configfile VI-VMwareEventTypes This is a policy that was required only for the vMA based monitoring approach for VMware. MP does not support vMA.
Evolution Guide Page 20
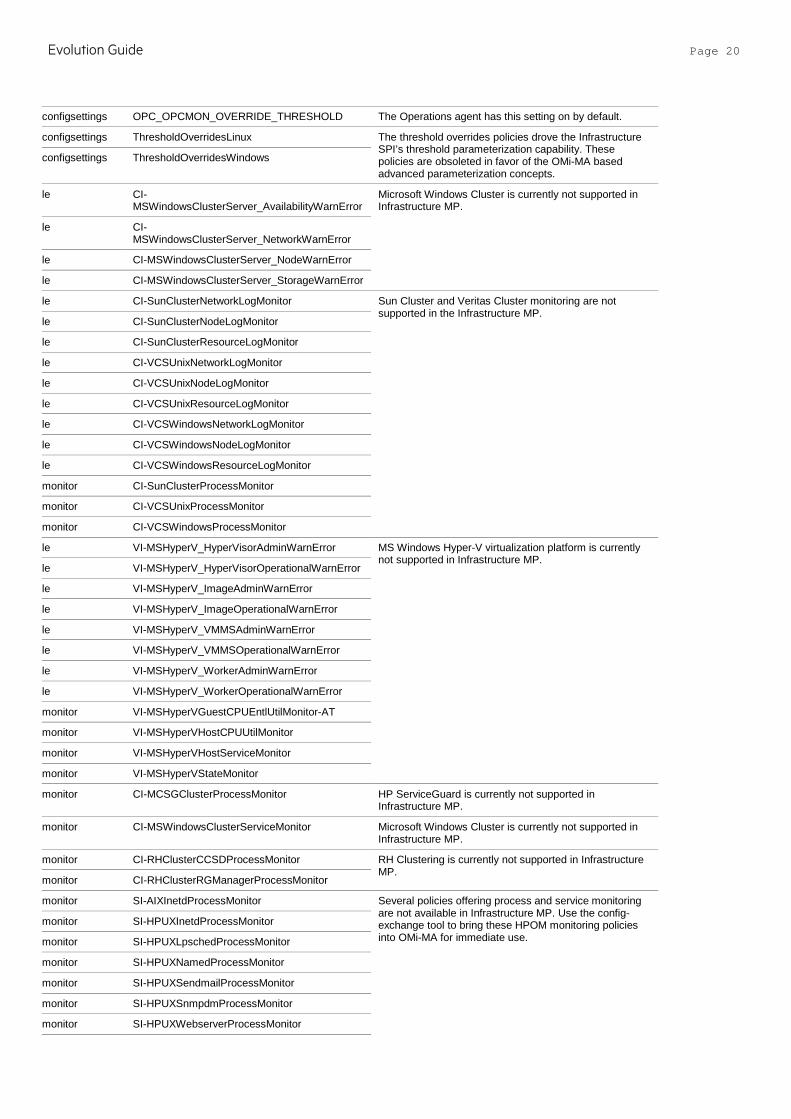
configsettings OPC_OPCMON_OVERRIDE_THRESHOLD The Operations agent has this setting on by default.
configsettings ThresholdOverridesLinux The threshold overrides policies drove the Infrastructure SPI’s threshold parameterization capability. These policies are obsoleted in favor of the OMi-MA based advanced parameterization concepts.
configsettings ThresholdOverridesWindows
le CI-MSWindowsClusterServer_AvailabilityWarnError
Microsoft Windows Cluster is currently not supported in Infrastructure MP.
le CI-MSWindowsClusterServer_NetworkWarnError
le CI-MSWindowsClusterServer_NodeWarnError
le CI-MSWindowsClusterServer_StorageWarnError
le CI-SunClusterNetworkLogMonitor Sun Cluster and Veritas Cluster monitoring are not supported in the Infrastructure MP.
le CI-SunClusterNodeLogMonitor
le CI-SunClusterResourceLogMonitor
le CI-VCSUnixNetworkLogMonitor
le CI-VCSUnixNodeLogMonitor
le CI-VCSUnixResourceLogMonitor
le CI-VCSWindowsNetworkLogMonitor
le CI-VCSWindowsNodeLogMonitor
le CI-VCSWindowsResourceLogMonitor
monitor CI-SunClusterProcessMonitor
monitor CI-VCSUnixProcessMonitor
monitor CI-VCSWindowsProcessMonitor
le VI-MSHyperV_HyperVisorAdminWarnError MS Windows Hyper-V virtualization platform is currently not supported in Infrastructure MP.
le VI-MSHyperV_HyperVisorOperationalWarnError
le VI-MSHyperV_ImageAdminWarnError
le VI-MSHyperV_ImageOperationalWarnError
le VI-MSHyperV_VMMSAdminWarnError
le VI-MSHyperV_VMMSOperationalWarnError
le VI-MSHyperV_WorkerAdminWarnError
le VI-MSHyperV_WorkerOperationalWarnError
monitor VI-MSHyperVGuestCPUEntlUtilMonitor-AT
monitor VI-MSHyperVHostCPUUtilMonitor
monitor VI-MSHyperVHostServiceMonitor
monitor VI-MSHyperVStateMonitor
monitor CI-MCSGClusterProcessMonitor HP ServiceGuard is currently not supported in Infrastructure MP.
monitor CI-MSWindowsClusterServiceMonitor Microsoft Windows Cluster is currently not supported in Infrastructure MP.
monitor CI-RHClusterCCSDProcessMonitor RH Clustering is currently not supported in Infrastructure MP.
monitor CI-RHClusterRGManagerProcessMonitor
monitor SI-AIXInetdProcessMonitor Several policies offering process and service monitoring are not available in Infrastructure MP. Use the config-exchange tool to bring these HPOM monitoring policies into OMi-MA for immediate use.
monitor SI-HPUXInetdProcessMonitor
monitor SI-HPUXLpschedProcessMonitor
monitor SI-HPUXNamedProcessMonitor
monitor SI-HPUXSendmailProcessMonitor
monitor SI-HPUXSnmpdmProcessMonitor
monitor SI-HPUXWebserverProcessMonitor
Evolution Guide Page 21
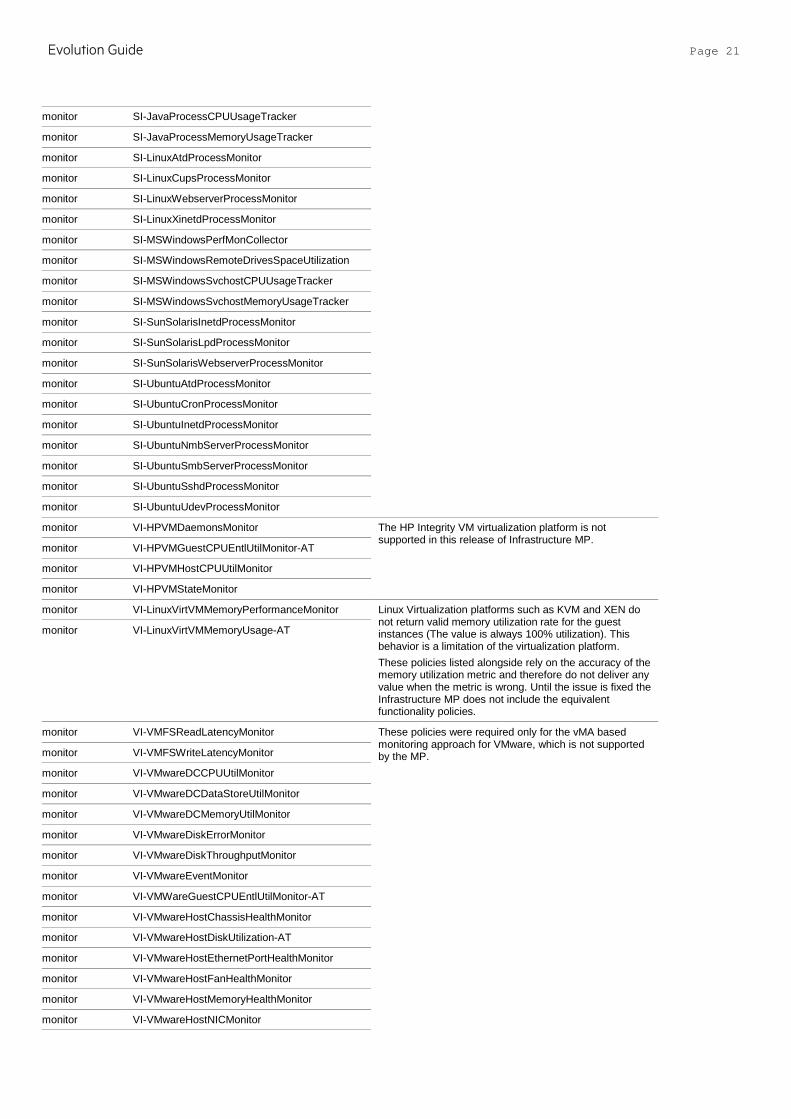
monitor SI-JavaProcessCPUUsageTracker
monitor SI-JavaProcessMemoryUsageTracker
monitor SI-LinuxAtdProcessMonitor
monitor SI-LinuxCupsProcessMonitor
monitor SI-LinuxWebserverProcessMonitor
monitor SI-LinuxXinetdProcessMonitor
monitor SI-MSWindowsPerfMonCollector
monitor SI-MSWindowsRemoteDrivesSpaceUtilization
monitor SI-MSWindowsSvchostCPUUsageTracker
monitor SI-MSWindowsSvchostMemoryUsageTracker
monitor SI-SunSolarisInetdProcessMonitor
monitor SI-SunSolarisLpdProcessMonitor
monitor SI-SunSolarisWebserverProcessMonitor
monitor SI-UbuntuAtdProcessMonitor
monitor SI-UbuntuCronProcessMonitor
monitor SI-UbuntuInetdProcessMonitor
monitor SI-UbuntuNmbServerProcessMonitor
monitor SI-UbuntuSmbServerProcessMonitor
monitor SI-UbuntuSshdProcessMonitor
monitor SI-UbuntuUdevProcessMonitor
monitor VI-HPVMDaemonsMonitor The HP Integrity VM virtualization platform is not supported in this release of Infrastructure MP.
monitor VI-HPVMGuestCPUEntlUtilMonitor-AT
monitor VI-HPVMHostCPUUtilMonitor
monitor VI-HPVMStateMonitor
monitor VI-LinuxVirtVMMemoryPerformanceMonitor Linux Virtualization platforms such as KVM and XEN do not return valid memory utilization rate for the guest instances (The value is always 100% utilization). This behavior is a limitation of the virtualization platform. These policies listed alongside rely on the accuracy of the memory utilization metric and therefore do not deliver any value when the metric is wrong. Until the issue is fixed the Infrastructure MP does not include the equivalent functionality policies.
monitor VI-LinuxVirtVMMemoryUsage-AT
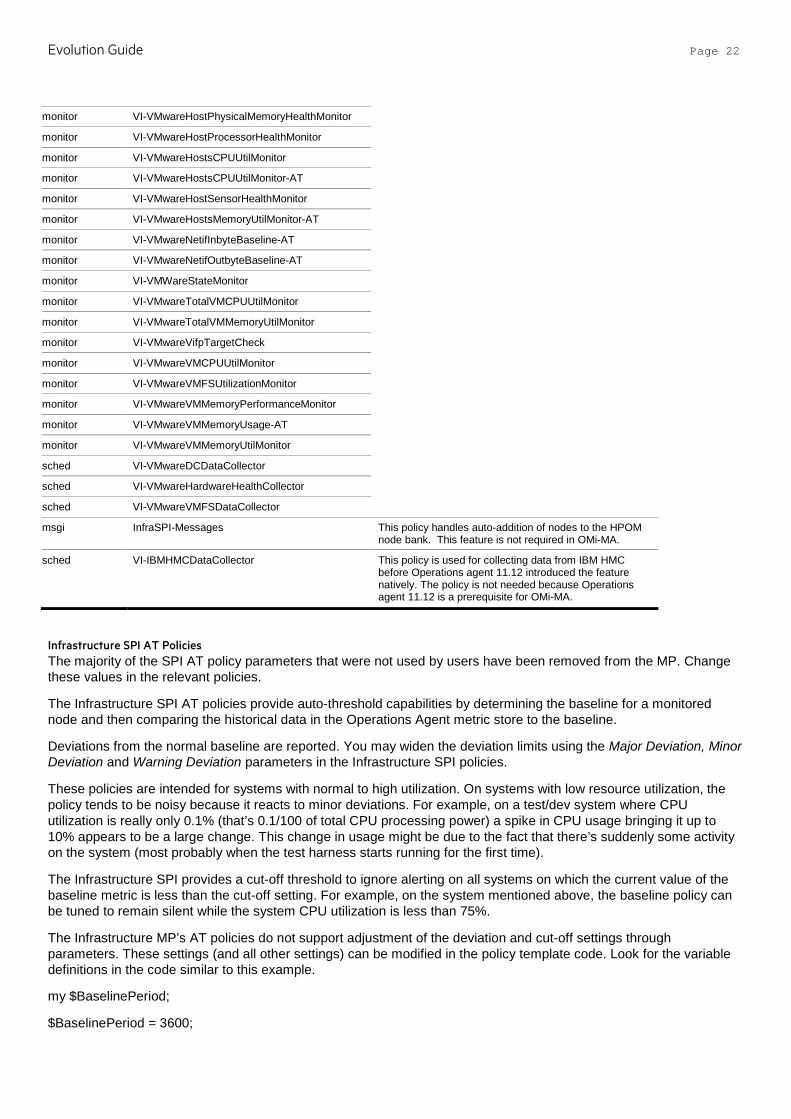
monitor VI-VMFSReadLatencyMonitor These policies were required only for the vMA based monitoring approach for VMware, which is not supported by the MP. monitor VI-VMFSWriteLatencyMonitor
monitor VI-VMwareDCCPUUtilMonitor
monitor VI-VMwareDCDataStoreUtilMonitor
monitor VI-VMwareDCMemoryUtilMonitor
monitor VI-VMwareDiskErrorMonitor
monitor VI-VMwareDiskThroughputMonitor
monitor VI-VMwareEventMonitor
monitor VI-VMWareGuestCPUEntlUtilMonitor-AT
monitor VI-VMwareHostChassisHealthMonitor
monitor VI-VMwareHostDiskUtilization-AT
monitor VI-VMwareHostEthernetPortHealthMonitor
monitor VI-VMwareHostFanHealthMonitor
monitor VI-VMwareHostMemoryHealthMonitor
monitor VI-VMwareHostNICMonitor
Evolution Guide Page 22
monitor VI-VMwareHostPhysicalMemoryHealthMonitor
monitor VI-VMwareHostProcessorHealthMonitor
monitor VI-VMwareHostsCPUUtilMonitor
monitor VI-VMwareHostsCPUUtilMonitor-AT
monitor VI-VMwareHostSensorHealthMonitor
monitor VI-VMwareHostsMemoryUtilMonitor-AT
monitor VI-VMwareNetifInbyteBaseline-AT
monitor VI-VMwareNetifOutbyteBaseline-AT
monitor VI-VMWareStateMonitor
monitor VI-VMwareTotalVMCPUUtilMonitor
monitor VI-VMwareTotalVMMemoryUtilMonitor
monitor VI-VMwareVifpTargetCheck
monitor VI-VMwareVMCPUUtilMonitor
monitor VI-VMwareVMFSUtilizationMonitor
monitor VI-VMwareVMMemoryPerformanceMonitor
monitor VI-VMwareVMMemoryUsage-AT
monitor VI-VMwareVMMemoryUtilMonitor
sched VI-VMwareDCDataCollector
sched VI-VMwareHardwareHealthCollector
sched VI-VMwareVMFSDataCollector
msgi InfraSPI-Messages This policy handles auto-addition of nodes to the HPOM node bank. This feature is not required in OMi-MA.
sched VI-IBMHMCDataCollector This policy is used for collecting data from IBM HMC before Operations agent 11.12 introduced the feature natively. The policy is not needed because Operations agent 11.12 is a prerequisite for OMi-MA.
Infrastructure SPI AT Policies The majority of the SPI AT policy parameters that were not used by users have been removed from the MP. Change these values in the relevant policies.
The Infrastructure SPI AT policies provide auto-threshold capabilities by determining the baseline for a monitored node and then comparing the historical data in the Operations Agent metric store to the baseline.
Deviations from the normal baseline are reported. You may widen the deviation limits using the Major Deviation, Minor Deviation and Warning Deviation parameters in the Infrastructure SPI policies.
These policies are intended for systems with normal to high utilization. On systems with low resource utilization, the policy tends to be noisy because it reacts to minor deviations. For example, on a test/dev system where CPU utilization is really only 0.1% (that’s 0.1/100 of total CPU processing power) a spike in CPU usage bringing it up to 10% appears to be a large change. This change in usage might be due to the fact that there’s suddenly some activity on the system (most probably when the test harness starts running for the first time).
The Infrastructure SPI provides a cut-off threshold to ignore alerting on all systems on which the current value of the baseline metric is less than the cut-off setting. For example, on the system mentioned above, the baseline policy can be tuned to remain silent while the system CPU utilization is less than 75%.
The Infrastructure MP’s AT policies do not support adjustment of the deviation and cut-off settings through parameters. These settings (and all other settings) can be modified in the policy template code. Look for the variable definitions in the code similar to this example.
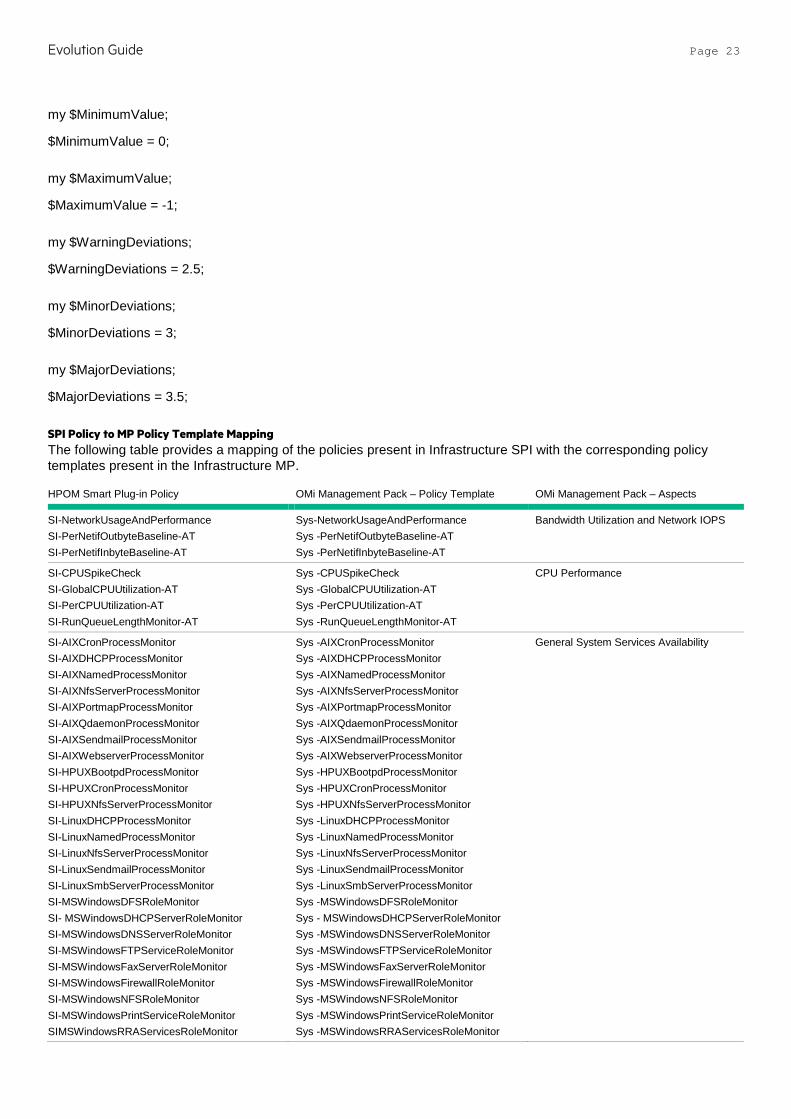
my $BaselinePeriod;
$BaselinePeriod = 3600;
Evolution Guide Page 23
my $MinimumValue;
$MinimumValue = 0;
my $MaximumValue;
$MaximumValue = -1;
my $WarningDeviations;
$WarningDeviations = 2.5;
my $MinorDeviations;
$MinorDeviations = 3;
my $MajorDeviations;
$MajorDeviations = 3.5;
SPI Policy to MP Policy Template Mapping The following table provides a mapping of the policies present in Infrastructure SPI with the corresponding policy templates present in the Infrastructure MP.
HPOM Smart Plug-in Policy OMi Management Pack – Policy Template OMi Management Pack – Aspects
SI-NetworkUsageAndPerformance SI-PerNetifOutbyteBaseline-AT SI-PerNetifInbyteBaseline-AT
Sys-NetworkUsageAndPerformance Sys -PerNetifOutbyteBaseline-AT Sys -PerNetifInbyteBaseline-AT
Bandwidth Utilization and Network IOPS
SI-CPUSpikeCheck SI-GlobalCPUUtilization-AT SI-PerCPUUtilization-AT SI-RunQueueLengthMonitor-AT
Sys -CPUSpikeCheck Sys -GlobalCPUUtilization-AT Sys -PerCPUUtilization-AT Sys -RunQueueLengthMonitor-AT
CPU Performance
SI-AIXCronProcessMonitor SI-AIXDHCPProcessMonitor SI-AIXNamedProcessMonitor SI-AIXNfsServerProcessMonitor SI-AIXPortmapProcessMonitor SI-AIXQdaemonProcessMonitor SI-AIXSendmailProcessMonitor SI-AIXWebserverProcessMonitor SI-HPUXBootpdProcessMonitor SI-HPUXCronProcessMonitor SI-HPUXNfsServerProcessMonitor SI-LinuxDHCPProcessMonitor SI-LinuxNamedProcessMonitor SI-LinuxNfsServerProcessMonitor SI-LinuxSendmailProcessMonitor SI-LinuxSmbServerProcessMonitor SI-MSWindowsDFSRoleMonitor SI- MSWindowsDHCPServerRoleMonitor SI-MSWindowsDNSServerRoleMonitor SI-MSWindowsFTPServiceRoleMonitor SI-MSWindowsFaxServerRoleMonitor SI-MSWindowsFirewallRoleMonitor SI-MSWindowsNFSRoleMonitor SI-MSWindowsPrintServiceRoleMonitor SIMSWindowsRRAServicesRoleMonitor
Sys -AIXCronProcessMonitor Sys -AIXDHCPProcessMonitor Sys -AIXNamedProcessMonitor Sys -AIXNfsServerProcessMonitor Sys -AIXPortmapProcessMonitor Sys -AIXQdaemonProcessMonitor Sys -AIXSendmailProcessMonitor Sys -AIXWebserverProcessMonitor Sys -HPUXBootpdProcessMonitor Sys -HPUXCronProcessMonitor Sys -HPUXNfsServerProcessMonitor Sys -LinuxDHCPProcessMonitor Sys -LinuxNamedProcessMonitor Sys -LinuxNfsServerProcessMonitor Sys -LinuxSendmailProcessMonitor Sys -LinuxSmbServerProcessMonitor Sys -MSWindowsDFSRoleMonitor Sys - MSWindowsDHCPServerRoleMonitor Sys -MSWindowsDNSServerRoleMonitor Sys -MSWindowsFTPServiceRoleMonitor Sys -MSWindowsFaxServerRoleMonitor Sys -MSWindowsFirewallRoleMonitor Sys -MSWindowsNFSRoleMonitor Sys -MSWindowsPrintServiceRoleMonitor Sys -MSWindowsRRAServicesRoleMonitor
General System Services Availability
Evolution Guide Page 24
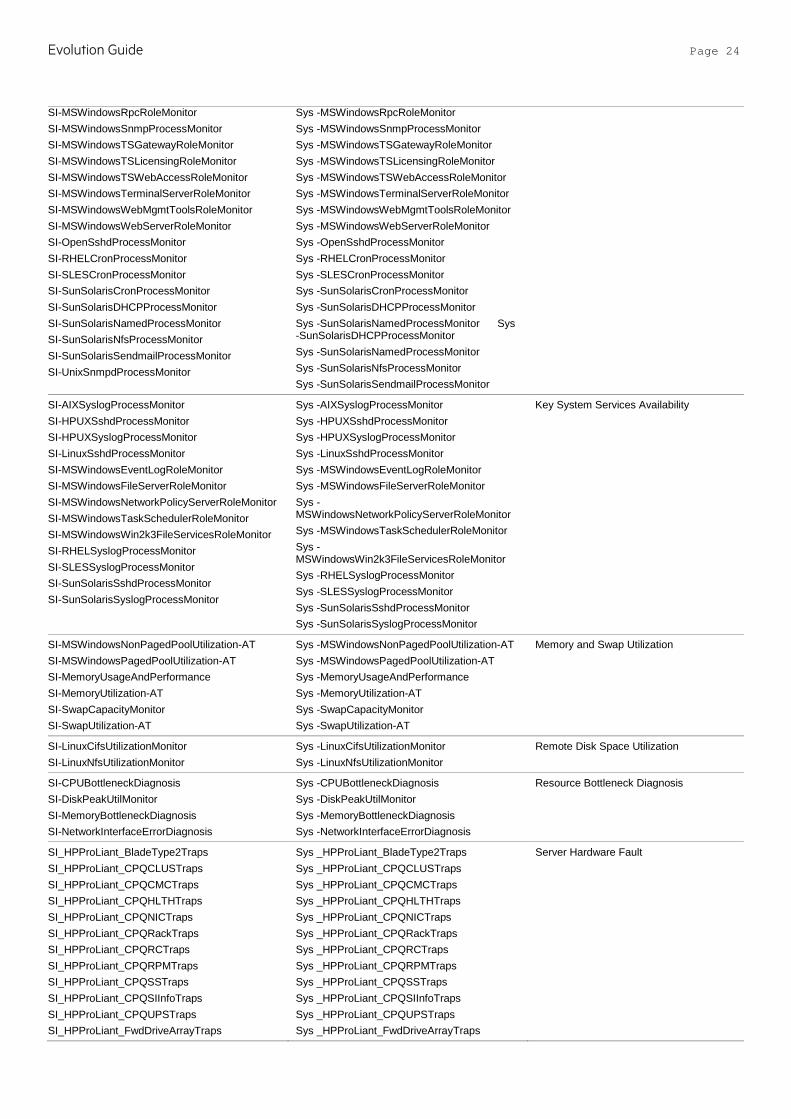
SI-MSWindowsRpcRoleMonitor SI-MSWindowsSnmpProcessMonitor SI-MSWindowsTSGatewayRoleMonitor SI-MSWindowsTSLicensingRoleMonitor SI-MSWindowsTSWebAccessRoleMonitor SI-MSWindowsTerminalServerRoleMonitor SI-MSWindowsWebMgmtToolsRoleMonitor SI-MSWindowsWebServerRoleMonitor SI-OpenSshdProcessMonitor SI-RHELCronProcessMonitor SI-SLESCronProcessMonitor SI-SunSolarisCronProcessMonitor SI-SunSolarisDHCPProcessMonitor SI-SunSolarisNamedProcessMonitor SI-SunSolarisNfsProcessMonitor SI-SunSolarisSendmailProcessMonitor SI-UnixSnmpdProcessMonitor
Sys -MSWindowsRpcRoleMonitor Sys -MSWindowsSnmpProcessMonitor Sys -MSWindowsTSGatewayRoleMonitor Sys -MSWindowsTSLicensingRoleMonitor Sys -MSWindowsTSWebAccessRoleMonitor Sys -MSWindowsTerminalServerRoleMonitor Sys -MSWindowsWebMgmtToolsRoleMonitor Sys -MSWindowsWebServerRoleMonitor Sys -OpenSshdProcessMonitor Sys -RHELCronProcessMonitor Sys -SLESCronProcessMonitor Sys -SunSolarisCronProcessMonitor Sys -SunSolarisDHCPProcessMonitor Sys -SunSolarisNamedProcessMonitor Sys -SunSolarisDHCPProcessMonitor Sys -SunSolarisNamedProcessMonitor Sys -SunSolarisNfsProcessMonitor Sys -SunSolarisSendmailProcessMonitor
SI-AIXSyslogProcessMonitor SI-HPUXSshdProcessMonitor SI-HPUXSyslogProcessMonitor SI-LinuxSshdProcessMonitor SI-MSWindowsEventLogRoleMonitor SI-MSWindowsFileServerRoleMonitor SI-MSWindowsNetworkPolicyServerRoleMonitor SI-MSWindowsTaskSchedulerRoleMonitor SI-MSWindowsWin2k3FileServicesRoleMonitor SI-RHELSyslogProcessMonitor SI-SLESSyslogProcessMonitor SI-SunSolarisSshdProcessMonitor SI-SunSolarisSyslogProcessMonitor
Sys -AIXSyslogProcessMonitor Sys -HPUXSshdProcessMonitor Sys -HPUXSyslogProcessMonitor Sys -LinuxSshdProcessMonitor Sys -MSWindowsEventLogRoleMonitor Sys -MSWindowsFileServerRoleMonitor Sys -MSWindowsNetworkPolicyServerRoleMonitor Sys -MSWindowsTaskSchedulerRoleMonitor Sys -MSWindowsWin2k3FileServicesRoleMonitor Sys -RHELSyslogProcessMonitor Sys -SLESSyslogProcessMonitor Sys -SunSolarisSshdProcessMonitor Sys -SunSolarisSyslogProcessMonitor
Key System Services Availability
SI-MSWindowsNonPagedPoolUtilization-AT SI-MSWindowsPagedPoolUtilization-AT SI-MemoryUsageAndPerformance SI-MemoryUtilization-AT SI-SwapCapacityMonitor SI-SwapUtilization-AT
Sys -MSWindowsNonPagedPoolUtilization-AT Sys -MSWindowsPagedPoolUtilization-AT Sys -MemoryUsageAndPerformance Sys -MemoryUtilization-AT Sys -SwapCapacityMonitor Sys -SwapUtilization-AT
Memory and Swap Utilization
SI-LinuxCifsUtilizationMonitor SI-LinuxNfsUtilizationMonitor
Sys -LinuxCifsUtilizationMonitor Sys -LinuxNfsUtilizationMonitor
Remote Disk Space Utilization
SI-CPUBottleneckDiagnosis SI-DiskPeakUtilMonitor SI-MemoryBottleneckDiagnosis SI-NetworkInterfaceErrorDiagnosis
Sys -CPUBottleneckDiagnosis Sys -DiskPeakUtilMonitor Sys -MemoryBottleneckDiagnosis Sys -NetworkInterfaceErrorDiagnosis
Resource Bottleneck Diagnosis
SI_HPProLiant_BladeType2Traps SI_HPProLiant_CPQCLUSTraps SI_HPProLiant_CPQCMCTraps SI_HPProLiant_CPQHLTHTraps SI_HPProLiant_CPQNICTraps SI_HPProLiant_CPQRackTraps SI_HPProLiant_CPQRCTraps SI_HPProLiant_CPQRPMTraps SI_HPProLiant_CPQSSTraps SI_HPProLiant_CPQSIInfoTraps SI_HPProLiant_CPQUPSTraps SI_HPProLiant_FwdDriveArrayTraps
Sys _HPProLiant_BladeType2Traps Sys _HPProLiant_CPQCLUSTraps Sys _HPProLiant_CPQCMCTraps Sys _HPProLiant_CPQHLTHTraps Sys _HPProLiant_CPQNICTraps Sys _HPProLiant_CPQRackTraps Sys _HPProLiant_CPQRCTraps Sys _HPProLiant_CPQRPMTraps Sys _HPProLiant_CPQSSTraps Sys _HPProLiant_CPQSIInfoTraps Sys _HPProLiant_CPQUPSTraps Sys _HPProLiant_FwdDriveArrayTraps
Server Hardware Fault
Evolution Guide Page 25
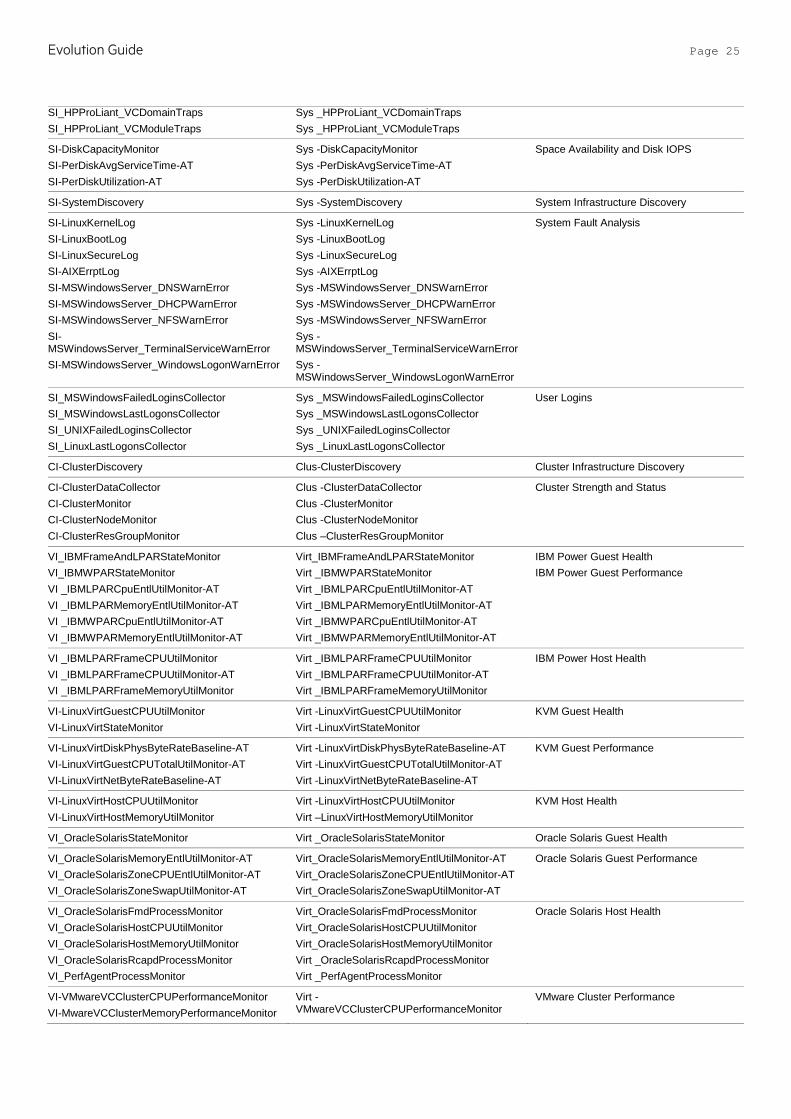
SI_HPProLiant_VCDomainTraps SI_HPProLiant_VCModuleTraps
Sys _HPProLiant_VCDomainTraps Sys _HPProLiant_VCModuleTraps
SI-DiskCapacityMonitor SI-PerDiskAvgServiceTime-AT SI-PerDiskUtilization-AT
Sys -DiskCapacityMonitor Sys -PerDiskAvgServiceTime-AT Sys -PerDiskUtilization-AT
Space Availability and Disk IOPS
SI-SystemDiscovery Sys -SystemDiscovery System Infrastructure Discovery
SI-LinuxKernelLog SI-LinuxBootLog SI-LinuxSecureLog SI-AIXErrptLog SI-MSWindowsServer_DNSWarnError SI-MSWindowsServer_DHCPWarnError SI-MSWindowsServer_NFSWarnError SI-MSWindowsServer_TerminalServiceWarnError SI-MSWindowsServer_WindowsLogonWarnError
Sys -LinuxKernelLog Sys -LinuxBootLog Sys -LinuxSecureLog Sys -AIXErrptLog Sys -MSWindowsServer_DNSWarnError Sys -MSWindowsServer_DHCPWarnError Sys -MSWindowsServer_NFSWarnError Sys -MSWindowsServer_TerminalServiceWarnError Sys -MSWindowsServer_WindowsLogonWarnError
System Fault Analysis
SI_MSWindowsFailedLoginsCollector SI_MSWindowsLastLogonsCollector SI_UNIXFailedLoginsCollector SI_LinuxLastLogonsCollector
Sys _MSWindowsFailedLoginsCollector Sys _MSWindowsLastLogonsCollector Sys _UNIXFailedLoginsCollector Sys _LinuxLastLogonsCollector
User Logins
CI-ClusterDiscovery Clus-ClusterDiscovery Cluster Infrastructure Discovery
CI-ClusterDataCollector CI-ClusterMonitor CI-ClusterNodeMonitor CI-ClusterResGroupMonitor
Clus -ClusterDataCollector Clus -ClusterMonitor Clus -ClusterNodeMonitor Clus –ClusterResGroupMonitor
Cluster Strength and Status
VI_IBMFrameAndLPARStateMonitor VI_IBMWPARStateMonitor VI _IBMLPARCpuEntlUtilMonitor-AT VI _IBMLPARMemoryEntlUtilMonitor-AT VI _IBMWPARCpuEntlUtilMonitor-AT VI _IBMWPARMemoryEntlUtilMonitor-AT
Virt_IBMFrameAndLPARStateMonitor Virt _IBMWPARStateMonitor Virt _IBMLPARCpuEntlUtilMonitor-AT Virt _IBMLPARMemoryEntlUtilMonitor-AT Virt _IBMWPARCpuEntlUtilMonitor-AT Virt _IBMWPARMemoryEntlUtilMonitor-AT
IBM Power Guest Health IBM Power Guest Performance
VI _IBMLPARFrameCPUUtilMonitor VI _IBMLPARFrameCPUUtilMonitor-AT VI _IBMLPARFrameMemoryUtilMonitor
Virt _IBMLPARFrameCPUUtilMonitor Virt _IBMLPARFrameCPUUtilMonitor-AT Virt _IBMLPARFrameMemoryUtilMonitor
IBM Power Host Health
VI-LinuxVirtGuestCPUUtilMonitor VI-LinuxVirtStateMonitor
Virt -LinuxVirtGuestCPUUtilMonitor Virt -LinuxVirtStateMonitor
KVM Guest Health
VI-LinuxVirtDiskPhysByteRateBaseline-AT VI-LinuxVirtGuestCPUTotalUtilMonitor-AT VI-LinuxVirtNetByteRateBaseline-AT
Virt -LinuxVirtDiskPhysByteRateBaseline-AT Virt -LinuxVirtGuestCPUTotalUtilMonitor-AT Virt -LinuxVirtNetByteRateBaseline-AT
KVM Guest Performance
VI-LinuxVirtHostCPUUtilMonitor VI-LinuxVirtHostMemoryUtilMonitor
Virt -LinuxVirtHostCPUUtilMonitor Virt –LinuxVirtHostMemoryUtilMonitor
KVM Host Health
VI_OracleSolarisStateMonitor Virt _OracleSolarisStateMonitor Oracle Solaris Guest Health
VI_OracleSolarisMemoryEntlUtilMonitor-AT VI_OracleSolarisZoneCPUEntlUtilMonitor-AT VI_OracleSolarisZoneSwapUtilMonitor-AT
Virt_OracleSolarisMemoryEntlUtilMonitor-AT Virt_OracleSolarisZoneCPUEntlUtilMonitor-AT Virt_OracleSolarisZoneSwapUtilMonitor-AT
Oracle Solaris Guest Performance
VI_OracleSolarisFmdProcessMonitor VI_OracleSolarisHostCPUUtilMonitor VI_OracleSolarisHostMemoryUtilMonitor VI_OracleSolarisRcapdProcessMonitor VI_PerfAgentProcessMonitor
Virt_OracleSolarisFmdProcessMonitor Virt_OracleSolarisHostCPUUtilMonitor Virt_OracleSolarisHostMemoryUtilMonitor Virt _OracleSolarisRcapdProcessMonitor Virt _PerfAgentProcessMonitor
Oracle Solaris Host Health
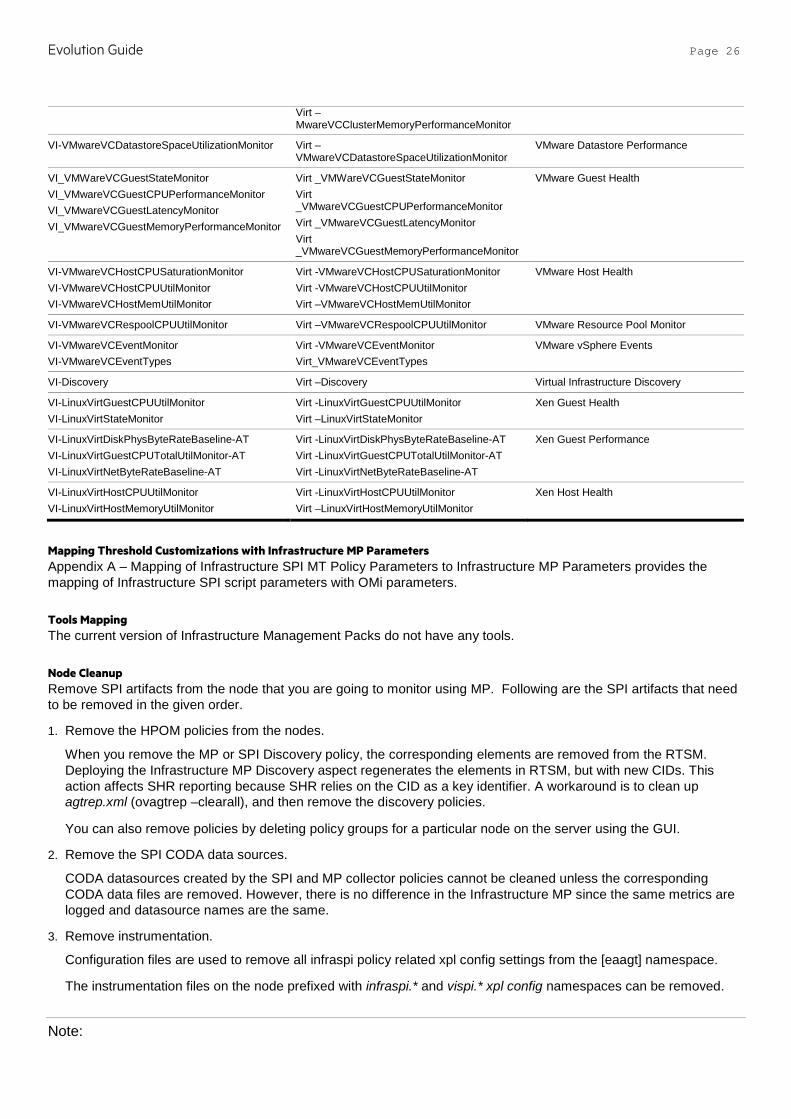
VI-VMwareVCClusterCPUPerformanceMonitor VI-MwareVCClusterMemoryPerformanceMonitor
Virt -VMwareVCClusterCPUPerformanceMonitor
VMware Cluster Performance
Evolution Guide Page 26
Virt –MwareVCClusterMemoryPerformanceMonitor
VI-VMwareVCDatastoreSpaceUtilizationMonitor Virt –VMwareVCDatastoreSpaceUtilizationMonitor
VMware Datastore Performance
VI_VMWareVCGuestStateMonitor VI_VMwareVCGuestCPUPerformanceMonitor VI_VMwareVCGuestLatencyMonitor VI_VMwareVCGuestMemoryPerformanceMonitor
Virt _VMWareVCGuestStateMonitor Virt _VMwareVCGuestCPUPerformanceMonitor Virt _VMwareVCGuestLatencyMonitor Virt _VMwareVCGuestMemoryPerformanceMonitor
VMware Guest Health
VI-VMwareVCHostCPUSaturationMonitor VI-VMwareVCHostCPUUtilMonitor VI-VMwareVCHostMemUtilMonitor
Virt -VMwareVCHostCPUSaturationMonitor Virt -VMwareVCHostCPUUtilMonitor Virt –VMwareVCHostMemUtilMonitor
VMware Host Health
VI-VMwareVCRespoolCPUUtilMonitor Virt –VMwareVCRespoolCPUUtilMonitor VMware Resource Pool Monitor
VI-VMwareVCEventMonitor VI-VMwareVCEventTypes
Virt -VMwareVCEventMonitor Virt_VMwareVCEventTypes
VMware vSphere Events
VI-Discovery Virt –Discovery Virtual Infrastructure Discovery
VI-LinuxVirtGuestCPUUtilMonitor VI-LinuxVirtStateMonitor
Virt -LinuxVirtGuestCPUUtilMonitor Virt –LinuxVirtStateMonitor
Xen Guest Health
VI-LinuxVirtDiskPhysByteRateBaseline-AT VI-LinuxVirtGuestCPUTotalUtilMonitor-AT VI-LinuxVirtNetByteRateBaseline-AT
Virt -LinuxVirtDiskPhysByteRateBaseline-AT Virt -LinuxVirtGuestCPUTotalUtilMonitor-AT Virt -LinuxVirtNetByteRateBaseline-AT
Xen Guest Performance
VI-LinuxVirtHostCPUUtilMonitor VI-LinuxVirtHostMemoryUtilMonitor
Virt -LinuxVirtHostCPUUtilMonitor Virt –LinuxVirtHostMemoryUtilMonitor
Xen Host Health
Mapping Threshold Customizations with Infrastructure MP Parameters Appendix A – Mapping of Infrastructure SPI MT Policy Parameters to Infrastructure MP Parameters provides the mapping of Infrastructure SPI script parameters with OMi parameters.
Tools Mapping The current version of Infrastructure Management Packs do not have any tools.
Node Cleanup Remove SPI artifacts from the node that you are going to monitor using MP. Following are the SPI artifacts that need to be removed in the given order.
1. Remove the HPOM policies from the nodes.
When you remove the MP or SPI Discovery policy, the corresponding elements are removed from the RTSM. Deploying the Infrastructure MP Discovery aspect regenerates the elements in RTSM, but with new CIDs. This action affects SHR reporting because SHR relies on the CID as a key identifier. A workaround is to clean up agtrep.xml (ovagtrep –clearall), and then remove the discovery policies.
You can also remove policies by deleting policy groups for a particular node on the server using the GUI.
2. Remove the SPI CODA data sources.
CODA datasources created by the SPI and MP collector policies cannot be cleaned unless the corresponding CODA data files are removed. However, there is no difference in the Infrastructure MP since the same metrics are logged and datasource names are the same.
3. Remove instrumentation.
Configuration files are used to remove all infraspi policy related xpl config settings from the [eaagt] namespace.
The instrumentation files on the node prefixed with infraspi.* and vispi.* xpl config namespaces can be removed.
Note:

Evolution Guide Page 27
Instrumentation removal may fail if any executable or script is running. Stop the corresponding process (es) and then delete the instrumentation files.
For more information on cleaning up nodes, see Prepare nodes for deployment under the Recommended steps for moving from a SPI to MP section in this document.
For more information on how to back up the data if you need the data for future use, see the SHR documentation.
Evolution Guide Page 28
Oracle Database SPI and Management Pack This section explains the evolution from the HPOM Smart Plug-in for Oracle Database 12.0x to the HPE OMi Management Pack for Oracle Database 1.10.
SPI and MP Comparison This section provides an overview of similarities and differences between HPOM Smart Plug-in for Oracle Database (Oracle Database SPI) and OMi MP for Oracle Database (Oracle Database MP). For information about working with the Oracle Database MP, see the OMi Management Pack for Oracle Database User Guide.
Features Oracle Database SPI 12.0x Oracle Database MP 1.10
Pre-requisites • HPOM W 8.16, HPOM W9, HPOM U/S/L 9 or higher • HP Operations Agent 11.05 or higher
• BSM or MA 9.22 or higher • HP Operations Agent 11.12 or higher
Product Delivery The Oracle Database SPI is shipped with the SPI DVD. The Oracle Database MP is shipped with the OMi 10 installer. Oracle Database MP is also available to download from the e-media download center. See the section Useful resources for the e-media download center link.
Installation Mount the ISO and use the OS specific installer: • HPUX: HP_Operations_Smart_Plug-
ins_HPUX.depot • Linux: HP_Operations_Smart_Plug-
ins_Linux_setup.bin • Solaris: HP_Operations_Smart_Plug-
ins_Solaris_setup.bin • Windows: setup.vbs
1. Oracle Database MP can be installed in any of the following methods:
Use the OMi ConfigWizard to install OMi 10.x. Use this option when you want to install the MP during OMi 10.x installation.
2. Install using the command line interface. Use this option when you want to install MP after OMi 10.x is installed. For more information about opr-mp-installer Command-Line Interface, see the OMi Administration guide.
3. Download the MP bits from the e-media download center. Then mount the ISO and use the OS specific installer:
• Linux: mpinstall.sh-i • Windows: cscript mpinstall.vbs-i Use this option when the latest version of this MP is available in the e-media download center.
Policy grouping Policies are grouped into policy groups.
Management Templates and aspects provide grouping of policy templates relevant to the area and criticality of monitoring.
Policy Versioning The Oracle Database SPI uses the <major version>.<minor version> (xxxx.yyyy) format for policy versioning. Example: If the version of the SPI is 12.03, policies updated in this release would be versioned as 12.0300. On the GUI, it is displayed as 12.300. When you update the above policy, minor version is updated. Example: When you update a policy with version 12.0300 (in GUI: 12.300), it will be changed to 12.0301 (in GUI 12.301).
The OracleDB MP uses the <major version>.<minor version> (xxxx.yyyy) format for policy versioning. Example: Server: 1.0 Node: 0001.0000 Example: In the Oracle Database MP 0001.0010 (in GUI 1.10), policies are versioned as 0001.0000. On the OMi GUI, it is displayed as 1.0. In the subsequent MP releases, policy version will be updated only if a particular policy is updated in that release.

Evolution Guide Page 29
When you update a policy, only minor versions (last two digits) should be updated. Example: When you update a policy with version 0001.0000 (in GUI 1.0), it will be changed to 0001.0001 (in GUI 1.1).
Policy Types The Oracle Database SPI has the following types of policies: • Measurement Threshold • Scheduled Task • Event Log • Logfile • Discovery
The Oracle Database MP has the same types of policies used in SPI. In addition, it has policy templates of the type ConfigFile. For more information, see the section Policy Types in SPI and MP in this document.
Message Groups The Oracle Database SPI provides the following message groups: • Ora_Admin for Administrative messages • Ora_Conf for Configuration messages • Ora_Perf for Performance messages • Ora_Fault for error messages
The Oracle Database MP has exactly the same set of message groups as Oracle Database SPI.
Tools The Oracle Database SPI provides tools for Database Configuration, Database Instance Management, and SPI operations.
In the Oracle Database MP, database configuration is done using parameters. Tools related to MP operations exist. For more information on tools, see the section Tools Mapping in this document.
Instrumentation The Oracle Database SPI contains the following Instrumentation categories: • Databases_Discovery • Databases_Monitoring HPOM Server: SPI Instrumentation is copied into the filesystem. Node: SPI Instrumentation is deployed to the “Instrumentation” directory on the node.
The Oracle Database MP contains the following Instrumentation categories: • Databases_Discovery_MP • Databases_Monitoring_MP • Oracle_Monitoring_MP • SHS_Instrumentation OMi Server: Instrumentation is uploaded into the OMi database. Node: Instrumentation is deployed to the same directories as in the SPIs. There is no difference with the instrumentation location on nodes. Instrumentation file names remain the same.
Discovery Not Available Deploy the Oracle Discovery aspect on the managed node. When the Discovery aspect is deployed to the node, appropriate CIs are published in the RTSM which are essential for CI based deployment. For more information about the created CIs, see the HPE OMi Management Pack for Oracle User Guide. The Oracle Database MP does not support Deep discovery of tablespaces.
Configuration Configuration of the Oracle database instance is done using the Database Configuration Manager tool from OMW or the Configure DB Connection tool from OMx.
Configuration of the Oracle database instance is done using parameters during the deployment. There are no specific tools for configuration. For more information about providing the username, password, and filters among other configurations, see the section Configuration and Customization Mapping in this document.
Note It is recommended not to update configuration directly on the node as it will not synchronize the values with the parameters.
Deployment Deploy specific policies or groups to the appropriate node or node group(s) based on your monitoring needs.
Deploy the MT or Aspect:
1. Assign Management Template or Aspects to Oracle CIs.
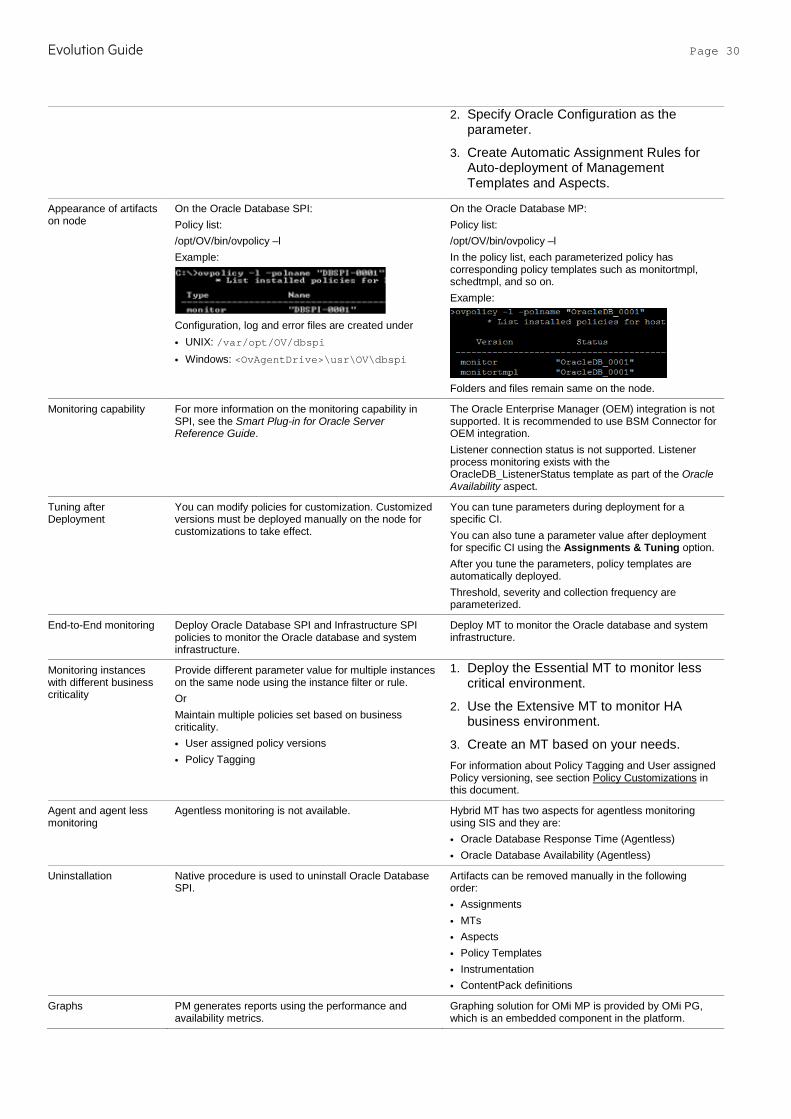
Evolution Guide Page 30
2. Specify Oracle Configuration as the parameter.
3. Create Automatic Assignment Rules for Auto-deployment of Management Templates and Aspects.
Appearance of artifacts on node
On the Oracle Database SPI: Policy list: /opt/OV/bin/ovpolicy –l Example:
Configuration, log and error files are created under • UNIX: /var/opt/OV/dbspi • Windows: <OvAgentDrive>\usr\OV\dbspi
On the Oracle Database MP: Policy list: /opt/OV/bin/ovpolicy –l In the policy list, each parameterized policy has corresponding policy templates such as monitortmpl, schedtmpl, and so on. Example:
Folders and files remain same on the node.
Monitoring capability For more information on the monitoring capability in SPI, see the Smart Plug-in for Oracle Server Reference Guide.
The Oracle Enterprise Manager (OEM) integration is not supported. It is recommended to use BSM Connector for OEM integration. Listener connection status is not supported. Listener process monitoring exists with the OracleDB_ListenerStatus template as part of the Oracle Availability aspect.
Tuning after Deployment
You can modify policies for customization. Customized versions must be deployed manually on the node for customizations to take effect.
You can tune parameters during deployment for a specific CI. You can also tune a parameter value after deployment for specific CI using the Assignments & Tuning option. After you tune the parameters, policy templates are automatically deployed. Threshold, severity and collection frequency are parameterized.
End-to-End monitoring Deploy Oracle Database SPI and Infrastructure SPI policies to monitor the Oracle database and system infrastructure.
Deploy MT to monitor the Oracle database and system infrastructure.
Monitoring instances with different business criticality
Provide different parameter value for multiple instances on the same node using the instance filter or rule. Or Maintain multiple policies set based on business criticality. • User assigned policy versions • Policy Tagging
1. Deploy the Essential MT to monitor less critical environment.
2. Use the Extensive MT to monitor HA business environment.
3. Create an MT based on your needs. For information about Policy Tagging and User assigned Policy versioning, see section Policy Customizations in this document.
Agent and agent less monitoring
Agentless monitoring is not available. Hybrid MT has two aspects for agentless monitoring using SIS and they are: • Oracle Database Response Time (Agentless) • Oracle Database Availability (Agentless)
Uninstallation Native procedure is used to uninstall Oracle Database SPI.
Artifacts can be removed manually in the following order: • Assignments • MTs • Aspects • Policy Templates • Instrumentation • ContentPack definitions
Graphs PM generates reports using the performance and availability metrics.
Graphing solution for OMi MP is provided by OMi PG, which is an embedded component in the platform.

Evolution Guide Page 31
SPIs have a separate installer for OOTB graphs that need to be installed on PM.
OOTB OMi PG graphs are installed with the Oracle Database MP. There is no difference between the graphs present in the Oracle Database SPI and MP.
Data logging on node Collected metrics are logged into either CODA or OVPA on the node.
Uses only the CODA as the datastore. Datasources or class names and metrics logged remain the same. The following data sources are created automatically: • DBSPI_ORA_GRAPH • DBSPI_ORA_REPORT • DBSPI_ORA_UDM
Cluster Support You can configure the Failover using the apminfo.xml as described in the Oracle Database SPI reference guide.
You can use the Agent’s apminfo.xml for MP for Failover configurations. Similar to SPI, Oracle Database MP is not cluster aware in terms of Oracle CI, relations between CIs as well as metrics logging.
Remote Monitoring Supports Remote Monitoring with a limited set of metrics.
Remote Monitoring is not supported. It is recommended to use SiteScope for remote monitoring.
Overriding Policy Thresholds
The override.cfg file helps a database administrator or an operator to monitor a system without having to use the HPOM console and introduce new policy versions or groups.
OMi Parameterization and CI based monitoring helps to avoid new policy versioning and groups. For more information on customizing Management Packs, see the Best Practices for Customizing Management Packs chapter in this document.
Indicators (ETIs and HIs)
Oracle content pack has 56 indicators. The same set of indicators are present in the Oracle Database MP as well.
TBECs There are 18 TBECs as part of Oracle content pack. The same set of TBECs are present in the Oracle Database MP as well.
Events Events are sent through Measurement Threshold Policy, Logfile Policy and Opcmsg Policy with appropriate message text.
Is I18N certified and is localized in the following languages: • French • German • Korean • Japanese • Russian • Simplified Chinese • Spanish
OO Flows Integration with the HP OO flows were shipped part of the Oracle content.
Same set of OO flows are shipped with MP. However, OO flows are restricted to the ops-bridge usecase only. The OO flows work only in an environment where the HPOM and SPI are used for monitoring along with OMi and OO integration.
Common policy changes This section captures changes (such as parameterization) commonly made to Oracle Database SPI policies and describes how to convert them into the Oracle Database MP Policy templates.
Policy Naming Convention in MP All Oracle Database MP Policy templates use the following nomenclature:
• Scheduled task, discovery, config and opcmsg policies start with “OracleDB_”.
• Oracle Database SPI policy names (Measurement threshold policies) start with “DBSPI-0” (example: DBSPI-0001) policy.
• Oracle Database MP has similar naming convention for the Measurement Threshold policy names which start with “OracleDB_0”.
For information on mapping between SPI policies and MP policy templates, see SPI policy to MP policy template mapping in this document.
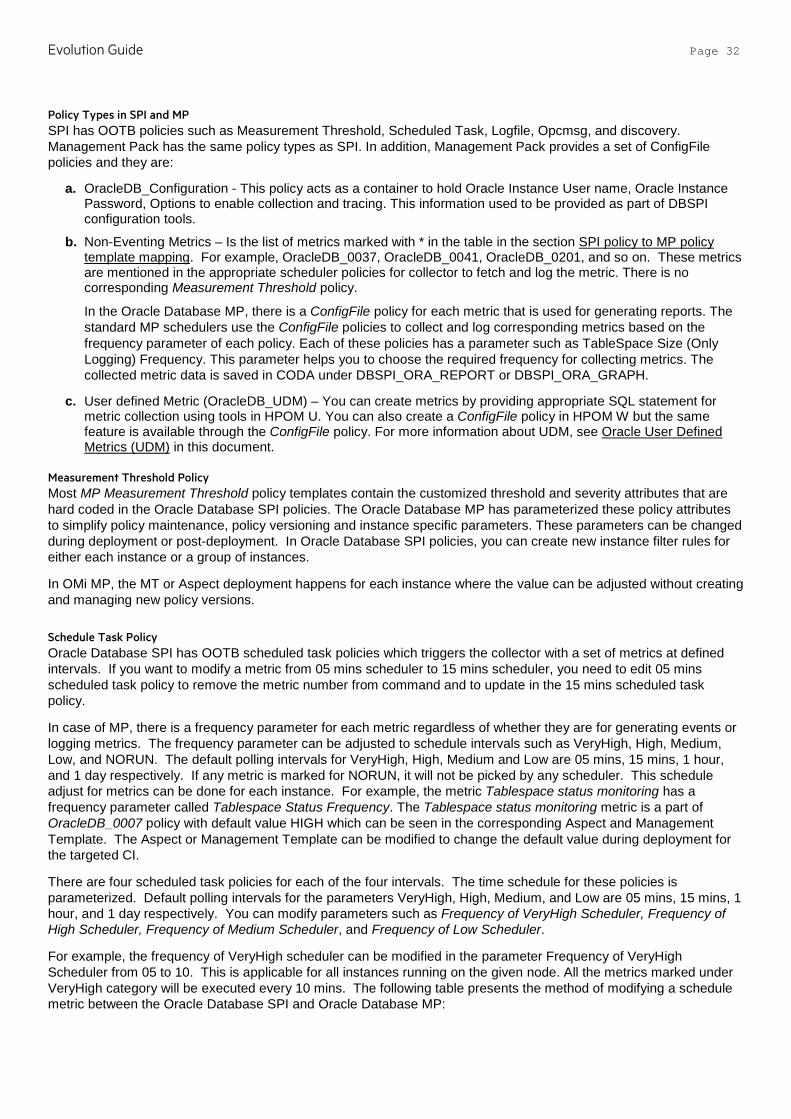
Evolution Guide Page 32
Policy Types in SPI and MP SPI has OOTB policies such as Measurement Threshold, Scheduled Task, Logfile, Opcmsg, and discovery. Management Pack has the same policy types as SPI. In addition, Management Pack provides a set of ConfigFile policies and they are:
a. OracleDB_Configuration - This policy acts as a container to hold Oracle Instance User name, Oracle Instance Password, Options to enable collection and tracing. This information used to be provided as part of DBSPI configuration tools.
b. Non-Eventing Metrics – Is the list of metrics marked with * in the table in the section SPI policy to MP policy template mapping. For example, OracleDB_0037, OracleDB_0041, OracleDB_0201, and so on. These metrics are mentioned in the appropriate scheduler policies for collector to fetch and log the metric. There is no corresponding Measurement Threshold policy.
In the Oracle Database MP, there is a ConfigFile policy for each metric that is used for generating reports. The standard MP schedulers use the ConfigFile policies to collect and log corresponding metrics based on the frequency parameter of each policy. Each of these policies has a parameter such as TableSpace Size (Only Logging) Frequency. This parameter helps you to choose the required frequency for collecting metrics. The collected metric data is saved in CODA under DBSPI_ORA_REPORT or DBSPI_ORA_GRAPH.
c. User defined Metric (OracleDB_UDM) – You can create metrics by providing appropriate SQL statement for metric collection using tools in HPOM U. You can also create a ConfigFile policy in HPOM W but the same feature is available through the ConfigFile policy. For more information about UDM, see Oracle User Defined Metrics (UDM) in this document.
Measurement Threshold Policy Most MP Measurement Threshold policy templates contain the customized threshold and severity attributes that are hard coded in the Oracle Database SPI policies. The Oracle Database MP has parameterized these policy attributes to simplify policy maintenance, policy versioning and instance specific parameters. These parameters can be changed during deployment or post-deployment. In Oracle Database SPI policies, you can create new instance filter rules for either each instance or a group of instances.
In OMi MP, the MT or Aspect deployment happens for each instance where the value can be adjusted without creating and managing new policy versions.
Schedule Task Policy Oracle Database SPI has OOTB scheduled task policies which triggers the collector with a set of metrics at defined intervals. If you want to modify a metric from 05 mins scheduler to 15 mins scheduler, you need to edit 05 mins scheduled task policy to remove the metric number from command and to update in the 15 mins scheduled task policy.
In case of MP, there is a frequency parameter for each metric regardless of whether they are for generating events or logging metrics. The frequency parameter can be adjusted to schedule intervals such as VeryHigh, High, Medium, Low, and NORUN. The default polling intervals for VeryHigh, High, Medium and Low are 05 mins, 15 mins, 1 hour, and 1 day respectively. If any metric is marked for NORUN, it will not be picked by any scheduler. This schedule adjust for metrics can be done for each instance. For example, the metric Tablespace status monitoring has a frequency parameter called Tablespace Status Frequency. The Tablespace status monitoring metric is a part of OracleDB_0007 policy with default value HIGH which can be seen in the corresponding Aspect and Management Template. The Aspect or Management Template can be modified to change the default value during deployment for the targeted CI.
There are four scheduled task policies for each of the four intervals. The time schedule for these policies is parameterized. Default polling intervals for the parameters VeryHigh, High, Medium, and Low are 05 mins, 15 mins, 1 hour, and 1 day respectively. You can modify parameters such as Frequency of VeryHigh Scheduler, Frequency of High Scheduler, Frequency of Medium Scheduler, and Frequency of Low Scheduler.
For example, the frequency of VeryHigh scheduler can be modified in the parameter Frequency of VeryHigh Scheduler from 05 to 10. This is applicable for all instances running on the given node. All the metrics marked under VeryHigh category will be executed every 10 mins. The following table presents the method of modifying a schedule metric between the Oracle Database SPI and Oracle Database MP:
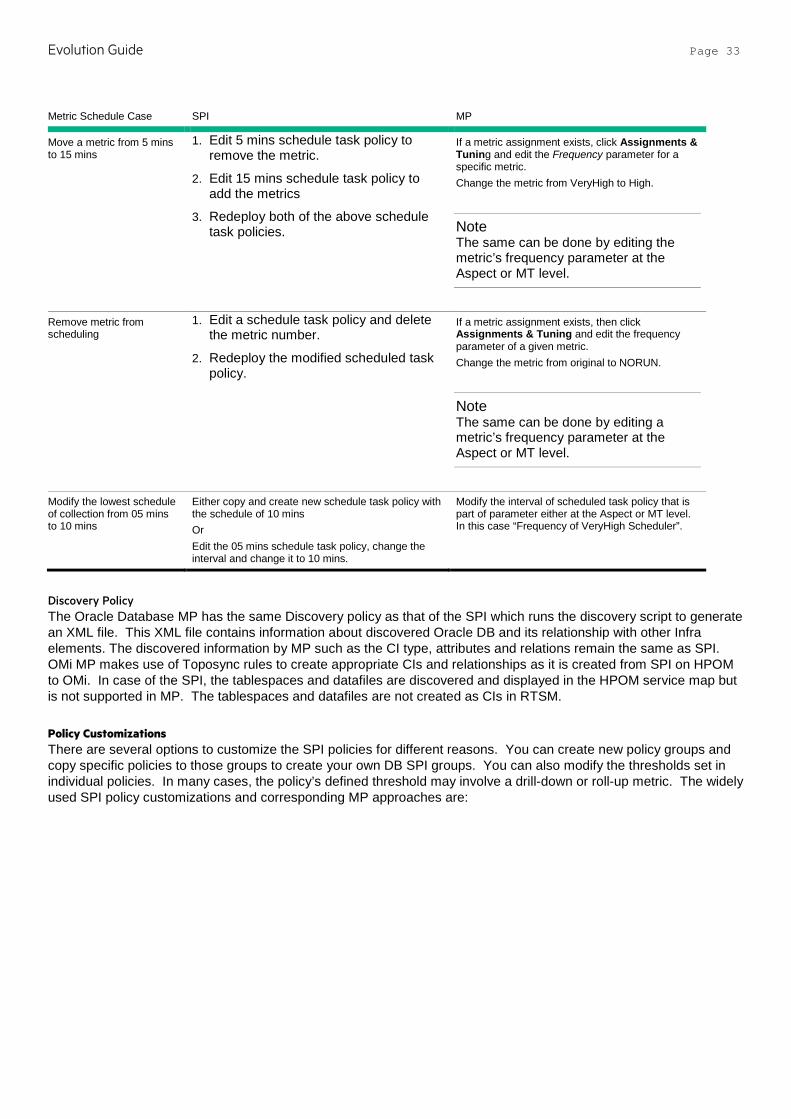
Evolution Guide Page 33
Metric Schedule Case SPI MP
Move a metric from 5 mins to 15 mins
1. Edit 5 mins schedule task policy to remove the metric.
2. Edit 15 mins schedule task policy to add the metrics
3. Redeploy both of the above schedule task policies.
If a metric assignment exists, click Assignments & Tuning and edit the Frequency parameter for a specific metric. Change the metric from VeryHigh to High.
Note The same can be done by editing the metric’s frequency parameter at the Aspect or MT level.
Remove metric from scheduling
1. Edit a schedule task policy and delete the metric number.
2. Redeploy the modified scheduled task policy.
If a metric assignment exists, then click Assignments & Tuning and edit the frequency parameter of a given metric. Change the metric from original to NORUN.
Note The same can be done by editing a metric’s frequency parameter at the Aspect or MT level.
Modify the lowest schedule of collection from 05 mins to 10 mins
Either copy and create new schedule task policy with the schedule of 10 mins Or Edit the 05 mins schedule task policy, change the interval and change it to 10 mins.
Modify the interval of scheduled task policy that is part of parameter either at the Aspect or MT level. In this case “Frequency of VeryHigh Scheduler”.
Discovery Policy The Oracle Database MP has the same Discovery policy as that of the SPI which runs the discovery script to generate an XML file. This XML file contains information about discovered Oracle DB and its relationship with other Infra elements. The discovered information by MP such as the CI type, attributes and relations remain the same as SPI. OMi MP makes use of Toposync rules to create appropriate CIs and relationships as it is created from SPI on HPOM to OMi. In case of the SPI, the tablespaces and datafiles are discovered and displayed in the HPOM service map but is not supported in MP. The tablespaces and datafiles are not created as CIs in RTSM.
Policy Customizations There are several options to customize the SPI policies for different reasons. You can create new policy groups and copy specific policies to those groups to create your own DB SPI groups. You can also modify the thresholds set in individual policies. In many cases, the policy’s defined threshold may involve a drill-down or roll-up metric. The widely used SPI policy customizations and corresponding MP approaches are:

Evolution Guide Page 34
Policy Tagging
What is Policy Tagging in SPI?
If you have database instances categorized into different groups and they need to be monitored differently, then DBSPI provides an option "-t" (tag) which allows the collector to use a different set of customized policies. Custom policy groupings can differentiate one group of policies from another. In such cases, you can:
1. Create copies of the policies.
2. Use the Tag feature to rename the Measurement Threshold and Scheduled Task polices.
3. Assign the policies to various groups. For example, you can create a SAP group of policies and tag those policies with “SAP-” or a PeopleSoft group, and tag those with “PS-.”
To use the Tag feature, make copies of the original DB SPI policies. The names you give to these new policies can contain a prefix, but they must also contain the original policy name.
For example, a copy of DBSPI-0016 can be called SAP-DBSPI-0016. Specify the tag option on the command line so that the Collector, Analyzer or Script uses this new policy rather than the original policy. New scheduled task policies can also be created in this way.
For example: dbspicao -m 16 -t SAP-
How is it achieved in MP?
This can be achieved by the OMi feature Management Templates. You can create different flavors of Management Templates from copying the OOTB MTs. This newly created Management Template can be customized to:
• Add or remove Aspects
• Enable or disable metrics within an aspect
• Modify parameters based on the criticality of database for which MT intends to be deployed.
For more information on customizing MPs, see the Best Practices for Customizing Management Packs chapter in this document.
User Assigned Policy Versioning
You can use the policy versioning approach to create customized policies for each group. HPOM automatically changes a modified policy version by incrementing the last digit by 1. This method suggests to override a policy version by using the Save option and inserting your own version. For example, 100-199 is for one group, 200-299 for another, and so on.
How to use policy versioning in MP?
Using a Management Template is the recommended approach. For more information about policy versioning, see the Best Practices for Customizing Management Packs chapter in this document.
SPI policy to MP policy template mapping This section maps Oracle Database MP’s policies to corresponding Oracle Database SPI’s policies. Also, it captures the differences between them, if there are any.
In the table below, MP policy templates marked with “*” are for only logging metric data into CODA and are not meant for generating events. The type of the policy is mentioned in short form along with the policy name.
• MT: Measurement Threshold
• ST: Scheduled Task
• CF: Config File
• LE: Logfile Entry

Evolution Guide Page 35
Oracle Database SPI Policies Oracle Database MP Policy Templates
Oracle Database MP Aspects
DBSPI-0028 (MT) OracleDB_0028 (MT) Basic Oracle Locks and Latches
DBSPI-0029 (MT) OracleDB_0029 (MT)
DBSPI-0043 (MT) OracleDB_0043 (MT)
DBSPI-0016 (MT) OracleDB_0016 (MT) Basic Oracle Segment Space
DBSPI-0216 (MT) OracleDB_0216 (MT)
DBSPI-Ora-1d-Reporter-NT (ST) Logs metric 215 as triggered by above scheduler
OracleDB_0215* (CF)
DBSPI-0106 (MT) OracleDB_0106 (MT) Basic Oracle Query Performance
DBSPI-0107 (MT) OracleDB_0107 (MT)
DBSPI-0108 (MT) OracleDB_0108 (MT)
DBSPI-0119 (MT) OracleDB_0119 (MT)
DBSPI-0306 (MT) OracleDB_0306 (MT)
DBSPI-0307 (MT) OracleDB_0307 (MT)
DBSPI-0308 (MT) OracleDB_0308 (MT)
DBSPI-0017 (MT) OracleDB_0017 (MT) Oracle Segment Space
DBSPI-0018 (MT) OracleDB_0018 (MT)
DBSPI-0016 (MT) OracleDB_0016 (MT)
DBSPI-0216 (MT) OracleDB_0216 (MT)
DBSPI-Ora-1d-Reporter-NT (ST) Logs metric 215 as triggered by above scheduler
OracleDB_0215* (CF)
DBSPI-0217 (MT) OracleDB_0217 (MT)
DBSPI-0218 (MT) OracleDB_0218 (MT)
DBSPI-0038 (MT) OracleDB_0038 (MT) Oracle Locks and Latches
DBSPI-0097 (MT) OracleDB_0097 (MT)
DBSPI-0028 (MT) OracleDB_0028 (MT)
DBSPI-0029 (MT) OracleDB_0029 (MT)
DBSPI-0043 (MT) OracleDB_0043 (MT)
DBSPI-0021 (MT) OracleDB_0021 (MT) Basic Oracle Memory Performance
DBSPI-0022 (MT) OracleDB_0022 (MT)
DBSPI-0023 (MT) OracleDB_0023 (MT)
DBSPI-0024 (MT) OracleDB_0024 (MT)
DBSPI-0026 (MT) OracleDB_0026 (MT)
DBSPI-0027 (MT) OracleDB_0027 (MT)
DBSPI-0032 (MT) OracleDB_0032 (MT)
DBSPI-0033 (MT) OracleDB_0033 (MT)
DBSPI-0034 (MT) OracleDB_0034 (MT)
DBSPI-0035 (MT) OracleDB_0035 (MT)
DBSPI-0045 (MT) OracleDB_0045 (MT)
DBSPI-0083 (MT) OracleDB_0083 (MT)
DBSPI-0019 (MT) OracleDB_0019 (MT) Oracle Memory Performance
DBSPI-0020 (MT) OracleDB_0020 (MT)
DBSPI-0039 (MT) OracleDB_0039 (MT)
DBSPI-0040 (MT) OracleDB_0040 (MT)
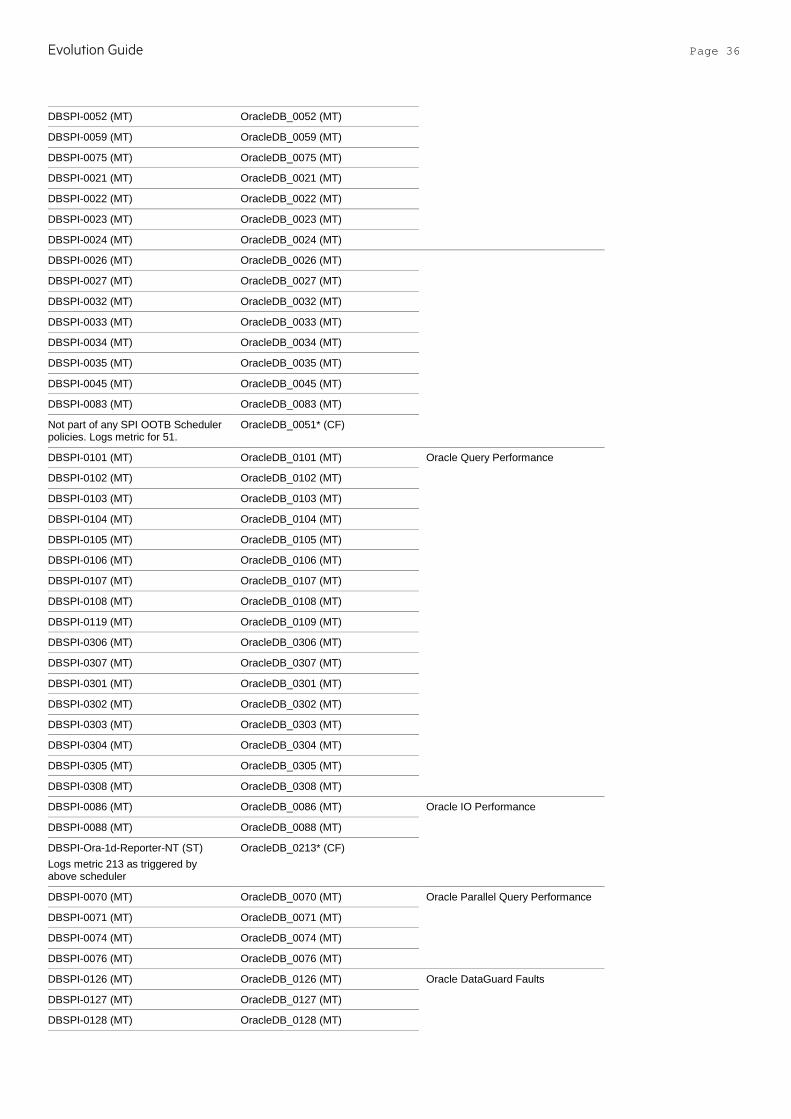
Evolution Guide Page 36
DBSPI-0052 (MT) OracleDB_0052 (MT)
DBSPI-0059 (MT) OracleDB_0059 (MT)
DBSPI-0075 (MT) OracleDB_0075 (MT)
DBSPI-0021 (MT) OracleDB_0021 (MT)
DBSPI-0022 (MT) OracleDB_0022 (MT)
DBSPI-0023 (MT) OracleDB_0023 (MT)
DBSPI-0024 (MT) OracleDB_0024 (MT)
DBSPI-0026 (MT) OracleDB_0026 (MT)
DBSPI-0027 (MT) OracleDB_0027 (MT)
DBSPI-0032 (MT) OracleDB_0032 (MT)
DBSPI-0033 (MT) OracleDB_0033 (MT)
DBSPI-0034 (MT) OracleDB_0034 (MT)
DBSPI-0035 (MT) OracleDB_0035 (MT)
DBSPI-0045 (MT) OracleDB_0045 (MT)
DBSPI-0083 (MT) OracleDB_0083 (MT)
Not part of any SPI OOTB Scheduler policies. Logs metric for 51.
OracleDB_0051* (CF)
DBSPI-0101 (MT) OracleDB_0101 (MT) Oracle Query Performance
DBSPI-0102 (MT) OracleDB_0102 (MT)
DBSPI-0103 (MT) OracleDB_0103 (MT)
DBSPI-0104 (MT) OracleDB_0104 (MT)
DBSPI-0105 (MT) OracleDB_0105 (MT)
DBSPI-0106 (MT) OracleDB_0106 (MT)
DBSPI-0107 (MT) OracleDB_0107 (MT)
DBSPI-0108 (MT) OracleDB_0108 (MT)
DBSPI-0119 (MT) OracleDB_0109 (MT)
DBSPI-0306 (MT) OracleDB_0306 (MT)
DBSPI-0307 (MT) OracleDB_0307 (MT)
DBSPI-0301 (MT) OracleDB_0301 (MT)
DBSPI-0302 (MT) OracleDB_0302 (MT)
DBSPI-0303 (MT) OracleDB_0303 (MT)
DBSPI-0304 (MT) OracleDB_0304 (MT)
DBSPI-0305 (MT) OracleDB_0305 (MT)
DBSPI-0308 (MT) OracleDB_0308 (MT)
DBSPI-0086 (MT) OracleDB_0086 (MT) Oracle IO Performance
DBSPI-0088 (MT) OracleDB_0088 (MT)
DBSPI-Ora-1d-Reporter-NT (ST) Logs metric 213 as triggered by above scheduler
OracleDB_0213* (CF)
DBSPI-0070 (MT) OracleDB_0070 (MT) Oracle Parallel Query Performance
DBSPI-0071 (MT) OracleDB_0071 (MT)
DBSPI-0074 (MT) OracleDB_0074 (MT)
DBSPI-0076 (MT) OracleDB_0076 (MT)
DBSPI-0126 (MT) OracleDB_0126 (MT) Oracle DataGuard Faults
DBSPI-0127 (MT) OracleDB_0127 (MT)
DBSPI-0128 (MT) OracleDB_0128 (MT)
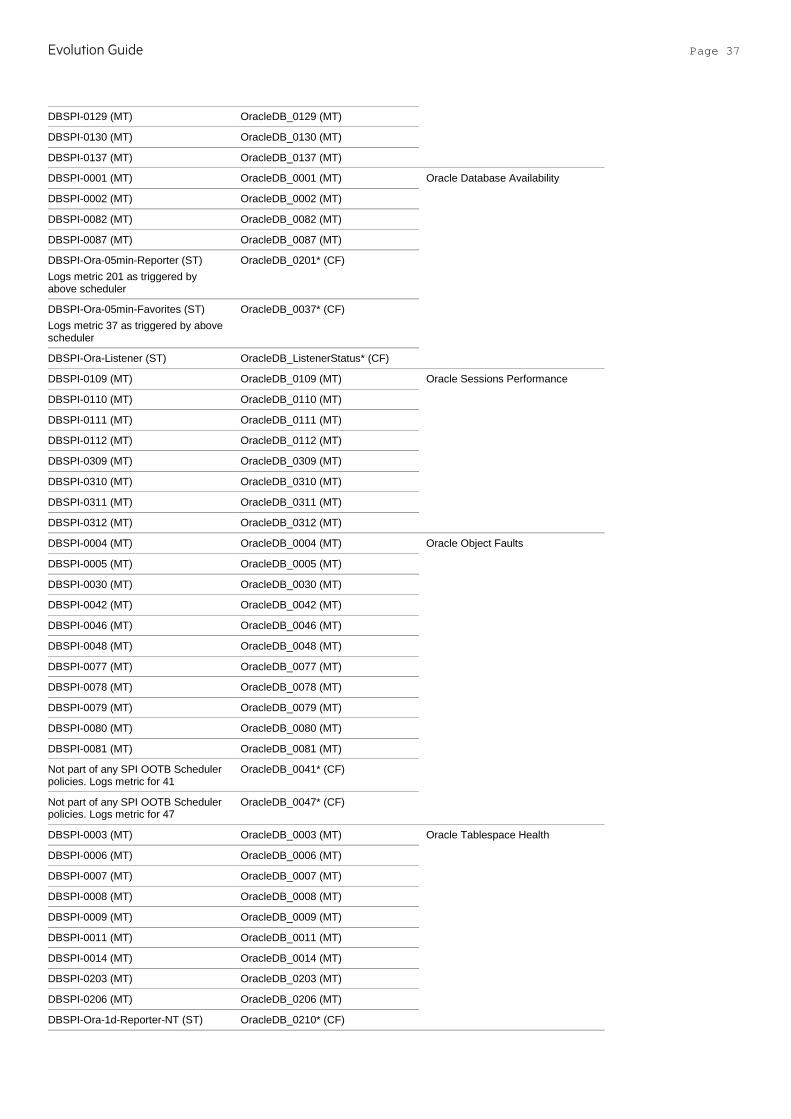
Evolution Guide Page 37
DBSPI-0129 (MT) OracleDB_0129 (MT)
DBSPI-0130 (MT) OracleDB_0130 (MT)
DBSPI-0137 (MT) OracleDB_0137 (MT)
DBSPI-0001 (MT) OracleDB_0001 (MT) Oracle Database Availability
DBSPI-0002 (MT) OracleDB_0002 (MT)
DBSPI-0082 (MT) OracleDB_0082 (MT)
DBSPI-0087 (MT) OracleDB_0087 (MT)
DBSPI-Ora-05min-Reporter (ST) Logs metric 201 as triggered by above scheduler
OracleDB_0201* (CF)
DBSPI-Ora-05min-Favorites (ST) Logs metric 37 as triggered by above scheduler
OracleDB_0037* (CF)
DBSPI-Ora-Listener (ST) OracleDB_ListenerStatus* (CF)
DBSPI-0109 (MT) OracleDB_0109 (MT) Oracle Sessions Performance
DBSPI-0110 (MT) OracleDB_0110 (MT)
DBSPI-0111 (MT) OracleDB_0111 (MT)
DBSPI-0112 (MT) OracleDB_0112 (MT)
DBSPI-0309 (MT) OracleDB_0309 (MT)
DBSPI-0310 (MT) OracleDB_0310 (MT)
DBSPI-0311 (MT) OracleDB_0311 (MT)
DBSPI-0312 (MT) OracleDB_0312 (MT)
DBSPI-0004 (MT) OracleDB_0004 (MT) Oracle Object Faults
DBSPI-0005 (MT) OracleDB_0005 (MT)
DBSPI-0030 (MT) OracleDB_0030 (MT)
DBSPI-0042 (MT) OracleDB_0042 (MT)
DBSPI-0046 (MT) OracleDB_0046 (MT)
DBSPI-0048 (MT) OracleDB_0048 (MT)
DBSPI-0077 (MT) OracleDB_0077 (MT)
DBSPI-0078 (MT) OracleDB_0078 (MT)
DBSPI-0079 (MT) OracleDB_0079 (MT)
DBSPI-0080 (MT) OracleDB_0080 (MT)
DBSPI-0081 (MT) OracleDB_0081 (MT)
Not part of any SPI OOTB Scheduler policies. Logs metric for 41
OracleDB_0041* (CF)
Not part of any SPI OOTB Scheduler policies. Logs metric for 47
OracleDB_0047* (CF)
DBSPI-0003 (MT) OracleDB_0003 (MT) Oracle Tablespace Health
DBSPI-0006 (MT) OracleDB_0006 (MT)
DBSPI-0007 (MT) OracleDB_0007 (MT)
DBSPI-0008 (MT) OracleDB_0008 (MT)
DBSPI-0009 (MT) OracleDB_0009 (MT)
DBSPI-0011 (MT) OracleDB_0011 (MT)
DBSPI-0014 (MT) OracleDB_0014 (MT)
DBSPI-0203 (MT) OracleDB_0203 (MT)
DBSPI-0206 (MT) OracleDB_0206 (MT)
DBSPI-Ora-1d-Reporter-NT (ST) OracleDB_0210* (CF)
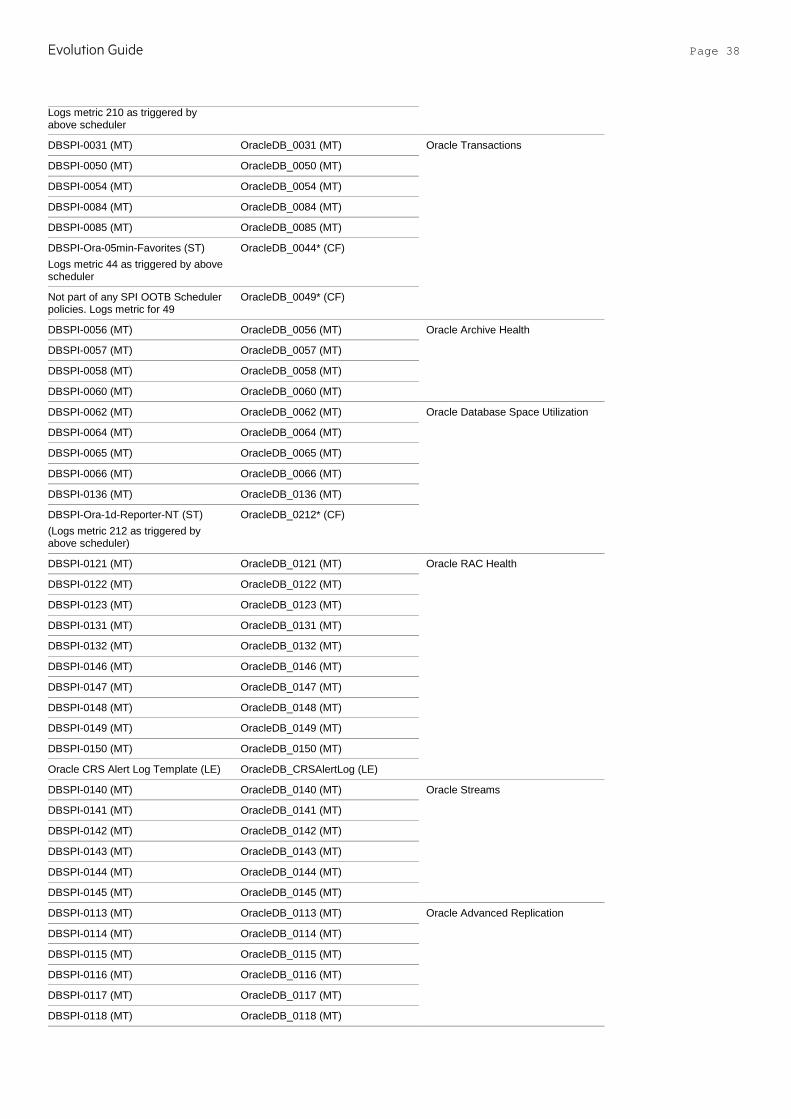
Evolution Guide Page 38
Logs metric 210 as triggered by above scheduler
DBSPI-0031 (MT) OracleDB_0031 (MT) Oracle Transactions
DBSPI-0050 (MT) OracleDB_0050 (MT)
DBSPI-0054 (MT) OracleDB_0054 (MT)
DBSPI-0084 (MT) OracleDB_0084 (MT)
DBSPI-0085 (MT) OracleDB_0085 (MT)
DBSPI-Ora-05min-Favorites (ST) Logs metric 44 as triggered by above scheduler
OracleDB_0044* (CF)
Not part of any SPI OOTB Scheduler policies. Logs metric for 49
OracleDB_0049* (CF)
DBSPI-0056 (MT) OracleDB_0056 (MT) Oracle Archive Health
DBSPI-0057 (MT) OracleDB_0057 (MT)
DBSPI-0058 (MT) OracleDB_0058 (MT)
DBSPI-0060 (MT) OracleDB_0060 (MT)
DBSPI-0062 (MT) OracleDB_0062 (MT) Oracle Database Space Utilization
DBSPI-0064 (MT) OracleDB_0064 (MT)
DBSPI-0065 (MT) OracleDB_0065 (MT)
DBSPI-0066 (MT) OracleDB_0066 (MT)
DBSPI-0136 (MT) OracleDB_0136 (MT)
DBSPI-Ora-1d-Reporter-NT (ST) (Logs metric 212 as triggered by above scheduler)
OracleDB_0212* (CF)
DBSPI-0121 (MT) OracleDB_0121 (MT) Oracle RAC Health
DBSPI-0122 (MT) OracleDB_0122 (MT)
DBSPI-0123 (MT) OracleDB_0123 (MT)
DBSPI-0131 (MT) OracleDB_0131 (MT)
DBSPI-0132 (MT) OracleDB_0132 (MT)
DBSPI-0146 (MT) OracleDB_0146 (MT)
DBSPI-0147 (MT) OracleDB_0147 (MT)
DBSPI-0148 (MT) OracleDB_0148 (MT)
DBSPI-0149 (MT) OracleDB_0149 (MT)
DBSPI-0150 (MT) OracleDB_0150 (MT)
Oracle CRS Alert Log Template (LE) OracleDB_CRSAlertLog (LE)
DBSPI-0140 (MT) OracleDB_0140 (MT) Oracle Streams
DBSPI-0141 (MT) OracleDB_0141 (MT)
DBSPI-0142 (MT) OracleDB_0142 (MT)
DBSPI-0143 (MT) OracleDB_0143 (MT)
DBSPI-0144 (MT) OracleDB_0144 (MT)
DBSPI-0145 (MT) OracleDB_0145 (MT)
DBSPI-0113 (MT) OracleDB_0113 (MT) Oracle Advanced Replication
DBSPI-0114 (MT) OracleDB_0114 (MT)
DBSPI-0115 (MT) OracleDB_0115 (MT)
DBSPI-0116 (MT) OracleDB_0116 (MT)
DBSPI-0117 (MT) OracleDB_0117 (MT)
DBSPI-0118 (MT) OracleDB_0118 (MT)

Evolution Guide Page 39
DBSPI-0090 (MT) OracleDB_0090 (MT) Oracle Shared Server Performance
DBSPI-0091 (MT) OracleDB_0091 (MT)
DBSPI-0092 (MT) OracleDB_0092 (MT)
DBSPI-0095 (MT) OracleDB_0095 (MT)
DBSPI-0096 (MT) OracleDB_0096 (MT)
DBSPI-0133 (MT) OracleDB_0133 (MT) Oracle ASM Health
DBSPI-0334 (MT) OracleDB_0334 (MT)
DBSPI-Ora-DeepDiscovery-1d (ST) OracleDB_DeepDiscovery (ST)
Note It is a dummy policy.
Oracle Discovery
DatabaseServiceDiscovery(DISC) OracleDB_Discovery(DISC)
DBSPI-Ora-Add-Ons-05min (ST) OracleDB_VeryHigh (ST)
Note For more details, see section Schedule Task Policy in this document.
Oraspi Base
DBSPI-Ora-05min-Favorites (ST)
DBSPI-Ora-05min-Reporter (ST)
DBSPI-Ora-05min-SQLNet (ST)
DBSPI-Ora-Add-Ons-15min (ST) OracleDB_High (ST)
DBSPI-Ora-StreamsMon-15Min (ST)
DBSPI-Ora-15min-SQLNet (ST)
DBSPI-Ora-Add-Ons-1h (ST) OracleDB_Medium (ST)
DBSPI-Ora-1h-Favorites (ST)
DBSPI-Ora-1h-SQLNet (ST)
DBSPI-Ora-1d-Favorites (ST) OracleDB_Low (ST)
DBSPI-Ora-1d-Reporter (ST)
DBSPI-Ora-1d-SQLNet (ST)
DBSPI-MeasureWare (ST) OracleDB_Logger (ST)
DBSPI-Messages(OPCMSG) OracleDB_Messages (OPCMSG)
NT Oracle Alert Log Template (LE) OracleDB_AlertLog (LE)
Oracle Alert Log Template (LE) OracleDB_AlertLog (LE)
NA OracleDB_Configuration (CF)
DBSPI-07XX (MT) DBSPI-Ora-UDM-YYmin (ST)
OracleDB_07XX (MT) Oracle UDA
OracleDB_UDM (CF)
Note This ConfigFile policy contains the metric code equivalent to the one provided in the OMU tool Configure UDM or created ConfigFile policy in OMW.
NA Oracle Database Response Time (SIS)
Oracle Database Response Time (Agentless)
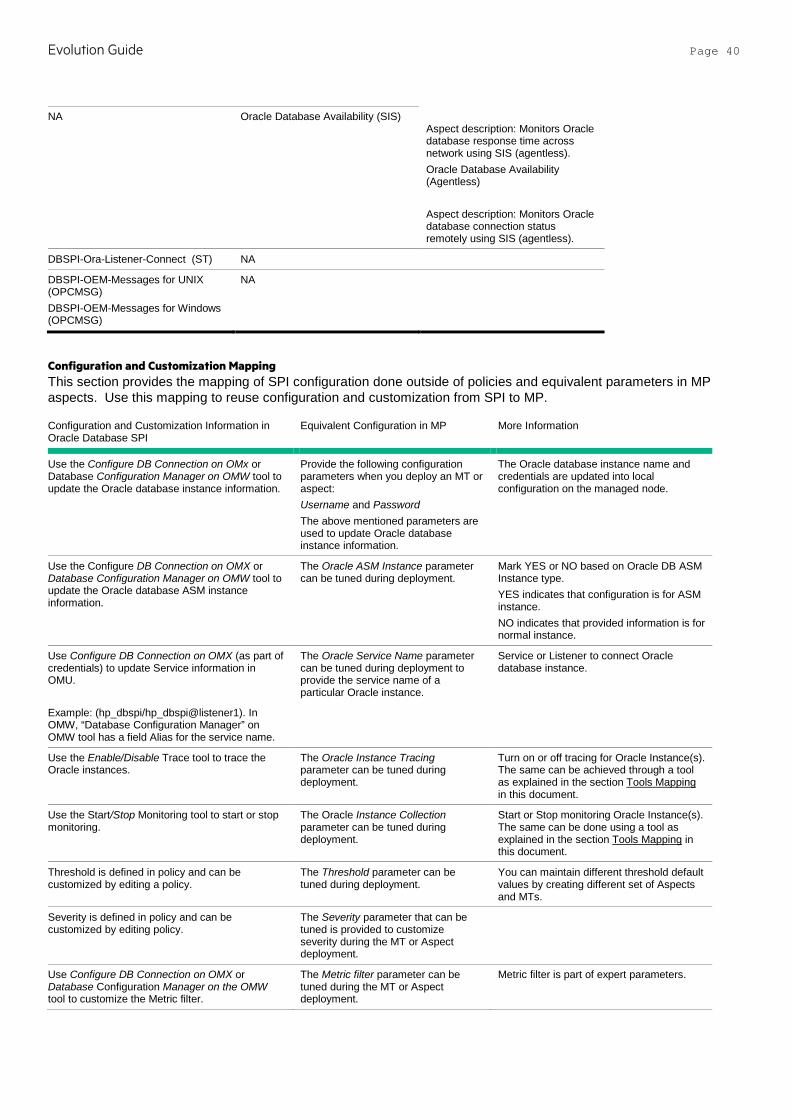
Evolution Guide Page 40
NA Oracle Database Availability (SIS) Aspect description: Monitors Oracle database response time across network using SIS (agentless). Oracle Database Availability (Agentless) Aspect description: Monitors Oracle database connection status remotely using SIS (agentless).
DBSPI-Ora-Listener-Connect (ST) NA
DBSPI-OEM-Messages for UNIX (OPCMSG) DBSPI-OEM-Messages for Windows (OPCMSG)
NA
Configuration and Customization Mapping This section provides the mapping of SPI configuration done outside of policies and equivalent parameters in MP aspects. Use this mapping to reuse configuration and customization from SPI to MP.
Configuration and Customization Information in Oracle Database SPI
Equivalent Configuration in MP More Information
Use the Configure DB Connection on OMx or Database Configuration Manager on OMW tool to update the Oracle database instance information.
Provide the following configuration parameters when you deploy an MT or aspect: Username and Password The above mentioned parameters are used to update Oracle database instance information.
The Oracle database instance name and credentials are updated into local configuration on the managed node.
Use the Configure DB Connection on OMX or Database Configuration Manager on OMW tool to update the Oracle database ASM instance information.
The Oracle ASM Instance parameter can be tuned during deployment.
Mark YES or NO based on Oracle DB ASM Instance type. YES indicates that configuration is for ASM instance. NO indicates that provided information is for normal instance.
Use Configure DB Connection on OMX (as part of credentials) to update Service information in OMU. Example: (hp_dbspi/hp_dbspi@listener1). In OMW, “Database Configuration Manager” on OMW tool has a field Alias for the service name.
The Oracle Service Name parameter can be tuned during deployment to provide the service name of a particular Oracle instance.
Service or Listener to connect Oracle database instance.
Use the Enable/Disable Trace tool to trace the Oracle instances.
The Oracle Instance Tracing parameter can be tuned during deployment.
Turn on or off tracing for Oracle Instance(s). The same can be achieved through a tool as explained in the section Tools Mapping in this document.
Use the Start/Stop Monitoring tool to start or stop monitoring.
The Oracle Instance Collection parameter can be tuned during deployment.
Start or Stop monitoring Oracle Instance(s). The same can be done using a tool as explained in the section Tools Mapping in this document.
Threshold is defined in policy and can be customized by editing a policy.
The Threshold parameter can be tuned during deployment.
You can maintain different threshold default values by creating different set of Aspects and MTs.
Severity is defined in policy and can be customized by editing policy.
The Severity parameter that can be tuned is provided to customize severity during the MT or Aspect deployment.
Use Configure DB Connection on OMX or Database Configuration Manager on the OMW tool to customize the Metric filter.
The Metric filter parameter can be tuned during the MT or Aspect deployment.
Metric filter is part of expert parameters.
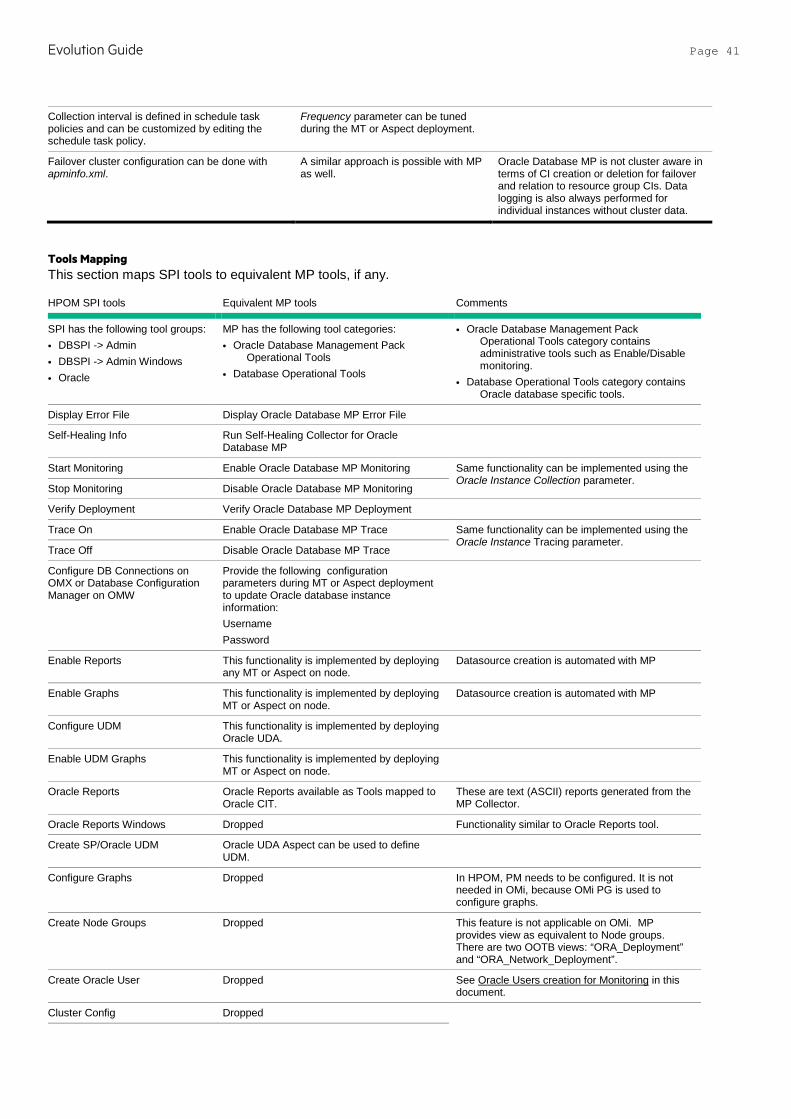
Evolution Guide Page 41
Collection interval is defined in schedule task policies and can be customized by editing the schedule task policy.
Frequency parameter can be tuned during the MT or Aspect deployment.
Failover cluster configuration can be done with apminfo.xml.
A similar approach is possible with MP as well.
Oracle Database MP is not cluster aware in terms of CI creation or deletion for failover and relation to resource group CIs. Data logging is also always performed for individual instances without cluster data.
Tools Mapping This section maps SPI tools to equivalent MP tools, if any.
HPOM SPI tools Equivalent MP tools Comments
SPI has the following tool groups: • DBSPI -> Admin • DBSPI -> Admin Windows • Oracle
MP has the following tool categories: • Oracle Database Management Pack
Operational Tools • Database Operational Tools
• Oracle Database Management Pack Operational Tools category contains administrative tools such as Enable/Disable monitoring.
• Database Operational Tools category contains Oracle database specific tools.
Display Error File Display Oracle Database MP Error File
Self-Healing Info Run Self-Healing Collector for Oracle Database MP
Start Monitoring Enable Oracle Database MP Monitoring Same functionality can be implemented using the Oracle Instance Collection parameter.
Stop Monitoring Disable Oracle Database MP Monitoring
Verify Deployment Verify Oracle Database MP Deployment
Trace On Enable Oracle Database MP Trace Same functionality can be implemented using the Oracle Instance Tracing parameter.
Trace Off Disable Oracle Database MP Trace
Configure DB Connections on OMX or Database Configuration Manager on OMW
Provide the following configuration parameters during MT or Aspect deployment to update Oracle database instance information: Username Password
Enable Reports This functionality is implemented by deploying any MT or Aspect on node.
Datasource creation is automated with MP
Enable Graphs This functionality is implemented by deploying MT or Aspect on node.
Datasource creation is automated with MP
Configure UDM This functionality is implemented by deploying Oracle UDA.
Enable UDM Graphs This functionality is implemented by deploying MT or Aspect on node.
Oracle Reports Oracle Reports available as Tools mapped to Oracle CIT.
These are text (ASCII) reports generated from the MP Collector.
Oracle Reports Windows Dropped Functionality similar to Oracle Reports tool.
Create SP/Oracle UDM Oracle UDA Aspect can be used to define UDM.
Configure Graphs Dropped In HPOM, PM needs to be configured. It is not needed in OMi, because OMi PG is used to configure graphs.
Create Node Groups Dropped This feature is not applicable on OMi. MP provides view as equivalent to Node groups. There are two OOTB views: “ORA_Deployment” and “ORA_Network_Deployment”.
Create Oracle User Dropped See Oracle Users creation for Monitoring in this document.
Cluster Config Dropped
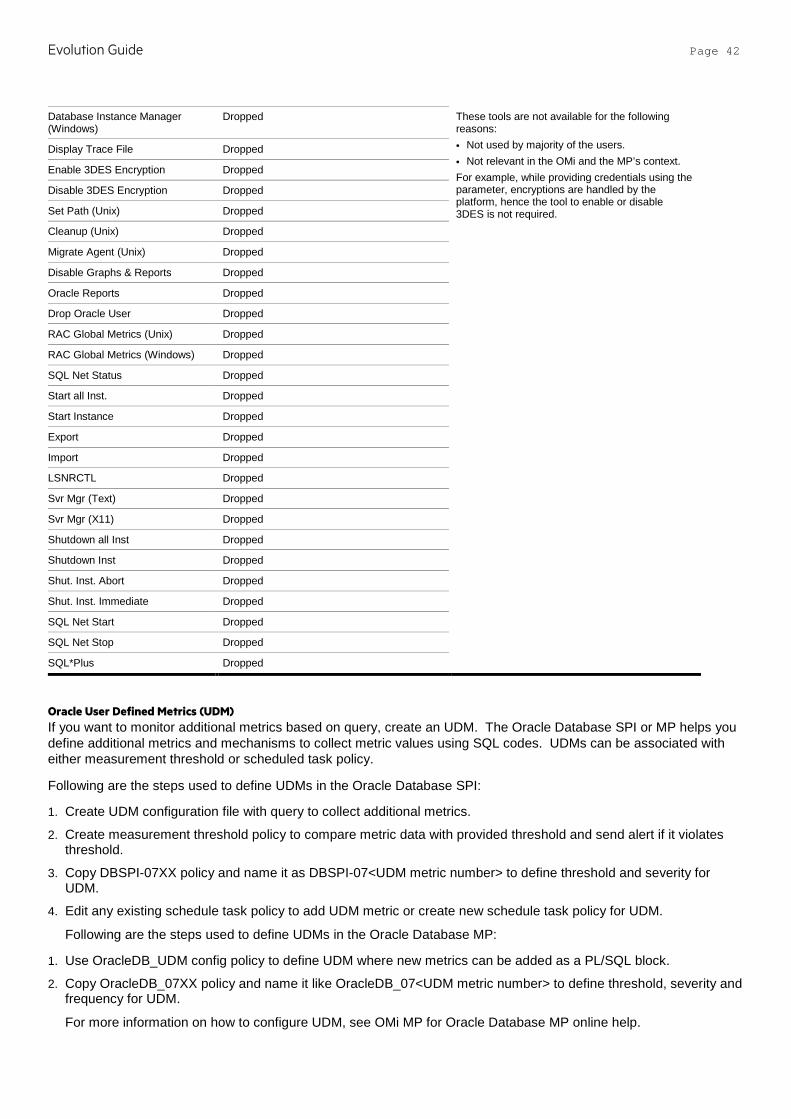
Evolution Guide Page 42
Database Instance Manager (Windows)
Dropped These tools are not available for the following reasons: • Not used by majority of the users. • Not relevant in the OMi and the MP’s context. For example, while providing credentials using the parameter, encryptions are handled by the platform, hence the tool to enable or disable 3DES is not required.
Display Trace File Dropped
Enable 3DES Encryption Dropped
Disable 3DES Encryption Dropped
Set Path (Unix) Dropped
Cleanup (Unix) Dropped
Migrate Agent (Unix) Dropped
Disable Graphs & Reports Dropped
Oracle Reports Dropped
Drop Oracle User Dropped
RAC Global Metrics (Unix) Dropped
RAC Global Metrics (Windows) Dropped
SQL Net Status Dropped
Start all Inst. Dropped
Start Instance Dropped
Export Dropped
Import Dropped
LSNRCTL Dropped
Svr Mgr (Text) Dropped
Svr Mgr (X11) Dropped
Shutdown all Inst Dropped
Shutdown Inst Dropped
Shut. Inst. Abort Dropped
Shut. Inst. Immediate Dropped
SQL Net Start Dropped
SQL Net Stop Dropped
SQL*Plus Dropped
Oracle User Defined Metrics (UDM) If you want to monitor additional metrics based on query, create an UDM. The Oracle Database SPI or MP helps you define additional metrics and mechanisms to collect metric values using SQL codes. UDMs can be associated with either measurement threshold or scheduled task policy.
Following are the steps used to define UDMs in the Oracle Database SPI:
1. Create UDM configuration file with query to collect additional metrics.
2. Create measurement threshold policy to compare metric data with provided threshold and send alert if it violates threshold.
3. Copy DBSPI-07XX policy and name it as DBSPI-07<UDM metric number> to define threshold and severity for UDM.
4. Edit any existing schedule task policy to add UDM metric or create new schedule task policy for UDM.
Following are the steps used to define UDMs in the Oracle Database MP:
1. Use OracleDB_UDM config policy to define UDM where new metrics can be added as a PL/SQL block.
2. Copy OracleDB_07XX policy and name it like OracleDB_07<UDM metric number> to define threshold, severity and frequency for UDM.
For more information on how to configure UDM, see OMi MP for Oracle Database MP online help.
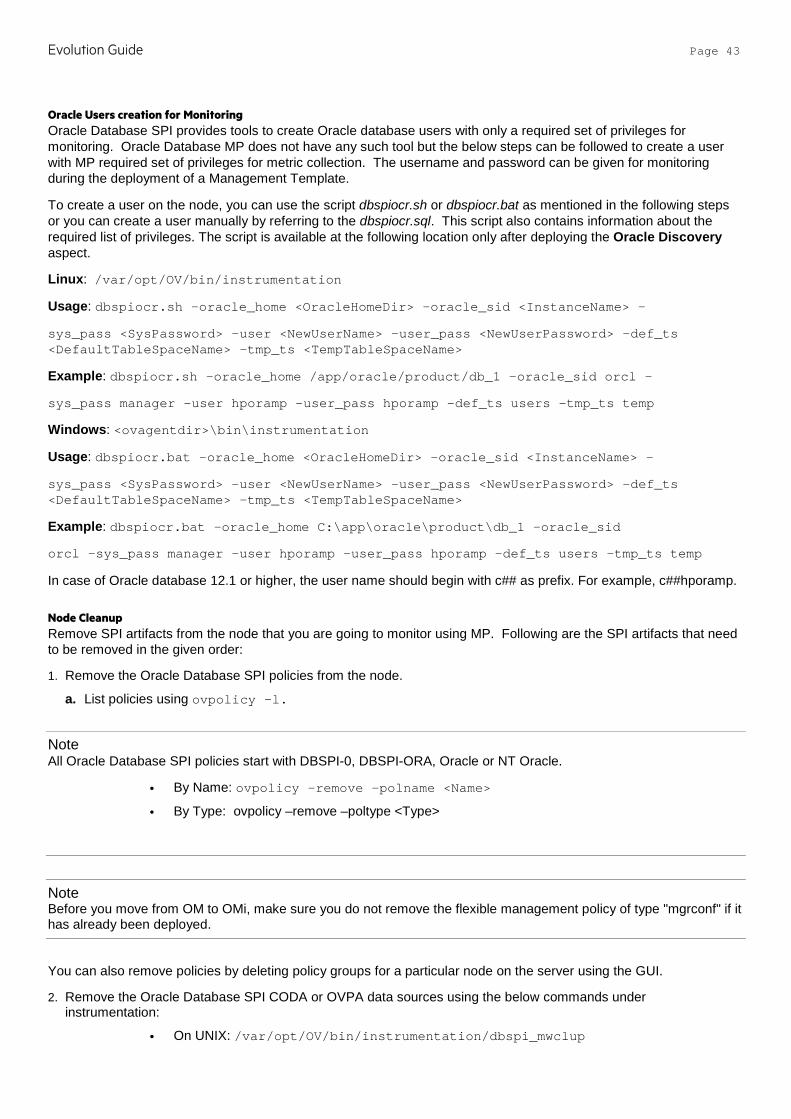
Evolution Guide Page 43
Oracle Users creation for Monitoring Oracle Database SPI provides tools to create Oracle database users with only a required set of privileges for monitoring. Oracle Database MP does not have any such tool but the below steps can be followed to create a user with MP required set of privileges for metric collection. The username and password can be given for monitoring during the deployment of a Management Template.
To create a user on the node, you can use the script dbspiocr.sh or dbspiocr.bat as mentioned in the following steps or you can create a user manually by referring to the dbspiocr.sql. This script also contains information about the required list of privileges. The script is available at the following location only after deploying the Oracle Discovery aspect.
Linux: /var/opt/OV/bin/instrumentation
Usage: dbspiocr.sh -oracle_home <OracleHomeDir> -oracle_sid <InstanceName> -
sys_pass <SysPassword> -user <NewUserName> -user_pass <NewUserPassword> -def_ts <DefaultTableSpaceName> -tmp_ts <TempTableSpaceName>
Example: dbspiocr.sh -oracle_home /app/oracle/product/db_1 -oracle_sid orcl -
sys_pass manager -user hporamp -user_pass hporamp -def_ts users -tmp_ts temp
Windows: <ovagentdir>\bin\instrumentation
Usage: dbspiocr.bat -oracle_home <OracleHomeDir> -oracle_sid <InstanceName> -
sys_pass <SysPassword> -user <NewUserName> -user_pass <NewUserPassword> -def_ts <DefaultTableSpaceName> -tmp_ts <TempTableSpaceName>
Example: dbspiocr.bat -oracle_home C:\app\oracle\product\db_1 -oracle_sid
orcl -sys_pass manager -user hporamp -user_pass hporamp -def_ts users -tmp_ts temp
In case of Oracle database 12.1 or higher, the user name should begin with c## as prefix. For example, c##hporamp.
Node Cleanup Remove SPI artifacts from the node that you are going to monitor using MP. Following are the SPI artifacts that need to be removed in the given order:
1. Remove the Oracle Database SPI policies from the node.
a. List policies using ovpolicy –l.
Note All Oracle Database SPI policies start with DBSPI-0, DBSPI-ORA, Oracle or NT Oracle.
• By Name: ovpolicy –remove –polname <Name>
• By Type: ovpolicy –remove –poltype <Type>
Note Before you move from OM to OMi, make sure you do not remove the flexible management policy of type "mgrconf" if it has already been deployed.
You can also remove policies by deleting policy groups for a particular node on the server using the GUI.
2. Remove the Oracle Database SPI CODA or OVPA data sources using the below commands under instrumentation:
• On UNIX: /var/opt/OV/bin/instrumentation/dbspi_mwclup
Evolution Guide Page 44
• On Windows: %OvAgentDir%\bin\instrumentation\dbspimwi –cleanup
a. Restart CODA by running the following command:
ovc –restart coda
b. Verify if the datasources are removed by running the following command:
ovcodautil –showds
Note There should not be any datasources listed as DBSPI_ORA_REPORT, DBSPI_ORA_UDM, ORADB_*, ORAOSM_* or ORAUDM_*. Management Pack creates datasources only on CODA.
3. Remove the Oracle Database SPI Instrumentation.
The instrumentation files on the node prefixed with “dbspi”, “DBSPI”, “spi_db”, and “ora_” can be deleted.
• On UNIX: /var/opt/OV/bin/instrumentation
• On Windows: %OvAgentDir%\bin\instrumentation
Note Instrumentation removal may fail if any executable or script is running. Stop the corresponding process (es) and then delete the instrumentation files.
For more information on how to back up the data if you need the data for future use, see the SHR documentation.
4. Remove the Oracle Database SPI configuration files.
The dbspi configuration/history/log files are located under the <OvAgentDrive>\usr\OV\dbspi folder on Windows and /var/opt/OV/dbspi folder on UNIX. You can back up the contents of the directory for later reference. After you have taken a backup, this directory can be removed before deploying an MP.
For more information on cleaning up nodes, see Prepare nodes for deployment under the Recommended steps for moving from a SPI to MP section in this document.

Evolution Guide Page 45
Microsoft SQL Server SPI and Management Pack This section explains the evolution from the HPOM Smart Plug-in for Microsoft SQL Server 12.0x to HPE OMi Management Pack for Microsoft SQL Server 1.0.
SPI and MP comparison This section provides an overview of similarities and differences between HPOM Smart Plug-in for Microsoft SQL Server (Microsoft SQL Server SPI) and OMi MP for Microsoft SQL Server (Microsoft SQL Server MP). For more information about working with the Microsoft SQL Server MP, see the HPE OMi Management Pack for Microsoft SQL Server User Guide.
Features Microsoft SQL Server SPI 12.0x Microsoft SQL Server MP 1.00
Pre-requisites • HPOM W 8.16, HPOM W9, HPOM U/S/L 9 or higher
• HP Operations Agent 11.05 or higher
• BSM/MA 9.23 or higher • HP Operations Agent 11.12 or higher
Product Delivery The Microsoft SQL Server SPI is shipped with the SPI DVD.
The Microsoft SQL Server MP is shipped with the OMi 10 installer. The Microsoft SQL Server MP is also available to download from the e-media download center. See the section Useful resources in this document for the e-media download center link.
Installation Mount the ISO and use the OS specific installer: • HPUX: HP_Operations_Smart_Plug-
ins_HPUX.depot • Linux: HP_Operations_Smart_Plug-
ins_Linux_setup.bin • Solaris: HP_Operations_Smart_Plug-
ins_Solaris_setup.bin • Windows: setup.vbs
Can be installed in any of the following methods:
1. Use the OMi ConfigWizard to install OMi 10.x. Use this option when you want to install the MP during the OMi 10.x installation.
2. Install using the command line interface. Use this option when you want to install MP after OMI 10.x is installed. For more information about opr-mp-installer Command-Line Interface, see the OMi Administration Guide.
3. Download the MP bits from the e-media download center. Then mount ISO and use OS specific installer:
• Linux: mpinstall.sh-i • Windows: cscript mpinstall.vbs-i Use this option, when a higher MP version is available in the e-media download center.
Policy Grouping Policies are grouped into policy groups.
Management Templates and Aspects provide grouping of policy templates relevant to the area and criticality of monitoring.
Policy Versioning The Microsoft SQL Server SPI uses the <major version>.<minor version> (xxxx.yyyy) format for policy versioning. Example: If the version of the SPI is 12.03, policies updated in this release would be versioned as 12.0300. On the GUI, it is displayed as 12.300. When you update such a policy, minor version is updated. Example: When you update a policy with version 12.0300 (in GUI: 12.300), it will be changed to 12.0301 (in GUI 12.301).
The Microsoft SQL Server MP uses the xxxx.yyyy format for policy versioning. Example: In the Microsoft SQL Server MP 0001.0000 (In GUI 1.00), policies are versioned as 0001.0000. On the OMi GUI, it is displayed as 1.0. In subsequent MP releases, policy version will be updated only if a particular policy is updated in that release. When you update a policy, only minor versions (last two digits) are updated.
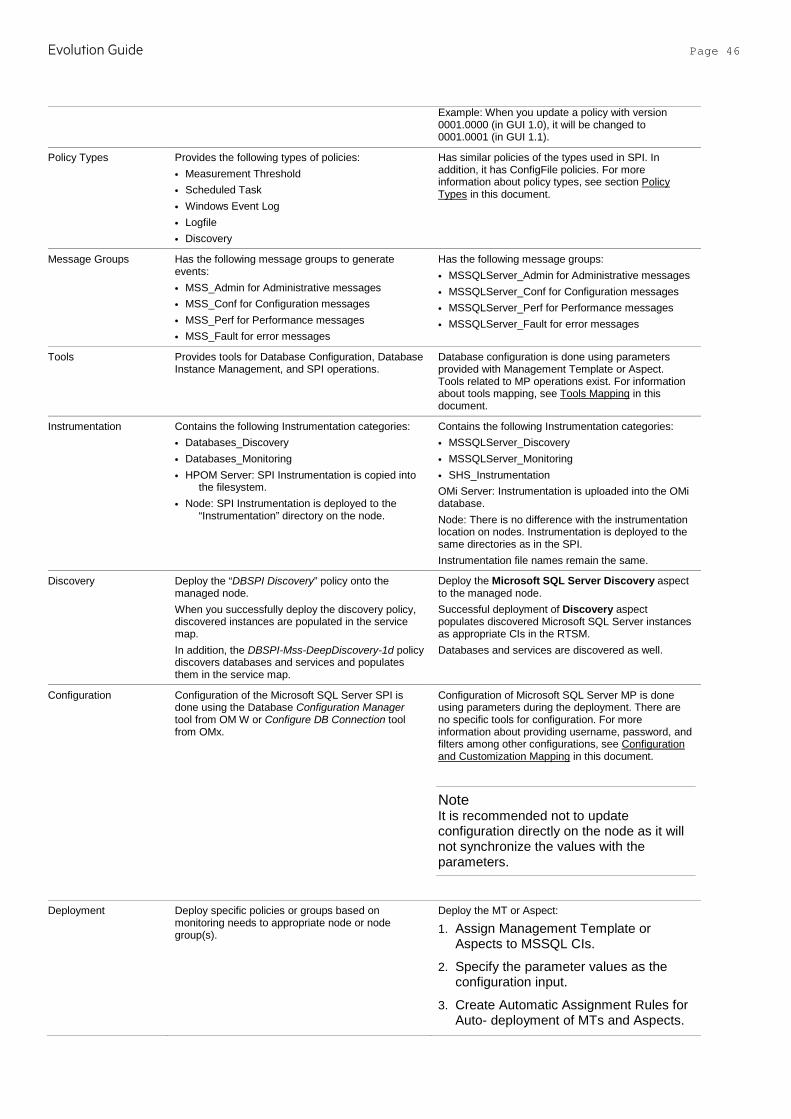
Evolution Guide Page 46
Example: When you update a policy with version 0001.0000 (in GUI 1.0), it will be changed to 0001.0001 (in GUI 1.1).
Policy Types Provides the following types of policies: • Measurement Threshold • Scheduled Task • Windows Event Log • Logfile • Discovery
Has similar policies of the types used in SPI. In addition, it has ConfigFile policies. For more information about policy types, see section Policy Types in this document.
Message Groups Has the following message groups to generate events: • MSS_Admin for Administrative messages • MSS_Conf for Configuration messages • MSS_Perf for Performance messages • MSS_Fault for error messages
Has the following message groups: • MSSQLServer_Admin for Administrative messages • MSSQLServer_Conf for Configuration messages • MSSQLServer_Perf for Performance messages • MSSQLServer_Fault for error messages
Tools Provides tools for Database Configuration, Database Instance Management, and SPI operations.
Database configuration is done using parameters provided with Management Template or Aspect. Tools related to MP operations exist. For information about tools mapping, see Tools Mapping in this document.
Instrumentation Contains the following Instrumentation categories: • Databases_Discovery • Databases_Monitoring • HPOM Server: SPI Instrumentation is copied into
the filesystem. • Node: SPI Instrumentation is deployed to the
“Instrumentation” directory on the node.
Contains the following Instrumentation categories: • MSSQLServer_Discovery • MSSQLServer_Monitoring • SHS_Instrumentation OMi Server: Instrumentation is uploaded into the OMi database. Node: There is no difference with the instrumentation location on nodes. Instrumentation is deployed to the same directories as in the SPI. Instrumentation file names remain the same.
Discovery Deploy the “DBSPI Discovery” policy onto the managed node. When you successfully deploy the discovery policy, discovered instances are populated in the service map. In addition, the DBSPI-Mss-DeepDiscovery-1d policy discovers databases and services and populates them in the service map.
Deploy the Microsoft SQL Server Discovery aspect to the managed node. Successful deployment of Discovery aspect populates discovered Microsoft SQL Server instances as appropriate CIs in the RTSM. Databases and services are discovered as well.
Configuration Configuration of the Microsoft SQL Server SPI is done using the Database Configuration Manager tool from OM W or Configure DB Connection tool from OMx.
Configuration of Microsoft SQL Server MP is done using parameters during the deployment. There are no specific tools for configuration. For more information about providing username, password, and filters among other configurations, see Configuration and Customization Mapping in this document.
Note It is recommended not to update configuration directly on the node as it will not synchronize the values with the parameters.
Deployment Deploy specific policies or groups based on monitoring needs to appropriate node or node group(s).
Deploy the MT or Aspect:
1. Assign Management Template or Aspects to MSSQL CIs.
2. Specify the parameter values as the configuration input.
3. Create Automatic Assignment Rules for Auto- deployment of MTs and Aspects.
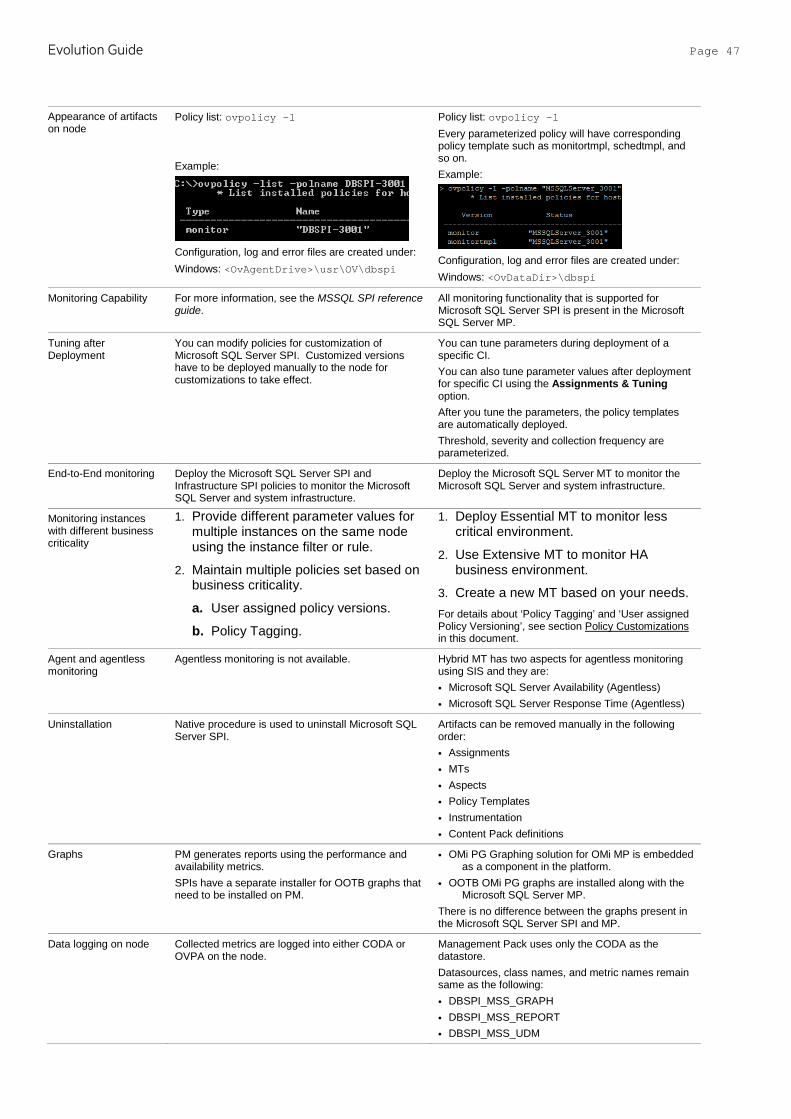
Evolution Guide Page 47
Appearance of artifacts on node
Policy list: ovpolicy –l Example:
Configuration, log and error files are created under: Windows: <OvAgentDrive>\usr\OV\dbspi
Policy list: ovpolicy –l Every parameterized policy will have corresponding policy template such as monitortmpl, schedtmpl, and so on. Example:
Configuration, log and error files are created under: Windows: <OvDataDir>\dbspi
Monitoring Capability For more information, see the MSSQL SPI reference guide.
All monitoring functionality that is supported for Microsoft SQL Server SPI is present in the Microsoft SQL Server MP.
Tuning after Deployment
You can modify policies for customization of Microsoft SQL Server SPI. Customized versions have to be deployed manually to the node for customizations to take effect.
You can tune parameters during deployment of a specific CI. You can also tune parameter values after deployment for specific CI using the Assignments & Tuning option. After you tune the parameters, the policy templates are automatically deployed. Threshold, severity and collection frequency are parameterized.
End-to-End monitoring Deploy the Microsoft SQL Server SPI and Infrastructure SPI policies to monitor the Microsoft SQL Server and system infrastructure.
Deploy the Microsoft SQL Server MT to monitor the Microsoft SQL Server and system infrastructure.
Monitoring instances with different business criticality
1. Provide different parameter values for multiple instances on the same node using the instance filter or rule.
2. Maintain multiple policies set based on business criticality.
a. User assigned policy versions.
b. Policy Tagging.
1. Deploy Essential MT to monitor less critical environment.
2. Use Extensive MT to monitor HA business environment.
3. Create a new MT based on your needs. For details about ‘Policy Tagging’ and ‘User assigned Policy Versioning’, see section Policy Customizations in this document.
Agent and agentless monitoring
Agentless monitoring is not available. Hybrid MT has two aspects for agentless monitoring using SIS and they are: • Microsoft SQL Server Availability (Agentless) • Microsoft SQL Server Response Time (Agentless)
Uninstallation Native procedure is used to uninstall Microsoft SQL Server SPI.
Artifacts can be removed manually in the following order: • Assignments • MTs • Aspects • Policy Templates • Instrumentation • Content Pack definitions
Graphs PM generates reports using the performance and availability metrics. SPIs have a separate installer for OOTB graphs that need to be installed on PM.
• OMi PG Graphing solution for OMi MP is embedded as a component in the platform.
• OOTB OMi PG graphs are installed along with the Microsoft SQL Server MP.
There is no difference between the graphs present in the Microsoft SQL Server SPI and MP.
Data logging on node Collected metrics are logged into either CODA or OVPA on the node.
Management Pack uses only the CODA as the datastore. Datasources, class names, and metric names remain same as the following: • DBSPI_MSS_GRAPH • DBSPI_MSS_REPORT • DBSPI_MSS_UDM

Evolution Guide Page 48
These data sources are automatically created.
Cluster Support You can configure the Failover using the apminfo.xml as described in the guide.
Microsoft SQL Server MP takes care of discovering cluster resource group and automatically configures cluster resource group appropriately in the apminfo.xml.
Remote Monitoring Remote Monitoring is not supported. Remote Monitoring is not supported. It is recommended to use SiteScope for remote monitoring.
Files and Folders on Node
The configuration, log and error files are created under <OvAgentDrive>\usr\OV\dbspi.
The files and folders are created under %ovdatadir%\dbspi.
Overriding Policy Thresholds
The override.cfg helps a database administrator or an operator to monitor a system without having to use the HPOM console and introduce new policy versions or groups.
OMi Parameterization and CI based monitoring helps to avoid new policy versioning and groups. For more information about customizing Management Packs, see Best Practices for Customizing Management Packs in this document.
Indicators (ETIs and HIs)
SPI events uses 27 indicators that are present in the MSSQL Content Pack.
MP has 39 indicators in addition to the following 12 new indicators: • MSSQL Database FileGroup Space Usage Level • MSSQL Database Mirroring Status • MSSQL Database Space Usage Level • MSSQL Database Status • MSSQL Database Transaction Log Usage Level • MSSQL Database Transaction State • MSSQL Server CPU Usage by SQL • MSSQL Server Replication Status • MSSQL Server SQL Query Performance • MSSQL Server Query Tuning • MSSQL Server Status • MSSQL Server Transaction Rate
TBECs There are 10 TBECs part of MSSQL Content Pack. The Microsoft SQL Server MP contains 5 TBECs and the following TBECs are removed: • Database::Computer:Memory Usage Level>>SQL
Server Performance His • Database::Computer:Node Status>>SQL Server
Status • Database::Computer:Ping Availability>>SQL Server
Status • Databse::Computer:SQL Server CPU Usage by
SQL>>CPU Load • Database::Interface:InterfaceUtilization>>SQL
Server Database Replication Status
Events Events are sent using the Measurement Threshold policy, Logfile policy and Opcmsg policy with appropriate message description.
Event text from the same set of policies remain the same. Event text carries new policy name part of it.
I18N & L10N Is I18N certified and is localized in Japanese. The Microsoft SQL Server MP is I18N certified and is localized in the following languages: • French • Simplified Chinese • Japanese • Korean • Deutsch • Spanish • Russian
OO Flows Integration with the HP OO flows was shipped part of the MS SQL content.
Same set of OO flows are shipped with the Microsoft SQL Server MP. However, OO flows are restricted to the ops-bridge usecase only. The OO flows work only in an environment where the HPOM and SPI are used for monitoring along with OMi and OO integration.

Evolution Guide Page 49
Common Policy Changes This section captures changes (such as parameterization) commonly made to Microsoft SQL Server SPI policies and describes how to convert them into Microsoft SQL Server MP policy templates.
Policy Naming Convention All Microsoft SQL Server SPI and MP Policy Templates use the following nomenclature:
• Microsoft SQL Server SPI policies name start with “DBSPI. For example, DBSPI-3001.
• Microsoft SQL Server MP policy templates name starts with “MSSQLServer”. For example, MSSQLServer _3001.
For more information about mapping between SPI policies and MP policy templates, see section SPI policy to MP policy template mapping in this document.
Policy Types Management Pack has same policy types as SPI. In addition, MP provides the policies of type Config File and they are used for:
a. MSSQLServer_Configuration - This policy acts as a container to hold MSSQL Server username, password, domain name, options to enable collection, and tracing. This information is included as a part of DBSPI configuration tools.
b. Non-Eventing Metrics (MSSQLServer_3240 to MSSQLServer_3244) – Is the list of policies marked with “*” in the section SPI policy to MP policy template mapping. These metrics are mentioned in the appropriate scheduler policies for collector to fetch and log the metric and there is no corresponding Measurement Threshold Policy.
In the Microsoft SQL Server MP, these policies are available for each reporting metrics. The standard MP schedulers use these policies to collect and log corresponding metrics based on the frequency parameter of each policy.
Each of these policies has parameter such as MSSQL Server Database Size Frequency. This parameter helps you choose the required frequency for metric collection. The collected metric data is stored in CODA under “DBSPI_MSS_REPORT”.
c. User defined Metric (MSSQLServer_UDM) - You can create metrics by providing appropriate SQL statement for metric collection using tools in HPOM U. You can also create a ConfigFile policy in HPOM W, but the same feature is available through ConfigFile policy. For more information about user defined metrics, see Microsoft SQL Server User Defined Metrics (UDM) in this document.
Measurement Threshold Policy Most MP Measurement Threshold policy templates contain the customized threshold and severity attributes. The Microsoft SQL Server MP has parameterized these policy attributes to simplify policy maintenance, policy versioning and instance specific parameters. These parameters can be changed during deployment or post-deployment. In HPOM Microsoft SQL Server SPI, you can create new instance filter rules for either each instance or a group of instances.
In OMi MP, the MT or Aspect deployment happens for each instance where the value can be adjusted without changing the policy versions.
Schedule Task Policy Microsoft SQL Server SPI has OOTB scheduled task policies which triggers the collector with a set of metrics at defined intervals. If you want to update a metric from 05 mins scheduler to 15 mins scheduler, edit the 05 mins scheduled task policy to remove the metric number from command and to update in the 15 mins scheduled task policy.
In Microsoft SQL Server MP, there is a frequency parameter for each metric regardless of whether they are for generating events or logging metrics. The frequency parameter can be adjusted to make the metric part of appropriate schedule intervals such as VeryHigh, High, Medium, Low and NORUN. The default polling intervals of VeryHigh, High, Medium and Low are 5 mins, 15 mins, 1 hour and 1 day respectively. If any metric is marked for NORUN, it will not be picked by any scheduler. This schedule adjust for metrics can be done for each instance.

Evolution Guide Page 50
For example, the metric Completed Jobs monitoring has a frequency parameter Completed Jobs Frequency which is part of the MSSQLServer_3277 policy with a default value of HIGH and this can be seen in the corresponding Aspect and Management Template. The Aspect or Management Template can be modified to change this parameter or the default value can be modified during deployment for the targeted CI.
There are four scheduled task policies for each of the four intervals. The time schedule for these policies is parameterized. Default polling intervals for the parameters VeryHigh, High, Medium and Low are 5 mins, 15 mins, 1 hour and 1 day respectively. You can modify the Frequency of VeryHigh Scheduler, Frequency of High Scheduler, Frequency of Medium Scheduler and Frequency of Low Scheduler parameters.
For example, the frequency of VeryHigh scheduler can be modified in the parameter Frequency of VeryHigh Scheduler from 5 mins to 10 mins. This is applicable for all instances running on the given node. All the metrics marked under VeryHigh category will be executed every 10 mins. The following table presents the method of modifying a schedule metric between the Oracle Database SPI and Oracle Database MP:
Metric Schedule Case SPI MP
Move a metric from 05mins to 15mins
1. Edit 05 mins schedule task policy to remove the metric.
2. Edit 15 mins schedule task policy to add the metrics
3. Redeploy both of the above schedule task policies.
If a metric assignment exists, click Assignments & Tuning and edit the frequency parameter for a specific metric. Modify the frequency parameter of a given metric change it from VeryHigh to High.
Note The same can be done by editing a metric’s frequency parameter in an aspect or MT.
Remove metric from scheduling
1. Edit a schedule task policy and remove the metric number.
2. Redeploy the modified scheduled task policy.
If a metric assignment exists, then click Assignments & Tuning and edit the frequency parameter of a given metric. Change the metric from original to NORUN.
Note The same can be done by editing a metric’s frequency parameter in an aspect or MT.
Modify the lowest schedule of collection from 05mins to 10mins
Either copy and create new schedule task policy with the schedule of 10 mins Or Edit the 05 mins schedule task policy, change the interval and rename it to 10 mins.
Modify the interval of scheduled task policy exposed as parameter either at the Aspect or MT level. In this case “Frequency of VeryHigh Scheduler”.
Discovery Policy The Microsoft SQL Server MP Discovery policy is a type of custom discovery policy which triggers discovery script to generate XML. The XML contains information about discovering Microsoft SQL Server Server as CI and its relationship with other Infra elements. The MP discovered information such as the CI type, attributes, and relations remain same as SPI.
Policy Customizations There are multiple options to customize the SPI policies for different reasons. You can create new policy groups and copy specific policies to those groups to create your own DB SPI groups. You can also modify the thresholds set in individual policies. In many cases, the policy’s defined threshold may involve a drill-down or roll-up metric. The widely used SPI policy customizations and corresponding MP approach are listed as following:

Evolution Guide Page 51
Policy Tagging
What is Policy Tagging in SPI?
If you have database instances categorized into different groups and they need to be monitored differently, then DBSPI provides an option "-t"(tag) which allows the collector to use different set of customized policies. Custom policy groupings can effectively differentiate one group of policies from another. In such cases, you can:
1. Create copies of the policies.
2. Use the Tag feature to rename the Measurement Threshold and Scheduled Task polices.
3. Assign them to the various groups. For example, you can create a SAP group of policies and tag those policies with “SAP-” or a PeopleSoft group, and tag those with “PS-.”
To use the Tag feature, make copies of the original DB SPI policies. The names you give to these new policies can contain a prefix, but they must also contain the original policy name.
For example, a copy of DBSPI-3216 can be called SAP-DBSPI-3216. Specify the tag option on the command line so that the Collector, Analyzer, or Script uses this new policy rather than the original policy. New scheduled task policies can also be created in this way:
For example: dbspicam -m 9 -t SAP-
How to achieve it in MP?
This can be achieved by using the OMi feature Management Templates. You can create different flavors of Management Template from copying the OOTB MTs. This newly created Management Templates can be customized to:
• Add or remove aspects
• Enable or disable metrics within an aspect
• Modify parameters based on the criticality of database for which MT intends to be deployed.
For more information about customizing management packs, see Best Practices for Customizing Management Packs chapter in this document.
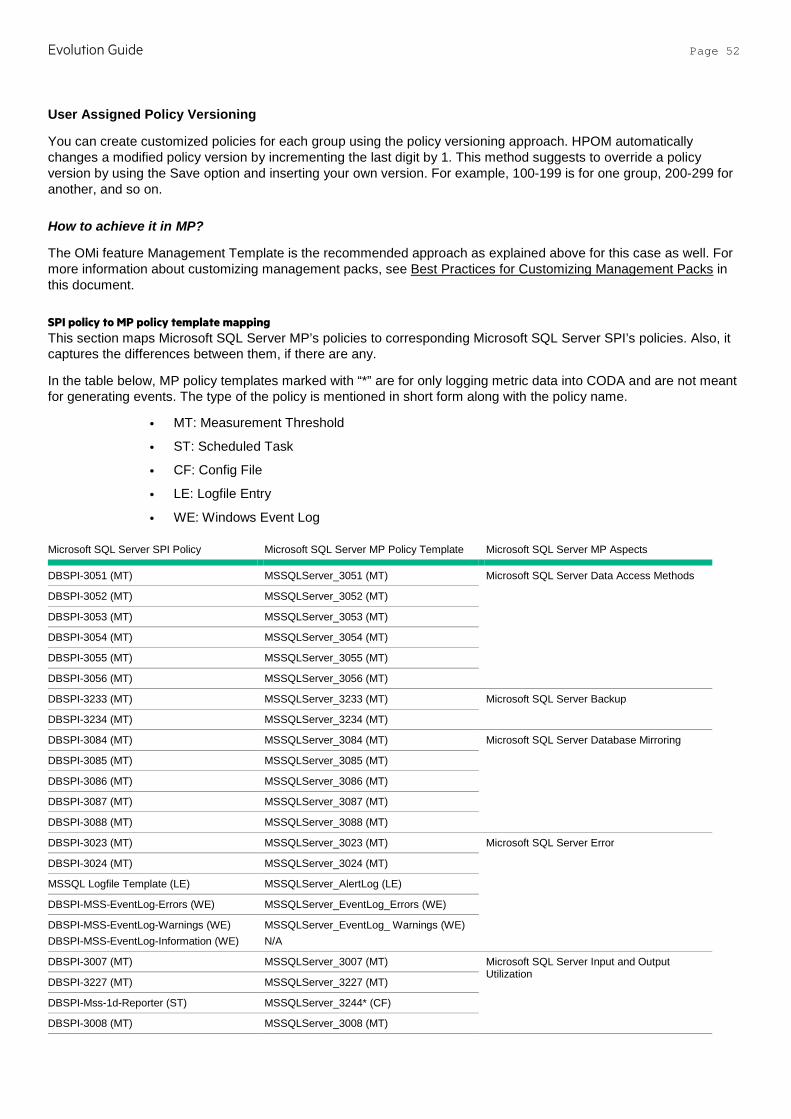
Evolution Guide Page 52
User Assigned Policy Versioning
You can create customized policies for each group using the policy versioning approach. HPOM automatically changes a modified policy version by incrementing the last digit by 1. This method suggests to override a policy version by using the Save option and inserting your own version. For example, 100-199 is for one group, 200-299 for another, and so on.
How to achieve it in MP?
The OMi feature Management Template is the recommended approach as explained above for this case as well. For more information about customizing management packs, see Best Practices for Customizing Management Packs in this document.
SPI policy to MP policy template mapping This section maps Microsoft SQL Server MP’s policies to corresponding Microsoft SQL Server SPI’s policies. Also, it captures the differences between them, if there are any.
In the table below, MP policy templates marked with “*” are for only logging metric data into CODA and are not meant for generating events. The type of the policy is mentioned in short form along with the policy name.
• MT: Measurement Threshold
• ST: Scheduled Task
• CF: Config File
• LE: Logfile Entry
• WE: Windows Event Log
Microsoft SQL Server SPI Policy Microsoft SQL Server MP Policy Template Microsoft SQL Server MP Aspects
DBSPI-3051 (MT) MSSQLServer_3051 (MT) Microsoft SQL Server Data Access Methods
DBSPI-3052 (MT) MSSQLServer_3052 (MT)
DBSPI-3053 (MT) MSSQLServer_3053 (MT)
DBSPI-3054 (MT) MSSQLServer_3054 (MT)
DBSPI-3055 (MT) MSSQLServer_3055 (MT)
DBSPI-3056 (MT) MSSQLServer_3056 (MT)
DBSPI-3233 (MT) MSSQLServer_3233 (MT) Microsoft SQL Server Backup
DBSPI-3234 (MT) MSSQLServer_3234 (MT)
DBSPI-3084 (MT) MSSQLServer_3084 (MT) Microsoft SQL Server Database Mirroring
DBSPI-3085 (MT) MSSQLServer_3085 (MT)
DBSPI-3086 (MT) MSSQLServer_3086 (MT)
DBSPI-3087 (MT) MSSQLServer_3087 (MT)
DBSPI-3088 (MT) MSSQLServer_3088 (MT)
DBSPI-3023 (MT) MSSQLServer_3023 (MT) Microsoft SQL Server Error
DBSPI-3024 (MT) MSSQLServer_3024 (MT)
MSSQL Logfile Template (LE) MSSQLServer_AlertLog (LE)
DBSPI-MSS-EventLog-Errors (WE) MSSQLServer_EventLog_Errors (WE)
DBSPI-MSS-EventLog-Warnings (WE) DBSPI-MSS-EventLog-Information (WE)
MSSQLServer_EventLog_ Warnings (WE) N/A
DBSPI-3007 (MT) MSSQLServer_3007 (MT) Microsoft SQL Server Input and Output Utilization
DBSPI-3227 (MT) MSSQLServer_3227 (MT)
DBSPI-Mss-1d-Reporter (ST) MSSQLServer_3244* (CF)
DBSPI-3008 (MT) MSSQLServer_3008 (MT)
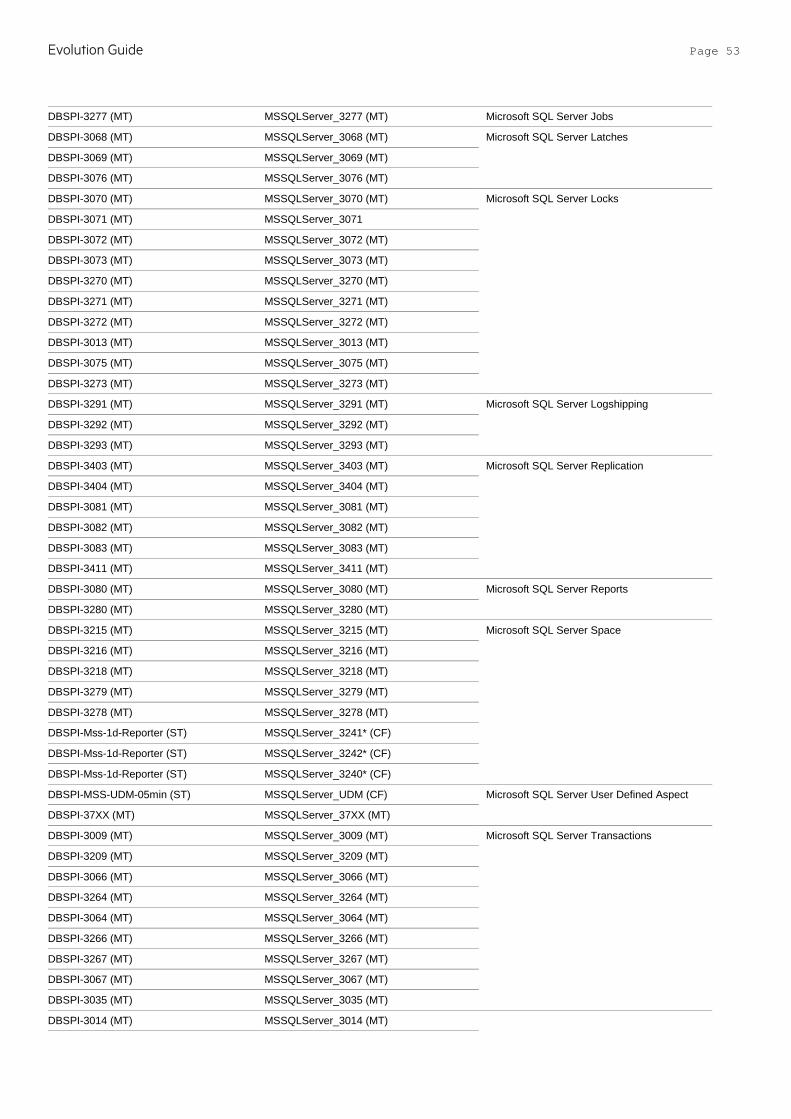
Evolution Guide Page 53
DBSPI-3277 (MT) MSSQLServer_3277 (MT) Microsoft SQL Server Jobs
DBSPI-3068 (MT) MSSQLServer_3068 (MT) Microsoft SQL Server Latches
DBSPI-3069 (MT) MSSQLServer_3069 (MT)
DBSPI-3076 (MT) MSSQLServer_3076 (MT)
DBSPI-3070 (MT) MSSQLServer_3070 (MT) Microsoft SQL Server Locks
DBSPI-3071 (MT) MSSQLServer_3071
DBSPI-3072 (MT) MSSQLServer_3072 (MT)
DBSPI-3073 (MT) MSSQLServer_3073 (MT)
DBSPI-3270 (MT) MSSQLServer_3270 (MT)
DBSPI-3271 (MT) MSSQLServer_3271 (MT)
DBSPI-3272 (MT) MSSQLServer_3272 (MT)
DBSPI-3013 (MT) MSSQLServer_3013 (MT)
DBSPI-3075 (MT) MSSQLServer_3075 (MT)
DBSPI-3273 (MT) MSSQLServer_3273 (MT)
DBSPI-3291 (MT) MSSQLServer_3291 (MT) Microsoft SQL Server Logshipping
DBSPI-3292 (MT) MSSQLServer_3292 (MT)
DBSPI-3293 (MT) MSSQLServer_3293 (MT)
DBSPI-3403 (MT) MSSQLServer_3403 (MT) Microsoft SQL Server Replication
DBSPI-3404 (MT) MSSQLServer_3404 (MT)
DBSPI-3081 (MT) MSSQLServer_3081 (MT)
DBSPI-3082 (MT) MSSQLServer_3082 (MT)
DBSPI-3083 (MT) MSSQLServer_3083 (MT)
DBSPI-3411 (MT) MSSQLServer_3411 (MT)
DBSPI-3080 (MT) MSSQLServer_3080 (MT) Microsoft SQL Server Reports
DBSPI-3280 (MT) MSSQLServer_3280 (MT)
DBSPI-3215 (MT) MSSQLServer_3215 (MT) Microsoft SQL Server Space
DBSPI-3216 (MT) MSSQLServer_3216 (MT)
DBSPI-3218 (MT) MSSQLServer_3218 (MT)
DBSPI-3279 (MT) MSSQLServer_3279 (MT)
DBSPI-3278 (MT) MSSQLServer_3278 (MT)
DBSPI-Mss-1d-Reporter (ST) MSSQLServer_3241* (CF)
DBSPI-Mss-1d-Reporter (ST) MSSQLServer_3242* (CF)
DBSPI-Mss-1d-Reporter (ST) MSSQLServer_3240* (CF)
DBSPI-MSS-UDM-05min (ST) MSSQLServer_UDM (CF) Microsoft SQL Server User Defined Aspect
DBSPI-37XX (MT) MSSQLServer_37XX (MT)
DBSPI-3009 (MT) MSSQLServer_3009 (MT) Microsoft SQL Server Transactions
DBSPI-3209 (MT) MSSQLServer_3209 (MT)
DBSPI-3066 (MT) MSSQLServer_3066 (MT)
DBSPI-3264 (MT) MSSQLServer_3264 (MT)
DBSPI-3064 (MT) MSSQLServer_3064 (MT)
DBSPI-3266 (MT) MSSQLServer_3266 (MT)
DBSPI-3267 (MT) MSSQLServer_3267 (MT)
DBSPI-3067 (MT) MSSQLServer_3067 (MT)
DBSPI-3035 (MT) MSSQLServer_3035 (MT)
DBSPI-3014 (MT) MSSQLServer_3014 (MT)

Evolution Guide Page 54
DBSPI-3017 (MT) MSSQLServer_3017 (MT) Microsoft SQL Server Processes and Statistics
DBSPI-3032 (MT) MSSQLServer_3032 (MT)
DBSPI-3025 (MT) MSSQLServer_3025 (MT)
DBSPI-3011 (MT) MSSQLServer_3011 (MT)
DBSPI-3026 (MT) MSSQLServer_3026 (MT)
DBSPI-3001 (MT) MSSQLServer_3001 (MT)
DBSPI-3074 (MT) MSSQLServer_3074 (MT)
DBSPI-3030 (MT) MSSQLServer_3030 (MT) Microsoft SQL Server Availability
DBSPI-3057 (MT) MSSQLServer_3057 (MT)
DBSPI-3058 (MT) MSSQLServer_3058 (MT)
DBSPI-Mss-05min-Reporter (ST) MSSQLServer_3243* (CF)
DBSPI-3028 (MT) MSSQLServer_3028 (MT)
DBSPI-3230 (MT) MSSQLServer_3230 (MT)
DBSPI-DeepDiscovery (ST) MSSQLServer_DeepDiscovery (ST) Microsoft SQL Server Discovery
DBSPI-Discovery (SVCDISC) MSSQLServer_Discovery (SVCDISC)
NA MSSQLServer_Availability (SiS) Microsoft SQL Server Availability (Agentless)
NA MSSQLServer_ResponseTime (SiS) Microsoft SQL Server Response Time (Agentless)
DBSPI-MSS-05Min (ST) DBSPI-MSS-05Min-Reporter (ST)
MSSQLServer_VeryHigh (ST) Microsoft SQL Server Base
DBSPI-MSS-15Min (ST) MSSQLServer_High (ST)
DBSPI-MSS-1h (ST) MSSQLServer_Medium (ST)
DBSPI-MSS-1d (ST) DBSPI-MSS-1d-Reporter (ST)
MSSQLServer_Low (ST)
DBSPI-Messages (OPCMSG) MSSQLServer_Messages (OPCMSG)
DBSPI-Measureware (ST) MSSQLServer_Logger (ST)
Configuration and Customization Mapping This section provides the mapping of SPI configuration done outside of policies and equivalent parameters in MP aspects. Use this mapping to reuse configuration and customization from SPI to MP.
Configuration and Customization Information in SPI Equivalent Aspect Parameter(s) More information
Use the Configure DB Connection tool on OMx or Database Configuration Manager tool on OMW to update the MSSQL Server instance information.
Specify the username and password as parameter values when deploying an aspect or MT.
Updating configuration on the node will not modify corresponding parameters in MP. It needs to be updated explicitly on the server.
Use the Configure DB Connection tool on OMX or Database Configuration Manager tool on OMW to update domain user information.
Specify the MSSQL Server Domain name as the parameter value.
Tracing can be turned On or Off using the Enable/Disable Trace tool.
MSSQL Server Instance Tracing parameter can be tuned during deployment.
This parameter enables or disables tracing for the Microsoft SQL Server MP Collection.
Start or Stop monitoring using the Start/Stop Monitoring tool.
MSSQL Server Instance Collection parameter can be tuned during deployment.
This parameter starts or stops monitoring of Microsoft SQL Server instances.
Threshold is defined in policy and can be customized by editing a policy.
Threshold parameter can be updated during deployment.
Severity is defined in policy and can be customized by editing policy.
Severity parameter can be updated while deploying an MT or Aspect.
Metric filter can be customized using Configure DB Connection on OMX or Database Configuration Manager on OMW tool.
Metric filter parameter can be tuned during while deploying an MT or Aspect.
Metric filter is part of the expert parameter.
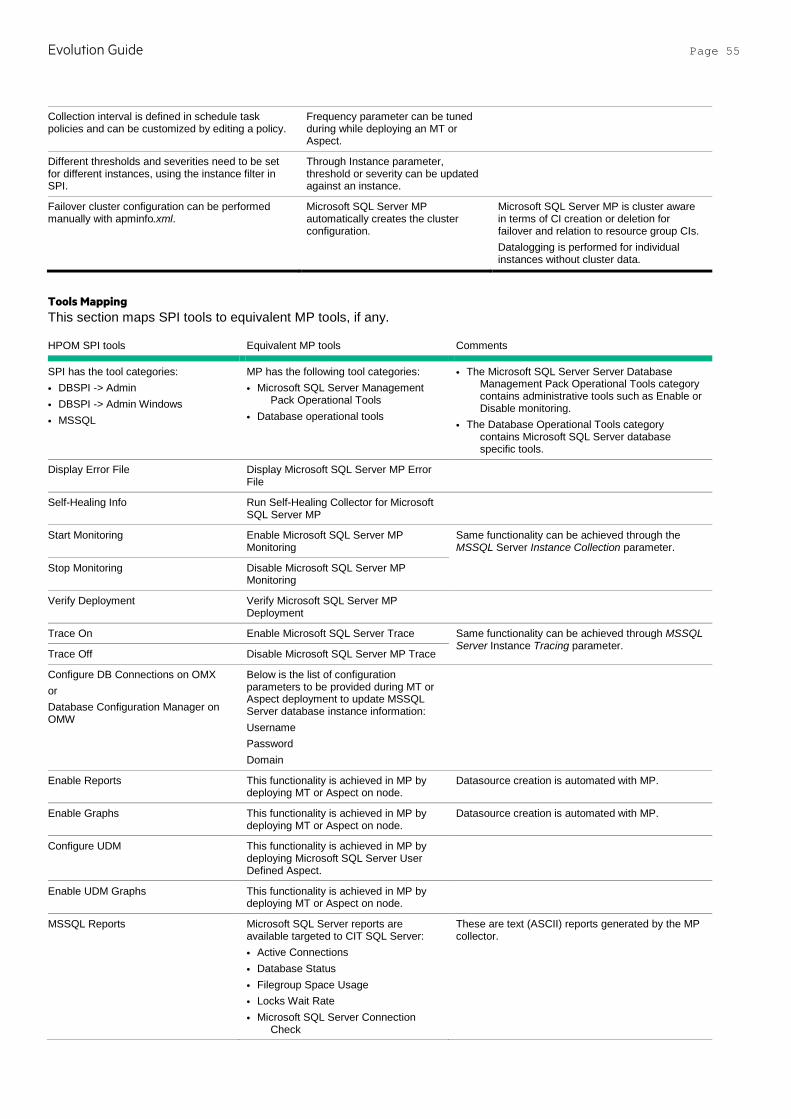
Evolution Guide Page 55
Collection interval is defined in schedule task policies and can be customized by editing a policy.
Frequency parameter can be tuned during while deploying an MT or Aspect.
Different thresholds and severities need to be set for different instances, using the instance filter in SPI.
Through Instance parameter, threshold or severity can be updated against an instance.
Failover cluster configuration can be performed manually with apminfo.xml.
Microsoft SQL Server MP automatically creates the cluster configuration.
Microsoft SQL Server MP is cluster aware in terms of CI creation or deletion for failover and relation to resource group CIs. Datalogging is performed for individual instances without cluster data.
Tools Mapping This section maps SPI tools to equivalent MP tools, if any.
HPOM SPI tools Equivalent MP tools Comments
SPI has the tool categories: • DBSPI -> Admin • DBSPI -> Admin Windows • MSSQL
MP has the following tool categories: • Microsoft SQL Server Management
Pack Operational Tools • Database operational tools
• The Microsoft SQL Server Server Database Management Pack Operational Tools category contains administrative tools such as Enable or Disable monitoring.
• The Database Operational Tools category contains Microsoft SQL Server database specific tools.
Display Error File Display Microsoft SQL Server MP Error File
Self-Healing Info Run Self-Healing Collector for Microsoft SQL Server MP
Start Monitoring Enable Microsoft SQL Server MP Monitoring
Same functionality can be achieved through the MSSQL Server Instance Collection parameter.
Stop Monitoring Disable Microsoft SQL Server MP Monitoring
Verify Deployment Verify Microsoft SQL Server MP Deployment
Trace On Enable Microsoft SQL Server Trace Same functionality can be achieved through MSSQL Server Instance Tracing parameter.
Trace Off Disable Microsoft SQL Server MP Trace
Configure DB Connections on OMX or Database Configuration Manager on OMW
Below is the list of configuration parameters to be provided during MT or Aspect deployment to update MSSQL Server database instance information: Username Password Domain
Enable Reports This functionality is achieved in MP by deploying MT or Aspect on node.
Datasource creation is automated with MP.
Enable Graphs This functionality is achieved in MP by deploying MT or Aspect on node.
Datasource creation is automated with MP.
Configure UDM This functionality is achieved in MP by deploying Microsoft SQL Server User Defined Aspect.
Enable UDM Graphs This functionality is achieved in MP by deploying MT or Aspect on node.
MSSQL Reports Microsoft SQL Server reports are available targeted to CIT SQL Server: • Active Connections • Database Status • Filegroup Space Usage • Locks Wait Rate • Microsoft SQL Server Connection
Check
These are text (ASCII) reports generated by the MP collector.
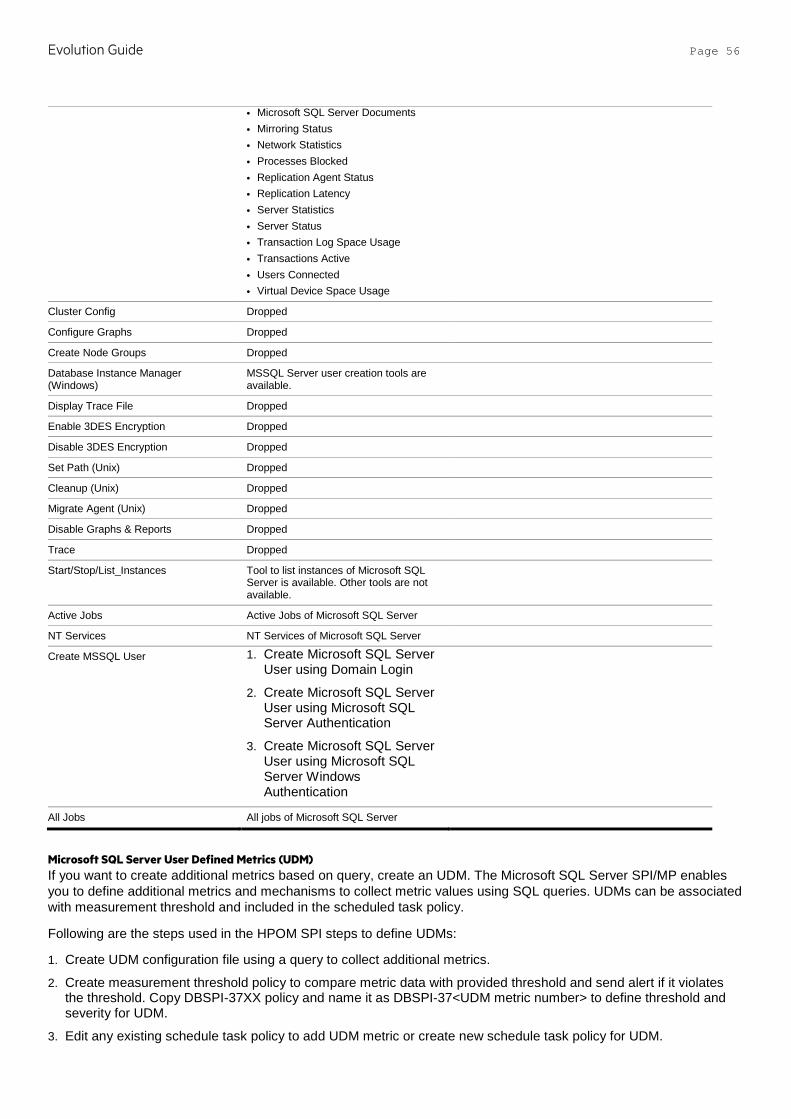
Evolution Guide Page 56
• Microsoft SQL Server Documents • Mirroring Status • Network Statistics • Processes Blocked • Replication Agent Status • Replication Latency • Server Statistics • Server Status • Transaction Log Space Usage • Transactions Active • Users Connected • Virtual Device Space Usage
Cluster Config Dropped
Configure Graphs Dropped
Create Node Groups Dropped
Database Instance Manager (Windows)
MSSQL Server user creation tools are available.
Display Trace File Dropped
Enable 3DES Encryption Dropped
Disable 3DES Encryption Dropped
Set Path (Unix) Dropped
Cleanup (Unix) Dropped
Migrate Agent (Unix) Dropped
Disable Graphs & Reports Dropped
Trace Dropped
Start/Stop/List_Instances Tool to list instances of Microsoft SQL Server is available. Other tools are not available.
Active Jobs Active Jobs of Microsoft SQL Server
NT Services NT Services of Microsoft SQL Server
Create MSSQL User 1. Create Microsoft SQL Server User using Domain Login
2. Create Microsoft SQL Server User using Microsoft SQL Server Authentication
3. Create Microsoft SQL Server User using Microsoft SQL Server Windows Authentication
All Jobs All jobs of Microsoft SQL Server
Microsoft SQL Server User Defined Metrics (UDM) If you want to create additional metrics based on query, create an UDM. The Microsoft SQL Server SPI/MP enables you to define additional metrics and mechanisms to collect metric values using SQL queries. UDMs can be associated with measurement threshold and included in the scheduled task policy.
Following are the steps used in the HPOM SPI steps to define UDMs:
1. Create UDM configuration file using a query to collect additional metrics.
2. Create measurement threshold policy to compare metric data with provided threshold and send alert if it violates the threshold. Copy DBSPI-37XX policy and name it as DBSPI-37<UDM metric number> to define threshold and severity for UDM.
3. Edit any existing schedule task policy to add UDM metric or create new schedule task policy for UDM.
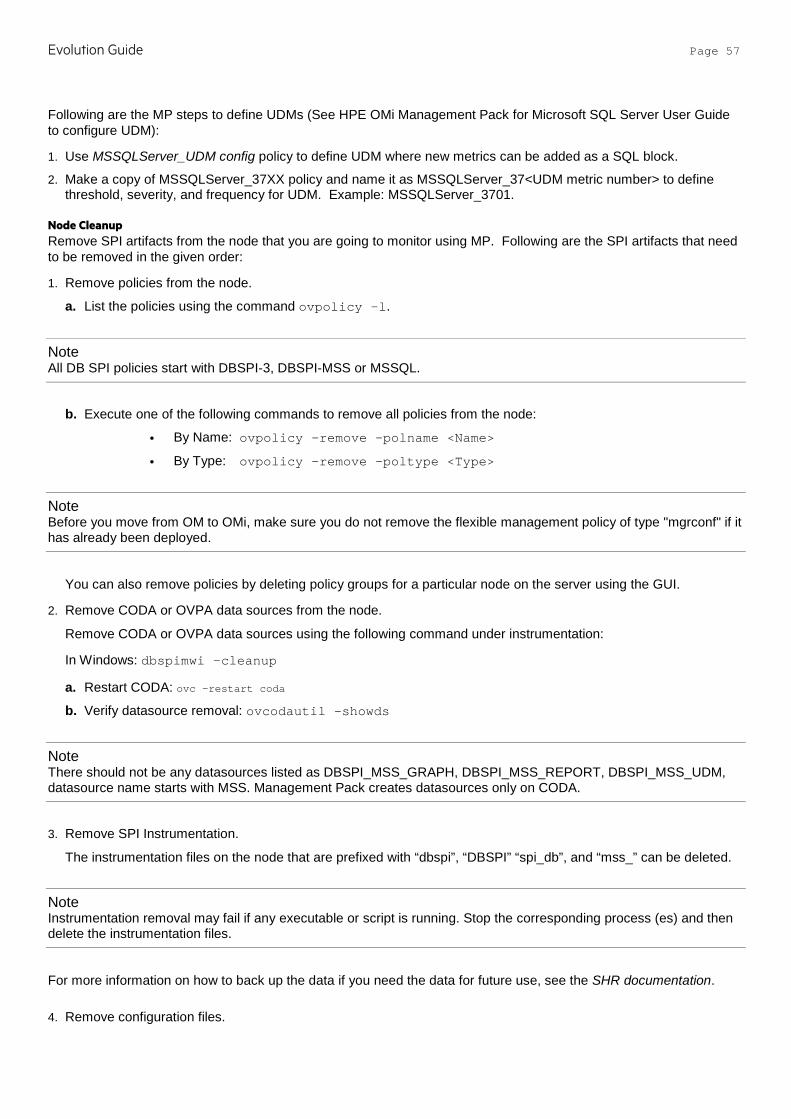
Evolution Guide Page 57
Following are the MP steps to define UDMs (See HPE OMi Management Pack for Microsoft SQL Server User Guide to configure UDM):
1. Use MSSQLServer_UDM config policy to define UDM where new metrics can be added as a SQL block.
2. Make a copy of MSSQLServer_37XX policy and name it as MSSQLServer_37<UDM metric number> to define threshold, severity, and frequency for UDM. Example: MSSQLServer_3701.
Node Cleanup Remove SPI artifacts from the node that you are going to monitor using MP. Following are the SPI artifacts that need to be removed in the given order:
1. Remove policies from the node.
a. List the policies using the command ovpolicy –l.
Note All DB SPI policies start with DBSPI-3, DBSPI-MSS or MSSQL.
b. Execute one of the following commands to remove all policies from the node:
• By Name: ovpolicy –remove –polname <Name>
• By Type: ovpolicy –remove –poltype <Type>
Note Before you move from OM to OMi, make sure you do not remove the flexible management policy of type "mgrconf" if it has already been deployed.
You can also remove policies by deleting policy groups for a particular node on the server using the GUI.
2. Remove CODA or OVPA data sources from the node.
Remove CODA or OVPA data sources using the following command under instrumentation:
In Windows: dbspimwi –cleanup
a. Restart CODA: ovc –restart coda
b. Verify datasource removal: ovcodautil –showds
Note There should not be any datasources listed as DBSPI_MSS_GRAPH, DBSPI_MSS_REPORT, DBSPI_MSS_UDM, datasource name starts with MSS. Management Pack creates datasources only on CODA.
3. Remove SPI Instrumentation.
The instrumentation files on the node that are prefixed with “dbspi”, “DBSPI” “spi_db”, and “mss_” can be deleted.
Note Instrumentation removal may fail if any executable or script is running. Stop the corresponding process (es) and then delete the instrumentation files.
For more information on how to back up the data if you need the data for future use, see the SHR documentation.
4. Remove configuration files.

Evolution Guide Page 58
The dbspi configuration, history or log files are located in the <OvAgentDrive>\usr\OV\dbspi folder. This directory needs to be removed after taking a backup.
For more information on cleaning up nodes, see Prepare nodes for deployment under the Recommended steps for moving from a SPI to MP section in this document.

Evolution Guide Page 59
Sybase SPI and Management Pack This section explains the evolution from the HPOM Smart Plug-in for Sybase 12.04x to the HPE OMi Management Pack for SAP Sybase ASE 1.0.
SPI and MP comparison This section provides an overview of differences between HPOM Smart Plug-in for Sybase (Sybase SPI) and OMi MP for SAP Sybase ASE (SAP Sybase ASE MP). For information about working with the SAP Sybase ASE MP, see the OMi Management Pack for SAP Sybase ASE User Guide.
Features Sybase SPI 12.04x SAP Sybase ASE MP 1.0
Pre-requisites • HPOM W 8.16, HPOM W9, HPOM U/S/L 9 or higher • HP Operations Agent 11.05 or higher
• BSM/MA 9.22 or higher • HP Operations Agent 11.12 or higher
Product Delivery
The Sybase SPI is shipped with the SPI DVD. The SAP Sybase ASE MP is shipped with OMi 10 installer. It is also available to download from the e-media download center. For more information about accessing the e-media download center link, see Useful resources in this document.
Installation Mount the ISO and use the OS specific installer: • HPUX: HP_Operations_Smart_Plug-ins_HPUX.depot • Linux: HP_Operations_Smart_Plug-ins_Linux_setup.bin • Solaris: HP_Operations_Smart_Plug-ins_Solaris_setup.bin • Windows: setup.vbs
The SAP Sybase ASE MP can be installed in one of the following methods:
1. Use the OMi ConfigWizard to install OMi 10.x. Use this option when you want to install the MP during the OMi 10.x installation.
2. Install using the command line interface. Use this option when you want to install MP after OMi 10.x is installed. For more information about opr-mp-installer Command-Line Interface, see the OMi Administration Guide.
3. Download the MP bits from the e-media download center. Then mount ISO and use OS specific installer:
• Linux: mpinstall.sh-i • Windows: cscript mpinstall.vbs-i Use this option when a greater MP version is available in the e-media download center.
Policy Grouping
Policies are grouped into policy groups:
Management Templates and Aspects provide grouping of policies relevant to the area and criticality of monitoring.
Policy Versioning
The Sybase SPI uses the <major version>.<minor version> (xxxx.yyyy) format for policy versioning. Example: If the version of the Sybase SPI is 12.03, policies updated in this release would be versioned as 12.0300. On the GUI, it is displayed as 12.300. When you update such a policy, minor version is updated.
The Sybase ASE MP uses the xxxx.yyyy format for policy versioning. Example: Server: 1.0 Node: 0001.0000
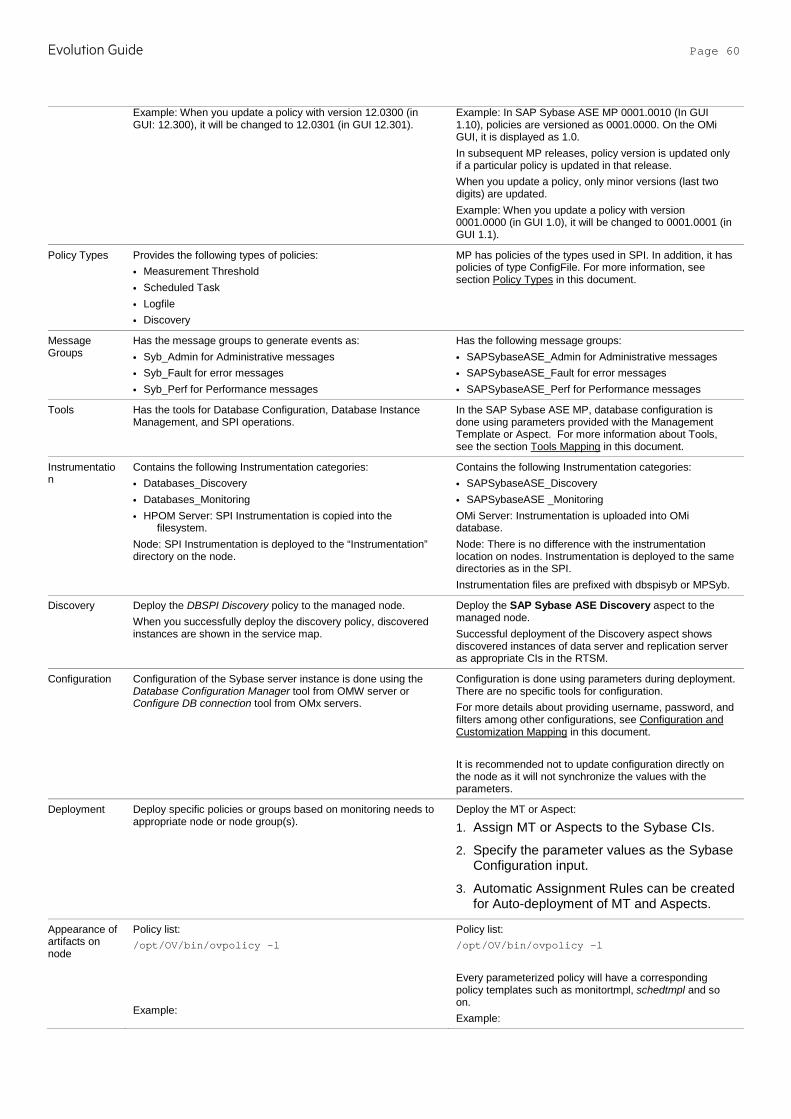
Evolution Guide Page 60
Example: When you update a policy with version 12.0300 (in GUI: 12.300), it will be changed to 12.0301 (in GUI 12.301).
Example: In SAP Sybase ASE MP 0001.0010 (In GUI 1.10), policies are versioned as 0001.0000. On the OMi GUI, it is displayed as 1.0. In subsequent MP releases, policy version is updated only if a particular policy is updated in that release. When you update a policy, only minor versions (last two digits) are updated. Example: When you update a policy with version 0001.0000 (in GUI 1.0), it will be changed to 0001.0001 (in GUI 1.1).
Policy Types Provides the following types of policies: • Measurement Threshold • Scheduled Task • Logfile • Discovery
MP has policies of the types used in SPI. In addition, it has policies of type ConfigFile. For more information, see section Policy Types in this document.
Message Groups
Has the message groups to generate events as: • Syb_Admin for Administrative messages • Syb_Fault for error messages • Syb_Perf for Performance messages
Has the following message groups: • SAPSybaseASE_Admin for Administrative messages • SAPSybaseASE_Fault for error messages • SAPSybaseASE_Perf for Performance messages
Tools Has the tools for Database Configuration, Database Instance Management, and SPI operations.
In the SAP Sybase ASE MP, database configuration is done using parameters provided with the Management Template or Aspect. For more information about Tools, see the section Tools Mapping in this document.
Instrumentation
Contains the following Instrumentation categories: • Databases_Discovery • Databases_Monitoring • HPOM Server: SPI Instrumentation is copied into the
filesystem. Node: SPI Instrumentation is deployed to the “Instrumentation” directory on the node.
Contains the following Instrumentation categories: • SAPSybaseASE_Discovery • SAPSybaseASE _Monitoring OMi Server: Instrumentation is uploaded into OMi database. Node: There is no difference with the instrumentation location on nodes. Instrumentation is deployed to the same directories as in the SPI. Instrumentation files are prefixed with dbspisyb or MPSyb.
Discovery Deploy the DBSPI Discovery policy to the managed node. When you successfully deploy the discovery policy, discovered instances are shown in the service map.
Deploy the SAP Sybase ASE Discovery aspect to the managed node. Successful deployment of the Discovery aspect shows discovered instances of data server and replication server as appropriate CIs in the RTSM.
Configuration Configuration of the Sybase server instance is done using the Database Configuration Manager tool from OMW server or Configure DB connection tool from OMx servers.
Configuration is done using parameters during deployment. There are no specific tools for configuration. For more details about providing username, password, and filters among other configurations, see Configuration and Customization Mapping in this document. It is recommended not to update configuration directly on the node as it will not synchronize the values with the parameters.
Deployment Deploy specific policies or groups based on monitoring needs to appropriate node or node group(s).
Deploy the MT or Aspect:
1. Assign MT or Aspects to the Sybase CIs.
2. Specify the parameter values as the Sybase Configuration input.
3. Automatic Assignment Rules can be created for Auto-deployment of MT and Aspects.
Appearance of artifacts on node
Policy list: /opt/OV/bin/ovpolicy –l
Example:
Policy list: /opt/OV/bin/ovpolicy –l
Every parameterized policy will have a corresponding policy templates such as monitortmpl, schedtmpl and so on. Example:

Evolution Guide Page 61
Configuration, Log, and Error files are created under: • UNIX: /var/opt/OV/dbspi • Windows: <OvAgentDrive>\usr\OV\dbspi
Configuration, Log, and Error files are created under: • UNIX Logs: /var/opt/OV/log/SAPSybaseASE Conf: /var/opt/OV/conf/SAPSybaseASE Temp: /var/opt/OV/tmp/SAPSybaseASE • Windows Logs: %OvDataDir%\log\SAPSybaseASE Conf: %OvDataDir%\conf\SAPSybaseASE Temp: %OvDataDir%\tmp\SAPSybaseASE
Monitoring capability
For more information on monitoring functionality, see the Sybase SPI reference guide.
All monitoring functionality that is supported for Sybase SPI is present in SAP Sybase ASE MP as well.
Tuning after Deployment
You can modify policies for customization. Customized versions have to be deployed manually to the node for customizations to take effect.
You can tune parameters during deployment for a specific CI. You can also tune parameter values after deployment for specific CI using the Assignments & Tuning option. After you tune the parameters, the policy templates are automatically deployed. Threshold, severity and collection frequency are parameterized.
End-to-End monitoring
Deploy Sybase SPI and Infrastructure SPI policies to monitor the Sybase Server and system infrastructure.
Deploy Sybase MT to monitor the SAP Sybase ASE server and system infrastructure.
Monitoring instances with different business criticality
Provide different parameter values for multiple instances on the same node using the instance filter or rule. Or Maintain multiple policies set based on business criticality for the following: • User assigned policy versions • Policy Tagging
Deploy essential MT to monitor less critical environment. Use extensive MT to monitor HA business environment. Create new MT as per needs. For details about ‘Policy Tagging’ and ‘User assigned Policy versioning’, see section Policy Customizations in this document.
Uninstallation Native procedure is used to uninstall Sybase SPI. Artifacts can be removed manually in the following order: • Assignments • MTs • Aspects • Policy Templates • Instrumentation • Remote ContentPack definitions
Graphs PM generates reports using the performance and availability metrics. SPIs have a separate installer for OOTB graphs that need to be installed on PM.
Graphing solution for OMi MP is provided by PMi, which is an embedded component in the platform. OOTB PMi graphs for an MP are installed along with MP. There is no difference between the graphs present in the Sybase SPI and MP.
Data logging on node
Collected metrics are logged into either CODA or OVPA on the node.
Collected metrics are logged into CODA. Datasource, class names, and metric names remain same as the following: • DBSPI_SYB_GRAPH • DBSPI_SYB_REPORT • DBSPI_SYB_UDM These data sources are automatically created.
Cluster Support
You can configure the Failover configuration using apminfo.xml as described in the SPI reference guide.
The same set of configuration is applicable for SAP Sybase ASE MP as well.
Remote Monitoring
Supports Remote Monitoring with a limited set of metrics. Remote Monitoring is not supported. It is recommended to use SiteScope for remote monitoring.
Overriding Policy Thresholds
The override.cfg helps a database administrator or operator to monitor a system without having to use the HPOM console and introduce new policy versions or groups.
OMi Parameterization and CI based monitoring helps to avoid new policy versioning and groups. For more information on customizing MPs, see Best Practices for Customizing Management Packs in this document.
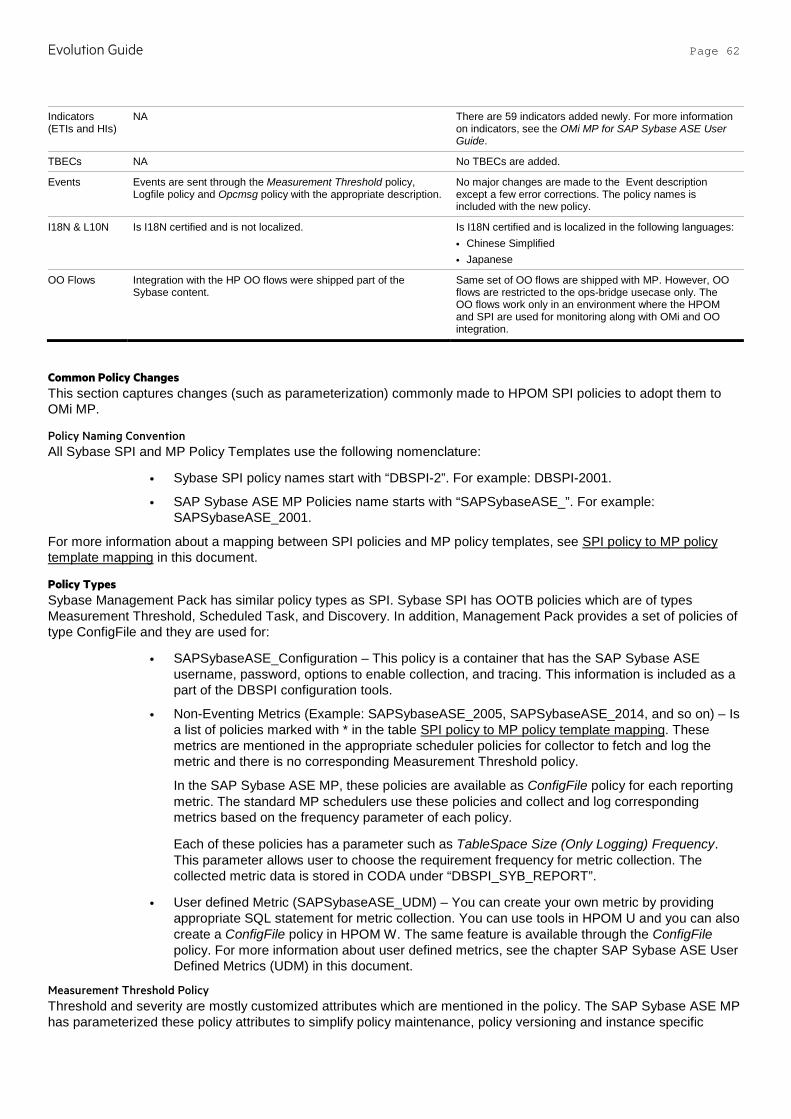
Evolution Guide Page 62
Indicators (ETIs and HIs)
NA There are 59 indicators added newly. For more information on indicators, see the OMi MP for SAP Sybase ASE User Guide.
TBECs NA No TBECs are added.
Events Events are sent through the Measurement Threshold policy, Logfile policy and Opcmsg policy with the appropriate description.
No major changes are made to the Event description except a few error corrections. The policy names is included with the new policy.
I18N & L10N Is I18N certified and is not localized. Is I18N certified and is localized in the following languages: • Chinese Simplified • Japanese
OO Flows Integration with the HP OO flows were shipped part of the Sybase content.
Same set of OO flows are shipped with MP. However, OO flows are restricted to the ops-bridge usecase only. The OO flows work only in an environment where the HPOM and SPI are used for monitoring along with OMi and OO integration.
Common Policy Changes This section captures changes (such as parameterization) commonly made to HPOM SPI policies to adopt them to OMi MP.
Policy Naming Convention All Sybase SPI and MP Policy Templates use the following nomenclature:
• Sybase SPI policy names start with “DBSPI-2”. For example: DBSPI-2001.
• SAP Sybase ASE MP Policies name starts with “SAPSybaseASE_”. For example: SAPSybaseASE_2001.
For more information about a mapping between SPI policies and MP policy templates, see SPI policy to MP policy template mapping in this document.
Policy Types Sybase Management Pack has similar policy types as SPI. Sybase SPI has OOTB policies which are of types Measurement Threshold, Scheduled Task, and Discovery. In addition, Management Pack provides a set of policies of type ConfigFile and they are used for:
• SAPSybaseASE_Configuration – This policy is a container that has the SAP Sybase ASE username, password, options to enable collection, and tracing. This information is included as a part of the DBSPI configuration tools.
• Non-Eventing Metrics (Example: SAPSybaseASE_2005, SAPSybaseASE_2014, and so on) – Is a list of policies marked with * in the table SPI policy to MP policy template mapping. These metrics are mentioned in the appropriate scheduler policies for collector to fetch and log the metric and there is no corresponding Measurement Threshold policy.
In the SAP Sybase ASE MP, these policies are available as ConfigFile policy for each reporting metric. The standard MP schedulers use these policies and collect and log corresponding metrics based on the frequency parameter of each policy.
Each of these policies has a parameter such as TableSpace Size (Only Logging) Frequency. This parameter allows user to choose the requirement frequency for metric collection. The collected metric data is stored in CODA under “DBSPI_SYB_REPORT”.
• User defined Metric (SAPSybaseASE_UDM) – You can create your own metric by providing appropriate SQL statement for metric collection. You can use tools in HPOM U and you can also create a ConfigFile policy in HPOM W. The same feature is available through the ConfigFile policy. For more information about user defined metrics, see the chapter SAP Sybase ASE User Defined Metrics (UDM) in this document.
Measurement Threshold Policy Threshold and severity are mostly customized attributes which are mentioned in the policy. The SAP Sybase ASE MP has parameterized these policy attributes to simplify policy maintenance, policy versioning and instance specific
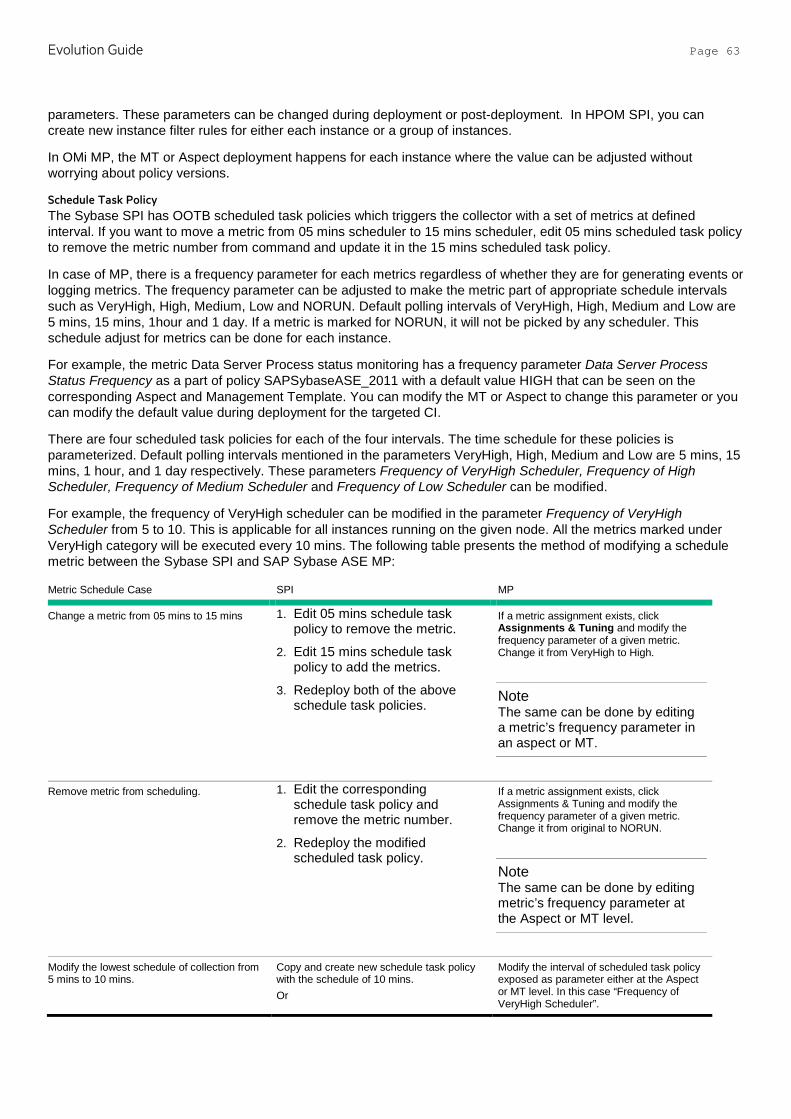
Evolution Guide Page 63
parameters. These parameters can be changed during deployment or post-deployment. In HPOM SPI, you can create new instance filter rules for either each instance or a group of instances.
In OMi MP, the MT or Aspect deployment happens for each instance where the value can be adjusted without worrying about policy versions.
Schedule Task Policy The Sybase SPI has OOTB scheduled task policies which triggers the collector with a set of metrics at defined interval. If you want to move a metric from 05 mins scheduler to 15 mins scheduler, edit 05 mins scheduled task policy to remove the metric number from command and update it in the 15 mins scheduled task policy.
In case of MP, there is a frequency parameter for each metrics regardless of whether they are for generating events or logging metrics. The frequency parameter can be adjusted to make the metric part of appropriate schedule intervals such as VeryHigh, High, Medium, Low and NORUN. Default polling intervals of VeryHigh, High, Medium and Low are 5 mins, 15 mins, 1hour and 1 day. If a metric is marked for NORUN, it will not be picked by any scheduler. This schedule adjust for metrics can be done for each instance.
For example, the metric Data Server Process status monitoring has a frequency parameter Data Server Process Status Frequency as a part of policy SAPSybaseASE_2011 with a default value HIGH that can be seen on the corresponding Aspect and Management Template. You can modify the MT or Aspect to change this parameter or you can modify the default value during deployment for the targeted CI.
There are four scheduled task policies for each of the four intervals. The time schedule for these policies is parameterized. Default polling intervals mentioned in the parameters VeryHigh, High, Medium and Low are 5 mins, 15 mins, 1 hour, and 1 day respectively. These parameters Frequency of VeryHigh Scheduler, Frequency of High Scheduler, Frequency of Medium Scheduler and Frequency of Low Scheduler can be modified.
For example, the frequency of VeryHigh scheduler can be modified in the parameter Frequency of VeryHigh Scheduler from 5 to 10. This is applicable for all instances running on the given node. All the metrics marked under VeryHigh category will be executed every 10 mins. The following table presents the method of modifying a schedule metric between the Sybase SPI and SAP Sybase ASE MP:
Metric Schedule Case SPI MP
Change a metric from 05 mins to 15 mins 1. Edit 05 mins schedule task policy to remove the metric.
2. Edit 15 mins schedule task policy to add the metrics.
3. Redeploy both of the above schedule task policies.
If a metric assignment exists, click Assignments & Tuning and modify the frequency parameter of a given metric. Change it from VeryHigh to High.
Note The same can be done by editing a metric’s frequency parameter in an aspect or MT.
Remove metric from scheduling. 1. Edit the corresponding schedule task policy and remove the metric number.
2. Redeploy the modified scheduled task policy.
If a metric assignment exists, click Assignments & Tuning and modify the frequency parameter of a given metric. Change it from original to NORUN.
Note The same can be done by editing metric’s frequency parameter at the Aspect or MT level.
Modify the lowest schedule of collection from 5 mins to 10 mins.
Copy and create new schedule task policy with the schedule of 10 mins. Or
Modify the interval of scheduled task policy exposed as parameter either at the Aspect or MT level. In this case “Frequency of VeryHigh Scheduler”.
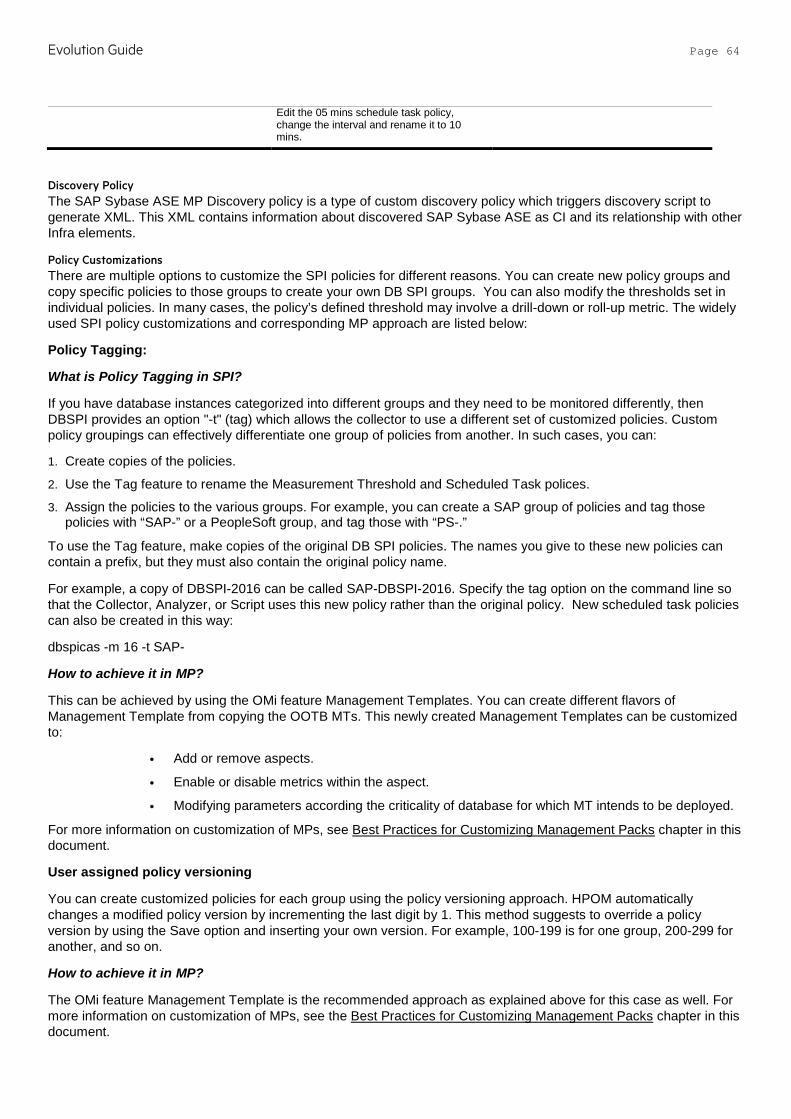
Evolution Guide Page 64
Edit the 05 mins schedule task policy, change the interval and rename it to 10 mins.
Discovery Policy The SAP Sybase ASE MP Discovery policy is a type of custom discovery policy which triggers discovery script to generate XML. This XML contains information about discovered SAP Sybase ASE as CI and its relationship with other Infra elements.
Policy Customizations There are multiple options to customize the SPI policies for different reasons. You can create new policy groups and copy specific policies to those groups to create your own DB SPI groups. You can also modify the thresholds set in individual policies. In many cases, the policy’s defined threshold may involve a drill-down or roll-up metric. The widely used SPI policy customizations and corresponding MP approach are listed below:
Policy Tagging:
What is Policy Tagging in SPI?
If you have database instances categorized into different groups and they need to be monitored differently, then DBSPI provides an option "-t" (tag) which allows the collector to use a different set of customized policies. Custom policy groupings can effectively differentiate one group of policies from another. In such cases, you can:
1. Create copies of the policies.
2. Use the Tag feature to rename the Measurement Threshold and Scheduled Task polices.
3. Assign the policies to the various groups. For example, you can create a SAP group of policies and tag those policies with “SAP-” or a PeopleSoft group, and tag those with “PS-.”
To use the Tag feature, make copies of the original DB SPI policies. The names you give to these new policies can contain a prefix, but they must also contain the original policy name.
For example, a copy of DBSPI-2016 can be called SAP-DBSPI-2016. Specify the tag option on the command line so that the Collector, Analyzer, or Script uses this new policy rather than the original policy. New scheduled task policies can also be created in this way:
dbspicas -m 16 -t SAP-
How to achieve it in MP?
This can be achieved by using the OMi feature Management Templates. You can create different flavors of Management Template from copying the OOTB MTs. This newly created Management Templates can be customized to:
• Add or remove aspects.
• Enable or disable metrics within the aspect.
• Modifying parameters according the criticality of database for which MT intends to be deployed.
For more information on customization of MPs, see Best Practices for Customizing Management Packs chapter in this document.
User assigned policy versioning
You can create customized policies for each group using the policy versioning approach. HPOM automatically changes a modified policy version by incrementing the last digit by 1. This method suggests to override a policy version by using the Save option and inserting your own version. For example, 100-199 is for one group, 200-299 for another, and so on.
How to achieve it in MP?
The OMi feature Management Template is the recommended approach as explained above for this case as well. For more information on customization of MPs, see the Best Practices for Customizing Management Packs chapter in this document.
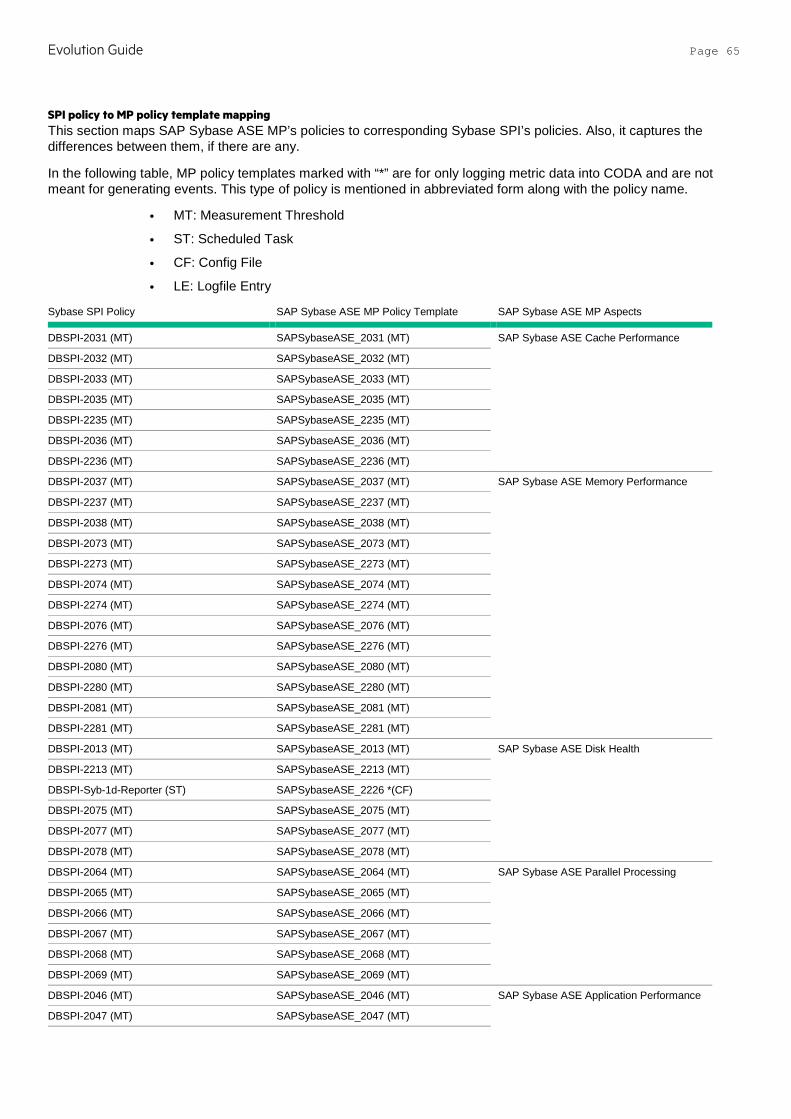
Evolution Guide Page 65
SPI policy to MP policy template mapping This section maps SAP Sybase ASE MP’s policies to corresponding Sybase SPI’s policies. Also, it captures the differences between them, if there are any.
In the following table, MP policy templates marked with “*” are for only logging metric data into CODA and are not meant for generating events. This type of policy is mentioned in abbreviated form along with the policy name.
• MT: Measurement Threshold
• ST: Scheduled Task
• CF: Config File
• LE: Logfile Entry
Sybase SPI Policy SAP Sybase ASE MP Policy Template SAP Sybase ASE MP Aspects
DBSPI-2031 (MT) SAPSybaseASE_2031 (MT) SAP Sybase ASE Cache Performance
DBSPI-2032 (MT) SAPSybaseASE_2032 (MT)
DBSPI-2033 (MT) SAPSybaseASE_2033 (MT)
DBSPI-2035 (MT) SAPSybaseASE_2035 (MT)
DBSPI-2235 (MT) SAPSybaseASE_2235 (MT)
DBSPI-2036 (MT) SAPSybaseASE_2036 (MT)
DBSPI-2236 (MT) SAPSybaseASE_2236 (MT)
DBSPI-2037 (MT) SAPSybaseASE_2037 (MT) SAP Sybase ASE Memory Performance
DBSPI-2237 (MT) SAPSybaseASE_2237 (MT)
DBSPI-2038 (MT) SAPSybaseASE_2038 (MT)
DBSPI-2073 (MT) SAPSybaseASE_2073 (MT)
DBSPI-2273 (MT) SAPSybaseASE_2273 (MT)
DBSPI-2074 (MT) SAPSybaseASE_2074 (MT)
DBSPI-2274 (MT) SAPSybaseASE_2274 (MT)
DBSPI-2076 (MT) SAPSybaseASE_2076 (MT)
DBSPI-2276 (MT) SAPSybaseASE_2276 (MT)
DBSPI-2080 (MT) SAPSybaseASE_2080 (MT)
DBSPI-2280 (MT) SAPSybaseASE_2280 (MT)
DBSPI-2081 (MT) SAPSybaseASE_2081 (MT)
DBSPI-2281 (MT) SAPSybaseASE_2281 (MT)
DBSPI-2013 (MT) SAPSybaseASE_2013 (MT) SAP Sybase ASE Disk Health
DBSPI-2213 (MT) SAPSybaseASE_2213 (MT)
DBSPI-Syb-1d-Reporter (ST) SAPSybaseASE_2226 *(CF)
DBSPI-2075 (MT) SAPSybaseASE_2075 (MT)
DBSPI-2077 (MT) SAPSybaseASE_2077 (MT)
DBSPI-2078 (MT) SAPSybaseASE_2078 (MT)
DBSPI-2064 (MT) SAPSybaseASE_2064 (MT) SAP Sybase ASE Parallel Processing
DBSPI-2065 (MT) SAPSybaseASE_2065 (MT)
DBSPI-2066 (MT) SAPSybaseASE_2066 (MT)
DBSPI-2067 (MT) SAPSybaseASE_2067 (MT)
DBSPI-2068 (MT) SAPSybaseASE_2068 (MT)
DBSPI-2069 (MT) SAPSybaseASE_2069 (MT)
DBSPI-2046 (MT) SAPSybaseASE_2046 (MT) SAP Sybase ASE Application Performance
DBSPI-2047 (MT) SAPSybaseASE_2047 (MT)
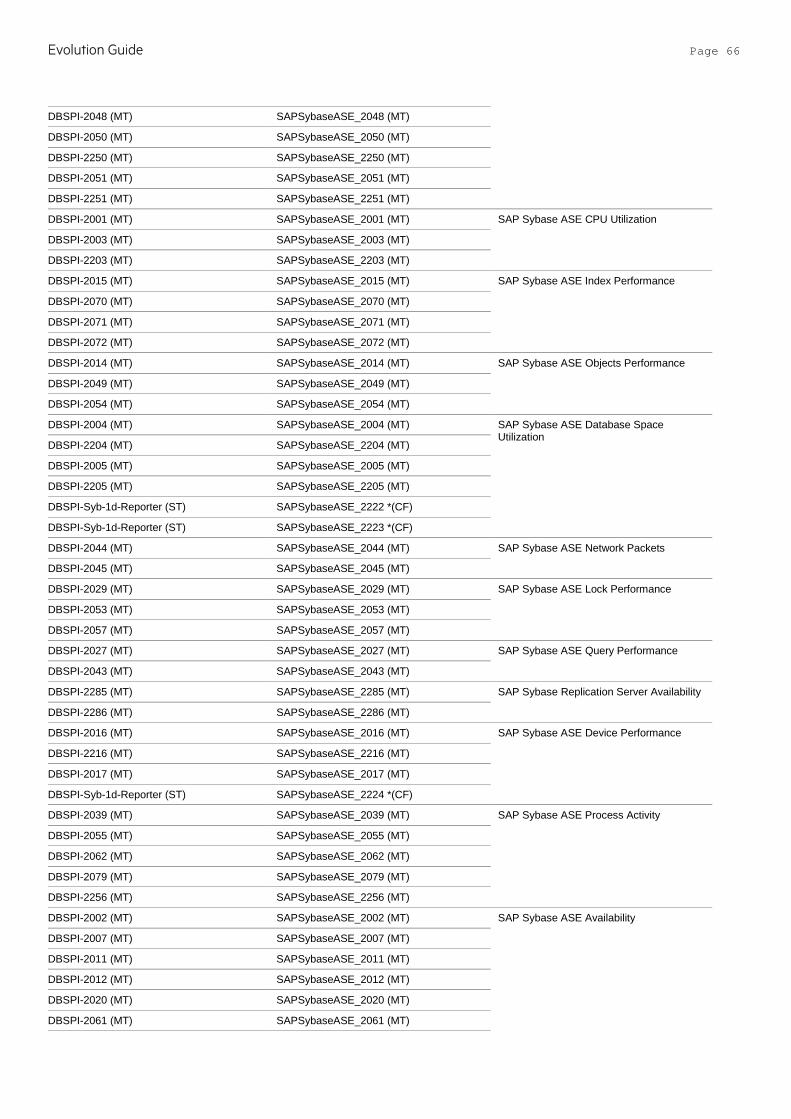
Evolution Guide Page 66
DBSPI-2048 (MT) SAPSybaseASE_2048 (MT)
DBSPI-2050 (MT) SAPSybaseASE_2050 (MT)
DBSPI-2250 (MT) SAPSybaseASE_2250 (MT)
DBSPI-2051 (MT) SAPSybaseASE_2051 (MT)
DBSPI-2251 (MT) SAPSybaseASE_2251 (MT)
DBSPI-2001 (MT) SAPSybaseASE_2001 (MT) SAP Sybase ASE CPU Utilization
DBSPI-2003 (MT) SAPSybaseASE_2003 (MT)
DBSPI-2203 (MT) SAPSybaseASE_2203 (MT)
DBSPI-2015 (MT) SAPSybaseASE_2015 (MT) SAP Sybase ASE Index Performance
DBSPI-2070 (MT) SAPSybaseASE_2070 (MT)
DBSPI-2071 (MT) SAPSybaseASE_2071 (MT)
DBSPI-2072 (MT) SAPSybaseASE_2072 (MT)
DBSPI-2014 (MT) SAPSybaseASE_2014 (MT) SAP Sybase ASE Objects Performance
DBSPI-2049 (MT) SAPSybaseASE_2049 (MT)
DBSPI-2054 (MT) SAPSybaseASE_2054 (MT)
DBSPI-2004 (MT) SAPSybaseASE_2004 (MT) SAP Sybase ASE Database Space Utilization
DBSPI-2204 (MT) SAPSybaseASE_2204 (MT)
DBSPI-2005 (MT) SAPSybaseASE_2005 (MT)
DBSPI-2205 (MT) SAPSybaseASE_2205 (MT)
DBSPI-Syb-1d-Reporter (ST) SAPSybaseASE_2222 *(CF)
DBSPI-Syb-1d-Reporter (ST) SAPSybaseASE_2223 *(CF)
DBSPI-2044 (MT) SAPSybaseASE_2044 (MT) SAP Sybase ASE Network Packets
DBSPI-2045 (MT) SAPSybaseASE_2045 (MT)
DBSPI-2029 (MT) SAPSybaseASE_2029 (MT) SAP Sybase ASE Lock Performance
DBSPI-2053 (MT) SAPSybaseASE_2053 (MT)
DBSPI-2057 (MT) SAPSybaseASE_2057 (MT)
DBSPI-2027 (MT) SAPSybaseASE_2027 (MT) SAP Sybase ASE Query Performance
DBSPI-2043 (MT) SAPSybaseASE_2043 (MT)
DBSPI-2285 (MT) SAPSybaseASE_2285 (MT) SAP Sybase Replication Server Availability
DBSPI-2286 (MT) SAPSybaseASE_2286 (MT)
DBSPI-2016 (MT) SAPSybaseASE_2016 (MT) SAP Sybase ASE Device Performance
DBSPI-2216 (MT) SAPSybaseASE_2216 (MT)
DBSPI-2017 (MT) SAPSybaseASE_2017 (MT)
DBSPI-Syb-1d-Reporter (ST) SAPSybaseASE_2224 *(CF)
DBSPI-2039 (MT) SAPSybaseASE_2039 (MT) SAP Sybase ASE Process Activity
DBSPI-2055 (MT) SAPSybaseASE_2055 (MT)
DBSPI-2062 (MT) SAPSybaseASE_2062 (MT)
DBSPI-2079 (MT) SAPSybaseASE_2079 (MT)
DBSPI-2256 (MT) SAPSybaseASE_2256 (MT)
DBSPI-2002 (MT) SAPSybaseASE_2002 (MT) SAP Sybase ASE Availability
DBSPI-2007 (MT) SAPSybaseASE_2007 (MT)
DBSPI-2011 (MT) SAPSybaseASE_2011 (MT)
DBSPI-2012 (MT) SAPSybaseASE_2012 (MT)
DBSPI-2020 (MT) SAPSybaseASE_2020 (MT)
DBSPI-2061 (MT) SAPSybaseASE_2061 (MT)
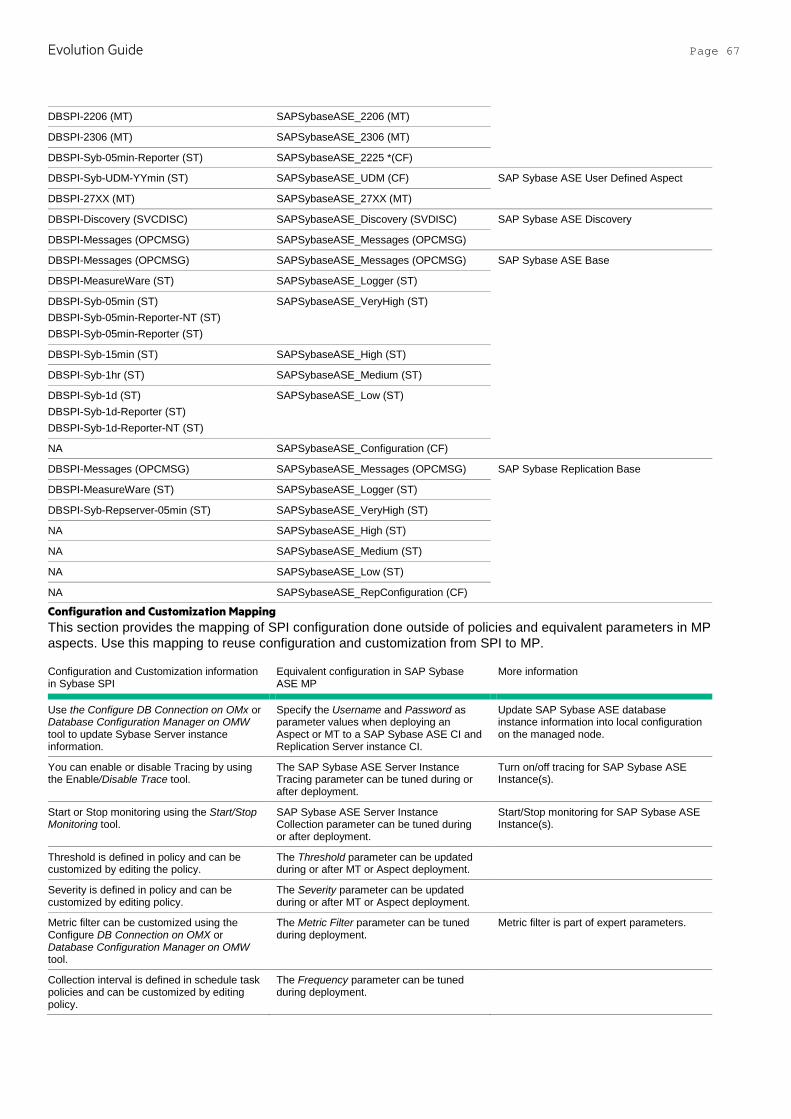
Evolution Guide Page 67
DBSPI-2206 (MT) SAPSybaseASE_2206 (MT)
DBSPI-2306 (MT) SAPSybaseASE_2306 (MT)
DBSPI-Syb-05min-Reporter (ST) SAPSybaseASE_2225 *(CF)
DBSPI-Syb-UDM-YYmin (ST) SAPSybaseASE_UDM (CF) SAP Sybase ASE User Defined Aspect
DBSPI-27XX (MT) SAPSybaseASE_27XX (MT)
DBSPI-Discovery (SVCDISC) SAPSybaseASE_Discovery (SVDISC) SAP Sybase ASE Discovery
DBSPI-Messages (OPCMSG) SAPSybaseASE_Messages (OPCMSG)
DBSPI-Messages (OPCMSG) SAPSybaseASE_Messages (OPCMSG) SAP Sybase ASE Base
DBSPI-MeasureWare (ST) SAPSybaseASE_Logger (ST)
DBSPI-Syb-05min (ST) DBSPI-Syb-05min-Reporter-NT (ST) DBSPI-Syb-05min-Reporter (ST)
SAPSybaseASE_VeryHigh (ST)
DBSPI-Syb-15min (ST) SAPSybaseASE_High (ST)
DBSPI-Syb-1hr (ST) SAPSybaseASE_Medium (ST)
DBSPI-Syb-1d (ST) DBSPI-Syb-1d-Reporter (ST) DBSPI-Syb-1d-Reporter-NT (ST)
SAPSybaseASE_Low (ST)
NA SAPSybaseASE_Configuration (CF)
DBSPI-Messages (OPCMSG) SAPSybaseASE_Messages (OPCMSG) SAP Sybase Replication Base
DBSPI-MeasureWare (ST) SAPSybaseASE_Logger (ST)
DBSPI-Syb-Repserver-05min (ST) SAPSybaseASE_VeryHigh (ST)
NA SAPSybaseASE_High (ST)
NA SAPSybaseASE_Medium (ST)
NA SAPSybaseASE_Low (ST)
NA SAPSybaseASE_RepConfiguration (CF)
Configuration and Customization Mapping This section provides the mapping of SPI configuration done outside of policies and equivalent parameters in MP aspects. Use this mapping to reuse configuration and customization from SPI to MP.
Configuration and Customization information in Sybase SPI
Equivalent configuration in SAP Sybase ASE MP
More information
Use the Configure DB Connection on OMx or Database Configuration Manager on OMW tool to update Sybase Server instance information.
Specify the Username and Password as parameter values when deploying an Aspect or MT to a SAP Sybase ASE CI and Replication Server instance CI.
Update SAP Sybase ASE database instance information into local configuration on the managed node.
You can enable or disable Tracing by using the Enable/Disable Trace tool.
The SAP Sybase ASE Server Instance Tracing parameter can be tuned during or after deployment.
Turn on/off tracing for SAP Sybase ASE Instance(s).
Start or Stop monitoring using the Start/Stop Monitoring tool.
SAP Sybase ASE Server Instance Collection parameter can be tuned during or after deployment.
Start/Stop monitoring for SAP Sybase ASE Instance(s).
Threshold is defined in policy and can be customized by editing the policy.
The Threshold parameter can be updated during or after MT or Aspect deployment.
Severity is defined in policy and can be customized by editing policy.
The Severity parameter can be updated during or after MT or Aspect deployment.
Metric filter can be customized using the Configure DB Connection on OMX or Database Configuration Manager on OMW tool.
The Metric Filter parameter can be tuned during deployment.
Metric filter is part of expert parameters.
Collection interval is defined in schedule task policies and can be customized by editing policy.
The Frequency parameter can be tuned during deployment.
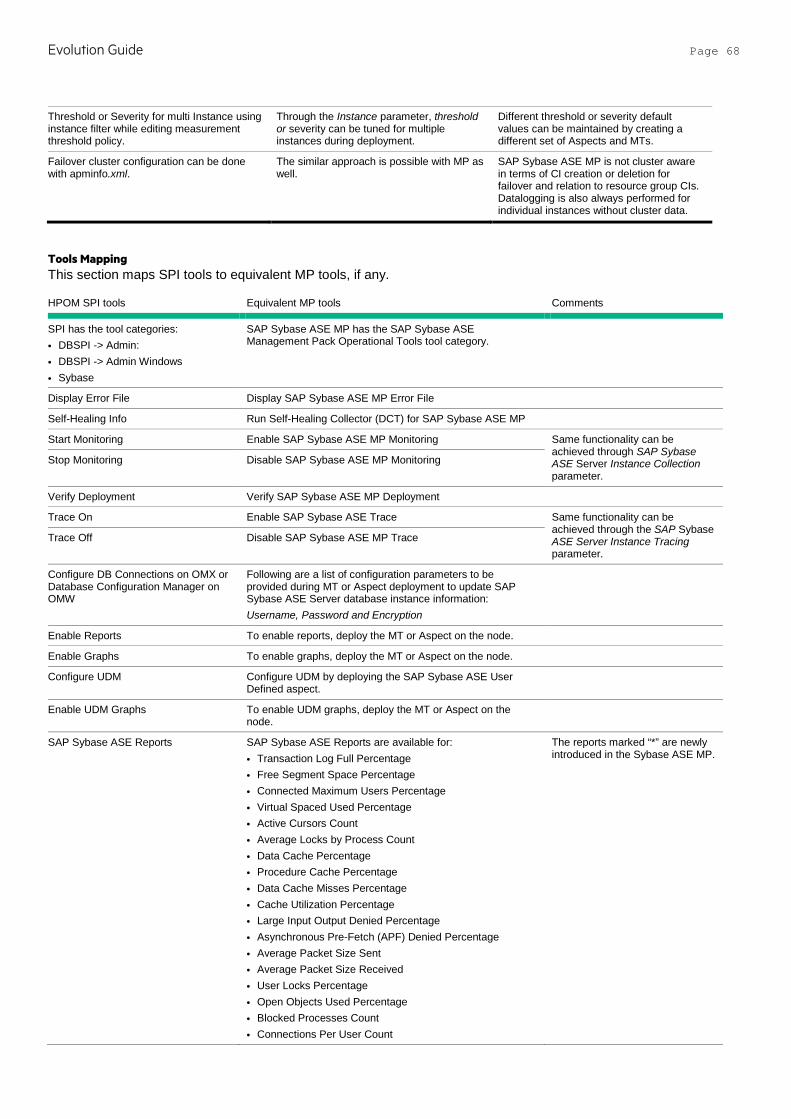
Evolution Guide Page 68
Threshold or Severity for multi Instance using instance filter while editing measurement threshold policy.
Through the Instance parameter, threshold or severity can be tuned for multiple instances during deployment.
Different threshold or severity default values can be maintained by creating a different set of Aspects and MTs.
Failover cluster configuration can be done with apminfo.xml.
The similar approach is possible with MP as well.
SAP Sybase ASE MP is not cluster aware in terms of CI creation or deletion for failover and relation to resource group CIs. Datalogging is also always performed for individual instances without cluster data.
Tools Mapping This section maps SPI tools to equivalent MP tools, if any.
HPOM SPI tools Equivalent MP tools Comments
SPI has the tool categories: • DBSPI -> Admin: • DBSPI -> Admin Windows • Sybase
SAP Sybase ASE MP has the SAP Sybase ASE Management Pack Operational Tools tool category.
Display Error File Display SAP Sybase ASE MP Error File
Self-Healing Info Run Self-Healing Collector (DCT) for SAP Sybase ASE MP
Start Monitoring Enable SAP Sybase ASE MP Monitoring Same functionality can be achieved through SAP Sybase ASE Server Instance Collection parameter.
Stop Monitoring Disable SAP Sybase ASE MP Monitoring
Verify Deployment Verify SAP Sybase ASE MP Deployment
Trace On Enable SAP Sybase ASE Trace Same functionality can be achieved through the SAP Sybase ASE Server Instance Tracing parameter.
Trace Off Disable SAP Sybase ASE MP Trace
Configure DB Connections on OMX or Database Configuration Manager on OMW
Following are a list of configuration parameters to be provided during MT or Aspect deployment to update SAP Sybase ASE Server database instance information: Username, Password and Encryption
Enable Reports To enable reports, deploy the MT or Aspect on the node.
Enable Graphs To enable graphs, deploy the MT or Aspect on the node.
Configure UDM Configure UDM by deploying the SAP Sybase ASE User Defined aspect.
Enable UDM Graphs To enable UDM graphs, deploy the MT or Aspect on the node.
SAP Sybase ASE Reports SAP Sybase ASE Reports are available for: • Transaction Log Full Percentage • Free Segment Space Percentage • Connected Maximum Users Percentage • Virtual Spaced Used Percentage • Active Cursors Count • Average Locks by Process Count • Data Cache Percentage • Procedure Cache Percentage • Data Cache Misses Percentage • Cache Utilization Percentage • Large Input Output Denied Percentage • Asynchronous Pre-Fetch (APF) Denied Percentage • Average Packet Size Sent • Average Packet Size Received • User Locks Percentage • Open Objects Used Percentage • Blocked Processes Count • Connections Per User Count
The reports marked “*” are newly introduced in the Sybase ASE MP.
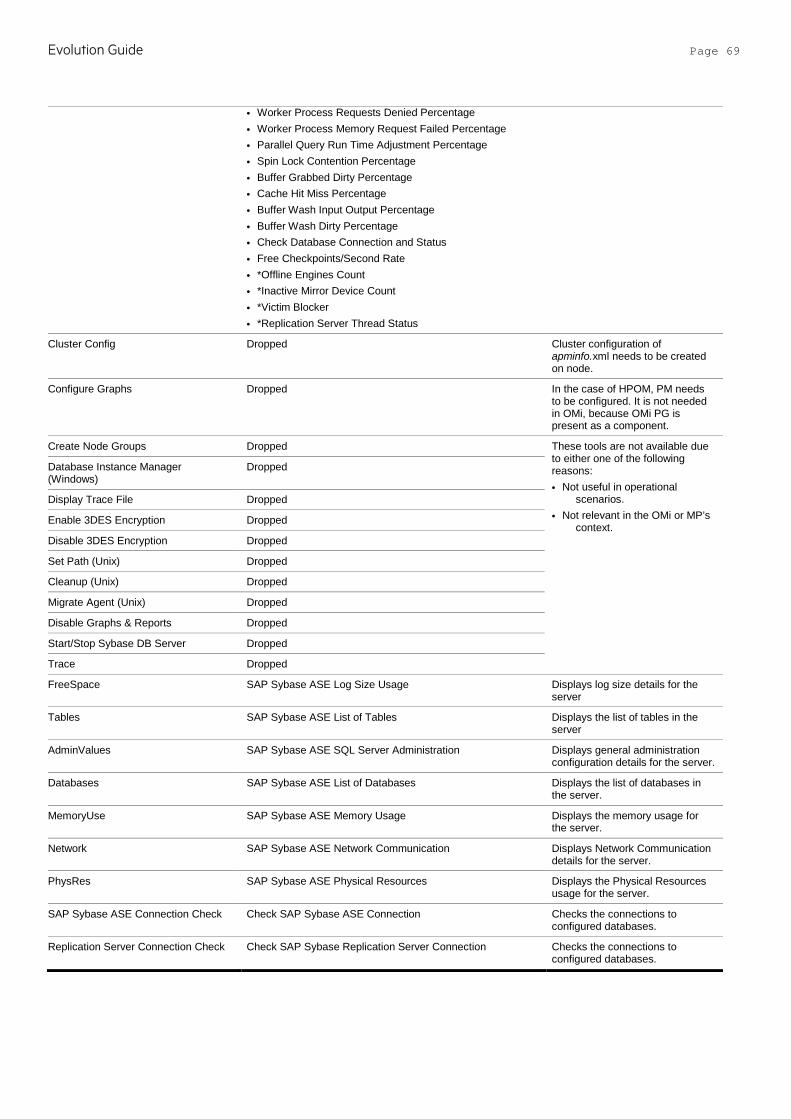
Evolution Guide Page 69
• Worker Process Requests Denied Percentage • Worker Process Memory Request Failed Percentage • Parallel Query Run Time Adjustment Percentage • Spin Lock Contention Percentage • Buffer Grabbed Dirty Percentage • Cache Hit Miss Percentage • Buffer Wash Input Output Percentage • Buffer Wash Dirty Percentage • Check Database Connection and Status • Free Checkpoints/Second Rate • *Offline Engines Count • *Inactive Mirror Device Count • *Victim Blocker • *Replication Server Thread Status
Cluster Config Dropped Cluster configuration of apminfo.xml needs to be created on node.
Configure Graphs Dropped In the case of HPOM, PM needs to be configured. It is not needed in OMi, because OMi PG is present as a component.
Create Node Groups Dropped These tools are not available due to either one of the following reasons: • Not useful in operational
scenarios. • Not relevant in the OMi or MP’s
context.
Database Instance Manager (Windows)
Dropped
Display Trace File Dropped
Enable 3DES Encryption Dropped
Disable 3DES Encryption Dropped
Set Path (Unix) Dropped
Cleanup (Unix) Dropped
Migrate Agent (Unix) Dropped
Disable Graphs & Reports Dropped
Start/Stop Sybase DB Server Dropped
Trace Dropped
FreeSpace SAP Sybase ASE Log Size Usage Displays log size details for the server
Tables SAP Sybase ASE List of Tables Displays the list of tables in the server
AdminValues SAP Sybase ASE SQL Server Administration Displays general administration configuration details for the server.
Databases SAP Sybase ASE List of Databases Displays the list of databases in the server.
MemoryUse SAP Sybase ASE Memory Usage Displays the memory usage for the server.
Network SAP Sybase ASE Network Communication Displays Network Communication details for the server.
PhysRes SAP Sybase ASE Physical Resources Displays the Physical Resources usage for the server.
SAP Sybase ASE Connection Check Check SAP Sybase ASE Connection Checks the connections to configured databases.
Replication Server Connection Check Check SAP Sybase Replication Server Connection Checks the connections to configured databases.
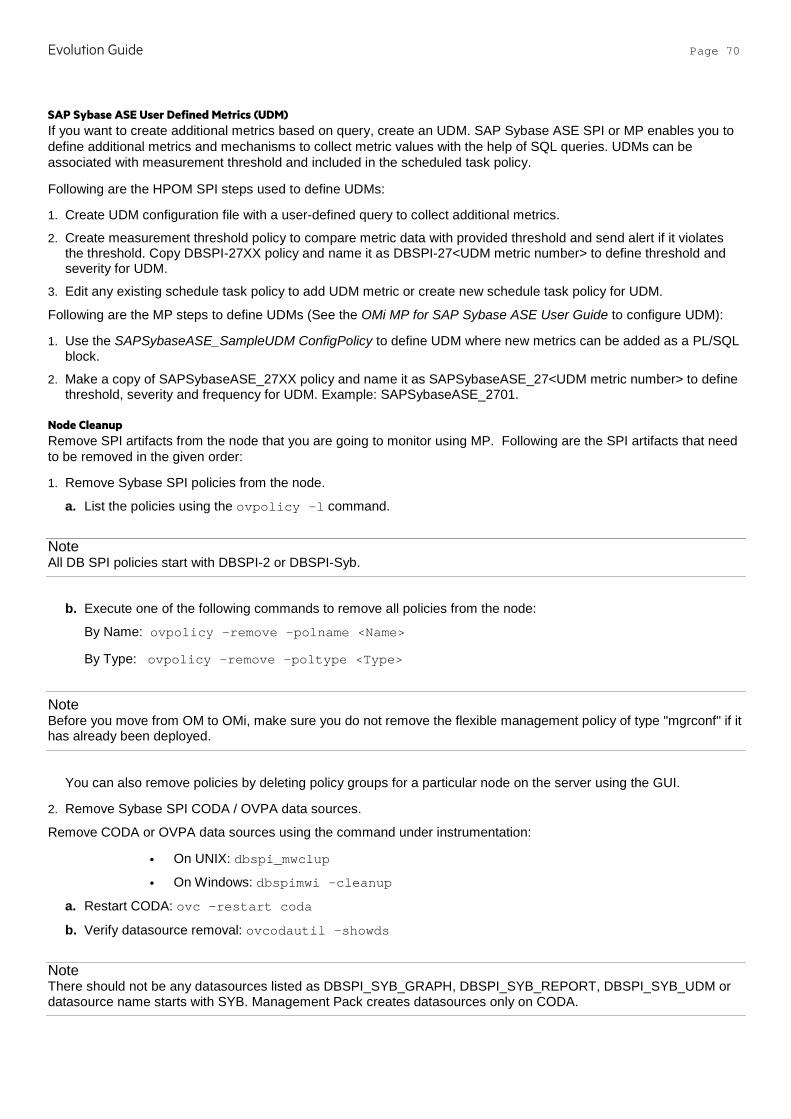
Evolution Guide Page 70
SAP Sybase ASE User Defined Metrics (UDM) If you want to create additional metrics based on query, create an UDM. SAP Sybase ASE SPI or MP enables you to define additional metrics and mechanisms to collect metric values with the help of SQL queries. UDMs can be associated with measurement threshold and included in the scheduled task policy.
Following are the HPOM SPI steps used to define UDMs:
1. Create UDM configuration file with a user-defined query to collect additional metrics.
2. Create measurement threshold policy to compare metric data with provided threshold and send alert if it violates the threshold. Copy DBSPI-27XX policy and name it as DBSPI-27<UDM metric number> to define threshold and severity for UDM.
3. Edit any existing schedule task policy to add UDM metric or create new schedule task policy for UDM.
Following are the MP steps to define UDMs (See the OMi MP for SAP Sybase ASE User Guide to configure UDM):
1. Use the SAPSybaseASE_SampleUDM ConfigPolicy to define UDM where new metrics can be added as a PL/SQL block.
2. Make a copy of SAPSybaseASE_27XX policy and name it as SAPSybaseASE_27<UDM metric number> to define threshold, severity and frequency for UDM. Example: SAPSybaseASE_2701.
Node Cleanup Remove SPI artifacts from the node that you are going to monitor using MP. Following are the SPI artifacts that need to be removed in the given order:
1. Remove Sybase SPI policies from the node.
a. List the policies using the ovpolicy –l command.
Note All DB SPI policies start with DBSPI-2 or DBSPI-Syb.
b. Execute one of the following commands to remove all policies from the node:
By Name: ovpolicy –remove –polname <Name>
By Type: ovpolicy –remove –poltype <Type>
Note Before you move from OM to OMi, make sure you do not remove the flexible management policy of type "mgrconf" if it has already been deployed.
You can also remove policies by deleting policy groups for a particular node on the server using the GUI.
2. Remove Sybase SPI CODA / OVPA data sources.
Remove CODA or OVPA data sources using the command under instrumentation:
• On UNIX: dbspi_mwclup
• On Windows: dbspimwi –cleanup
a. Restart CODA: ovc –restart coda
b. Verify datasource removal: ovcodautil –showds
Note There should not be any datasources listed as DBSPI_SYB_GRAPH, DBSPI_SYB_REPORT, DBSPI_SYB_UDM or datasource name starts with SYB. Management Pack creates datasources only on CODA.
Evolution Guide Page 71
For more information on how to back up the data if you need the data for future use, see the SHR documentation.
3. Remove Sybase SPI Instrumentation.
The instrumentation files on the node that are prefixed with “dbspi”, “DBSPI”, “spi_db”, and “syb_” can be deleted.
• On UNIX: /var/opt/OV/bin/instrumentation
• On Windows: %OvAgentDir%\bin\instrumentation
Note Instrumentation removal may fail if any executable or script is running. Stop the corresponding process (es) and then delete the instrumentation files.
4. Remove Sybase SPI configuration files.
The dbspi configuration/history/log files are located under <OvAgentDrive>\usr\OV\dbspi on Windows and /var/opt/OV/dbspi on UNIX. After you have taken a backup, this directory can be removed before deploying an MP.
See the chapter Removing the DBSPI in the DBSPI Install and Config guide for cleaning up assignments, policies, instrumentation and config files.
For more information on cleaning up nodes, see Prepare nodes for deployment under the Recommended steps for moving from a SPI to MP section in this document.
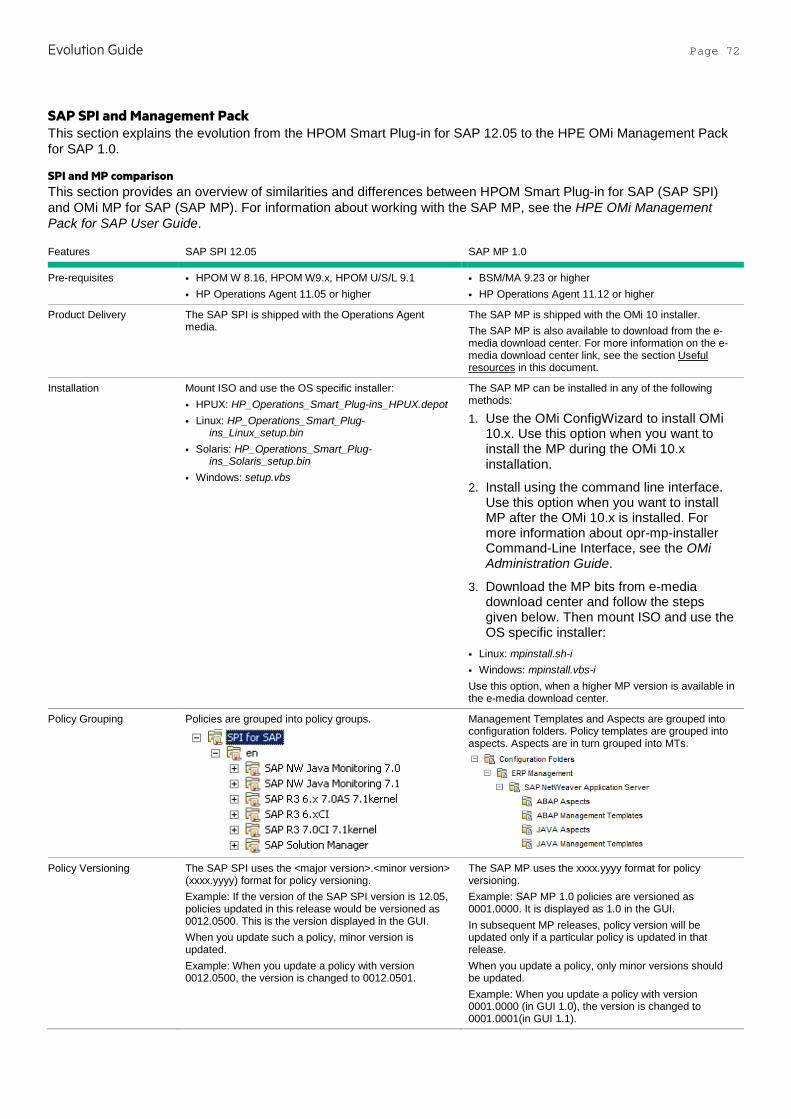
Evolution Guide Page 72
SAP SPI and Management Pack This section explains the evolution from the HPOM Smart Plug-in for SAP 12.05 to the HPE OMi Management Pack for SAP 1.0.
SPI and MP comparison This section provides an overview of similarities and differences between HPOM Smart Plug-in for SAP (SAP SPI) and OMi MP for SAP (SAP MP). For information about working with the SAP MP, see the HPE OMi Management Pack for SAP User Guide.
Features SAP SPI 12.05 SAP MP 1.0
Pre-requisites • HPOM W 8.16, HPOM W9.x, HPOM U/S/L 9.1 • HP Operations Agent 11.05 or higher
• BSM/MA 9.23 or higher • HP Operations Agent 11.12 or higher
Product Delivery The SAP SPI is shipped with the Operations Agent media.
The SAP MP is shipped with the OMi 10 installer. The SAP MP is also available to download from the e-media download center. For more information on the e-media download center link, see the section Useful resources in this document.
Installation Mount ISO and use the OS specific installer: • HPUX: HP_Operations_Smart_Plug-ins_HPUX.depot • Linux: HP_Operations_Smart_Plug-
ins_Linux_setup.bin • Solaris: HP_Operations_Smart_Plug-
ins_Solaris_setup.bin • Windows: setup.vbs
The SAP MP can be installed in any of the following methods:
1. Use the OMi ConfigWizard to install OMi 10.x. Use this option when you want to install the MP during the OMi 10.x installation.
2. Install using the command line interface. Use this option when you want to install MP after the OMi 10.x is installed. For more information about opr-mp-installer Command-Line Interface, see the OMi Administration Guide.
3. Download the MP bits from e-media download center and follow the steps given below. Then mount ISO and use the OS specific installer:
• Linux: mpinstall.sh-i • Windows: mpinstall.vbs-i Use this option, when a higher MP version is available in the e-media download center.
Policy Grouping Policies are grouped into policy groups.
Management Templates and Aspects are grouped into configuration folders. Policy templates are grouped into aspects. Aspects are in turn grouped into MTs.
Policy Versioning The SAP SPI uses the <major version>.<minor version> (xxxx.yyyy) format for policy versioning. Example: If the version of the SAP SPI version is 12.05, policies updated in this release would be versioned as 0012.0500. This is the version displayed in the GUI. When you update such a policy, minor version is updated. Example: When you update a policy with version 0012.0500, the version is changed to 0012.0501.
The SAP MP uses the xxxx.yyyy format for policy versioning. Example: SAP MP 1.0 policies are versioned as 0001.0000. It is displayed as 1.0 in the GUI. In subsequent MP releases, policy version will be updated only if a particular policy is updated in that release. When you update a policy, only minor versions should be updated. Example: When you update a policy with version 0001.0000 (in GUI 1.0), the version is changed to 0001.0001(in GUI 1.1).

Evolution Guide Page 73
Tools The SAP SPI provides the following tools for monitoring SAP. Tools are grouped based on the functionality and the type of node either Windows or UNIX on which the tools are executed.
The tools in SAP MP are grouped based on the Configuration Items - SAP ABAP application Server and SAP J2EE Application Server. Tools for SAP ABAP Application Server CI:
Tools for SAP J2EE Application Server CI:
Instrumentation Consists of the following instrumentation categories: • SAP_Instrumentation • SPIDataCollector
Uses the SAPMP_Instrumentation category.
Discovery SAP ABAP Application Server: Deploy the Auto-Discovery of SAP R/3 system policy (r3sdisc) onto the managed node. SAP J2EE Application Server: Deploy the Auto-Discovery of SAP Java Systems (r3j2eesdisc) policy onto the managed node.
• SAP ABAP Application Server: Deploy the SAP ABAP discovery aspect onto the managed node The CIs discovered by SAP MP include the SAP systems, SAP ABAP Application Servers, and SAP Work Processes. • SAP J2EE Application Server: Deploy the SAP J2EE discovery aspect onto the managed node. The CI discovered by SAP MP for J2EE Application Server includes SAP J2EE Application Server configured on the node. • Remote instances discovery for SAP ABAP
Application Server: Deploy the SAP ABAP remote configuration aspect to the managed node on which the Operations agent is installed.
Configuration ABAP Application Server: • Configure SAP instances and the login credentials
using the configuration file r3itosap.cfg. • Configure the individual monitoring areas using the
configuration files such as r3mondmp.cfg, r3monrfc.cfg, r3monwpa.cfg, and so on.
J2EE Application Server: • Configure the J2EE instances and the login
credentials using the configuration file global_SiteConfig.cfg.
• Configure the individual monitoring areas using the respective measurement threshold policies such as SPISAP_0001, SPISAP_0002, SPISAP_0204, SPISAP_0205, and so on.
ABAP Application Server: Configuration is part of deployment. For more information, see section SAP ABAP Application Server Monitoring. J2EE Application Server: Configuration is part of deployment. For more information, see section SAP J2EE Application Server Monitoring.
Deployment Deploy specific policies or groups for the SAP ABAP application server and SAP J2EE application server based on monitoring needs to appropriate node(s).
Deploy the MT or Aspect: SAP ABAP Application Server:
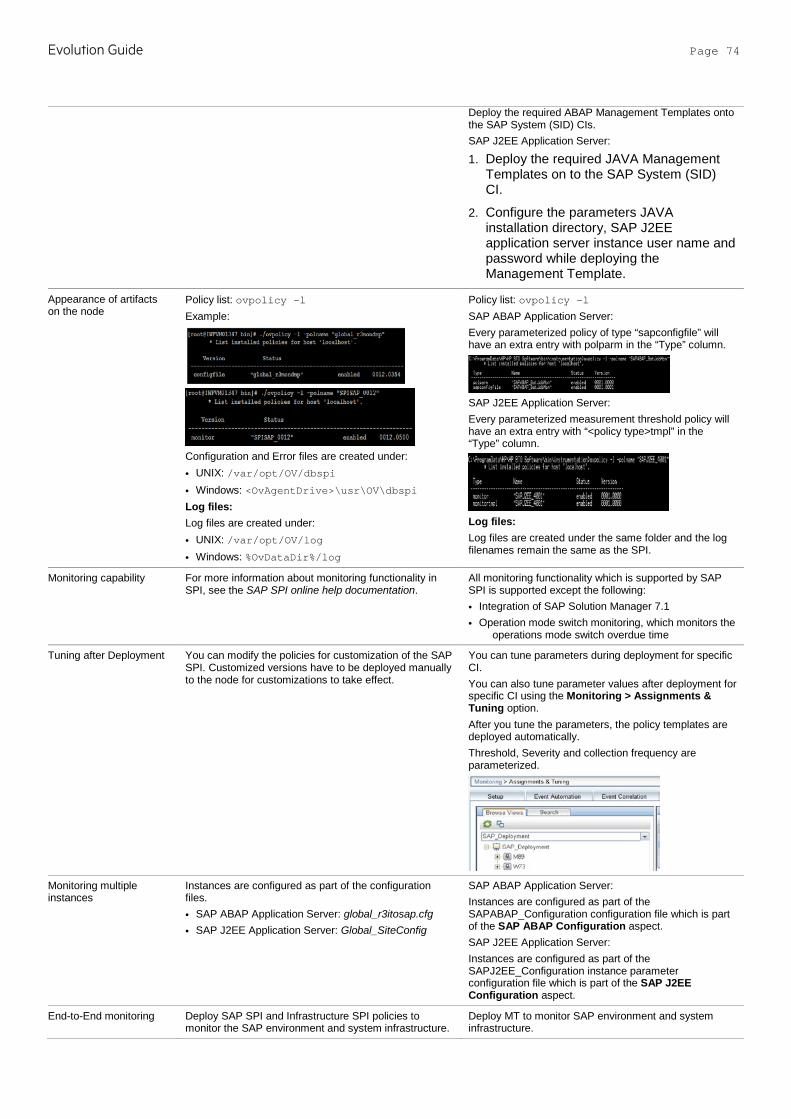
Evolution Guide Page 74
Deploy the required ABAP Management Templates onto the SAP System (SID) CIs. SAP J2EE Application Server:
1. Deploy the required JAVA Management Templates on to the SAP System (SID) CI.
2. Configure the parameters JAVA installation directory, SAP J2EE application server instance user name and password while deploying the Management Template.
Appearance of artifacts on the node
Policy list: ovpolicy –l Example:
Configuration and Error files are created under: • UNIX: /var/opt/OV/dbspi • Windows: <OvAgentDrive>\usr\OV\dbspi Log files: Log files are created under: • UNIX: /var/opt/OV/log • Windows: %OvDataDir%/log
Policy list: ovpolicy –l SAP ABAP Application Server: Every parameterized policy of type “sapconfigfile” will have an extra entry with polparm in the “Type” column.
SAP J2EE Application Server: Every parameterized measurement threshold policy will have an extra entry with “<policy type>tmpl” in the “Type” column.
Log files: Log files are created under the same folder and the log filenames remain the same as the SPI.
Monitoring capability For more information about monitoring functionality in SPI, see the SAP SPI online help documentation.
All monitoring functionality which is supported by SAP SPI is supported except the following: • Integration of SAP Solution Manager 7.1 • Operation mode switch monitoring, which monitors the
operations mode switch overdue time
Tuning after Deployment You can modify the policies for customization of the SAP SPI. Customized versions have to be deployed manually to the node for customizations to take effect.
You can tune parameters during deployment for specific CI. You can also tune parameter values after deployment for specific CI using the Monitoring > Assignments & Tuning option. After you tune the parameters, the policy templates are deployed automatically. Threshold, Severity and collection frequency are parameterized.
Monitoring multiple instances
Instances are configured as part of the configuration files. • SAP ABAP Application Server: global_r3itosap.cfg • SAP J2EE Application Server: Global_SiteConfig
SAP ABAP Application Server: Instances are configured as part of the SAPABAP_Configuration configuration file which is part of the SAP ABAP Configuration aspect. SAP J2EE Application Server: Instances are configured as part of the SAPJ2EE_Configuration instance parameter configuration file which is part of the SAP J2EE Configuration aspect.
End-to-End monitoring Deploy SAP SPI and Infrastructure SPI policies to monitor the SAP environment and system infrastructure.
Deploy MT to monitor SAP environment and system infrastructure.

Evolution Guide Page 75
There is no one-to-one mapping between the SPI policy groups and MTs present in MP. For more information on the mapping between the SPI policy and the corresponding MP policy template and Aspect, see SAP SPI policy to SAP MP Policy Template Mapping in this document.
Monitoring instances with different business criticality
Maintain multiple policies set based on the business criticality.
• Essential MT has a set of policies that monitors the key health metrics of the SAP Landscape. Deploy the essential MT to monitor less critical environment.
• Extensive MT has a wider range of policies monitoring additional metrics. Use the extensive MT to monitor critical business environment.
Remote Monitoring for SAP ABAP Application Server
1. Specify the credentials of remote nodes and proxy node (on which agent is installed) in the configuration file r3itosap.cfg.
2. Specify the remote nodes and associated server nodes in the individual configuration files. For example, r3mondmp.cfg, r3monrfc.cfg, r3monwpa.cfg and so on.
3. Deploy them on the server nodes.
1. Provide configuration details about the remote host and the local host in the configuration file policy SAPABAP_RemoteConfiguration which is part of the SAP ABAP Remote Configuration Aspect.
2. Specify the remote nodes and associated server nodes in the individual configuration files.
For example: SAPABAP_DmpMon, SAPABAP_RFCDestMon, SAPABAP_WPMon, and so on. The SAPABAP_RemoteConfiguration Aspect also includes the discovery policy SAPABAP_RemoteDiscovery that is used to discover SAP ABAP application server remote instances.
Transports Import specific transports to monitor the SAP ABAP Application Server on the SAP node. Transports are available based on the SAP versions.
Import specific transports to monitor the SAP ABAP Application Server on the SAP node. Transport for SAP versions 6.20 or 6.40 and transports for the SAP solution Manager 7.1 integration are not available. Detailed mapping is available in the section Transports Mapping in this document.
Uninstallation Native procedure is used to uninstall SAP SPI. Artifacts can be removed manually in the following order: • Assignments • MTs • Aspects • Policy Templates • Instrumentation • Content Pack definitions
Graphs OOTB graphs are not available OOTB graphs are not available
Data logging Collected metrics gets logged into CODA or OVPA on the node.
SAP MP uses only CODA as datasource. There is no difference in the data logged with respect to datasource name or class names.
Indicators (ETIs and HIs) Supports SAP Content Pack which ships HIs or ETIs. HIs or ETIs are included as part of the Custom Message Attributes in the events.
Has the following new ETIs in In addition to the HIs or ETIs available in SAP SPI, SAP MP provides the following: • CTSPerformance • SystemChangeOptionStatus • ABAPDispatcherStatus • TemSeFileInconsistency • SAPFileSystemUtilization • SAPSystemSecurityStatus • SAPSystemLogStatus • IDOCStatus
TBECs Supports SAP Content Pack where Topology Based Event Correlation Rules are not available.
Topology Based Correlation Rules are available with SAP MP for both ABAP and J2EE Application Servers.

Evolution Guide Page 76
Events The policy names form a part of the message text and they start with r3* for ABAP Application Server and SPISAP_* for J2EE Application Server.
The policy names form a part of the message text and they start with r3* for ABAP Application Server and SAPJ2EE_* for J2EE Application Server.
I18N & L10N Is I18N certified and supports L10N. Is I18N certified and is localized in the following languages: • Simplified Chinese • Japanese
OO Flows Not available Not available
SAP ABAP Application Server Monitoring Common Policy Changes from SAP SPI to SAP MP This section captures changes (such as parameterization) commonly done on SAP SPI policies to convert them into the SAP MP policy templates for monitoring the SAP ABAP Application Server.
The following out-of-the-box policy types available in SAP SPI is explained in the next few sections:
• Configuration File Policies
• Schedule Task Policies
• Service Auto Discovery Policy
Configuration File Policies
As part of SAP ABAP Application server monitoring, all the input credentials and the configurations for monitoring the individual specific areas of SAP ABAP environment are available as configuration file policies. The below part lists the differences between the configuration in SAP MP against the SAP SPI.
Configurations File Policy for Login Credentials
You can classify the changes made to configuration file policies in SAP SPI into two parts:
a. Changes to the configuration file templates for specifying the login credentials.
SAP SPI 12.05 SAP MP 1.0
Global_r3itosap This file is used to configure the SAP ABAP instances both for remote instances and instances on which the operations agent is running.
SAPABAP_Configuration This aspect is used to configure SAP ABAP instances on which the operations agent is running. SAPABAP_RemoteConfiguration This aspect is used to configure the SAP ABAP remote instances.
b. Changes to the other configuration file templates for specifying the monitoring configurations to monitor the individual monitoring areas:
A new policy template type called SAP ABAP Monitoring Template is introduced in SAP MP. This is used to define the configurations required for monitoring the different areas of SAP ABAP Application Server such as the dump monitoring, rfc monitoring, job monitoring and so on. These policy templates map to the SAP SPI configuration files such as global_r3monjob, global_r3monrfc, and so on.
The following screenshot “Policy templates of type SAP ABAP Monitoring Template” lists the different policy templates available in SAP MP under SAP ABAP Monitoring Template.
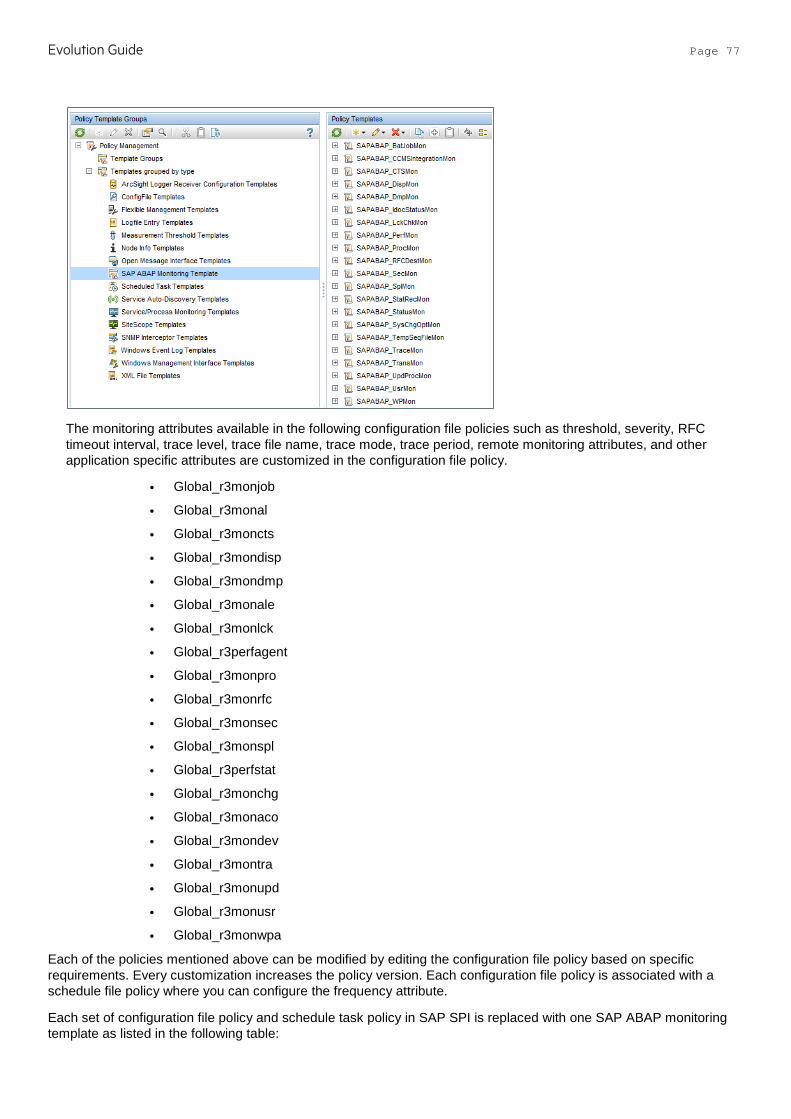
Evolution Guide Page 77
The monitoring attributes available in the following configuration file policies such as threshold, severity, RFC timeout interval, trace level, trace file name, trace mode, trace period, remote monitoring attributes, and other application specific attributes are customized in the configuration file policy.
• Global_r3monjob
• Global_r3monal
• Global_r3moncts
• Global_r3mondisp
• Global_r3mondmp
• Global_r3monale
• Global_r3monlck
• Global_r3perfagent
• Global_r3monpro
• Global_r3monrfc
• Global_r3monsec
• Global_r3monspl
• Global_r3perfstat
• Global_r3monchg
• Global_r3monaco
• Global_r3mondev
• Global_r3montra
• Global_r3monupd
• Global_r3monusr
• Global_r3monwpa
Each of the policies mentioned above can be modified by editing the configuration file policy based on specific requirements. Every customization increases the policy version. Each configuration file policy is associated with a schedule file policy where you can configure the frequency attribute.
Each set of configuration file policy and schedule task policy in SAP SPI is replaced with one SAP ABAP monitoring template as listed in the following table:
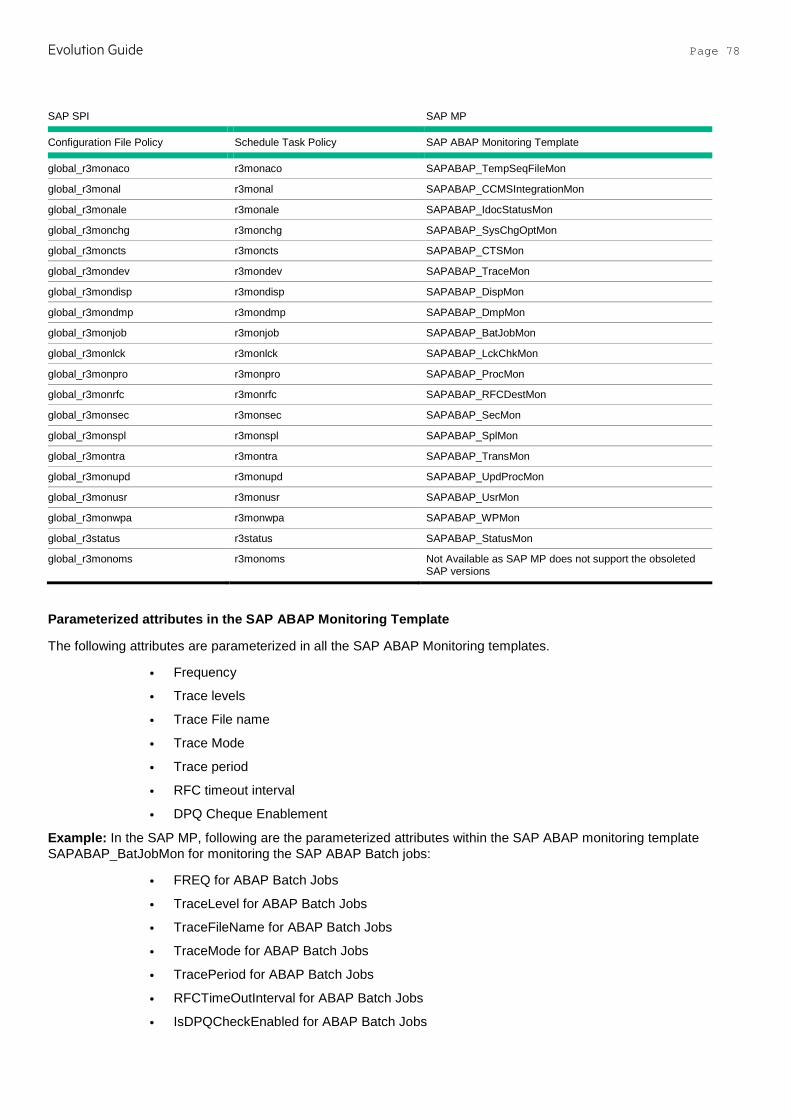
Evolution Guide Page 78
SAP SPI SAP MP
Configuration File Policy Schedule Task Policy SAP ABAP Monitoring Template
global_r3monaco r3monaco SAPABAP_TempSeqFileMon
global_r3monal r3monal SAPABAP_CCMSIntegrationMon
global_r3monale r3monale SAPABAP_IdocStatusMon
global_r3monchg r3monchg SAPABAP_SysChgOptMon
global_r3moncts r3moncts SAPABAP_CTSMon
global_r3mondev r3mondev SAPABAP_TraceMon
global_r3mondisp r3mondisp SAPABAP_DispMon
global_r3mondmp r3mondmp SAPABAP_DmpMon
global_r3monjob r3monjob SAPABAP_BatJobMon
global_r3monlck r3monlck SAPABAP_LckChkMon
global_r3monpro r3monpro SAPABAP_ProcMon
global_r3monrfc r3monrfc SAPABAP_RFCDestMon
global_r3monsec r3monsec SAPABAP_SecMon
global_r3monspl r3monspl SAPABAP_SplMon
global_r3montra r3montra SAPABAP_TransMon
global_r3monupd r3monupd SAPABAP_UpdProcMon
global_r3monusr r3monusr SAPABAP_UsrMon
global_r3monwpa r3monwpa SAPABAP_WPMon
global_r3status r3status SAPABAP_StatusMon
global_r3monoms r3monoms Not Available as SAP MP does not support the obsoleted SAP versions
Parameterized attributes in the SAP ABAP Monitoring Template
The following attributes are parameterized in all the SAP ABAP Monitoring templates.
• Frequency
• Trace levels
• Trace File name
• Trace Mode
• Trace period
• RFC timeout interval
• DPQ Cheque Enablement
Example: In the SAP MP, following are the parameterized attributes within the SAP ABAP monitoring template SAPABAP_BatJobMon for monitoring the SAP ABAP Batch jobs:
• FREQ for ABAP Batch Jobs
• TraceLevel for ABAP Batch Jobs
• TraceFileName for ABAP Batch Jobs
• TraceMode for ABAP Batch Jobs
• TracePeriod for ABAP Batch Jobs
• RFCTimeOutInterval for ABAP Batch Jobs
• IsDPQCheckEnabled for ABAP Batch Jobs
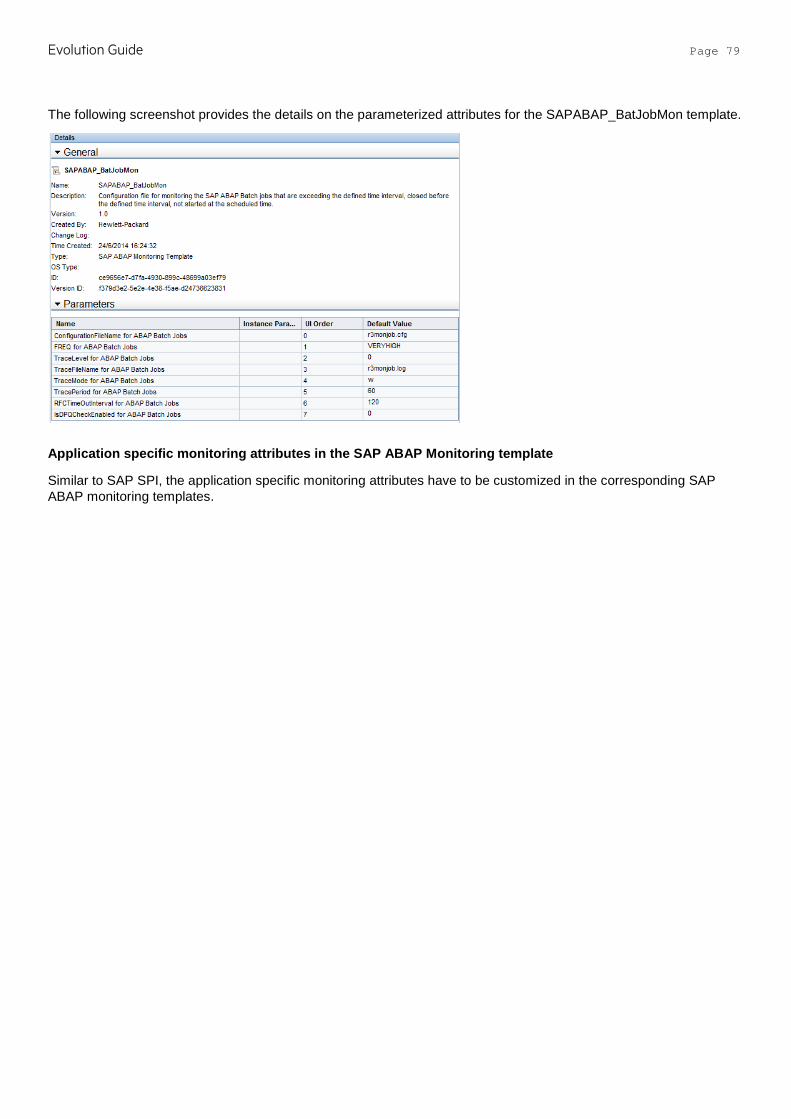
Evolution Guide Page 79
The following screenshot provides the details on the parameterized attributes for the SAPABAP_BatJobMon template.
Application specific monitoring attributes in the SAP ABAP Monitoring template
Similar to SAP SPI, the application specific monitoring attributes have to be customized in the corresponding SAP ABAP monitoring templates.
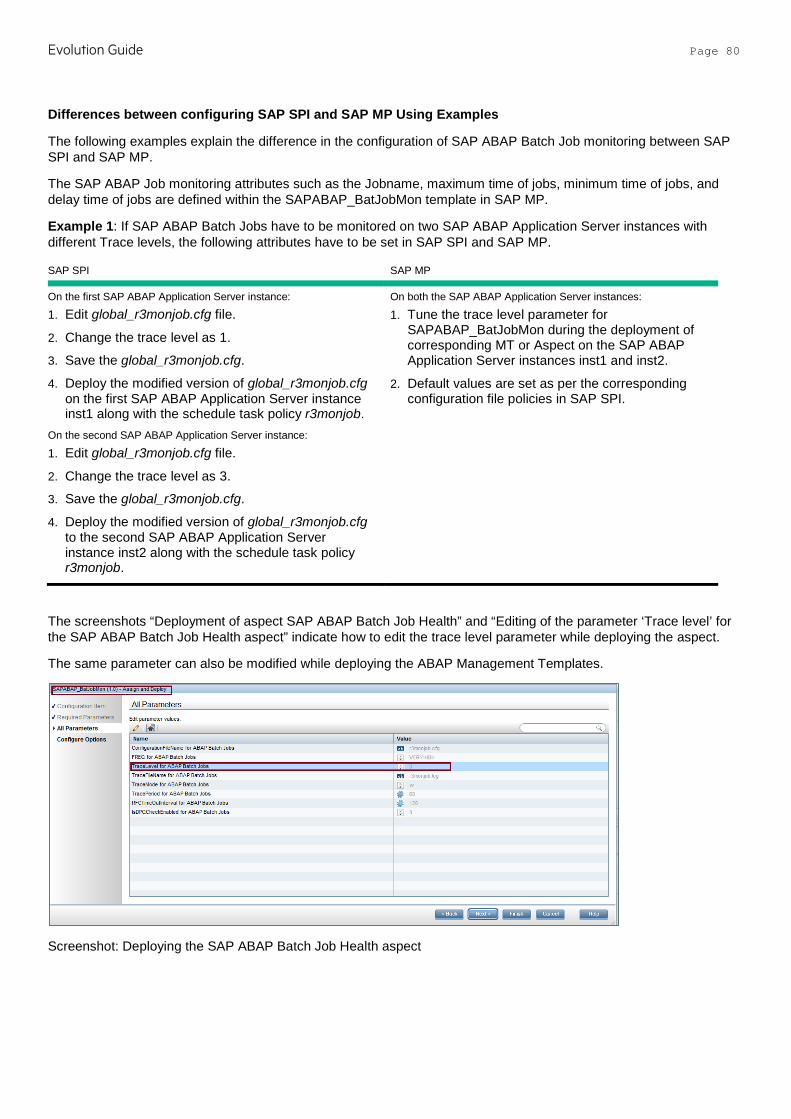
Evolution Guide Page 80
Differences between configuring SAP SPI and SAP MP Using Examples
The following examples explain the difference in the configuration of SAP ABAP Batch Job monitoring between SAP SPI and SAP MP.
The SAP ABAP Job monitoring attributes such as the Jobname, maximum time of jobs, minimum time of jobs, and delay time of jobs are defined within the SAPABAP_BatJobMon template in SAP MP.
Example 1: If SAP ABAP Batch Jobs have to be monitored on two SAP ABAP Application Server instances with different Trace levels, the following attributes have to be set in SAP SPI and SAP MP.
SAP SPI SAP MP
On the first SAP ABAP Application Server instance:
1. Edit global_r3monjob.cfg file.
2. Change the trace level as 1.
3. Save the global_r3monjob.cfg.
4. Deploy the modified version of global_r3monjob.cfg on the first SAP ABAP Application Server instance inst1 along with the schedule task policy r3monjob.
On the second SAP ABAP Application Server instance:
1. Edit global_r3monjob.cfg file.
2. Change the trace level as 3.
3. Save the global_r3monjob.cfg.
4. Deploy the modified version of global_r3monjob.cfg to the second SAP ABAP Application Server instance inst2 along with the schedule task policy r3monjob.
On both the SAP ABAP Application Server instances:
1. Tune the trace level parameter for SAPABAP_BatJobMon during the deployment of corresponding MT or Aspect on the SAP ABAP Application Server instances inst1 and inst2.
2. Default values are set as per the corresponding configuration file policies in SAP SPI.
The screenshots “Deployment of aspect SAP ABAP Batch Job Health” and “Editing of the parameter ‘Trace level’ for the SAP ABAP Batch Job Health aspect” indicate how to edit the trace level parameter while deploying the aspect.
The same parameter can also be modified while deploying the ABAP Management Templates.
Screenshot: Deploying the SAP ABAP Batch Job Health aspect
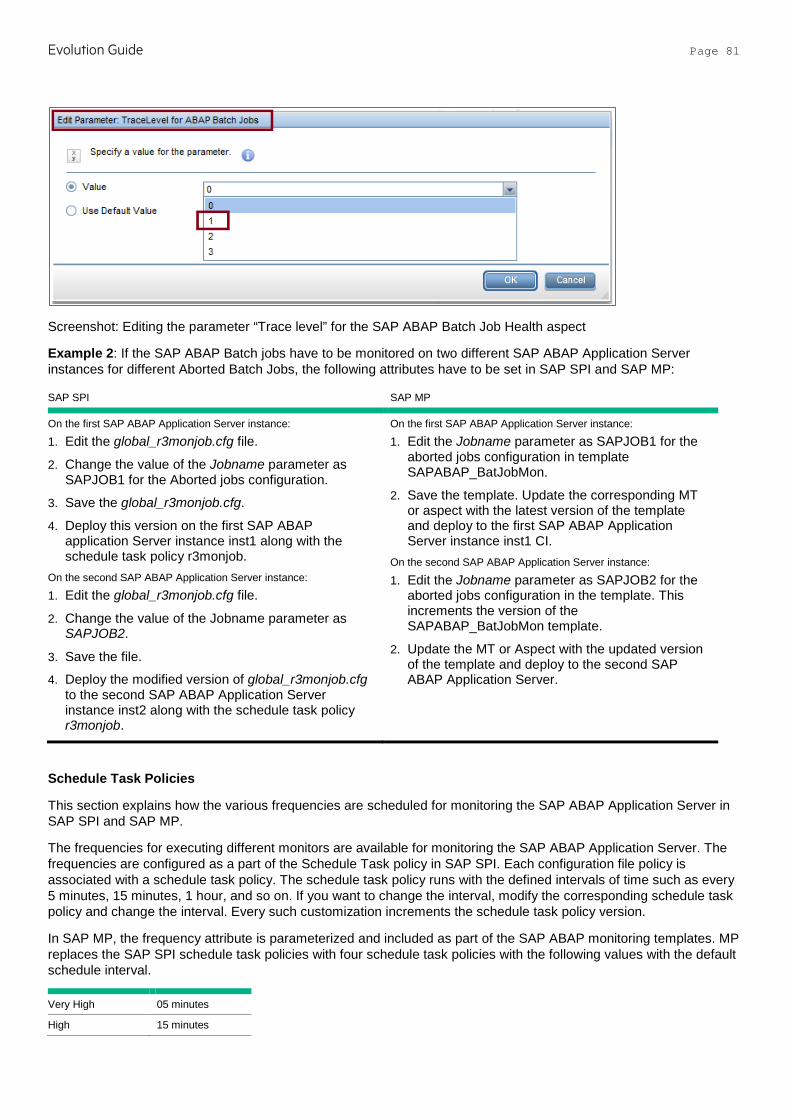
Evolution Guide Page 81
Screenshot: Editing the parameter “Trace level” for the SAP ABAP Batch Job Health aspect
Example 2: If the SAP ABAP Batch jobs have to be monitored on two different SAP ABAP Application Server instances for different Aborted Batch Jobs, the following attributes have to be set in SAP SPI and SAP MP:
SAP SPI SAP MP
On the first SAP ABAP Application Server instance:
1. Edit the global_r3monjob.cfg file.
2. Change the value of the Jobname parameter as SAPJOB1 for the Aborted jobs configuration.
3. Save the global_r3monjob.cfg.
4. Deploy this version on the first SAP ABAP application Server instance inst1 along with the schedule task policy r3monjob.
On the second SAP ABAP Application Server instance:
1. Edit the global_r3monjob.cfg file.
2. Change the value of the Jobname parameter as SAPJOB2.
3. Save the file.
4. Deploy the modified version of global_r3monjob.cfg to the second SAP ABAP Application Server instance inst2 along with the schedule task policy r3monjob.
On the first SAP ABAP Application Server instance:
1. Edit the Jobname parameter as SAPJOB1 for the aborted jobs configuration in template SAPABAP_BatJobMon.
2. Save the template. Update the corresponding MT or aspect with the latest version of the template and deploy to the first SAP ABAP Application Server instance inst1 CI.
On the second SAP ABAP Application Server instance:
1. Edit the Jobname parameter as SAPJOB2 for the aborted jobs configuration in the template. This increments the version of the SAPABAP_BatJobMon template.
2. Update the MT or Aspect with the updated version of the template and deploy to the second SAP ABAP Application Server.
Schedule Task Policies
This section explains how the various frequencies are scheduled for monitoring the SAP ABAP Application Server in SAP SPI and SAP MP.
The frequencies for executing different monitors are available for monitoring the SAP ABAP Application Server. The frequencies are configured as a part of the Schedule Task policy in SAP SPI. Each configuration file policy is associated with a schedule task policy. The schedule task policy runs with the defined intervals of time such as every 5 minutes, 15 minutes, 1 hour, and so on. If you want to change the interval, modify the corresponding schedule task policy and change the interval. Every such customization increments the schedule task policy version.
In SAP MP, the frequency attribute is parameterized and included as part of the SAP ABAP monitoring templates. MP replaces the SAP SPI schedule task policies with four schedule task policies with the following values with the default schedule interval.
Very High 05 minutes
High 15 minutes
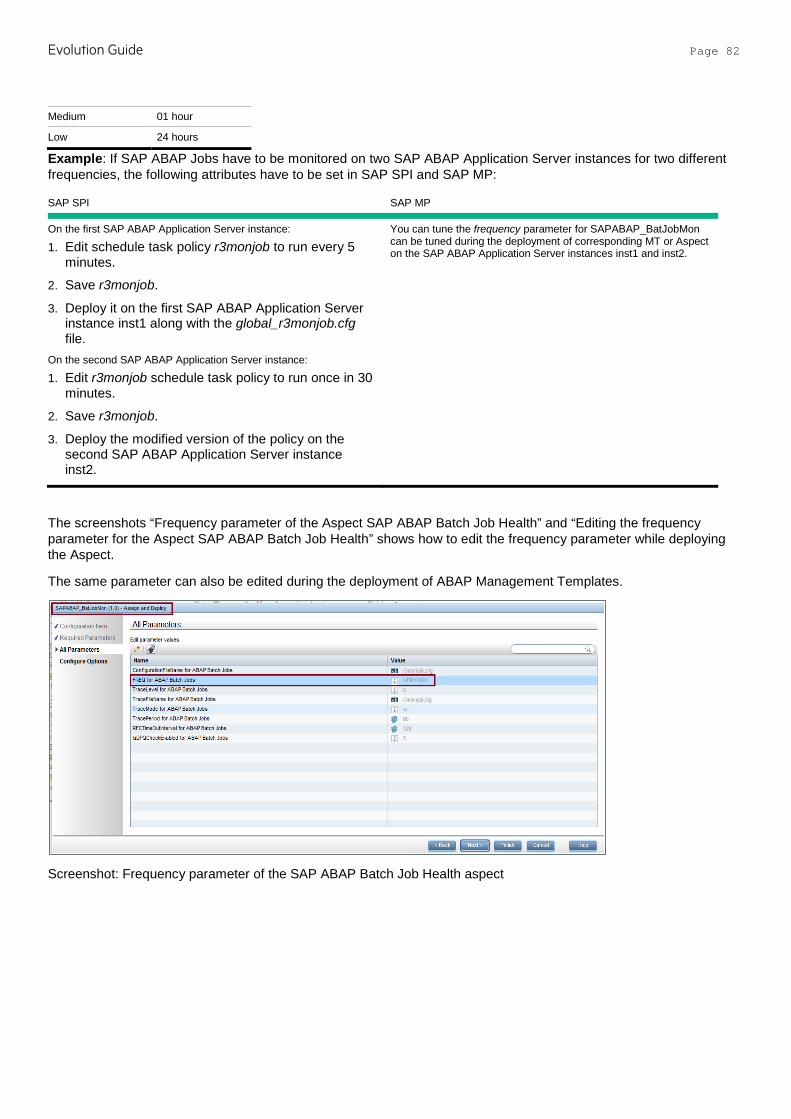
Evolution Guide Page 82
Medium 01 hour
Low 24 hours
Example: If SAP ABAP Jobs have to be monitored on two SAP ABAP Application Server instances for two different frequencies, the following attributes have to be set in SAP SPI and SAP MP:
SAP SPI SAP MP
On the first SAP ABAP Application Server instance:
1. Edit schedule task policy r3monjob to run every 5 minutes.
2. Save r3monjob.
3. Deploy it on the first SAP ABAP Application Server instance inst1 along with the global_r3monjob.cfg file.
On the second SAP ABAP Application Server instance:
1. Edit r3monjob schedule task policy to run once in 30 minutes.
2. Save r3monjob.
3. Deploy the modified version of the policy on the second SAP ABAP Application Server instance inst2.
You can tune the frequency parameter for SAPABAP_BatJobMon can be tuned during the deployment of corresponding MT or Aspect on the SAP ABAP Application Server instances inst1 and inst2.
The screenshots “Frequency parameter of the Aspect SAP ABAP Batch Job Health” and “Editing the frequency parameter for the Aspect SAP ABAP Batch Job Health” shows how to edit the frequency parameter while deploying the Aspect.
The same parameter can also be edited during the deployment of ABAP Management Templates.
Screenshot: Frequency parameter of the SAP ABAP Batch Job Health aspect
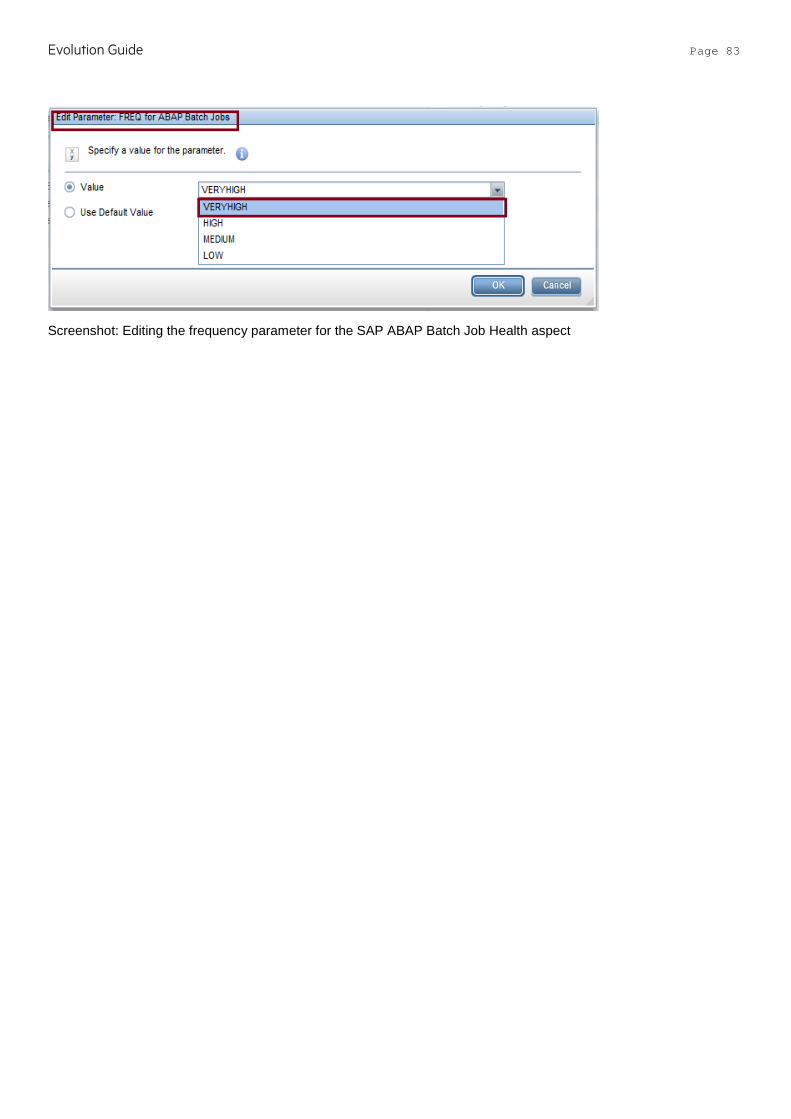
Evolution Guide Page 83
Screenshot: Editing the frequency parameter for the SAP ABAP Batch Job Health aspect
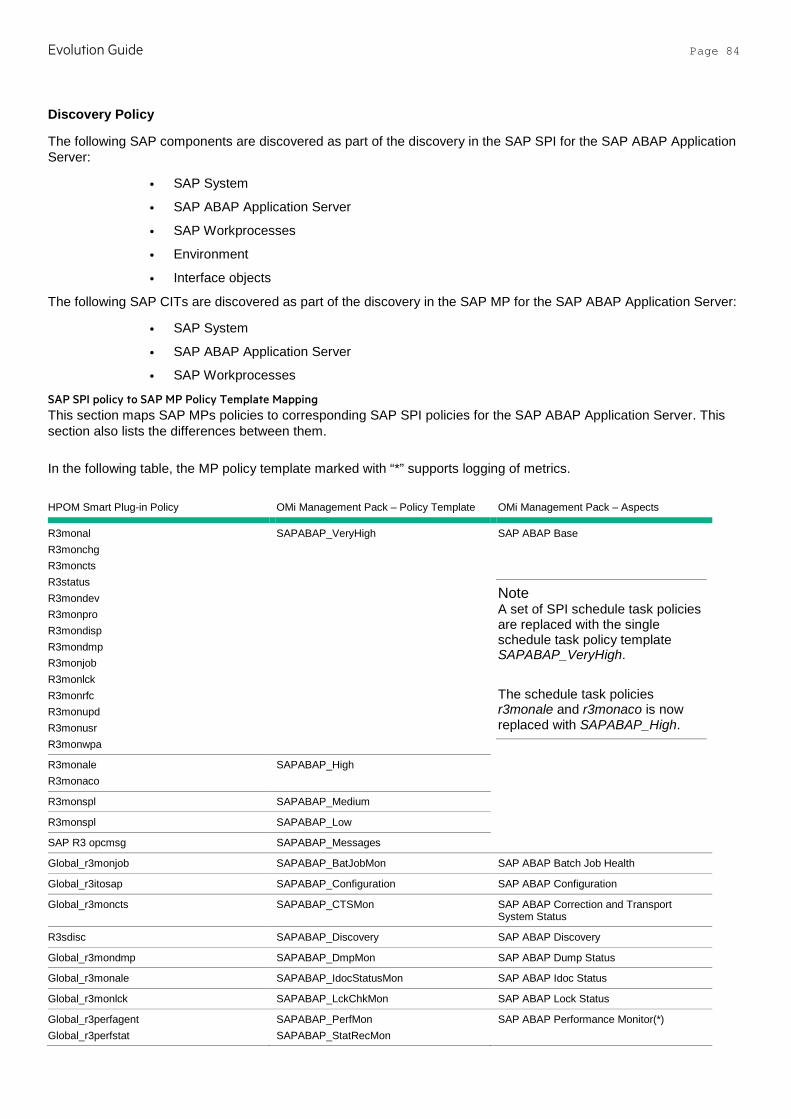
Evolution Guide Page 84
Discovery Policy
The following SAP components are discovered as part of the discovery in the SAP SPI for the SAP ABAP Application Server:
• SAP System
• SAP ABAP Application Server
• SAP Workprocesses
• Environment
• Interface objects
The following SAP CITs are discovered as part of the discovery in the SAP MP for the SAP ABAP Application Server:
• SAP System
• SAP ABAP Application Server
• SAP Workprocesses
SAP SPI policy to SAP MP Policy Template Mapping This section maps SAP MPs policies to corresponding SAP SPI policies for the SAP ABAP Application Server. This section also lists the differences between them.
In the following table, the MP policy template marked with “*” supports logging of metrics.
HPOM Smart Plug-in Policy OMi Management Pack – Policy Template OMi Management Pack – Aspects
R3monal R3monchg R3moncts R3status R3mondev R3monpro R3mondisp R3mondmp R3monjob R3monlck R3monrfc R3monupd R3monusr R3monwpa
SAPABAP_VeryHigh SAP ABAP Base
Note A set of SPI schedule task policies are replaced with the single schedule task policy template SAPABAP_VeryHigh.
The schedule task policies r3monale and r3monaco is now replaced with SAPABAP_High.
R3monale R3monaco
SAPABAP_High
R3monspl SAPABAP_Medium
R3monspl SAPABAP_Low
SAP R3 opcmsg SAPABAP_Messages
Global_r3monjob SAPABAP_BatJobMon SAP ABAP Batch Job Health
Global_r3itosap SAPABAP_Configuration SAP ABAP Configuration
Global_r3moncts SAPABAP_CTSMon SAP ABAP Correction and Transport System Status
R3sdisc SAPABAP_Discovery SAP ABAP Discovery
Global_r3mondmp SAPABAP_DmpMon SAP ABAP Dump Status
Global_r3monale SAPABAP_IdocStatusMon SAP ABAP Idoc Status
Global_r3monlck SAPABAP_LckChkMon SAP ABAP Lock Status
Global_r3perfagent Global_r3perfstat
SAPABAP_PerfMon SAPABAP_StatRecMon
SAP ABAP Performance Monitor(*)

Evolution Guide Page 85
Global_r3mondisp Global_r3monproc
SAPABAP_DispMon SAPABAP_ProcMon
SAP ABAP Processes and Dispatcher Status
Global_r3monrfc SAPABAP_RFCDestMon SAP ABAP RFC Destination Status
N/A SAPABAP_RemoteConfiguration SAPABAP_RemoteDiscovery
SAP ABAP RemoteConfiguration
Global_r3monsec SAPABAP_SecMon SAP ABAP Security Status
Global_r3monspl SAPABAP_SplMon SAP ABAP Spool Health
Global_r3monchg SAPABAP_SysChgOptMon SAP ABAP System Change Option Status
Global_r3montra SAPABAP_TransMon SAP ABAP Transport Status
Global_r3monupd SAPABAP_UpdProcMon SAP ABAP Update Tasks Health
Global_r3monusr SAPABAP_UsrMon SAP ABAP User Health
Global_r3monwpa SAPABAP_WPMon SAP ABAP Work Process Health
Global_r3monal SAPABAP_CCMSIntegrationMon SAP CCMS Integration
Global_r3status Global_r3mondev
SAPABAP_StatusMon SAPABAP_TraceMon
SAP System Health
Global_r3monaco SAPABAP_TempSeqFileMon SAP Temporary Sequential File Monitoring
Global_r3monoms Dropped Not available as SAP MP does not support the obsoleted SAP versions
Configuration and Customization Mapping This section provides the mapping of SPI configuration done outside of policies and equivalent parameters in MP aspects. Use this mapping to reuse configuration and customization from SPI to MP.
Configuration Type Configuration and Customization Information in SAP SPI 12.05
Equivalent Configuration in SAP MP 1.0
Frequency parameter Modify the corresponding schedule file policy.
Modify the corresponding frequency parameter in the management template.
Parameters related to trace file, RFC timeout interval and DP Queue check Enablement
Modify the corresponding configuration file policy.
Modify the corresponding parameters in management template.
Placement of RFC library files to the instrumentation directory on the managed node
Use the tool (Install the RFC library) under SAP R/3 Admin tool group.
Manually copy the RFC library to the instrumentation directory on the managed node.
Discovery of SAP ABAP application server instances
Specify all the details required for the discovery in the configuration file. This is a completely manual task.
The SAP ABAP instances are automatically discovered. No inputs required.
Discovery and monitoring of remote SAP ABAP application Server instances
SAP remote instances are not discovered automatically. Specify the details on the remote instances in the configuration file and monitor those remote instances based on the input details.
Discovery of remote instances is available as a part of the RTSM view. Configuration of remote instances is done using the Aspect and monitoring is based on the input values in the aspect.
SAP High Availability Specify the input details required to monitor SAP High Availability environment in the configuration file.
All the inputs required to configure the SAP High availability systems are extracted automatically.
Discovery of SAP High Availability service tree
No support is available to discover the SAP High availability service view.
Separate view for SAP HA environment is available. The view shows the active SAP instances. Passive instances are not discovered.
Tools that invoke SAP GUI on the server Install separate SAPGUI software on the HPOM server to run the tools that display the SAP GUI.
Use a web interface to access SAP GUI from the MA server.
Creation of data source Data sources are created by executing the command manually on the managed node.
Data sources are created automatically as part of the background configuration.
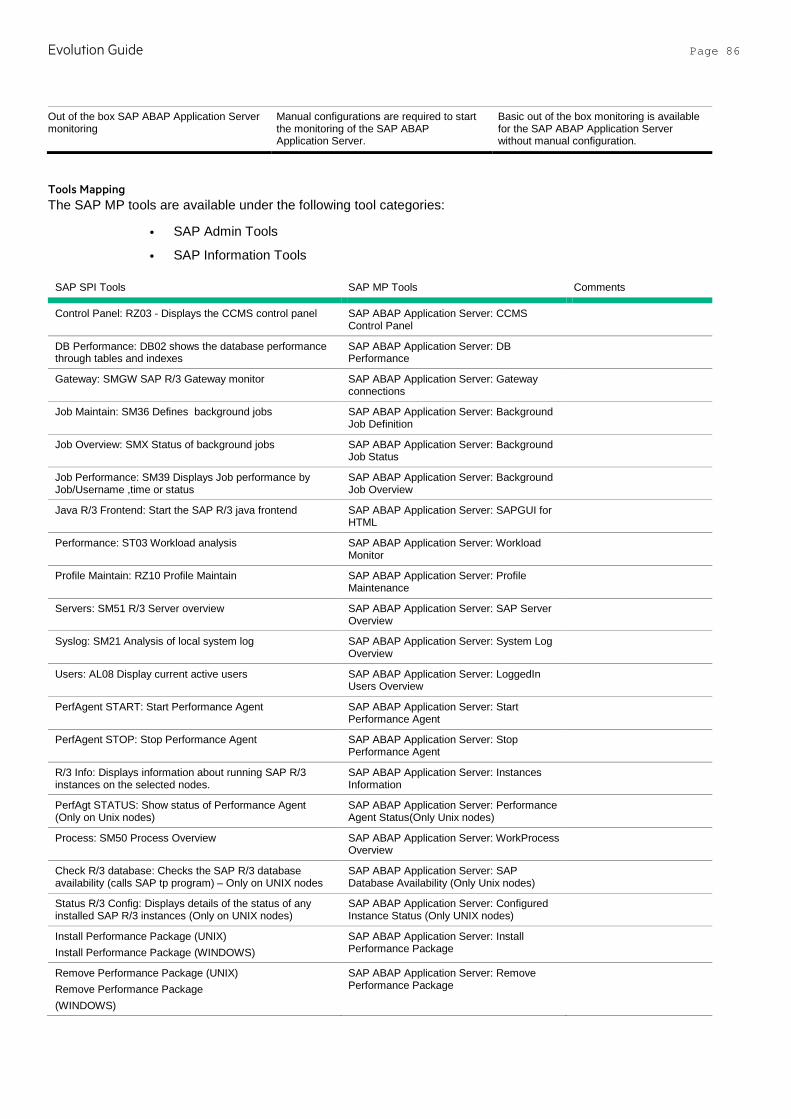
Evolution Guide Page 86
Out of the box SAP ABAP Application Server monitoring
Manual configurations are required to start the monitoring of the SAP ABAP Application Server.
Basic out of the box monitoring is available for the SAP ABAP Application Server without manual configuration.
Tools Mapping The SAP MP tools are available under the following tool categories:
• SAP Admin Tools
• SAP Information Tools
SAP SPI Tools SAP MP Tools Comments
Control Panel: RZ03 - Displays the CCMS control panel SAP ABAP Application Server: CCMS Control Panel
DB Performance: DB02 shows the database performance through tables and indexes
SAP ABAP Application Server: DB Performance
Gateway: SMGW SAP R/3 Gateway monitor SAP ABAP Application Server: Gateway connections
Job Maintain: SM36 Defines background jobs SAP ABAP Application Server: Background Job Definition
Job Overview: SMX Status of background jobs SAP ABAP Application Server: Background Job Status
Job Performance: SM39 Displays Job performance by Job/Username ,time or status
SAP ABAP Application Server: Background Job Overview
Java R/3 Frontend: Start the SAP R/3 java frontend SAP ABAP Application Server: SAPGUI for HTML
Performance: ST03 Workload analysis SAP ABAP Application Server: Workload Monitor
Profile Maintain: RZ10 Profile Maintain SAP ABAP Application Server: Profile Maintenance
Servers: SM51 R/3 Server overview SAP ABAP Application Server: SAP Server Overview
Syslog: SM21 Analysis of local system log SAP ABAP Application Server: System Log Overview
Users: AL08 Display current active users SAP ABAP Application Server: LoggedIn Users Overview
PerfAgent START: Start Performance Agent SAP ABAP Application Server: Start Performance Agent
PerfAgent STOP: Stop Performance Agent SAP ABAP Application Server: Stop Performance Agent
R/3 Info: Displays information about running SAP R/3 instances on the selected nodes.
SAP ABAP Application Server: Instances Information
PerfAgt STATUS: Show status of Performance Agent (Only on Unix nodes)
SAP ABAP Application Server: Performance Agent Status(Only Unix nodes)
Process: SM50 Process Overview SAP ABAP Application Server: WorkProcess Overview
Check R/3 database: Checks the SAP R/3 database availability (calls SAP tp program) – Only on UNIX nodes
SAP ABAP Application Server: SAP Database Availability (Only Unix nodes)
Status R/3 Config: Displays details of the status of any installed SAP R/3 instances (Only on UNIX nodes)
SAP ABAP Application Server: Configured Instance Status (Only UNIX nodes)
Install Performance Package (UNIX) Install Performance Package (WINDOWS)
SAP ABAP Application Server: Install Performance Package
Remove Performance Package (UNIX) Remove Performance Package (WINDOWS)
SAP ABAP Application Server: Remove Performance Package
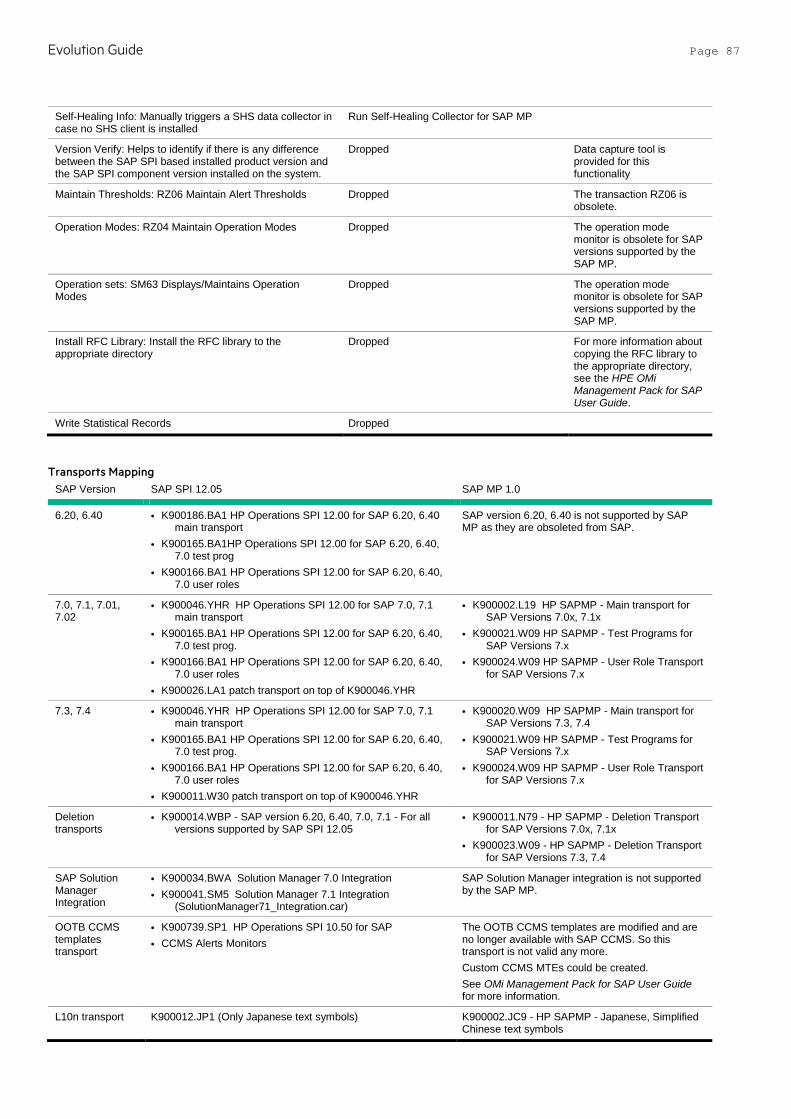
Evolution Guide Page 87
Self-Healing Info: Manually triggers a SHS data collector in case no SHS client is installed
Run Self-Healing Collector for SAP MP
Version Verify: Helps to identify if there is any difference between the SAP SPI based installed product version and the SAP SPI component version installed on the system.
Dropped Data capture tool is provided for this functionality
Maintain Thresholds: RZ06 Maintain Alert Thresholds Dropped The transaction RZ06 is obsolete.
Operation Modes: RZ04 Maintain Operation Modes Dropped The operation mode monitor is obsolete for SAP versions supported by the SAP MP.
Operation sets: SM63 Displays/Maintains Operation Modes
Dropped The operation mode monitor is obsolete for SAP versions supported by the SAP MP.
Install RFC Library: Install the RFC library to the appropriate directory
Dropped For more information about copying the RFC library to the appropriate directory, see the HPE OMi Management Pack for SAP User Guide.
Write Statistical Records Dropped
Transports Mapping SAP Version SAP SPI 12.05 SAP MP 1.0
6.20, 6.40 • K900186.BA1 HP Operations SPI 12.00 for SAP 6.20, 6.40 main transport
• K900165.BA1HP Operations SPI 12.00 for SAP 6.20, 6.40, 7.0 test prog
• K900166.BA1 HP Operations SPI 12.00 for SAP 6.20, 6.40, 7.0 user roles
SAP version 6.20, 6.40 is not supported by SAP MP as they are obsoleted from SAP.
7.0, 7.1, 7.01, 7.02
• K900046.YHR HP Operations SPI 12.00 for SAP 7.0, 7.1 main transport
• K900165.BA1 HP Operations SPI 12.00 for SAP 6.20, 6.40, 7.0 test prog.
• K900166.BA1 HP Operations SPI 12.00 for SAP 6.20, 6.40, 7.0 user roles
• K900026.LA1 patch transport on top of K900046.YHR
• K900002.L19 HP SAPMP - Main transport for SAP Versions 7.0x, 7.1x
• K900021.W09 HP SAPMP - Test Programs for SAP Versions 7.x
• K900024.W09 HP SAPMP - User Role Transport for SAP Versions 7.x
7.3, 7.4 • K900046.YHR HP Operations SPI 12.00 for SAP 7.0, 7.1 main transport
• K900165.BA1 HP Operations SPI 12.00 for SAP 6.20, 6.40, 7.0 test prog.
• K900166.BA1 HP Operations SPI 12.00 for SAP 6.20, 6.40, 7.0 user roles
• K900011.W30 patch transport on top of K900046.YHR
• K900020.W09 HP SAPMP - Main transport for SAP Versions 7.3, 7.4
• K900021.W09 HP SAPMP - Test Programs for SAP Versions 7.x
• K900024.W09 HP SAPMP - User Role Transport for SAP Versions 7.x
Deletion transports
• K900014.WBP - SAP version 6.20, 6.40, 7.0, 7.1 - For all versions supported by SAP SPI 12.05
• K900011.N79 - HP SAPMP - Deletion Transport for SAP Versions 7.0x, 7.1x
• K900023.W09 - HP SAPMP - Deletion Transport for SAP Versions 7.3, 7.4
SAP Solution Manager Integration
• K900034.BWA Solution Manager 7.0 Integration • K900041.SM5 Solution Manager 7.1 Integration
(SolutionManager71_Integration.car)
SAP Solution Manager integration is not supported by the SAP MP.
OOTB CCMS templates transport
• K900739.SP1 HP Operations SPI 10.50 for SAP • CCMS Alerts Monitors
The OOTB CCMS templates are modified and are no longer available with SAP CCMS. So this transport is not valid any more. Custom CCMS MTEs could be created. See OMi Management Pack for SAP User Guide for more information.
L10n transport K900012.JP1 (Only Japanese text symbols) K900002.JC9 - HP SAPMP - Japanese, Simplified Chinese text symbols
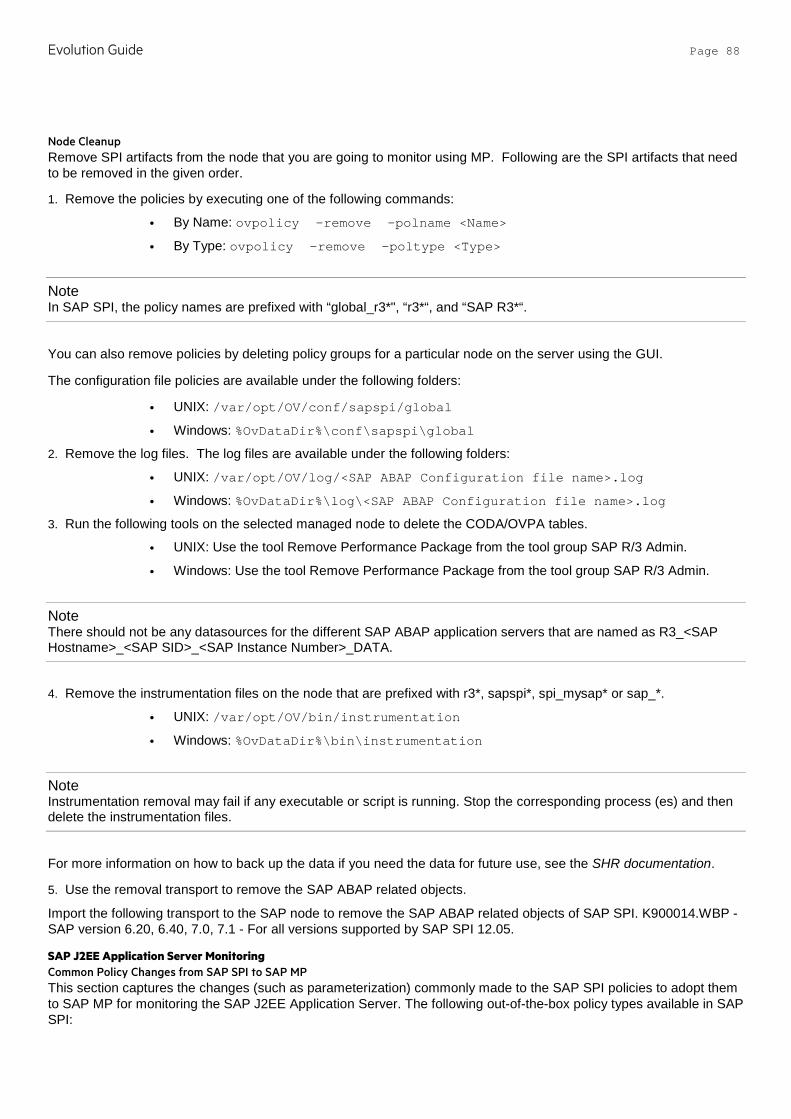
Evolution Guide Page 88
Node Cleanup Remove SPI artifacts from the node that you are going to monitor using MP. Following are the SPI artifacts that need to be removed in the given order.
1. Remove the policies by executing one of the following commands:
• By Name: ovpolicy –remove –polname <Name>
• By Type: ovpolicy –remove -poltype <Type>
Note In SAP SPI, the policy names are prefixed with “global_r3*", “r3*“, and “SAP R3*“.
You can also remove policies by deleting policy groups for a particular node on the server using the GUI.
The configuration file policies are available under the following folders:
• UNIX: /var/opt/OV/conf/sapspi/global
• Windows: %OvDataDir%\conf\sapspi\global
2. Remove the log files. The log files are available under the following folders:
• UNIX: /var/opt/OV/log/<SAP ABAP Configuration file name>.log
• Windows: %OvDataDir%\log\<SAP ABAP Configuration file name>.log
3. Run the following tools on the selected managed node to delete the CODA/OVPA tables.
• UNIX: Use the tool Remove Performance Package from the tool group SAP R/3 Admin.
• Windows: Use the tool Remove Performance Package from the tool group SAP R/3 Admin.
Note There should not be any datasources for the different SAP ABAP application servers that are named as R3_<SAP Hostname>_<SAP SID>_<SAP Instance Number>_DATA.
4. Remove the instrumentation files on the node that are prefixed with r3*, sapspi*, spi_mysap* or sap_*.
• UNIX: /var/opt/OV/bin/instrumentation
• Windows: %OvDataDir%\bin\instrumentation
Note Instrumentation removal may fail if any executable or script is running. Stop the corresponding process (es) and then delete the instrumentation files.
For more information on how to back up the data if you need the data for future use, see the SHR documentation.
5. Use the removal transport to remove the SAP ABAP related objects.
Import the following transport to the SAP node to remove the SAP ABAP related objects of SAP SPI. K900014.WBP - SAP version 6.20, 6.40, 7.0, 7.1 - For all versions supported by SAP SPI 12.05.
SAP J2EE Application Server Monitoring Common Policy Changes from SAP SPI to SAP MP This section captures the changes (such as parameterization) commonly made to the SAP SPI policies to adopt them to SAP MP for monitoring the SAP J2EE Application Server. The following out-of-the-box policy types available in SAP SPI:

Evolution Guide Page 89
• Measurement Threshold Policies
• Schedule Task Policies
• Service Auto Discovery Policy
Measurement Threshold Policies
Threshold and Severity
Threshold and severity are the most customized policy attributes for SAP J2EE Monitoring. In the SAP SPI, threshold and severity are defined in the measurement threshold policies. You can modify the threshold and severity by editing the policy based on your requirements. Each customization increments the policy version. With parameterization, you can define any attribute as a parameter and can modify the value during the deployment. With the SAP MP, threshold and severity are parameterized.
Example: There are two SAP J2EE Application Server instances ‘inst1’ and ‘inst2’ of SAP version 7.0 running on two different nodes. Both the instances have to be configured with different threshold and severity to monitor the average response time from the server.
SAP SPI SAP MP
On the first SAP J2EE Application Server instance:
1. Edit policy SPISAP_4004 to change the threshold or severity for inst1.
2. Save the policy.
3. Deploy this version of the policy on inst1. On the second SAP J2EE Application Server instance:
1. Edit the SPISAP_4004 and change the threshold/severity for inst2.
2. Save the policy.
3. Deploy policy SPISAP_4004 on inst2.
On both SAP J2EE Application Server instances: Tune the values of threshold and severity for SAPJ2EE_4004 during the deployment of the corresponding MT/Aspect on inst1 and inst2. Default values are set as per the SPISAP_4004 policy.
The following screenshots “Editing the severity and threshold parameters for policy SAPJ2EE_4004” shows the method used to edit the severity and threshold parameters in the SAP MP.
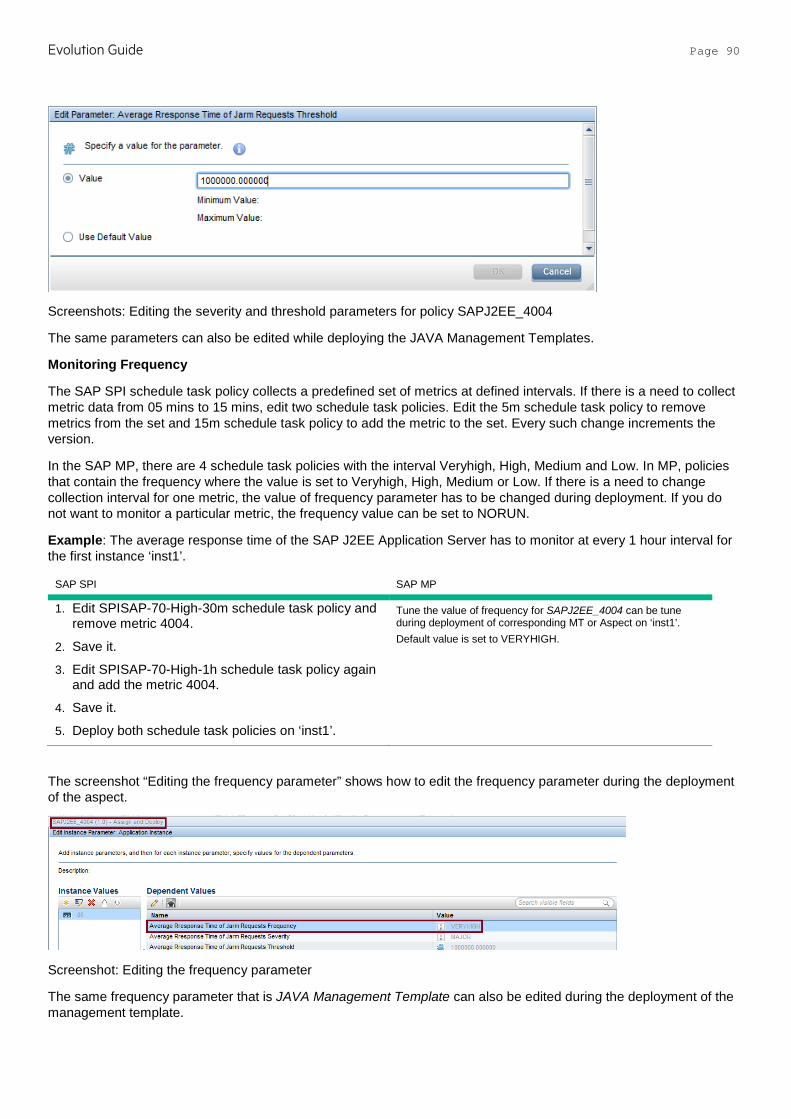
Evolution Guide Page 90
Screenshots: Editing the severity and threshold parameters for policy SAPJ2EE_4004
The same parameters can also be edited while deploying the JAVA Management Templates.
Monitoring Frequency
The SAP SPI schedule task policy collects a predefined set of metrics at defined intervals. If there is a need to collect metric data from 05 mins to 15 mins, edit two schedule task policies. Edit the 5m schedule task policy to remove metrics from the set and 15m schedule task policy to add the metric to the set. Every such change increments the version.
In the SAP MP, there are 4 schedule task policies with the interval Veryhigh, High, Medium and Low. In MP, policies that contain the frequency where the value is set to Veryhigh, High, Medium or Low. If there is a need to change collection interval for one metric, the value of frequency parameter has to be changed during deployment. If you do not want to monitor a particular metric, the frequency value can be set to NORUN.
Example: The average response time of the SAP J2EE Application Server has to monitor at every 1 hour interval for the first instance ‘inst1’.
SAP SPI SAP MP
1. Edit SPISAP-70-High-30m schedule task policy and remove metric 4004.
2. Save it.
3. Edit SPISAP-70-High-1h schedule task policy again and add the metric 4004.
4. Save it.
5. Deploy both schedule task policies on ‘inst1’.
Tune the value of frequency for SAPJ2EE_4004 can be tune during deployment of corresponding MT or Aspect on ‘inst1’. Default value is set to VERYHIGH.
The screenshot “Editing the frequency parameter” shows how to edit the frequency parameter during the deployment of the aspect.
Screenshot: Editing the frequency parameter
The same frequency parameter that is JAVA Management Template can also be edited during the deployment of the management template.
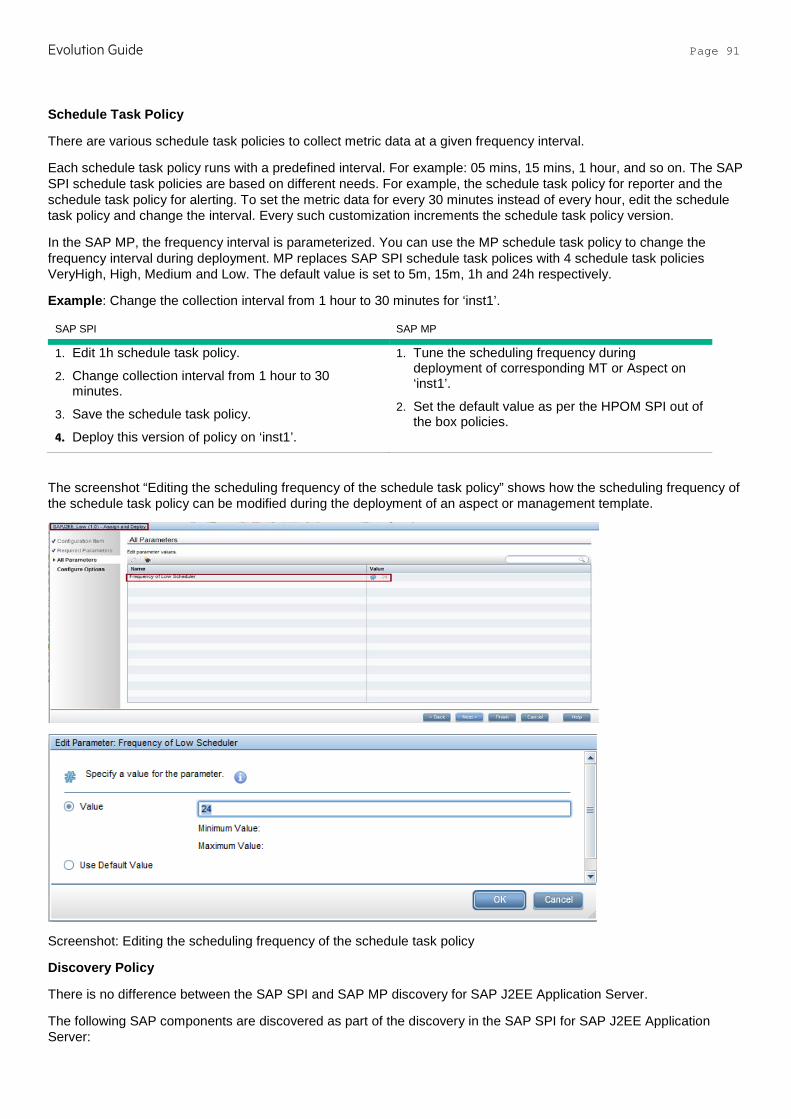
Evolution Guide Page 91
Schedule Task Policy
There are various schedule task policies to collect metric data at a given frequency interval.
Each schedule task policy runs with a predefined interval. For example: 05 mins, 15 mins, 1 hour, and so on. The SAP SPI schedule task policies are based on different needs. For example, the schedule task policy for reporter and the schedule task policy for alerting. To set the metric data for every 30 minutes instead of every hour, edit the schedule task policy and change the interval. Every such customization increments the schedule task policy version.
In the SAP MP, the frequency interval is parameterized. You can use the MP schedule task policy to change the frequency interval during deployment. MP replaces SAP SPI schedule task polices with 4 schedule task policies VeryHigh, High, Medium and Low. The default value is set to 5m, 15m, 1h and 24h respectively.
Example: Change the collection interval from 1 hour to 30 minutes for ‘inst1’.
SAP SPI SAP MP
1. Edit 1h schedule task policy.
2. Change collection interval from 1 hour to 30 minutes.
3. Save the schedule task policy.
4. Deploy this version of policy on ‘inst1’.
1. Tune the scheduling frequency during deployment of corresponding MT or Aspect on ‘inst1’.
2. Set the default value as per the HPOM SPI out of the box policies.
The screenshot “Editing the scheduling frequency of the schedule task policy” shows how the scheduling frequency of the schedule task policy can be modified during the deployment of an aspect or management template.
Screenshot: Editing the scheduling frequency of the schedule task policy
Discovery Policy
There is no difference between the SAP SPI and SAP MP discovery for SAP J2EE Application Server.
The following SAP components are discovered as part of the discovery in the SAP SPI for SAP J2EE Application Server:
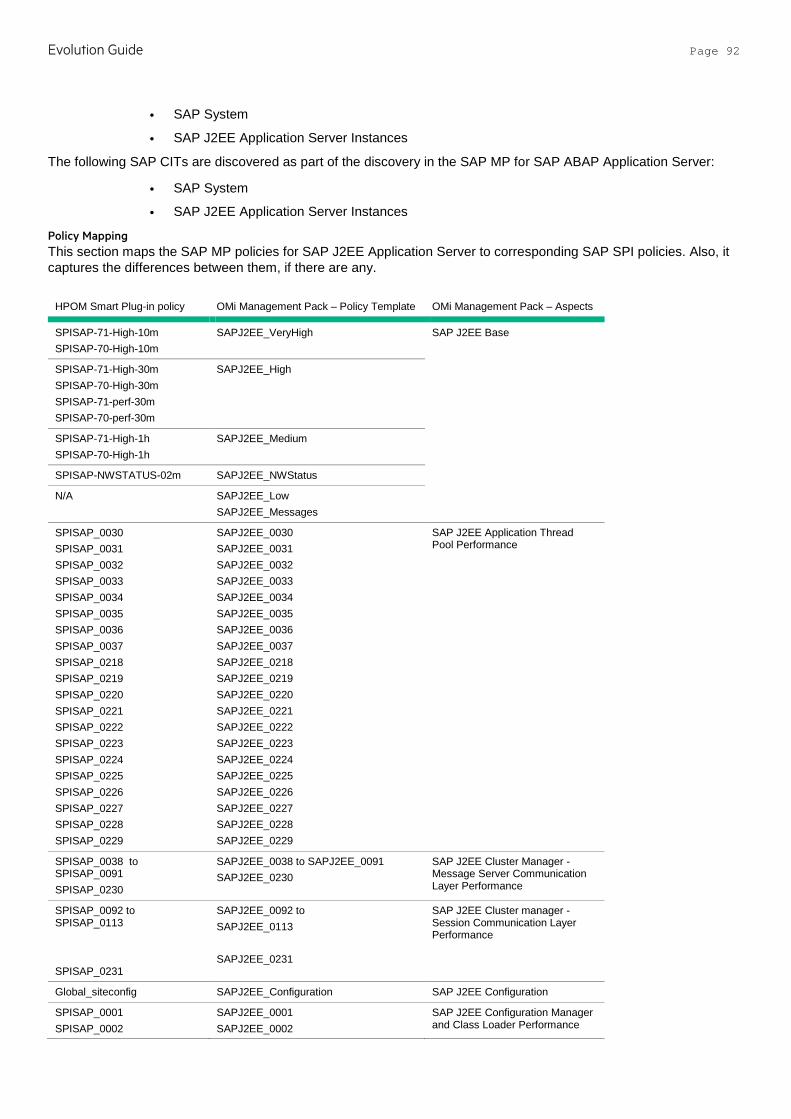
Evolution Guide Page 92
• SAP System
• SAP J2EE Application Server Instances
The following SAP CITs are discovered as part of the discovery in the SAP MP for SAP ABAP Application Server:
• SAP System
• SAP J2EE Application Server Instances
Policy Mapping This section maps the SAP MP policies for SAP J2EE Application Server to corresponding SAP SPI policies. Also, it captures the differences between them, if there are any.
HPOM Smart Plug-in policy OMi Management Pack – Policy Template OMi Management Pack – Aspects
SPISAP-71-High-10m SPISAP-70-High-10m
SAPJ2EE_VeryHigh SAP J2EE Base
SPISAP-71-High-30m SPISAP-70-High-30m SPISAP-71-perf-30m SPISAP-70-perf-30m
SAPJ2EE_High
SPISAP-71-High-1h SPISAP-70-High-1h
SAPJ2EE_Medium
SPISAP-NWSTATUS-02m SAPJ2EE_NWStatus
N/A SAPJ2EE_Low SAPJ2EE_Messages
SPISAP_0030 SPISAP_0031 SPISAP_0032 SPISAP_0033 SPISAP_0034 SPISAP_0035 SPISAP_0036 SPISAP_0037 SPISAP_0218 SPISAP_0219 SPISAP_0220 SPISAP_0221 SPISAP_0222 SPISAP_0223 SPISAP_0224 SPISAP_0225 SPISAP_0226 SPISAP_0227 SPISAP_0228 SPISAP_0229
SAPJ2EE_0030 SAPJ2EE_0031 SAPJ2EE_0032 SAPJ2EE_0033 SAPJ2EE_0034 SAPJ2EE_0035 SAPJ2EE_0036 SAPJ2EE_0037 SAPJ2EE_0218 SAPJ2EE_0219 SAPJ2EE_0220 SAPJ2EE_0221 SAPJ2EE_0222 SAPJ2EE_0223 SAPJ2EE_0224 SAPJ2EE_0225 SAPJ2EE_0226 SAPJ2EE_0227 SAPJ2EE_0228 SAPJ2EE_0229
SAP J2EE Application Thread Pool Performance
SPISAP_0038 to SPISAP_0091 SPISAP_0230
SAPJ2EE_0038 to SAPJ2EE_0091 SAPJ2EE_0230
SAP J2EE Cluster Manager - Message Server Communication Layer Performance
SPISAP_0092 to SPISAP_0113 SPISAP_0231
SAPJ2EE_0092 to SAPJ2EE_0113 SAPJ2EE_0231
SAP J2EE Cluster manager - Session Communication Layer Performance
Global_siteconfig SAPJ2EE_Configuration SAP J2EE Configuration
SPISAP_0001 SPISAP_0002
SAPJ2EE_0001 SAPJ2EE_0002
SAP J2EE Configuration Manager and Class Loader Performance
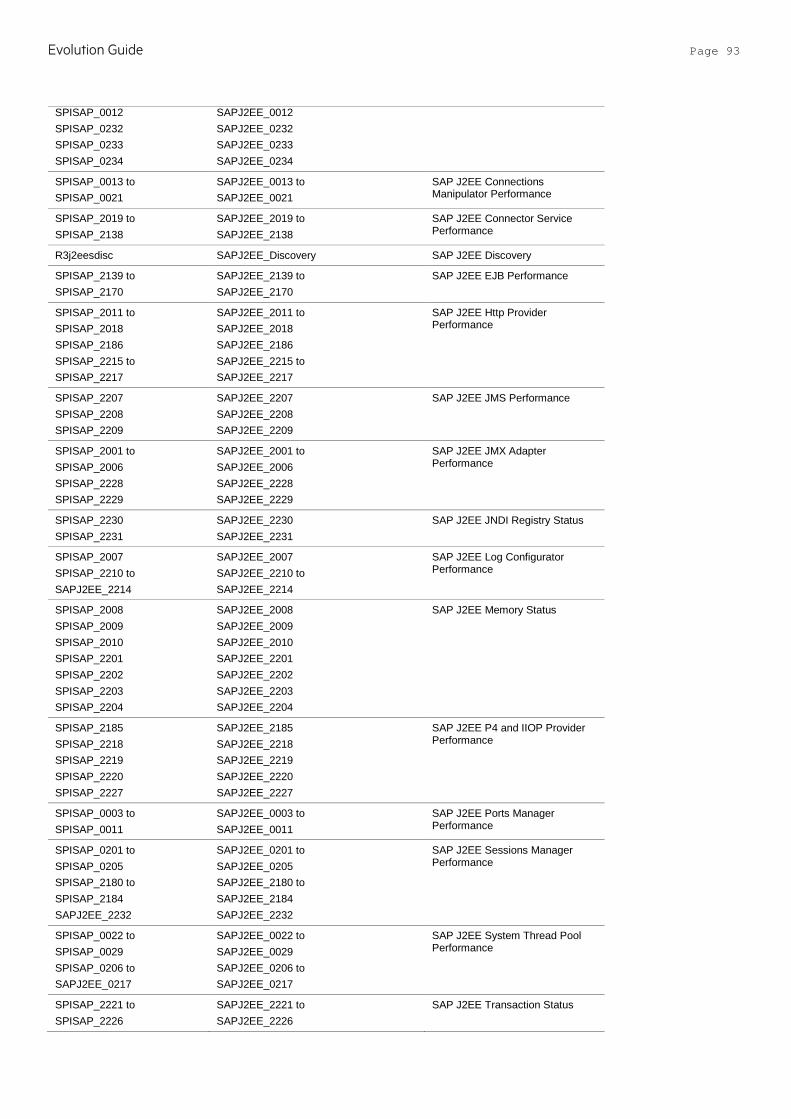
Evolution Guide Page 93
SPISAP_0012 SPISAP_0232 SPISAP_0233 SPISAP_0234
SAPJ2EE_0012 SAPJ2EE_0232 SAPJ2EE_0233 SAPJ2EE_0234
SPISAP_0013 to SPISAP_0021
SAPJ2EE_0013 to SAPJ2EE_0021
SAP J2EE Connections Manipulator Performance
SPISAP_2019 to SPISAP_2138
SAPJ2EE_2019 to SAPJ2EE_2138
SAP J2EE Connector Service Performance
R3j2eesdisc SAPJ2EE_Discovery SAP J2EE Discovery
SPISAP_2139 to SPISAP_2170
SAPJ2EE_2139 to SAPJ2EE_2170
SAP J2EE EJB Performance
SPISAP_2011 to SPISAP_2018 SPISAP_2186 SPISAP_2215 to SPISAP_2217
SAPJ2EE_2011 to SAPJ2EE_2018 SAPJ2EE_2186 SAPJ2EE_2215 to SAPJ2EE_2217
SAP J2EE Http Provider Performance
SPISAP_2207 SPISAP_2208 SPISAP_2209
SAPJ2EE_2207 SAPJ2EE_2208 SAPJ2EE_2209
SAP J2EE JMS Performance
SPISAP_2001 to SPISAP_2006 SPISAP_2228 SPISAP_2229
SAPJ2EE_2001 to SAPJ2EE_2006 SAPJ2EE_2228 SAPJ2EE_2229
SAP J2EE JMX Adapter Performance
SPISAP_2230 SPISAP_2231
SAPJ2EE_2230 SAPJ2EE_2231
SAP J2EE JNDI Registry Status
SPISAP_2007 SPISAP_2210 to SAPJ2EE_2214
SAPJ2EE_2007 SAPJ2EE_2210 to SAPJ2EE_2214
SAP J2EE Log Configurator Performance
SPISAP_2008 SPISAP_2009 SPISAP_2010 SPISAP_2201 SPISAP_2202 SPISAP_2203 SPISAP_2204
SAPJ2EE_2008 SAPJ2EE_2009 SAPJ2EE_2010 SAPJ2EE_2201 SAPJ2EE_2202 SAPJ2EE_2203 SAPJ2EE_2204
SAP J2EE Memory Status
SPISAP_2185 SPISAP_2218 SPISAP_2219 SPISAP_2220 SPISAP_2227
SAPJ2EE_2185 SAPJ2EE_2218 SAPJ2EE_2219 SAPJ2EE_2220 SAPJ2EE_2227
SAP J2EE P4 and IIOP Provider Performance
SPISAP_0003 to SPISAP_0011
SAPJ2EE_0003 to SAPJ2EE_0011
SAP J2EE Ports Manager Performance
SPISAP_0201 to SPISAP_0205 SPISAP_2180 to SPISAP_2184 SAPJ2EE_2232
SAPJ2EE_0201 to SAPJ2EE_0205 SAPJ2EE_2180 to SAPJ2EE_2184 SAPJ2EE_2232
SAP J2EE Sessions Manager Performance
SPISAP_0022 to SPISAP_0029 SPISAP_0206 to SAPJ2EE_0217
SAPJ2EE_0022 to SAPJ2EE_0029 SAPJ2EE_0206 to SAPJ2EE_0217
SAP J2EE System Thread Pool Performance
SPISAP_2221 to SPISAP_2226
SAPJ2EE_2221 to SAPJ2EE_2226
SAP J2EE Transaction Status
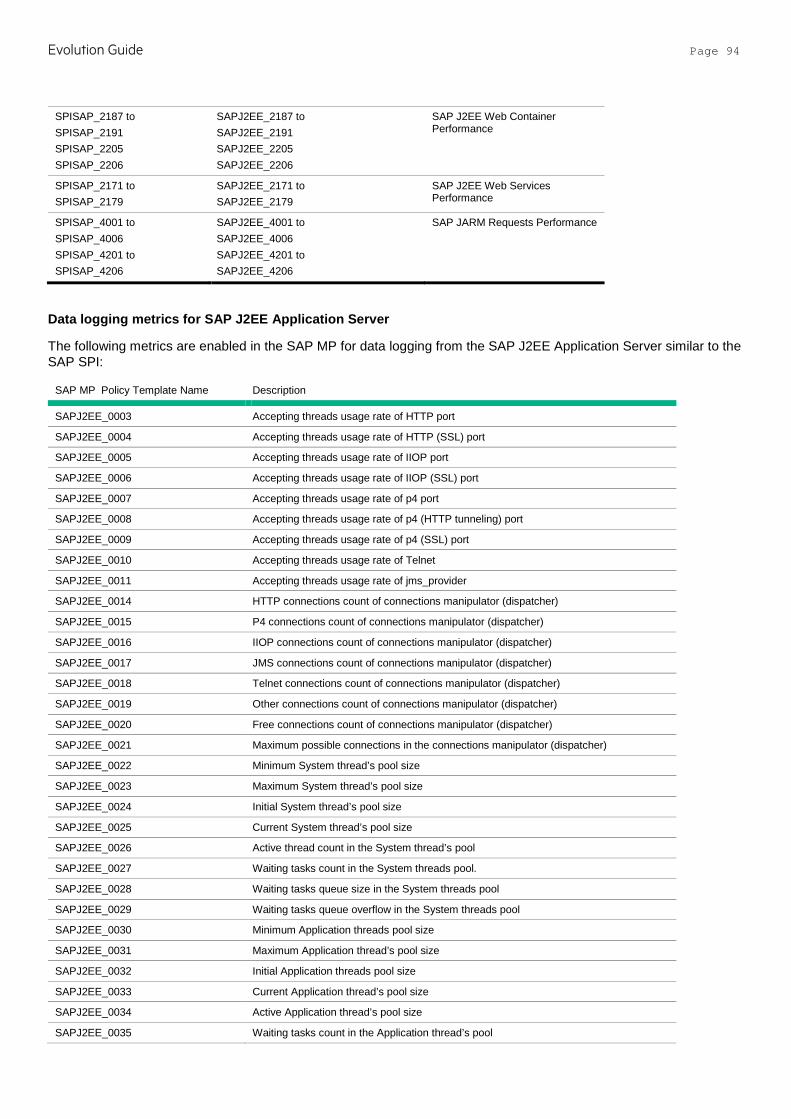
Evolution Guide Page 94
SPISAP_2187 to SPISAP_2191 SPISAP_2205 SPISAP_2206
SAPJ2EE_2187 to SAPJ2EE_2191 SAPJ2EE_2205 SAPJ2EE_2206
SAP J2EE Web Container Performance
SPISAP_2171 to SPISAP_2179
SAPJ2EE_2171 to SAPJ2EE_2179
SAP J2EE Web Services Performance
SPISAP_4001 to SPISAP_4006 SPISAP_4201 to SPISAP_4206
SAPJ2EE_4001 to SAPJ2EE_4006 SAPJ2EE_4201 to SAPJ2EE_4206
SAP JARM Requests Performance
Data logging metrics for SAP J2EE Application Server
The following metrics are enabled in the SAP MP for data logging from the SAP J2EE Application Server similar to the SAP SPI:
SAP MP Policy Template Name Description
SAPJ2EE_0003 Accepting threads usage rate of HTTP port
SAPJ2EE_0004 Accepting threads usage rate of HTTP (SSL) port
SAPJ2EE_0005 Accepting threads usage rate of IIOP port
SAPJ2EE_0006 Accepting threads usage rate of IIOP (SSL) port
SAPJ2EE_0007 Accepting threads usage rate of p4 port
SAPJ2EE_0008 Accepting threads usage rate of p4 (HTTP tunneling) port
SAPJ2EE_0009 Accepting threads usage rate of p4 (SSL) port
SAPJ2EE_0010 Accepting threads usage rate of Telnet
SAPJ2EE_0011 Accepting threads usage rate of jms_provider
SAPJ2EE_0014 HTTP connections count of connections manipulator (dispatcher)
SAPJ2EE_0015 P4 connections count of connections manipulator (dispatcher)
SAPJ2EE_0016 IIOP connections count of connections manipulator (dispatcher)
SAPJ2EE_0017 JMS connections count of connections manipulator (dispatcher)
SAPJ2EE_0018 Telnet connections count of connections manipulator (dispatcher)
SAPJ2EE_0019 Other connections count of connections manipulator (dispatcher)
SAPJ2EE_0020 Free connections count of connections manipulator (dispatcher)
SAPJ2EE_0021 Maximum possible connections in the connections manipulator (dispatcher)
SAPJ2EE_0022 Minimum System thread’s pool size
SAPJ2EE_0023 Maximum System thread’s pool size
SAPJ2EE_0024 Initial System thread’s pool size
SAPJ2EE_0025 Current System thread’s pool size
SAPJ2EE_0026 Active thread count in the System thread’s pool
SAPJ2EE_0027 Waiting tasks count in the System threads pool.
SAPJ2EE_0028 Waiting tasks queue size in the System threads pool
SAPJ2EE_0029 Waiting tasks queue overflow in the System threads pool
SAPJ2EE_0030 Minimum Application threads pool size
SAPJ2EE_0031 Maximum Application thread’s pool size
SAPJ2EE_0032 Initial Application threads pool size
SAPJ2EE_0033 Current Application thread’s pool size
SAPJ2EE_0034 Active Application thread’s pool size
SAPJ2EE_0035 Waiting tasks count in the Application thread’s pool
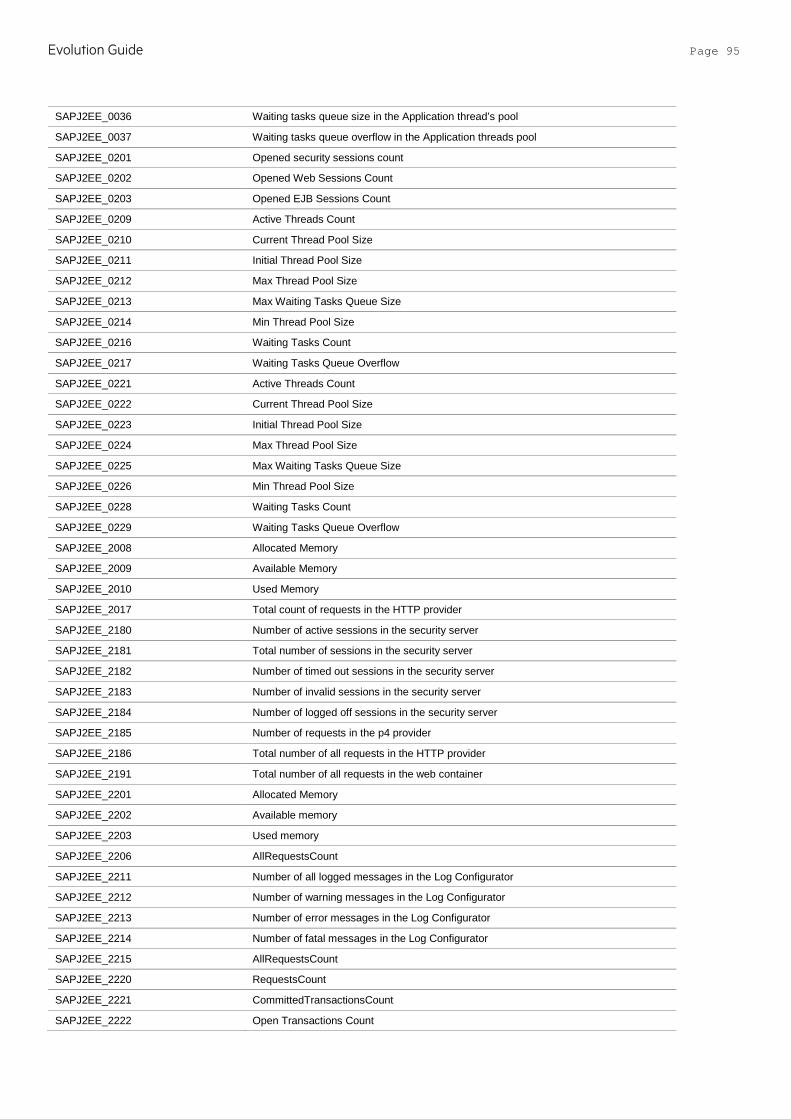
Evolution Guide Page 95
SAPJ2EE_0036 Waiting tasks queue size in the Application thread’s pool
SAPJ2EE_0037 Waiting tasks queue overflow in the Application threads pool
SAPJ2EE_0201 Opened security sessions count
SAPJ2EE_0202 Opened Web Sessions Count
SAPJ2EE_0203 Opened EJB Sessions Count
SAPJ2EE_0209 Active Threads Count
SAPJ2EE_0210 Current Thread Pool Size
SAPJ2EE_0211 Initial Thread Pool Size
SAPJ2EE_0212 Max Thread Pool Size
SAPJ2EE_0213 Max Waiting Tasks Queue Size
SAPJ2EE_0214 Min Thread Pool Size
SAPJ2EE_0216 Waiting Tasks Count
SAPJ2EE_0217 Waiting Tasks Queue Overflow
SAPJ2EE_0221 Active Threads Count
SAPJ2EE_0222 Current Thread Pool Size
SAPJ2EE_0223 Initial Thread Pool Size
SAPJ2EE_0224 Max Thread Pool Size
SAPJ2EE_0225 Max Waiting Tasks Queue Size
SAPJ2EE_0226 Min Thread Pool Size
SAPJ2EE_0228 Waiting Tasks Count
SAPJ2EE_0229 Waiting Tasks Queue Overflow
SAPJ2EE_2008 Allocated Memory
SAPJ2EE_2009 Available Memory
SAPJ2EE_2010 Used Memory
SAPJ2EE_2017 Total count of requests in the HTTP provider
SAPJ2EE_2180 Number of active sessions in the security server
SAPJ2EE_2181 Total number of sessions in the security server
SAPJ2EE_2182 Number of timed out sessions in the security server
SAPJ2EE_2183 Number of invalid sessions in the security server
SAPJ2EE_2184 Number of logged off sessions in the security server
SAPJ2EE_2185 Number of requests in the p4 provider
SAPJ2EE_2186 Total number of all requests in the HTTP provider
SAPJ2EE_2191 Total number of all requests in the web container
SAPJ2EE_2201 Allocated Memory
SAPJ2EE_2202 Available memory
SAPJ2EE_2203 Used memory
SAPJ2EE_2206 AllRequestsCount
SAPJ2EE_2211 Number of all logged messages in the Log Configurator
SAPJ2EE_2212 Number of warning messages in the Log Configurator
SAPJ2EE_2213 Number of error messages in the Log Configurator
SAPJ2EE_2214 Number of fatal messages in the Log Configurator
SAPJ2EE_2215 AllRequestsCount
SAPJ2EE_2220 RequestsCount
SAPJ2EE_2221 CommittedTransactionsCount
SAPJ2EE_2222 Open Transactions Count
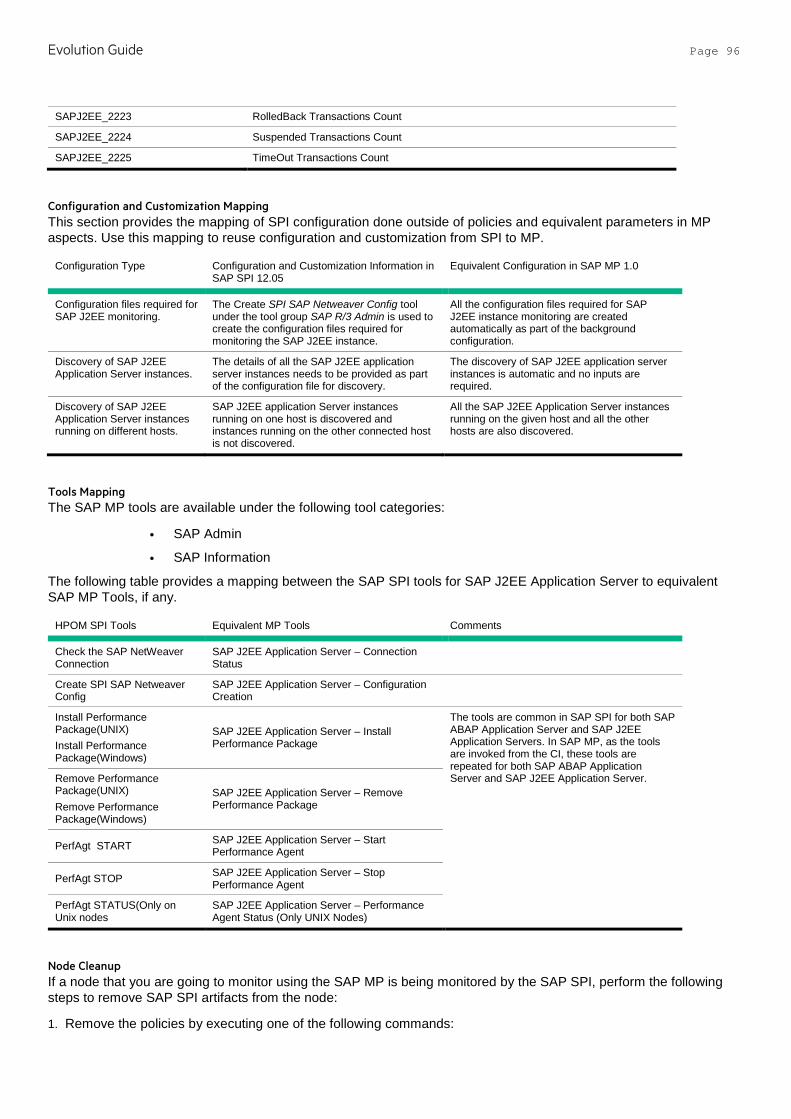
Evolution Guide Page 96
SAPJ2EE_2223 RolledBack Transactions Count
SAPJ2EE_2224 Suspended Transactions Count
SAPJ2EE_2225 TimeOut Transactions Count
Configuration and Customization Mapping This section provides the mapping of SPI configuration done outside of policies and equivalent parameters in MP aspects. Use this mapping to reuse configuration and customization from SPI to MP.
Configuration Type Configuration and Customization Information in SAP SPI 12.05
Equivalent Configuration in SAP MP 1.0
Configuration files required for SAP J2EE monitoring.
The Create SPI SAP Netweaver Config tool under the tool group SAP R/3 Admin is used to create the configuration files required for monitoring the SAP J2EE instance.
All the configuration files required for SAP J2EE instance monitoring are created automatically as part of the background configuration.
Discovery of SAP J2EE Application Server instances.
The details of all the SAP J2EE application server instances needs to be provided as part of the configuration file for discovery.
The discovery of SAP J2EE application server instances is automatic and no inputs are required.
Discovery of SAP J2EE Application Server instances running on different hosts.
SAP J2EE application Server instances running on one host is discovered and instances running on the other connected host is not discovered.
All the SAP J2EE Application Server instances running on the given host and all the other hosts are also discovered.
Tools Mapping The SAP MP tools are available under the following tool categories:
• SAP Admin
• SAP Information
The following table provides a mapping between the SAP SPI tools for SAP J2EE Application Server to equivalent SAP MP Tools, if any.
HPOM SPI Tools Equivalent MP Tools Comments
Check the SAP NetWeaver Connection
SAP J2EE Application Server – Connection Status
Create SPI SAP Netweaver Config
SAP J2EE Application Server – Configuration Creation
Install Performance Package(UNIX) Install Performance Package(Windows)
SAP J2EE Application Server – Install Performance Package
The tools are common in SAP SPI for both SAP ABAP Application Server and SAP J2EE Application Servers. In SAP MP, as the tools are invoked from the CI, these tools are repeated for both SAP ABAP Application Server and SAP J2EE Application Server. Remove Performance
Package(UNIX) Remove Performance Package(Windows)
SAP J2EE Application Server – Remove Performance Package
PerfAgt START SAP J2EE Application Server – Start Performance Agent
PerfAgt STOP SAP J2EE Application Server – Stop Performance Agent
PerfAgt STATUS(Only on Unix nodes
SAP J2EE Application Server – Performance Agent Status (Only UNIX Nodes)
Node Cleanup If a node that you are going to monitor using the SAP MP is being monitored by the SAP SPI, perform the following steps to remove SAP SPI artifacts from the node:
1. Remove the policies by executing one of the following commands:
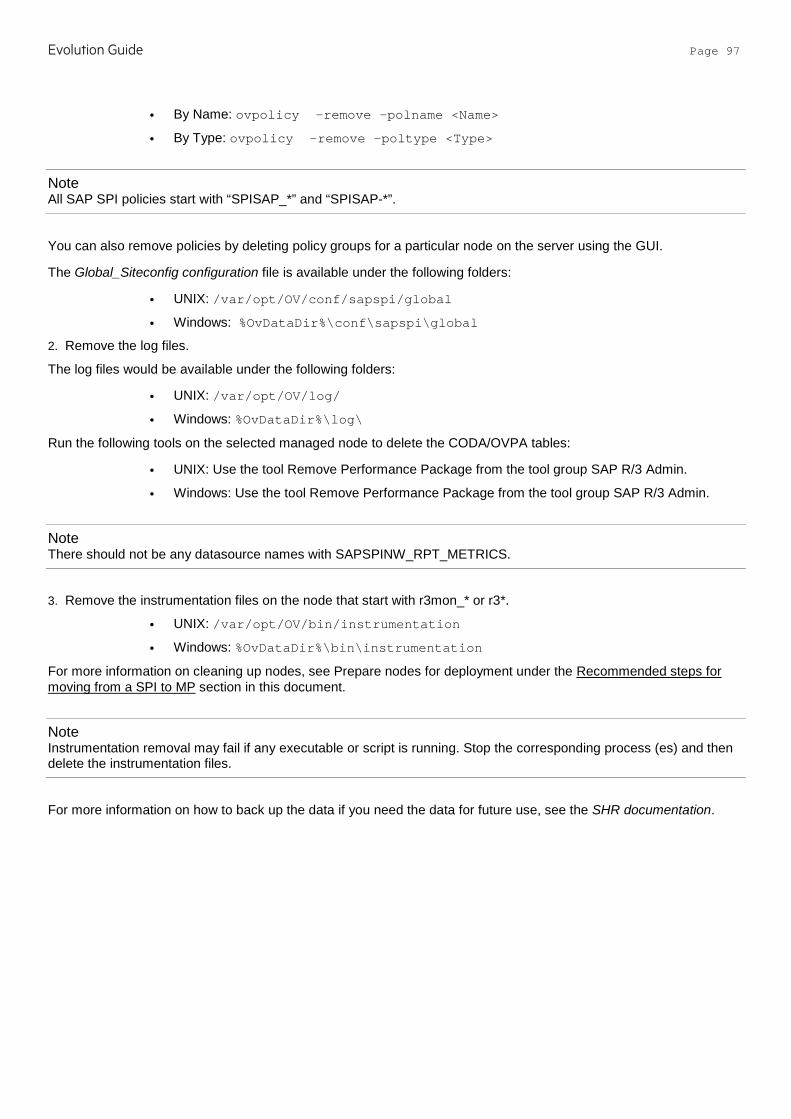
Evolution Guide Page 97
• By Name: ovpolicy -remove –polname <Name>
• By Type: ovpolicy -remove –poltype <Type>
Note All SAP SPI policies start with “SPISAP_*” and “SPISAP-*”.
You can also remove policies by deleting policy groups for a particular node on the server using the GUI.
The Global_Siteconfig configuration file is available under the following folders:
• UNIX: /var/opt/OV/conf/sapspi/global
• Windows: %OvDataDir%\conf\sapspi\global
2. Remove the log files.
The log files would be available under the following folders:
• UNIX: /var/opt/OV/log/
• Windows: %OvDataDir%\log\
Run the following tools on the selected managed node to delete the CODA/OVPA tables:
• UNIX: Use the tool Remove Performance Package from the tool group SAP R/3 Admin.
• Windows: Use the tool Remove Performance Package from the tool group SAP R/3 Admin.
Note There should not be any datasource names with SAPSPINW_RPT_METRICS.
3. Remove the instrumentation files on the node that start with r3mon_* or r3*.
• UNIX: /var/opt/OV/bin/instrumentation
• Windows: %OvDataDir%\bin\instrumentation
For more information on cleaning up nodes, see Prepare nodes for deployment under the Recommended steps for moving from a SPI to MP section in this document.
Note Instrumentation removal may fail if any executable or script is running. Stop the corresponding process (es) and then delete the instrumentation files.
For more information on how to back up the data if you need the data for future use, see the SHR documentation.
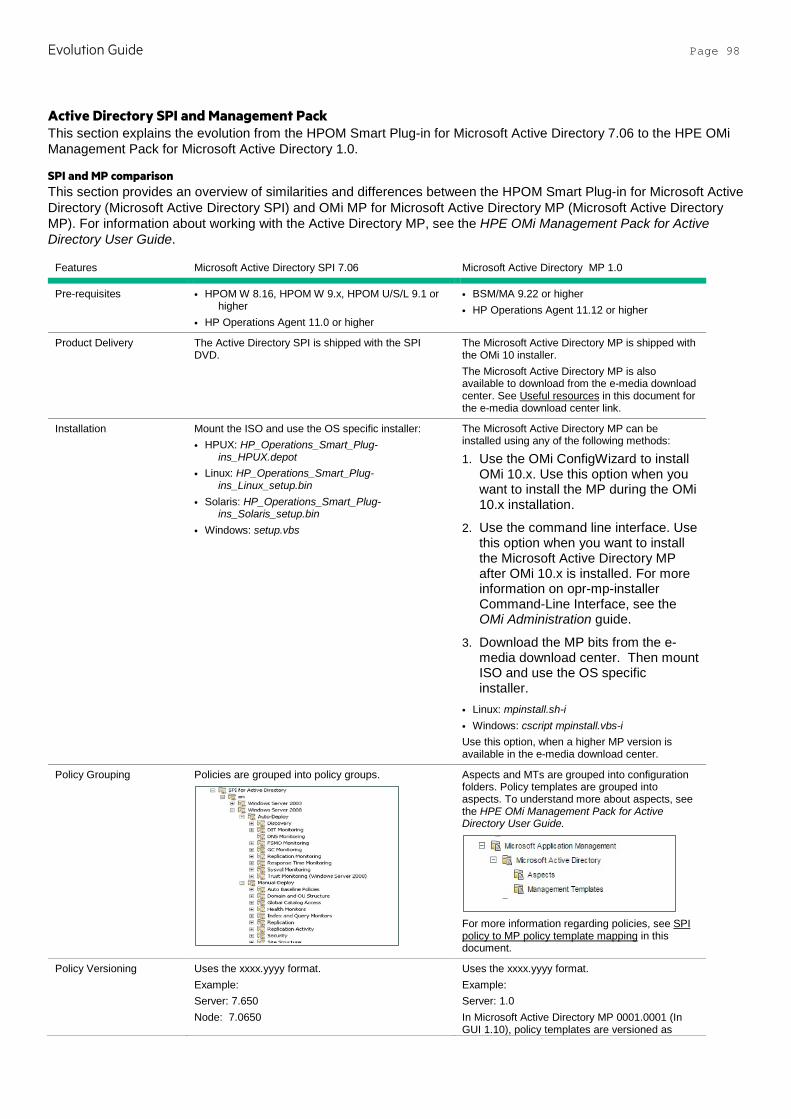
Evolution Guide Page 98
Active Directory SPI and Management Pack This section explains the evolution from the HPOM Smart Plug-in for Microsoft Active Directory 7.06 to the HPE OMi Management Pack for Microsoft Active Directory 1.0.
SPI and MP comparison This section provides an overview of similarities and differences between the HPOM Smart Plug-in for Microsoft Active Directory (Microsoft Active Directory SPI) and OMi MP for Microsoft Active Directory MP (Microsoft Active Directory MP). For information about working with the Active Directory MP, see the HPE OMi Management Pack for Active Directory User Guide.
Features Microsoft Active Directory SPI 7.06 Microsoft Active Directory MP 1.0
Pre-requisites • HPOM W 8.16, HPOM W 9.x, HPOM U/S/L 9.1 or higher
• HP Operations Agent 11.0 or higher
• BSM/MA 9.22 or higher • HP Operations Agent 11.12 or higher
Product Delivery The Active Directory SPI is shipped with the SPI DVD.
The Microsoft Active Directory MP is shipped with the OMi 10 installer. The Microsoft Active Directory MP is also available to download from the e-media download center. See Useful resources in this document for the e-media download center link.
Installation Mount the ISO and use the OS specific installer: • HPUX: HP_Operations_Smart_Plug-
ins_HPUX.depot • Linux: HP_Operations_Smart_Plug-
ins_Linux_setup.bin • Solaris: HP_Operations_Smart_Plug-
ins_Solaris_setup.bin • Windows: setup.vbs
The Microsoft Active Directory MP can be installed using any of the following methods:
1. Use the OMi ConfigWizard to install OMi 10.x. Use this option when you want to install the MP during the OMi 10.x installation.
2. Use the command line interface. Use this option when you want to install the Microsoft Active Directory MP after OMi 10.x is installed. For more information on opr-mp-installer Command-Line Interface, see the OMi Administration guide.
3. Download the MP bits from the e-media download center. Then mount ISO and use the OS specific installer.
• Linux: mpinstall.sh-i • Windows: cscript mpinstall.vbs-i Use this option, when a higher MP version is available in the e-media download center.
Policy Grouping Policies are grouped into policy groups.
Aspects and MTs are grouped into configuration folders. Policy templates are grouped into aspects. To understand more about aspects, see the HPE OMi Management Pack for Active Directory User Guide.
For more information regarding policies, see SPI policy to MP policy template mapping in this document.
Policy Versioning Uses the xxxx.yyyy format. Example: Server: 7.650 Node: 7.0650
Uses the xxxx.yyyy format. Example: Server: 1.0 In Microsoft Active Directory MP 0001.0001 (In GUI 1.10), policy templates are versioned as

Evolution Guide Page 99
When SPI version is 7.06, policies updated in this release would be versioned as 0007.0650. On the GUI, it is visible as 7.650. When you update such a policy, only minor versions (Last two digits) should be updated. Example: When you update a policy with version 0007.0650 (in GUI: 7.650), it will be changed to 7.650.0001 (in GUI 7.651).
0001.0000. On the OMi GUI, it is displayed as 1.0. In subsequent MP releases, policy template version is updated only if a particular policy is updated in that release. When you update a policy, only minor versions (last two digits) should be updated. Example: When you update a policy with version 0001.0000 (in GUI 1.0), it will be changed to 0001.0001 (in GUI 1.1).
Policy Types Has policies of the following types: • Measurement Threshold • Scheduled Task • Windows Event Log • Windows Management Instrumentation • Discovery
Has policy templates of the following types: • Measurement Threshold • Scheduled Task • Windows Event Log • Windows Management Instrumentation • Discovery • Config File Template
Message Groups SPI has Message Groups to generate events such as MICROSOFT ACTIVE DIRECTORY SPI.
The Microsoft Active Directory MP does not have Message Groups.
Tools Following are the tools in Microsoft Active Directory SPI: • AD DC Demotion Preparation • AD Trust Relationships • Check ADS Service • Delete Older ADSPI Classes • Operations Topology Viewer • Self-Healing Info • Self-Healing Verification
The Microsoft Active Directory MP has lesser number of tools. Topology Viewer and Self-Healing Info tools are not available. For more information about the mapping of tools between SPI and MP, see Tools Mapping in this document.
Instrumentation Following are the instrumentation categories: • ActiveDirectory_Core • ActiveDirectory_Discovery HPOM Server: SPI Instrumentation is copied into the filesystem. Node: SPI Instrumentation is deployed to the Instrumentation directory on the node.
Instrumentation categories in MP: MSAD-Core OMi Server: Instrumentation is uploaded into the OMi database. To know more on how to upload Instrumentation for MPs, see the OMi Management Pack Development Guide. Node: There is no difference with the instrumentation location on nodes. Instrumentation is deployed to the same directories as the SPIs. Most of the instrumentation filenames are retained. A few instrumentation files have been changed. The ADSPI prefix or suffix has been removed for a few instrumentation files and have been replaced with MSAD or ADMP. A new set of instrumentation files is introduced with this MP for monitoring, logging and alerting on performance counter and service status related metrics. These binaries start with prefix of Ms. For example, MsCollectionManager.exe.
Discovery Deploy the ADSPI_Discovery policy to a managed node. When the deployment of the Discovery policy is successful, the discovered instances are shown in the service map.
Deploy the Microsoft AD Discovery aspect on the managed node. Successful deployment of Discovery aspect populates discovered instances as appropriate CIs in the RTSM. List of discovered CIs: • Active Directory Forest • Active Directory Site • Domain Controller Roles • Domain Controller • Windows Host
Configuration Deploy the ADSPI-CreateDatasources to create ADSPI Data source.
Datasource creation is done as a part of the Microsoft AD Discovery aspect.
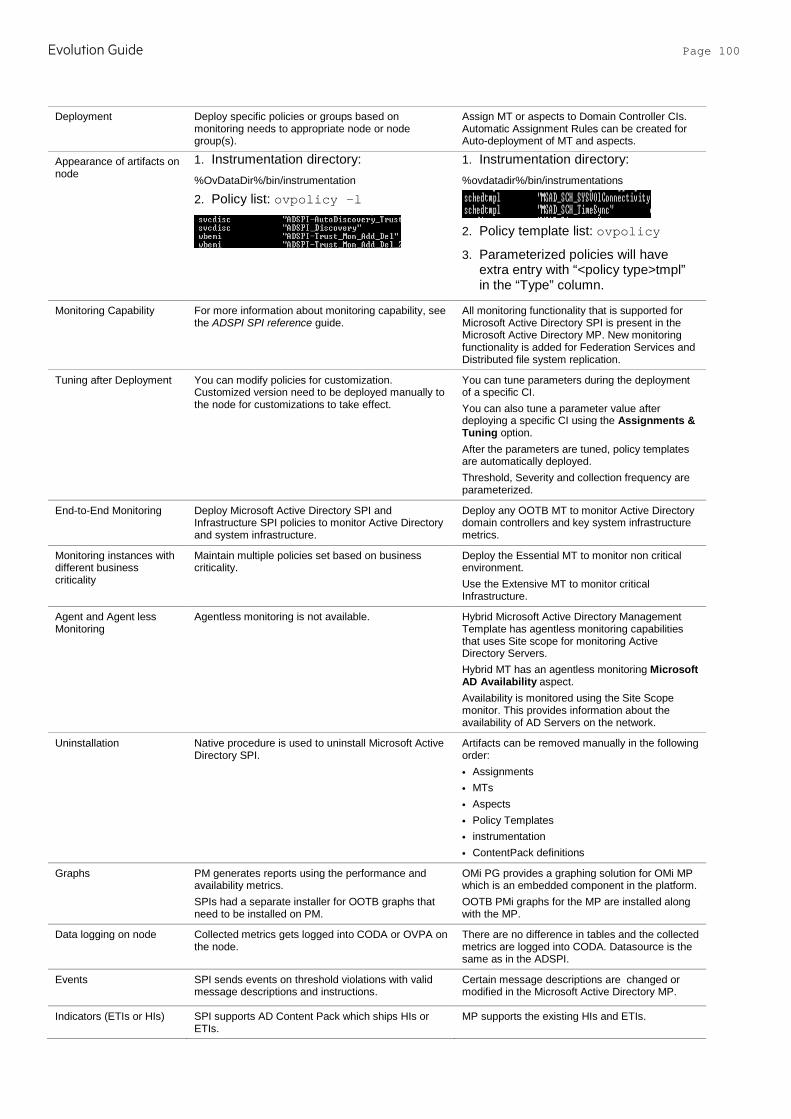
Evolution Guide Page 100
Deployment Deploy specific policies or groups based on monitoring needs to appropriate node or node group(s).
Assign MT or aspects to Domain Controller CIs. Automatic Assignment Rules can be created for Auto-deployment of MT and aspects.
Appearance of artifacts on node
1. Instrumentation directory: %OvDataDir%/bin/instrumentation
2. Policy list: ovpolicy –l
1. Instrumentation directory: %ovdatadir%/bin/instrumentations
2. Policy template list: ovpolicy
3. Parameterized policies will have extra entry with “<policy type>tmpl” in the “Type” column.
Monitoring Capability
For more information about monitoring capability, see the ADSPI SPI reference guide.
All monitoring functionality that is supported for Microsoft Active Directory SPI is present in the Microsoft Active Directory MP. New monitoring functionality is added for Federation Services and Distributed file system replication.
Tuning after Deployment You can modify policies for customization. Customized version need to be deployed manually to the node for customizations to take effect.
You can tune parameters during the deployment of a specific CI. You can also tune a parameter value after deploying a specific CI using the Assignments & Tuning option. After the parameters are tuned, policy templates are automatically deployed. Threshold, Severity and collection frequency are parameterized.
End-to-End Monitoring Deploy Microsoft Active Directory SPI and Infrastructure SPI policies to monitor Active Directory and system infrastructure.
Deploy any OOTB MT to monitor Active Directory domain controllers and key system infrastructure metrics.
Monitoring instances with different business criticality
Maintain multiple policies set based on business criticality.
Deploy the Essential MT to monitor non critical environment. Use the Extensive MT to monitor critical Infrastructure.
Agent and Agent less Monitoring
Agentless monitoring is not available. Hybrid Microsoft Active Directory Management Template has agentless monitoring capabilities that uses Site scope for monitoring Active Directory Servers. Hybrid MT has an agentless monitoring Microsoft AD Availability aspect. Availability is monitored using the Site Scope monitor. This provides information about the availability of AD Servers on the network.
Uninstallation Native procedure is used to uninstall Microsoft Active Directory SPI.
Artifacts can be removed manually in the following order: • Assignments • MTs • Aspects • Policy Templates • instrumentation • ContentPack definitions
Graphs PM generates reports using the performance and availability metrics. SPIs had a separate installer for OOTB graphs that need to be installed on PM.
OMi PG provides a graphing solution for OMi MP which is an embedded component in the platform. OOTB PMi graphs for the MP are installed along with the MP.
Data logging on node Collected metrics gets logged into CODA or OVPA on the node.
There are no difference in tables and the collected metrics are logged into CODA. Datasource is the same as in the ADSPI.
Events
SPI sends events on threshold violations with valid message descriptions and instructions.
Certain message descriptions are changed or modified in the Microsoft Active Directory MP.
Indicators (ETIs or HIs) SPI supports AD Content Pack which ships HIs or ETIs.
MP supports the existing HIs and ETIs.
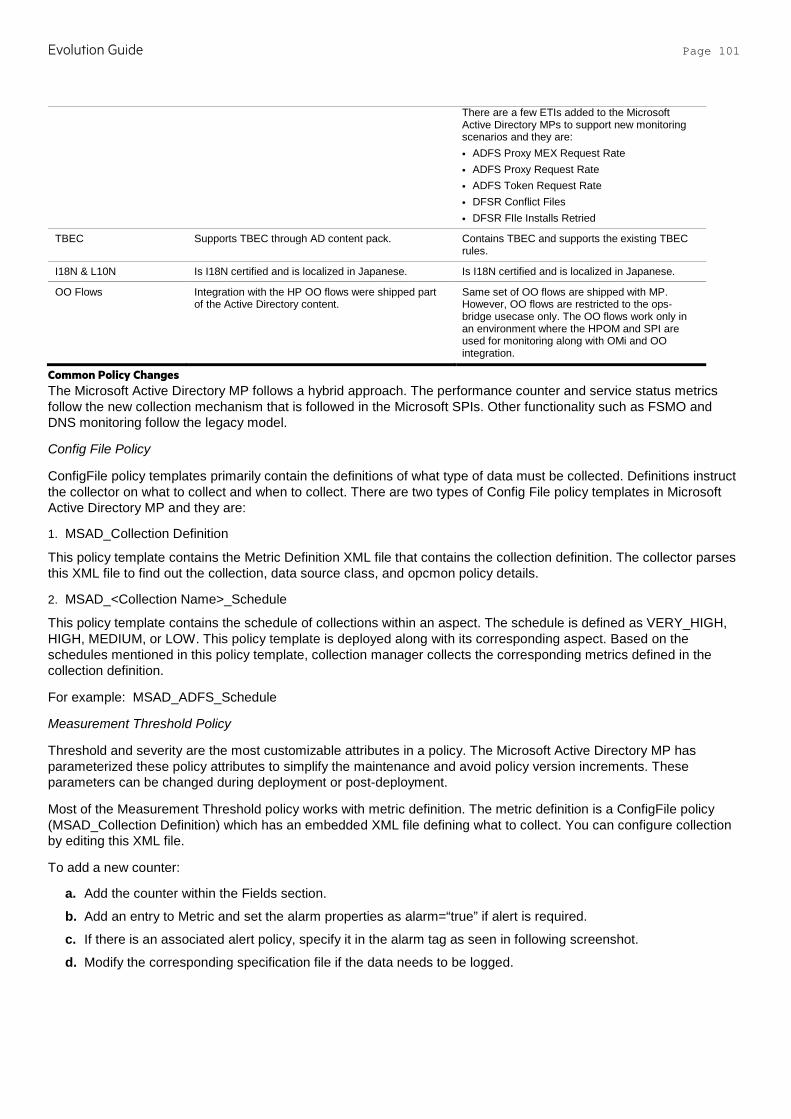
Evolution Guide Page 101
There are a few ETIs added to the Microsoft Active Directory MPs to support new monitoring scenarios and they are: • ADFS Proxy MEX Request Rate • ADFS Proxy Request Rate • ADFS Token Request Rate • DFSR Conflict Files • DFSR FIle Installs Retried
TBEC Supports TBEC through AD content pack. Contains TBEC and supports the existing TBEC rules.
I18N & L10N Is I18N certified and is localized in Japanese. Is I18N certified and is localized in Japanese.
OO Flows Integration with the HP OO flows were shipped part of the Active Directory content.
Same set of OO flows are shipped with MP. However, OO flows are restricted to the ops-bridge usecase only. The OO flows work only in an environment where the HPOM and SPI are used for monitoring along with OMi and OO integration.
Common Policy Changes The Microsoft Active Directory MP follows a hybrid approach. The performance counter and service status metrics follow the new collection mechanism that is followed in the Microsoft SPIs. Other functionality such as FSMO and DNS monitoring follow the legacy model.
Config File Policy
ConfigFile policy templates primarily contain the definitions of what type of data must be collected. Definitions instruct the collector on what to collect and when to collect. There are two types of Config File policy templates in Microsoft Active Directory MP and they are:
1. MSAD_Collection Definition
This policy template contains the Metric Definition XML file that contains the collection definition. The collector parses this XML file to find out the collection, data source class, and opcmon policy details.
2. MSAD_<Collection Name>_Schedule
This policy template contains the schedule of collections within an aspect. The schedule is defined as VERY_HIGH, HIGH, MEDIUM, or LOW. This policy template is deployed along with its corresponding aspect. Based on the schedules mentioned in this policy template, collection manager collects the corresponding metrics defined in the collection definition.
For example: MSAD_ADFS_Schedule
Measurement Threshold Policy
Threshold and severity are the most customizable attributes in a policy. The Microsoft Active Directory MP has parameterized these policy attributes to simplify the maintenance and avoid policy version increments. These parameters can be changed during deployment or post-deployment.
Most of the Measurement Threshold policy works with metric definition. The metric definition is a ConfigFile policy (MSAD_Collection Definition) which has an embedded XML file defining what to collect. You can configure collection by editing this XML file.
To add a new counter:
a. Add the counter within the Fields section.
b. Add an entry to Metric and set the alarm properties as alarm=“true” if alert is required.
c. If there is an associated alert policy, specify it in the alarm tag as seen in following screenshot.
d. Modify the corresponding specification file if the data needs to be logged.
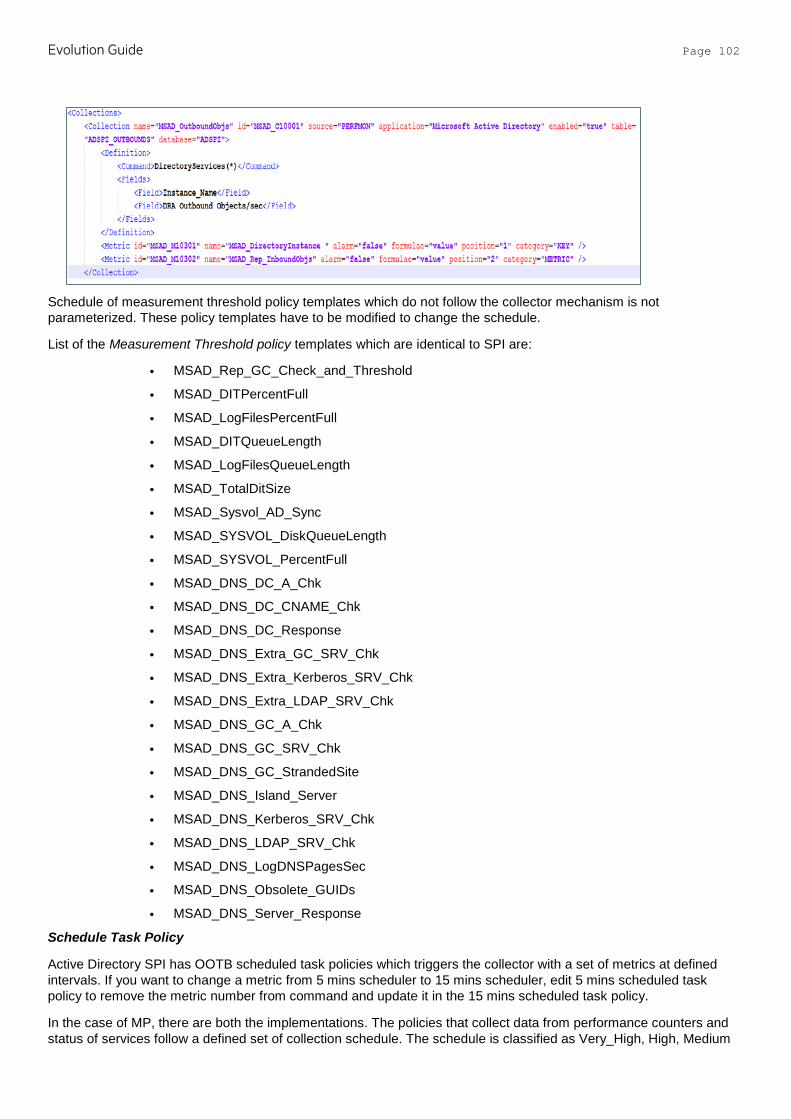
Evolution Guide Page 102
Schedule of measurement threshold policy templates which do not follow the collector mechanism is not parameterized. These policy templates have to be modified to change the schedule.
List of the Measurement Threshold policy templates which are identical to SPI are:
• MSAD_Rep_GC_Check_and_Threshold
• MSAD_DITPercentFull
• MSAD_LogFilesPercentFull
• MSAD_DITQueueLength
• MSAD_LogFilesQueueLength
• MSAD_TotalDitSize
• MSAD_Sysvol_AD_Sync
• MSAD_SYSVOL_DiskQueueLength
• MSAD_SYSVOL_PercentFull
• MSAD_DNS_DC_A_Chk
• MSAD_DNS_DC_CNAME_Chk
• MSAD_DNS_DC_Response
• MSAD_DNS_Extra_GC_SRV_Chk
• MSAD_DNS_Extra_Kerberos_SRV_Chk
• MSAD_DNS_Extra_LDAP_SRV_Chk
• MSAD_DNS_GC_A_Chk
• MSAD_DNS_GC_SRV_Chk
• MSAD_DNS_GC_StrandedSite
• MSAD_DNS_Island_Server
• MSAD_DNS_Kerberos_SRV_Chk
• MSAD_DNS_LDAP_SRV_Chk
• MSAD_DNS_LogDNSPagesSec
• MSAD_DNS_Obsolete_GUIDs
• MSAD_DNS_Server_Response
Schedule Task Policy
Active Directory SPI has OOTB scheduled task policies which triggers the collector with a set of metrics at defined intervals. If you want to change a metric from 5 mins scheduler to 15 mins scheduler, edit 5 mins scheduled task policy to remove the metric number from command and update it in the 15 mins scheduled task policy.
In the case of MP, there are both the implementations. The policies that collect data from performance counters and status of services follow a defined set of collection schedule. The schedule is classified as Very_High, High, Medium
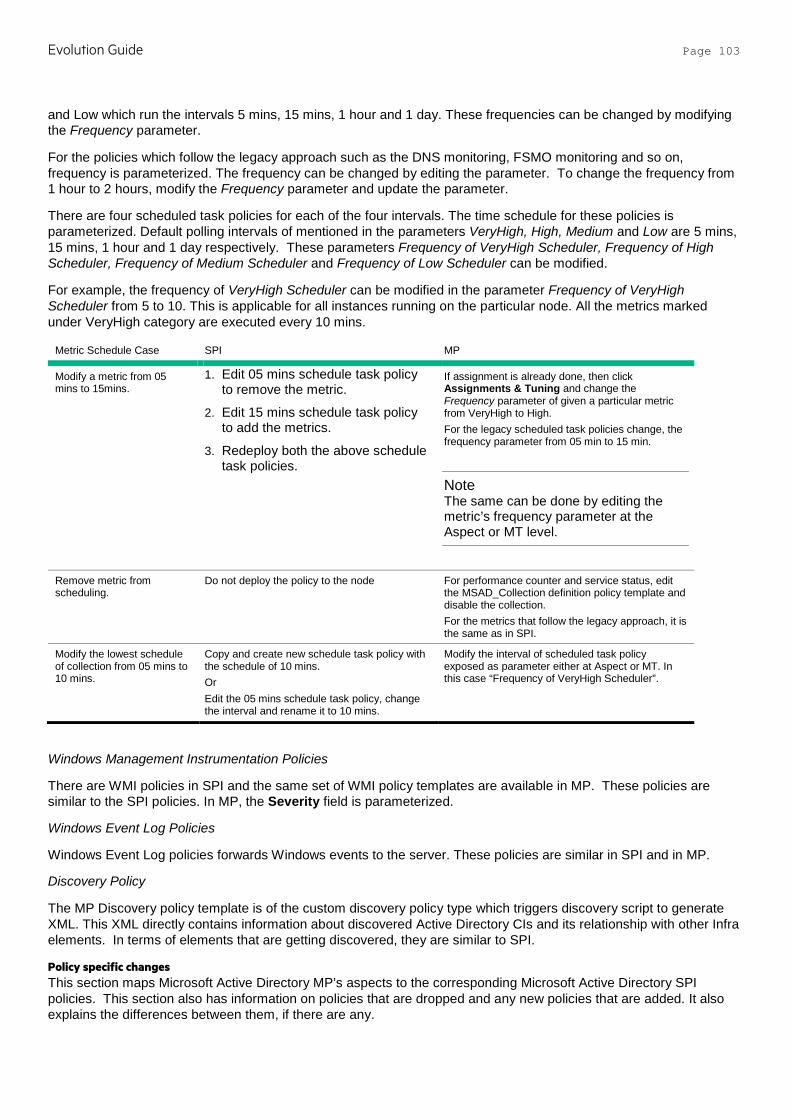
Evolution Guide Page 103
and Low which run the intervals 5 mins, 15 mins, 1 hour and 1 day. These frequencies can be changed by modifying the Frequency parameter.
For the policies which follow the legacy approach such as the DNS monitoring, FSMO monitoring and so on, frequency is parameterized. The frequency can be changed by editing the parameter. To change the frequency from 1 hour to 2 hours, modify the Frequency parameter and update the parameter.
There are four scheduled task policies for each of the four intervals. The time schedule for these policies is parameterized. Default polling intervals of mentioned in the parameters VeryHigh, High, Medium and Low are 5 mins, 15 mins, 1 hour and 1 day respectively. These parameters Frequency of VeryHigh Scheduler, Frequency of High Scheduler, Frequency of Medium Scheduler and Frequency of Low Scheduler can be modified.
For example, the frequency of VeryHigh Scheduler can be modified in the parameter Frequency of VeryHigh Scheduler from 5 to 10. This is applicable for all instances running on the particular node. All the metrics marked under VeryHigh category are executed every 10 mins.
Metric Schedule Case SPI MP
Modify a metric from 05 mins to 15mins.
1. Edit 05 mins schedule task policy to remove the metric.
2. Edit 15 mins schedule task policy to add the metrics.
3. Redeploy both the above schedule task policies.
If assignment is already done, then click Assignments & Tuning and change the Frequency parameter of given a particular metric from VeryHigh to High. For the legacy scheduled task policies change, the frequency parameter from 05 min to 15 min.
Note The same can be done by editing the metric’s frequency parameter at the Aspect or MT level.
Remove metric from scheduling.
Do not deploy the policy to the node For performance counter and service status, edit the MSAD_Collection definition policy template and disable the collection. For the metrics that follow the legacy approach, it is the same as in SPI.
Modify the lowest schedule of collection from 05 mins to 10 mins.
Copy and create new schedule task policy with the schedule of 10 mins. Or Edit the 05 mins schedule task policy, change the interval and rename it to 10 mins.
Modify the interval of scheduled task policy exposed as parameter either at Aspect or MT. In this case “Frequency of VeryHigh Scheduler”.
Windows Management Instrumentation Policies
There are WMI policies in SPI and the same set of WMI policy templates are available in MP. These policies are similar to the SPI policies. In MP, the Severity field is parameterized.
Windows Event Log Policies
Windows Event Log policies forwards Windows events to the server. These policies are similar in SPI and in MP.
Discovery Policy
The MP Discovery policy template is of the custom discovery policy type which triggers discovery script to generate XML. This XML directly contains information about discovered Active Directory CIs and its relationship with other Infra elements. In terms of elements that are getting discovered, they are similar to SPI.
Policy specific changes This section maps Microsoft Active Directory MP’s aspects to the corresponding Microsoft Active Directory SPI policies. This section also has information on policies that are dropped and any new policies that are added. It also explains the differences between them, if there are any.

Evolution Guide Page 104
Apart from the common changes that have been captured in the previous section, following are the policy specific changes. Some of the policies present in Microsoft Active Directory SPI have been split into multiple policies in Microsoft Active Directory MP. This has been done to have a higher level of control and granularity.
SPI Policy MP Policy Template Comments
ADSPI-GC_CheckStatus_2K8+ MSAD_GCMonitorStatus, MSAD_SCH_GCCheckStatus
Schedule and the alert functionality is split into two policies.
ADSPI-Rep_MonitorInterSiteReplication_2K8+
MSAD_Rep_MonitorIntraSiteReplication MSAD_SCH_IntraSiteReplication
ADSPI-Rep_MonitorIntraSiteReplication_2K8+
MSAD_Rep_MonitorInterSiteReplication MSAD_SCH_InterSiteReplication
ADSPI-Rep_TimeSync_2K8+ MSAD_SCH_TimeSync MSAD_Rep_TimeSync
ADSPI_DNSServ_FwdAllWarnError_2K8+
MSAD_DNSServ_FwdAllWarn MSAD_DNSServ_FwdAllError
Split the events to different policies to avoid noise.
ADSPI_FwdAllWarnErrorDS_2K8+ MSAD_FwdAllIWarnDS MSAD_FwdAllIErrorDS
ADSPI_FwdAllWarnErrorFRS_2K8+ MSAD_FwdAllIWarnFRS MSAD_FwdAllIErrorFRS
Microsoft Active Directory SPI policies that are not present in Microsoft Active Directory MP The following table lists policies that are not present in the Microsoft Active Directory MP:
Microsoft Active Directory SPI Policy Type
Active Directory SPI Policy Name Comments
Windows Event Log ADSPI_SMTPEventlogs_2K8+ ADSPI-Sysvol_FRS_2K8+
Removed to reduce noise.
Measurement Threshold
ADSPI_ADSRepNotifyQueueSize_2K8+ ADSPI-Rep_OutboundObjs_2K8+ ADSPI_HMThreadsInUse_2K8+
Removed to reduce noise.
Note Outbound objects are collected and logged. Only the Eventing policy has been removed.
Windows Management Instrumentation
ADSPI-Rep_CheckObj_2K8+ ADSPI_Trust_Mon_Modify_2K8+ ADSPI_SiteChanges_2K8+ ADSPI_DirUserCreationDeletionModification_2K8+
Removed to reduce noise.
New Policies that are added in Microsoft Active Directory MP Config File Policies
For aspects that monitors service availability or performance counters, there will be one config file policy present in that aspect. This has the collection ID and collection schedule to map collection to frequency. This information is used by the Collection Manager.
Config file policy is also used as a collection definition policy. In this case, it will contain a list of definitions on what to collect, where to log, and the associated opcmon policy for generating alerts.
Policy Name Comments
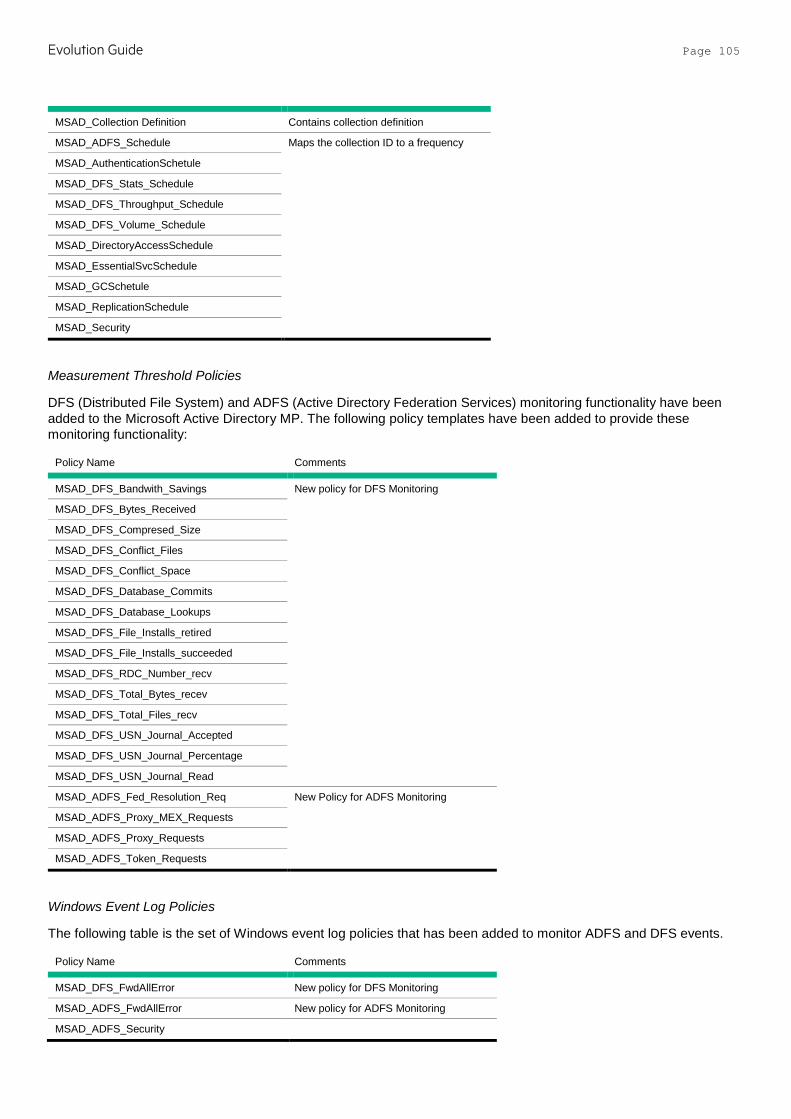
Evolution Guide Page 105
MSAD_Collection Definition Contains collection definition
MSAD_ADFS_Schedule Maps the collection ID to a frequency
MSAD_AuthenticationSchetule
MSAD_DFS_Stats_Schedule
MSAD_DFS_Throughput_Schedule
MSAD_DFS_Volume_Schedule
MSAD_DirectoryAccessSchedule
MSAD_EssentialSvcSchedule
MSAD_GCSchetule
MSAD_ReplicationSchedule
MSAD_Security
Measurement Threshold Policies
DFS (Distributed File System) and ADFS (Active Directory Federation Services) monitoring functionality have been added to the Microsoft Active Directory MP. The following policy templates have been added to provide these monitoring functionality:
Policy Name Comments
MSAD_DFS_Bandwith_Savings New policy for DFS Monitoring
MSAD_DFS_Bytes_Received
MSAD_DFS_Compresed_Size
MSAD_DFS_Conflict_Files
MSAD_DFS_Conflict_Space
MSAD_DFS_Database_Commits
MSAD_DFS_Database_Lookups
MSAD_DFS_File_Installs_retired
MSAD_DFS_File_Installs_succeeded
MSAD_DFS_RDC_Number_recv
MSAD_DFS_Total_Bytes_recev
MSAD_DFS_Total_Files_recv
MSAD_DFS_USN_Journal_Accepted
MSAD_DFS_USN_Journal_Percentage
MSAD_DFS_USN_Journal_Read
MSAD_ADFS_Fed_Resolution_Req New Policy for ADFS Monitoring
MSAD_ADFS_Proxy_MEX_Requests
MSAD_ADFS_Proxy_Requests
MSAD_ADFS_Token_Requests
Windows Event Log Policies
The following table is the set of Windows event log policies that has been added to monitor ADFS and DFS events.
Policy Name Comments
MSAD_DFS_FwdAllError New policy for DFS Monitoring
MSAD_ADFS_FwdAllError New policy for ADFS Monitoring
MSAD_ADFS_Security
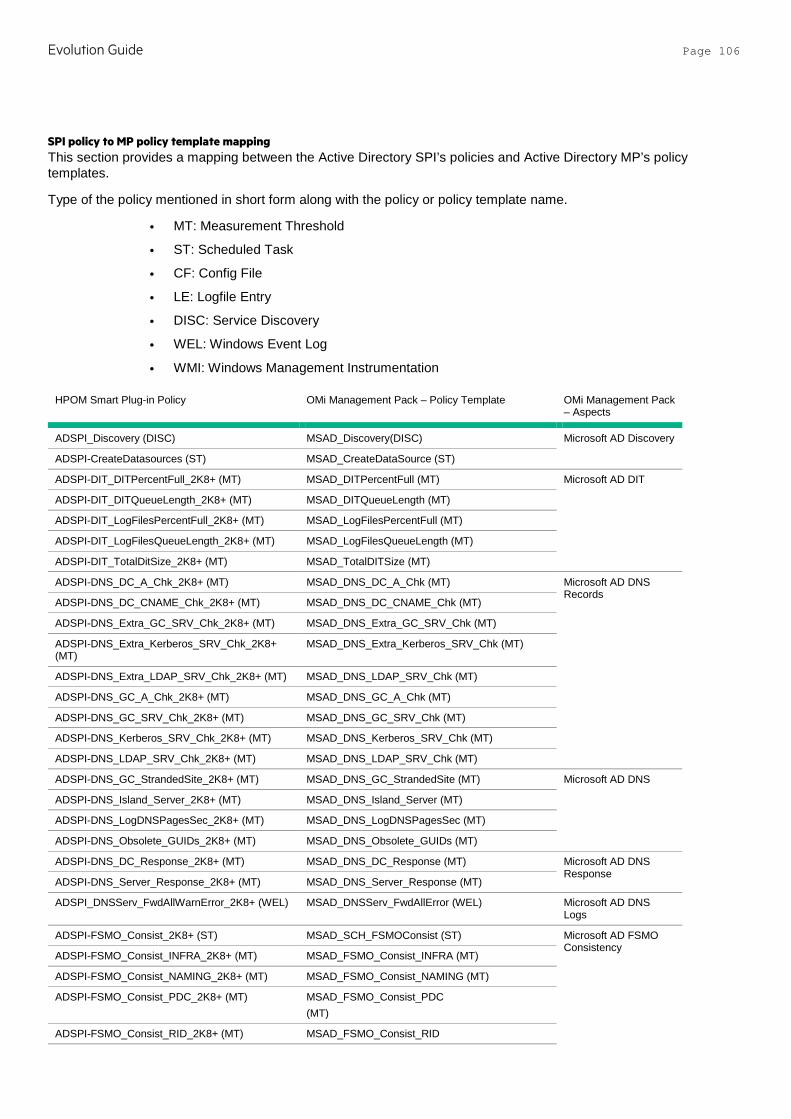
Evolution Guide Page 106
SPI policy to MP policy template mapping This section provides a mapping between the Active Directory SPI’s policies and Active Directory MP’s policy templates.
Type of the policy mentioned in short form along with the policy or policy template name.
• MT: Measurement Threshold
• ST: Scheduled Task
• CF: Config File
• LE: Logfile Entry
• DISC: Service Discovery
• WEL: Windows Event Log
• WMI: Windows Management Instrumentation
HPOM Smart Plug-in Policy OMi Management Pack – Policy Template OMi Management Pack – Aspects
ADSPI_Discovery (DISC) MSAD_Discovery(DISC) Microsoft AD Discovery
ADSPI-CreateDatasources (ST) MSAD_CreateDataSource (ST)
ADSPI-DIT_DITPercentFull_2K8+ (MT) MSAD_DITPercentFull (MT) Microsoft AD DIT
ADSPI-DIT_DITQueueLength_2K8+ (MT) MSAD_DITQueueLength (MT)
ADSPI-DIT_LogFilesPercentFull_2K8+ (MT) MSAD_LogFilesPercentFull (MT)
ADSPI-DIT_LogFilesQueueLength_2K8+ (MT) MSAD_LogFilesQueueLength (MT)
ADSPI-DIT_TotalDitSize_2K8+ (MT) MSAD_TotalDITSize (MT)
ADSPI-DNS_DC_A_Chk_2K8+ (MT) MSAD_DNS_DC_A_Chk (MT) Microsoft AD DNS Records
ADSPI-DNS_DC_CNAME_Chk_2K8+ (MT) MSAD_DNS_DC_CNAME_Chk (MT)
ADSPI-DNS_Extra_GC_SRV_Chk_2K8+ (MT) MSAD_DNS_Extra_GC_SRV_Chk (MT)
ADSPI-DNS_Extra_Kerberos_SRV_Chk_2K8+ (MT)
MSAD_DNS_Extra_Kerberos_SRV_Chk (MT)
ADSPI-DNS_Extra_LDAP_SRV_Chk_2K8+ (MT) MSAD_DNS_LDAP_SRV_Chk (MT)
ADSPI-DNS_GC_A_Chk_2K8+ (MT) MSAD_DNS_GC_A_Chk (MT)
ADSPI-DNS_GC_SRV_Chk_2K8+ (MT) MSAD_DNS_GC_SRV_Chk (MT)
ADSPI-DNS_Kerberos_SRV_Chk_2K8+ (MT) MSAD_DNS_Kerberos_SRV_Chk (MT)
ADSPI-DNS_LDAP_SRV_Chk_2K8+ (MT) MSAD_DNS_LDAP_SRV_Chk (MT)
ADSPI-DNS_GC_StrandedSite_2K8+ (MT) MSAD_DNS_GC_StrandedSite (MT) Microsoft AD DNS
ADSPI-DNS_Island_Server_2K8+ (MT) MSAD_DNS_Island_Server (MT)
ADSPI-DNS_LogDNSPagesSec_2K8+ (MT) MSAD_DNS_LogDNSPagesSec (MT)
ADSPI-DNS_Obsolete_GUIDs_2K8+ (MT) MSAD_DNS_Obsolete_GUIDs (MT)
ADSPI-DNS_DC_Response_2K8+ (MT) MSAD_DNS_DC_Response (MT) Microsoft AD DNS Response
ADSPI-DNS_Server_Response_2K8+ (MT) MSAD_DNS_Server_Response (MT)
ADSPI_DNSServ_FwdAllWarnError_2K8+ (WEL) MSAD_DNSServ_FwdAllError (WEL) Microsoft AD DNS Logs
ADSPI-FSMO_Consist_2K8+ (ST) MSAD_SCH_FSMOConsist (ST) Microsoft AD FSMO Consistency
ADSPI-FSMO_Consist_INFRA_2K8+ (MT) MSAD_FSMO_Consist_INFRA (MT)
ADSPI-FSMO_Consist_NAMING_2K8+ (MT) MSAD_FSMO_Consist_NAMING (MT)
ADSPI-FSMO_Consist_PDC_2K8+ (MT) MSAD_FSMO_Consist_PDC (MT)
ADSPI-FSMO_Consist_RID_2K8+ (MT) MSAD_FSMO_Consist_RID
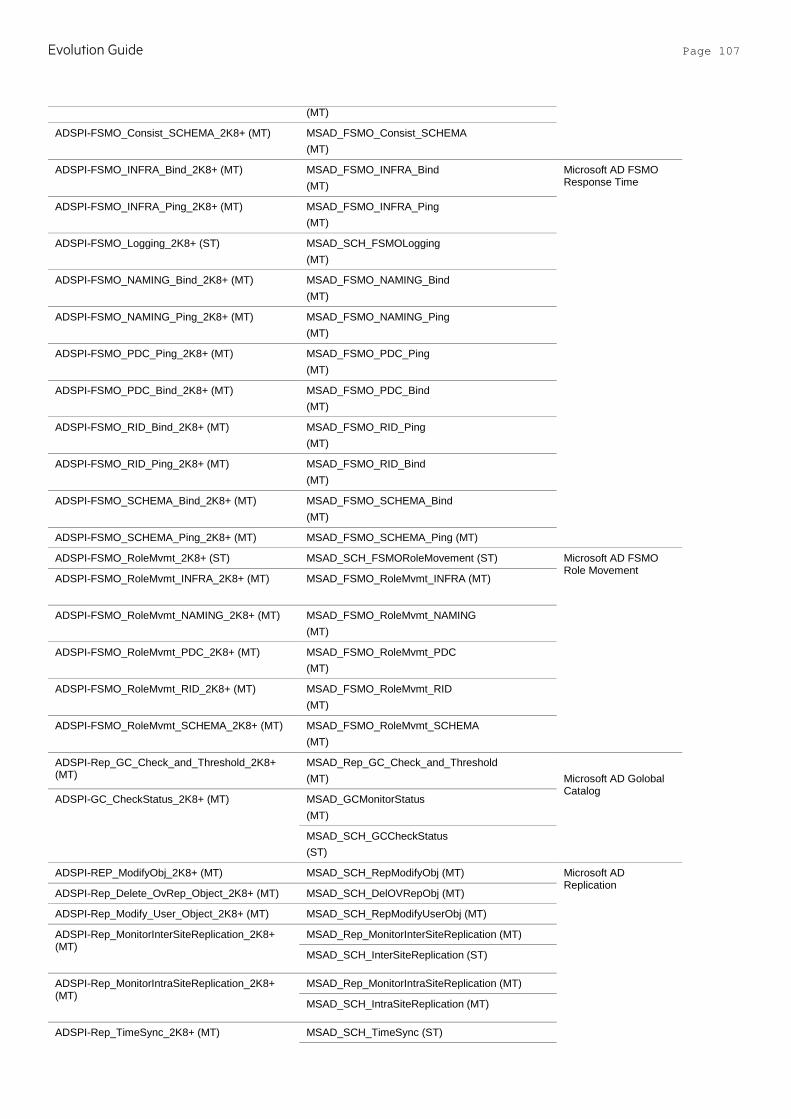
Evolution Guide Page 107
(MT)
ADSPI-FSMO_Consist_SCHEMA_2K8+ (MT) MSAD_FSMO_Consist_SCHEMA (MT)
ADSPI-FSMO_INFRA_Bind_2K8+ (MT)
MSAD_FSMO_INFRA_Bind (MT)
Microsoft AD FSMO Response Time
ADSPI-FSMO_INFRA_Ping_2K8+ (MT)
MSAD_FSMO_INFRA_Ping (MT)
ADSPI-FSMO_Logging_2K8+ (ST)
MSAD_SCH_FSMOLogging (MT)
ADSPI-FSMO_NAMING_Bind_2K8+ (MT)
MSAD_FSMO_NAMING_Bind (MT)
ADSPI-FSMO_NAMING_Ping_2K8+ (MT)
MSAD_FSMO_NAMING_Ping (MT)
ADSPI-FSMO_PDC_Ping_2K8+ (MT)
MSAD_FSMO_PDC_Ping (MT)
ADSPI-FSMO_PDC_Bind_2K8+ (MT)
MSAD_FSMO_PDC_Bind (MT)
ADSPI-FSMO_RID_Bind_2K8+ (MT)
MSAD_FSMO_RID_Ping (MT)
ADSPI-FSMO_RID_Ping_2K8+ (MT)
MSAD_FSMO_RID_Bind (MT)
ADSPI-FSMO_SCHEMA_Bind_2K8+ (MT)
MSAD_FSMO_SCHEMA_Bind (MT)
ADSPI-FSMO_SCHEMA_Ping_2K8+ (MT) MSAD_FSMO_SCHEMA_Ping (MT)
ADSPI-FSMO_RoleMvmt_2K8+ (ST) MSAD_SCH_FSMORoleMovement (ST) Microsoft AD FSMO Role Movement
ADSPI-FSMO_RoleMvmt_INFRA_2K8+ (MT) MSAD_FSMO_RoleMvmt_INFRA (MT)
ADSPI-FSMO_RoleMvmt_NAMING_2K8+ (MT)
MSAD_FSMO_RoleMvmt_NAMING (MT)
ADSPI-FSMO_RoleMvmt_PDC_2K8+ (MT)
MSAD_FSMO_RoleMvmt_PDC (MT)
ADSPI-FSMO_RoleMvmt_RID_2K8+ (MT)
MSAD_FSMO_RoleMvmt_RID (MT)
ADSPI-FSMO_RoleMvmt_SCHEMA_2K8+ (MT)
MSAD_FSMO_RoleMvmt_SCHEMA (MT)
ADSPI-Rep_GC_Check_and_Threshold_2K8+ (MT)
MSAD_Rep_GC_Check_and_Threshold (MT)
Microsoft AD Golobal Catalog
ADSPI-GC_CheckStatus_2K8+ (MT)
MSAD_GCMonitorStatus (MT)
MSAD_SCH_GCCheckStatus (ST)
ADSPI-REP_ModifyObj_2K8+ (MT) MSAD_SCH_RepModifyObj (MT) Microsoft AD Replication
ADSPI-Rep_Delete_OvRep_Object_2K8+ (MT) MSAD_SCH_DelOVRepObj (MT)
ADSPI-Rep_Modify_User_Object_2K8+ (MT) MSAD_SCH_RepModifyUserObj (MT)
ADSPI-Rep_MonitorInterSiteReplication_2K8+ (MT)
MSAD_Rep_MonitorInterSiteReplication (MT)
MSAD_SCH_InterSiteReplication (ST)
ADSPI-Rep_MonitorIntraSiteReplication_2K8+ (MT)
MSAD_Rep_MonitorIntraSiteReplication (MT)
MSAD_SCH_IntraSiteReplication (MT)
ADSPI-Rep_TimeSync_2K8+ (MT) MSAD_SCH_TimeSync (ST)
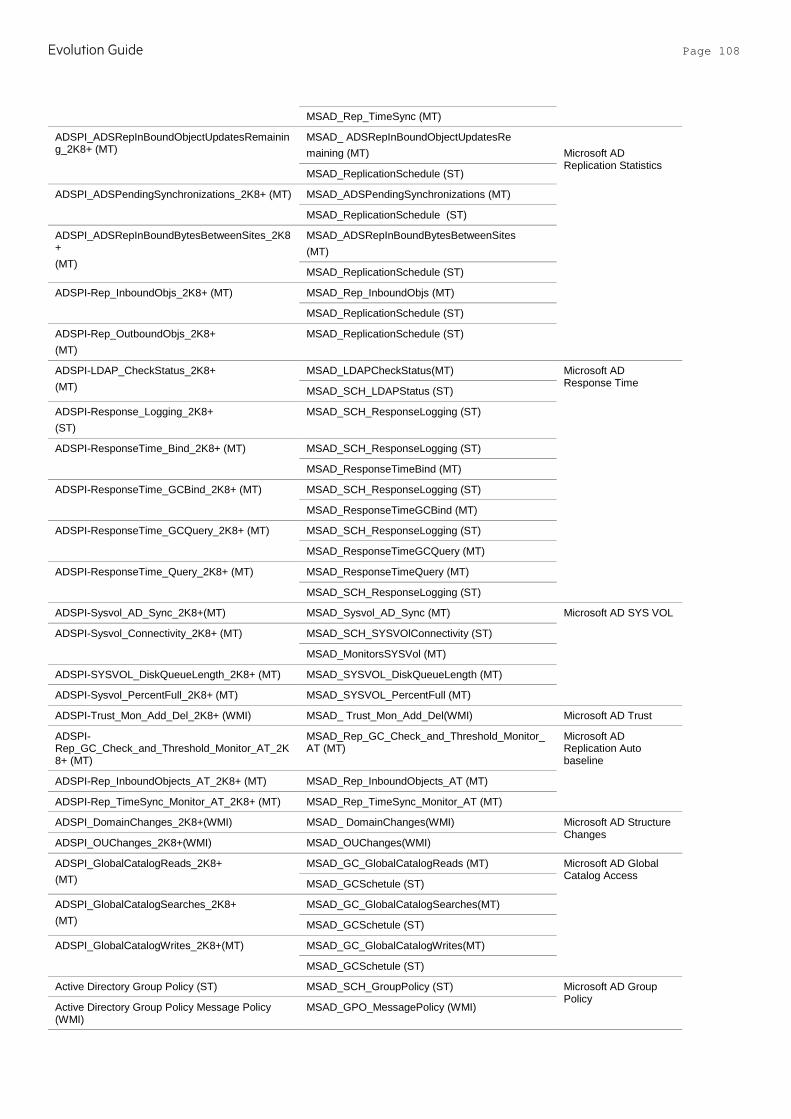
Evolution Guide Page 108
MSAD_Rep_TimeSync (MT)
ADSPI_ADSRepInBoundObjectUpdatesRemaining_2K8+ (MT)
MSAD_ ADSRepInBoundObjectUpdatesRe maining (MT)
Microsoft AD Replication Statistics
MSAD_ReplicationSchedule (ST)
ADSPI_ADSPendingSynchronizations_2K8+ (MT) MSAD_ADSPendingSynchronizations (MT)
MSAD_ReplicationSchedule (ST)
ADSPI_ADSRepInBoundBytesBetweenSites_2K8+ (MT)
MSAD_ADSRepInBoundBytesBetweenSites (MT)
MSAD_ReplicationSchedule (ST)
ADSPI-Rep_InboundObjs_2K8+ (MT) MSAD_Rep_InboundObjs (MT)
MSAD_ReplicationSchedule (ST)
ADSPI-Rep_OutboundObjs_2K8+ (MT)
MSAD_ReplicationSchedule (ST)
ADSPI-LDAP_CheckStatus_2K8+ (MT)
MSAD_LDAPCheckStatus(MT) Microsoft AD Response Time
MSAD_SCH_LDAPStatus (ST)
ADSPI-Response_Logging_2K8+ (ST)
MSAD_SCH_ResponseLogging (ST)
ADSPI-ResponseTime_Bind_2K8+ (MT)
MSAD_SCH_ResponseLogging (ST)
MSAD_ResponseTimeBind (MT)
ADSPI-ResponseTime_GCBind_2K8+ (MT)
MSAD_SCH_ResponseLogging (ST)
MSAD_ResponseTimeGCBind (MT)
ADSPI-ResponseTime_GCQuery_2K8+ (MT)
MSAD_SCH_ResponseLogging (ST)
MSAD_ResponseTimeGCQuery (MT)
ADSPI-ResponseTime_Query_2K8+ (MT) MSAD_ResponseTimeQuery (MT)
MSAD_SCH_ResponseLogging (ST)
ADSPI-Sysvol_AD_Sync_2K8+(MT) MSAD_Sysvol_AD_Sync (MT) Microsoft AD SYS VOL
ADSPI-Sysvol_Connectivity_2K8+ (MT) MSAD_SCH_SYSVOlConnectivity (ST)
MSAD_MonitorsSYSVol (MT)
ADSPI-SYSVOL_DiskQueueLength_2K8+ (MT) MSAD_SYSVOL_DiskQueueLength (MT)
ADSPI-Sysvol_PercentFull_2K8+ (MT) MSAD_SYSVOL_PercentFull (MT)
ADSPI-Trust_Mon_Add_Del_2K8+ (WMI) MSAD_ Trust_Mon_Add_Del(WMI) Microsoft AD Trust
ADSPI-Rep_GC_Check_and_Threshold_Monitor_AT_2K8+ (MT)
MSAD_Rep_GC_Check_and_Threshold_Monitor_AT (MT)
Microsoft AD Replication Auto baseline
ADSPI-Rep_InboundObjects_AT_2K8+ (MT) MSAD_Rep_InboundObjects_AT (MT)
ADSPI-Rep_TimeSync_Monitor_AT_2K8+ (MT) MSAD_Rep_TimeSync_Monitor_AT (MT)
ADSPI_DomainChanges_2K8+(WMI) MSAD_ DomainChanges(WMI) Microsoft AD Structure Changes
ADSPI_OUChanges_2K8+(WMI) MSAD_OUChanges(WMI)
ADSPI_GlobalCatalogReads_2K8+ (MT)
MSAD_GC_GlobalCatalogReads (MT) Microsoft AD Global Catalog Access
MSAD_GCSchetule (ST)
ADSPI_GlobalCatalogSearches_2K8+ (MT)
MSAD_GC_GlobalCatalogSearches(MT)
MSAD_GCSchetule (ST)
ADSPI_GlobalCatalogWrites_2K8+(MT) MSAD_GC_GlobalCatalogWrites(MT)
MSAD_GCSchetule (ST)
Active Directory Group Policy (ST) MSAD_SCH_GroupPolicy (ST) Microsoft AD Group Policy
Active Directory Group Policy Message Policy (WMI)
MSAD_GPO_MessagePolicy (WMI)
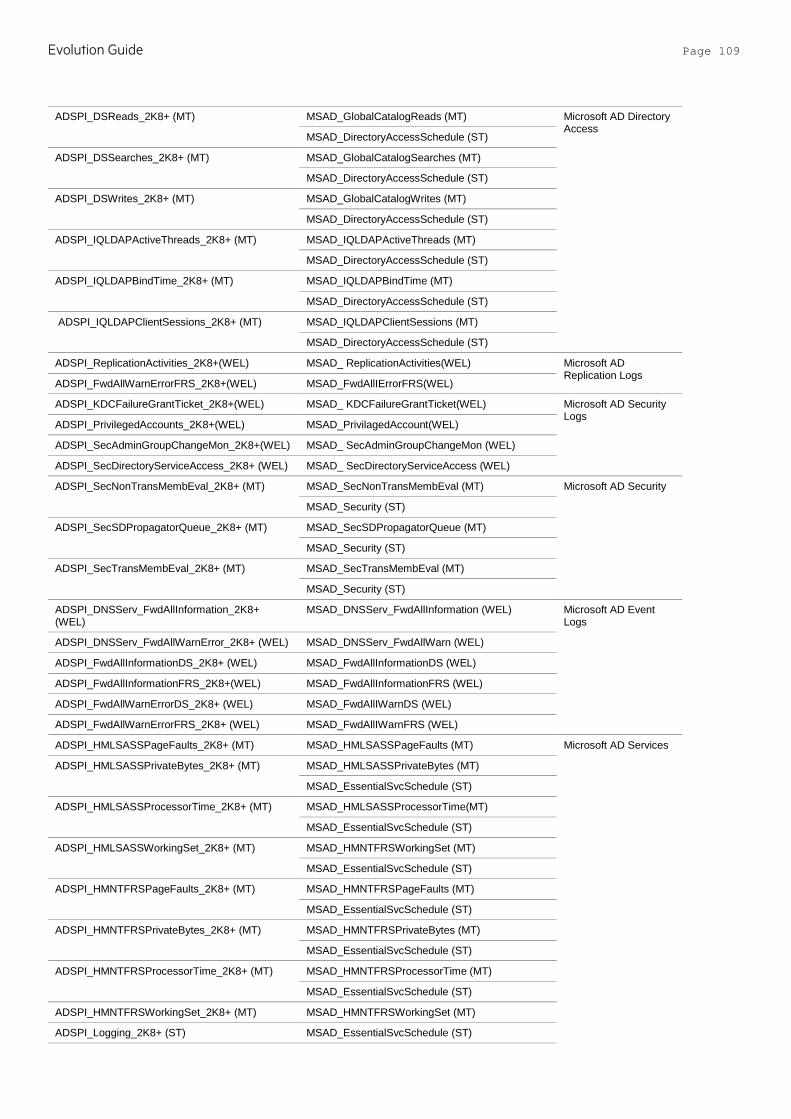
Evolution Guide Page 109
ADSPI_DSReads_2K8+ (MT) MSAD_GlobalCatalogReads (MT) Microsoft AD Directory Access
MSAD_DirectoryAccessSchedule (ST)
ADSPI_DSSearches_2K8+ (MT) MSAD_GlobalCatalogSearches (MT)
MSAD_DirectoryAccessSchedule (ST)
ADSPI_DSWrites_2K8+ (MT) MSAD_GlobalCatalogWrites (MT)
MSAD_DirectoryAccessSchedule (ST)
ADSPI_IQLDAPActiveThreads_2K8+ (MT) MSAD_IQLDAPActiveThreads (MT)
MSAD_DirectoryAccessSchedule (ST)
ADSPI_IQLDAPBindTime_2K8+ (MT) MSAD_IQLDAPBindTime (MT)
MSAD_DirectoryAccessSchedule (ST)
ADSPI_IQLDAPClientSessions_2K8+ (MT) MSAD_IQLDAPClientSessions (MT)
MSAD_DirectoryAccessSchedule (ST)
ADSPI_ReplicationActivities_2K8+(WEL) MSAD_ ReplicationActivities(WEL) Microsoft AD Replication Logs
ADSPI_FwdAllWarnErrorFRS_2K8+(WEL) MSAD_FwdAllIErrorFRS(WEL)
ADSPI_KDCFailureGrantTicket_2K8+(WEL) MSAD_ KDCFailureGrantTicket(WEL) Microsoft AD Security Logs
ADSPI_PrivilegedAccounts_2K8+(WEL) MSAD_PrivilagedAccount(WEL)
ADSPI_SecAdminGroupChangeMon_2K8+(WEL) MSAD_ SecAdminGroupChangeMon (WEL)
ADSPI_SecDirectoryServiceAccess_2K8+ (WEL) MSAD_ SecDirectoryServiceAccess (WEL)
ADSPI_SecNonTransMembEval_2K8+ (MT) MSAD_SecNonTransMembEval (MT) Microsoft AD Security
MSAD_Security (ST)
ADSPI_SecSDPropagatorQueue_2K8+ (MT) MSAD_SecSDPropagatorQueue (MT)
MSAD_Security (ST)
ADSPI_SecTransMembEval_2K8+ (MT) MSAD_SecTransMembEval (MT)
MSAD_Security (ST)
ADSPI_DNSServ_FwdAllInformation_2K8+ (WEL)
MSAD_DNSServ_FwdAllInformation (WEL) Microsoft AD Event Logs
ADSPI_DNSServ_FwdAllWarnError_2K8+ (WEL) MSAD_DNSServ_FwdAllWarn (WEL)
ADSPI_FwdAllInformationDS_2K8+ (WEL) MSAD_FwdAllInformationDS (WEL)
ADSPI_FwdAllInformationFRS_2K8+(WEL) MSAD_FwdAllInformationFRS (WEL)
ADSPI_FwdAllWarnErrorDS_2K8+ (WEL) MSAD_FwdAllIWarnDS (WEL)
ADSPI_FwdAllWarnErrorFRS_2K8+ (WEL) MSAD_FwdAllIWarnFRS (WEL)
ADSPI_HMLSASSPageFaults_2K8+ (MT) MSAD_HMLSASSPageFaults (MT) Microsoft AD Services
ADSPI_HMLSASSPrivateBytes_2K8+ (MT) MSAD_HMLSASSPrivateBytes (MT)
MSAD_EssentialSvcSchedule (ST)
ADSPI_HMLSASSProcessorTime_2K8+ (MT) MSAD_HMLSASSProcessorTime(MT)
MSAD_EssentialSvcSchedule (ST)
ADSPI_HMLSASSWorkingSet_2K8+ (MT) MSAD_HMNTFRSWorkingSet (MT)
MSAD_EssentialSvcSchedule (ST)
ADSPI_HMNTFRSPageFaults_2K8+ (MT) MSAD_HMNTFRSPageFaults (MT)
MSAD_EssentialSvcSchedule (ST)
ADSPI_HMNTFRSPrivateBytes_2K8+ (MT) MSAD_HMNTFRSPrivateBytes (MT)
MSAD_EssentialSvcSchedule (ST)
ADSPI_HMNTFRSProcessorTime_2K8+ (MT) MSAD_HMNTFRSProcessorTime (MT)
MSAD_EssentialSvcSchedule (ST)
ADSPI_HMNTFRSWorkingSet_2K8+ (MT) MSAD_HMNTFRSWorkingSet (MT)
ADSPI_Logging_2K8+ (ST) MSAD_EssentialSvcSchedule (ST)
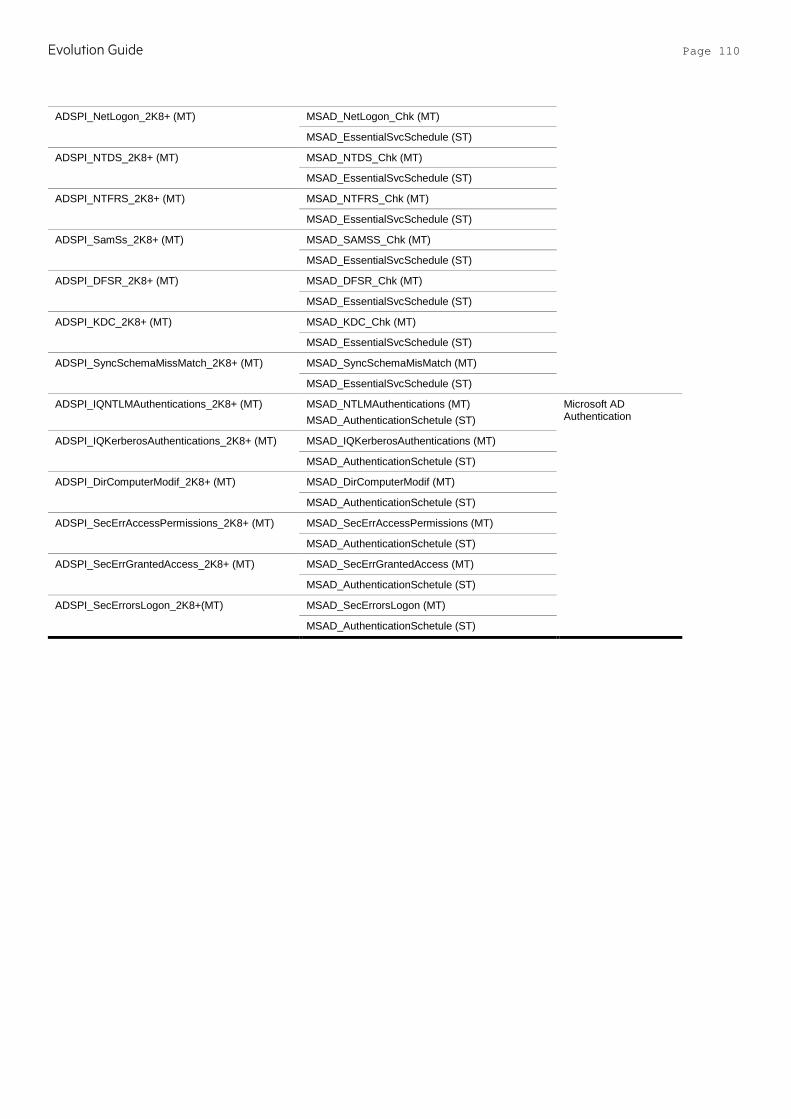
Evolution Guide Page 110
ADSPI_NetLogon_2K8+ (MT) MSAD_NetLogon_Chk (MT)
MSAD_EssentialSvcSchedule (ST)
ADSPI_NTDS_2K8+ (MT) MSAD_NTDS_Chk (MT)
MSAD_EssentialSvcSchedule (ST)
ADSPI_NTFRS_2K8+ (MT) MSAD_NTFRS_Chk (MT)
MSAD_EssentialSvcSchedule (ST)
ADSPI_SamSs_2K8+ (MT) MSAD_SAMSS_Chk (MT)
MSAD_EssentialSvcSchedule (ST)
ADSPI_DFSR_2K8+ (MT) MSAD_DFSR_Chk (MT)
MSAD_EssentialSvcSchedule (ST)
ADSPI_KDC_2K8+ (MT) MSAD_KDC_Chk (MT)
MSAD_EssentialSvcSchedule (ST)
ADSPI_SyncSchemaMissMatch_2K8+ (MT) MSAD_SyncSchemaMisMatch (MT)
MSAD_EssentialSvcSchedule (ST)
ADSPI_IQNTLMAuthentications_2K8+ (MT)
MSAD_NTLMAuthentications (MT) MSAD_AuthenticationSchetule (ST)
Microsoft AD Authentication
ADSPI_IQKerberosAuthentications_2K8+ (MT) MSAD_IQKerberosAuthentications (MT)
MSAD_AuthenticationSchetule (ST)
ADSPI_DirComputerModif_2K8+ (MT) MSAD_DirComputerModif (MT)
MSAD_AuthenticationSchetule (ST)
ADSPI_SecErrAccessPermissions_2K8+ (MT) MSAD_SecErrAccessPermissions (MT)
MSAD_AuthenticationSchetule (ST)
ADSPI_SecErrGrantedAccess_2K8+ (MT) MSAD_SecErrGrantedAccess (MT)
MSAD_AuthenticationSchetule (ST)
ADSPI_SecErrorsLogon_2K8+(MT) MSAD_SecErrorsLogon (MT)
MSAD_AuthenticationSchetule (ST)
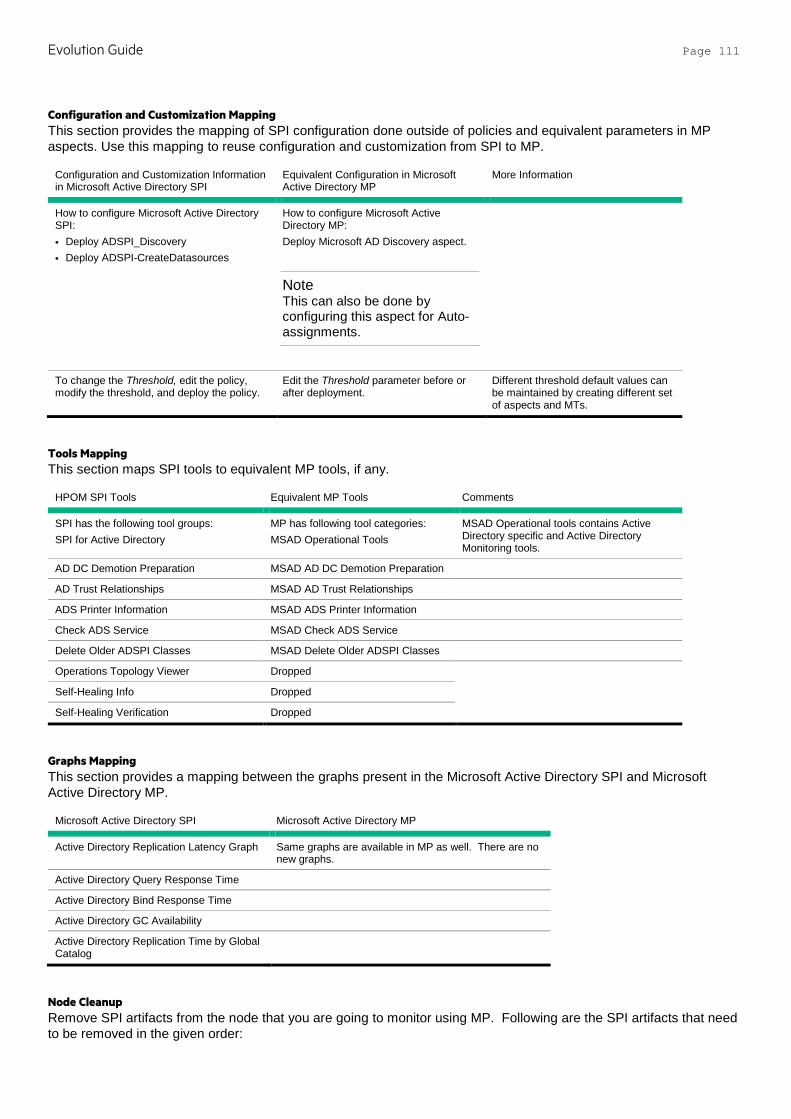
Evolution Guide Page 111
Configuration and Customization Mapping This section provides the mapping of SPI configuration done outside of policies and equivalent parameters in MP aspects. Use this mapping to reuse configuration and customization from SPI to MP.
Configuration and Customization Information in Microsoft Active Directory SPI
Equivalent Configuration in Microsoft Active Directory MP
More Information
How to configure Microsoft Active Directory SPI: • Deploy ADSPI_Discovery • Deploy ADSPI-CreateDatasources
How to configure Microsoft Active Directory MP: Deploy Microsoft AD Discovery aspect.
Note This can also be done by configuring this aspect for Auto-assignments.
To change the Threshold, edit the policy, modify the threshold, and deploy the policy.
Edit the Threshold parameter before or after deployment.
Different threshold default values can be maintained by creating different set of aspects and MTs.
Tools Mapping This section maps SPI tools to equivalent MP tools, if any.
HPOM SPI Tools Equivalent MP Tools Comments
SPI has the following tool groups: SPI for Active Directory
MP has following tool categories: MSAD Operational Tools
MSAD Operational tools contains Active Directory specific and Active Directory Monitoring tools.
AD DC Demotion Preparation MSAD AD DC Demotion Preparation
AD Trust Relationships MSAD AD Trust Relationships
ADS Printer Information MSAD ADS Printer Information
Check ADS Service MSAD Check ADS Service
Delete Older ADSPI Classes MSAD Delete Older ADSPI Classes
Operations Topology Viewer Dropped
Self-Healing Info Dropped
Self-Healing Verification Dropped
Graphs Mapping This section provides a mapping between the graphs present in the Microsoft Active Directory SPI and Microsoft Active Directory MP.
Microsoft Active Directory SPI Microsoft Active Directory MP
Active Directory Replication Latency Graph Same graphs are available in MP as well. There are no new graphs.
Active Directory Query Response Time
Active Directory Bind Response Time
Active Directory GC Availability
Active Directory Replication Time by Global Catalog
Node Cleanup Remove SPI artifacts from the node that you are going to monitor using MP. Following are the SPI artifacts that need to be removed in the given order:
Evolution Guide Page 112
1. Remove policy templates from the node.
a. List the policies using the ovpolicy –l command.
Note All Microsoft Active Directory SPI policies start with ADSPI.
b. Execute one of the following commands to remove policies:
• By Name: ovpolicy –remove –polname <Name>
• By Type: ovpolicy –remove -poltype <Type>
Note Before you move from OM to OMi, make sure you do not remove the flexible management policy of type "mgrconf" if it has already been deployed.
You can also remove policies by deleting policy groups for a particular node on the server using the GUI.
2. Remove the CODA / OVPA data sources.
Remove CODA or OVPA data sources using the command ADSPI_DeleteDS.bat under instrumentation or run the tool Delete Older ADSPI Classes from HPOM Server to remove the ADSPI data sources.
a. Restart CODA: ovc –restart coda
b. Verify Datasource removal: ovcodautil –showds
Note There should not be any datasources listed as ADSPI. Management Pack automatically creates datasources only on CODA.
3. Remove the Microsoft Active Directory SPI instrumentation.
Instrumentation folder on Windows: %OvAgentDir%\bin\instrumentation
The instrumentation files on the node that are prefixed or suffixed with “adspi”, “WINOSSPI”, and “ad_” can be deleted.
Note Instrumentation removal may fail if any executable or script is running. Stop the corresponding process (es) and then delete the instrumentation files.
For more information on how to back up the data if you need the data for future use, see the SHR documentation.
4. Remove the log files.
The ADSPI log files are created under the following folder <OvAgentDrive>/log. The log file names starts or ends with ADSPI.
For more information on cleaning up nodes, see Prepare nodes for deployment under the Recommended steps for moving from a SPI to MP section in this document.
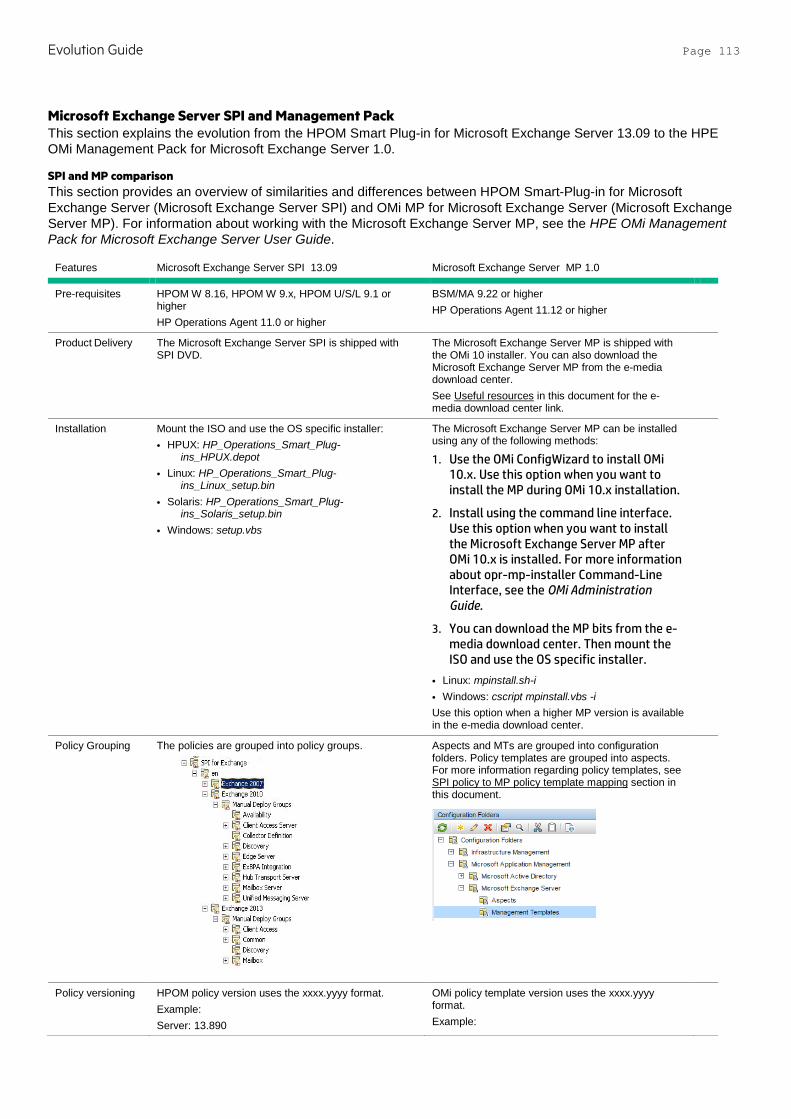
Evolution Guide Page 113
Microsoft Exchange Server SPI and Management Pack This section explains the evolution from the HPOM Smart Plug-in for Microsoft Exchange Server 13.09 to the HPE OMi Management Pack for Microsoft Exchange Server 1.0.
SPI and MP comparison This section provides an overview of similarities and differences between HPOM Smart-Plug-in for Microsoft Exchange Server (Microsoft Exchange Server SPI) and OMi MP for Microsoft Exchange Server (Microsoft Exchange Server MP). For information about working with the Microsoft Exchange Server MP, see the HPE OMi Management Pack for Microsoft Exchange Server User Guide.
Features Microsoft Exchange Server SPI 13.09 Microsoft Exchange Server MP 1.0
Pre-requisites HPOM W 8.16, HPOM W 9.x, HPOM U/S/L 9.1 or higher HP Operations Agent 11.0 or higher
BSM/MA 9.22 or higher HP Operations Agent 11.12 or higher
Product Delivery The Microsoft Exchange Server SPI is shipped with SPI DVD.
The Microsoft Exchange Server MP is shipped with the OMi 10 installer. You can also download the Microsoft Exchange Server MP from the e-media download center. See Useful resources in this document for the e-media download center link.
Installation Mount the ISO and use the OS specific installer: • HPUX: HP_Operations_Smart_Plug-
ins_HPUX.depot • Linux: HP_Operations_Smart_Plug-
ins_Linux_setup.bin • Solaris: HP_Operations_Smart_Plug-
ins_Solaris_setup.bin • Windows: setup.vbs
The Microsoft Exchange Server MP can be installed using any of the following methods:
1. Use the OMi ConfigWizard to install OMi 10.x. Use this option when you want to install the MP during OMi 10.x installation.
2. Install using the command line interface. Use this option when you want to install the Microsoft Exchange Server MP after OMi 10.x is installed. For more information about opr-mp-installer Command-Line Interface, see the OMi Administration Guide.
3. You can download the MP bits from the e-media download center. Then mount the ISO and use the OS specific installer.
• Linux: mpinstall.sh-i • Windows: cscript mpinstall.vbs -i Use this option when a higher MP version is available in the e-media download center.
Policy Grouping The policies are grouped into policy groups.
Aspects and MTs are grouped into configuration folders. Policy templates are grouped into aspects. For more information regarding policy templates, see SPI policy to MP policy template mapping section in this document.
Policy versioning HPOM policy version uses the xxxx.yyyy format. Example: Server: 13.890
OMi policy template version uses the xxxx.yyyy format. Example:
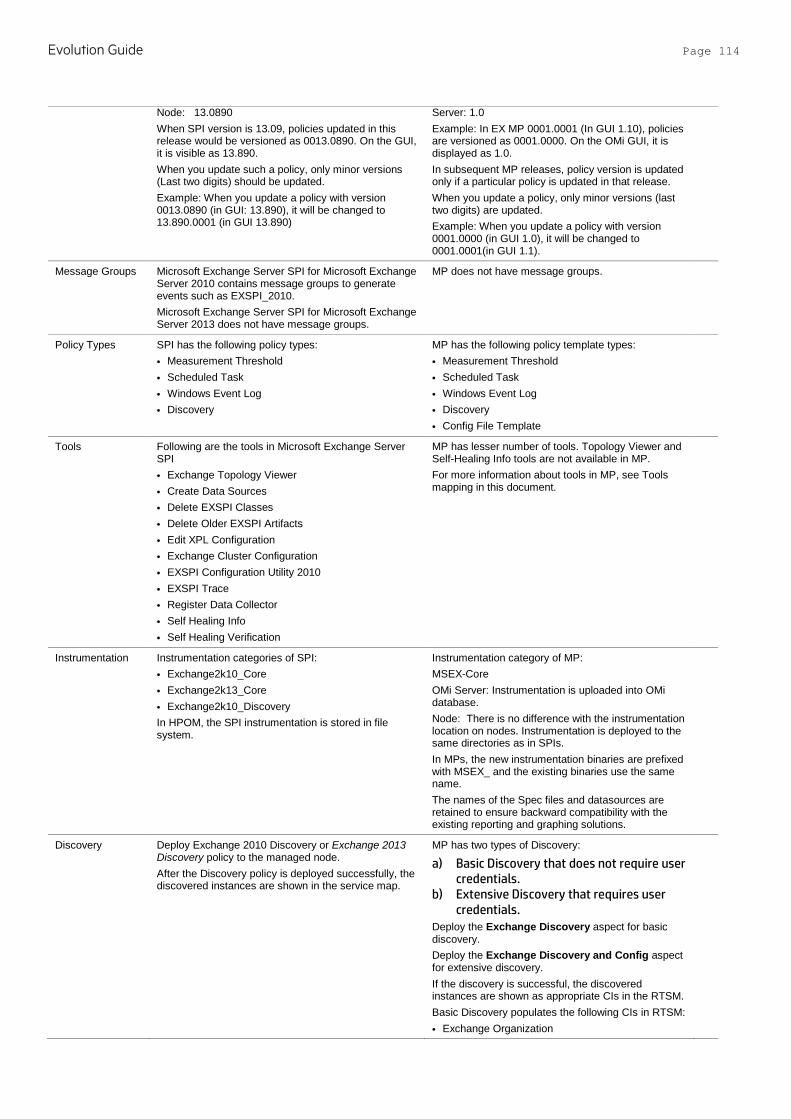
Evolution Guide Page 114
Node: 13.0890 When SPI version is 13.09, policies updated in this release would be versioned as 0013.0890. On the GUI, it is visible as 13.890. When you update such a policy, only minor versions (Last two digits) should be updated. Example: When you update a policy with version 0013.0890 (in GUI: 13.890), it will be changed to 13.890.0001 (in GUI 13.890)
Server: 1.0 Example: In EX MP 0001.0001 (In GUI 1.10), policies are versioned as 0001.0000. On the OMi GUI, it is displayed as 1.0. In subsequent MP releases, policy version is updated only if a particular policy is updated in that release. When you update a policy, only minor versions (last two digits) are updated. Example: When you update a policy with version 0001.0000 (in GUI 1.0), it will be changed to 0001.0001(in GUI 1.1).
Message Groups Microsoft Exchange Server SPI for Microsoft Exchange Server 2010 contains message groups to generate events such as EXSPI_2010. Microsoft Exchange Server SPI for Microsoft Exchange Server 2013 does not have message groups.
MP does not have message groups.
Policy Types SPI has the following policy types: • Measurement Threshold • Scheduled Task • Windows Event Log • Discovery
MP has the following policy template types: • Measurement Threshold • Scheduled Task • Windows Event Log • Discovery • Config File Template
Tools Following are the tools in Microsoft Exchange Server SPI • Exchange Topology Viewer • Create Data Sources • Delete EXSPI Classes • Delete Older EXSPI Artifacts • Edit XPL Configuration • Exchange Cluster Configuration • EXSPI Configuration Utility 2010 • EXSPI Trace • Register Data Collector • Self Healing Info • Self Healing Verification
MP has lesser number of tools. Topology Viewer and Self-Healing Info tools are not available in MP. For more information about tools in MP, see Tools mapping in this document.
Instrumentation Instrumentation categories of SPI: • Exchange2k10_Core • Exchange2k13_Core • Exchange2k10_Discovery In HPOM, the SPI instrumentation is stored in file system.
Instrumentation category of MP: MSEX-Core OMi Server: Instrumentation is uploaded into OMi database. Node: There is no difference with the instrumentation location on nodes. Instrumentation is deployed to the same directories as in SPIs. In MPs, the new instrumentation binaries are prefixed with MSEX_ and the existing binaries use the same name. The names of the Spec files and datasources are retained to ensure backward compatibility with the existing reporting and graphing solutions.
Discovery Deploy Exchange 2010 Discovery or Exchange 2013 Discovery policy to the managed node. After the Discovery policy is deployed successfully, the discovered instances are shown in the service map.
MP has two types of Discovery:
a) Basic Discovery that does not require user credentials.
b) Extensive Discovery that requires user credentials.
Deploy the Exchange Discovery aspect for basic discovery. Deploy the Exchange Discovery and Config aspect for extensive discovery. If the discovery is successful, the discovered instances are shown as appropriate CIs in the RTSM. Basic Discovery populates the following CIs in RTSM: • Exchange Organization
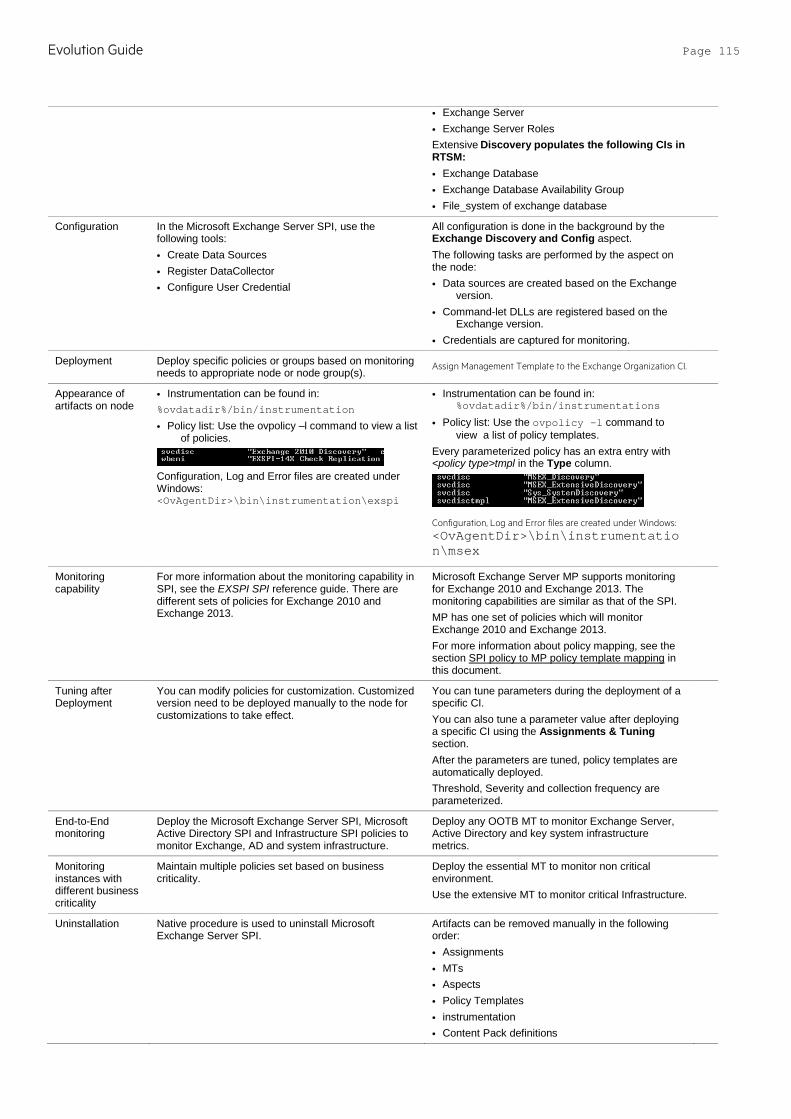
Evolution Guide Page 115
• Exchange Server • Exchange Server Roles Extensive Discovery populates the following CIs in RTSM:
• Exchange Database • Exchange Database Availability Group • File_system of exchange database
Configuration In the Microsoft Exchange Server SPI, use the following tools: • Create Data Sources • Register DataCollector • Configure User Credential
All configuration is done in the background by the Exchange Discovery and Config aspect. The following tasks are performed by the aspect on the node: • Data sources are created based on the Exchange
version. • Command-let DLLs are registered based on the
Exchange version. • Credentials are captured for monitoring.
Deployment Deploy specific policies or groups based on monitoring needs to appropriate node or node group(s).
Assign Management Template to the Exchange Organization CI.
Appearance of artifacts on node
• Instrumentation can be found in: %ovdatadir%/bin/instrumentation
• Policy list: Use the ovpolicy –l command to view a list of policies.
Configuration, Log and Error files are created under Windows: <OvAgentDir>\bin\instrumentation\exspi
• Instrumentation can be found in: %ovdatadir%/bin/instrumentations
• Policy list: Use the ovpolicy –l command to view a list of policy templates.
Every parameterized policy has an extra entry with <policy type>tmpl in the Type column.
Configuration, Log and Error files are created under Windows: <OvAgentDir>\bin\instrumentation\msex
Monitoring capability
For more information about the monitoring capability in SPI, see the EXSPI SPI reference guide. There are different sets of policies for Exchange 2010 and Exchange 2013.
Microsoft Exchange Server MP supports monitoring for Exchange 2010 and Exchange 2013. The monitoring capabilities are similar as that of the SPI. MP has one set of policies which will monitor Exchange 2010 and Exchange 2013. For more information about policy mapping, see the section SPI policy to MP policy template mapping in this document.
Tuning after Deployment
You can modify policies for customization. Customized version need to be deployed manually to the node for customizations to take effect.
You can tune parameters during the deployment of a specific CI. You can also tune a parameter value after deploying a specific CI using the Assignments & Tuning section. After the parameters are tuned, policy templates are automatically deployed. Threshold, Severity and collection frequency are parameterized.
End-to-End monitoring
Deploy the Microsoft Exchange Server SPI, Microsoft Active Directory SPI and Infrastructure SPI policies to monitor Exchange, AD and system infrastructure.
Deploy any OOTB MT to monitor Exchange Server, Active Directory and key system infrastructure metrics.
Monitoring instances with different business criticality
Maintain multiple policies set based on business criticality.
Deploy the essential MT to monitor non critical environment. Use the extensive MT to monitor critical Infrastructure.
Uninstallation Native procedure is used to uninstall Microsoft Exchange Server SPI.
Artifacts can be removed manually in the following order: • Assignments • MTs • Aspects • Policy Templates • instrumentation • Content Pack definitions
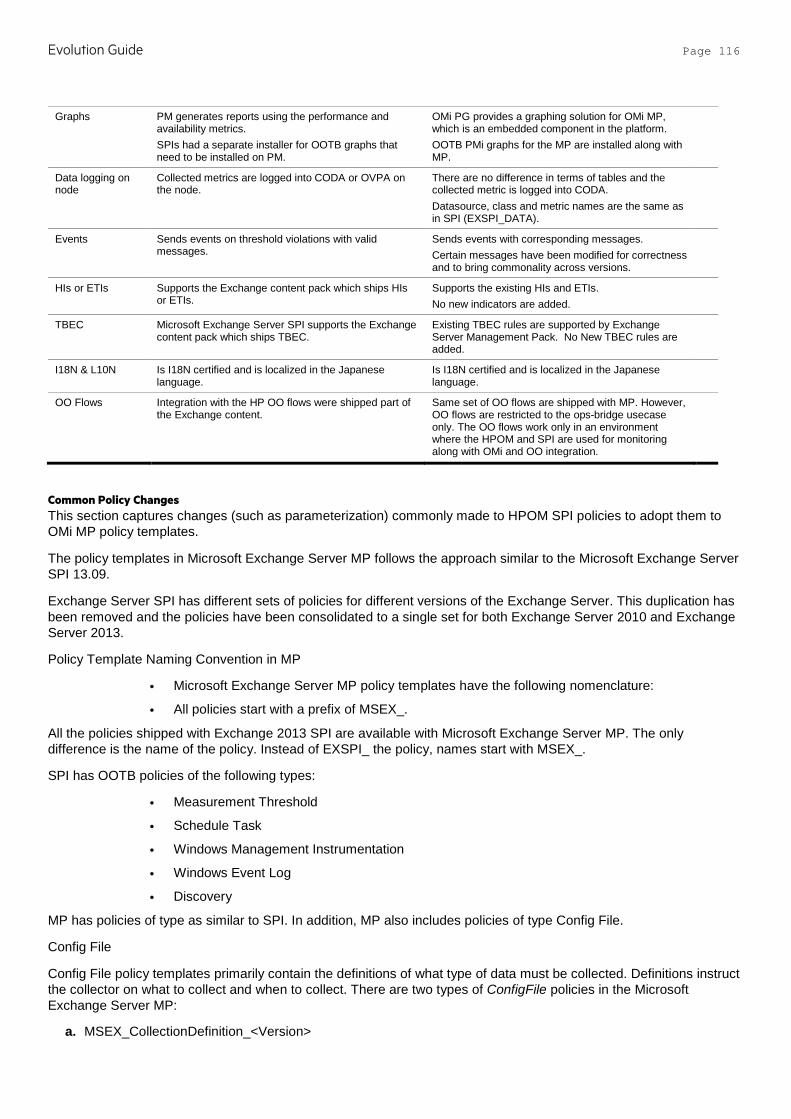
Evolution Guide Page 116
Graphs PM generates reports using the performance and availability metrics. SPIs had a separate installer for OOTB graphs that need to be installed on PM.
OMi PG provides a graphing solution for OMi MP, which is an embedded component in the platform. OOTB PMi graphs for the MP are installed along with MP.
Data logging on node
Collected metrics are logged into CODA or OVPA on the node.
There are no difference in terms of tables and the collected metric is logged into CODA. Datasource, class and metric names are the same as in SPI (EXSPI_DATA).
Events Sends events on threshold violations with valid messages.
Sends events with corresponding messages. Certain messages have been modified for correctness and to bring commonality across versions.
HIs or ETIs Supports the Exchange content pack which ships HIs or ETIs.
Supports the existing HIs and ETIs. No new indicators are added.
TBEC Microsoft Exchange Server SPI supports the Exchange content pack which ships TBEC.
Existing TBEC rules are supported by Exchange Server Management Pack. No New TBEC rules are added.
I18N & L10N Is I18N certified and is localized in the Japanese language.
Is I18N certified and is localized in the Japanese language.
OO Flows Integration with the HP OO flows were shipped part of the Exchange content.
Same set of OO flows are shipped with MP. However, OO flows are restricted to the ops-bridge usecase only. The OO flows work only in an environment where the HPOM and SPI are used for monitoring along with OMi and OO integration.
Common Policy Changes This section captures changes (such as parameterization) commonly made to HPOM SPI policies to adopt them to OMi MP policy templates.
The policy templates in Microsoft Exchange Server MP follows the approach similar to the Microsoft Exchange Server SPI 13.09.
Exchange Server SPI has different sets of policies for different versions of the Exchange Server. This duplication has been removed and the policies have been consolidated to a single set for both Exchange Server 2010 and Exchange Server 2013.
Policy Template Naming Convention in MP
• Microsoft Exchange Server MP policy templates have the following nomenclature:
• All policies start with a prefix of MSEX_.
All the policies shipped with Exchange 2013 SPI are available with Microsoft Exchange Server MP. The only difference is the name of the policy. Instead of EXSPI_ the policy, names start with MSEX_.
SPI has OOTB policies of the following types:
• Measurement Threshold
• Schedule Task
• Windows Management Instrumentation
• Windows Event Log
• Discovery
MP has policies of type as similar to SPI. In addition, MP also includes policies of type Config File.
Config File
Config File policy templates primarily contain the definitions of what type of data must be collected. Definitions instruct the collector on what to collect and when to collect. There are two types of ConfigFile policies in the Microsoft Exchange Server MP:
a. MSEX_CollectionDefinition_<Version>
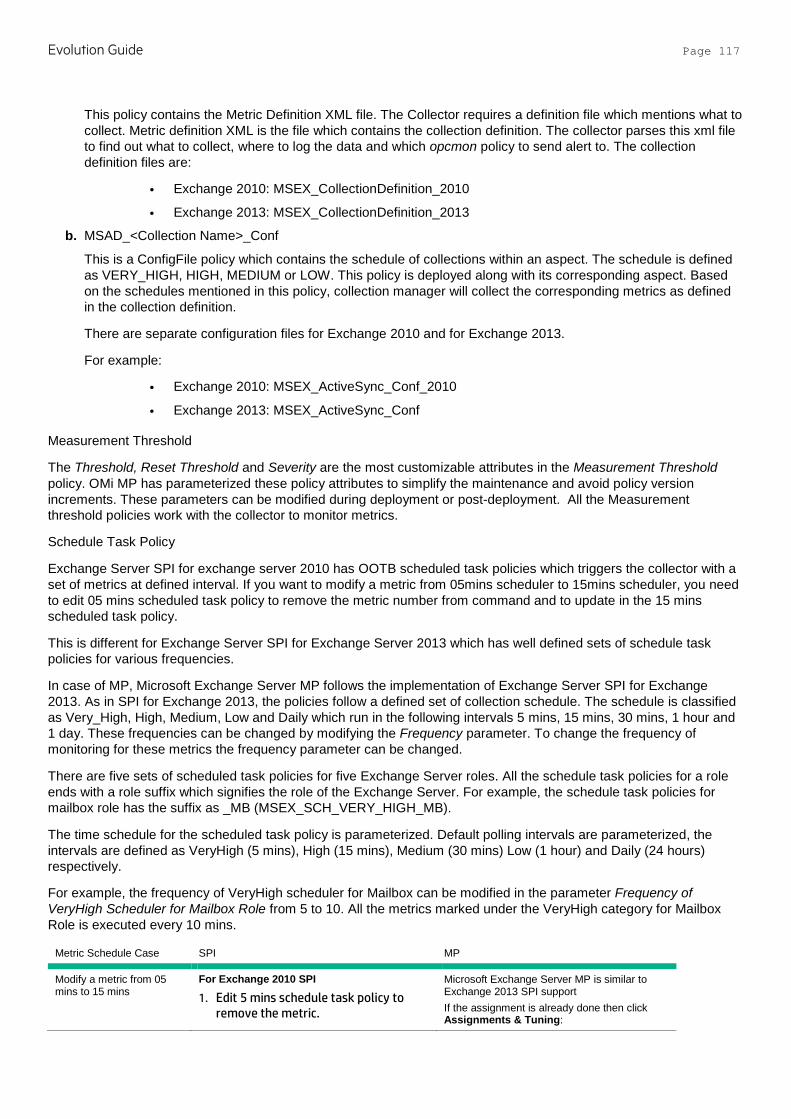
Evolution Guide Page 117
This policy contains the Metric Definition XML file. The Collector requires a definition file which mentions what to collect. Metric definition XML is the file which contains the collection definition. The collector parses this xml file to find out what to collect, where to log the data and which opcmon policy to send alert to. The collection definition files are:
• Exchange 2010: MSEX_CollectionDefinition_2010
• Exchange 2013: MSEX_CollectionDefinition_2013
b. MSAD_<Collection Name>_Conf
This is a ConfigFile policy which contains the schedule of collections within an aspect. The schedule is defined as VERY_HIGH, HIGH, MEDIUM or LOW. This policy is deployed along with its corresponding aspect. Based on the schedules mentioned in this policy, collection manager will collect the corresponding metrics as defined in the collection definition.
There are separate configuration files for Exchange 2010 and for Exchange 2013.
For example:
• Exchange 2010: MSEX_ActiveSync_Conf_2010
• Exchange 2013: MSEX_ActiveSync_Conf
Measurement Threshold
The Threshold, Reset Threshold and Severity are the most customizable attributes in the Measurement Threshold policy. OMi MP has parameterized these policy attributes to simplify the maintenance and avoid policy version increments. These parameters can be modified during deployment or post-deployment. All the Measurement threshold policies work with the collector to monitor metrics.
Schedule Task Policy
Exchange Server SPI for exchange server 2010 has OOTB scheduled task policies which triggers the collector with a set of metrics at defined interval. If you want to modify a metric from 05mins scheduler to 15mins scheduler, you need to edit 05 mins scheduled task policy to remove the metric number from command and to update in the 15 mins scheduled task policy.
This is different for Exchange Server SPI for Exchange Server 2013 which has well defined sets of schedule task policies for various frequencies.
In case of MP, Microsoft Exchange Server MP follows the implementation of Exchange Server SPI for Exchange 2013. As in SPI for Exchange 2013, the policies follow a defined set of collection schedule. The schedule is classified as Very_High, High, Medium, Low and Daily which run in the following intervals 5 mins, 15 mins, 30 mins, 1 hour and 1 day. These frequencies can be changed by modifying the Frequency parameter. To change the frequency of monitoring for these metrics the frequency parameter can be changed.
There are five sets of scheduled task policies for five Exchange Server roles. All the schedule task policies for a role ends with a role suffix which signifies the role of the Exchange Server. For example, the schedule task policies for mailbox role has the suffix as _MB (MSEX_SCH_VERY_HIGH_MB).
The time schedule for the scheduled task policy is parameterized. Default polling intervals are parameterized, the intervals are defined as VeryHigh (5 mins), High (15 mins), Medium (30 mins) Low (1 hour) and Daily (24 hours) respectively.
For example, the frequency of VeryHigh scheduler for Mailbox can be modified in the parameter Frequency of VeryHigh Scheduler for Mailbox Role from 5 to 10. All the metrics marked under the VeryHigh category for Mailbox Role is executed every 10 mins.
Metric Schedule Case SPI MP
Modify a metric from 05 mins to 15 mins
For Exchange 2010 SPI
1. Edit 5 mins schedule task policy to remove the metric.
Microsoft Exchange Server MP is similar to Exchange 2013 SPI support If the assignment is already done then click Assignments & Tuning:

Evolution Guide Page 118
2. Edit 15 mins schedule task policy to add the metrics.
3. Redeploy both of the above schedule task policies.
For Exchange 2013 SPI Edit the schedule in the Schedule task policy from Very High to High and redeploy.
1. Edit the frequency parameter of given metric change it from VeryHigh to High.
2. For the legacy scheduled task policies change the frequency parameter from 5 mins to 15 mins.
Note The same can be done by editing metric’s frequency parameter at the aspect or MT level.
Remove metric from scheduling.
For Exchange 2010 SPI, do not deploy the policy to the node. For Exchange 2013 Node, disable the collection in collection definition policy of the SPI.
Edit the Collection definition policy and disable the collection. There are two collection definition policies one for Exchange 2010 and another for Exchange 2013. • MSEX_CollectionDefinition_2010 • MSEX_CollectionDefinition_2013
Modify the lowest schedule of collection from 5 mins to 10 mins.
Copy and create new schedule task policy with the schedule of 10 mins. Or Edit the 5 mins schedule task policy, change the interval and rename it to 10 mins.
Modify the interval of scheduled task policy exposed as parameter either at the Aspect or MT level. In this case Frequency of VeryHigh Scheduler.
Windows Event Log Policies
Windows Event Log policies forwards events to the server. These policies are similar in SPI and in MP.
Discovery Policy
This policy is a type of custom discovery policy which triggers discovery script to generate XML. This XML directly contains information about discovered Exchange Server CIs and its relationship with Active Directory and Infra elements.
There are two types of discovery policy, Basic discovery which does not take any credentials and the extensive discovery which is similar to SPI and takes username and password as parameters.
Policy specific changes This section maps Microsoft Exchange Server MP’s aspects to the corresponding Microsoft Exchange Server SPI policies. This section also has information on policies that are dropped and any new policies that are added. Also, it captures the differences between them, if there are any.
Apart from the common changes that have been captured in the previous section, following are the policy specific changes.
Microsoft Exchange Server SPI Policies Split Some of the policies present in Microsoft Exchange Server SPI have been split into multiple policies in Exchange. This has been done to maintain a higher level of control and granularity.
In Exchange 2013 SPI, the EXSPI_CollectionSchedule is split into many ConfigFile policies. This was done to achieve scheduling at the aspect level.
SPI Policy MP Policy Template Comments
EXSPI_CollectionSchedule MSEX_TransportQueue_Conf MSEX_Pop3Perf_Conf MSEX_StorePerf_Conf MSEX_SMTPPerf_Conf
In Exchange 2013, the SPI has one collection schedule policy for scheduling collection.
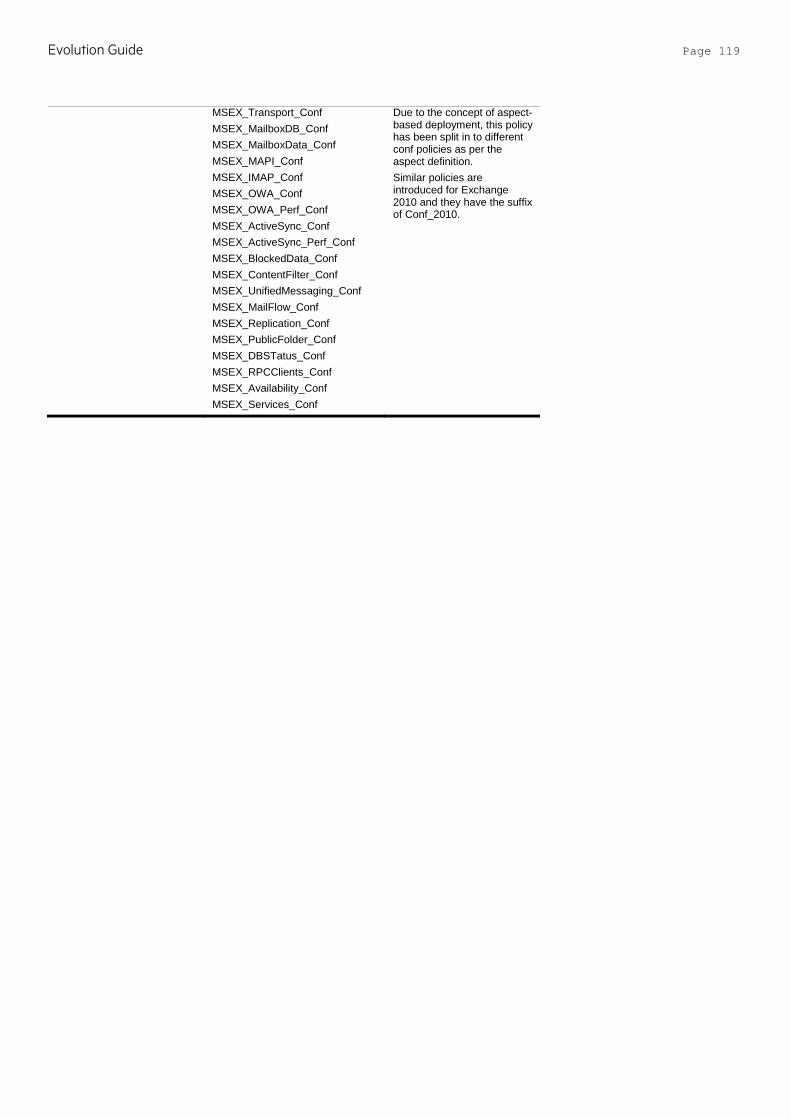
Evolution Guide Page 119
MSEX_Transport_Conf MSEX_MailboxDB_Conf MSEX_MailboxData_Conf MSEX_MAPI_Conf MSEX_IMAP_Conf MSEX_OWA_Conf MSEX_OWA_Perf_Conf MSEX_ActiveSync_Conf MSEX_ActiveSync_Perf_Conf MSEX_BlockedData_Conf MSEX_ContentFilter_Conf MSEX_UnifiedMessaging_Conf MSEX_MailFlow_Conf MSEX_Replication_Conf MSEX_PublicFolder_Conf MSEX_DBSTatus_Conf MSEX_RPCClients_Conf MSEX_Availability_Conf MSEX_Services_Conf
Due to the concept of aspect-based deployment, this policy has been split in to different conf policies as per the aspect definition. Similar policies are introduced for Exchange 2010 and they have the suffix of Conf_2010.
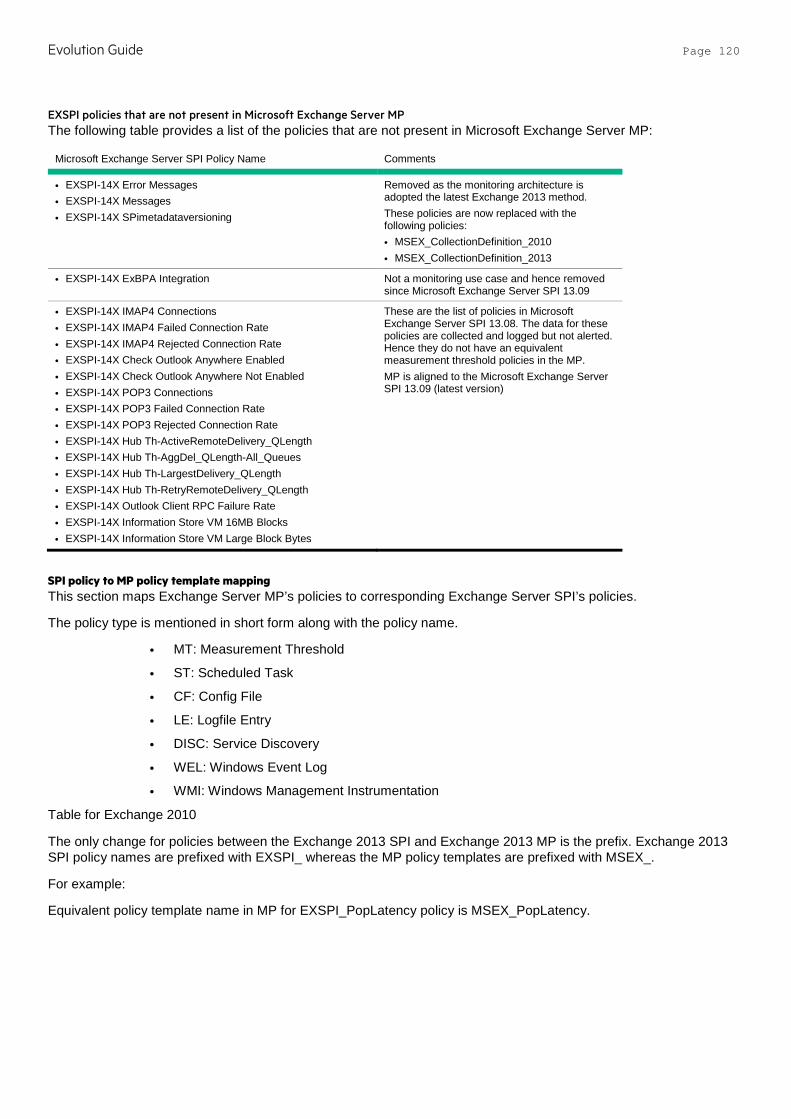
Evolution Guide Page 120
EXSPI policies that are not present in Microsoft Exchange Server MP The following table provides a list of the policies that are not present in Microsoft Exchange Server MP:
Microsoft Exchange Server SPI Policy Name Comments
• EXSPI-14X Error Messages • EXSPI-14X Messages • EXSPI-14X SPimetadataversioning
Removed as the monitoring architecture is adopted the latest Exchange 2013 method. These policies are now replaced with the following policies: • MSEX_CollectionDefinition_2010 • MSEX_CollectionDefinition_2013
• EXSPI-14X ExBPA Integration Not a monitoring use case and hence removed since Microsoft Exchange Server SPI 13.09
• EXSPI-14X IMAP4 Connections • EXSPI-14X IMAP4 Failed Connection Rate • EXSPI-14X IMAP4 Rejected Connection Rate • EXSPI-14X Check Outlook Anywhere Enabled • EXSPI-14X Check Outlook Anywhere Not Enabled • EXSPI-14X POP3 Connections • EXSPI-14X POP3 Failed Connection Rate • EXSPI-14X POP3 Rejected Connection Rate • EXSPI-14X Hub Th-ActiveRemoteDelivery_QLength • EXSPI-14X Hub Th-AggDel_QLength-All_Queues • EXSPI-14X Hub Th-LargestDelivery_QLength • EXSPI-14X Hub Th-RetryRemoteDelivery_QLength • EXSPI-14X Outlook Client RPC Failure Rate • EXSPI-14X Information Store VM 16MB Blocks • EXSPI-14X Information Store VM Large Block Bytes
These are the list of policies in Microsoft Exchange Server SPI 13.08. The data for these policies are collected and logged but not alerted. Hence they do not have an equivalent measurement threshold policies in the MP. MP is aligned to the Microsoft Exchange Server SPI 13.09 (latest version)
SPI policy to MP policy template mapping This section maps Exchange Server MP’s policies to corresponding Exchange Server SPI’s policies.
The policy type is mentioned in short form along with the policy name.
• MT: Measurement Threshold
• ST: Scheduled Task
• CF: Config File
• LE: Logfile Entry
• DISC: Service Discovery
• WEL: Windows Event Log
• WMI: Windows Management Instrumentation
Table for Exchange 2010
The only change for policies between the Exchange 2013 SPI and Exchange 2013 MP is the prefix. Exchange 2013 SPI policy names are prefixed with EXSPI_ whereas the MP policy templates are prefixed with MSEX_.
For example:
Equivalent policy template name in MP for EXSPI_PopLatency policy is MSEX_PopLatency.
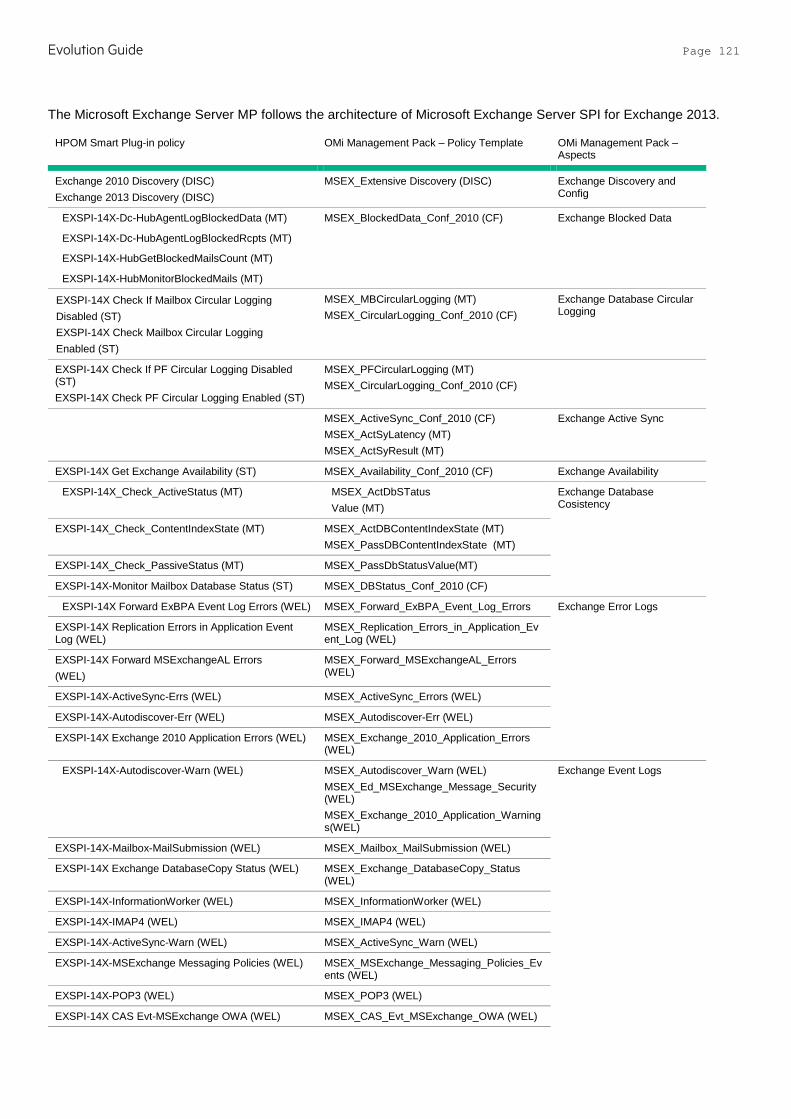
Evolution Guide Page 121
The Microsoft Exchange Server MP follows the architecture of Microsoft Exchange Server SPI for Exchange 2013.
HPOM Smart Plug-in policy OMi Management Pack – Policy Template OMi Management Pack – Aspects
Exchange 2010 Discovery (DISC) Exchange 2013 Discovery (DISC)
MSEX_Extensive Discovery (DISC) Exchange Discovery and Config
EXSPI-14X-Dc-HubAgentLogBlockedData (MT)
EXSPI-14X-Dc-HubAgentLogBlockedRcpts (MT)
EXSPI-14X-HubGetBlockedMailsCount (MT)
EXSPI-14X-HubMonitorBlockedMails (MT)
MSEX_BlockedData_Conf_2010 (CF) Exchange Blocked Data
EXSPI-14X Check If Mailbox Circular Logging Disabled (ST) EXSPI-14X Check Mailbox Circular Logging Enabled (ST)
MSEX_MBCircularLogging (MT) MSEX_CircularLogging_Conf_2010 (CF)
Exchange Database Circular Logging
EXSPI-14X Check If PF Circular Logging Disabled (ST) EXSPI-14X Check PF Circular Logging Enabled (ST)
MSEX_PFCircularLogging (MT) MSEX_CircularLogging_Conf_2010 (CF)
MSEX_ActiveSync_Conf_2010 (CF) MSEX_ActSyLatency (MT) MSEX_ActSyResult (MT)
Exchange Active Sync
EXSPI-14X Get Exchange Availability (ST) MSEX_Availability_Conf_2010 (CF) Exchange Availability
EXSPI-14X_Check_ActiveStatus (MT)
MSEX_ActDbSTatus Value (MT)
Exchange Database Cosistency
EXSPI-14X_Check_ContentIndexState (MT) MSEX_ActDBContentIndexState (MT) MSEX_PassDBContentIndexState (MT)
EXSPI-14X_Check_PassiveStatus (MT) MSEX_PassDbStatusValue(MT)
EXSPI-14X-Monitor Mailbox Database Status (ST) MSEX_DBStatus_Conf_2010 (CF)
EXSPI-14X Forward ExBPA Event Log Errors (WEL)
MSEX_Forward_ExBPA_Event_Log_Errors Exchange Error Logs
EXSPI-14X Replication Errors in Application Event Log (WEL)
MSEX_Replication_Errors_in_Application_Event_Log (WEL)
EXSPI-14X Forward MSExchangeAL Errors (WEL)
MSEX_Forward_MSExchangeAL_Errors (WEL)
EXSPI-14X-ActiveSync-Errs (WEL) MSEX_ActiveSync_Errors (WEL)
EXSPI-14X-Autodiscover-Err (WEL) MSEX_Autodiscover-Err (WEL)
EXSPI-14X Exchange 2010 Application Errors (WEL) MSEX_Exchange_2010_Application_Errors (WEL)
EXSPI-14X-Autodiscover-Warn (WEL)
MSEX_Autodiscover_Warn (WEL) MSEX_Ed_MSExchange_Message_Security (WEL) MSEX_Exchange_2010_Application_Warnings(WEL)
Exchange Event Logs
EXSPI-14X-Mailbox-MailSubmission (WEL) MSEX_Mailbox_MailSubmission (WEL)
EXSPI-14X Exchange DatabaseCopy Status (WEL) MSEX_Exchange_DatabaseCopy_Status (WEL)
EXSPI-14X-InformationWorker (WEL) MSEX_InformationWorker (WEL)
EXSPI-14X-IMAP4 (WEL) MSEX_IMAP4 (WEL)
EXSPI-14X-ActiveSync-Warn (WEL) MSEX_ActiveSync_Warn (WEL)
EXSPI-14X-MSExchange Messaging Policies (WEL) MSEX_MSExchange_Messaging_Policies_Events (WEL)
EXSPI-14X-POP3 (WEL) MSEX_POP3 (WEL)
EXSPI-14X CAS Evt-MSExchange OWA (WEL) MSEX_CAS_Evt_MSExchange_OWA (WEL)

Evolution Guide Page 122
EXSPI-14X-MailboxServer-Assistants (WEL) MSEX_MailboxServer_Assistants (WEL)
EXSPI-14X MSExchange Store Driver Events (WEL) MSEX_MSExchange_Store_Driver_Events (WEL)
EXSPI-14X Exchange 2010 Application Info (WEL) MSEX_Exchange_2010_Application_Info (WEL)
EXSPI-14X Repl Warnings in Application Event Log (WEL)
MSEX_Repl_Warnings_in_Application_Event_Log (WEL)
EXSPI-14X Dc-IMAP4 Performance (ST) MSEX_ImapLatency (MT) MSEX_ImapResult (MT) MSEX_IMAP_Conf_2010 (CF)
Exchange IMAP4
EXSPI-14X Exchange 2010 Application Info (WEL) MSEX_Exchange_2010_Application_Info (WEL)
Exchange Information Logs
EXSPI-14X-ActiveSync-Info (WEL) MSEX_ActiveSync_Info (WEL)
EXSPI-14X Dc-Information Store Performance (MT) MSEX_StorePerf_Conf_2010 (CF) Exchange Information Store
EXSPI-14X Information Store RPC Averaged Latency (MT)
MSEX_StoreRPCAvgLat (MT)
EXSPI-14X Information Store RPC Operations (MT) MSEX_StoreRPCOPPerSec (MT)
EXSPI-14X Information Store RPC Requests (MT) MSEX_StoreRPCReq (MT)
EXSPI-14X IS Mailbox Average Delivery Time (MT) MSEX_AvgDelTime (MT)
EXSPI-14X Information Store Additional Heaps (MT) MSEX_ExchmemAdditionalHeaps (MT)
EXSPI-14X Information Store Heap Memory Errors (MT)
MSEX_ExchmemHeapsErrors (MT)
EXSPI-14X Information Store Memory Errors MSEX_ExchmemMemoryErrors (MT)
EXSPI-14X Information Store User Count (MT) MSEX_userCount (MT)
EXSPI-14X Information Store VM Largest Block(MT) MSEX_ISLargestVMBlock (MT)
EXSPI-14X Test Mapi Connectivity (ST) MSEX_MAPI_Conf_2010 (CF) Exchange MAPI
EXSPI-14X Dc-GetMailFlowLatency (ST) MSEX_MailFlow_Conf_2010 (CF) Exchange Mailflow
EXSPI-14X Get Mailbox Details (ST) EXSPI-14X Get Mailbox IS Sum Data (ST)
MSEX_MailboxData_Conf_2010 (CF) Exchange Mailbox
EXSPI-14X Dc-IS Mailbox Performance (MT) MSEX_MailboxDB_Conf_2010 (CF) Exchange Mailbox Database
EXSPI-14X Information Store Db Cache Size (MT) MSEX_ISDBCacheSize(MT)
EXSPI-14X Information Store Db Cache Size in MB (MT)
MSEX_ISDBCacheSizeMB (MT)
EXSPI-14X Information Store Db Log Threads Waiting (MT)
MSEX_LogThreadsWaiting (MT)
EXSPI-14X Information Store Db Log Writes per sec (MT)
MSEX_DatabaseLogWritesRate (MT)
EXSPI-14X IS Db Log Record Stalls per sec (MT) MSEX_MdbLgRecStalls (MT)
EXSPI-14X-OwaConnectivity_Latency (MT) MSEX_OwaLatency (MT) Exchange OWA
EXSPI-14X-OwaConnectivity_Result (MT) MSEX_OwaResult (MT)
EXSPI-14X-DownloadTaskQueued-OAB-All (MT) MSEX_DownloadTaskQueues(MT) Exchange Online Address Book
EXSPI-14X-DownloadTaskQueued-OAB-Total (MT) MSEX_TotalDownloadTaskQueued (MT)
EXSPI-14X-DownloadTasksCompleted-OAB-All (MT) MSEX_DownloadTaskCompleted (MT)
EXSPI-14X CAS Collect FDS Metrics (MT) MSEX_FDSOABPerf_Conf_2010 (CF)
EXSPI-14X Dc-POP3 Performance (MT) MSEX_Pop3Perf_Conf_2010 (CF) Exchange POP3
EXSPI-14X Dc-IS Public Folder Performance(MT) MSEX_PublicFolderPerf_Conf_2010 (CF) Exchange Public Folder
EXSPI-14X Get Public Folder Details (ST) MSEX_PublicFolder_Conf_2010 (CF) MSEX_PublicFolder_Conf_2010 (CF)
EXSPI-14X Get Public IS Sum Data (ST)
EXSPI-14X IS Public Average Delivery Time (MT) MSEX_PFAvgDeliveryTIme (MT)
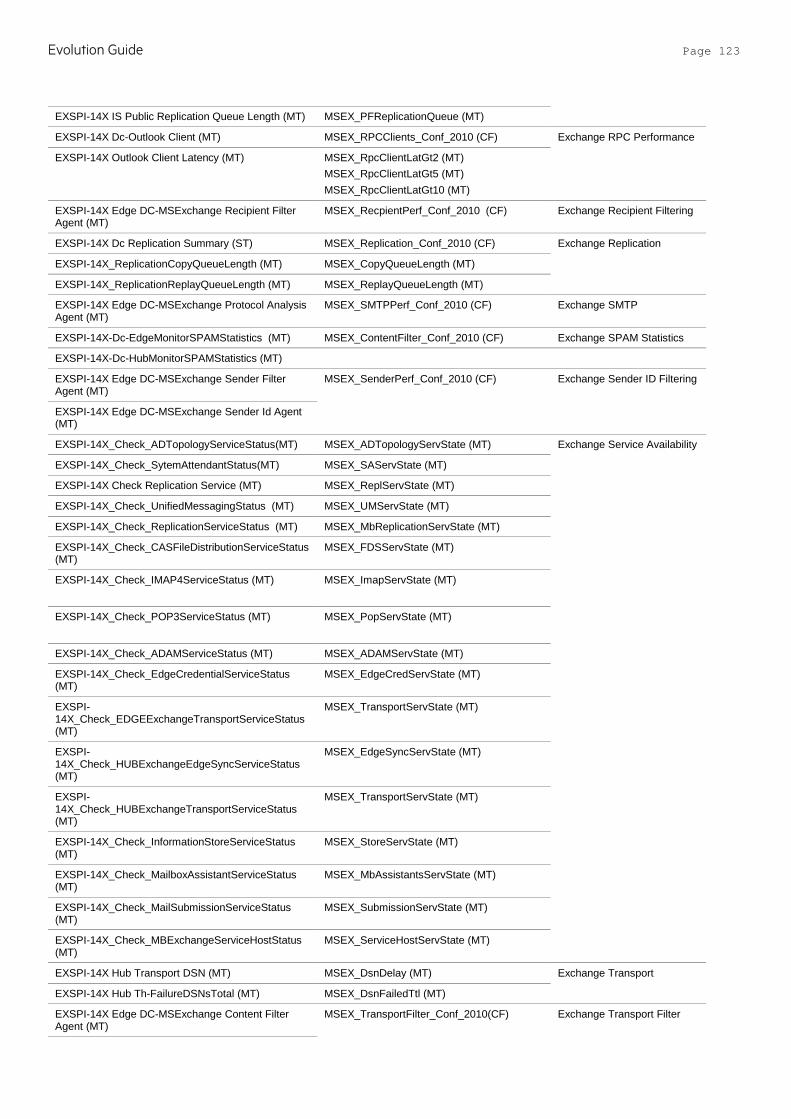
Evolution Guide Page 123
EXSPI-14X IS Public Replication Queue Length (MT) MSEX_PFReplicationQueue (MT)
EXSPI-14X Dc-Outlook Client (MT) MSEX_RPCClients_Conf_2010 (CF) Exchange RPC Performance
EXSPI-14X Outlook Client Latency (MT) MSEX_RpcClientLatGt2 (MT) MSEX_RpcClientLatGt5 (MT) MSEX_RpcClientLatGt10 (MT)
EXSPI-14X Edge DC-MSExchange Recipient Filter Agent (MT)
MSEX_RecpientPerf_Conf_2010 (CF) Exchange Recipient Filtering
EXSPI-14X Dc Replication Summary (ST) MSEX_Replication_Conf_2010 (CF) Exchange Replication
EXSPI-14X_ReplicationCopyQueueLength (MT) MSEX_CopyQueueLength (MT)
EXSPI-14X_ReplicationReplayQueueLength (MT) MSEX_ReplayQueueLength (MT)
EXSPI-14X Edge DC-MSExchange Protocol Analysis Agent (MT)
MSEX_SMTPPerf_Conf_2010 (CF) Exchange SMTP
EXSPI-14X-Dc-EdgeMonitorSPAMStatistics (MT) MSEX_ContentFilter_Conf_2010 (CF) Exchange SPAM Statistics
EXSPI-14X-Dc-HubMonitorSPAMStatistics (MT)
EXSPI-14X Edge DC-MSExchange Sender Filter Agent (MT)
MSEX_SenderPerf_Conf_2010 (CF) Exchange Sender ID Filtering
EXSPI-14X Edge DC-MSExchange Sender Id Agent (MT)
EXSPI-14X_Check_ADTopologyServiceStatus(MT) MSEX_ADTopologyServState (MT) Exchange Service Availability
EXSPI-14X_Check_SytemAttendantStatus(MT) MSEX_SAServState (MT)
EXSPI-14X Check Replication Service (MT) MSEX_ReplServState (MT)
EXSPI-14X_Check_UnifiedMessagingStatus (MT) MSEX_UMServState (MT)
EXSPI-14X_Check_ReplicationServiceStatus (MT) MSEX_MbReplicationServState (MT)
EXSPI-14X_Check_CASFileDistributionServiceStatus (MT)
MSEX_FDSServState (MT)
EXSPI-14X_Check_IMAP4ServiceStatus (MT)
MSEX_ImapServState (MT)
EXSPI-14X_Check_POP3ServiceStatus (MT)
MSEX_PopServState (MT)
EXSPI-14X_Check_ADAMServiceStatus (MT) MSEX_ADAMServState (MT)
EXSPI-14X_Check_EdgeCredentialServiceStatus (MT)
MSEX_EdgeCredServState (MT)
EXSPI-14X_Check_EDGEExchangeTransportServiceStatus (MT)
MSEX_TransportServState (MT)
EXSPI-14X_Check_HUBExchangeEdgeSyncServiceStatus (MT)
MSEX_EdgeSyncServState (MT)
EXSPI-14X_Check_HUBExchangeTransportServiceStatus (MT)
MSEX_TransportServState (MT)
EXSPI-14X_Check_InformationStoreServiceStatus (MT)
MSEX_StoreServState (MT)
EXSPI-14X_Check_MailboxAssistantServiceStatus (MT)
MSEX_MbAssistantsServState (MT)
EXSPI-14X_Check_MailSubmissionServiceStatus (MT)
MSEX_SubmissionServState (MT)
EXSPI-14X_Check_MBExchangeServiceHostStatus (MT)
MSEX_ServiceHostServState (MT)
EXSPI-14X Hub Transport DSN (MT) MSEX_DsnDelay (MT) Exchange Transport
EXSPI-14X Hub Th-FailureDSNsTotal (MT) MSEX_DsnFailedTtl (MT)
EXSPI-14X Edge DC-MSExchange Content Filter Agent (MT)
MSEX_TransportFilter_Conf_2010(CF) Exchange Transport Filter
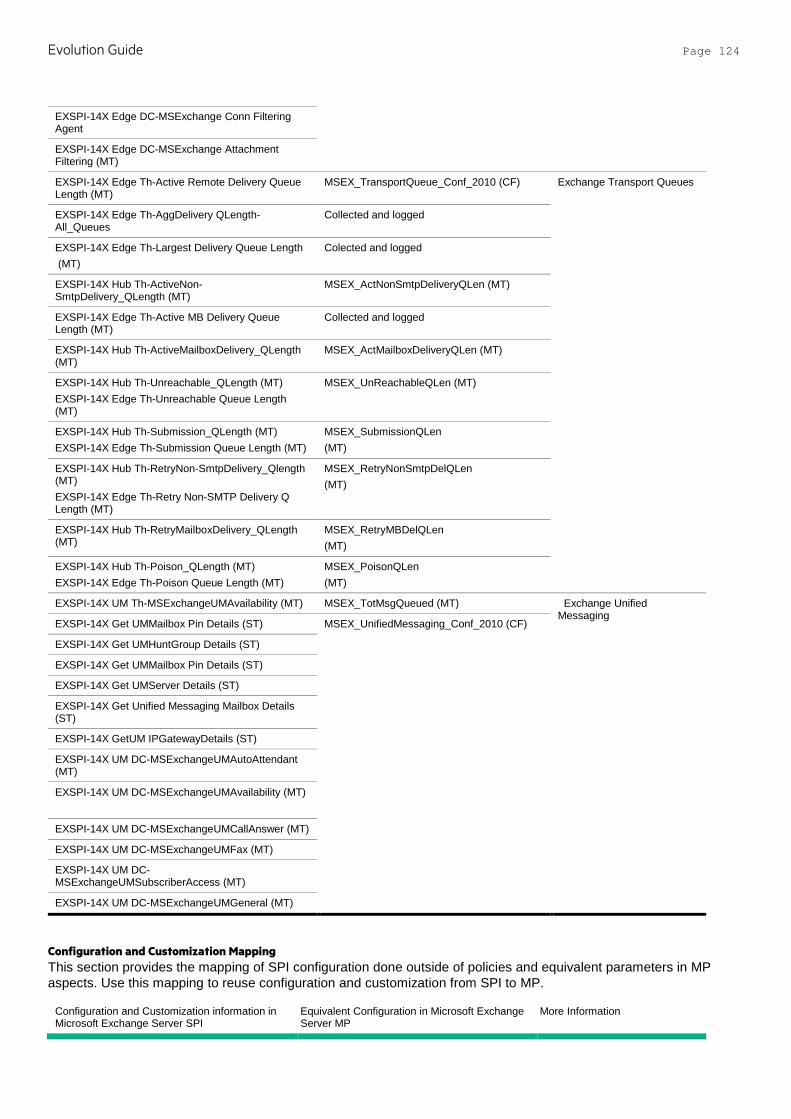
Evolution Guide Page 124
EXSPI-14X Edge DC-MSExchange Conn Filtering Agent
EXSPI-14X Edge DC-MSExchange Attachment Filtering (MT)
EXSPI-14X Edge Th-Active Remote Delivery Queue Length (MT)
MSEX_TransportQueue_Conf_2010 (CF) Exchange Transport Queues
EXSPI-14X Edge Th-AggDelivery QLength-All_Queues
Collected and logged
EXSPI-14X Edge Th-Largest Delivery Queue Length (MT)
Colected and logged
EXSPI-14X Hub Th-ActiveNon-SmtpDelivery_QLength (MT)
MSEX_ActNonSmtpDeliveryQLen (MT)
EXSPI-14X Edge Th-Active MB Delivery Queue Length (MT)
Collected and logged
EXSPI-14X Hub Th-ActiveMailboxDelivery_QLength (MT)
MSEX_ActMailboxDeliveryQLen (MT)
EXSPI-14X Hub Th-Unreachable_QLength (MT) EXSPI-14X Edge Th-Unreachable Queue Length (MT)
MSEX_UnReachableQLen (MT)
EXSPI-14X Hub Th-Submission_QLength (MT) EXSPI-14X Edge Th-Submission Queue Length (MT)
MSEX_SubmissionQLen (MT)
EXSPI-14X Hub Th-RetryNon-SmtpDelivery_Qlength (MT) EXSPI-14X Edge Th-Retry Non-SMTP Delivery Q Length (MT)
MSEX_RetryNonSmtpDelQLen (MT)
EXSPI-14X Hub Th-RetryMailboxDelivery_QLength (MT)
MSEX_RetryMBDelQLen (MT)
EXSPI-14X Hub Th-Poison_QLength (MT) EXSPI-14X Edge Th-Poison Queue Length (MT)
MSEX_PoisonQLen (MT)
EXSPI-14X UM Th-MSExchangeUMAvailability (MT) MSEX_TotMsgQueued (MT) Exchange Unified Messaging
EXSPI-14X Get UMMailbox Pin Details (ST) MSEX_UnifiedMessaging_Conf_2010 (CF)
EXSPI-14X Get UMHuntGroup Details (ST)
EXSPI-14X Get UMMailbox Pin Details (ST)
EXSPI-14X Get UMServer Details (ST)
EXSPI-14X Get Unified Messaging Mailbox Details (ST)
EXSPI-14X GetUM IPGatewayDetails (ST)
EXSPI-14X UM DC-MSExchangeUMAutoAttendant (MT)
EXSPI-14X UM DC-MSExchangeUMAvailability (MT)
EXSPI-14X UM DC-MSExchangeUMCallAnswer (MT)
EXSPI-14X UM DC-MSExchangeUMFax (MT)
EXSPI-14X UM DC-MSExchangeUMSubscriberAccess (MT)
EXSPI-14X UM DC-MSExchangeUMGeneral (MT)
Configuration and Customization Mapping This section provides the mapping of SPI configuration done outside of policies and equivalent parameters in MP aspects. Use this mapping to reuse configuration and customization from SPI to MP.
Configuration and Customization information in Microsoft Exchange Server SPI
Equivalent Configuration in Microsoft Exchange Server MP
More Information
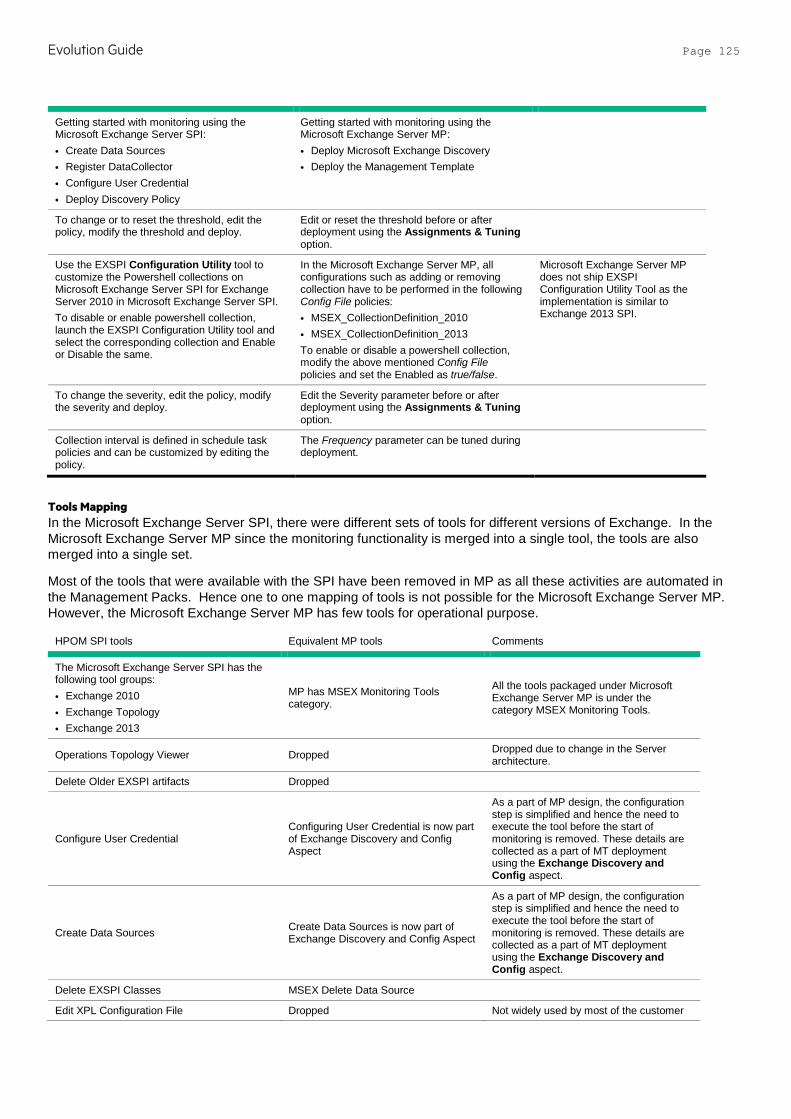
Evolution Guide Page 125
Getting started with monitoring using the Microsoft Exchange Server SPI: • Create Data Sources • Register DataCollector • Configure User Credential • Deploy Discovery Policy
Getting started with monitoring using the Microsoft Exchange Server MP: • Deploy Microsoft Exchange Discovery • Deploy the Management Template
To change or to reset the threshold, edit the policy, modify the threshold and deploy.
Edit or reset the threshold before or after deployment using the Assignments & Tuning option.
Use the EXSPI Configuration Utility tool to customize the Powershell collections on Microsoft Exchange Server SPI for Exchange Server 2010 in Microsoft Exchange Server SPI. To disable or enable powershell collection, launch the EXSPI Configuration Utility tool and select the corresponding collection and Enable or Disable the same.
In the Microsoft Exchange Server MP, all configurations such as adding or removing collection have to be performed in the following Config File policies: • MSEX_CollectionDefinition_2010 • MSEX_CollectionDefinition_2013 To enable or disable a powershell collection, modify the above mentioned Config File policies and set the Enabled as true/false.
Microsoft Exchange Server MP does not ship EXSPI Configuration Utility Tool as the implementation is similar to Exchange 2013 SPI.
To change the severity, edit the policy, modify the severity and deploy.
Edit the Severity parameter before or after deployment using the Assignments & Tuning option.
Collection interval is defined in schedule task policies and can be customized by editing the policy.
The Frequency parameter can be tuned during deployment.
Tools Mapping In the Microsoft Exchange Server SPI, there were different sets of tools for different versions of Exchange. In the Microsoft Exchange Server MP since the monitoring functionality is merged into a single tool, the tools are also merged into a single set.
Most of the tools that were available with the SPI have been removed in MP as all these activities are automated in the Management Packs. Hence one to one mapping of tools is not possible for the Microsoft Exchange Server MP. However, the Microsoft Exchange Server MP has few tools for operational purpose.
HPOM SPI tools Equivalent MP tools Comments
The Microsoft Exchange Server SPI has the following tool groups: • Exchange 2010 • Exchange Topology • Exchange 2013
MP has MSEX Monitoring Tools category.
All the tools packaged under Microsoft Exchange Server MP is under the category MSEX Monitoring Tools.
Operations Topology Viewer Dropped Dropped due to change in the Server architecture.
Delete Older EXSPI artifacts Dropped
Configure User Credential Configuring User Credential is now part of Exchange Discovery and Config Aspect
As a part of MP design, the configuration step is simplified and hence the need to execute the tool before the start of monitoring is removed. These details are collected as a part of MT deployment using the Exchange Discovery and Config aspect.
Create Data Sources Create Data Sources is now part of Exchange Discovery and Config Aspect
As a part of MP design, the configuration step is simplified and hence the need to execute the tool before the start of monitoring is removed. These details are collected as a part of MT deployment using the Exchange Discovery and Config aspect.
Delete EXSPI Classes MSEX Delete Data Source
Edit XPL Configuration File Dropped Not widely used by most of the customer

Evolution Guide Page 126
Exchange Cluster Configuration Dropped Not required as Exchange Server has dropped cluster support.
EXSPI Configuration Utility Dropped Microsoft Exchange Server MP similar to Exchange 2013 SPI architecture. Hence this tool is not required.
EXSPI Trace MSEX Enable Collection Manager Trace
Register DataCollector Registration is now part of Exchange Discovery and Config aspect
As a part of MP design, the configuration step is simplified and hence the need to execute the tool before the start of monitoring is removed. This information is collected as a part of MT deployment by the Exchange Discovery and Config aspect.
Self-Healing Info Dropped Not used
Self-Healing Verification Dropped Not used
Graphs Mapping Microsoft Exchange Server SPI had two sets of graphs one set for Exchange 2010 and another for Exchange 2013. These graphs are merged into a single set with Management Packs. The list of graphs available in the MPs are the following:
HPOM SPI Graphs Equivalent MP Graphs Comments
Virtual Memory Largest Block Size Virtual Memory Largest Block Size (Exchange Server 2010)
Virtual Memory Large Free Block Megabytes Usage
Virtual Memory Large Free Block Megabytes Usage (Exchange Server 2010)
Virtual Memory 16MB Free Block Trend Virtual Memory 16MB Free Block Trend (Exchange Server 2010)
Information Store Users and Connections Information Store Users and Connections (Exchange Server 2010)
MAPI RPC Performance MAPI RPC Performance (Exchange Server 2010)
MAPI RPC Latency Levels MAPI RPC Latency Levels (Exchange Server 2010)
Outlook Client RPC Performance Outlook Client RPC Performance (Exchange Server 2010)
Outlook Client Failures Outlook Client Failures (Exchange Server 2010)
Public Folder Store Queues Dropped Data is getting logged
Mailbox Store Queues Dropped Data is getting logged
Mailbox Store Delivery Time Mailbox Store Delivery Time (Exchange Server 2010)
Public Folder Store Delivery Time Dropped Data is getting logged
Mailbox Store Message Volume Mailbox Store Message Volume
Public Folder Store Message Volume Dropped Data is getting logged
IMAP4 Connections IMAP4 Connections
POP3 Performance Dropped Data is getting logged
POP3 Connections POP3 Connections
Exchange 2010 Mailbox Store EDB Database Statistics Exchange Mailbox Store EDB Database Statistics
Exchange 2010 Public Folder Store EDB Database Statistics Dropped Data is getting logged
Transport Server Queues Transport Server Queues
Node Cleanup Remove SPI artifacts from the node that you are going to monitor using the Microsoft Exchange Server MP. Following are the SPI artifacts that need to be removed in the given order:
Evolution Guide Page 127
1. Remove policy templates from the node.
a. Use the ovpolicy –l to view a list of policies.
Note All EX SPI policies start with EXSPI.
b. Execute one of the following commands to remove policies:
• By Name: ovpolicy –remove –polname <Name>
• By Type: ovpolicy –remove –poltype <Type>
Note Before you move from OM to OMi, make sure you do not remove the flexible management policy of type "mgrconf" if it has already been deployed.
You can also remove policies by deleting policy groups for a particular node on the server using the GUI.
2. Remove the CODA / OVPA data sources.
Remove CODA or OVPA data sources using the command MSEX_DeleteDS.bat under instrumentation or run the tool Delete EXSPI Classes to remove the EXSPI data sources on the HPOM Server.
a. Restart CODA: ovc –restart coda
b. Verify Datasource removal: ovcodautil –showds
Note There should not be any datasources listed as EXSPI_DATA. Management Pack automatically creates datasources only on CODA.
3. Remove Instrumentation.
The instrumentation files on the node that are prefixed or suffixed with “Exchange_”, “HP.OV.SPI.EX”, “EXSPI_”, and “remoteconfigutil” can be deleted.
Note Instrumentation removal may fail if any executable or script is running. Stop the corresponding process (es) and then delete the instrumentation files.
For more information on how to back up the data if you need the data for future use, see the SHR documentation.
Instrumentation folder:
On Windows: %OvAgentDir%\bin\instrumentation
4. Remove the log files.
Remove the EXSPI log files are created under the folder <OvAgentDrive>/log. The log file names starts or ends with “EXSPI” or “Exchange_”.
Remove the EXSPI temp files that are created under the folder: <OvAgentDrive>/bin/instrumentation/EXSPI
For more information on cleaning up nodes, see Prepare nodes for deployment under the Recommended steps for moving from a SPI to MP section in this document.
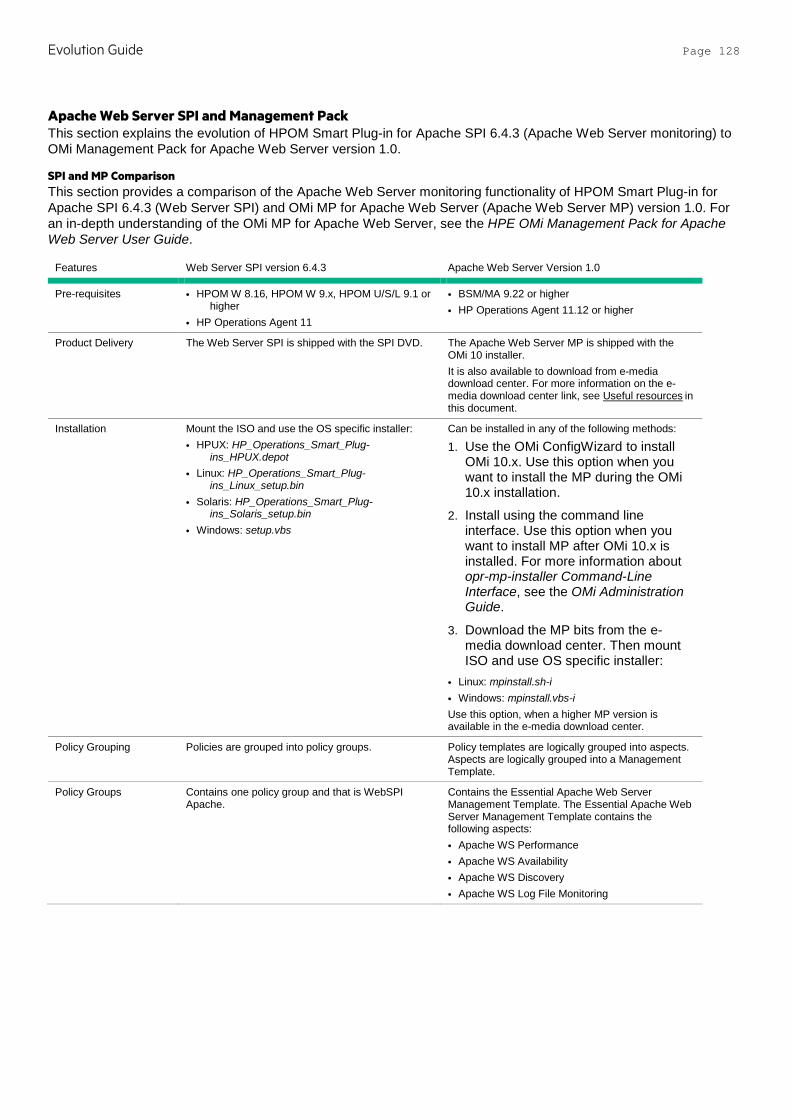
Evolution Guide Page 128
Apache Web Server SPI and Management Pack This section explains the evolution of HPOM Smart Plug-in for Apache SPI 6.4.3 (Apache Web Server monitoring) to OMi Management Pack for Apache Web Server version 1.0.
SPI and MP Comparison This section provides a comparison of the Apache Web Server monitoring functionality of HPOM Smart Plug-in for Apache SPI 6.4.3 (Web Server SPI) and OMi MP for Apache Web Server (Apache Web Server MP) version 1.0. For an in-depth understanding of the OMi MP for Apache Web Server, see the HPE OMi Management Pack for Apache Web Server User Guide.
Features Web Server SPI version 6.4.3 Apache Web Server Version 1.0
Pre-requisites • HPOM W 8.16, HPOM W 9.x, HPOM U/S/L 9.1 or higher
• HP Operations Agent 11
• BSM/MA 9.22 or higher • HP Operations Agent 11.12 or higher
Product Delivery The Web Server SPI is shipped with the SPI DVD. The Apache Web Server MP is shipped with the OMi 10 installer. It is also available to download from e-media download center. For more information on the e-media download center link, see Useful resources in this document.
Installation Mount the ISO and use the OS specific installer: • HPUX: HP_Operations_Smart_Plug-
ins_HPUX.depot • Linux: HP_Operations_Smart_Plug-
ins_Linux_setup.bin • Solaris: HP_Operations_Smart_Plug-
ins_Solaris_setup.bin • Windows: setup.vbs
Can be installed in any of the following methods:
1. Use the OMi ConfigWizard to install OMi 10.x. Use this option when you want to install the MP during the OMi 10.x installation.
2. Install using the command line interface. Use this option when you want to install MP after OMi 10.x is installed. For more information about opr-mp-installer Command-Line Interface, see the OMi Administration Guide.
3. Download the MP bits from the e-media download center. Then mount ISO and use OS specific installer:
• Linux: mpinstall.sh-i • Windows: mpinstall.vbs-i Use this option, when a higher MP version is available in the e-media download center.
Policy Grouping Policies are grouped into policy groups. Policy templates are logically grouped into aspects. Aspects are logically grouped into a Management Template.
Policy Groups Contains one policy group and that is WebSPI Apache.
Contains the Essential Apache Web Server Management Template. The Essential Apache Web Server Management Template contains the following aspects: • Apache WS Performance • Apache WS Availability • Apache WS Discovery • Apache WS Log File Monitoring
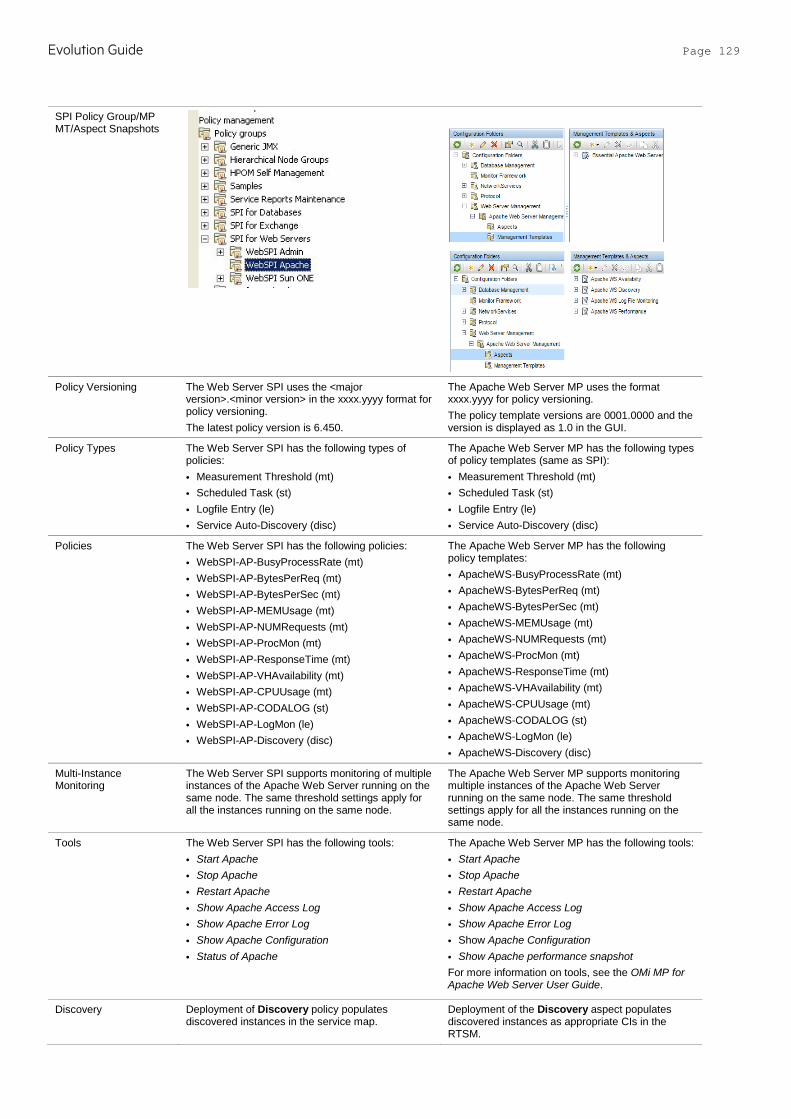
Evolution Guide Page 129
SPI Policy Group/MP MT/Aspect Snapshots
Policy Versioning The Web Server SPI uses the <major version>.<minor version> in the xxxx.yyyy format for policy versioning. The latest policy version is 6.450.
The Apache Web Server MP uses the format xxxx.yyyy for policy versioning. The policy template versions are 0001.0000 and the version is displayed as 1.0 in the GUI.
Policy Types The Web Server SPI has the following types of policies: • Measurement Threshold (mt) • Scheduled Task (st) • Logfile Entry (le) • Service Auto-Discovery (disc)
The Apache Web Server MP has the following types of policy templates (same as SPI): • Measurement Threshold (mt) • Scheduled Task (st) • Logfile Entry (le) • Service Auto-Discovery (disc)
Policies The Web Server SPI has the following policies: • WebSPI-AP-BusyProcessRate (mt) • WebSPI-AP-BytesPerReq (mt) • WebSPI-AP-BytesPerSec (mt) • WebSPI-AP-MEMUsage (mt) • WebSPI-AP-NUMRequests (mt) • WebSPI-AP-ProcMon (mt) • WebSPI-AP-ResponseTime (mt) • WebSPI-AP-VHAvailability (mt) • WebSPI-AP-CPUUsage (mt) • WebSPI-AP-CODALOG (st) • WebSPI-AP-LogMon (le) • WebSPI-AP-Discovery (disc)
The Apache Web Server MP has the following policy templates: • ApacheWS-BusyProcessRate (mt) • ApacheWS-BytesPerReq (mt) • ApacheWS-BytesPerSec (mt) • ApacheWS-MEMUsage (mt) • ApacheWS-NUMRequests (mt) • ApacheWS-ProcMon (mt) • ApacheWS-ResponseTime (mt) • ApacheWS-VHAvailability (mt) • ApacheWS-CPUUsage (mt) • ApacheWS-CODALOG (st) • ApacheWS-LogMon (le) • ApacheWS-Discovery (disc)
Multi-Instance Monitoring
The Web Server SPI supports monitoring of multiple instances of the Apache Web Server running on the same node. The same threshold settings apply for all the instances running on the same node.
The Apache Web Server MP supports monitoring multiple instances of the Apache Web Server running on the same node. The same threshold settings apply for all the instances running on the same node.
Tools The Web Server SPI has the following tools: • Start Apache • Stop Apache • Restart Apache • Show Apache Access Log • Show Apache Error Log • Show Apache Configuration • Status of Apache
The Apache Web Server MP has the following tools: • Start Apache • Stop Apache • Restart Apache • Show Apache Access Log • Show Apache Error Log • Show Apache Configuration • Show Apache performance snapshot For more information on tools, see the OMi MP for Apache Web Server User Guide.
Discovery Deployment of Discovery policy populates discovered instances in the service map.
Deployment of the Discovery aspect populates discovered instances as appropriate CIs in the RTSM.
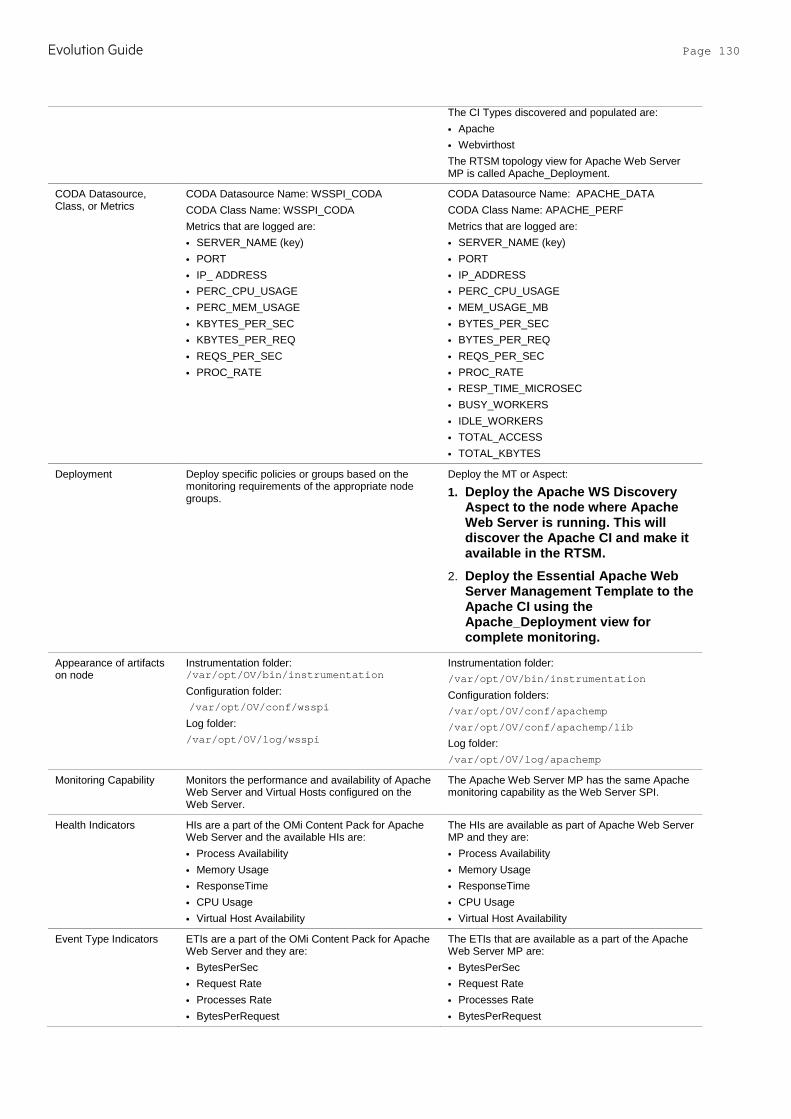
Evolution Guide Page 130
The CI Types discovered and populated are: • Apache • Webvirthost The RTSM topology view for Apache Web Server MP is called Apache_Deployment.
CODA Datasource, Class, or Metrics
CODA Datasource Name: WSSPI_CODA CODA Class Name: WSSPI_CODA Metrics that are logged are: • SERVER_NAME (key) • PORT • IP_ ADDRESS • PERC_CPU_USAGE • PERC_MEM_USAGE • KBYTES_PER_SEC • KBYTES_PER_REQ • REQS_PER_SEC • PROC_RATE
CODA Datasource Name: APACHE_DATA CODA Class Name: APACHE_PERF Metrics that are logged are: • SERVER_NAME (key) • PORT • IP_ADDRESS • PERC_CPU_USAGE • MEM_USAGE_MB • BYTES_PER_SEC • BYTES_PER_REQ • REQS_PER_SEC • PROC_RATE • RESP_TIME_MICROSEC • BUSY_WORKERS • IDLE_WORKERS • TOTAL_ACCESS • TOTAL_KBYTES
Deployment Deploy specific policies or groups based on the monitoring requirements of the appropriate node groups.
Deploy the MT or Aspect:
1. Deploy the Apache WS Discovery Aspect to the node where Apache Web Server is running. This will discover the Apache CI and make it available in the RTSM.
2. Deploy the Essential Apache Web Server Management Template to the Apache CI using the Apache_Deployment view for complete monitoring.
Appearance of artifacts on node
Instrumentation folder: /var/opt/OV/bin/instrumentation Configuration folder: /var/opt/OV/conf/wsspi Log folder: /var/opt/OV/log/wsspi
Instrumentation folder: /var/opt/OV/bin/instrumentation
Configuration folders: /var/opt/OV/conf/apachemp
/var/opt/OV/conf/apachemp/lib Log folder: /var/opt/OV/log/apachemp
Monitoring Capability Monitors the performance and availability of Apache Web Server and Virtual Hosts configured on the Web Server.
The Apache Web Server MP has the same Apache monitoring capability as the Web Server SPI.
Health Indicators HIs are a part of the OMi Content Pack for Apache Web Server and the available HIs are: • Process Availability • Memory Usage • ResponseTime • CPU Usage • Virtual Host Availability
The HIs are available as part of Apache Web Server MP and they are: • Process Availability • Memory Usage • ResponseTime • CPU Usage • Virtual Host Availability
Event Type Indicators ETIs are a part of the OMi Content Pack for Apache Web Server and they are: • BytesPerSec • Request Rate • Processes Rate • BytesPerRequest
The ETIs that are available as a part of the Apache Web Server MP are: • BytesPerSec • Request Rate • Processes Rate • BytesPerRequest

Evolution Guide Page 131
TBEC Rules TBEC rules are a part of the OMi Content Pack for Apache Web Server. HI: Virtual Host Availability correlates below HI: Process Availability
The following TBEC rule is available as part of the Apache Web Server MP. HI: Virtual Host Availability correlates below HI: Process Availability
Tuning after Deployment You can modify policies for customization. Customized versions have to be deployed manually to the node for customizations to take effect.
You can tune the parameters during the deployment of a specific CI. You can also tune parameter values after deploying a specific CI using the Assignments & Tuning option. The policy templates are automatically deployed after the parameters are tuned. Threshold, Severity and collection frequency are parameterized.
Uninstallation Native procedure is used to uninstall Web Server SPI.
Artifacts can be removed manually in the following order: • Assignments • MTs • Aspects • Policy Templates • Instrumentation • Content Pack definitions
Graphs No graphs are available as part of the Web Server SPI.
Provides four out-of-the-box graphs and they are: • Busy Process Rate vs Response Time • CPU Usage vs Response Time • Memory Usage vs Response Time • Apache Load Statistics
I18N & L10N The Web Server SPI is I18N certified and is localized in the Japanese language.
The Apache Web Server MP is I18N certified and is localized in the Japanese and Simplified Chinese languages.
OO Flows Not Available Not Available
Common Policy Changes The only change in the policies between the Apache Web Server compared to the Apache monitoring features in the Web Server SPI is the addition of parameters in the MP policy templates. For more information on parameters, see the OMi MP for Apache Web Server User Guide.
Policy Specific Changes There are no policy specific changes in the Apache Web Server MP. The policy templates in the Apache Web Server MP provide the same functionality as the policies in the SPI. There is a 1-1 mapping between the policy templates of the Apache Web Server MP and Apache monitoring policies in Web Server SPI as mentioned in the next section.
SPI Policy to MP Policy Template Mapping This section provides a mapping between the Web Server SPI and Apache Web Server MP:
Web Server SPI version 6.4.3 Apache Web Server MP Version 1.0 Apache Web Server Version 1.0 - Aspect
WebSPI-AP-BusyProcessRate (Measurement Threshold)
ApacheWS-BusyProcessRate (Measurement Threshold)
Apache WS Performance
WebSPI-AP-BytesPerReq (Measurement Threshold)
ApacheWS-BytesPerReq (Measurement Threshold)
Apache WS Performance
WebSPI-AP-BytesPerSec (Measurement Threshold)
ApacheWS-BytesPerSec (Measurement Threshold)
Apache WS Performance
WebSPI-AP-MEMUsage (Measurement Threshold)
ApacheWS-MEMUsage (Measurement Threshold)
Apache WS Performance
WebSPI-AP-NUMRequests (Measurement Threshold)
ApacheWS-NUMRequests (Measurement Threshold)
Apache WS Performance
WebSPI-AP-CPUUsage (Measurement Threshold)
ApacheWS-CPUUsage (Measurement Threshold)
Apache WS Performance
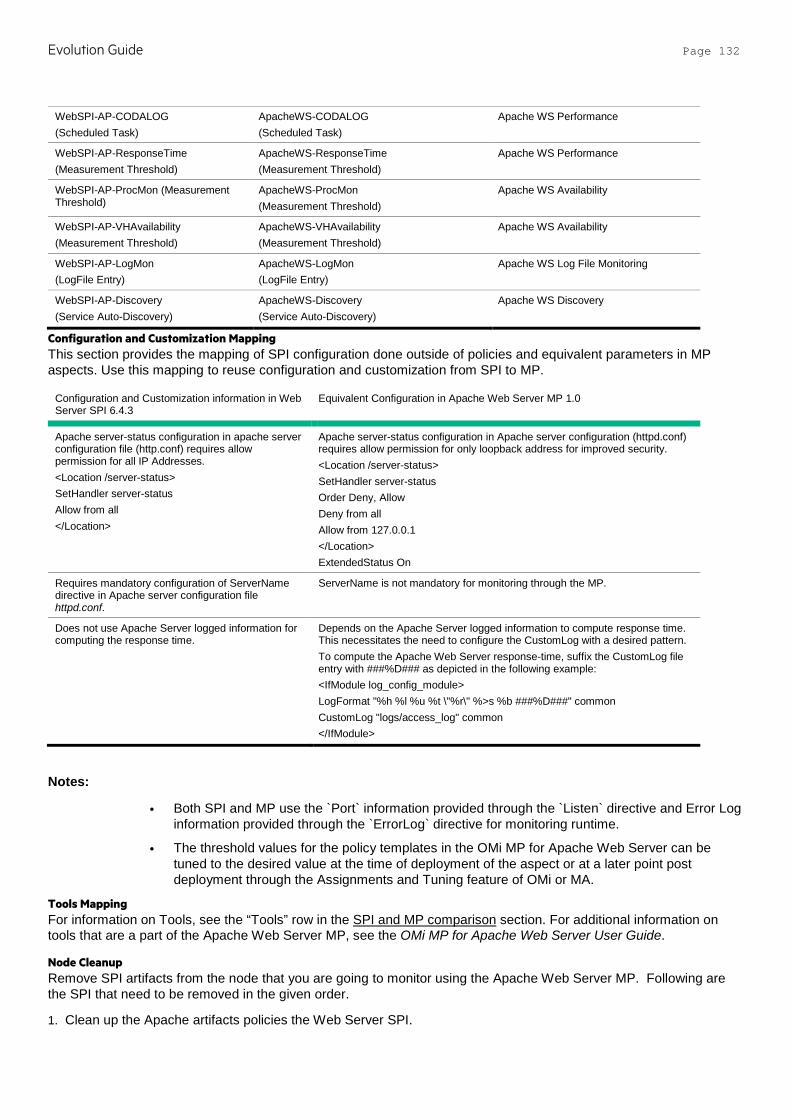
Evolution Guide Page 132
WebSPI-AP-CODALOG (Scheduled Task)
ApacheWS-CODALOG (Scheduled Task)
Apache WS Performance
WebSPI-AP-ResponseTime (Measurement Threshold)
ApacheWS-ResponseTime (Measurement Threshold)
Apache WS Performance
WebSPI-AP-ProcMon (Measurement Threshold)
ApacheWS-ProcMon (Measurement Threshold)
Apache WS Availability
WebSPI-AP-VHAvailability (Measurement Threshold)
ApacheWS-VHAvailability (Measurement Threshold)
Apache WS Availability
WebSPI-AP-LogMon (LogFile Entry)
ApacheWS-LogMon (LogFile Entry)
Apache WS Log File Monitoring
WebSPI-AP-Discovery (Service Auto-Discovery)
ApacheWS-Discovery (Service Auto-Discovery)
Apache WS Discovery
Configuration and Customization Mapping This section provides the mapping of SPI configuration done outside of policies and equivalent parameters in MP aspects. Use this mapping to reuse configuration and customization from SPI to MP.
Configuration and Customization information in Web Server SPI 6.4.3
Equivalent Configuration in Apache Web Server MP 1.0
Apache server-status configuration in apache server configuration file (http.conf) requires allow permission for all IP Addresses. <Location /server-status> SetHandler server-status Allow from all </Location>
Apache server-status configuration in Apache server configuration (httpd.conf) requires allow permission for only loopback address for improved security. <Location /server-status> SetHandler server-status Order Deny, Allow Deny from all Allow from 127.0.0.1 </Location> ExtendedStatus On
Requires mandatory configuration of ServerName directive in Apache server configuration file httpd.conf.
ServerName is not mandatory for monitoring through the MP.
Does not use Apache Server logged information for computing the response time.
Depends on the Apache Server logged information to compute response time. This necessitates the need to configure the CustomLog with a desired pattern. To compute the Apache Web Server response-time, suffix the CustomLog file entry with ###%D### as depicted in the following example: <IfModule log_config_module> LogFormat "%h %l %u %t \"%r\" %>s %b ###%D###" common CustomLog "logs/access_log" common </IfModule>
Notes:
• Both SPI and MP use the `Port` information provided through the `Listen` directive and Error Log information provided through the `ErrorLog` directive for monitoring runtime.
• The threshold values for the policy templates in the OMi MP for Apache Web Server can be tuned to the desired value at the time of deployment of the aspect or at a later point post deployment through the Assignments and Tuning feature of OMi or MA.
Tools Mapping For information on Tools, see the “Tools” row in the SPI and MP comparison section. For additional information on tools that are a part of the Apache Web Server MP, see the OMi MP for Apache Web Server User Guide.
Node Cleanup Remove SPI artifacts from the node that you are going to monitor using the Apache Web Server MP. Following are the SPI that need to be removed in the given order.
1. Clean up the Apache artifacts policies the Web Server SPI.
Evolution Guide Page 133
a. Identify the list of policies installed using the command ovpolicy –l.
b. Remove all the policies prefixed with WebSPI-AP using the command ovpolicy –remove –polname <policy name>
You can also remove policies by deleting policy groups for a particular node on the server using the GUI.
2. Remove the CODA/OVPA datasources for Apache Web Serverusing the following command:
ddfutil "/var/opt/OV/wsspi/WSSPI-LOG-SET" –rm all
The datasource name for Apache Web Server is WSSPI_CODA.
Note This will remove the complete set of datasources for WebServer SPI, which also includes IIS and iPlanet SPI datasources. You can skip this step if the IIS and iPlanet SPIs are in use.
Note Removing the CODA datasource has no impact on the evolution from SPI to MP. This is only an optional clean up step.
3. Run the following commands in order:
a. ovc –restart coda - Re-starts the CODA server for the changes to take effect.
b. ovc –showds - Verifies the datasource named WSSPI_CODA has been removed.
4. Remove the instrumentation on the node. The instrumentation files are located at /var/opt/OV/bin/instrumentation folder. Remove files with name prefixed with “wsspi_”.
Note Instrumentation removal may fail if any executable or script is running. Stop the corresponding process (es) and then delete the instrumentation files.
For more information on how to back up the data if you need the data for future use, see the SHR documentation.
5. Remove the configuration files located in the /var/opt/OV/conf/wsspi folder.
This will remove the complete set of cofiguration files for WebServer SPI, which also includes IIS and iPlanet SPI datasources.
Note Removing the CODA datasource has no impact on the evolution from SPI to MP. This is only an optional clean up step.
For more information on cleaning up nodes, see Prepare nodes for deployment under the Recommended steps for moving from a SPI to MP section in this document.
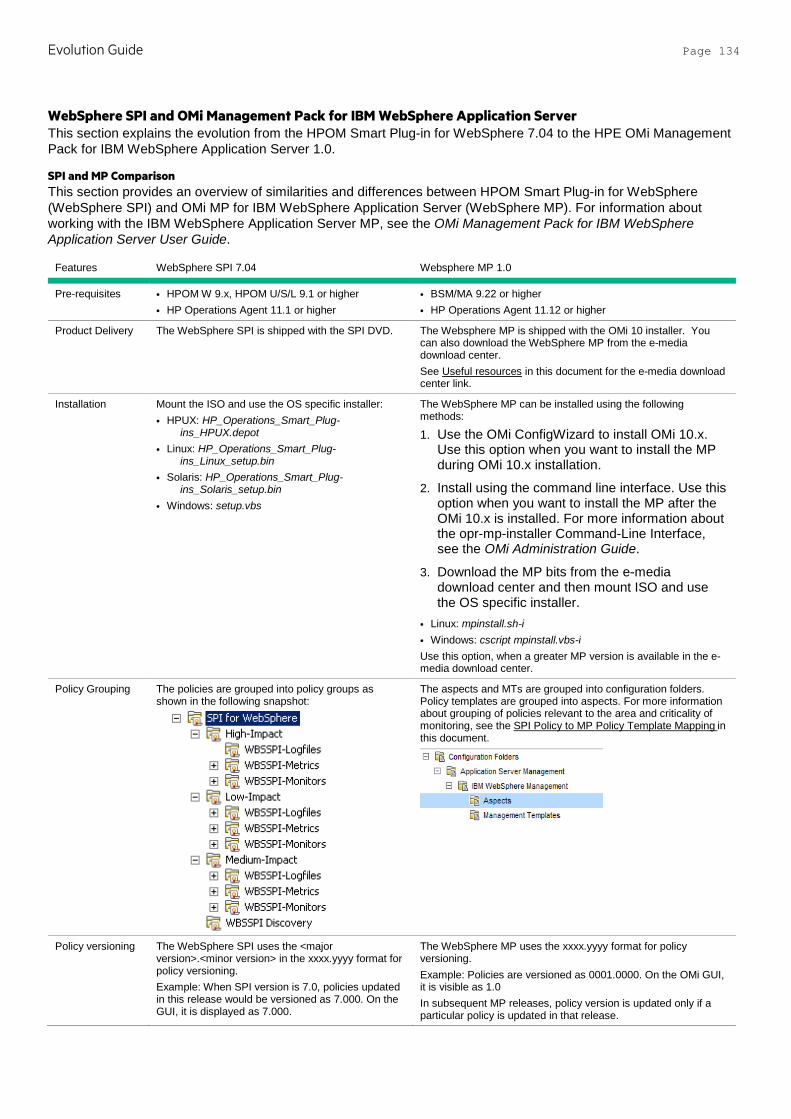
Evolution Guide Page 134
WebSphere SPI and OMi Management Pack for IBM WebSphere Application Server This section explains the evolution from the HPOM Smart Plug-in for WebSphere 7.04 to the HPE OMi Management Pack for IBM WebSphere Application Server 1.0.
SPI and MP Comparison This section provides an overview of similarities and differences between HPOM Smart Plug-in for WebSphere (WebSphere SPI) and OMi MP for IBM WebSphere Application Server (WebSphere MP). For information about working with the IBM WebSphere Application Server MP, see the OMi Management Pack for IBM WebSphere Application Server User Guide.
Features WebSphere SPI 7.04 Websphere MP 1.0
Pre-requisites • HPOM W 9.x, HPOM U/S/L 9.1 or higher • HP Operations Agent 11.1 or higher
• BSM/MA 9.22 or higher • HP Operations Agent 11.12 or higher
Product Delivery The WebSphere SPI is shipped with the SPI DVD. The Websphere MP is shipped with the OMi 10 installer. You can also download the WebSphere MP from the e-media download center. See Useful resources in this document for the e-media download center link.
Installation Mount the ISO and use the OS specific installer: • HPUX: HP_Operations_Smart_Plug-
ins_HPUX.depot • Linux: HP_Operations_Smart_Plug-
ins_Linux_setup.bin • Solaris: HP_Operations_Smart_Plug-
ins_Solaris_setup.bin • Windows: setup.vbs
The WebSphere MP can be installed using the following methods:
1. Use the OMi ConfigWizard to install OMi 10.x. Use this option when you want to install the MP during OMi 10.x installation.
2. Install using the command line interface. Use this option when you want to install the MP after the OMi 10.x is installed. For more information about the opr-mp-installer Command-Line Interface, see the OMi Administration Guide.
3. Download the MP bits from the e-media download center and then mount ISO and use the OS specific installer.
• Linux: mpinstall.sh-i • Windows: cscript mpinstall.vbs-i Use this option, when a greater MP version is available in the e-media download center.
Policy Grouping The policies are grouped into policy groups as shown in the following snapshot:
The aspects and MTs are grouped into configuration folders. Policy templates are grouped into aspects. For more information about grouping of policies relevant to the area and criticality of monitoring, see the SPI Policy to MP Policy Template Mapping in this document.
Policy versioning The WebSphere SPI uses the <major version>.<minor version> in the xxxx.yyyy format for policy versioning. Example: When SPI version is 7.0, policies updated in this release would be versioned as 7.000. On the GUI, it is displayed as 7.000.
The WebSphere MP uses the xxxx.yyyy format for policy versioning. Example: Policies are versioned as 0001.0000. On the OMi GUI, it is visible as 1.0 In subsequent MP releases, policy version is updated only if a particular policy is updated in that release.

Evolution Guide Page 135
When you update such a policy, only minor versions (last two digits) should be updated. Example: When you update a policy with version 7.000 (in GUI: 7.000), it will be changed to 7.0100 (in GUI 7.100).
When you update a policy, only minor versions (last two digits) are updated. Example: When you update a policy with version 0001.0000 (in GUI 1.0), it will be changed to 0001.0001 (in GUI 1.1).
Policy Types The WebSphere SPI has the following types of policies: • Measurement Threshold • Scheduled Task • Logfile • Service Auto-Discovery • Message Interface
The WebSphere MP has similar type of policy templates as those used in SPI. In addition, it has policy templates of type ConfigFile. For more details about policy changes, see Common Policy Changes in this document.
Message Groups The WebSphere SPI contains message groups to generate events such as WebSphere.
The WebSphere MP has exactly same set of message groups as in the SPI.
Node Groups Has node groups called SPI for WebSphere and the group is created based on the discovered WebSphere version.
Node groups are not required in MP as the topology is based on CIs which is updated in the RTSM.
Tools Following are the tools available in SPI: • SPI Admin tools group • WebSphere Admin tools group • Metric Reports
In the WebSphere MP, there are tools to start, stop, or restart monitoring. Few of the tools which exist in SPI are not available in MP. For more information about the tools that are dropped, see the Tools Mapping.
Instrumentation The WebSphere SPI contains the WebSphere instrumentation category.
The WebSphere MP contains the Instrumentation category called WebSphere_Monitoring. OMi Server: Instrumentation is uploaded into the OMi database. Instrumentation deployment on the Node: There is no difference with the instrumentation location on nodes. Instrumentation is deployed to the same directories as in the SPIs. Instrumentation filenames have changed in MP.
Discovery Deploy the following policies from the policy group WBSSPI Discovery to a managed node. WBSSPI Discovery • WBSSPI-Messages • WBSSPI Service Discovery After the Discovery policy is deployed successfully, the discovered instances are shown in the service map.
The WebSphere MP has two types of Discovery: When you deploy the Discovery aspect, all the J2EE domain and J2EE Server CIs are discovered. When you deploy an MT, the remaining J2EE application and JDBC DataSources CIs are discovered. To discover the WebSphere CIs: Deploy the WebSphere Discovery aspect to the node before deploying an aspect or an MT. When you deploy an aspect or an MT to the J2EE Domain, the extended discovery discovers the J2EE applications and JDBC datasources. There is no difference in topology that is discovered by WBSSPI and WebSphere MP.
Configuration Run the Configure tool and in the Configuration Editor, specify the following required parameters: • Login • Password • JavaHome • WebSphere Home There are other optional parameters that you can provide. For more information about configuration file, priority, and parameters, see the WebSphereSPI online help.
All the configuration is done as a part of the deployment process using parameters. The required parameters are username and password. There are optional parameters such as JAVA_HOME, Passpharse and so on. For more information about Parameters, see the OMi MP for IBM WebSphere Application Server User Guide.
Deployment Deploy specific policies or policy groups based on monitoring needs to appropriate node(s) or node group(s).
Deploy the MT or Aspect: • Deploy Discovery Aspect • Deploy Aspect or MT Assign Management Template to the J2EE domain CIs. Specify the configuration details such as username and password as parameters for successful deployment of MTs. Create Automatic Assignment Rules for Auto-deployment of MT and aspects.

Evolution Guide Page 136
Note It is not recommended to update configuration directly on the node as it will make the values out-of-sync.
Appearance of artifacts on node
Instrumentation: %ovdatadir%/bin/instrumentation
Policy list: Use the ovpolicy –l command to view a list of policies. Example: #ovpolicy –l
"Websphere_Discovery" enabled 01.0000 Policy names: The policy names are prefixed as WBSSPI_. Logfiles location: The SPI logfiles are located under <OvAgentDir>. • wasspi/wbs/log/Discovery.log • wasspi/wbs/log/Collector.log • wasspi/wbs/log/wasspi_perl.log • wasspi/wbs/log/CollectorClient.log
Instrumentation: %ovdatadir%/bin/instrumentation
Policy list: Use the ovpolicy –l command to view a list of policy templates. In the policy list, every parameterized policy template will have an extra entry with “<policy type>tmpl” in the “Type” column as provided in the following example: # ovpolicy –l
configfile "Websphere_Configuration" enabled 0001.0000 configfiletmpl "Websphere_Configuration" enabled 0001.0000 Policy Template Names: The policy names are prefixed with Websphere_. MP Logfiles: Logfiles can be located under <OvDataDir>/log/Websphere • WebSphere_Perl.log • Collector.log • collectionManager/collector_Schedule.log Folders and files remain same on the node.
Monitoring Capability
Monitoring functionality in WBSSPI: • Availability of Websphere Application Server,
Cluster, and Applications • Performance of WebSPhere Application Server
components such as JDBC DataSource, Applications, and Servlets.
For more information about the monitoring functionality, see the WBSSPI user guide.
All monitoring functionality which are supported for WebSphere SPI are present in WebSphere MP except the following: • User Defined Metrics • Remote Monitoring of WBS
Tuning after Deployment
You can customize threshold, message groups, and severity (any) can be done by editing the policies. Re-deploy the new version of policy which can later be deployed to the node.
You can tune parameters during deployment for a specific CI. You also can tune parameter values after deploying a specific CI from the Assignments & Tuning pane. After parameters are tuned, the policy templates are automatically deployed. The threshold, severity and collection frequency are parameterized.
Monitoring multiple instances
Supports monitoring of multiple instances of WBS with the limitation that the credentials are same across the WBS instances on a managed node that is the policy parameters are applicable for all instances of WBS on a node.
Parameters are applicable for all instances of WBS. However during deployment, the parameters can be tuned for particular instance of WBS. The Instance parameter (Server Name) is used to identify a particular instance of WBS.
End-to-End monitoring
Deploy the WBSSPI to monitor only the WBS environment. For the Cross Domain monitoring, deploy Infrastructure SPI policies to monitor system infrastructure such as the CPU, Memory, Disk, File System, and so on. Deploy Oracle policies to monitor Oracle
Deploy the essential or extensive MT for WebSphere to monitor the WebSphere components. The Essential MT has a set of aspects or policies that monitors the key health metrics of WBS. The Extensive MT has a wider range of policies to monitor additional metrics. For the cross domain monitoring, use the Extensive MT for WebSphere. Use the Extensive WebSphere and Oracle Database Management to monitor System Infrastructure, Oracle and WebSphere resources.
Monitoring instances with different business criticality
Maintain multiple policies set based on business criticality.
Deploy the essential MT to monitor less critical environment. Use the extensive MT to monitor critical Infrastructure.
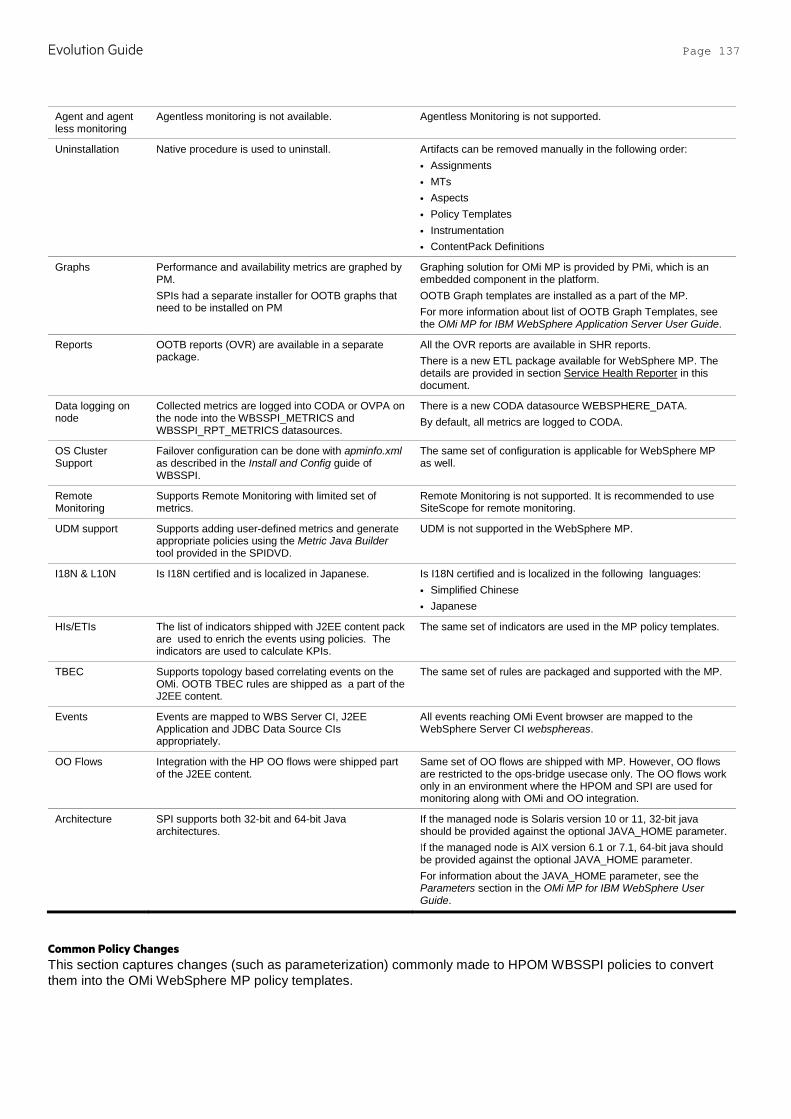
Evolution Guide Page 137
Agent and agent less monitoring
Agentless monitoring is not available. Agentless Monitoring is not supported.
Uninstallation Native procedure is used to uninstall. Artifacts can be removed manually in the following order: • Assignments • MTs • Aspects • Policy Templates • Instrumentation • ContentPack Definitions
Graphs Performance and availability metrics are graphed by PM. SPIs had a separate installer for OOTB graphs that need to be installed on PM
Graphing solution for OMi MP is provided by PMi, which is an embedded component in the platform. OOTB Graph templates are installed as a part of the MP. For more information about list of OOTB Graph Templates, see the OMi MP for IBM WebSphere Application Server User Guide.
Reports OOTB reports (OVR) are available in a separate package.
All the OVR reports are available in SHR reports. There is a new ETL package available for WebSphere MP. The details are provided in section Service Health Reporter in this document.
Data logging on node
Collected metrics are logged into CODA or OVPA on the node into the WBSSPI_METRICS and WBSSPI_RPT_METRICS datasources.
There is a new CODA datasource WEBSPHERE_DATA. By default, all metrics are logged to CODA.
OS Cluster Support
Failover configuration can be done with apminfo.xml as described in the Install and Config guide of WBSSPI.
The same set of configuration is applicable for WebSphere MP as well.
Remote Monitoring
Supports Remote Monitoring with limited set of metrics.
Remote Monitoring is not supported. It is recommended to use SiteScope for remote monitoring.
UDM support Supports adding user-defined metrics and generate appropriate policies using the Metric Java Builder tool provided in the SPIDVD.
UDM is not supported in the WebSphere MP.
I18N & L10N Is I18N certified and is localized in Japanese. Is I18N certified and is localized in the following languages: • Simplified Chinese • Japanese
HIs/ETIs The list of indicators shipped with J2EE content pack are used to enrich the events using policies. The indicators are used to calculate KPIs.
The same set of indicators are used in the MP policy templates.
TBEC Supports topology based correlating events on the OMi. OOTB TBEC rules are shipped as a part of the J2EE content.
The same set of rules are packaged and supported with the MP.
Events Events are mapped to WBS Server CI, J2EE Application and JDBC Data Source CIs appropriately.
All events reaching OMi Event browser are mapped to the WebSphere Server CI websphereas.
OO Flows Integration with the HP OO flows were shipped part of the J2EE content.
Same set of OO flows are shipped with MP. However, OO flows are restricted to the ops-bridge usecase only. The OO flows work only in an environment where the HPOM and SPI are used for monitoring along with OMi and OO integration.
Architecture SPI supports both 32-bit and 64-bit Java architectures.
If the managed node is Solaris version 10 or 11, 32-bit java should be provided against the optional JAVA_HOME parameter. If the managed node is AIX version 6.1 or 7.1, 64-bit java should be provided against the optional JAVA_HOME parameter. For information about the JAVA_HOME parameter, see the Parameters section in the OMi MP for IBM WebSphere User Guide.
Common Policy Changes This section captures changes (such as parameterization) commonly made to HPOM WBSSPI policies to convert them into the OMi WebSphere MP policy templates.
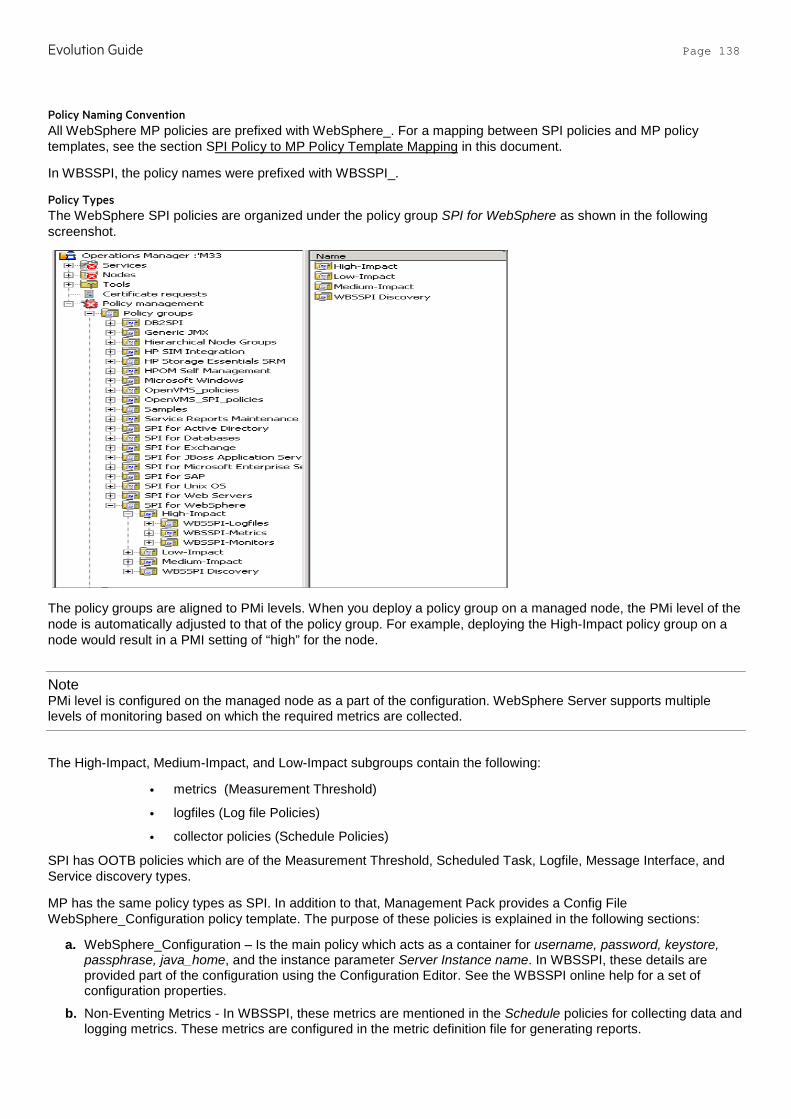
Evolution Guide Page 138
Policy Naming Convention All WebSphere MP policies are prefixed with WebSphere_. For a mapping between SPI policies and MP policy templates, see the section SPI Policy to MP Policy Template Mapping in this document.
In WBSSPI, the policy names were prefixed with WBSSPI_.
Policy Types The WebSphere SPI policies are organized under the policy group SPI for WebSphere as shown in the following screenshot.
The policy groups are aligned to PMi levels. When you deploy a policy group on a managed node, the PMi level of the node is automatically adjusted to that of the policy group. For example, deploying the High-Impact policy group on a node would result in a PMI setting of “high” for the node.
Note PMi level is configured on the managed node as a part of the configuration. WebSphere Server supports multiple levels of monitoring based on which the required metrics are collected.
The High-Impact, Medium-Impact, and Low-Impact subgroups contain the following:
• metrics (Measurement Threshold)
• logfiles (Log file Policies)
• collector policies (Schedule Policies)
SPI has OOTB policies which are of the Measurement Threshold, Scheduled Task, Logfile, Message Interface, and Service discovery types.
MP has the same policy types as SPI. In addition to that, Management Pack provides a Config File WebSphere_Configuration policy template. The purpose of these policies is explained in the following sections:
a. WebSphere_Configuration – Is the main policy which acts as a container for username, password, keystore, passphrase, java_home, and the instance parameter Server Instance name. In WBSSPI, these details are provided part of the configuration using the Configuration Editor. See the WBSSPI online help for a set of configuration properties.
b. Non-Eventing Metrics - In WBSSPI, these metrics are mentioned in the Schedule policies for collecting data and logging metrics. These metrics are configured in the metric definition file for generating reports.

Evolution Guide Page 139
In case of MP, these policies are available as a part of the ConfigFile policy template for reporting metrics. The standard MP Schedulers pick these policies and collect and log corresponding metrics based on the frequency parameter for each policy. Each of these policies has a Frequency parameter. This parameter allows you to choose the requirement frequency for collecting metrics.
In MP, collected metric data is stored in CODA under data source WEBSPHERE_DATA.
c. Data logging - In MP, all the metrics are configured in the metric definition file that has corresponding policies. All the metrics are by default logged to CODA.
In WebSphere SPI, there are two classes for logging data to CODA and they are:
• WBSSPI_METRICS
• WBSSPI_RPT_METRICS (to use with OVR/SHR)
For each metric, the configuration to alarm, report, or graph data is done in the metric definition file.
In MP, use the WEBSPHERE_DATA class to log data to CODA. By default, all the metrics are logged to CODA.
Measurement Threshold Policy In WebSphere SPI, you can set different threshold values for the same metric by adding a new policy condition using the Policy editor.
For example: If you want to set threshold for the application server SERVER_1, enter the command: SERVER1:<*.var2>:<*.var3>:<*.var4>:<*.var5>:<*.var6>
var1, var2, var3, var4, var5, and var6 are user defined variables.
In MP, the following policy arguments are parameterized:
• Threshold
• Severity
The MT or Aspect deployment happens for each instance where the value can be adjusted without creating and managing new policy versions.
Schedule Task Policy In the WBSSPI Collector, policies control what metrics are collected by running the collector or analyzer at the specified polling interval and defining the metrics that are collected. These are OOTB scheduled task policies which triggers the collector with a set of metrics at defined intervals. If you want to change a metric from 05 mins scheduler to 15 mins scheduler, edit 05 mins scheduled task policy to remove the metric number from the command and update in the 15 mins scheduled task policy.
In case of MP, there is a frequency parameter for each metric regardless of whether they are for eventing or logging. This parameter can be adjusted to make the metric part of appropriate schedule interval namely VeryHigh, High, Medium, Low and NORUN.
Default polling intervals of VeryHigh, High, Medium and Low are 5 mins, 15 mins, 1 hour and 1 day respectively. If any metric marked for NORUN, it will not be picked by any scheduler. Aspect or Management Template can be edited to change this parameter or the default value can be modified during deployment for the targeted CI.
Metric Shcedule Case SPI MP
Modify a metric from 05 mins to 15 mins
Edit 05 mins schedule task policy to remove the metric. Edit 15 mins schedule task policy to add the metrics. Redeploy both of the above Schedule Task policies.
If an assignment is already done then click Assignments & Tuning. Edit the frequency parameter of a particular metric and change it from VeryHigh to High.
Note
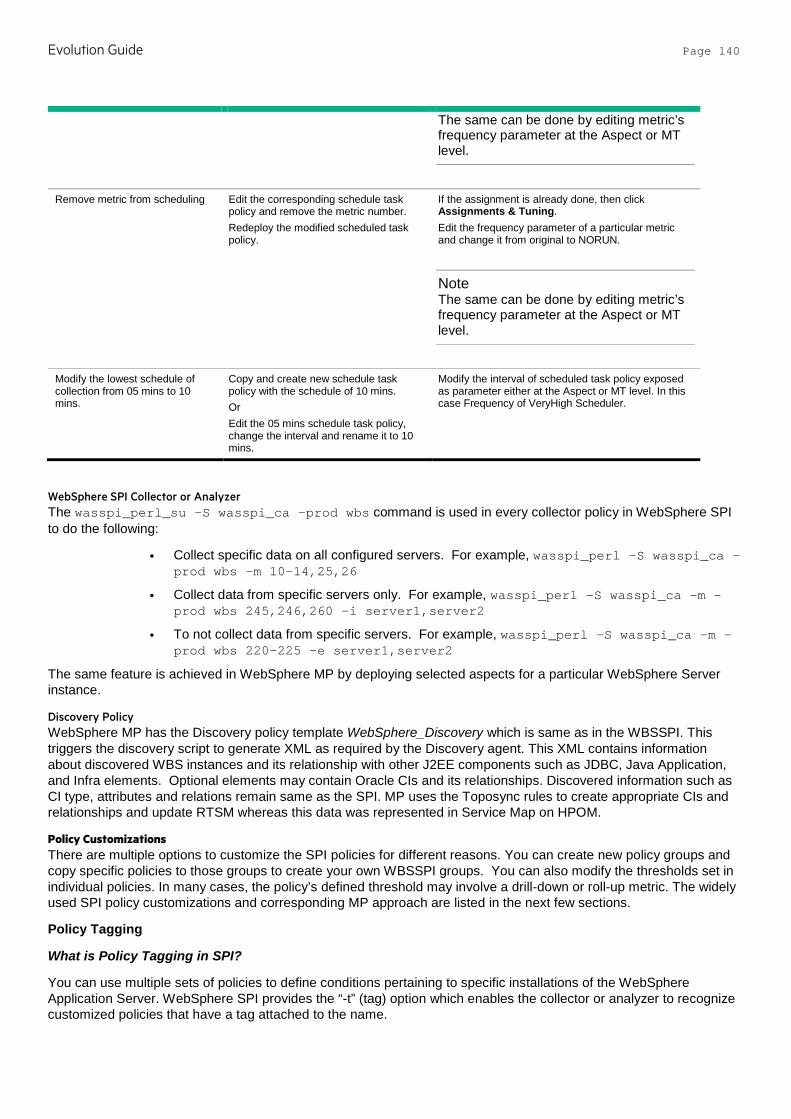
Evolution Guide Page 140
The same can be done by editing metric’s frequency parameter at the Aspect or MT level.
Remove metric from scheduling Edit the corresponding schedule task policy and remove the metric number. Redeploy the modified scheduled task policy.
If the assignment is already done, then click Assignments & Tuning. Edit the frequency parameter of a particular metric and change it from original to NORUN.
Note The same can be done by editing metric’s frequency parameter at the Aspect or MT level.
Modify the lowest schedule of collection from 05 mins to 10 mins.
Copy and create new schedule task policy with the schedule of 10 mins. Or Edit the 05 mins schedule task policy, change the interval and rename it to 10 mins.
Modify the interval of scheduled task policy exposed as parameter either at the Aspect or MT level. In this case Frequency of VeryHigh Scheduler.
WebSphere SPI Collector or Analyzer The wasspi_perl_su -S wasspi_ca -prod wbs command is used in every collector policy in WebSphere SPI to do the following:
• Collect specific data on all configured servers. For example, wasspi_perl -S wasspi_ca -prod wbs -m 10-14,25,26
• Collect data from specific servers only. For example, wasspi_perl -S wasspi_ca -m -prod wbs 245,246,260 -i server1,server2
• To not collect data from specific servers. For example, wasspi_perl -S wasspi_ca -m -prod wbs 220-225 -e server1,server2
The same feature is achieved in WebSphere MP by deploying selected aspects for a particular WebSphere Server instance.
Discovery Policy WebSphere MP has the Discovery policy template WebSphere_Discovery which is same as in the WBSSPI. This triggers the discovery script to generate XML as required by the Discovery agent. This XML contains information about discovered WBS instances and its relationship with other J2EE components such as JDBC, Java Application, and Infra elements. Optional elements may contain Oracle CIs and its relationships. Discovered information such as CI type, attributes and relations remain same as the SPI. MP uses the Toposync rules to create appropriate CIs and relationships and update RTSM whereas this data was represented in Service Map on HPOM.
Policy Customizations There are multiple options to customize the SPI policies for different reasons. You can create new policy groups and copy specific policies to those groups to create your own WBSSPI groups. You can also modify the thresholds set in individual policies. In many cases, the policy’s defined threshold may involve a drill-down or roll-up metric. The widely used SPI policy customizations and corresponding MP approach are listed in the next few sections.
Policy Tagging
What is Policy Tagging in SPI?
You can use multiple sets of policies to define conditions pertaining to specific installations of the WebSphere Application Server. WebSphere SPI provides the “-t” (tag) option which enables the collector or analyzer to recognize customized policies that have a tag attached to the name.
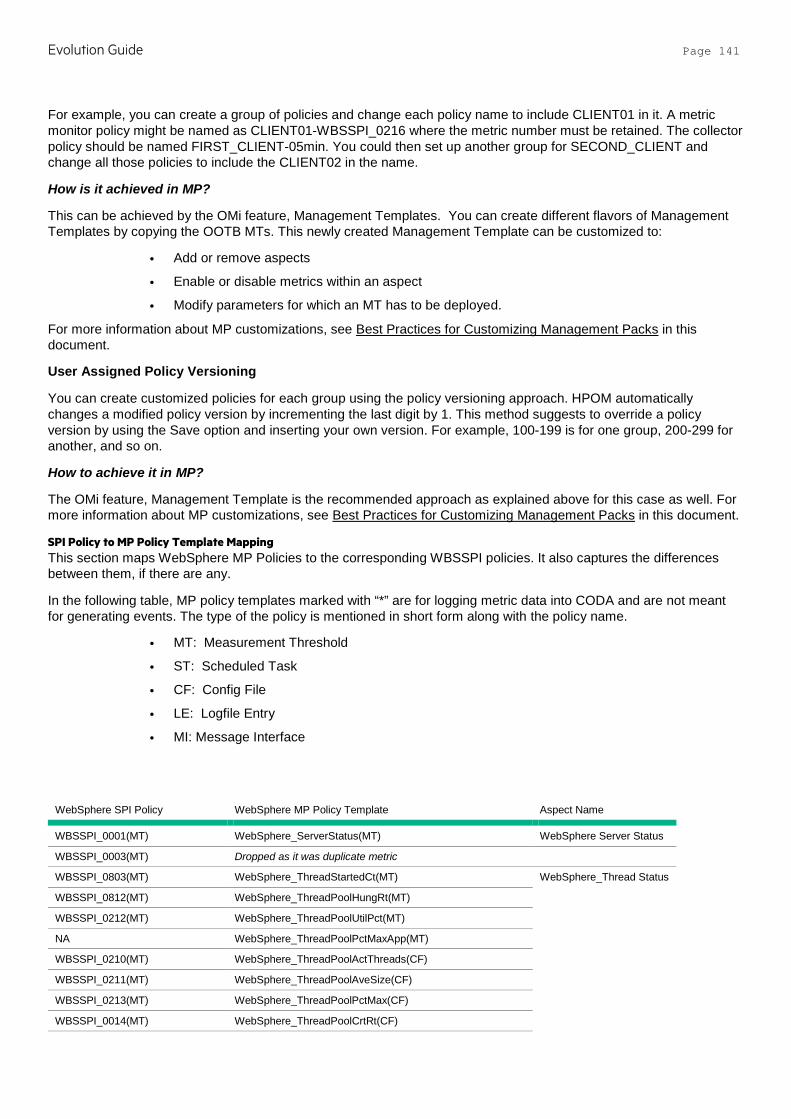
Evolution Guide Page 141
For example, you can create a group of policies and change each policy name to include CLIENT01 in it. A metric monitor policy might be named as CLIENT01-WBSSPI_0216 where the metric number must be retained. The collector policy should be named FIRST_CLIENT-05min. You could then set up another group for SECOND_CLIENT and change all those policies to include the CLIENT02 in the name.
How is it achieved in MP?
This can be achieved by the OMi feature, Management Templates. You can create different flavors of Management Templates by copying the OOTB MTs. This newly created Management Template can be customized to:
• Add or remove aspects
• Enable or disable metrics within an aspect
• Modify parameters for which an MT has to be deployed.
For more information about MP customizations, see Best Practices for Customizing Management Packs in this document.
User Assigned Policy Versioning
You can create customized policies for each group using the policy versioning approach. HPOM automatically changes a modified policy version by incrementing the last digit by 1. This method suggests to override a policy version by using the Save option and inserting your own version. For example, 100-199 is for one group, 200-299 for another, and so on.
How to achieve it in MP?
The OMi feature, Management Template is the recommended approach as explained above for this case as well. For more information about MP customizations, see Best Practices for Customizing Management Packs in this document.
SPI Policy to MP Policy Template Mapping This section maps WebSphere MP Policies to the corresponding WBSSPI policies. It also captures the differences between them, if there are any.
In the following table, MP policy templates marked with “*” are for logging metric data into CODA and are not meant for generating events. The type of the policy is mentioned in short form along with the policy name.
• MT: Measurement Threshold
• ST: Scheduled Task
• CF: Config File
• LE: Logfile Entry
• MI: Message Interface
WebSphere SPI Policy WebSphere MP Policy Template Aspect Name
WBSSPI_0001(MT) WebSphere_ServerStatus(MT) WebSphere Server Status
WBSSPI_0003(MT) Dropped as it was duplicate metric
WBSSPI_0803(MT) WebSphere_ThreadStartedCt(MT) WebSphere_Thread Status
WBSSPI_0812(MT) WebSphere_ThreadPoolHungRt(MT)
WBSSPI_0212(MT) WebSphere_ThreadPoolUtilPct(MT)
NA WebSphere_ThreadPoolPctMaxApp(MT)
WBSSPI_0210(MT) WebSphere_ThreadPoolActThreads(CF)
WBSSPI_0211(MT) WebSphere_ThreadPoolAveSize(CF)
WBSSPI_0213(MT) WebSphere_ThreadPoolPctMax(CF)
WBSSPI_0014(MT) WebSphere_ThreadPoolCrtRt(CF)

Evolution Guide Page 142
WBSSPI_0813(MT) WebSphere_CcrtThreadPlHngCt(CF)
WBSSPI_0805(MT) WebSphere_GarbageCollectionTime(MT) WebSphere JVM Heap Memory
WBSSPI_0005(MT) WebSphere_JVMMemUtilPct*(CF)
WBSSPI_0807(MT) WebSphere_JVMMemFreePct*(CF)
WBSSPI_0808(MT) WebSphere_JVMCpuUsagePct*(CF)
NA WebSphere_TotalHeapSize*(CF)
WBSSPI_0806(MT) WebSphere_JVMUpTime(CF)
WBSSPI_0809(MT) WebSphere_GCIntervalTime*(CF)
WBSSPI_0804(MT) WebSphere_GarbageCollectionCt(MT)
WBSSPI_0801(MT) WebSphere_ProcessCpuUsage(MT)
WBSSPI_0006(MT) WebSphere_ClusterStatus(MT) WebSphere Cluster Status
WBSSPI_0020(MT) WebSphere_EJBPoolUtil*(CF) WebSphere EJB Performance
WBSSPI_0220(MT) WebSphere_EJBPoolUtilApp(MT)
WBSSPI_0221(MT) WebSphere_EJBMethRespTime(MT)
WBSSPI_0222(MT) WebSphere_EJBMethCallsRtApp(MT)
WBSSPI_0224(MT) WebSphere_EJBEntDatLdStRtApp(MT)
WBSSPI_0026(MT) WebSphere_EJBConcLives*(CF)
WBSSPI_0226(MT) WebSphere_EJBConcLivesApp(MT)
WBSSPI_0810(MT) WebSphere_EJBMsgBackoutRate(MT)
WBSSPI_0811(MT) WebSphere_EJBReturnDiscrdRt(MT)
WBSSPI_0022(MT) WebSphere_EJBMethCallsRt*(CF)
WBSSPI_0223(MT) WebSphere_EJBPoolSize*(CF)
WBSSPI_0024(MT) WebSphere_EJBEntDatLdStRt*(CF)
WBSSPI_0025(MT) WebSphere_EJBPoolMissPct*(CF)
WBSSPI_0225(MT) WebSphere_EJBPoolMissPctApp*(CF)
WBSSPI_0040(MT) WebSphere_ServSessAveLife(MT) WebSphere Servlet Performance
WBSSPI_0041(MT) WebSphere_ServSessActSess(MT)
WBSSPI_0042(MT) WebSphere_ServInvSessRt(MT)
WBSSPI_0245(MT) WebSphere_WebAppServReqRtApp(MT)
WBSSPI_0246(MT) WebSphere_WebAppServletRespTime(MT)
WBSSPI_0247(MT) WebSphere_WebAppServErrRtApp(MT)
WBSSPI_0048(MT) WebSphere_WebAppServLoad(MT)
WBSSPI_0045(MT) WebSphere_WebAppServReqRt*(CF)
WBSSPI_0047(MT) WebSphere_WebAppServErrRt*(CF)
WBSSPI_0049(MT) WebSphere_WebAppServRelRt*(CF)
WBSSPI_0260(MT) WebSphere_JDBCConnPoolSize(MT) WebSphere JDBCConnectionPool Status WBSSPI_0261(MT) WebSphere_JDBCConnPoolWaiters(MT)
WBSSPI_0262(MT) WebSphere_JDBCConnPoolWaitTime(MT)
WBSSPI_0263(MT) WebSphere_JDBCConnPoolUtil(MT)
WBSSPI_0264(MT) WebSphere_JDBCConnPoolMaxPct(MT)
WBSSPI_0265(MT) WebSphere_JDBCConnPoolTimeOutRts(MT)
WBSSPI_0266(MT) WebSphere_JDBCConPoolThroughput(MT)
WBSSPI_0814(MT) WebSphere_JDBCPreparedStDiscRt(MT)
WBSSPI_0061(MT) WebSphere_JDBCConPoolWait*(CF)
WBSSPI_0062(MT) WebSphere_JDBCConPoolWtTime*
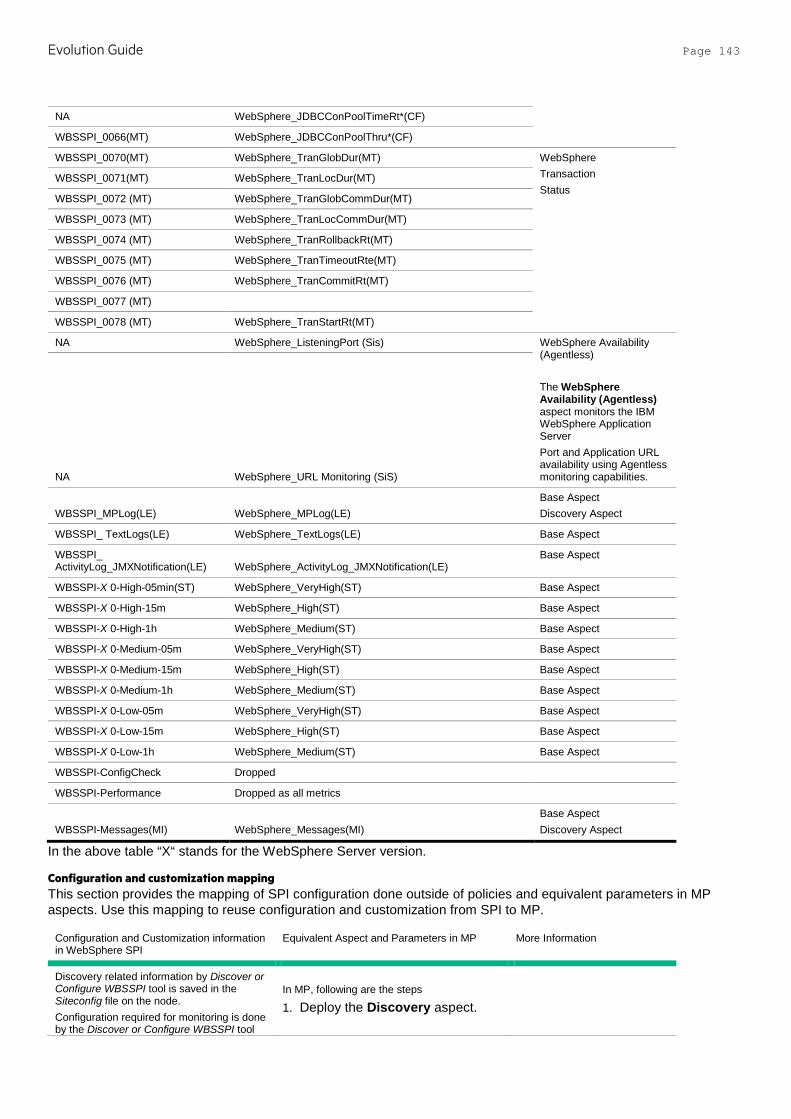
Evolution Guide Page 143
NA WebSphere_JDBCConPoolTimeRt*(CF)
WBSSPI_0066(MT) WebSphere_JDBCConPoolThru*(CF)
WBSSPI_0070(MT) WebSphere_TranGlobDur(MT) WebSphere Transaction Status
WBSSPI_0071(MT) WebSphere_TranLocDur(MT)
WBSSPI_0072 (MT) WebSphere_TranGlobCommDur(MT)
WBSSPI_0073 (MT) WebSphere_TranLocCommDur(MT)
WBSSPI_0074 (MT) WebSphere_TranRollbackRt(MT)
WBSSPI_0075 (MT) WebSphere_TranTimeoutRte(MT)
WBSSPI_0076 (MT) WebSphere_TranCommitRt(MT)
WBSSPI_0077 (MT)
WBSSPI_0078 (MT) WebSphere_TranStartRt(MT)
NA WebSphere_ListeningPort (Sis) WebSphere Availability (Agentless) The WebSphere Availability (Agentless) aspect monitors the IBM WebSphere Application Server Port and Application URL availability using Agentless monitoring capabilities. NA WebSphere_URL Monitoring (SiS)
WBSSPI_MPLog(LE) WebSphere_MPLog(LE) Base Aspect Discovery Aspect
WBSSPI_ TextLogs(LE) WebSphere_TextLogs(LE) Base Aspect
WBSSPI_ ActivityLog_JMXNotification(LE) WebSphere_ActivityLog_JMXNotification(LE)
Base Aspect
WBSSPI-X 0-High-05min(ST) WebSphere_VeryHigh(ST) Base Aspect
WBSSPI-X 0-High-15m WebSphere_High(ST) Base Aspect
WBSSPI-X 0-High-1h WebSphere_Medium(ST) Base Aspect
WBSSPI-X 0-Medium-05m WebSphere_VeryHigh(ST) Base Aspect
WBSSPI-X 0-Medium-15m WebSphere_High(ST) Base Aspect
WBSSPI-X 0-Medium-1h WebSphere_Medium(ST) Base Aspect
WBSSPI-X 0-Low-05m WebSphere_VeryHigh(ST) Base Aspect
WBSSPI-X 0-Low-15m WebSphere_High(ST) Base Aspect
WBSSPI-X 0-Low-1h WebSphere_Medium(ST) Base Aspect
WBSSPI-ConfigCheck Dropped
WBSSPI-Performance Dropped as all metrics
WBSSPI-Messages(MI) WebSphere_Messages(MI) Base Aspect Discovery Aspect
In the above table “X“ stands for the WebSphere Server version.
Configuration and customization mapping This section provides the mapping of SPI configuration done outside of policies and equivalent parameters in MP aspects. Use this mapping to reuse configuration and customization from SPI to MP.
Configuration and Customization information in WebSphere SPI
Equivalent Aspect and Parameters in MP More Information
Discovery related information by Discover or Configure WBSSPI tool is saved in the Siteconfig file on the node. Configuration required for monitoring is done by the Discover or Configure WBSSPI tool
In MP, following are the steps
1. Deploy the Discovery aspect.
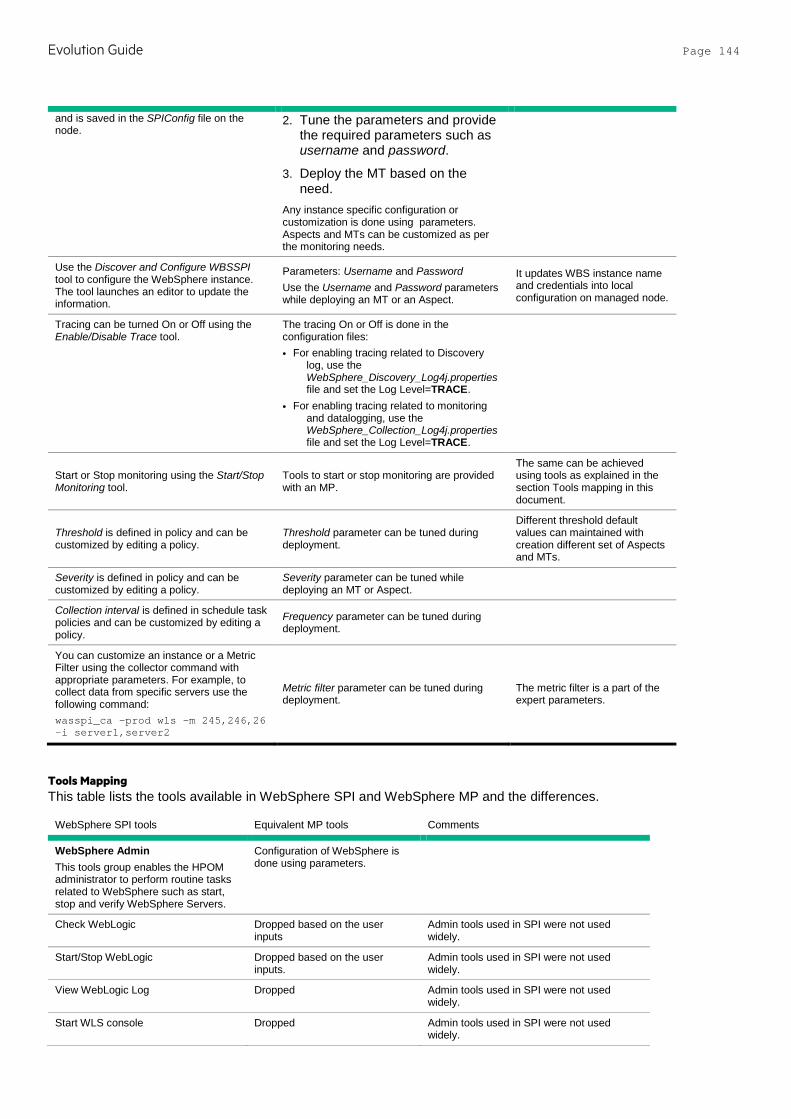
Evolution Guide Page 144
and is saved in the SPIConfig file on the node.
2. Tune the parameters and provide the required parameters such as username and password.
3. Deploy the MT based on the need.
Any instance specific configuration or customization is done using parameters. Aspects and MTs can be customized as per the monitoring needs.
Use the Discover and Configure WBSSPI tool to configure the WebSphere instance. The tool launches an editor to update the information.
Parameters: Username and Password Use the Username and Password parameters while deploying an MT or an Aspect.
It updates WBS instance name and credentials into local configuration on managed node.
Tracing can be turned On or Off using the Enable/Disable Trace tool.
The tracing On or Off is done in the configuration files: • For enabling tracing related to Discovery
log, use the WebSphere_Discovery_Log4j.properties file and set the Log Level=TRACE.
• For enabling tracing related to monitoring and datalogging, use the WebSphere_Collection_Log4j.properties file and set the Log Level=TRACE.
Start or Stop monitoring using the Start/Stop Monitoring tool.
Tools to start or stop monitoring are provided with an MP.
The same can be achieved using tools as explained in the section Tools mapping in this document.
Threshold is defined in policy and can be customized by editing a policy.
Threshold parameter can be tuned during deployment.
Different threshold default values can maintained with creation different set of Aspects and MTs.
Severity is defined in policy and can be customized by editing a policy.
Severity parameter can be tuned while deploying an MT or Aspect.
Collection interval is defined in schedule task policies and can be customized by editing a policy.
Frequency parameter can be tuned during deployment.
You can customize an instance or a Metric Filter using the collector command with appropriate parameters. For example, to collect data from specific servers use the following command: wasspi_ca -prod wls -m 245,246,26 -i server1,server2
Metric filter parameter can be tuned during deployment.
The metric filter is a part of the expert parameters.
Tools Mapping This table lists the tools available in WebSphere SPI and WebSphere MP and the differences.
WebSphere SPI tools Equivalent MP tools Comments
WebSphere Admin This tools group enables the HPOM administrator to perform routine tasks related to WebSphere such as start, stop and verify WebSphere Servers.
Configuration of WebSphere is done using parameters.
Check WebLogic Dropped based on the user inputs
Admin tools used in SPI were not used widely.
Start/Stop WebLogic Dropped based on the user inputs.
Admin tools used in SPI were not used widely.
View WebLogic Log Dropped Admin tools used in SPI were not used widely.
Start WLS console Dropped Admin tools used in SPI were not used widely.
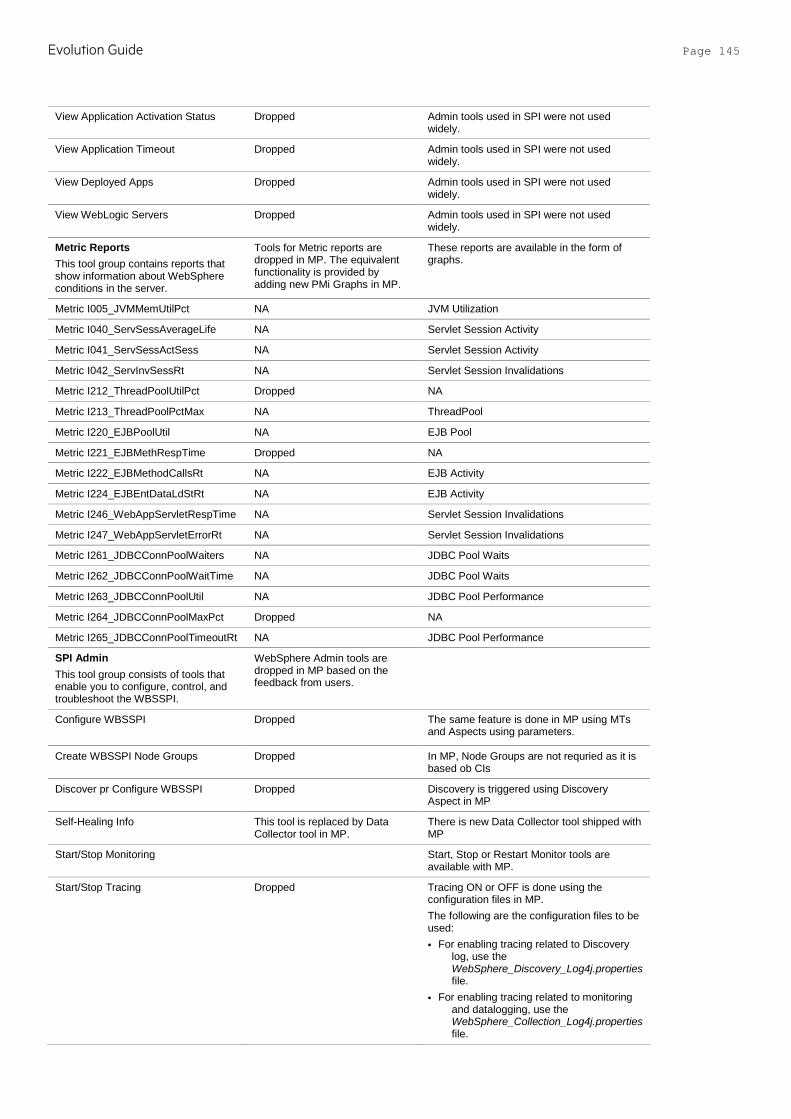
Evolution Guide Page 145
View Application Activation Status Dropped Admin tools used in SPI were not used widely.
View Application Timeout Dropped Admin tools used in SPI were not used widely.
View Deployed Apps Dropped Admin tools used in SPI were not used widely.
View WebLogic Servers Dropped Admin tools used in SPI were not used widely.
Metric Reports This tool group contains reports that show information about WebSphere conditions in the server.
Tools for Metric reports are dropped in MP. The equivalent functionality is provided by adding new PMi Graphs in MP.
These reports are available in the form of graphs.
Metric I005_JVMMemUtilPct NA JVM Utilization
Metric I040_ServSessAverageLife NA Servlet Session Activity
Metric I041_ServSessActSess NA Servlet Session Activity
Metric I042_ServInvSessRt NA Servlet Session Invalidations
Metric I212_ThreadPoolUtilPct Dropped NA
Metric I213_ThreadPoolPctMax NA ThreadPool
Metric I220_EJBPoolUtil NA EJB Pool
Metric I221_EJBMethRespTime Dropped NA
Metric I222_EJBMethodCallsRt NA EJB Activity
Metric I224_EJBEntDataLdStRt NA EJB Activity
Metric I246_WebAppServletRespTime NA Servlet Session Invalidations
Metric I247_WebAppServletErrorRt NA Servlet Session Invalidations
Metric I261_JDBCConnPoolWaiters NA JDBC Pool Waits
Metric I262_JDBCConnPoolWaitTime NA JDBC Pool Waits
Metric I263_JDBCConnPoolUtil NA JDBC Pool Performance
Metric I264_JDBCConnPoolMaxPct Dropped NA
Metric I265_JDBCConnPoolTimeoutRt NA JDBC Pool Performance
SPI Admin This tool group consists of tools that enable you to configure, control, and troubleshoot the WBSSPI.
WebSphere Admin tools are dropped in MP based on the feedback from users.
Configure WBSSPI
Dropped The same feature is done in MP using MTs and Aspects using parameters.
Create WBSSPI Node Groups Dropped In MP, Node Groups are not requried as it is based ob CIs
Discover pr Configure WBSSPI Dropped Discovery is triggered using Discovery Aspect in MP
Self-Healing Info This tool is replaced by Data Collector tool in MP.
There is new Data Collector tool shipped with MP
Start/Stop Monitoring Start, Stop or Restart Monitor tools are available with MP.
Start/Stop Tracing Dropped Tracing ON or OFF is done using the configuration files in MP. The following are the configuration files to be used: • For enabling tracing related to Discovery
log, use the WebSphere_Discovery_Log4j.properties file.
• For enabling tracing related to monitoring and datalogging, use the WebSphere_Collection_Log4j.properties file.
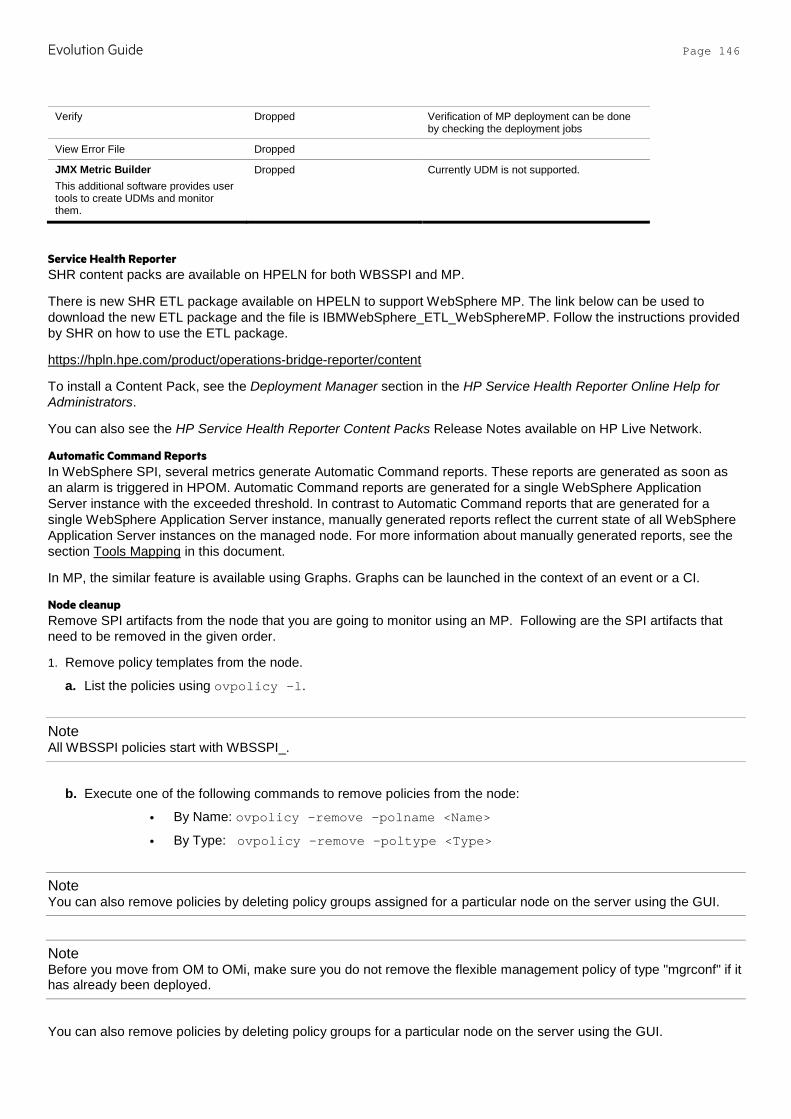
Evolution Guide Page 146
Verify Dropped Verification of MP deployment can be done by checking the deployment jobs
View Error File Dropped
JMX Metric Builder This additional software provides user tools to create UDMs and monitor them.
Dropped Currently UDM is not supported.
Service Health Reporter SHR content packs are available on HPELN for both WBSSPI and MP.
There is new SHR ETL package available on HPELN to support WebSphere MP. The link below can be used to download the new ETL package and the file is IBMWebSphere_ETL_WebSphereMP. Follow the instructions provided by SHR on how to use the ETL package.
https://hpln.hpe.com/product/operations-bridge-reporter/content
To install a Content Pack, see the Deployment Manager section in the HP Service Health Reporter Online Help for Administrators.
You can also see the HP Service Health Reporter Content Packs Release Notes available on HP Live Network.
Automatic Command Reports In WebSphere SPI, several metrics generate Automatic Command reports. These reports are generated as soon as an alarm is triggered in HPOM. Automatic Command reports are generated for a single WebSphere Application Server instance with the exceeded threshold. In contrast to Automatic Command reports that are generated for a single WebSphere Application Server instance, manually generated reports reflect the current state of all WebSphere Application Server instances on the managed node. For more information about manually generated reports, see the section Tools Mapping in this document.
In MP, the similar feature is available using Graphs. Graphs can be launched in the context of an event or a CI.
Node cleanup Remove SPI artifacts from the node that you are going to monitor using an MP. Following are the SPI artifacts that need to be removed in the given order.
1. Remove policy templates from the node.
a. List the policies using ovpolicy –l.
Note All WBSSPI policies start with WBSSPI_.
b. Execute one of the following commands to remove policies from the node:
• By Name: ovpolicy –remove –polname <Name>
• By Type: ovpolicy –remove –poltype <Type>
Note You can also remove policies by deleting policy groups assigned for a particular node on the server using the GUI.
Note Before you move from OM to OMi, make sure you do not remove the flexible management policy of type "mgrconf" if it has already been deployed.
You can also remove policies by deleting policy groups for a particular node on the server using the GUI.
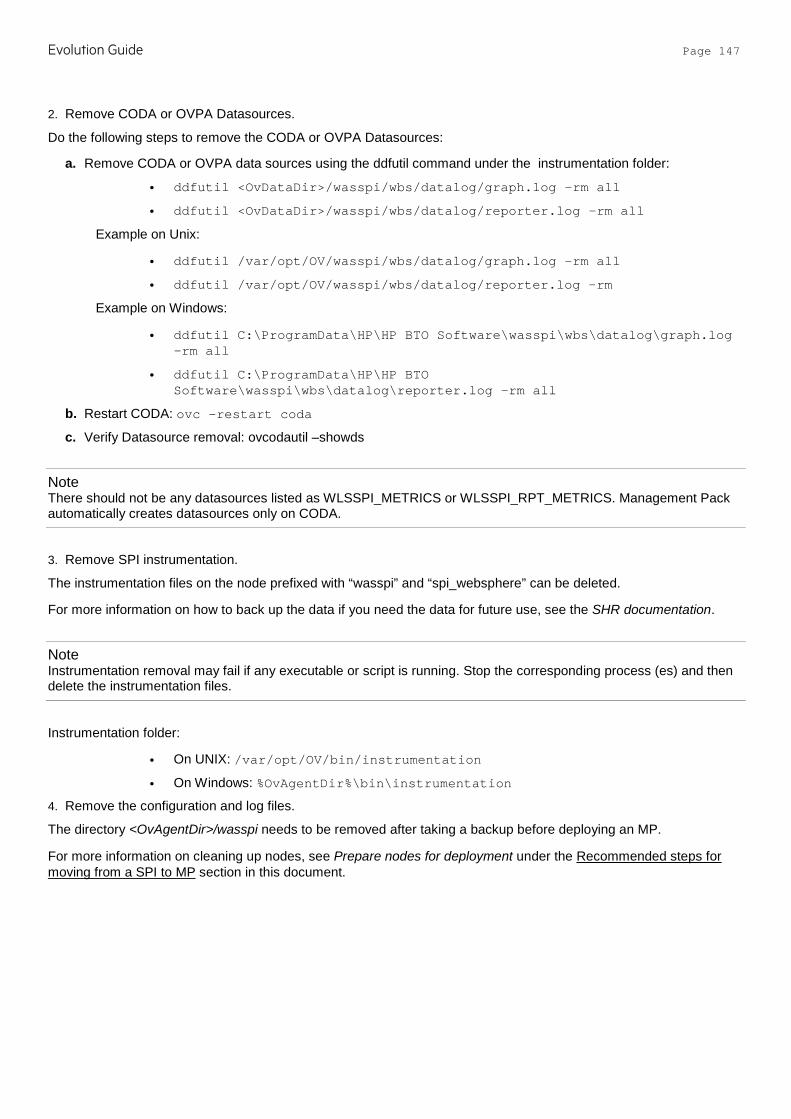
Evolution Guide Page 147
2. Remove CODA or OVPA Datasources.
Do the following steps to remove the CODA or OVPA Datasources:
a. Remove CODA or OVPA data sources using the ddfutil command under the instrumentation folder:
• ddfutil <OvDataDir>/wasspi/wbs/datalog/graph.log –rm all
• ddfutil <OvDataDir>/wasspi/wbs/datalog/reporter.log –rm all
Example on Unix:
• ddfutil /var/opt/OV/wasspi/wbs/datalog/graph.log –rm all
• ddfutil /var/opt/OV/wasspi/wbs/datalog/reporter.log –rm
Example on Windows:
• ddfutil C:\ProgramData\HP\HP BTO Software\wasspi\wbs\datalog\graph.log –rm all
• ddfutil C:\ProgramData\HP\HP BTO Software\wasspi\wbs\datalog\reporter.log –rm all
b. Restart CODA: ovc –restart coda
c. Verify Datasource removal: ovcodautil –showds
Note There should not be any datasources listed as WLSSPI_METRICS or WLSSPI_RPT_METRICS. Management Pack automatically creates datasources only on CODA.
3. Remove SPI instrumentation.
The instrumentation files on the node prefixed with “wasspi” and “spi_websphere” can be deleted.
For more information on how to back up the data if you need the data for future use, see the SHR documentation.
Note Instrumentation removal may fail if any executable or script is running. Stop the corresponding process (es) and then delete the instrumentation files.
Instrumentation folder:
• On UNIX: /var/opt/OV/bin/instrumentation
• On Windows: %OvAgentDir%\bin\instrumentation
4. Remove the configuration and log files.
The directory <OvAgentDir>/wasspi needs to be removed after taking a backup before deploying an MP.
For more information on cleaning up nodes, see Prepare nodes for deployment under the Recommended steps for moving from a SPI to MP section in this document.

Evolution Guide Page 148
WebLogic SPI and OMi Management Pack for Oracle WebLogic Application Server This section explains the evolution from the HPOM Smart Plug-in 7.04.003 for WebLogic to the HPE OMi Management Pack for Oracle WebLogic 1.01.
SPI and MP comparison This section provides an overview of similarities and differences between HPOM Smart Plug-in for WebLogic (WebLogic SPI) and OMi MP for Oracle WebLogic (Oracle WebLogic MP). For information about working with the Oracle WebLogic MP, see the OMi Management Pack for Oracle WebLogic User Guide.
Features WebLogic SPI 7.04.003 Oracle WebLogic MP 1.01
Pre-requisites • HPOM W 9.x, HPOM U/S/L 9.1 or higher • HP Operations Agent 11.1 or higher
• BSM/MA 9.22 or higher • HP Operations Agent 11.12 or higher
Product Delivery The WebLogic SPI is shipped with the SPI DVD. The Oracle WebLogic MP is shipped with the OMi 10 installer. You can also download the Oracle WebLogic MP from the e-media download center. See Useful resources in this document for the e-media download center link.
Installation Mount the ISO and use the OS specific installer: • HPUX: HP_Operations_Smart_Plug-
ins_HPUX.depot • Linux: HP_Operations_Smart_Plug-
ins_Linux_setup.bin • Solaris: HP_Operations_Smart_Plug-
ins_Solaris_setup.bin • Windows: setup.vbs
The Oracle WebLogic MP can be installed using any of the following methods:
1. Use the OMi ConfigWizard to install OMi 10.x. Use this option when you want to install the MP during OMi 10.x installation.
2. Install using the command line interface. Use this option when you want to install the MP after the OMi 10.x is installed. For more information about the opr-mp-installer Command-Line Interface, see the OMi Administration Guide.
3. You can download the MP bits from the e-media download center and then mount ISO and use the OS specific installer.
• Linux: mpinstall.sh-i • Windows: cscript mpinstall.vbs-i Use this option when a higher MP version is available in the e-media download center.
Policy grouping The policies are grouped into policy groups as shown in the following snapshot:
The aspects and MTs are grouped into configuration folders. Policy templates are grouped into aspects. For more information about grouping of policies relevant to the area and criticality of monitoring, see the SPI Policy to MP Policy Template Mapping in this document.
Policy versioning Uses the xxxx.yyyy format. Example: If the SPI version is 7.0, policies updated in this release would be versioned as 7.000. On the GUI, it is visible as 7.000. When you update such a policy, only minor versions (Last two digits) are updated. For example: When you update a policy with version 7.000 (in GUI: 7.000), it will be changed to 7.0100 (in GUI 7.100).
Uses the xxxx.yyyy format. Example: Policies are versioned as 0001.0100. On the OMi GUI, it is displayed as 1.100. In MP releases, policy version is updated only if a particular policy is updated in that release. For example, with 1.01 release, only a few policies are updated to 1.0100. When you update a policy, only minor versions (last two digits) should be updated. Example: When you update a policy with version 0001.0100 (in GUI 1.100), it will be changed to 0001.0101 (in GUI 1.101).
Policy Types The WebLogic SPI has the following policy types: MP has similar types of policies of the types used in SPI.
Evolution Guide Page 149
• Measurement Threshold • Scheduled Task • Logfile • Service Auto-Discovery • Message Interface
In addition, it has the ConfigFile type of policy template. For more details about policy changes, see Common policy changes in this document.
Message Groups The WebLogic SPI has message groups to generate WebLogic events.
MP has exactly same set of message groups as in SPI.
Node Groups The WebLogic SPI has node groups called SPI for WebLogic and the group is created based on the discovered WebLogic version.
Node groups are not required in MP as the topology is based on CIs.
Tools Following are the tools available in WebLogic SPI: • SPI Admin tools group • WebLogic Admin tools group • Metric Reports
In MP, tools to start, stop and restart monitoring are available. Few of the tools which exist in SPI are dropped. For more information on tools, see section Tools Mapping in this document.
Instrumentation The WebLogic SPI has the WebLogic Instrumentation category.
The Oracle WebLogic MP provides the WebLogic_Monitoring instrumentation category. OMi Server: Instrumentation is uploaded into the OMi database. Instrumentation deployment on the Node: There is no difference with respect to instrumentation location on nodes. Instrumentation is deployed to the same directories as in the SPIs. Instrumentation filenames have been changed in MP.
Discovery Deploy the following policies from the policy group WLSSPI Discovery to the managed node. • WLSSPI-Messages • WLSSPI Auto-Service Discovery Successful deployment of the Discovery policy displays the discovered instances in the service map.
Discovery in the Oracle WebLogic MP is done in two stages:
1. When you deploy the Discovery aspect, all the J2EE domain and J2EE Server CIs are discovered.
2. When you deploy an MT, the remaining J2EE application and JDBC DataSources CIs are discovered.
To discover WebLogic CIs: • Deploy the
WebLogic Discovery aspect to the node before deploying an Aspect or MT.
• When you deploy an aspect or MT to J2EE, extended discovery discovers J2EE apps and JDBC Data Sources.
There is no difference in topology that is discovered by WebLogic SPI and Oracle WebLogic MP.
Configuration Run the Configure tool and in the Configuration Editor and specify the following required parameters: • Login • Password • JavaHome • WebLogic Home There are other optional parameters that you can provide. For information on configuration, see the WebLogic SPI Online Help.
All the configuration is done as a part of the deployment process using parameters. The required parameters are username and password. There are optional parameters such as JAVA_HOME, KeyStore, and Passpharse that are required if the SSL is configured on the WLS server. For more information about the parameters that are to be provided during the deployment of an MT, see the OMi MP for Oracle WebLogic User Guide.
Deployment Deploy specific policies based on monitoring needs to appropriate node(s) or node group(s).
Deploy the MT or Aspect: • Deploy Discovery Aspect • Deploy Aspect or MT
1. Assign Management Template to the J2EE Domain CIs.
2. Specify the username and password as parameters.
Evolution Guide Page 150
3. Create Automatic Assignment Rules for Auto-deployment of MT and aspects.
It is not recommended to update configuration directly on the node as it will make the values out-of-sync.
Appearance of artifacts on node
Instrumentation: %ovdatadir%/bin/instrumentation
Policy list: Use the ovpolicy –l command to view a list of policies Example: #ovpolicy –l "WebLogic_Discovery" enabled 01.0000 Policy names: The policy names are prefixed with WLSSPI_. Location of logfiles: The SPI logfiles are located under: <OvAgentDir>/wasspi/wls/log • Discovery.log • Collector.log • wasspi_perl.log • CollectorClient.log
Instrumentation: %ovdatadir%/bin/instrumentation
Policy list: Use the ovpolicy –l command to view a list of policies. In the policy list, each parameterized policy will have extra entry with “<policy type>tmpl” in the “Type” column” as provided in the following example: # ovpolicy –l
configfile "WebLogic_Configuration" enabled 0001.0000
configfiletmpl "WebLogic_Configuration" enabled 0001.0000
Policy names: The policy names are prefixed with WebLogic_. MP Logfiles: Logfiles can be located under: <OvAgentDir>/log/WebLogic
• WebLogic_Perl.log • Collector.log • collectionManager/collector_Schedule.log
Monitoring Capability
The WebLogic SPI monitors the following: • Availability of WebLogic Application Server,
Cluster and Applications • Performance of WebLogic Application Server
components such as JDBC DataSource, Applications and Servlets
For more information about the monitoring functionality, see the WLSSPI Reference Guide.
All monitoring functionality which are supported by the WebLogic SPI are present in the Oracle WebLogic MP except for the following: • User Defined Metrics • Remote Monitoring of WLS
Tuning after Deployment
You can customize threshold, message groups, and severity (any) by editing the policies. Redeploy the new version of policy which can later be deployed to the node.
You can tune parameters during deployment for a specific CI. You can also tune parameter values after deploying a specific CI from the Assignments & Tuning window. After parameters are tuned, the policy templates are automatically deployed. The threshold, severity and collection frequency are parameterized.
Monitoring Multiple Instances
The WebLogic SPI supports monitoring of multiple instances of WLS with the limitation that the credentials are same across the WLS instances. Policy parameters are applicable for all instances of WLS on a particular node.
Parameters are applicable for all instances of WLS. However during deployment, the parameters can be tuned for a particular instance of WLS. The Instance parameter (Server Name) is used to identify a particular instance of WLS.
End-to-End monitoring
Deploy the WebLogic SPI to monitor only the WLS environment. For the Cross Domain monitoring, deploy Infrastructure SPI policies to monitor System infrastructure such as the CPU, Memory, Disk and File System. Deploy Oracle policies to monitor Oracle database.
Deploy essential or extensive MT for WebLogic to monitor WebLogic components. The Essential MT has a set of aspects or policies to monitor the key health metrics of WLS Server. The Extensive MT has a wider range of policies to monitor additional metrics. For the cross domain monitoring, use the Extensive WebLogic Management Template. Use the Extensive WebLogic and Oracle Database Management Template to monitor System Infrastructure, Oracle and WebLogic resources.
Monitoring instances with different business criticality
Maintain multiple policies set based on the business criticality.
Use the Essential WebLogic Management Template to monitor less critical environment. Use the Extensive WebLogic Management Template to monitor critical infrastructure.
Agent and agent less monitoring
Agentless monitoring is not available. Hybrid MT has the WebLogic Availability (Agentless) aspect for agentless monitoring using SiS.
Evolution Guide Page 151
The WebLogic Availability (Agentless) aspect monitors the WebLogic Application Server Port and Application URL availability using Agentless monitoring capabilities.
Uninstallation Native procedure is used to uninstall InfraSPI. Artifacts can be removed manually in the following order: • Assignments • MTs • Aspects • Policy Templates • Instrumentation • ContentPack Definitions
Graphs Performance and availability metrics are graphed by PM. SPIs had a separate installer for OOTB graphs that need to be installed on PM
Graphing solution for OMi MP is provided by PMi, which is an embedded component in the platform. OOTB Graph templates are installed as a part of the MP. For more information about a list of OOTB Graph Templates, see the OMi MP for Oracle WebLogic User Guide.
Reports OOTB reports (OVR) are available as a separate package.
All the OVR reports are available in the SHR reports. There is a new ETL package available for Oracle WebLogic MP. The details are provided in section Service Health Reporter in this document.
Data logging on node
Collected metrics gets logged to CODA or OVPA on the node in the following datasources: • WLSSPI_METRICS • WLSSPI_RPT_METRICS
There is a new CODA datasource WEBLOGIC_DATA. All metrics are logged to CODA.
OS Cluster Support
Failover configuration can be done with apminfo.xml as described in the Install and Config guide of WLSSPI.
The same set of configuration is applicable for the Oracle WebLogic MP as well.
Remote Monitoring
Supports Remote Monitoring with limited set of metrics.
Remote Monitoring is not supported. It is recommended to use SiteScope for remote monitoring.
UDM support The WebLogic SPI supports adding user defined metrics and generate appropriate policies using the Metric Java Builder Tool provided in the SPI DVD.
UDM is not supported in Oracle WebLogic MP.
I18N & L10N The WebLogic SPI is I18N certified and is localized in Japanese.
The Oracle WebLogic MP is I18N certified and is localized in the following languages: • Simplified Chinese • Japanese
HIs/ETIs The list of indicators shipped with J2EE content pack are used to enrich the events using policies. The indicators are used in the KPI calculation.
The same set of indicators are used in the MP policy templates.
TBEC The WebLogic SPI supports topology based correlation event correlation on OMi. OOTB TBEC Rules are shipped as a part of J2EE content.
The same set of TBEC rules are supported in MP.
Events Events are mapped to WLS Server CI, J2EE Application and JDBC Data Source CIs appropriately on OMi.
All events reaching OMi Event browser are mapped to the WebLogic as WebLogic Server CI. In the Event Title, the policy name is appended at the end of the text as shown in the sample event: Average servlet session lifetime (2630451.25ms) too high (>=1000.00ms) [Policy: Weblogic_ServerStatus] [Policy: WebLogic_ServerStatus]
OO flows Integration with the HP OO flows were shipped as a part of the J2EE content.
Same set of OO flows are shipped with MP. However, OO flows are restricted to the ops-bridge usecase only. The OO flows work only in an environment where the HPOM and SPI are used for monitoring along with OMi and OO integration.
Architecture SPI supports both 32-bit and 64-bit Java architectures.
If the managed node is Solaris version 8, 9, 10 or 11, 32 bit java should be provided against the optional JAVA_HOME parameter. If the managed node is AIX version 5.3, 6.1 or 7.1, 64 bit java should be provided against the optional JAVA_HOME parameter.
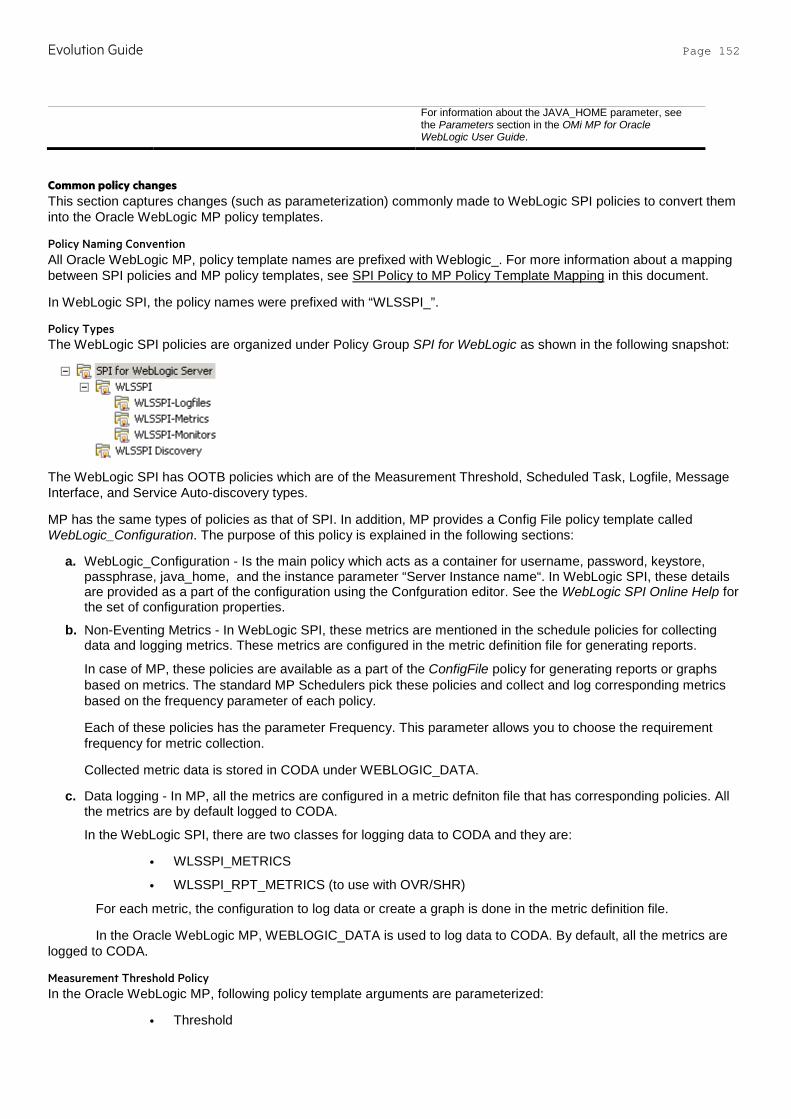
Evolution Guide Page 152
For information about the JAVA_HOME parameter, see the Parameters section in the OMi MP for Oracle WebLogic User Guide.
Common policy changes This section captures changes (such as parameterization) commonly made to WebLogic SPI policies to convert them into the Oracle WebLogic MP policy templates.
Policy Naming Convention All Oracle WebLogic MP, policy template names are prefixed with Weblogic_. For more information about a mapping between SPI policies and MP policy templates, see SPI Policy to MP Policy Template Mapping in this document.
In WebLogic SPI, the policy names were prefixed with “WLSSPI_”.
Policy Types The WebLogic SPI policies are organized under Policy Group SPI for WebLogic as shown in the following snapshot:
The WebLogic SPI has OOTB policies which are of the Measurement Threshold, Scheduled Task, Logfile, Message Interface, and Service Auto-discovery types.
MP has the same types of policies as that of SPI. In addition, MP provides a Config File policy template called WebLogic_Configuration. The purpose of this policy is explained in the following sections:
a. WebLogic_Configuration - Is the main policy which acts as a container for username, password, keystore, passphrase, java_home, and the instance parameter “Server Instance name“. In WebLogic SPI, these details are provided as a part of the configuration using the Confguration editor. See the WebLogic SPI Online Help for the set of configuration properties.
b. Non-Eventing Metrics - In WebLogic SPI, these metrics are mentioned in the schedule policies for collecting data and logging metrics. These metrics are configured in the metric definition file for generating reports.
In case of MP, these policies are available as a part of the ConfigFile policy for generating reports or graphs based on metrics. The standard MP Schedulers pick these policies and collect and log corresponding metrics based on the frequency parameter of each policy.
Each of these policies has the parameter Frequency. This parameter allows you to choose the requirement frequency for metric collection.
Collected metric data is stored in CODA under WEBLOGIC_DATA.
c. Data logging - In MP, all the metrics are configured in a metric defniton file that has corresponding policies. All the metrics are by default logged to CODA.
In the WebLogic SPI, there are two classes for logging data to CODA and they are:
• WLSSPI_METRICS
• WLSSPI_RPT_METRICS (to use with OVR/SHR)
For each metric, the configuration to log data or create a graph is done in the metric definition file.
In the Oracle WebLogic MP, WEBLOGIC_DATA is used to log data to CODA. By default, all the metrics are logged to CODA.
Measurement Threshold Policy In the Oracle WebLogic MP, following policy template arguments are parameterized:
• Threshold

Evolution Guide Page 153
• Severity
The MT or Aspect deployment happens for each instance where the value can be adjusted without creating and managing new policy versions.
Schedule Task Policy In the WLSSPI Collector, policies control what metrics are collected by running the collector or analyzer at the specified polling interval and defining the metrics that are collected. These are OOTB scheduled task policies which trigger the collector with a set of metrics at defined interval.
Collector Policy Name Polling Interval Metrics Collected
WLSSPI-05min 5m (Runs the WebLogic Server SPI collector/analyzer every 5 minutes)
1, 2, 61, 63, 70-81, 85, 245, 246, 260, 262-265, 270, 278, 281-282
WLSSPI-15min 14m (Runs the WebLogic Server SPI collector/analyzer every 15 minutes)
5, 10-17, 25, 26, 35, 36, 225, 226, 238,251-256
WLSSPI-1h 59m (Runs the WebLogic Server SPI collector/analyzer every one hour)
240-242
If you want to move a metric from 05 mins scheduler to 15 mins scheduler, edit 05mins scheduled task policy to remove the metric number from command and to update to 15 mins scheduled task policy.
In case of MP, there is a frequency parameter for each metrics regardless of whether they are for eventing or logging. This parameter can be adjusted to make the metric part of appropriate schedule interval namely VeryHigh, High, Medium, Low and NORUN.
Default polling intervals of VeryHigh, High, Medium and Low are 5 mins, 15 mins, 1 hour and 1 day respectively. If any metric is marked for NORUN, it will not be picked by any scheduler. An aspect or MT can be edited to change this parameter or the default value can be modified during deployment for the targeted CI.
Metric Schedule Case SPI MP
Modify a metric from 05 mins to 15 mins
1. Edit 05 mins schedule task policy to remove the metric.
2. Edit 15 mins schedule task policy to add the metrics.
3. Redeploy both of the above schedule task policies.
1. Click Assignments & Tuning, if an assignment is already done.
2. Edit the frequency parameter of a given metric change it from VeryHigh to High.
Note The same can be done by editing metric’s frequency parameter at the Aspect or MT level.
Remove metric from scheduling.
1. Edit the corresponding schedule task policy and remove the metric number.
2. Reploy the modified scheduled task policy.
1. Click Assignments & Tuning if an assignment is already done.
2. Edit the frequency parameter of a particular metric and change it from original to NORUN.
Note The same can be done by editing metric’s frequency parameter at the Aspect or MT level.
Modify the lowest schedule of collection from 05 mins to 10 mins.
Copy and create new schedule task policy with a schedule of 10 mins. Or
Modify the interval of scheduled task policy exposed as a parameter either at the Aspect or MT level. In this case Frequency of VeryHigh Scheduler.
Evolution Guide Page 154
Edit the 05 mins schedule task policy, change the interval and rename it to 10 mins.
WebLogic SPI Collector/Analyzer The wasspi_perl_su -S wasspi_ca -prod wls command is used in every collector policy in WLSSPI to do the following:
a. Collect specific data on all configured servers. For example, wasspi_perl -S wasspi_ca -prod wls -m 10-14,25,26.
b. Collect data from specific servers only. For example, wasspi_perl -S wasspi_ca -m -prod wls 245,246,260 -i server1,server2.
c. Collect data from specific servers. For example, wasspi_perl -S wasspi_ca -m -prod wls 220-225 -e server1,server2.
The same feature is achieved in the Oracle WebLogic MP by deploying selected aspects for a particular WebLogic Server Instance.
Discovery Policy The Oracle WebLogic MP has the Discovery policy template WebLogic_Discovery which is same as in WebLogic SPI. This triggers discovery script to generate XML as expected by the Discovery agent. This XML contains information about discovered WLS instances and its relationship with other J2EE components such as JDBC, Java Application and Infra elements. Optional elements may contain Oracle CIs and its relationships.The discovered information such as the CI type, attributes and relations remain same as SPI. MP uses the Toposync rules to create appropriate CIs and relationships and update RTSM whereas this data was represented in the Service Map on HPOM.
Policy Customizations There are multiple options to customize the SPI policies for different reasons. You can create new policy groups and copy specific policies to those groups to create your own WebLogic SPI groups. You can also modify the thresholds set in individual policies. In many cases, the policy’s defined threshold may involve a drill-down or roll-up metric. The widely used SPI policy customizations and corresponding MP approach are listed in the next few sections.
Policy Tagging
What is Policy Tagging in SPI?
You can use multiple sets of policies to define conditions pertaining to specific installations of the WebLogic Server. WebLogic SPI provides the “-t” (tag) option which enables the collector or analyzer to recognize customized policies that have a tag attached to the name.
For example, you can create a group of policies and change each policy name to include CLIENT01 in it. A metric monitor policy might be named as CLIENT01-WLSSPI_0012 0216 where the metric number must be retained. The collector policy should be named as FIRST_CLIENT-05min. You could then set up another group for SECOND_CLIENT and change all those policies to include the CLIENT02 in the name.
How is it achieved in MP?
This can be achieved by the OMi feature Management Templates. You can create different flavors of Management Templates by copying the OOTB MTs. This newly created Management Template can be customized to:
• Add or remove aspects
• Enable or disable metrics within an aspect
• Modify parameters for which an MT has to be deployed
For more information about MP customizations, see the chapter Best Practices for Customizing Management Packs in this document.
User assigned policy versioning
You can create customized policies for each group using the policy versioning approach. HPOM automatically changes a modified policy version by incrementing the last digit by 1. This method suggests to override this policy
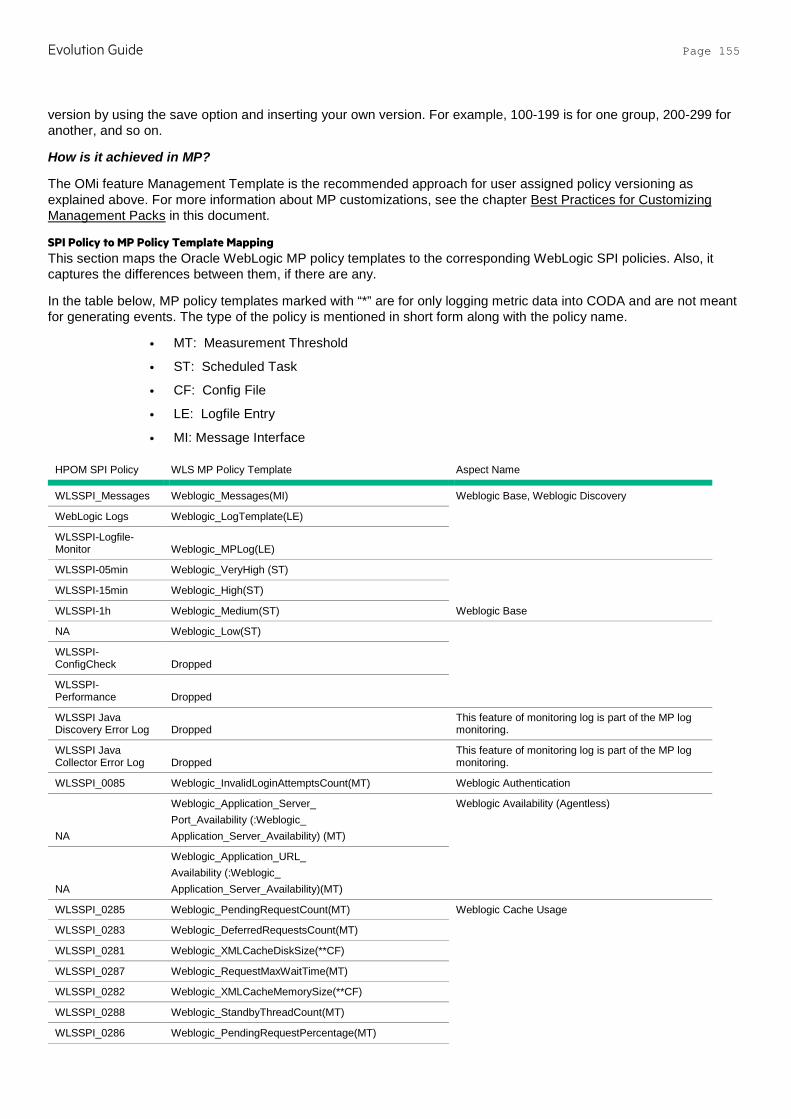
Evolution Guide Page 155
version by using the save option and inserting your own version. For example, 100-199 is for one group, 200-299 for another, and so on.
How is it achieved in MP?
The OMi feature Management Template is the recommended approach for user assigned policy versioning as explained above. For more information about MP customizations, see the chapter Best Practices for Customizing Management Packs in this document.
SPI Policy to MP Policy Template Mapping This section maps the Oracle WebLogic MP policy templates to the corresponding WebLogic SPI policies. Also, it captures the differences between them, if there are any.
In the table below, MP policy templates marked with “*” are for only logging metric data into CODA and are not meant for generating events. The type of the policy is mentioned in short form along with the policy name.
• MT: Measurement Threshold
• ST: Scheduled Task
• CF: Config File
• LE: Logfile Entry
• MI: Message Interface
HPOM SPI Policy WLS MP Policy Template Aspect Name
WLSSPI_Messages Weblogic_Messages(MI) Weblogic Base, Weblogic Discovery
WebLogic Logs Weblogic_LogTemplate(LE)
WLSSPI-Logfile-Monitor Weblogic_MPLog(LE)
WLSSPI-05min Weblogic_VeryHigh (ST)
Weblogic Base
WLSSPI-15min Weblogic_High(ST)
WLSSPI-1h Weblogic_Medium(ST)
NA Weblogic_Low(ST)
WLSSPI-ConfigCheck Dropped
WLSSPI-Performance Dropped
WLSSPI Java Discovery Error Log Dropped
This feature of monitoring log is part of the MP log monitoring.
WLSSPI Java Collector Error Log Dropped
This feature of monitoring log is part of the MP log monitoring.
WLSSPI_0085 Weblogic_InvalidLoginAttemptsCount(MT) Weblogic Authentication
NA
Weblogic_Application_Server_ Port_Availability (:Weblogic_ Application_Server_Availability) (MT)
Weblogic Availability (Agentless)
NA
Weblogic_Application_URL_ Availability (:Weblogic_ Application_Server_Availability)(MT)
WLSSPI_0285 Weblogic_PendingRequestCount(MT) Weblogic Cache Usage
WLSSPI_0283 Weblogic_DeferredRequestsCount(MT)
WLSSPI_0281 Weblogic_XMLCacheDiskSize(**CF)
WLSSPI_0287 Weblogic_RequestMaxWaitTime(MT)
WLSSPI_0282 Weblogic_XMLCacheMemorySize(**CF)
WLSSPI_0288 Weblogic_StandbyThreadCount(MT)
WLSSPI_0286 Weblogic_PendingRequestPercentage(MT)
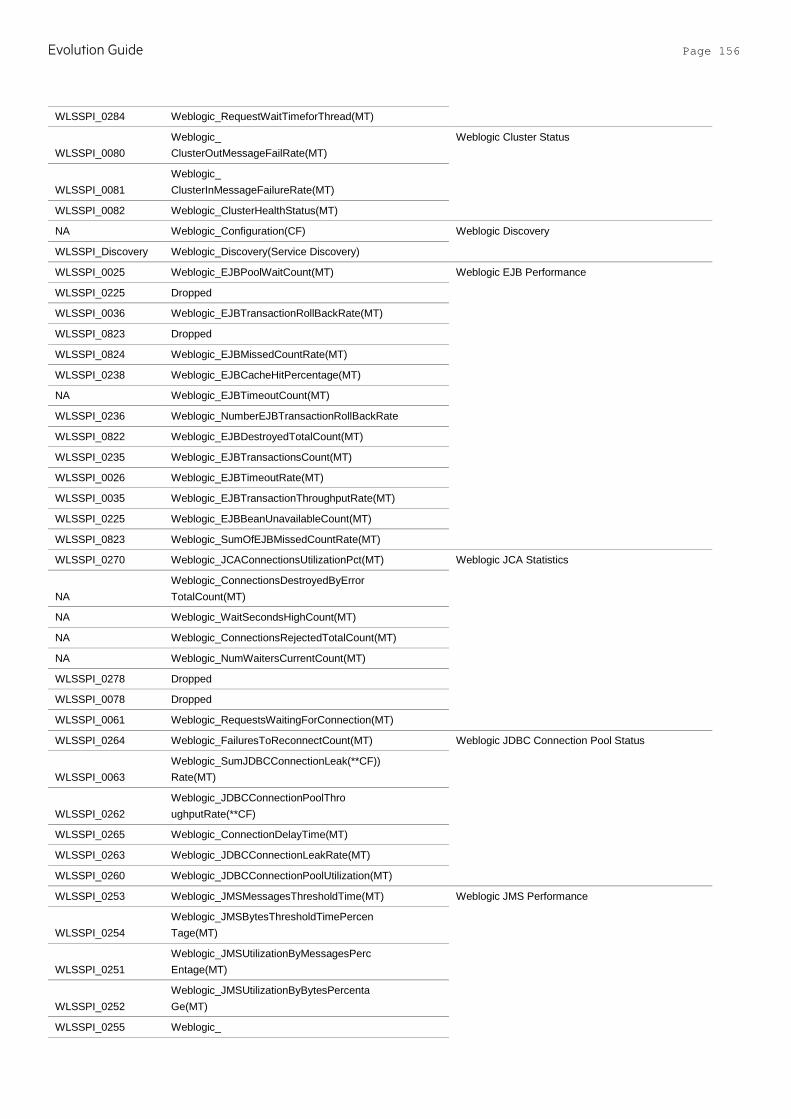
Evolution Guide Page 156
WLSSPI_0284 Weblogic_RequestWaitTimeforThread(MT)
WLSSPI_0080 Weblogic_ ClusterOutMessageFailRate(MT)
Weblogic Cluster Status
WLSSPI_0081 Weblogic_ ClusterInMessageFailureRate(MT)
WLSSPI_0082 Weblogic_ClusterHealthStatus(MT)
NA Weblogic_Configuration(CF) Weblogic Discovery
WLSSPI_Discovery Weblogic_Discovery(Service Discovery)
WLSSPI_0025 Weblogic_EJBPoolWaitCount(MT) Weblogic EJB Performance
WLSSPI_0225 Dropped
WLSSPI_0036 Weblogic_EJBTransactionRollBackRate(MT)
WLSSPI_0823 Dropped
WLSSPI_0824 Weblogic_EJBMissedCountRate(MT)
WLSSPI_0238 Weblogic_EJBCacheHitPercentage(MT)
NA Weblogic_EJBTimeoutCount(MT)
WLSSPI_0236 Weblogic_NumberEJBTransactionRollBackRate
WLSSPI_0822 Weblogic_EJBDestroyedTotalCount(MT)
WLSSPI_0235 Weblogic_EJBTransactionsCount(MT)
WLSSPI_0026 Weblogic_EJBTimeoutRate(MT)
WLSSPI_0035 Weblogic_EJBTransactionThroughputRate(MT)
WLSSPI_0225 Weblogic_EJBBeanUnavailableCount(MT)
WLSSPI_0823 Weblogic_SumOfEJBMissedCountRate(MT)
WLSSPI_0270 Weblogic_JCAConnectionsUtilizationPct(MT) Weblogic JCA Statistics
NA Weblogic_ConnectionsDestroyedByError TotalCount(MT)
NA Weblogic_WaitSecondsHighCount(MT)
NA Weblogic_ConnectionsRejectedTotalCount(MT)
NA Weblogic_NumWaitersCurrentCount(MT)
WLSSPI_0278 Dropped
WLSSPI_0078 Dropped
WLSSPI_0061 Weblogic_RequestsWaitingForConnection(MT)
WLSSPI_0264 Weblogic_FailuresToReconnectCount(MT) Weblogic JDBC Connection Pool Status
WLSSPI_0063 Weblogic_SumJDBCConnectionLeak(**CF)) Rate(MT)
WLSSPI_0262 Weblogic_JDBCConnectionPoolThro ughputRate(**CF)
WLSSPI_0265 Weblogic_ConnectionDelayTime(MT)
WLSSPI_0263 Weblogic_JDBCConnectionLeakRate(MT)
WLSSPI_0260 Weblogic_JDBCConnectionPoolUtilization(MT)
WLSSPI_0253 Weblogic_JMSMessagesThresholdTime(MT) Weblogic JMS Performance
WLSSPI_0254 Weblogic_JMSBytesThresholdTimePercen Tage(MT)
WLSSPI_0251 Weblogic_JMSUtilizationByMessagesPerc Entage(MT)
WLSSPI_0252 Weblogic_JMSUtilizationByBytesPercenta Ge(MT)
WLSSPI_0255 Weblogic_

Evolution Guide Page 157
JMSServerThruMessageRate(**CF)
WLSSPI_0256 Weblogic_JMSServerThruByteRate(**CF)
WLSSPI_0001 Weblogic_ServerStatus(MT) Weblogic Server Status
WLSSPI_0005 Weblogic_JVMHeapUsage(MT) Weblogic JVM Heap Memory
WLSSPI_0819 Weblogic_JVMHeapFreeMemorY(**CF)
WLSSPI_0007 Weblogic_GarbageCollectionTime(MT)
WLSSPI_0006 Weblogic_GarbageCollectionCount(MT)
WLSSPI_0008 Weblogic_GarbageCollectionThread(MT)
WLSSPI_0009 Weblogic_ProcessorsAverageLoad(MT)
WLSSPI_0011 Weblogic_ExecuteQThreadsInUse Weblogic Servlet Performance
WLSSPI_0014 actcount
WLSSPI_0013 Weblogic_SocketTrafficRate(**CF)
WLSSPI_0240 Weblogic_ServletAverageExecutionTi Me(MT)
WLSSPI_0241 Dropped
WLSSPI_0242 Weblogic_ServletRequestRate(MT)
WLSSPI_0820 Dropped - svrreqrestreq
WLSSPI_0012 Weblogic_ExecuteQMetricMonitors(MT)
WLSSPI_0010 Weblogic_ExecutionQueueThroughputRate(**CF)
NA Weblogic_ThreadPoolOverloadCondition(MT) Weblogic Thread Status
WLSSPI_0284 Weblogic_RequestWaitTimeforThread(MT)
WLSSPI_0075 Weblogic_TransactionSystemErrorRollbac kPercentage(MT)
Weblogic Transactions
WLSSPI_0071 Weblogic_TransactionRollbackPercentage(MT)
WLSSPI_0073 Weblogic_TransactionAppErrorRollbackPercentage(MT)
WLSSPI_0070 Weblogic_TransactionAverageTime(MT)
WLSSPI_0079 Weblogic_TransactionCapacityUtilizationPct(MT)
WLSSPI_0077 Weblogic_TransactionHeuristicsTotalCount(MT)
WLSSPI_0074 Weblogic_TransactionTimeErrorRollbackPercentage(MT)
WLSSPI_0076 Weblogic_TranactionThroughputRate(**CF)
WLSSPI_0072 Weblogic_TransactionResErrorRollbackPercentage(MT)
WLSSPI_0815 Dropped
WLSSPI_0245 Weblogic_WebApplicationSessionsCount WebLogic Web Application Status
WLSSPI_0246 Weblogic_WebApplicationHitRate
WLSSPI_0918 Dropped as the data is used for Title of Auto generated reports
WLSSPI_0917 Dropped as the data is used for Title of Auto generated reports
WLSSPI_0802 - 0811
Dropped as the data is used for Title of Auto generated reports
WLSSPI_0818 Dropped as the data is used for Title of Auto generated reports
WLSSPI_0817 Dropped as the data is used for Title of Auto generated reports
WLSSPI_0816 Dropped as the data is used for Title of Auto generated reports
WLSSPI_0813 Dropped as the data is used for Title of Auto generated reports
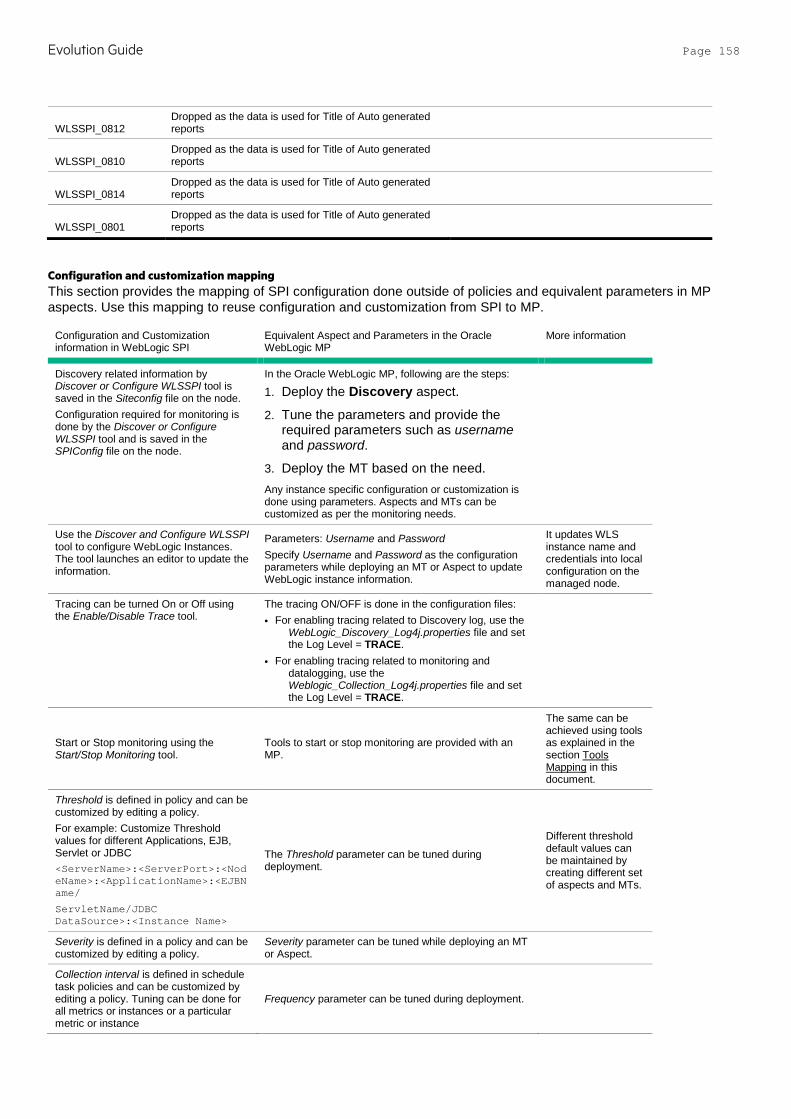
Evolution Guide Page 158
WLSSPI_0812 Dropped as the data is used for Title of Auto generated reports
WLSSPI_0810 Dropped as the data is used for Title of Auto generated reports
WLSSPI_0814 Dropped as the data is used for Title of Auto generated reports
WLSSPI_0801 Dropped as the data is used for Title of Auto generated reports
Configuration and customization mapping This section provides the mapping of SPI configuration done outside of policies and equivalent parameters in MP aspects. Use this mapping to reuse configuration and customization from SPI to MP.
Configuration and Customization information in WebLogic SPI
Equivalent Aspect and Parameters in the Oracle WebLogic MP
More information
Discovery related information by Discover or Configure WLSSPI tool is saved in the Siteconfig file on the node. Configuration required for monitoring is done by the Discover or Configure WLSSPI tool and is saved in the SPIConfig file on the node.
In the Oracle WebLogic MP, following are the steps:
1. Deploy the Discovery aspect.
2. Tune the parameters and provide the required parameters such as username and password.
3. Deploy the MT based on the need. Any instance specific configuration or customization is done using parameters. Aspects and MTs can be customized as per the monitoring needs.
Use the Discover and Configure WLSSPI tool to configure WebLogic Instances. The tool launches an editor to update the information.
Parameters: Username and Password Specify Username and Password as the configuration parameters while deploying an MT or Aspect to update WebLogic instance information.
It updates WLS instance name and credentials into local configuration on the managed node.
Tracing can be turned On or Off using the Enable/Disable Trace tool.
The tracing ON/OFF is done in the configuration files: • For enabling tracing related to Discovery log, use the
WebLogic_Discovery_Log4j.properties file and set the Log Level = TRACE.
• For enabling tracing related to monitoring and datalogging, use the Weblogic_Collection_Log4j.properties file and set the Log Level = TRACE.
Start or Stop monitoring using the Start/Stop Monitoring tool.
Tools to start or stop monitoring are provided with an MP.
The same can be achieved using tools as explained in the section Tools Mapping in this document.
Threshold is defined in policy and can be customized by editing a policy. For example: Customize Threshold values for different Applications, EJB, Servlet or JDBC <ServerName>:<ServerPort>:<NodeName>:<ApplicationName>:<EJBName/
ServletName/JDBC DataSource>:<Instance Name>
The Threshold parameter can be tuned during deployment.
Different threshold default values can be maintained by creating different set of aspects and MTs.
Severity is defined in a policy and can be customized by editing a policy.
Severity parameter can be tuned while deploying an MT or Aspect.
Collection interval is defined in schedule task policies and can be customized by editing a policy. Tuning can be done for all metrics or instances or a particular metric or instance
Frequency parameter can be tuned during deployment.
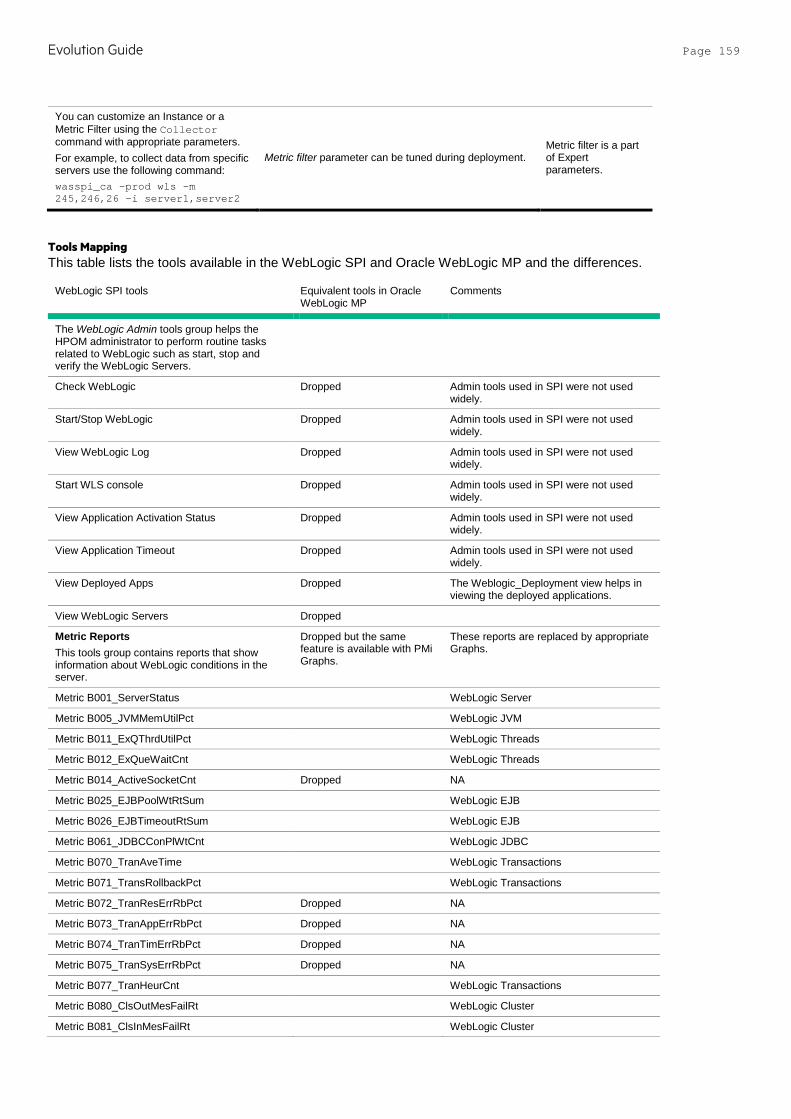
Evolution Guide Page 159
You can customize an Instance or a Metric Filter using the Collector command with appropriate parameters. For example, to collect data from specific servers use the following command: wasspi_ca -prod wls -m 245,246,26 -i server1,server2
Metric filter parameter can be tuned during deployment. Metric filter is a part of Expert parameters.
Tools Mapping This table lists the tools available in the WebLogic SPI and Oracle WebLogic MP and the differences.
WebLogic SPI tools Equivalent tools in Oracle WebLogic MP
Comments
The WebLogic Admin tools group helps the HPOM administrator to perform routine tasks related to WebLogic such as start, stop and verify the WebLogic Servers.
Check WebLogic Dropped Admin tools used in SPI were not used widely.
Start/Stop WebLogic Dropped Admin tools used in SPI were not used widely.
View WebLogic Log Dropped Admin tools used in SPI were not used widely.
Start WLS console Dropped Admin tools used in SPI were not used widely.
View Application Activation Status Dropped Admin tools used in SPI were not used widely.
View Application Timeout Dropped Admin tools used in SPI were not used widely.
View Deployed Apps Dropped The Weblogic_Deployment view helps in viewing the deployed applications.
View WebLogic Servers Dropped
Metric Reports This tools group contains reports that show information about WebLogic conditions in the server.
Dropped but the same feature is available with PMi Graphs.
These reports are replaced by appropriate Graphs.
Metric B001_ServerStatus WebLogic Server
Metric B005_JVMMemUtilPct WebLogic JVM
Metric B011_ExQThrdUtilPct WebLogic Threads
Metric B012_ExQueWaitCnt WebLogic Threads
Metric B014_ActiveSocketCnt Dropped NA
Metric B025_EJBPoolWtRtSum WebLogic EJB
Metric B026_EJBTimeoutRtSum WebLogic EJB
Metric B061_JDBCConPlWtCnt WebLogic JDBC
Metric B070_TranAveTime WebLogic Transactions
Metric B071_TransRollbackPct WebLogic Transactions
Metric B072_TranResErrRbPct Dropped NA
Metric B073_TranAppErrRbPct Dropped NA
Metric B074_TranTimErrRbPct Dropped NA
Metric B075_TranSysErrRbPct Dropped NA
Metric B077_TranHeurCnt WebLogic Transactions
Metric B080_ClsOutMesFailRt WebLogic Cluster
Metric B081_ClsInMesFailRt WebLogic Cluster
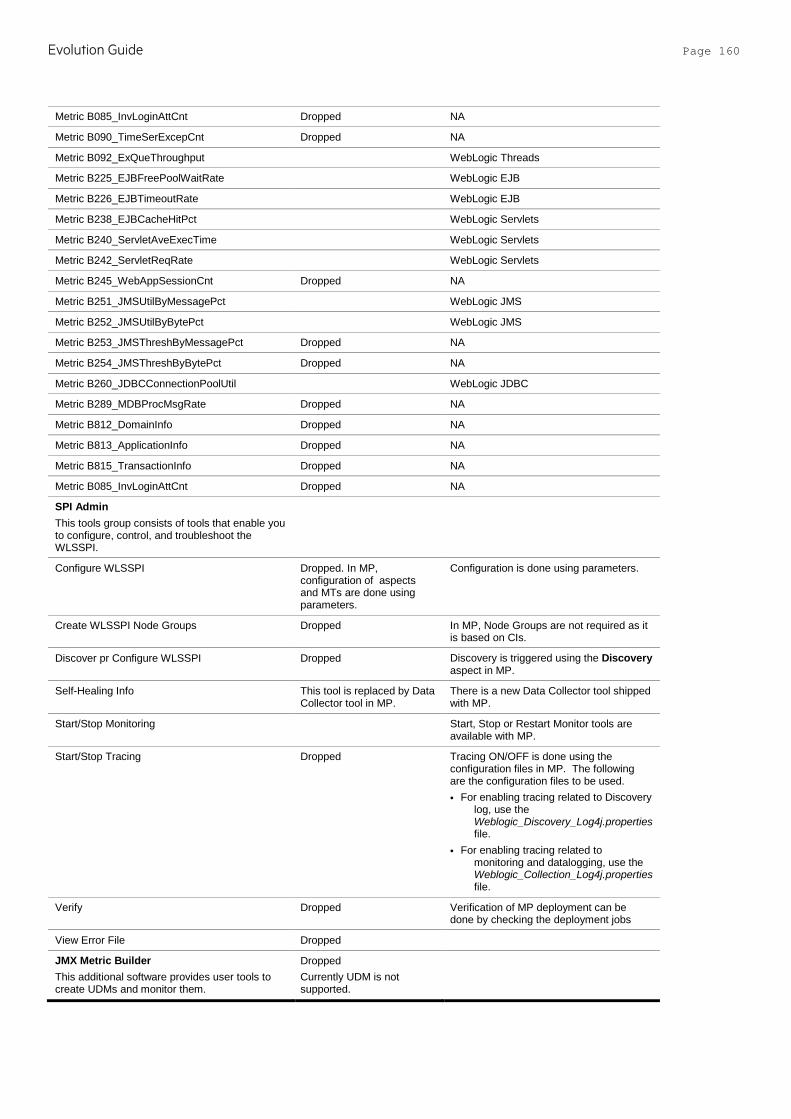
Evolution Guide Page 160
Metric B085_InvLoginAttCnt Dropped NA
Metric B090_TimeSerExcepCnt Dropped NA
Metric B092_ExQueThroughput WebLogic Threads
Metric B225_EJBFreePoolWaitRate WebLogic EJB
Metric B226_EJBTimeoutRate WebLogic EJB
Metric B238_EJBCacheHitPct WebLogic Servlets
Metric B240_ServletAveExecTime WebLogic Servlets
Metric B242_ServletReqRate WebLogic Servlets
Metric B245_WebAppSessionCnt Dropped NA
Metric B251_JMSUtilByMessagePct WebLogic JMS
Metric B252_JMSUtilByBytePct WebLogic JMS
Metric B253_JMSThreshByMessagePct Dropped NA
Metric B254_JMSThreshByBytePct Dropped NA
Metric B260_JDBCConnectionPoolUtil WebLogic JDBC
Metric B289_MDBProcMsgRate Dropped NA
Metric B812_DomainInfo Dropped NA
Metric B813_ApplicationInfo Dropped NA
Metric B815_TransactionInfo Dropped NA
Metric B085_InvLoginAttCnt Dropped NA
SPI Admin This tools group consists of tools that enable you to configure, control, and troubleshoot the WLSSPI.
Configure WLSSPI
Dropped. In MP, configuration of aspects and MTs are done using parameters.
Configuration is done using parameters.
Create WLSSPI Node Groups Dropped In MP, Node Groups are not required as it is based on CIs.
Discover pr Configure WLSSPI Dropped Discovery is triggered using the Discovery aspect in MP.
Self-Healing Info This tool is replaced by Data Collector tool in MP.
There is a new Data Collector tool shipped with MP.
Start/Stop Monitoring Start, Stop or Restart Monitor tools are available with MP.
Start/Stop Tracing Dropped Tracing ON/OFF is done using the configuration files in MP. The following are the configuration files to be used. • For enabling tracing related to Discovery
log, use the Weblogic_Discovery_Log4j.properties file.
• For enabling tracing related to monitoring and datalogging, use the Weblogic_Collection_Log4j.properties file.
Verify Dropped Verification of MP deployment can be done by checking the deployment jobs
View Error File Dropped
JMX Metric Builder This additional software provides user tools to create UDMs and monitor them.
Dropped Currently UDM is not supported.

Evolution Guide Page 161
Service Health Reporter SHR content packs are available on HPLN for both WebLogic SPI and MP.
There is new SHR ETL package available on HPLN to support Oracle WebLogic MP. Use the https://hpln.hpe.com/product/operations-bridge-reporter/content link to download the new ETL package and the file is OracleWebLogic_ETL_WebLogic_MP. For information on how to use the ETL package, see the instructions provided by SHR.
To install a Content Pack, see the Deployment Manager section in the HP Service Health Reporter Online Help for Administrators.
You can also see the HP Service Health Reporter Content Packs Release Notes available on HP Live Network.
Automatic Command Reports In WebLogic SPI, several metrics generate Automatic Command reports. These reports are generated as soon as an alarm is triggered in the HPOM. Automatic Command reports are generated for a single WebLogic Application Server instance with the exceeded threshold. In contrast to Automatic Command reports that are generated for a single WebLogic Application Server instance, manually generated reports reflect the current state of all WebLogic Application Server instances on the managed node. For more information about manually generated reports, see Tools Mapping in this document.
In MP the similar feature is available using Graphs. Graphs can be launched in the context of an event or a CI.
Node cleanup Remove SPI artifacts from the node that you are going to monitor using an MP. Following are the SPI artifacts that need to be removed in the given order.
1. Remove policies from the node.
a. List the policies using the command ovpolicy –l.
Note All WebLogic SPI policies start with WLSSPI_.
b. Execute one of the following commands to remove all policies from the node:
• By Name: ovpolicy –remove –polname <Name>
• By Type: ovpolicy –remove –poltype <Type>
You can also remove policies by deleting policy groups for a particular node on the server using the GUI.
Note Before you move from OM to OMi, make sure you do not remove the flexible management policy of type "mgrconf" if it has already been deployed.
You can also remove policies by deleting policy groups for a particular node on the server using the GUI.
2. Remove CODA / OVPA data sources.
For more information on how to back up the data if you need the data for future use, see the SHR documentation.
a. Remove CODA or OVPA data sources using the ddfutil command that is present under the instrumentation folder:
ddfutil <OvDataDir>/wasspi/wls/datalog/graph.log –rm all
ddfutil <OvDataDir>/wasspi/wls/datalog/reporter.log –rm all
Example on Unix:
ddfutil /var/opt/OV/wasspi/wls/datalog/graph.log –rm all

Evolution Guide Page 162
ddfutil /var/opt/OV/wasspi/wls/datalog/reporter.log –rm
Example on Windows:
ddfutil “C:\ProgramData\HP\HP BTO Software\wasspi\wls\datalog\graph.log” –rm all
ddfutil “C:\ProgramData\HP\HP BTO Software\wasspi\wls\datalog\reporter.log” –rm all
b. Restart CODA: ovc –restart coda
c. Verify Datasource removal: ovcodautil –showds
Note There should not be any datasources listed as WLSSPI_METRICS or WLSSPI_RPT_METRICS. Management Pack automatically creates datasources only on CODA.
3. Remove SPI Instrumentation.
The instrumentation files on the node prefixed with “wasspi” and “spi_WebLogic” can be deleted. The instrumentation files are located in the Instrumentation folder:
• On UNIX: /var/opt/OV/bin/instrumentation
• On Windows: %OvAgentDir%\bin\instrumentation
Note Instrumentation removal may fail if any executable or script is running. Stop the corresponding process (es) and then delete the instrumentation files.
4. Remove the configuration and log files.
The directory <OvAgentDir>/wasspi needs to be removed after taking a backup before deploying an MP.
For more information on cleaning up nodes, see Prepare nodes for deployment under the Recommended steps for moving from a SPI to MP section in this document.

Evolution Guide Page 163
IIS SPI and Management Pack This section explains the evolution from the HPOM Smart Plug-in version 6.05 for Web Server to the HPE OMi Management Pack for Microsoft IIS Web Server 1.0.
SPI and MP comparison This section provides an overview of similarities and differences between the IIS Web Server monitoring capability of HPOM Smart Plug-in for Web Server SPI (Web Server SPI) and OMi Management Pack for Microsoft IIS Web Server (Microsoft IIS MP). For information about working with the IIS Web Server MP, see the OMi Management Pack for IIS Web Server User Guide.
Features Web Server SPI version 6.05 OMi MP for Microsoft IIS Web Server 1.0
Prerequisites • HPOM W 8.16, HPOM W 9, HPOM U/S/L 9 and above • HP Operations Agent 11.05 or higher
• BSM or MA 9.23 or above • HP Operations Agent 11.12 or higher
Product Delivery The IIS SPI is available as a hotfix on the HPOM Web Server SPI 6.05. Web Server SPI is shipped with SPI DVD.
The Microsoft IIS MP can be downloaded as e-media from the HP Live Network location.
Installation Mount the ISO and use the OS specific installer: • HPUX: HP_Operations_Smart_Plug-ins_HPUX.depot • Linux: HP_Operations_Smart_Plug-
ins_Linux_setup.bin • Solaris: HP_Operations_Smart_Plug-
ins_Solaris_setup.bin • Windows: setup.vbs
The Microsoft IIS MP can be installed in any of the following methods:
1. Use the OMi ConfigWizard to install OMi 10.x. Use this option when you want to install the MP during OMi 10.x installation.
2. Install using the command line interface. Use this option when you want to install MP after OMi 10.x installation. For more information about the opr-mp-installer Command-Line Interface, see the OMi Administration Guide for more details.
3. Download the MP bits from the e-media download center. Then mount the ISO and use the OS specific installer.
• Linux: mpinstall.sh –i • Windows: cscript mpinstall.vbs –i Use this option when the latest version of this MP is available in the e-media download center.
Policy grouping Policies are grouped into policy groups.
Policies are logically grouped under Aspects. Aspects are available under Microsoft IIS in the Configuration Folders.
Policy Versioning The IIS SPI uses the <major version>.minor version> (xxxx.yyyy) format for policy versioning. Example: If the version of the SPI version is 6.05, policies updated in this release would be versioned as 6.0500. On the GUI it is displayed as 6.500. When you update a policy, minor version is updated. Example: When you update a policy with version 6.0500 (in GUI: 6.500), it will be changed to 6.0501 (in GUI 6.501).
The Microsoft IIS MP uses the xxxx.yyyy format for OMi policies. Example: In the Microsoft IIS MP 0001.0000 (in GUI 1.00), policies are versioned as 0001.0000. On the OMi GUI, it is displayed as 1.0. In the subsequent MP releases, the policy version is updated only if a given policy is updated in that release. When you update a policy, only minor versions (last two digits) are updated.
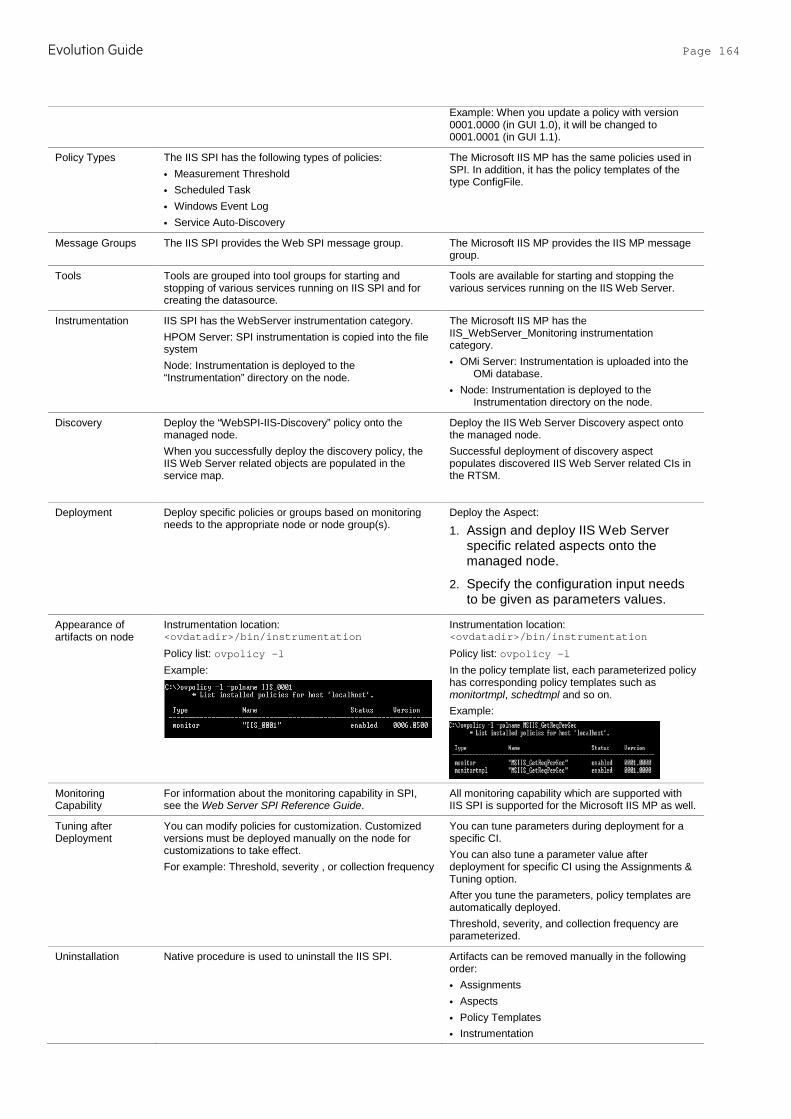
Evolution Guide Page 164
Example: When you update a policy with version 0001.0000 (in GUI 1.0), it will be changed to 0001.0001 (in GUI 1.1).
Policy Types The IIS SPI has the following types of policies: • Measurement Threshold • Scheduled Task • Windows Event Log • Service Auto-Discovery
The Microsoft IIS MP has the same policies used in SPI. In addition, it has the policy templates of the type ConfigFile.
Message Groups The IIS SPI provides the Web SPI message group. The Microsoft IIS MP provides the IIS MP message group.
Tools Tools are grouped into tool groups for starting and stopping of various services running on IIS SPI and for creating the datasource.
Tools are available for starting and stopping the various services running on the IIS Web Server.
Instrumentation IIS SPI has the WebServer instrumentation category. HPOM Server: SPI instrumentation is copied into the file system Node: Instrumentation is deployed to the “Instrumentation” directory on the node.
The Microsoft IIS MP has the IIS_WebServer_Monitoring instrumentation category. • OMi Server: Instrumentation is uploaded into the
OMi database. • Node: Instrumentation is deployed to the
Instrumentation directory on the node.
Discovery Deploy the “WebSPI-IIS-Discovery” policy onto the managed node. When you successfully deploy the discovery policy, the IIS Web Server related objects are populated in the service map.
Deploy the IIS Web Server Discovery aspect onto the managed node. Successful deployment of discovery aspect populates discovered IIS Web Server related CIs in the RTSM.
Deployment Deploy specific policies or groups based on monitoring needs to the appropriate node or node group(s).
Deploy the Aspect:
1. Assign and deploy IIS Web Server specific related aspects onto the managed node.
2. Specify the configuration input needs to be given as parameters values.
Appearance of artifacts on node
Instrumentation location: <ovdatadir>/bin/instrumentation Policy list: ovpolicy –l Example:
Instrumentation location: <ovdatadir>/bin/instrumentation Policy list: ovpolicy –l In the policy template list, each parameterized policy has corresponding policy templates such as monitortmpl, schedtmpl and so on. Example:
Monitoring Capability
For information about the monitoring capability in SPI, see the Web Server SPI Reference Guide.
All monitoring capability which are supported with IIS SPI is supported for the Microsoft IIS MP as well.
Tuning after Deployment
You can modify policies for customization. Customized versions must be deployed manually on the node for customizations to take effect. For example: Threshold, severity , or collection frequency
You can tune parameters during deployment for a specific CI. You can also tune a parameter value after deployment for specific CI using the Assignments & Tuning option. After you tune the parameters, policy templates are automatically deployed. Threshold, severity, and collection frequency are parameterized.
Uninstallation Native procedure is used to uninstall the IIS SPI. Artifacts can be removed manually in the following order: • Assignments • Aspects • Policy Templates • Instrumentation
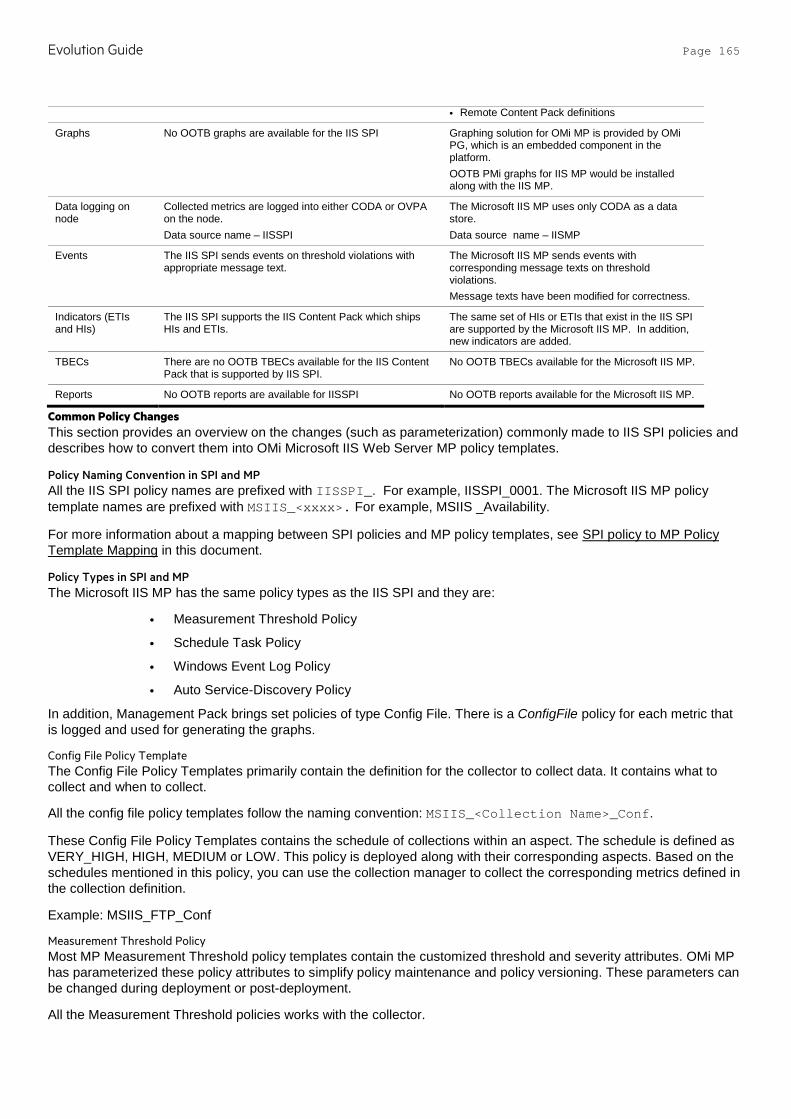
Evolution Guide Page 165
• Remote Content Pack definitions
Graphs No OOTB graphs are available for the IIS SPI Graphing solution for OMi MP is provided by OMi PG, which is an embedded component in the platform. OOTB PMi graphs for IIS MP would be installed along with the IIS MP.
Data logging on node
Collected metrics are logged into either CODA or OVPA on the node. Data source name – IISSPI
The Microsoft IIS MP uses only CODA as a data store. Data source name – IISMP
Events The IIS SPI sends events on threshold violations with appropriate message text.
The Microsoft IIS MP sends events with corresponding message texts on threshold violations. Message texts have been modified for correctness.
Indicators (ETIs and HIs)
The IIS SPI supports the IIS Content Pack which ships HIs and ETIs.
The same set of HIs or ETIs that exist in the IIS SPI are supported by the Microsoft IIS MP. In addition, new indicators are added.
TBECs There are no OOTB TBECs available for the IIS Content Pack that is supported by IIS SPI.
No OOTB TBECs available for the Microsoft IIS MP.
Reports No OOTB reports are available for IISSPI No OOTB reports available for the Microsoft IIS MP.
Common Policy Changes This section provides an overview on the changes (such as parameterization) commonly made to IIS SPI policies and describes how to convert them into OMi Microsoft IIS Web Server MP policy templates.
Policy Naming Convention in SPI and MP All the IIS SPI policy names are prefixed with IISSPI_. For example, IISSPI_0001. The Microsoft IIS MP policy template names are prefixed with MSIIS_<xxxx>. For example, MSIIS _Availability.
For more information about a mapping between SPI policies and MP policy templates, see SPI policy to MP Policy Template Mapping in this document.
Policy Types in SPI and MP The Microsoft IIS MP has the same policy types as the IIS SPI and they are:
• Measurement Threshold Policy
• Schedule Task Policy
• Windows Event Log Policy
• Auto Service-Discovery Policy
In addition, Management Pack brings set policies of type Config File. There is a ConfigFile policy for each metric that is logged and used for generating the graphs.
Config File Policy Template The Config File Policy Templates primarily contain the definition for the collector to collect data. It contains what to collect and when to collect.
All the config file policy templates follow the naming convention: MSIIS_<Collection Name>_Conf.
These Config File Policy Templates contains the schedule of collections within an aspect. The schedule is defined as VERY_HIGH, HIGH, MEDIUM or LOW. This policy is deployed along with their corresponding aspects. Based on the schedules mentioned in this policy, you can use the collection manager to collect the corresponding metrics defined in the collection definition.
Example: MSIIS_FTP_Conf
Measurement Threshold Policy Most MP Measurement Threshold policy templates contain the customized threshold and severity attributes. OMi MP has parameterized these policy attributes to simplify policy maintenance and policy versioning. These parameters can be changed during deployment or post-deployment.
All the Measurement Threshold policies works with the collector.
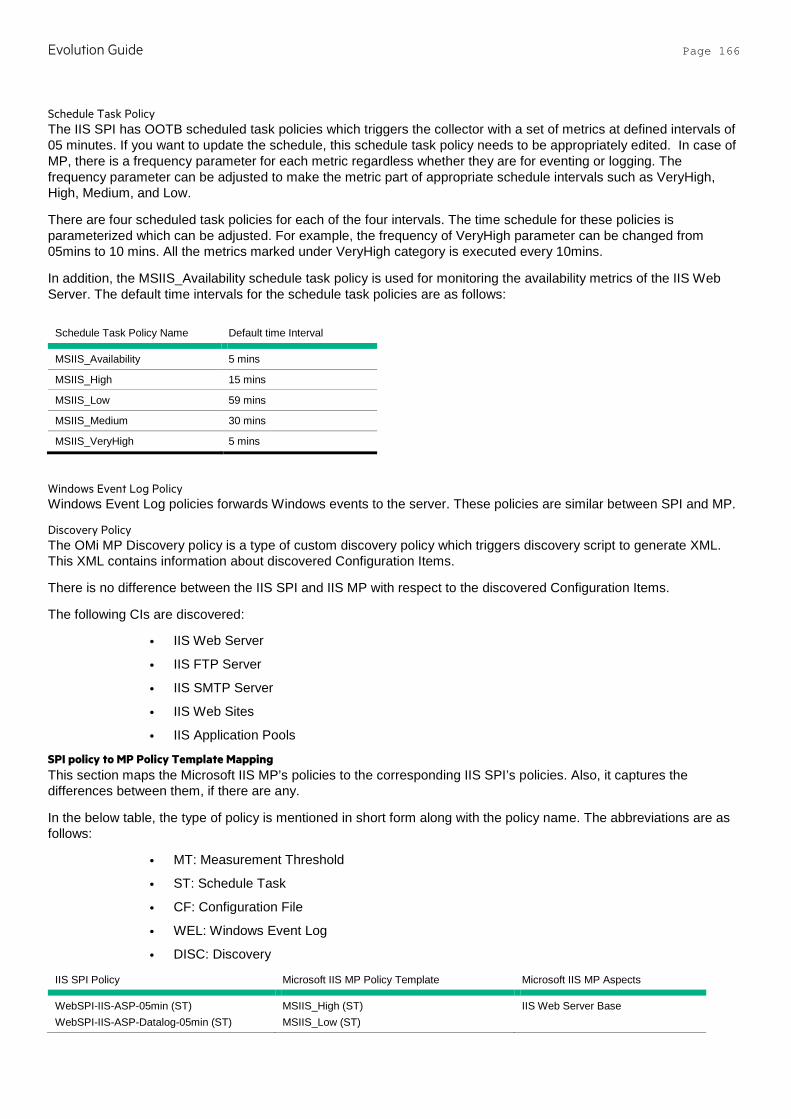
Evolution Guide Page 166
Schedule Task Policy The IIS SPI has OOTB scheduled task policies which triggers the collector with a set of metrics at defined intervals of 05 minutes. If you want to update the schedule, this schedule task policy needs to be appropriately edited. In case of MP, there is a frequency parameter for each metric regardless whether they are for eventing or logging. The frequency parameter can be adjusted to make the metric part of appropriate schedule intervals such as VeryHigh, High, Medium, and Low.
There are four scheduled task policies for each of the four intervals. The time schedule for these policies is parameterized which can be adjusted. For example, the frequency of VeryHigh parameter can be changed from 05mins to 10 mins. All the metrics marked under VeryHigh category is executed every 10mins.
In addition, the MSIIS_Availability schedule task policy is used for monitoring the availability metrics of the IIS Web Server. The default time intervals for the schedule task policies are as follows:
Schedule Task Policy Name Default time Interval
MSIIS_Availability 5 mins
MSIIS_High 15 mins
MSIIS_Low 59 mins
MSIIS_Medium 30 mins
MSIIS_VeryHigh 5 mins
Windows Event Log Policy Windows Event Log policies forwards Windows events to the server. These policies are similar between SPI and MP.
Discovery Policy The OMi MP Discovery policy is a type of custom discovery policy which triggers discovery script to generate XML. This XML contains information about discovered Configuration Items.
There is no difference between the IIS SPI and IIS MP with respect to the discovered Configuration Items.
The following CIs are discovered:
• IIS Web Server
• IIS FTP Server
• IIS SMTP Server
• IIS Web Sites
• IIS Application Pools
SPI policy to MP Policy Template Mapping This section maps the Microsoft IIS MP’s policies to the corresponding IIS SPI’s policies. Also, it captures the differences between them, if there are any.
In the below table, the type of policy is mentioned in short form along with the policy name. The abbreviations are as follows:
• MT: Measurement Threshold
• ST: Schedule Task
• CF: Configuration File
• WEL: Windows Event Log
• DISC: Discovery
IIS SPI Policy Microsoft IIS MP Policy Template Microsoft IIS MP Aspects
WebSPI-IIS-ASP-05min (ST) WebSPI-IIS-ASP-Datalog-05min (ST)
MSIIS_High (ST) MSIIS_Low (ST)
IIS Web Server Base
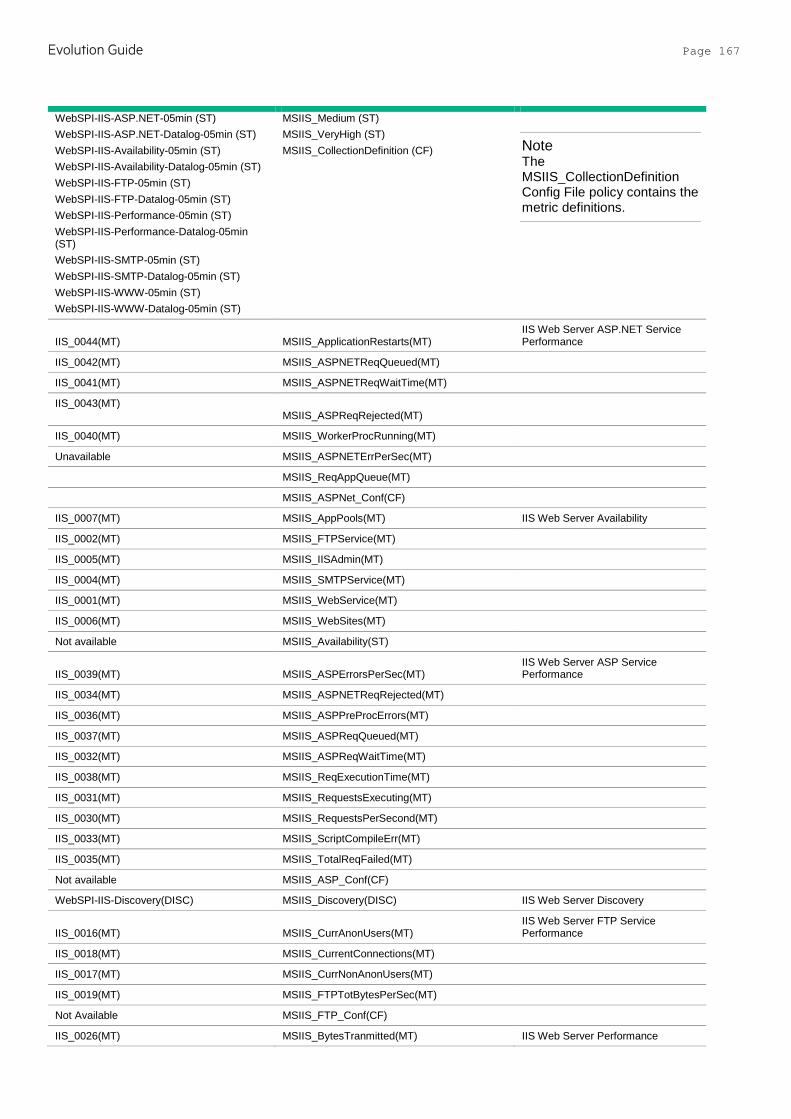
Evolution Guide Page 167
WebSPI-IIS-ASP.NET-05min (ST) WebSPI-IIS-ASP.NET-Datalog-05min (ST) WebSPI-IIS-Availability-05min (ST) WebSPI-IIS-Availability-Datalog-05min (ST) WebSPI-IIS-FTP-05min (ST) WebSPI-IIS-FTP-Datalog-05min (ST) WebSPI-IIS-Performance-05min (ST) WebSPI-IIS-Performance-Datalog-05min (ST) WebSPI-IIS-SMTP-05min (ST) WebSPI-IIS-SMTP-Datalog-05min (ST) WebSPI-IIS-WWW-05min (ST) WebSPI-IIS-WWW-Datalog-05min (ST)
MSIIS_Medium (ST) MSIIS_VeryHigh (ST) MSIIS_CollectionDefinition (CF) Note
The MSIIS_CollectionDefinition Config File policy contains the metric definitions.
IIS_0044(MT) MSIIS_ApplicationRestarts(MT) IIS Web Server ASP.NET Service Performance
IIS_0042(MT) MSIIS_ASPNETReqQueued(MT)
IIS_0041(MT) MSIIS_ASPNETReqWaitTime(MT)
IIS_0043(MT) MSIIS_ASPReqRejected(MT)
IIS_0040(MT) MSIIS_WorkerProcRunning(MT)
Unavailable MSIIS_ASPNETErrPerSec(MT)
MSIIS_ReqAppQueue(MT)
MSIIS_ASPNet_Conf(CF)
IIS_0007(MT) MSIIS_AppPools(MT) IIS Web Server Availability
IIS_0002(MT) MSIIS_FTPService(MT)
IIS_0005(MT) MSIIS_IISAdmin(MT)
IIS_0004(MT) MSIIS_SMTPService(MT)
IIS_0001(MT) MSIIS_WebService(MT)
IIS_0006(MT) MSIIS_WebSites(MT)
Not available MSIIS_Availability(ST)
IIS_0039(MT) MSIIS_ASPErrorsPerSec(MT) IIS Web Server ASP Service Performance
IIS_0034(MT) MSIIS_ASPNETReqRejected(MT)
IIS_0036(MT) MSIIS_ASPPreProcErrors(MT)
IIS_0037(MT) MSIIS_ASPReqQueued(MT)
IIS_0032(MT) MSIIS_ASPReqWaitTime(MT)
IIS_0038(MT) MSIIS_ReqExecutionTime(MT)
IIS_0031(MT) MSIIS_RequestsExecuting(MT)
IIS_0030(MT) MSIIS_RequestsPerSecond(MT)
IIS_0033(MT) MSIIS_ScriptCompileErr(MT)
IIS_0035(MT) MSIIS_TotalReqFailed(MT)
Not available MSIIS_ASP_Conf(CF)
WebSPI-IIS-Discovery(DISC) MSIIS_Discovery(DISC) IIS Web Server Discovery
IIS_0016(MT) MSIIS_CurrAnonUsers(MT) IIS Web Server FTP Service Performance
IIS_0018(MT) MSIIS_CurrentConnections(MT)
IIS_0017(MT) MSIIS_CurrNonAnonUsers(MT)
IIS_0019(MT) MSIIS_FTPTotBytesPerSec(MT)
Not Available MSIIS_FTP_Conf(CF)
IIS_0026(MT) MSIIS_BytesTranmitted(MT) IIS Web Server Performance
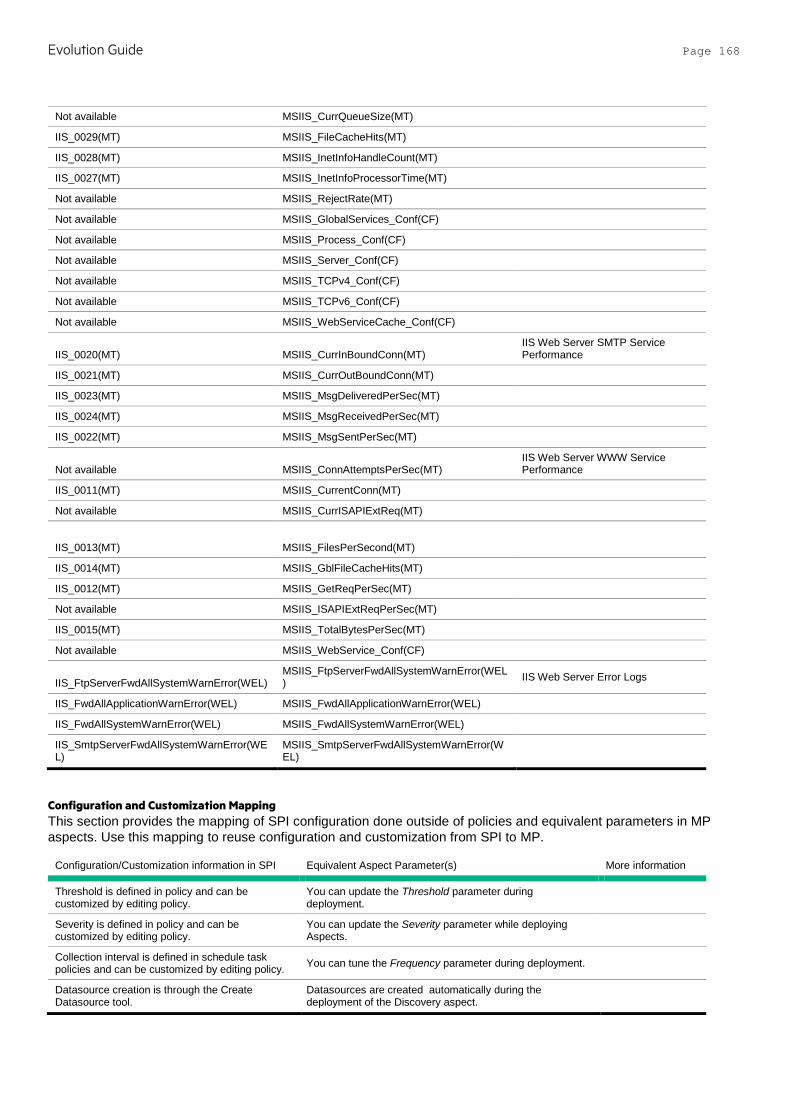
Evolution Guide Page 168
Not available MSIIS_CurrQueueSize(MT)
IIS_0029(MT) MSIIS_FileCacheHits(MT)
IIS_0028(MT) MSIIS_InetInfoHandleCount(MT)
IIS_0027(MT) MSIIS_InetInfoProcessorTime(MT)
Not available MSIIS_RejectRate(MT)
Not available MSIIS_GlobalServices_Conf(CF)
Not available MSIIS_Process_Conf(CF)
Not available MSIIS_Server_Conf(CF)
Not available MSIIS_TCPv4_Conf(CF)
Not available MSIIS_TCPv6_Conf(CF)
Not available MSIIS_WebServiceCache_Conf(CF)
IIS_0020(MT) MSIIS_CurrInBoundConn(MT) IIS Web Server SMTP Service Performance
IIS_0021(MT) MSIIS_CurrOutBoundConn(MT)
IIS_0023(MT) MSIIS_MsgDeliveredPerSec(MT)
IIS_0024(MT) MSIIS_MsgReceivedPerSec(MT)
IIS_0022(MT) MSIIS_MsgSentPerSec(MT)
Not available MSIIS_ConnAttemptsPerSec(MT) IIS Web Server WWW Service Performance
IIS_0011(MT) MSIIS_CurrentConn(MT)
Not available MSIIS_CurrISAPIExtReq(MT)
IIS_0013(MT) MSIIS_FilesPerSecond(MT)
IIS_0014(MT) MSIIS_GblFileCacheHits(MT)
IIS_0012(MT) MSIIS_GetReqPerSec(MT)
Not available MSIIS_ISAPIExtReqPerSec(MT)
IIS_0015(MT) MSIIS_TotalBytesPerSec(MT)
Not available MSIIS_WebService_Conf(CF)
IIS_FtpServerFwdAllSystemWarnError(WEL) MSIIS_FtpServerFwdAllSystemWarnError(WEL) IIS Web Server Error Logs
IIS_FwdAllApplicationWarnError(WEL) MSIIS_FwdAllApplicationWarnError(WEL)
IIS_FwdAllSystemWarnError(WEL) MSIIS_FwdAllSystemWarnError(WEL)
IIS_SmtpServerFwdAllSystemWarnError(WEL)
MSIIS_SmtpServerFwdAllSystemWarnError(WEL)
Configuration and Customization Mapping This section provides the mapping of SPI configuration done outside of policies and equivalent parameters in MP aspects. Use this mapping to reuse configuration and customization from SPI to MP.
Configuration/Customization information in SPI Equivalent Aspect Parameter(s) More information
Threshold is defined in policy and can be customized by editing policy.
You can update the Threshold parameter during deployment.
Severity is defined in policy and can be customized by editing policy.
You can update the Severity parameter while deploying Aspects.
Collection interval is defined in schedule task policies and can be customized by editing policy. You can tune the Frequency parameter during deployment.
Datasource creation is through the Create Datasource tool.
Datasources are created automatically during the deployment of the Discovery aspect.
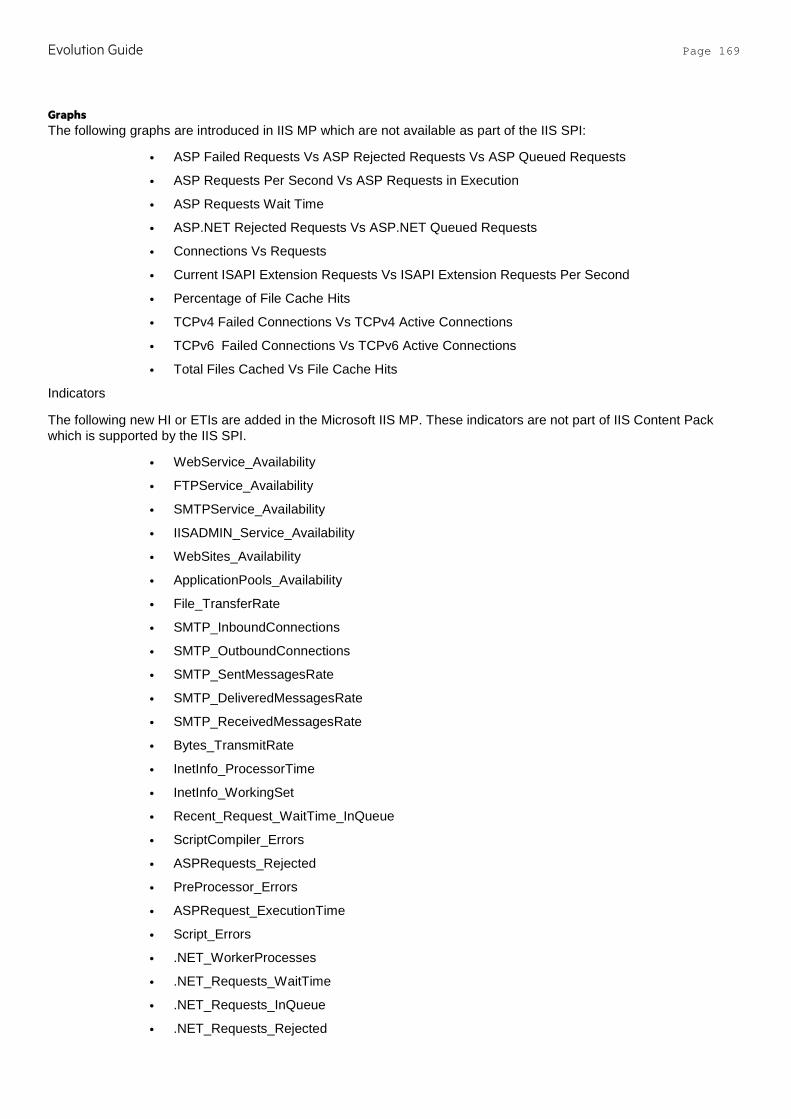
Evolution Guide Page 169
Graphs The following graphs are introduced in IIS MP which are not available as part of the IIS SPI:
• ASP Failed Requests Vs ASP Rejected Requests Vs ASP Queued Requests
• ASP Requests Per Second Vs ASP Requests in Execution
• ASP Requests Wait Time
• ASP.NET Rejected Requests Vs ASP.NET Queued Requests
• Connections Vs Requests
• Current ISAPI Extension Requests Vs ISAPI Extension Requests Per Second
• Percentage of File Cache Hits
• TCPv4 Failed Connections Vs TCPv4 Active Connections
• TCPv6 Failed Connections Vs TCPv6 Active Connections
• Total Files Cached Vs File Cache Hits
Indicators
The following new HI or ETIs are added in the Microsoft IIS MP. These indicators are not part of IIS Content Pack which is supported by the IIS SPI.
• WebService_Availability
• FTPService_Availability
• SMTPService_Availability
• IISADMIN_Service_Availability
• WebSites_Availability
• ApplicationPools_Availability
• File_TransferRate
• SMTP_InboundConnections
• SMTP_OutboundConnections
• SMTP_SentMessagesRate
• SMTP_DeliveredMessagesRate
• SMTP_ReceivedMessagesRate
• Bytes_TransmitRate
• InetInfo_ProcessorTime
• InetInfo_WorkingSet
• Recent_Request_WaitTime_InQueue
• ScriptCompiler_Errors
• ASPRequests_Rejected
• PreProcessor_Errors
• ASPRequest_ExecutionTime
• Script_Errors
• .NET_WorkerProcesses
• .NET_Requests_WaitTime
• .NET_Requests_InQueue
• .NET_Requests_Rejected
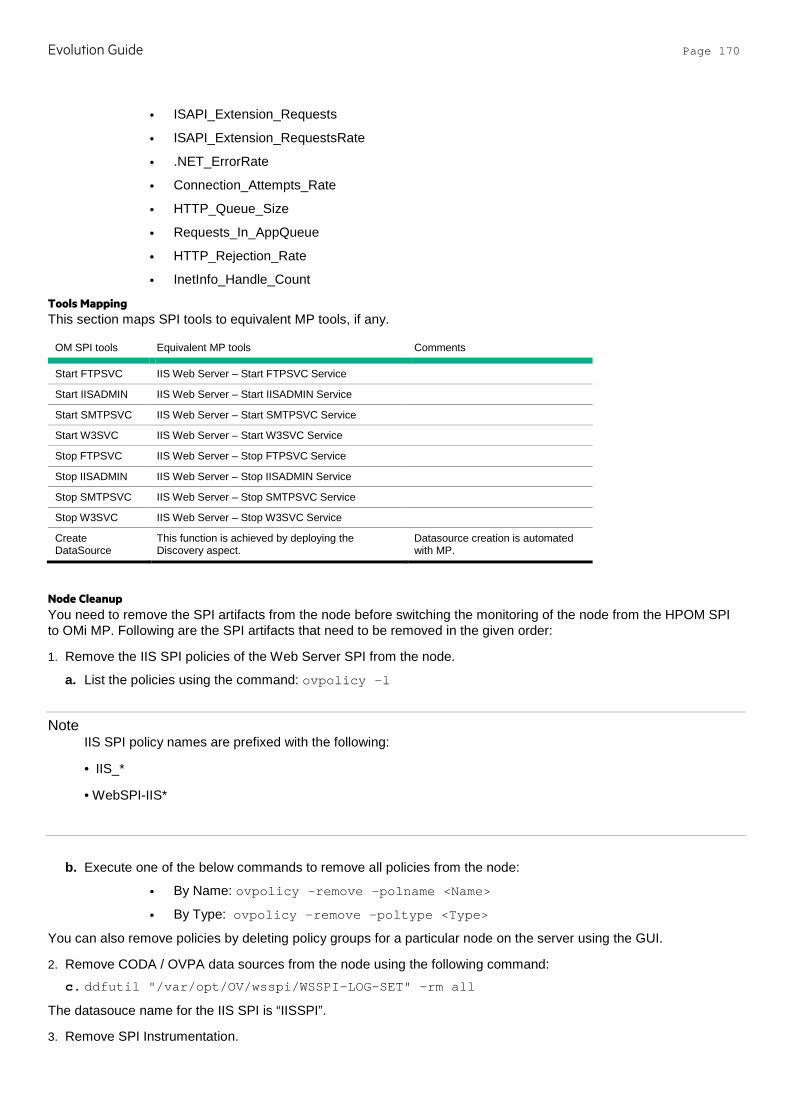
Evolution Guide Page 170
• ISAPI_Extension_Requests
• ISAPI_Extension_RequestsRate
• .NET_ErrorRate
• Connection_Attempts_Rate
• HTTP_Queue_Size
• Requests_In_AppQueue
• HTTP_Rejection_Rate
• InetInfo_Handle_Count
Tools Mapping This section maps SPI tools to equivalent MP tools, if any.
OM SPI tools Equivalent MP tools Comments
Start FTPSVC IIS Web Server – Start FTPSVC Service
Start IISADMIN IIS Web Server – Start IISADMIN Service
Start SMTPSVC IIS Web Server – Start SMTPSVC Service
Start W3SVC IIS Web Server – Start W3SVC Service
Stop FTPSVC IIS Web Server – Stop FTPSVC Service
Stop IISADMIN IIS Web Server – Stop IISADMIN Service
Stop SMTPSVC IIS Web Server – Stop SMTPSVC Service
Stop W3SVC IIS Web Server – Stop W3SVC Service
Create DataSource
This function is achieved by deploying the Discovery aspect.
Datasource creation is automated with MP.
Node Cleanup You need to remove the SPI artifacts from the node before switching the monitoring of the node from the HPOM SPI to OMi MP. Following are the SPI artifacts that need to be removed in the given order:
1. Remove the IIS SPI policies of the Web Server SPI from the node.
a. List the policies using the command: ovpolicy –l
Note IIS SPI policy names are prefixed with the following:
• IIS_*
• WebSPI-IIS*
b. Execute one of the below commands to remove all policies from the node:
• By Name: ovpolicy –remove –polname <Name>
• By Type: ovpolicy –remove –poltype <Type>
You can also remove policies by deleting policy groups for a particular node on the server using the GUI.
2. Remove CODA / OVPA data sources from the node using the following command: c. ddfutil "/var/opt/OV/wsspi/WSSPI-LOG-SET" –rm all
The datasouce name for the IIS SPI is “IISSPI”.
3. Remove SPI Instrumentation.
Evolution Guide Page 171
The instrumentation files are located at %OvDataDir%\bin\instrumentation. The instrumentation on the node prefixed with IIS_* or Wsspi_* can be deleted.
For more information on how to back up the data if you need the data for future use, see the SHR documentation.
Note wsspi_* is the common instrumentation for all the WebServer SPIs such as Apache, SunOne and IIS. Removal of wsspi_* instrumentation would remove all the Web Server SPIs from the node. You can skip this step if the SunOne and Apache WebServer SPIs are in use.
Note Instrumentation removal may fail if any executable or script is running. Stop the corresponding process (es) and then delete the instrumentation files.
4. Remove the configuration files.
Remove the configuration files located in the %OvDataDir%\conf\wsspi folder.
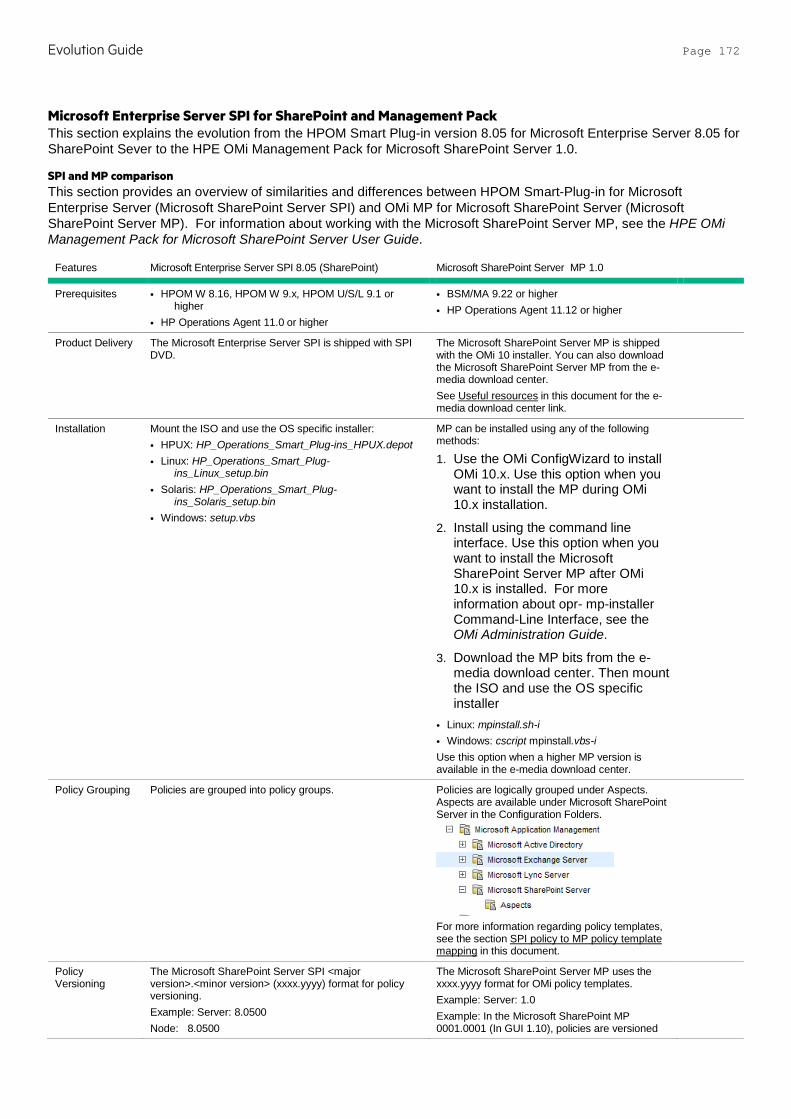
Evolution Guide Page 172
Microsoft Enterprise Server SPI for SharePoint and Management Pack This section explains the evolution from the HPOM Smart Plug-in version 8.05 for Microsoft Enterprise Server 8.05 for SharePoint Sever to the HPE OMi Management Pack for Microsoft SharePoint Server 1.0.
SPI and MP comparison This section provides an overview of similarities and differences between HPOM Smart-Plug-in for Microsoft Enterprise Server (Microsoft SharePoint Server SPI) and OMi MP for Microsoft SharePoint Server (Microsoft SharePoint Server MP). For information about working with the Microsoft SharePoint Server MP, see the HPE OMi Management Pack for Microsoft SharePoint Server User Guide.
Features Microsoft Enterprise Server SPI 8.05 (SharePoint) Microsoft SharePoint Server MP 1.0
Prerequisites • HPOM W 8.16, HPOM W 9.x, HPOM U/S/L 9.1 or higher
• HP Operations Agent 11.0 or higher
• BSM/MA 9.22 or higher • HP Operations Agent 11.12 or higher
Product Delivery The Microsoft Enterprise Server SPI is shipped with SPI DVD.
The Microsoft SharePoint Server MP is shipped with the OMi 10 installer. You can also download the Microsoft SharePoint Server MP from the e-media download center. See Useful resources in this document for the e-media download center link.
Installation Mount the ISO and use the OS specific installer: • HPUX: HP_Operations_Smart_Plug-ins_HPUX.depot • Linux: HP_Operations_Smart_Plug-
ins_Linux_setup.bin • Solaris: HP_Operations_Smart_Plug-
ins_Solaris_setup.bin • Windows: setup.vbs
MP can be installed using any of the following methods:
1. Use the OMi ConfigWizard to install OMi 10.x. Use this option when you want to install the MP during OMi 10.x installation.
2. Install using the command line interface. Use this option when you want to install the Microsoft SharePoint Server MP after OMi 10.x is installed. For more information about opr- mp-installer Command-Line Interface, see the OMi Administration Guide.
3. Download the MP bits from the e-media download center. Then mount the ISO and use the OS specific installer
• Linux: mpinstall.sh-i • Windows: cscript mpinstall.vbs-i Use this option when a higher MP version is available in the e-media download center.
Policy Grouping Policies are grouped into policy groups. Policies are logically grouped under Aspects. Aspects are available under Microsoft SharePoint Server in the Configuration Folders.
For more information regarding policy templates, see the section SPI policy to MP policy template mapping in this document.
Policy Versioning
The Microsoft SharePoint Server SPI <major version>.<minor version> (xxxx.yyyy) format for policy versioning. Example: Server: 8.0500 Node: 8.0500
The Microsoft SharePoint Server MP uses the xxxx.yyyy format for OMi policy templates. Example: Server: 1.0 Example: In the Microsoft SharePoint MP 0001.0001 (In GUI 1.10), policies are versioned

Evolution Guide Page 173
When the SPI version is 08.05, policies updated in this release would be versioned as 0008.0500. On the GUI, it is displayed as 8.0500. When you update a policy, only the minor version (Last two digits) should be updated. Example: When you update a policy with version 0008.0500 (in GUI: 8.500), it will be changed to 8.500.0001 (in GUI 8.500).
as 0001.0000. On the OMi GUI, it is displayed as 1.0. In the subsequent MP releases, policy version is updated only if a particular policy is updated in that release. When you update a policy, only the minor version (last two digits) is updated. Example: When you update a policy with version 0001.0000 (in GUI 1.0), it will be changed to 0001.0001(in GUI 1.1).
Policy Types The Microsoft SharePoint Server SPI has the following policy types: • Measurement Threshold • Scheduled Task • Windows Event Log • Discovery
The Microsoft SharePoint Server MP has the following policy template types: • Measurement Threshold • Scheduled Task • Windows Event Log • Discovery • ConfigFile Template
Message Groups Microsoft Enterprise Server SPI for Microsoft SharePoint Server 2010 contains message groups for events generated from SharePoint 2010. Microsoft Enterprise Server SPI for Microsoft SharePoint Server 2013 does not have message groups.
The Microsoft SharePoint Server MP does not have message groups.
Tools Microsoft Enterprise Server SPI provides the following tools: • Create Datasource for Sharepoint Server • Enable SPTrace
The Microsoft SharePoint Server MP has more tools that are primarily used for managing the node. For more information about tools in MP, see Tools Mapping in this document.
Instrumentation The Microsoft Enterprise Server SPI provides the following instrumentation categories: • SharePoint_Server • SP2013 • MSCore In HPOM, the SPI instrumentation is stored in file system.
Instrumentation category of MP: MSSP-Core OMi Server: Instrumentation is uploaded into the OMi database. Node: There is no difference with the instrumentation location on nodes. Instrumentation is deployed to the same directories as in the SPI. In MP, the new instrumentation binaries are prefixed with MPMS_ and the existing binaries use the same name. The names of the Spec files and datasources are retained to ensure backward compatibility with the existing reporting and graphing solutions.
Discovery Deploy Sharepoint_Discovery or SharePoint2013_Discovery policy onto the managed node. When you successfully deploy the Discovery policy is deployed successfully, the discovered instances are shown in the service map.
The Microsoft SharePoint Server MP has two types of Discovery:
a. Basic Discovery that does not require user credentials.
b. Extensive Discovery that requires user credentials.
Deploy the SharePoint Discovery aspect for basic discovery. Deploy the SharePoint Extended Discovery aspect for extensive discovery.
If the discovery is successful, the discovered instances are shown as appropriate CIs in the RTSM. Basic Discovery populates the following CI in RTSM: • SharePoint Server Extensive Discovery populates the following CIs in RTSM: • SharePoint Server • SharePoint Server Roles • SQL Server
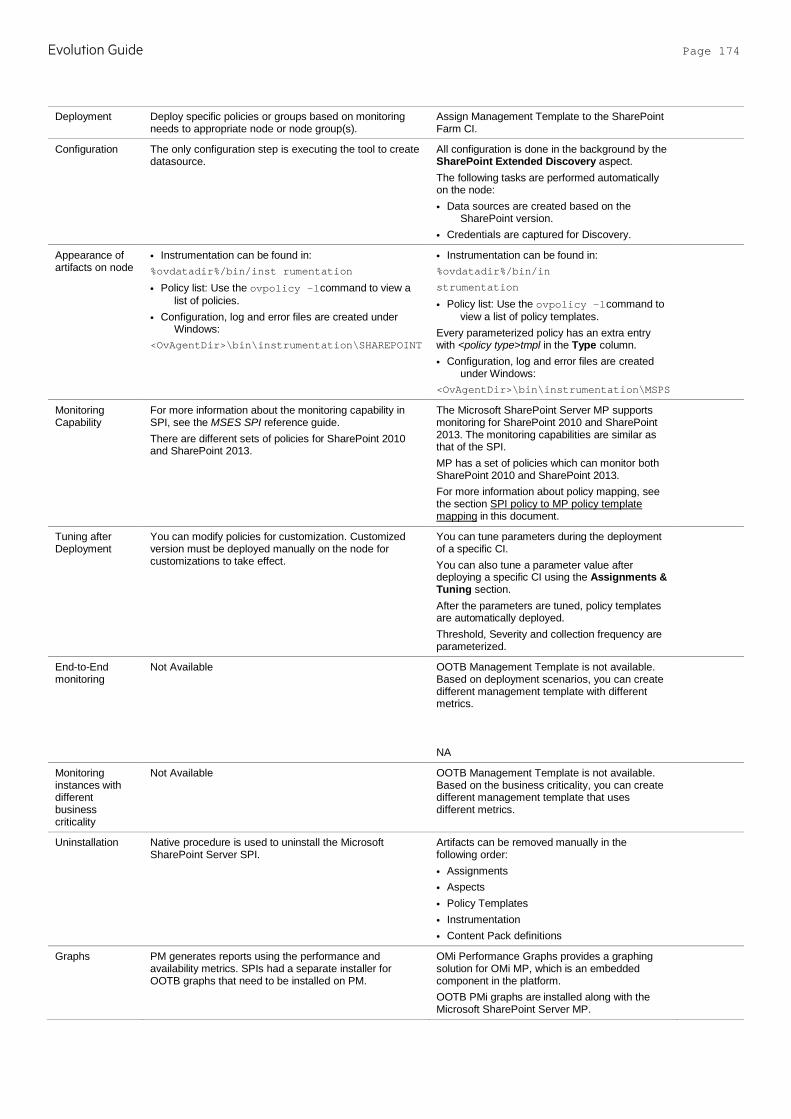
Evolution Guide Page 174
Deployment Deploy specific policies or groups based on monitoring needs to appropriate node or node group(s).
Assign Management Template to the SharePoint Farm CI.
Configuration The only configuration step is executing the tool to create datasource.
All configuration is done in the background by the SharePoint Extended Discovery aspect. The following tasks are performed automatically on the node: • Data sources are created based on the
SharePoint version. • Credentials are captured for Discovery.
Appearance of artifacts on node
• Instrumentation can be found in: %ovdatadir%/bin/inst rumentation
• Policy list: Use the ovpolicy –l command to view a list of policies.
• Configuration, log and error files are created under Windows:
<OvAgentDir>\bin\instrumentation\SHAREPOINT
• Instrumentation can be found in: %ovdatadir%/bin/in
strumentation
• Policy list: Use the ovpolicy –l command to view a list of policy templates.
Every parameterized policy has an extra entry with <policy type>tmpl in the Type column. • Configuration, log and error files are created
under Windows: <OvAgentDir>\bin\instrumentation\MSPS
Monitoring Capability
For more information about the monitoring capability in SPI, see the MSES SPI reference guide. There are different sets of policies for SharePoint 2010 and SharePoint 2013.
The Microsoft SharePoint Server MP supports monitoring for SharePoint 2010 and SharePoint 2013. The monitoring capabilities are similar as that of the SPI. MP has a set of policies which can monitor both SharePoint 2010 and SharePoint 2013. For more information about policy mapping, see the section SPI policy to MP policy template mapping in this document.
Tuning after Deployment
You can modify policies for customization. Customized version must be deployed manually on the node for customizations to take effect.
You can tune parameters during the deployment of a specific CI. You can also tune a parameter value after deploying a specific CI using the Assignments & Tuning section. After the parameters are tuned, policy templates are automatically deployed. Threshold, Severity and collection frequency are parameterized.
End-to-End monitoring
Not Available OOTB Management Template is not available. Based on deployment scenarios, you can create different management template with different metrics. NA
Monitoring instances with different business criticality
Not Available OOTB Management Template is not available. Based on the business criticality, you can create different management template that uses different metrics.
Uninstallation Native procedure is used to uninstall the Microsoft SharePoint Server SPI.
Artifacts can be removed manually in the following order: • Assignments • Aspects • Policy Templates • Instrumentation • Content Pack definitions
Graphs PM generates reports using the performance and availability metrics. SPIs had a separate installer for OOTB graphs that need to be installed on PM.
OMi Performance Graphs provides a graphing solution for OMi MP, which is an embedded component in the platform. OOTB PMi graphs are installed along with the Microsoft SharePoint Server MP.
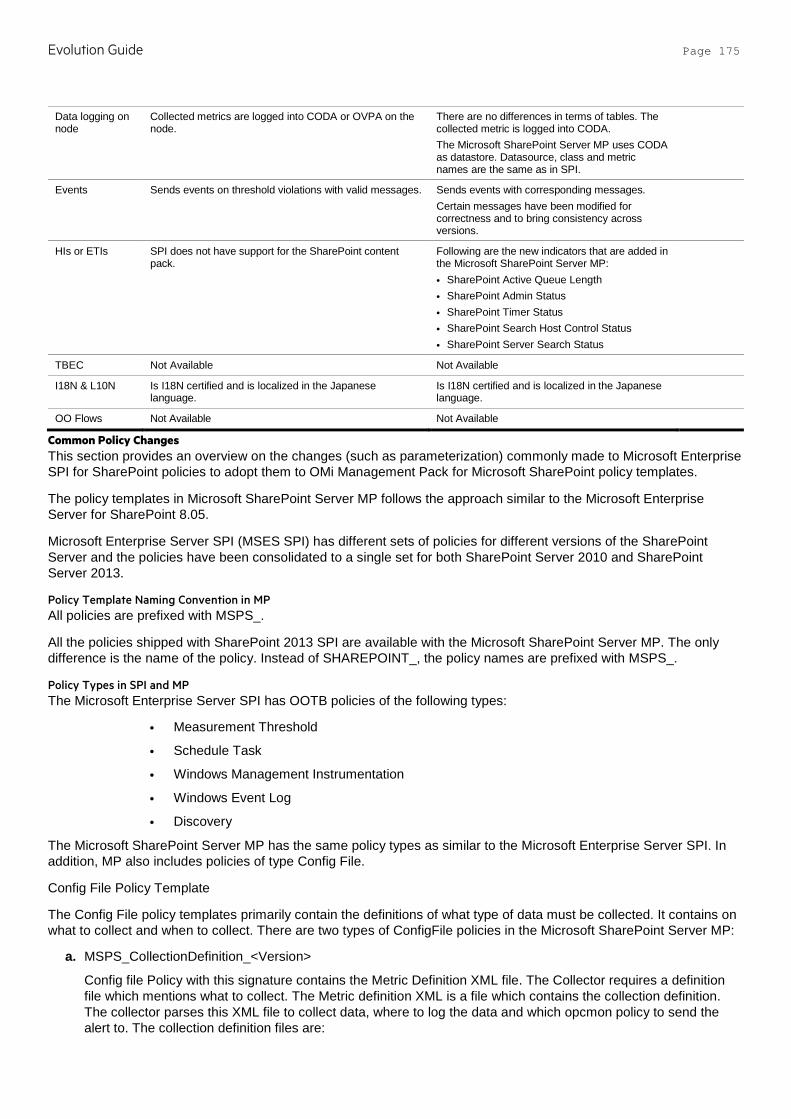
Evolution Guide Page 175
Data logging on node
Collected metrics are logged into CODA or OVPA on the node.
There are no differences in terms of tables. The collected metric is logged into CODA. The Microsoft SharePoint Server MP uses CODA as datastore. Datasource, class and metric names are the same as in SPI.
Events Sends events on threshold violations with valid messages. Sends events with corresponding messages. Certain messages have been modified for correctness and to bring consistency across versions.
HIs or ETIs SPI does not have support for the SharePoint content pack.
Following are the new indicators that are added in the Microsoft SharePoint Server MP: • SharePoint Active Queue Length • SharePoint Admin Status • SharePoint Timer Status • SharePoint Search Host Control Status • SharePoint Server Search Status
TBEC Not Available Not Available
I18N & L10N Is I18N certified and is localized in the Japanese language.
Is I18N certified and is localized in the Japanese language.
OO Flows Not Available Not Available
Common Policy Changes This section provides an overview on the changes (such as parameterization) commonly made to Microsoft Enterprise SPI for SharePoint policies to adopt them to OMi Management Pack for Microsoft SharePoint policy templates.
The policy templates in Microsoft SharePoint Server MP follows the approach similar to the Microsoft Enterprise Server for SharePoint 8.05.
Microsoft Enterprise Server SPI (MSES SPI) has different sets of policies for different versions of the SharePoint Server and the policies have been consolidated to a single set for both SharePoint Server 2010 and SharePoint Server 2013.
Policy Template Naming Convention in MP All policies are prefixed with MSPS_.
All the policies shipped with SharePoint 2013 SPI are available with the Microsoft SharePoint Server MP. The only difference is the name of the policy. Instead of SHAREPOINT_, the policy names are prefixed with MSPS_.
Policy Types in SPI and MP The Microsoft Enterprise Server SPI has OOTB policies of the following types:
• Measurement Threshold
• Schedule Task
• Windows Management Instrumentation
• Windows Event Log
• Discovery
The Microsoft SharePoint Server MP has the same policy types as similar to the Microsoft Enterprise Server SPI. In addition, MP also includes policies of type Config File.
Config File Policy Template
The Config File policy templates primarily contain the definitions of what type of data must be collected. It contains on what to collect and when to collect. There are two types of ConfigFile policies in the Microsoft SharePoint Server MP:
a. MSPS_CollectionDefinition_<Version>
Config file Policy with this signature contains the Metric Definition XML file. The Collector requires a definition file which mentions what to collect. The Metric definition XML is a file which contains the collection definition. The collector parses this XML file to collect data, where to log the data and which opcmon policy to send the alert to. The collection definition files are:
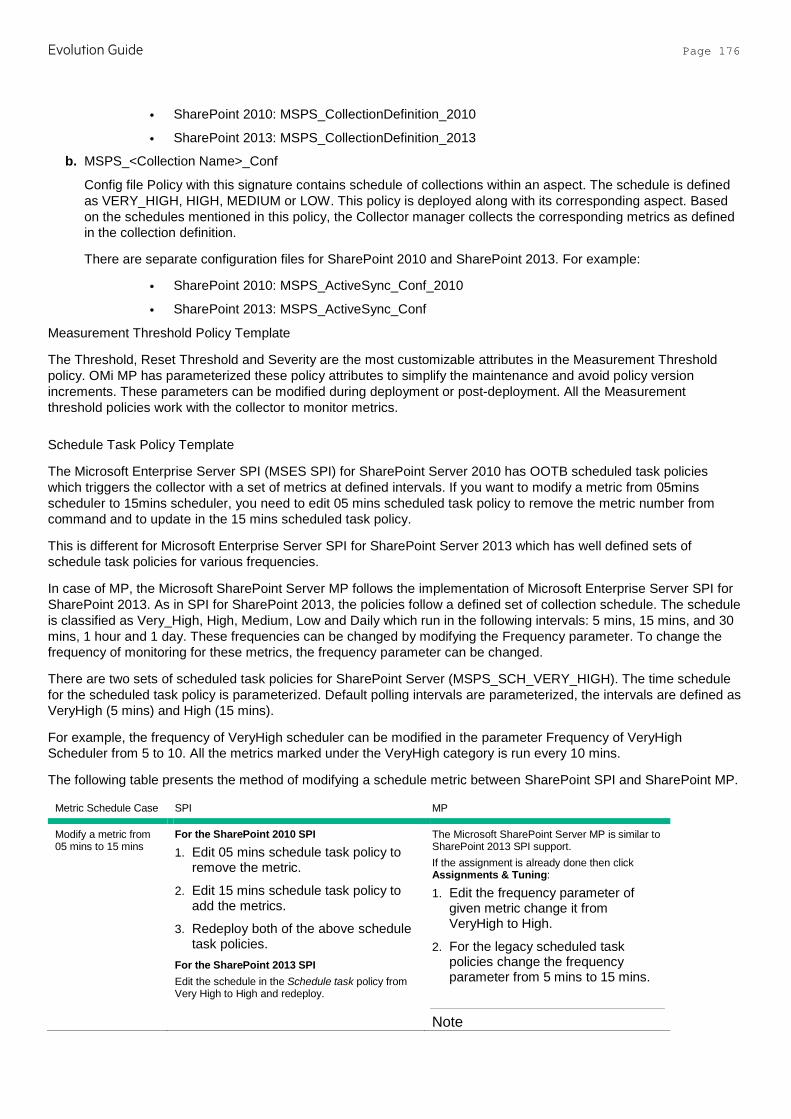
Evolution Guide Page 176
• SharePoint 2010: MSPS_CollectionDefinition_2010
• SharePoint 2013: MSPS_CollectionDefinition_2013
b. MSPS_<Collection Name>_Conf
Config file Policy with this signature contains schedule of collections within an aspect. The schedule is defined as VERY_HIGH, HIGH, MEDIUM or LOW. This policy is deployed along with its corresponding aspect. Based on the schedules mentioned in this policy, the Collector manager collects the corresponding metrics as defined in the collection definition.
There are separate configuration files for SharePoint 2010 and SharePoint 2013. For example:
• SharePoint 2010: MSPS_ActiveSync_Conf_2010
• SharePoint 2013: MSPS_ActiveSync_Conf
Measurement Threshold Policy Template
The Threshold, Reset Threshold and Severity are the most customizable attributes in the Measurement Threshold policy. OMi MP has parameterized these policy attributes to simplify the maintenance and avoid policy version increments. These parameters can be modified during deployment or post-deployment. All the Measurement threshold policies work with the collector to monitor metrics.
Schedule Task Policy Template
The Microsoft Enterprise Server SPI (MSES SPI) for SharePoint Server 2010 has OOTB scheduled task policies which triggers the collector with a set of metrics at defined intervals. If you want to modify a metric from 05mins scheduler to 15mins scheduler, you need to edit 05 mins scheduled task policy to remove the metric number from command and to update in the 15 mins scheduled task policy.
This is different for Microsoft Enterprise Server SPI for SharePoint Server 2013 which has well defined sets of schedule task policies for various frequencies.
In case of MP, the Microsoft SharePoint Server MP follows the implementation of Microsoft Enterprise Server SPI for SharePoint 2013. As in SPI for SharePoint 2013, the policies follow a defined set of collection schedule. The schedule is classified as Very_High, High, Medium, Low and Daily which run in the following intervals: 5 mins, 15 mins, and 30 mins, 1 hour and 1 day. These frequencies can be changed by modifying the Frequency parameter. To change the frequency of monitoring for these metrics, the frequency parameter can be changed.
There are two sets of scheduled task policies for SharePoint Server (MSPS_SCH_VERY_HIGH). The time schedule for the scheduled task policy is parameterized. Default polling intervals are parameterized, the intervals are defined as VeryHigh (5 mins) and High (15 mins).
For example, the frequency of VeryHigh scheduler can be modified in the parameter Frequency of VeryHigh Scheduler from 5 to 10. All the metrics marked under the VeryHigh category is run every 10 mins.
The following table presents the method of modifying a schedule metric between SharePoint SPI and SharePoint MP.
Metric Schedule Case SPI MP
Modify a metric from 05 mins to 15 mins
For the SharePoint 2010 SPI
1. Edit 05 mins schedule task policy to remove the metric.
2. Edit 15 mins schedule task policy to add the metrics.
3. Redeploy both of the above schedule task policies.
For the SharePoint 2013 SPI Edit the schedule in the Schedule task policy from Very High to High and redeploy.
The Microsoft SharePoint Server MP is similar to SharePoint 2013 SPI support. If the assignment is already done then click Assignments & Tuning:
1. Edit the frequency parameter of given metric change it from VeryHigh to High.
2. For the legacy scheduled task policies change the frequency parameter from 5 mins to 15 mins.
Note
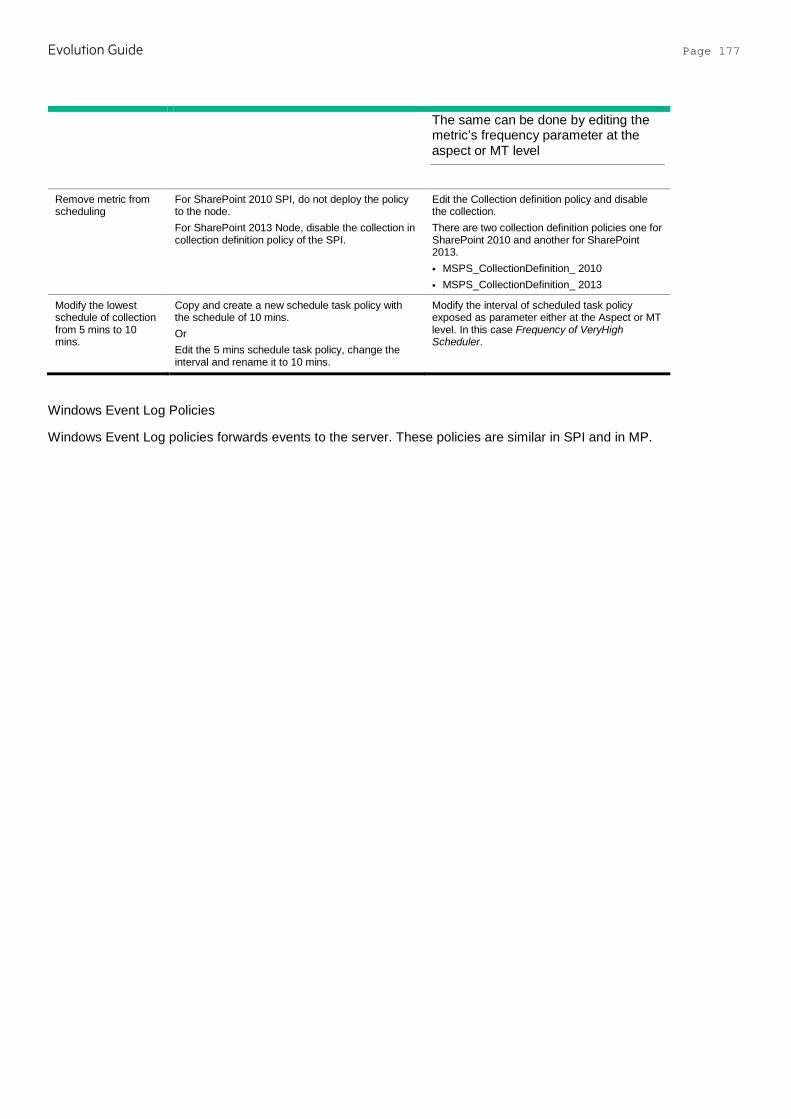
Evolution Guide Page 177
The same can be done by editing the metric’s frequency parameter at the aspect or MT level
Remove metric from scheduling
For SharePoint 2010 SPI, do not deploy the policy to the node. For SharePoint 2013 Node, disable the collection in collection definition policy of the SPI.
Edit the Collection definition policy and disable the collection. There are two collection definition policies one for SharePoint 2010 and another for SharePoint 2013. • MSPS_CollectionDefinition_ 2010 • MSPS_CollectionDefinition_ 2013
Modify the lowest schedule of collection from 5 mins to 10 mins.
Copy and create a new schedule task policy with the schedule of 10 mins. Or Edit the 5 mins schedule task policy, change the interval and rename it to 10 mins.
Modify the interval of scheduled task policy exposed as parameter either at the Aspect or MT level. In this case Frequency of VeryHigh Scheduler.
Windows Event Log Policies
Windows Event Log policies forwards events to the server. These policies are similar in SPI and in MP.
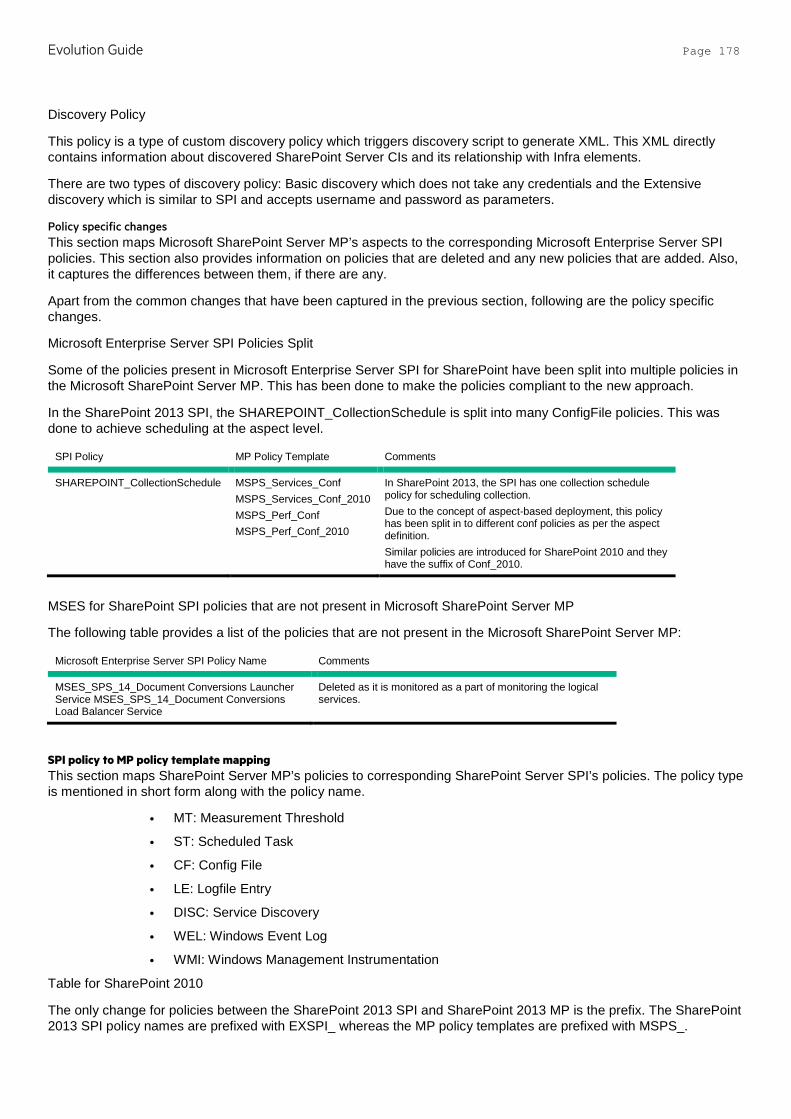
Evolution Guide Page 178
Discovery Policy
This policy is a type of custom discovery policy which triggers discovery script to generate XML. This XML directly contains information about discovered SharePoint Server CIs and its relationship with Infra elements.
There are two types of discovery policy: Basic discovery which does not take any credentials and the Extensive discovery which is similar to SPI and accepts username and password as parameters.
Policy specific changes This section maps Microsoft SharePoint Server MP’s aspects to the corresponding Microsoft Enterprise Server SPI policies. This section also provides information on policies that are deleted and any new policies that are added. Also, it captures the differences between them, if there are any.
Apart from the common changes that have been captured in the previous section, following are the policy specific changes.
Microsoft Enterprise Server SPI Policies Split
Some of the policies present in Microsoft Enterprise Server SPI for SharePoint have been split into multiple policies in the Microsoft SharePoint Server MP. This has been done to make the policies compliant to the new approach.
In the SharePoint 2013 SPI, the SHAREPOINT_CollectionSchedule is split into many ConfigFile policies. This was done to achieve scheduling at the aspect level.
SPI Policy MP Policy Template Comments
SHAREPOINT_CollectionSchedule MSPS_Services_Conf MSPS_Services_Conf_2010 MSPS_Perf_Conf MSPS_Perf_Conf_2010
In SharePoint 2013, the SPI has one collection schedule policy for scheduling collection. Due to the concept of aspect-based deployment, this policy has been split in to different conf policies as per the aspect definition. Similar policies are introduced for SharePoint 2010 and they have the suffix of Conf_2010.
MSES for SharePoint SPI policies that are not present in Microsoft SharePoint Server MP
The following table provides a list of the policies that are not present in the Microsoft SharePoint Server MP:
Microsoft Enterprise Server SPI Policy Name Comments
MSES_SPS_14_Document Conversions Launcher Service MSES_SPS_14_Document Conversions Load Balancer Service
Deleted as it is monitored as a part of monitoring the logical services.
SPI policy to MP policy template mapping This section maps SharePoint Server MP’s policies to corresponding SharePoint Server SPI’s policies. The policy type is mentioned in short form along with the policy name.
• MT: Measurement Threshold
• ST: Scheduled Task
• CF: Config File
• LE: Logfile Entry
• DISC: Service Discovery
• WEL: Windows Event Log
• WMI: Windows Management Instrumentation
Table for SharePoint 2010
The only change for policies between the SharePoint 2013 SPI and SharePoint 2013 MP is the prefix. The SharePoint 2013 SPI policy names are prefixed with EXSPI_ whereas the MP policy templates are prefixed with MSPS_.
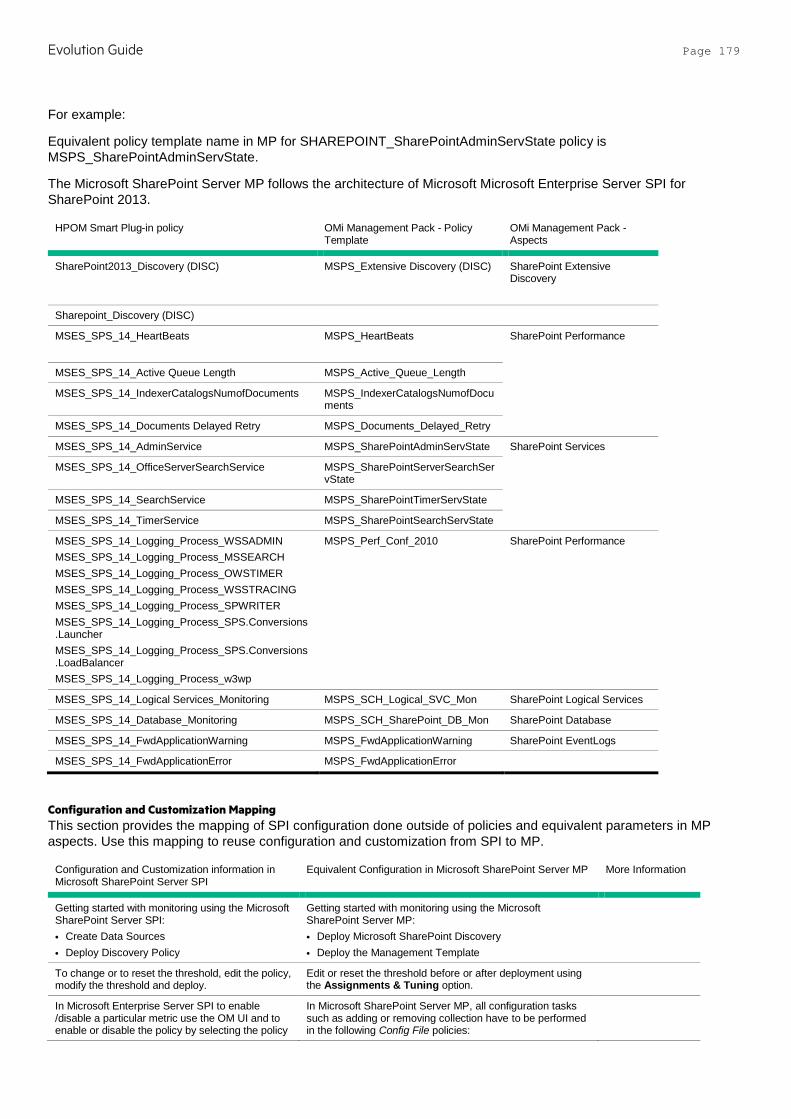
Evolution Guide Page 179
For example:
Equivalent policy template name in MP for SHAREPOINT_SharePointAdminServState policy is MSPS_SharePointAdminServState.
The Microsoft SharePoint Server MP follows the architecture of Microsoft Microsoft Enterprise Server SPI for SharePoint 2013.
HPOM Smart Plug-in policy OMi Management Pack - Policy Template
OMi Management Pack - Aspects
SharePoint2013_Discovery (DISC) MSPS_Extensive Discovery (DISC) SharePoint Extensive Discovery
Sharepoint_Discovery (DISC)
MSES_SPS_14_HeartBeats
MSPS_HeartBeats
SharePoint Performance
MSES_SPS_14_Active Queue Length MSPS_Active_Queue_Length
MSES_SPS_14_IndexerCatalogsNumofDocuments MSPS_IndexerCatalogsNumofDocuments
MSES_SPS_14_Documents Delayed Retry MSPS_Documents_Delayed_Retry
MSES_SPS_14_AdminService MSPS_SharePointAdminServState SharePoint Services
MSES_SPS_14_OfficeServerSearchService MSPS_SharePointServerSearchServState
MSES_SPS_14_SearchService MSPS_SharePointTimerServState
MSES_SPS_14_TimerService MSPS_SharePointSearchServState
MSES_SPS_14_Logging_Process_WSSADMIN MSES_SPS_14_Logging_Process_MSSEARCH MSES_SPS_14_Logging_Process_OWSTIMER MSES_SPS_14_Logging_Process_WSSTRACING MSES_SPS_14_Logging_Process_SPWRITER MSES_SPS_14_Logging_Process_SPS.Conversions.Launcher MSES_SPS_14_Logging_Process_SPS.Conversions.LoadBalancer MSES_SPS_14_Logging_Process_w3wp
MSPS_Perf_Conf_2010 SharePoint Performance
MSES_SPS_14_Logical Services_Monitoring MSPS_SCH_Logical_SVC_Mon SharePoint Logical Services
MSES_SPS_14_Database_Monitoring MSPS_SCH_SharePoint_DB_Mon SharePoint Database
MSES_SPS_14_FwdApplicationWarning MSPS_FwdApplicationWarning SharePoint EventLogs
MSES_SPS_14_FwdApplicationError MSPS_FwdApplicationError
Configuration and Customization Mapping This section provides the mapping of SPI configuration done outside of policies and equivalent parameters in MP aspects. Use this mapping to reuse configuration and customization from SPI to MP.
Configuration and Customization information in Microsoft SharePoint Server SPI
Equivalent Configuration in Microsoft SharePoint Server MP More Information
Getting started with monitoring using the Microsoft SharePoint Server SPI: • Create Data Sources • Deploy Discovery Policy
Getting started with monitoring using the Microsoft SharePoint Server MP: • Deploy Microsoft SharePoint Discovery • Deploy the Management Template
To change or to reset the threshold, edit the policy, modify the threshold and deploy.
Edit or reset the threshold before or after deployment using the Assignments & Tuning option.
In Microsoft Enterprise Server SPI to enable /disable a particular metric use the OM UI and to enable or disable the policy by selecting the policy
In Microsoft SharePoint Server MP, all configuration tasks such as adding or removing collection have to be performed in the following Config File policies:

Evolution Guide Page 180
To add a new metric, a new policy needs to be created with the valid entries.
• MSPS_CollectionDefinition_2 010 • MSPS_CollectionDefinition_2 013 To enable or disable a collection, modify the above mentioned Config File policies and set Enabled as true/false.
Collection interval is defined in schedule task policies and can be customized by editing the policy.
The Frequency parameter can be tuned during deployment.
Tools Mapping The tools that were available with the SPI have been removed in MP as all these activities are automated in the Management Packs. Hence, one to one mapping of tools is not possible for Microsoft SharePoint Server MP. However, Microsoft SharePoint Server MP has few tools for operational purpose.
HPOM SPI tools Equivalent MP tools Comments
SPI has the Sharepoint Server Tools tool groups.
MP has the MSPS Monitoring Tools category.
All the tools packaged under Microsoft SharePoint Server MP is under the category MSPS Monitoring Tools.
Create Datasource for Sharepoint Server
Create Data Sources is now part of SharePoint Extensive Discovery Aspect and the Data sources are created automatically.
Enable SPTrace MSPS Enable Collection Manager Trace This tool is used to enable debug logs for debugging MP.
Graphs Mapping Microsoft Enterprise Server SPI had two sets of graphs one set for SharePoint 2010 and another for SharePoint 2013. These graphs are merged into a single set with Management Packs. This will work for both SharePoint 2010 and SharePoint 20013. The list of graphs available in the MPs are the following:
HPOM SPI Graphs Equivalent MP Graphs Comments
SharePoint Search Service CPU SharePoint Search Service CPU
SharePoint Search Service Memory SharePoint Search Service Memory
SharePoint Search Service Page Faults/sec
SharePoint Search Service Page Faults/sec
SharePoint Server Admin Service CPU
SharePoint Server Admin Service CPU
SharePoint Server Admin Service Memory
SharePoint Server Admin Service Memory
SharePoint Server SPTimer Service CPU
SharePoint Server SPTimer Service CPU
SharePoint Server SPTimer Service Memory
SharePoint Server SPTimer Service Memory
IIS Worker process CPU usage Web Server Worker process CPU usage
IIS Worker process Memory usage Web Server Worker process Memory usage
IIS Worker processes Page Faults Web Server Worker processes Page Faults
Node Cleanup You need to remove the SPI artifacts from the node before switching the monitoring of the node from the HPOM SPI to OMi MP. Following are the SPI artifacts that need to be removed in the given order:
1. Remove the SharePoint policies of SharePoint SPI from the node.
a. List the policies using the command: ovpolicy –l
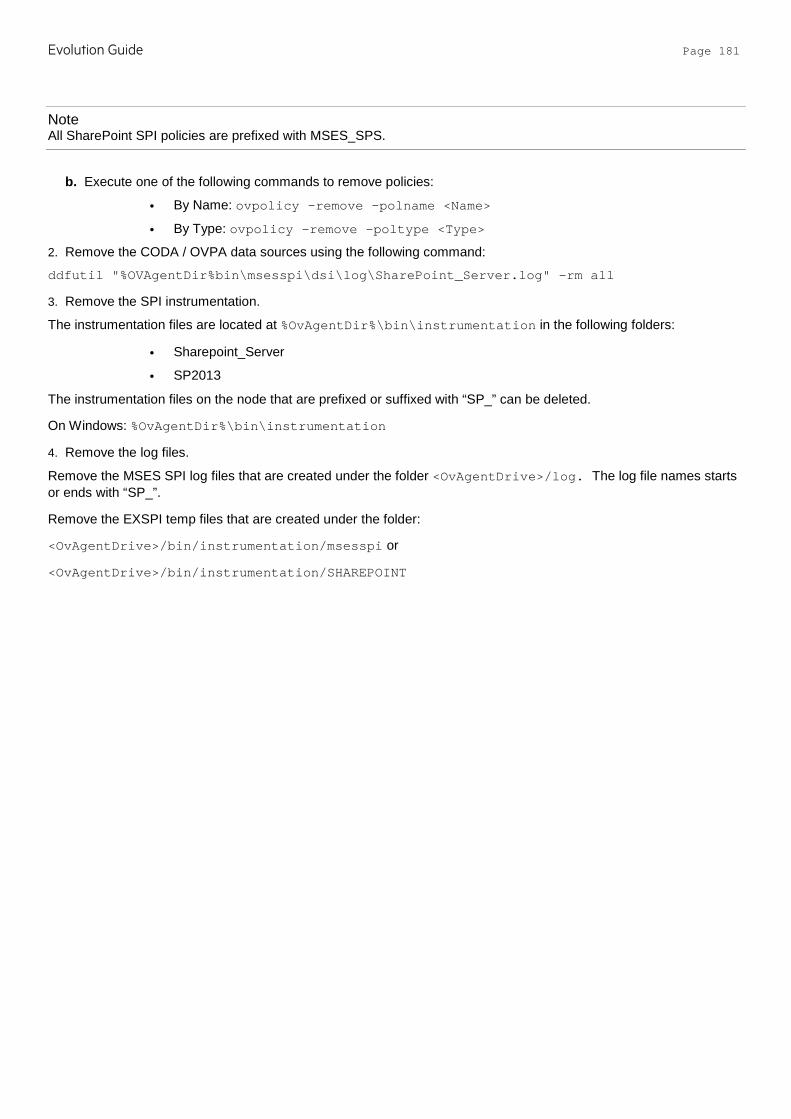
Evolution Guide Page 181
Note All SharePoint SPI policies are prefixed with MSES_SPS.
b. Execute one of the following commands to remove policies:
• By Name: ovpolicy –remove –polname <Name>
• By Type: ovpolicy –remove –poltype <Type>
2. Remove the CODA / OVPA data sources using the following command:
ddfutil "%OVAgentDir%bin\msesspi\dsi\log\SharePoint_Server.log" –rm all
3. Remove the SPI instrumentation.
The instrumentation files are located at %OvAgentDir%\bin\instrumentation in the following folders:
• Sharepoint_Server
• SP2013
The instrumentation files on the node that are prefixed or suffixed with “SP_” can be deleted.
On Windows: %OvAgentDir%\bin\instrumentation
4. Remove the log files.
Remove the MSES SPI log files that are created under the folder <OvAgentDrive>/log. The log file names starts or ends with “SP_”.
Remove the EXSPI temp files that are created under the folder:
<OvAgentDrive>/bin/instrumentation/msesspi or
<OvAgentDrive>/bin/instrumentation/SHAREPOINT
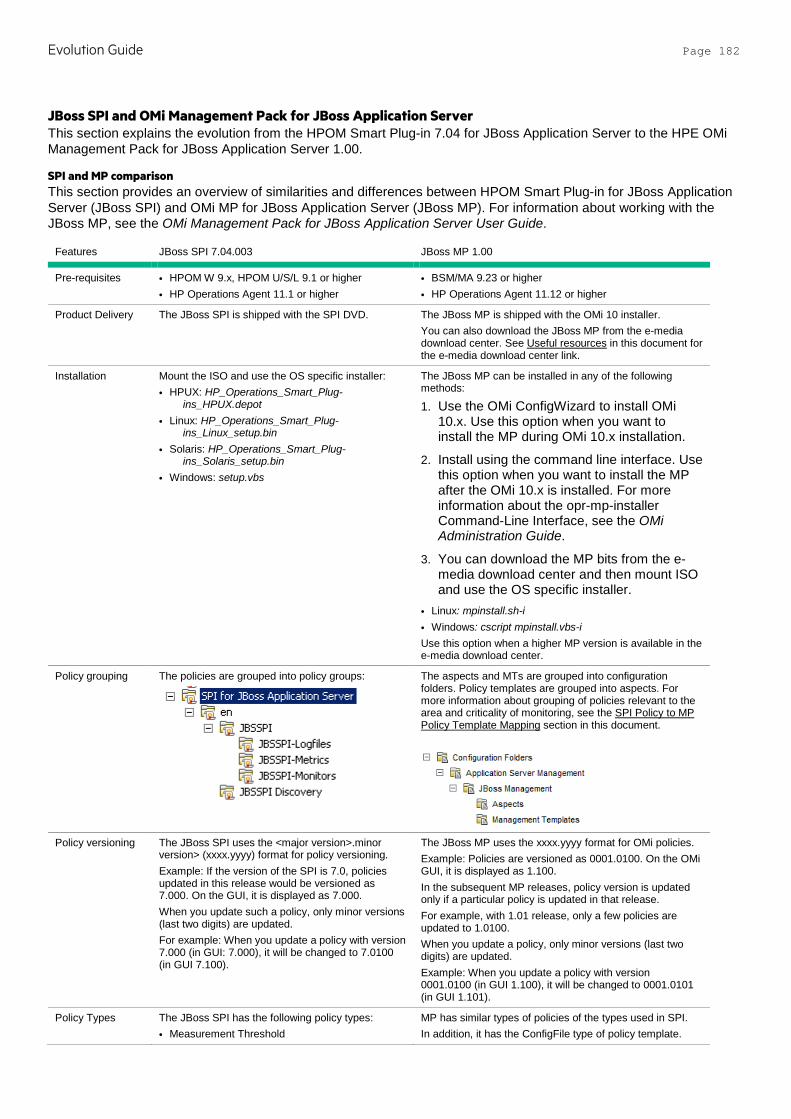
Evolution Guide Page 182
JBoss SPI and OMi Management Pack for JBoss Application Server This section explains the evolution from the HPOM Smart Plug-in 7.04 for JBoss Application Server to the HPE OMi Management Pack for JBoss Application Server 1.00.
SPI and MP comparison This section provides an overview of similarities and differences between HPOM Smart Plug-in for JBoss Application Server (JBoss SPI) and OMi MP for JBoss Application Server (JBoss MP). For information about working with the JBoss MP, see the OMi Management Pack for JBoss Application Server User Guide.
Features JBoss SPI 7.04.003 JBoss MP 1.00
Pre-requisites • HPOM W 9.x, HPOM U/S/L 9.1 or higher • HP Operations Agent 11.1 or higher
• BSM/MA 9.23 or higher • HP Operations Agent 11.12 or higher
Product Delivery The JBoss SPI is shipped with the SPI DVD. The JBoss MP is shipped with the OMi 10 installer. You can also download the JBoss MP from the e-media download center. See Useful resources in this document for the e-media download center link.
Installation Mount the ISO and use the OS specific installer: • HPUX: HP_Operations_Smart_Plug-
ins_HPUX.depot • Linux: HP_Operations_Smart_Plug-
ins_Linux_setup.bin • Solaris: HP_Operations_Smart_Plug-
ins_Solaris_setup.bin • Windows: setup.vbs
The JBoss MP can be installed in any of the following methods:
1. Use the OMi ConfigWizard to install OMi 10.x. Use this option when you want to install the MP during OMi 10.x installation.
2. Install using the command line interface. Use this option when you want to install the MP after the OMi 10.x is installed. For more information about the opr-mp-installer Command-Line Interface, see the OMi Administration Guide.
3. You can download the MP bits from the e-media download center and then mount ISO and use the OS specific installer.
• Linux: mpinstall.sh-i • Windows: cscript mpinstall.vbs-i Use this option when a higher MP version is available in the e-media download center.
Policy grouping The policies are grouped into policy groups:
The aspects and MTs are grouped into configuration folders. Policy templates are grouped into aspects. For more information about grouping of policies relevant to the area and criticality of monitoring, see the SPI Policy to MP Policy Template Mapping section in this document.
Policy versioning The JBoss SPI uses the <major version>.minor version> (xxxx.yyyy) format for policy versioning. Example: If the version of the SPI is 7.0, policies updated in this release would be versioned as 7.000. On the GUI, it is displayed as 7.000. When you update such a policy, only minor versions (last two digits) are updated. For example: When you update a policy with version 7.000 (in GUI: 7.000), it will be changed to 7.0100 (in GUI 7.100).
The JBoss MP uses the xxxx.yyyy format for OMi policies. Example: Policies are versioned as 0001.0100. On the OMi GUI, it is displayed as 1.100. In the subsequent MP releases, policy version is updated only if a particular policy is updated in that release. For example, with 1.01 release, only a few policies are updated to 1.0100. When you update a policy, only minor versions (last two digits) are updated. Example: When you update a policy with version 0001.0100 (in GUI 1.100), it will be changed to 0001.0101 (in GUI 1.101).
Policy Types The JBoss SPI has the following policy types: • Measurement Threshold
MP has similar types of policies of the types used in SPI. In addition, it has the ConfigFile type of policy template.
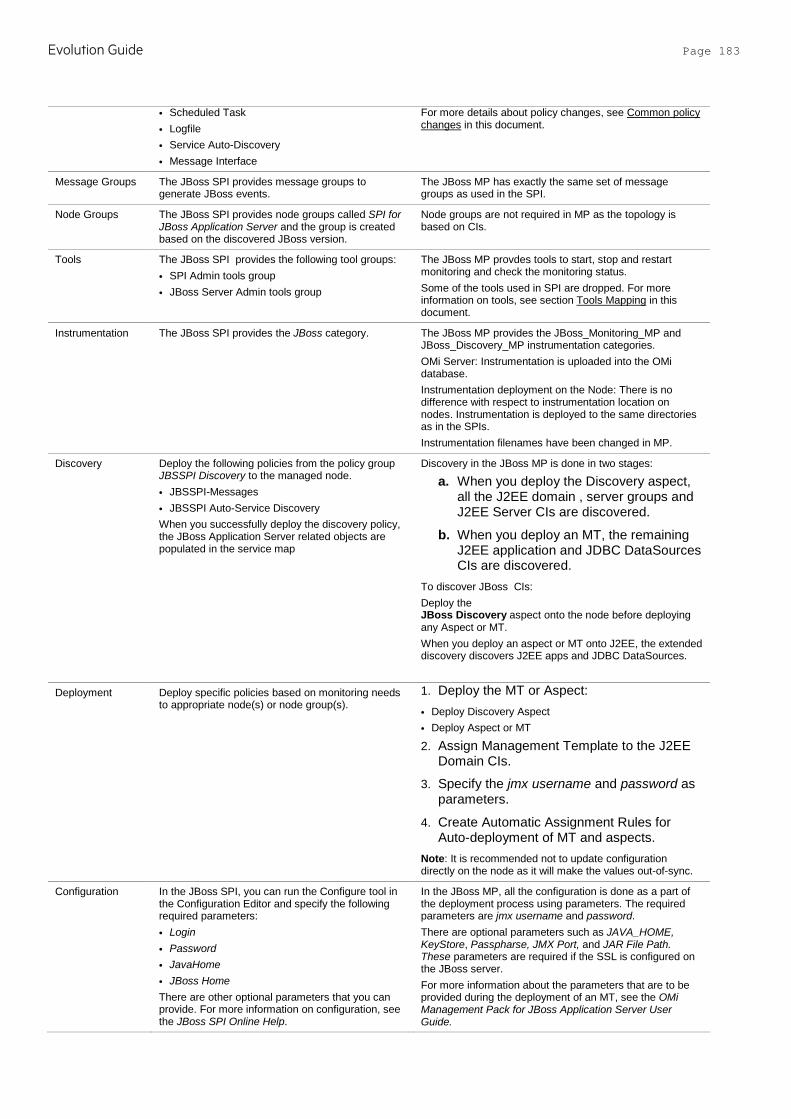
Evolution Guide Page 183
• Scheduled Task • Logfile • Service Auto-Discovery • Message Interface
For more details about policy changes, see Common policy changes in this document.
Message Groups The JBoss SPI provides message groups to generate JBoss events.
The JBoss MP has exactly the same set of message groups as used in the SPI.
Node Groups The JBoss SPI provides node groups called SPI for JBoss Application Server and the group is created based on the discovered JBoss version.
Node groups are not required in MP as the topology is based on CIs.
Tools The JBoss SPI provides the following tool groups: • SPI Admin tools group • JBoss Server Admin tools group
The JBoss MP provdes tools to start, stop and restart monitoring and check the monitoring status. Some of the tools used in SPI are dropped. For more information on tools, see section Tools Mapping in this document.
Instrumentation The JBoss SPI provides the JBoss category.
The JBoss MP provides the JBoss_Monitoring_MP and JBoss_Discovery_MP instrumentation categories. OMi Server: Instrumentation is uploaded into the OMi database. Instrumentation deployment on the Node: There is no difference with respect to instrumentation location on nodes. Instrumentation is deployed to the same directories as in the SPIs. Instrumentation filenames have been changed in MP.
Discovery Deploy the following policies from the policy group JBSSPI Discovery to the managed node. • JBSSPI-Messages • JBSSPI Auto-Service Discovery When you successfully deploy the discovery policy, the JBoss Application Server related objects are populated in the service map
Discovery in the JBoss MP is done in two stages:
a. When you deploy the Discovery aspect, all the J2EE domain , server groups and J2EE Server CIs are discovered.
b. When you deploy an MT, the remaining J2EE application and JDBC DataSources CIs are discovered.
To discover JBoss CIs: Deploy the JBoss Discovery aspect onto the node before deploying any Aspect or MT. When you deploy an aspect or MT onto J2EE, the extended discovery discovers J2EE apps and JDBC DataSources.
Deployment Deploy specific policies based on monitoring needs to appropriate node(s) or node group(s).
1. Deploy the MT or Aspect: • Deploy Discovery Aspect • Deploy Aspect or MT
2. Assign Management Template to the J2EE Domain CIs.
3. Specify the jmx username and password as parameters.
4. Create Automatic Assignment Rules for Auto-deployment of MT and aspects.
Note: It is recommended not to update configuration directly on the node as it will make the values out-of-sync.
Configuration In the JBoss SPI, you can run the Configure tool in the Configuration Editor and specify the following required parameters: • Login • Password • JavaHome • JBoss Home There are other optional parameters that you can provide. For more information on configuration, see the JBoss SPI Online Help.
In the JBoss MP, all the configuration is done as a part of the deployment process using parameters. The required parameters are jmx username and password. There are optional parameters such as JAVA_HOME, KeyStore, Passpharse, JMX Port, and JAR File Path. These parameters are required if the SSL is configured on the JBoss server. For more information about the parameters that are to be provided during the deployment of an MT, see the OMi Management Pack for JBoss Application Server User Guide.
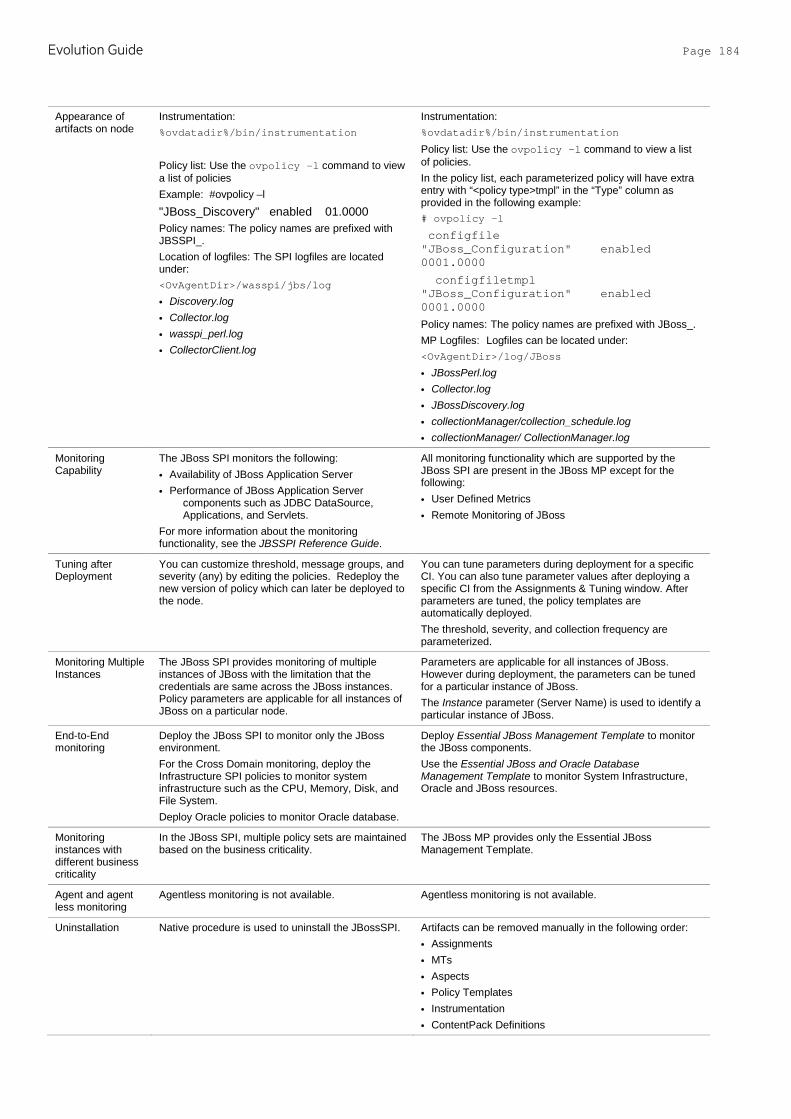
Evolution Guide Page 184
Appearance of artifacts on node
Instrumentation: %ovdatadir%/bin/instrumentation
Policy list: Use the ovpolicy –l command to view a list of policies Example: #ovpolicy –l "JBoss_Discovery" enabled 01.0000 Policy names: The policy names are prefixed with JBSSPI_. Location of logfiles: The SPI logfiles are located under: <OvAgentDir>/wasspi/jbs/log • Discovery.log • Collector.log • wasspi_perl.log • CollectorClient.log
Instrumentation: %ovdatadir%/bin/instrumentation
Policy list: Use the ovpolicy –l command to view a list of policies. In the policy list, each parameterized policy will have extra entry with “<policy type>tmpl” in the “Type” column as provided in the following example: # ovpolicy –l
configfile "JBoss_Configuration" enabled 0001.0000
configfiletmpl "JBoss_Configuration" enabled 0001.0000
Policy names: The policy names are prefixed with JBoss_. MP Logfiles: Logfiles can be located under: <OvAgentDir>/log/JBoss
• JBossPerl.log • Collector.log • JBossDiscovery.log • collectionManager/collection_schedule.log • collectionManager/ CollectionManager.log
Monitoring Capability
The JBoss SPI monitors the following: • Availability of JBoss Application Server • Performance of JBoss Application Server
components such as JDBC DataSource, Applications, and Servlets.
For more information about the monitoring functionality, see the JBSSPI Reference Guide.
All monitoring functionality which are supported by the JBoss SPI are present in the JBoss MP except for the following: • User Defined Metrics • Remote Monitoring of JBoss
Tuning after Deployment
You can customize threshold, message groups, and severity (any) by editing the policies. Redeploy the new version of policy which can later be deployed to the node.
You can tune parameters during deployment for a specific CI. You can also tune parameter values after deploying a specific CI from the Assignments & Tuning window. After parameters are tuned, the policy templates are automatically deployed. The threshold, severity, and collection frequency are parameterized.
Monitoring Multiple Instances
The JBoss SPI provides monitoring of multiple instances of JBoss with the limitation that the credentials are same across the JBoss instances. Policy parameters are applicable for all instances of JBoss on a particular node.
Parameters are applicable for all instances of JBoss. However during deployment, the parameters can be tuned for a particular instance of JBoss. The Instance parameter (Server Name) is used to identify a particular instance of JBoss.
End-to-End monitoring
Deploy the JBoss SPI to monitor only the JBoss environment. For the Cross Domain monitoring, deploy the Infrastructure SPI policies to monitor system infrastructure such as the CPU, Memory, Disk, and File System. Deploy Oracle policies to monitor Oracle database.
Deploy Essential JBoss Management Template to monitor the JBoss components. Use the Essential JBoss and Oracle Database Management Template to monitor System Infrastructure, Oracle and JBoss resources.
Monitoring instances with different business criticality
In the JBoss SPI, multiple policy sets are maintained based on the business criticality.
The JBoss MP provides only the Essential JBoss Management Template.
Agent and agent less monitoring
Agentless monitoring is not available. Agentless monitoring is not available.
Uninstallation Native procedure is used to uninstall the JBossSPI. Artifacts can be removed manually in the following order: • Assignments • MTs • Aspects • Policy Templates • Instrumentation • ContentPack Definitions
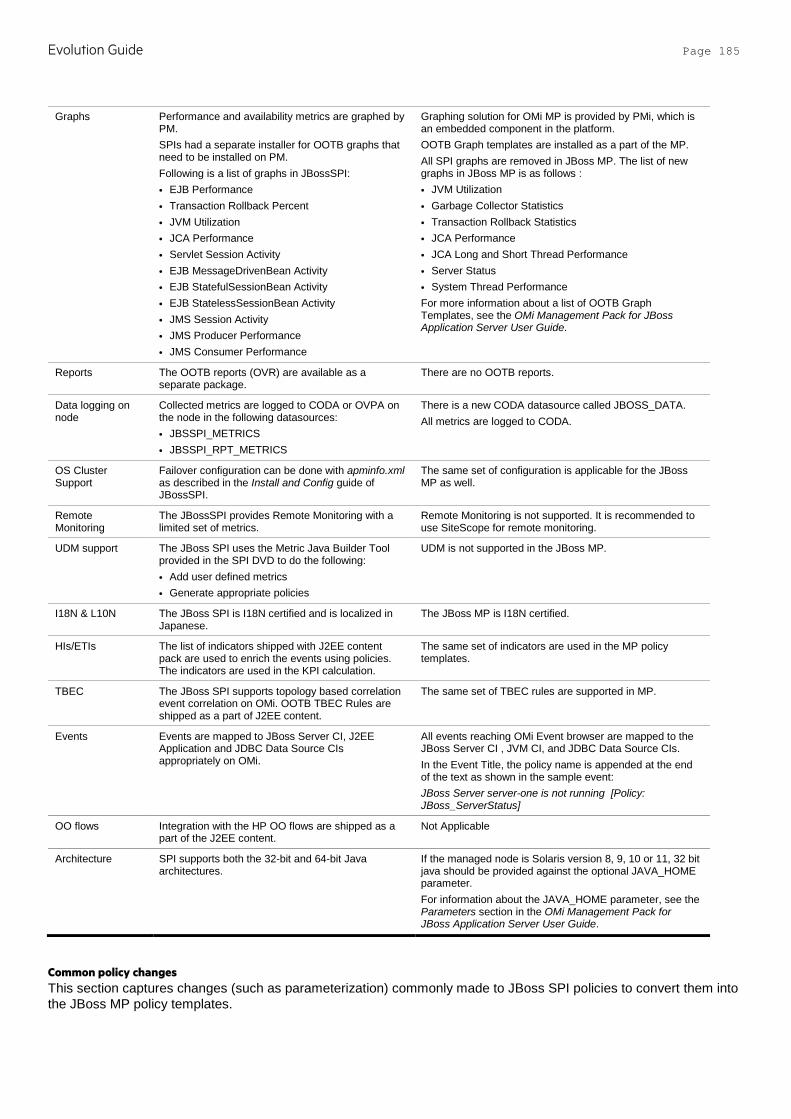
Evolution Guide Page 185
Graphs Performance and availability metrics are graphed by PM. SPIs had a separate installer for OOTB graphs that need to be installed on PM. Following is a list of graphs in JBossSPI: • EJB Performance • Transaction Rollback Percent • JVM Utilization • JCA Performance • Servlet Session Activity • EJB MessageDrivenBean Activity • EJB StatefulSessionBean Activity • EJB StatelessSessionBean Activity • JMS Session Activity • JMS Producer Performance • JMS Consumer Performance
Graphing solution for OMi MP is provided by PMi, which is an embedded component in the platform. OOTB Graph templates are installed as a part of the MP. All SPI graphs are removed in JBoss MP. The list of new graphs in JBoss MP is as follows : • JVM Utilization • Garbage Collector Statistics • Transaction Rollback Statistics • JCA Performance • JCA Long and Short Thread Performance • Server Status • System Thread Performance For more information about a list of OOTB Graph Templates, see the OMi Management Pack for JBoss Application Server User Guide.
Reports The OOTB reports (OVR) are available as a separate package.
There are no OOTB reports.
Data logging on node
Collected metrics are logged to CODA or OVPA on the node in the following datasources: • JBSSPI_METRICS • JBSSPI_RPT_METRICS
There is a new CODA datasource called JBOSS_DATA. All metrics are logged to CODA.
OS Cluster Support
Failover configuration can be done with apminfo.xml as described in the Install and Config guide of JBossSPI.
The same set of configuration is applicable for the JBoss MP as well.
Remote Monitoring
The JBossSPI provides Remote Monitoring with a limited set of metrics.
Remote Monitoring is not supported. It is recommended to use SiteScope for remote monitoring.
UDM support The JBoss SPI uses the Metric Java Builder Tool provided in the SPI DVD to do the following: • Add user defined metrics • Generate appropriate policies
UDM is not supported in the JBoss MP.
I18N & L10N The JBoss SPI is I18N certified and is localized in Japanese.
The JBoss MP is I18N certified.
HIs/ETIs The list of indicators shipped with J2EE content pack are used to enrich the events using policies. The indicators are used in the KPI calculation.
The same set of indicators are used in the MP policy templates.
TBEC The JBoss SPI supports topology based correlation event correlation on OMi. OOTB TBEC Rules are shipped as a part of J2EE content.
The same set of TBEC rules are supported in MP.
Events Events are mapped to JBoss Server CI, J2EE Application and JDBC Data Source CIs appropriately on OMi.
All events reaching OMi Event browser are mapped to the JBoss Server CI , JVM CI, and JDBC Data Source CIs. In the Event Title, the policy name is appended at the end of the text as shown in the sample event: JBoss Server server-one is not running [Policy: JBoss_ServerStatus]
OO flows Integration with the HP OO flows are shipped as a part of the J2EE content.
Not Applicable
Architecture SPI supports both the 32-bit and 64-bit Java architectures.
If the managed node is Solaris version 8, 9, 10 or 11, 32 bit java should be provided against the optional JAVA_HOME parameter. For information about the JAVA_HOME parameter, see the Parameters section in the OMi Management Pack for JBoss Application Server User Guide.
Common policy changes This section captures changes (such as parameterization) commonly made to JBoss SPI policies to convert them into the JBoss MP policy templates.
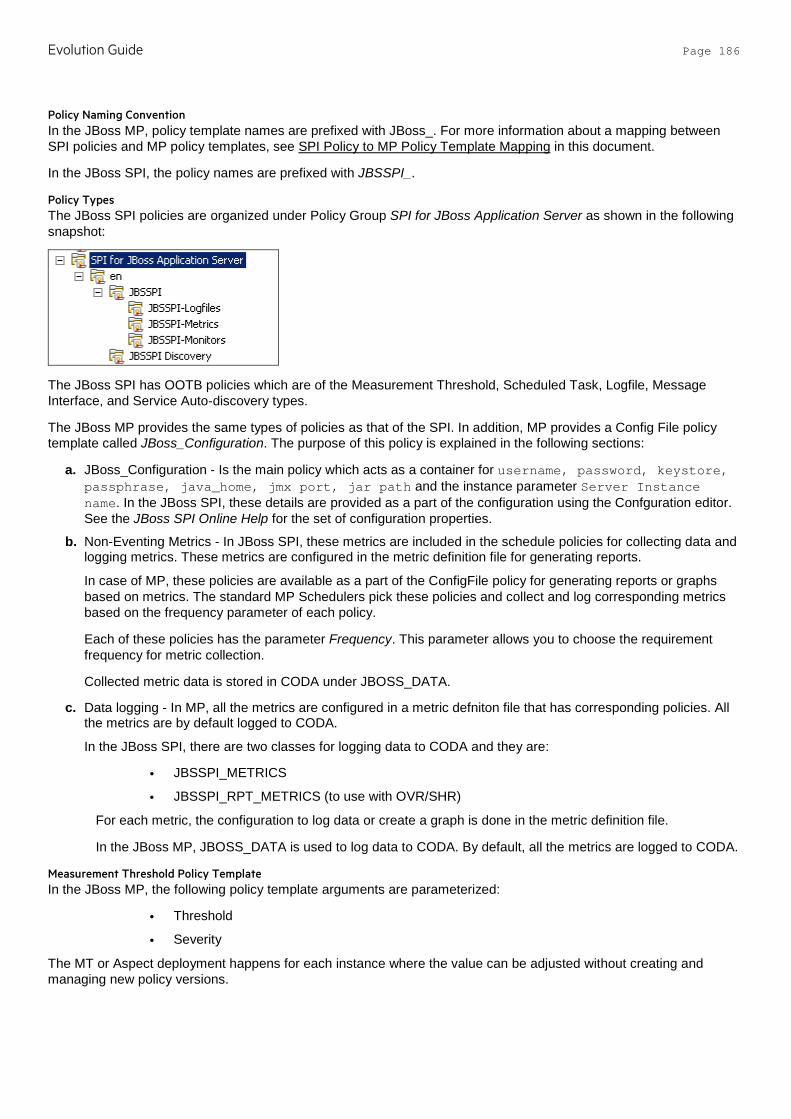
Evolution Guide Page 186
Policy Naming Convention In the JBoss MP, policy template names are prefixed with JBoss_. For more information about a mapping between SPI policies and MP policy templates, see SPI Policy to MP Policy Template Mapping in this document.
In the JBoss SPI, the policy names are prefixed with JBSSPI_.
Policy Types The JBoss SPI policies are organized under Policy Group SPI for JBoss Application Server as shown in the following snapshot:
The JBoss SPI has OOTB policies which are of the Measurement Threshold, Scheduled Task, Logfile, Message Interface, and Service Auto-discovery types.
The JBoss MP provides the same types of policies as that of the SPI. In addition, MP provides a Config File policy template called JBoss_Configuration. The purpose of this policy is explained in the following sections:
a. JBoss_Configuration - Is the main policy which acts as a container for username, password, keystore, passphrase, java_home, jmx port, jar path and the instance parameter Server Instance name. In the JBoss SPI, these details are provided as a part of the configuration using the Confguration editor. See the JBoss SPI Online Help for the set of configuration properties.
b. Non-Eventing Metrics - In JBoss SPI, these metrics are included in the schedule policies for collecting data and logging metrics. These metrics are configured in the metric definition file for generating reports.
In case of MP, these policies are available as a part of the ConfigFile policy for generating reports or graphs based on metrics. The standard MP Schedulers pick these policies and collect and log corresponding metrics based on the frequency parameter of each policy.
Each of these policies has the parameter Frequency. This parameter allows you to choose the requirement frequency for metric collection.
Collected metric data is stored in CODA under JBOSS_DATA.
c. Data logging - In MP, all the metrics are configured in a metric defniton file that has corresponding policies. All the metrics are by default logged to CODA.
In the JBoss SPI, there are two classes for logging data to CODA and they are:
• JBSSPI_METRICS
• JBSSPI_RPT_METRICS (to use with OVR/SHR)
For each metric, the configuration to log data or create a graph is done in the metric definition file.
In the JBoss MP, JBOSS_DATA is used to log data to CODA. By default, all the metrics are logged to CODA.
Measurement Threshold Policy Template In the JBoss MP, the following policy template arguments are parameterized:
• Threshold
• Severity
The MT or Aspect deployment happens for each instance where the value can be adjusted without creating and managing new policy versions.
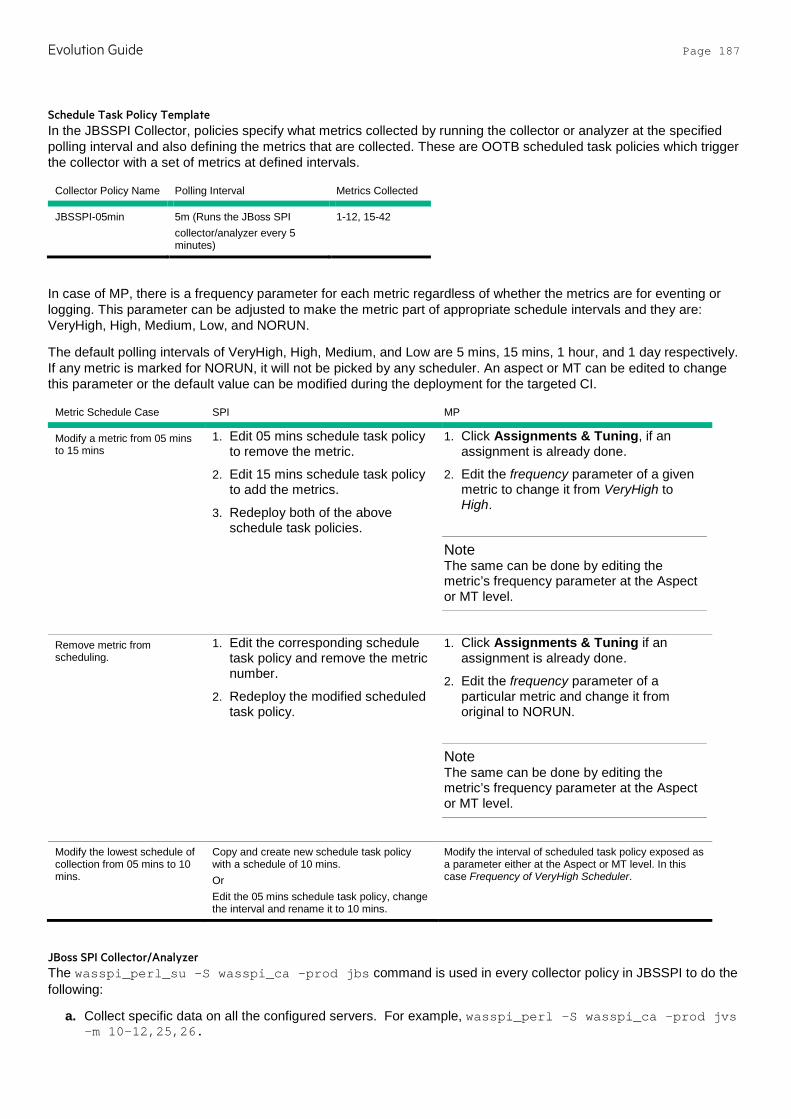
Evolution Guide Page 187
Schedule Task Policy Template In the JBSSPI Collector, policies specify what metrics collected by running the collector or analyzer at the specified polling interval and also defining the metrics that are collected. These are OOTB scheduled task policies which trigger the collector with a set of metrics at defined intervals.
Collector Policy Name Polling Interval Metrics Collected
JBSSPI-05min 5m (Runs the JBoss SPI collector/analyzer every 5 minutes)
1-12, 15-42
In case of MP, there is a frequency parameter for each metric regardless of whether the metrics are for eventing or logging. This parameter can be adjusted to make the metric part of appropriate schedule intervals and they are: VeryHigh, High, Medium, Low, and NORUN.
The default polling intervals of VeryHigh, High, Medium, and Low are 5 mins, 15 mins, 1 hour, and 1 day respectively. If any metric is marked for NORUN, it will not be picked by any scheduler. An aspect or MT can be edited to change this parameter or the default value can be modified during the deployment for the targeted CI.
Metric Schedule Case SPI MP
Modify a metric from 05 mins to 15 mins
1. Edit 05 mins schedule task policy to remove the metric.
2. Edit 15 mins schedule task policy to add the metrics.
3. Redeploy both of the above schedule task policies.
1. Click Assignments & Tuning, if an assignment is already done.
2. Edit the frequency parameter of a given metric to change it from VeryHigh to High.
Note The same can be done by editing the metric’s frequency parameter at the Aspect or MT level.
Remove metric from scheduling.
1. Edit the corresponding schedule task policy and remove the metric number.
2. Redeploy the modified scheduled task policy.
1. Click Assignments & Tuning if an assignment is already done.
2. Edit the frequency parameter of a particular metric and change it from original to NORUN.
Note The same can be done by editing the metric’s frequency parameter at the Aspect or MT level.
Modify the lowest schedule of collection from 05 mins to 10 mins.
Copy and create new schedule task policy with a schedule of 10 mins. Or Edit the 05 mins schedule task policy, change the interval and rename it to 10 mins.
Modify the interval of scheduled task policy exposed as a parameter either at the Aspect or MT level. In this case Frequency of VeryHigh Scheduler.
JBoss SPI Collector/Analyzer The wasspi_perl_su -S wasspi_ca -prod jbs command is used in every collector policy in JBSSPI to do the following:
a. Collect specific data on all the configured servers. For example, wasspi_perl -S wasspi_ca -prod jvs -m 10-12,25,26.
Evolution Guide Page 188
b. Collect data from specific servers only. For example, wasspi_perl -S wasspi_ca -m -prod jbs 38,39,40 -i server1,server2.
c. Collect data from specific servers. For example, wasspi_perl -S wasspi_ca -m -prod jbs 20-25 -e server1,server2.
The same feature is achieved in the JBoss MP by deploying selected aspects for a particular JBoss Server instance.
Discovery Policy Template The JBoss MP has the Discovery policy template JBoss_Discovery which is same as in JBoss SPI. This triggers discovery script to generate an XML file as expected by the Discovery agent. This XML file contains information about discovered JBoss instances and its relationship with other J2EE components such as JDBC, Java Application, and Infra elements. Optional elements may contain Oracle CIs and its relationships. The discovered information such as the CI type, attributes, and relations remain same as SPI. MP uses the Toposync rules to create appropriate CIs and relationships and update RTSM whereas this data was represented in the Service Map on HPOM.
Policy Customizations There are multiple options to customize the SPI policies for different reasons. You can create new policy groups and copy specific policies to those groups to create your own JBoss SPI groups. You can also modify the thresholds set in individual policies. In many cases, the policy’s defined threshold may involve a drill-down or roll-up metric. The widely used SPI policy customizations and corresponding MP approach are listed in the next few sections.
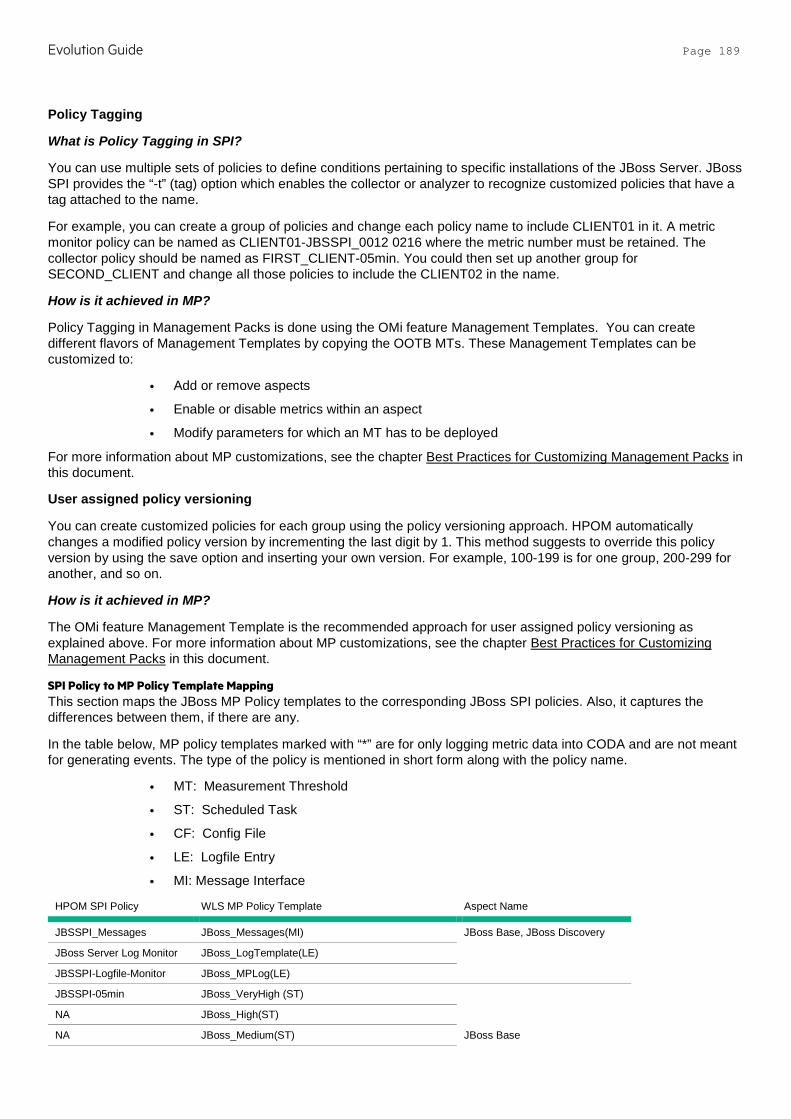
Evolution Guide Page 189
Policy Tagging
What is Policy Tagging in SPI?
You can use multiple sets of policies to define conditions pertaining to specific installations of the JBoss Server. JBoss SPI provides the “-t” (tag) option which enables the collector or analyzer to recognize customized policies that have a tag attached to the name.
For example, you can create a group of policies and change each policy name to include CLIENT01 in it. A metric monitor policy can be named as CLIENT01-JBSSPI_0012 0216 where the metric number must be retained. The collector policy should be named as FIRST_CLIENT-05min. You could then set up another group for SECOND_CLIENT and change all those policies to include the CLIENT02 in the name.
How is it achieved in MP?
Policy Tagging in Management Packs is done using the OMi feature Management Templates. You can create different flavors of Management Templates by copying the OOTB MTs. These Management Templates can be customized to:
• Add or remove aspects
• Enable or disable metrics within an aspect
• Modify parameters for which an MT has to be deployed
For more information about MP customizations, see the chapter Best Practices for Customizing Management Packs in this document.
User assigned policy versioning
You can create customized policies for each group using the policy versioning approach. HPOM automatically changes a modified policy version by incrementing the last digit by 1. This method suggests to override this policy version by using the save option and inserting your own version. For example, 100-199 is for one group, 200-299 for another, and so on.
How is it achieved in MP?
The OMi feature Management Template is the recommended approach for user assigned policy versioning as explained above. For more information about MP customizations, see the chapter Best Practices for Customizing Management Packs in this document.
SPI Policy to MP Policy Template Mapping This section maps the JBoss MP Policy templates to the corresponding JBoss SPI policies. Also, it captures the differences between them, if there are any.
In the table below, MP policy templates marked with “*” are for only logging metric data into CODA and are not meant for generating events. The type of the policy is mentioned in short form along with the policy name.
• MT: Measurement Threshold
• ST: Scheduled Task
• CF: Config File
• LE: Logfile Entry
• MI: Message Interface
HPOM SPI Policy WLS MP Policy Template Aspect Name
JBSSPI_Messages JBoss_Messages(MI) JBoss Base, JBoss Discovery
JBoss Server Log Monitor JBoss_LogTemplate(LE)
JBSSPI-Logfile-Monitor JBoss_MPLog(LE)
JBSSPI-05min JBoss_VeryHigh (ST)
JBoss Base
NA JBoss_High(ST)
NA JBoss_Medium(ST)
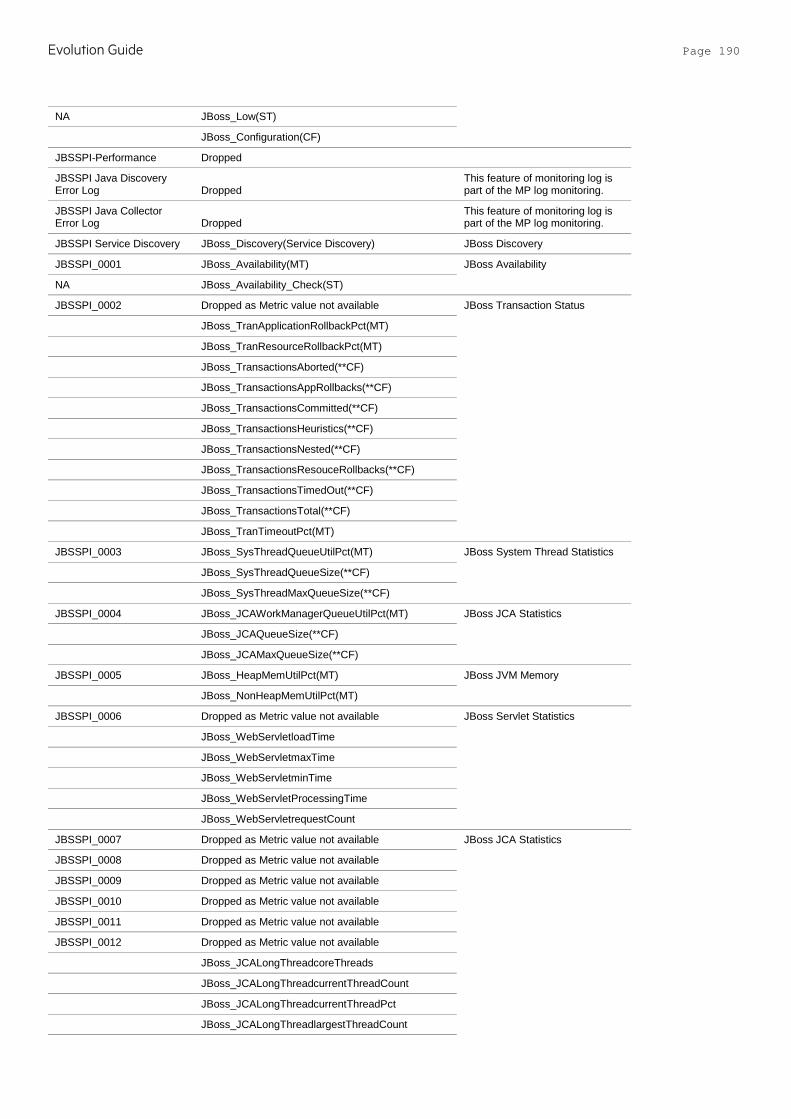
Evolution Guide Page 190
NA JBoss_Low(ST)
JBoss_Configuration(CF)
JBSSPI-Performance Dropped
JBSSPI Java Discovery Error Log Dropped
This feature of monitoring log is part of the MP log monitoring.
JBSSPI Java Collector Error Log Dropped
This feature of monitoring log is part of the MP log monitoring.
JBSSPI Service Discovery JBoss_Discovery(Service Discovery) JBoss Discovery
JBSSPI_0001 JBoss_Availability(MT) JBoss Availability
NA JBoss_Availability_Check(ST)
JBSSPI_0002 Dropped as Metric value not available JBoss Transaction Status
JBoss_TranApplicationRollbackPct(MT)
JBoss_TranResourceRollbackPct(MT)
JBoss_TransactionsAborted(**CF)
JBoss_TransactionsAppRollbacks(**CF)
JBoss_TransactionsCommitted(**CF)
JBoss_TransactionsHeuristics(**CF)
JBoss_TransactionsNested(**CF)
JBoss_TransactionsResouceRollbacks(**CF)
JBoss_TransactionsTimedOut(**CF)
JBoss_TransactionsTotal(**CF)
JBoss_TranTimeoutPct(MT)
JBSSPI_0003 JBoss_SysThreadQueueUtilPct(MT) JBoss System Thread Statistics
JBoss_SysThreadQueueSize(**CF)
JBoss_SysThreadMaxQueueSize(**CF)
JBSSPI_0004 JBoss_JCAWorkManagerQueueUtilPct(MT) JBoss JCA Statistics
JBoss_JCAQueueSize(**CF)
JBoss_JCAMaxQueueSize(**CF)
JBSSPI_0005 JBoss_HeapMemUtilPct(MT) JBoss JVM Memory
JBoss_NonHeapMemUtilPct(MT)
JBSSPI_0006 Dropped as Metric value not available JBoss Servlet Statistics
JBoss_WebServletloadTime
JBoss_WebServletmaxTime
JBoss_WebServletminTime
JBoss_WebServletProcessingTime
JBoss_WebServletrequestCount
JBSSPI_0007 Dropped as Metric value not available JBoss JCA Statistics
JBSSPI_0008 Dropped as Metric value not available
JBSSPI_0009 Dropped as Metric value not available
JBSSPI_0010 Dropped as Metric value not available
JBSSPI_0011 Dropped as Metric value not available
JBSSPI_0012 Dropped as Metric value not available
JBoss_JCALongThreadcoreThreads
JBoss_JCALongThreadcurrentThreadCount
JBoss_JCALongThreadcurrentThreadPct
JBoss_JCALongThreadlargestThreadCount
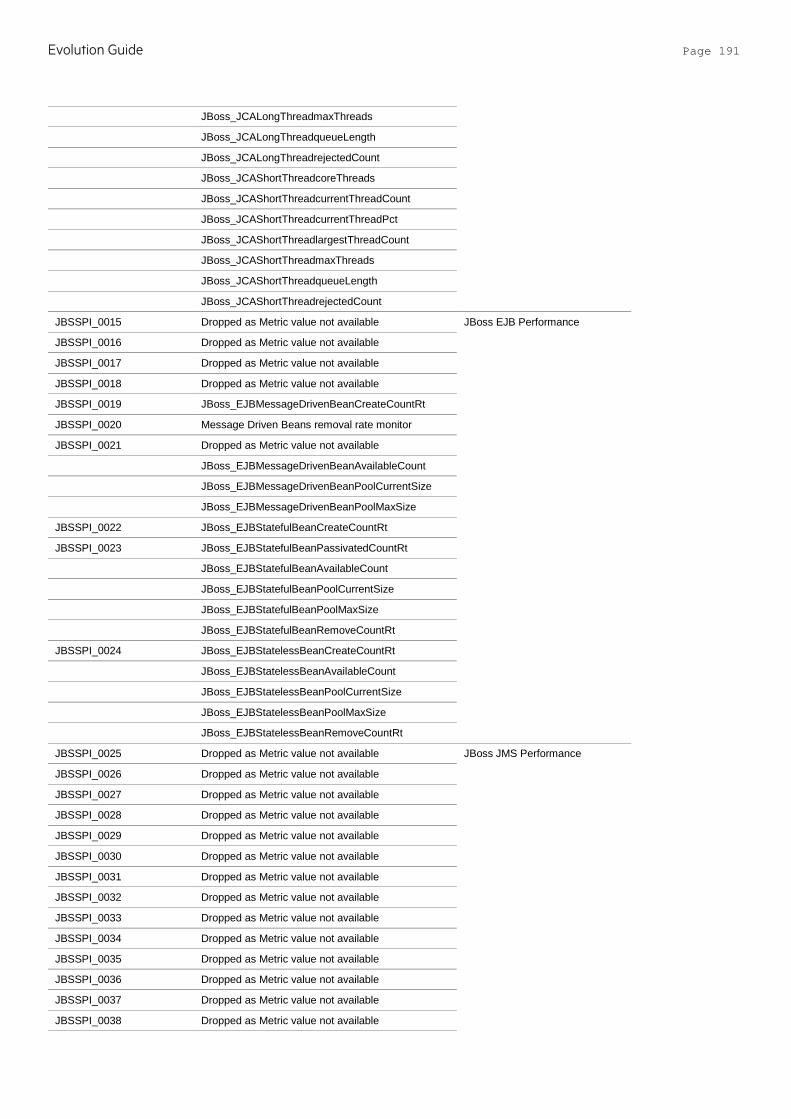
Evolution Guide Page 191
JBoss_JCALongThreadmaxThreads
JBoss_JCALongThreadqueueLength
JBoss_JCALongThreadrejectedCount
JBoss_JCAShortThreadcoreThreads
JBoss_JCAShortThreadcurrentThreadCount
JBoss_JCAShortThreadcurrentThreadPct
JBoss_JCAShortThreadlargestThreadCount
JBoss_JCAShortThreadmaxThreads
JBoss_JCAShortThreadqueueLength
JBoss_JCAShortThreadrejectedCount
JBSSPI_0015 Dropped as Metric value not available JBoss EJB Performance
JBSSPI_0016 Dropped as Metric value not available
JBSSPI_0017 Dropped as Metric value not available
JBSSPI_0018 Dropped as Metric value not available
JBSSPI_0019 JBoss_EJBMessageDrivenBeanCreateCountRt
JBSSPI_0020 Message Driven Beans removal rate monitor
JBSSPI_0021 Dropped as Metric value not available
JBoss_EJBMessageDrivenBeanAvailableCount
JBoss_EJBMessageDrivenBeanPoolCurrentSize
JBoss_EJBMessageDrivenBeanPoolMaxSize
JBSSPI_0022 JBoss_EJBStatefulBeanCreateCountRt
JBSSPI_0023 JBoss_EJBStatefulBeanPassivatedCountRt
JBoss_EJBStatefulBeanAvailableCount
JBoss_EJBStatefulBeanPoolCurrentSize
JBoss_EJBStatefulBeanPoolMaxSize
JBoss_EJBStatefulBeanRemoveCountRt
JBSSPI_0024 JBoss_EJBStatelessBeanCreateCountRt
JBoss_EJBStatelessBeanAvailableCount
JBoss_EJBStatelessBeanPoolCurrentSize
JBoss_EJBStatelessBeanPoolMaxSize
JBoss_EJBStatelessBeanRemoveCountRt
JBSSPI_0025 Dropped as Metric value not available JBoss JMS Performance
JBSSPI_0026 Dropped as Metric value not available
JBSSPI_0027 Dropped as Metric value not available
JBSSPI_0028 Dropped as Metric value not available
JBSSPI_0029 Dropped as Metric value not available
JBSSPI_0030 Dropped as Metric value not available
JBSSPI_0031 Dropped as Metric value not available
JBSSPI_0032 Dropped as Metric value not available
JBSSPI_0033 Dropped as Metric value not available
JBSSPI_0034 Dropped as Metric value not available
JBSSPI_0035 Dropped as Metric value not available
JBSSPI_0036 Dropped as Metric value not available
JBSSPI_0037 Dropped as Metric value not available
JBSSPI_0038 Dropped as Metric value not available

Evolution Guide Page 192
JBSSPI_0039 Dropped as Metric value not available
JBSSPI_0040 Dropped as Metric value not available
JBSSPI_0041 Dropped as Metric value not available
JBSSPI_0042 Dropped as Metric value not available
JBoss_JMSconsumerCount
JBoss_JMSdurableMessageCount
JBoss_JMSdurableMessagePct
JBoss_JMSdurableSubscriptionCount
JBoss_JMSnonDurableMessageCount
JBoss_JMSnonDurableMessagePct
JBoss_JMSnonDurableSubscriptionCount
JBoss_JMSqueueDeliveringCount
JBoss_JMSqueueMessageCount
JBoss_JMSqueueMessagesAdded
JBoss_JMSscheduledCount
JBoss_JMSsubscriptionCount
JBoss_JMStopicDeliveringCount
JBoss_JMStopicMessageCount
JBoss_JMStopicMessagesAdded
JBoss_ApplicationStatus JBoss Application Status
JBoss_Collector_Availability JBoss MP Self-Monitoring
JBoss_Collector_Availability_Check
JBoss_ClassLoadingLoadedClassCount JBoss Classloading Statistics
JBoss_ClassLoadingTotalLoadedClassCount
JBoss_ClassLoadingUnloadedClassCount
JBoss_GarbageCollectorCollectionCount JBoss Garbage Collector Statistics
JBoss_GarbageCollectorCollectionTime
JBoss_GarbageCollectorIntervalTime
JBoss_GarbageCollectorThreadCount
JBoss_JDBCConnectionPoolThruRt JBoss JDBC Connection Pool Status
JBoss_JDBCPreparedStatementCacheAccessCount
JBoss_JDBCPreparedStatementCacheCurrentSize
JBoss_JDBCPreparedStatementCacheDeleteCount
JBoss_JDBCPreparedStatementCacheHitCount
JBoss_JDBCPreparedStatementCacheMissCount
JBoss_PoolActiveCount
JBoss_PoolAvailableCount
JBoss_PoolCreatedCount
JBoss_PoolDestroyedCount
JBoss_PoolInUseCount
JBoss_PoolInUsePct
JBoss_PoolMaxWaitCount
JBoss_WebAppActiveSessions JBoss Web Application Statistics
JBoss_WebAppDuplicatedSessionIds
JBoss_WebAppExpiredSessions
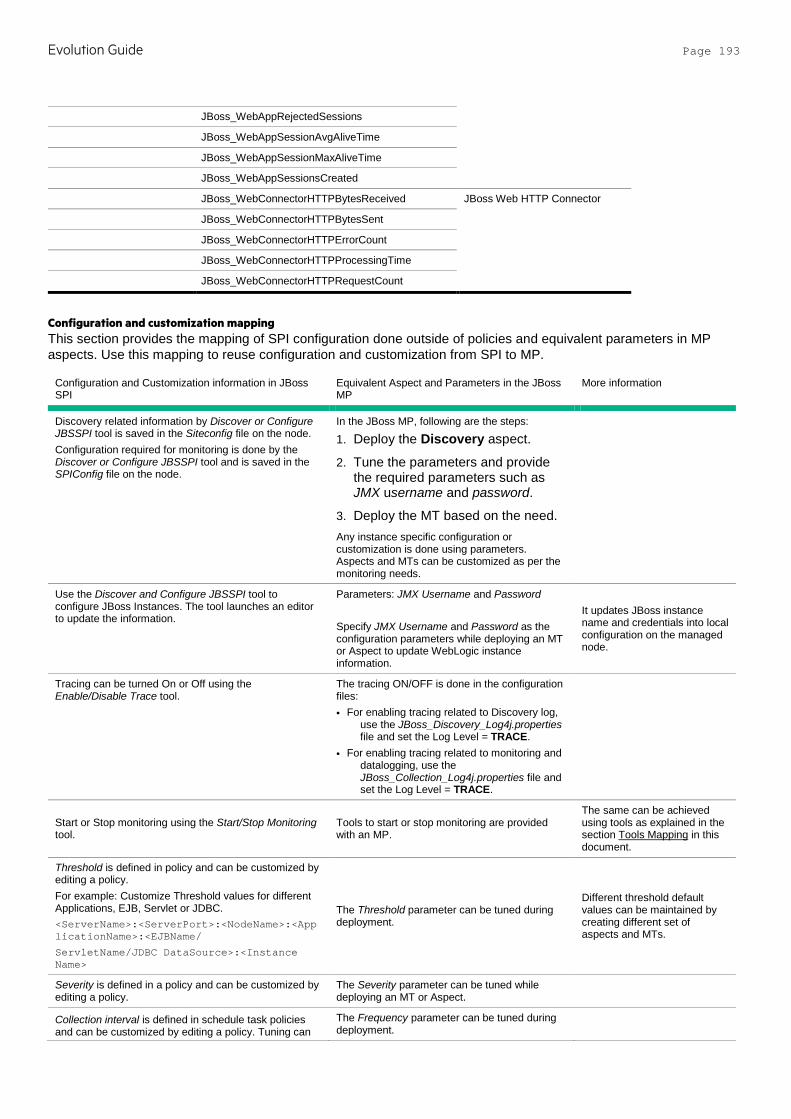
Evolution Guide Page 193
JBoss_WebAppRejectedSessions
JBoss_WebAppSessionAvgAliveTime
JBoss_WebAppSessionMaxAliveTime
JBoss_WebAppSessionsCreated
JBoss_WebConnectorHTTPBytesReceived JBoss Web HTTP Connector
JBoss_WebConnectorHTTPBytesSent
JBoss_WebConnectorHTTPErrorCount
JBoss_WebConnectorHTTPProcessingTime
JBoss_WebConnectorHTTPRequestCount
Configuration and customization mapping This section provides the mapping of SPI configuration done outside of policies and equivalent parameters in MP aspects. Use this mapping to reuse configuration and customization from SPI to MP.
Configuration and Customization information in JBoss SPI
Equivalent Aspect and Parameters in the JBoss MP
More information
Discovery related information by Discover or Configure JBSSPI tool is saved in the Siteconfig file on the node. Configuration required for monitoring is done by the Discover or Configure JBSSPI tool and is saved in the SPIConfig file on the node.
In the JBoss MP, following are the steps:
1. Deploy the Discovery aspect.
2. Tune the parameters and provide the required parameters such as JMX username and password.
3. Deploy the MT based on the need. Any instance specific configuration or customization is done using parameters. Aspects and MTs can be customized as per the monitoring needs.
Use the Discover and Configure JBSSPI tool to configure JBoss Instances. The tool launches an editor to update the information.
Parameters: JMX Username and Password Specify JMX Username and Password as the configuration parameters while deploying an MT or Aspect to update WebLogic instance information.
It updates JBoss instance name and credentials into local configuration on the managed node.
Tracing can be turned On or Off using the Enable/Disable Trace tool.
The tracing ON/OFF is done in the configuration files: • For enabling tracing related to Discovery log,
use the JBoss_Discovery_Log4j.properties file and set the Log Level = TRACE.
• For enabling tracing related to monitoring and datalogging, use the JBoss_Collection_Log4j.properties file and set the Log Level = TRACE.
Start or Stop monitoring using the Start/Stop Monitoring tool.
Tools to start or stop monitoring are provided with an MP.
The same can be achieved using tools as explained in the section Tools Mapping in this document.
Threshold is defined in policy and can be customized by editing a policy. For example: Customize Threshold values for different Applications, EJB, Servlet or JDBC. <ServerName>:<ServerPort>:<NodeName>:<ApplicationName>:<EJBName/
ServletName/JDBC DataSource>:<Instance Name>
The Threshold parameter can be tuned during deployment.
Different threshold default values can be maintained by creating different set of aspects and MTs.
Severity is defined in a policy and can be customized by editing a policy.
The Severity parameter can be tuned while deploying an MT or Aspect.
Collection interval is defined in schedule task policies and can be customized by editing a policy. Tuning can
The Frequency parameter can be tuned during deployment.

Evolution Guide Page 194
be done for all metrics or instances or a particular metric or instance.
You can customize an Instance or a Metric Filter using the Collector command with appropriate parameters. For example, to collect data from specific servers use the following command: wasspi_ca -prod jbs -m 40,41,42 -i server1,server2
The Metric filter parameter can be tuned during deployment.
Metric filter is a part of Expert parameters.
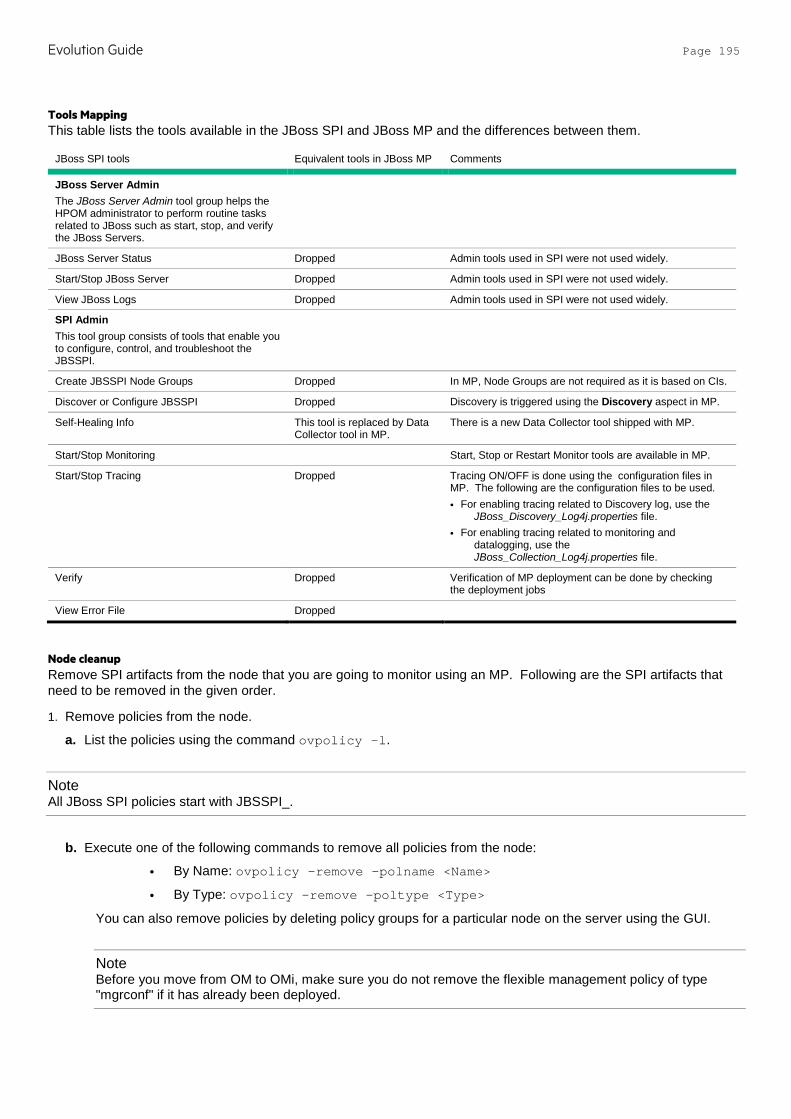
Evolution Guide Page 195
Tools Mapping This table lists the tools available in the JBoss SPI and JBoss MP and the differences between them.
JBoss SPI tools Equivalent tools in JBoss MP Comments
JBoss Server Admin The JBoss Server Admin tool group helps the HPOM administrator to perform routine tasks related to JBoss such as start, stop, and verify the JBoss Servers.
JBoss Server Status Dropped Admin tools used in SPI were not used widely.
Start/Stop JBoss Server Dropped Admin tools used in SPI were not used widely.
View JBoss Logs Dropped Admin tools used in SPI were not used widely.
SPI Admin This tool group consists of tools that enable you to configure, control, and troubleshoot the JBSSPI.
Create JBSSPI Node Groups Dropped In MP, Node Groups are not required as it is based on CIs.
Discover or Configure JBSSPI Dropped Discovery is triggered using the Discovery aspect in MP.
Self-Healing Info This tool is replaced by Data Collector tool in MP.
There is a new Data Collector tool shipped with MP.
Start/Stop Monitoring Start, Stop or Restart Monitor tools are available in MP.
Start/Stop Tracing Dropped Tracing ON/OFF is done using the configuration files in MP. The following are the configuration files to be used. • For enabling tracing related to Discovery log, use the
JBoss_Discovery_Log4j.properties file. • For enabling tracing related to monitoring and
datalogging, use the JBoss_Collection_Log4j.properties file.
Verify Dropped Verification of MP deployment can be done by checking the deployment jobs
View Error File Dropped
Node cleanup Remove SPI artifacts from the node that you are going to monitor using an MP. Following are the SPI artifacts that need to be removed in the given order.
1. Remove policies from the node.
a. List the policies using the command ovpolicy –l.
Note All JBoss SPI policies start with JBSSPI_.
b. Execute one of the following commands to remove all policies from the node:
• By Name: ovpolicy –remove –polname <Name>
• By Type: ovpolicy –remove –poltype <Type>
You can also remove policies by deleting policy groups for a particular node on the server using the GUI.
Note Before you move from OM to OMi, make sure you do not remove the flexible management policy of type "mgrconf" if it has already been deployed.

Evolution Guide Page 196
You can also remove policies by deleting policy groups for a particular node on the server using the GUI.
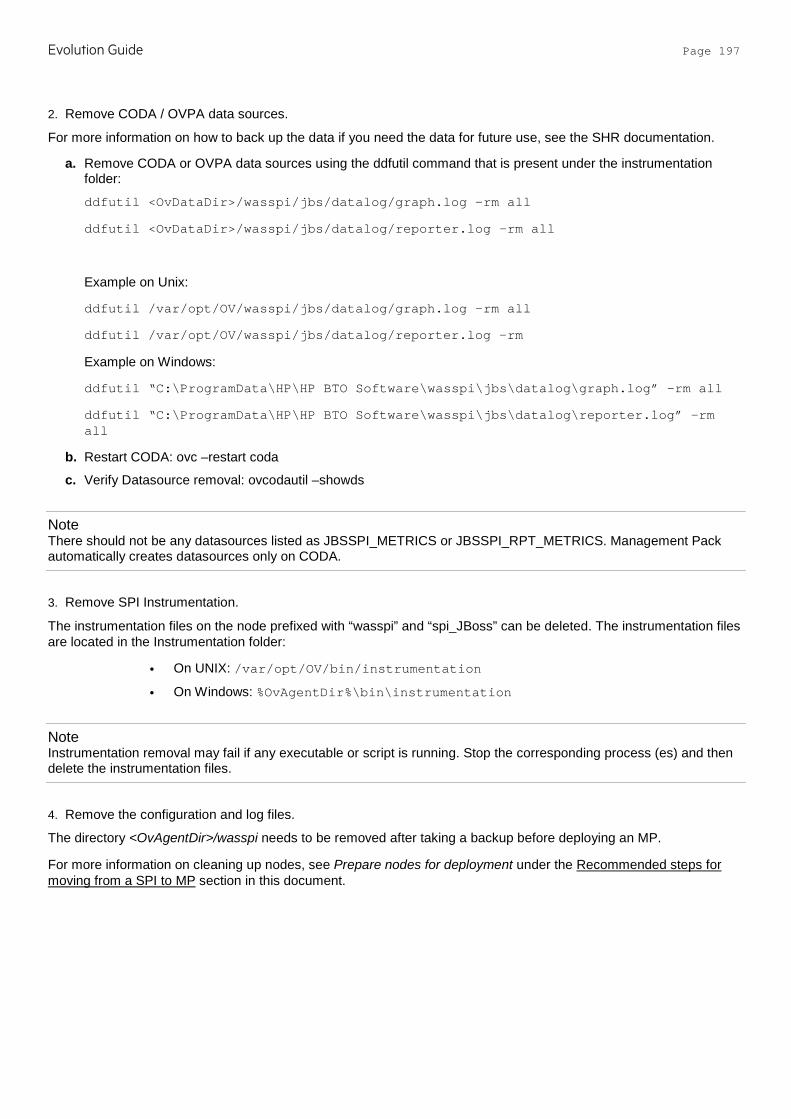
Evolution Guide Page 197
2. Remove CODA / OVPA data sources.
For more information on how to back up the data if you need the data for future use, see the SHR documentation.
a. Remove CODA or OVPA data sources using the ddfutil command that is present under the instrumentation folder:
ddfutil <OvDataDir>/wasspi/jbs/datalog/graph.log –rm all
ddfutil <OvDataDir>/wasspi/jbs/datalog/reporter.log –rm all
Example on Unix:
ddfutil /var/opt/OV/wasspi/jbs/datalog/graph.log –rm all
ddfutil /var/opt/OV/wasspi/jbs/datalog/reporter.log –rm
Example on Windows:
ddfutil “C:\ProgramData\HP\HP BTO Software\wasspi\jbs\datalog\graph.log” –rm all
ddfutil “C:\ProgramData\HP\HP BTO Software\wasspi\jbs\datalog\reporter.log” –rm all
b. Restart CODA: ovc –restart coda
c. Verify Datasource removal: ovcodautil –showds
Note There should not be any datasources listed as JBSSPI_METRICS or JBSSPI_RPT_METRICS. Management Pack automatically creates datasources only on CODA.
3. Remove SPI Instrumentation.
The instrumentation files on the node prefixed with “wasspi” and “spi_JBoss” can be deleted. The instrumentation files are located in the Instrumentation folder:
• On UNIX: /var/opt/OV/bin/instrumentation
• On Windows: %OvAgentDir%\bin\instrumentation
Note Instrumentation removal may fail if any executable or script is running. Stop the corresponding process (es) and then delete the instrumentation files.
4. Remove the configuration and log files.
The directory <OvAgentDir>/wasspi needs to be removed after taking a backup before deploying an MP.
For more information on cleaning up nodes, see Prepare nodes for deployment under the Recommended steps for moving from a SPI to MP section in this document.

Evolution Guide Page 198
Appendix A --- Mapping of Infrastructure SPI MT Policy Parameters to Infrastructure MP Parameters This section provides the mapping of Infrastructure SPI script parameters with OMi parameters.
This worksheet does not list out the common script parameter Debug. Other than this all other script parameters are listed. The debug script parameter is not replaced by an equivalent OMi MA parameter, but it can be set or unset inside the policy rule code before the policy template is deployed.
For a script parameter associated with an HPOM policy, where an equivalent policy does not exist in the Infrastructure MP, the term ‘Policy not in MP’ is used in the worksheet.
For a script parameter associated with an HPOM policy, where the equivalent parameter is not available in the Infrastructure MP policy templates, the term ‘Not available’ is used in the worksheet.
Infrastructure SPI Policy Parameters
Infrastructure SPI Policy Name Policy Script Parameter Name Aspect Parameter
CI-ClusterMonitor Debug <Not available> <Not available>
CI-ClusterMonitor MessageGroup Cluster Strength and Status Message Group
CI-ClusterNodeMonitor Debug <Not available> <Not available>
CI-ClusterNodeMonitor MessageGroup Cluster Strength and Status Message Group
CI-ClusterResGroupMonitor Debug <Not available> <Not available>
CI-ClusterResGroupMonitor MessageGroup Cluster Strength and Status Message Group
SI-CPUBottleneckDiagnosis GlobalCpuUtilCriticalThreshold Resource Bottleneck Diagnosis
Summarized Cpu Utilization (%)
SI-CPUBottleneckDiagnosis GlobalCpuUtilMajorThreshold
SI-CPUBottleneckDiagnosis GlobalCpuUtilMinorThreshold
SI-CPUBottleneckDiagnosis GlobalCpuUtilWarningThreshold
SI-CPUBottleneckDiagnosis MessageGroup Resource Bottleneck Diagnosis
Message group for outgoing messages
SI-CPUSpikeCheck CpuUtilCriticalThreshold CPU Performance CPU Utilization Level (%)
SI-CPUSpikeCheck CpuUtilMajorThreshold
SI-CPUSpikeCheck CpuUtilMinorThreshold
SI-CPUSpikeCheck CpuUtilWarningThreshold
SI-CPUSpikeCheck CpuUtilSysmodeCriticalThreshold CPU Performance CPU Utilization Level In System Mode (%)
SI-CPUSpikeCheck CpuUtilSysmodeMajorThreshold
SI-CPUSpikeCheck CpuUtilSysmodeMinorThreshold
SI-CPUSpikeCheck CpuUtilSysmodeWarningThreshold
SI-CPUSpikeCheck CpuUtilUsermodeCriticalThreshold CPU Performance CPU Utilization Level In User Mode (%)
SI-CPUSpikeCheck CpuUtilUsermodeMajorThreshold
SI-CPUSpikeCheck CpuUtilUsermodeMinorThreshold
SI-CPUSpikeCheck CpuUtilUsermodeWarningThreshold
SI-CPUSpikeCheck InterruptRateCriticalThreshold CPU Performance Rate of Interrupts (%)
SI-CPUSpikeCheck InterruptRateMajorThreshold
SI-CPUSpikeCheck InterruptRateMinorThreshold
SI-CPUSpikeCheck InterruptRateWarningThreshold
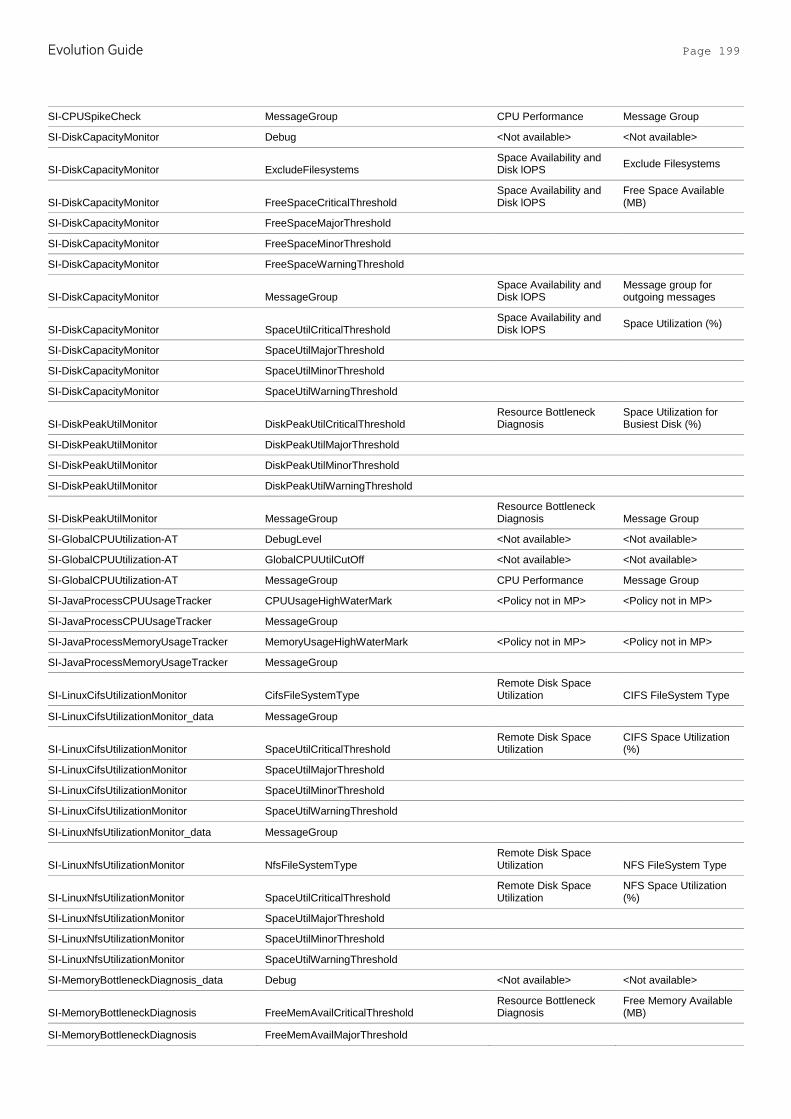
Evolution Guide Page 199
SI-CPUSpikeCheck MessageGroup CPU Performance Message Group
SI-DiskCapacityMonitor Debug <Not available> <Not available>
SI-DiskCapacityMonitor ExcludeFilesystems Space Availability and Disk lOPS Exclude Filesystems
SI-DiskCapacityMonitor FreeSpaceCriticalThreshold Space Availability and Disk lOPS
Free Space Available (MB)
SI-DiskCapacityMonitor FreeSpaceMajorThreshold
SI-DiskCapacityMonitor FreeSpaceMinorThreshold
SI-DiskCapacityMonitor FreeSpaceWarningThreshold
SI-DiskCapacityMonitor MessageGroup Space Availability and Disk lOPS
Message group for outgoing messages
SI-DiskCapacityMonitor SpaceUtilCriticalThreshold Space Availability and Disk lOPS Space Utilization (%)
SI-DiskCapacityMonitor SpaceUtilMajorThreshold
SI-DiskCapacityMonitor SpaceUtilMinorThreshold
SI-DiskCapacityMonitor SpaceUtilWarningThreshold
SI-DiskPeakUtilMonitor DiskPeakUtilCriticalThreshold Resource Bottleneck Diagnosis
Space Utilization for Busiest Disk (%)
SI-DiskPeakUtilMonitor DiskPeakUtilMajorThreshold
SI-DiskPeakUtilMonitor DiskPeakUtilMinorThreshold
SI-DiskPeakUtilMonitor DiskPeakUtilWarningThreshold
SI-DiskPeakUtilMonitor MessageGroup Resource Bottleneck Diagnosis Message Group
SI-GlobalCPUUtilization-AT DebugLevel <Not available> <Not available>
SI-GlobalCPUUtilization-AT GlobalCPUUtilCutOff <Not available> <Not available>
SI-GlobalCPUUtilization-AT MessageGroup CPU Performance Message Group
SI-JavaProcessCPUUsageTracker CPUUsageHighWaterMark <Policy not in MP> <Policy not in MP>
SI-JavaProcessCPUUsageTracker MessageGroup
SI-JavaProcessMemoryUsageTracker MemoryUsageHighWaterMark <Policy not in MP> <Policy not in MP>
SI-JavaProcessMemoryUsageTracker MessageGroup
SI-LinuxCifsUtilizationMonitor CifsFileSystemType Remote Disk Space Utilization CIFS FileSystem Type
SI-LinuxCifsUtilizationMonitor_data MessageGroup
SI-LinuxCifsUtilizationMonitor SpaceUtilCriticalThreshold Remote Disk Space Utilization
CIFS Space Utilization (%)
SI-LinuxCifsUtilizationMonitor SpaceUtilMajorThreshold
SI-LinuxCifsUtilizationMonitor SpaceUtilMinorThreshold
SI-LinuxCifsUtilizationMonitor SpaceUtilWarningThreshold
SI-LinuxNfsUtilizationMonitor_data MessageGroup
SI-LinuxNfsUtilizationMonitor NfsFileSystemType Remote Disk Space Utilization NFS FileSystem Type
SI-LinuxNfsUtilizationMonitor SpaceUtilCriticalThreshold Remote Disk Space Utilization
NFS Space Utilization (%)
SI-LinuxNfsUtilizationMonitor SpaceUtilMajorThreshold
SI-LinuxNfsUtilizationMonitor SpaceUtilMinorThreshold
SI-LinuxNfsUtilizationMonitor SpaceUtilWarningThreshold
SI-MemoryBottleneckDiagnosis_data Debug <Not available> <Not available>
SI-MemoryBottleneckDiagnosis FreeMemAvailCriticalThreshold Resource Bottleneck Diagnosis
Free Memory Available (MB)
SI-MemoryBottleneckDiagnosis FreeMemAvailMajorThreshold
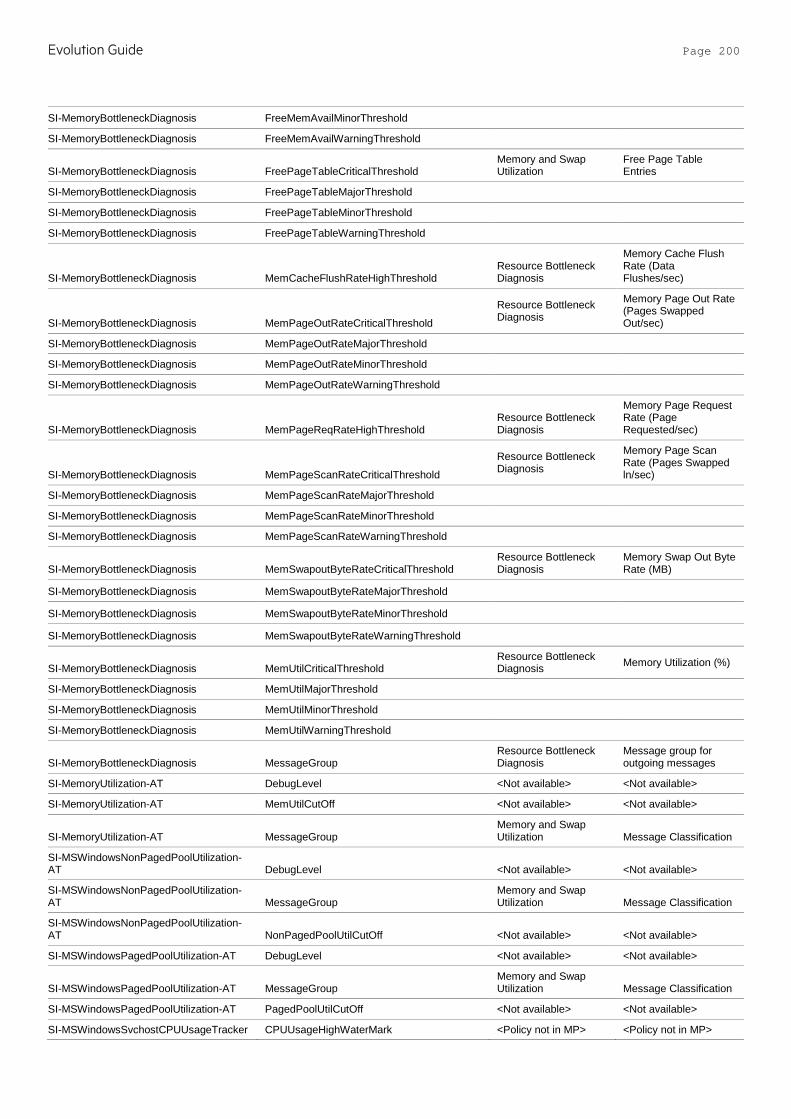
Evolution Guide Page 200
SI-MemoryBottleneckDiagnosis FreeMemAvailMinorThreshold
SI-MemoryBottleneckDiagnosis FreeMemAvailWarningThreshold
SI-MemoryBottleneckDiagnosis FreePageTableCriticalThreshold Memory and Swap Utilization
Free Page Table Entries
SI-MemoryBottleneckDiagnosis FreePageTableMajorThreshold
SI-MemoryBottleneckDiagnosis FreePageTableMinorThreshold
SI-MemoryBottleneckDiagnosis FreePageTableWarningThreshold
SI-MemoryBottleneckDiagnosis MemCacheFlushRateHighThreshold Resource Bottleneck Diagnosis
Memory Cache Flush Rate (Data Flushes/sec)
SI-MemoryBottleneckDiagnosis MemPageOutRateCriticalThreshold
Resource Bottleneck Diagnosis
Memory Page Out Rate (Pages Swapped Out/sec)
SI-MemoryBottleneckDiagnosis MemPageOutRateMajorThreshold
SI-MemoryBottleneckDiagnosis MemPageOutRateMinorThreshold
SI-MemoryBottleneckDiagnosis MemPageOutRateWarningThreshold
SI-MemoryBottleneckDiagnosis MemPageReqRateHighThreshold Resource Bottleneck Diagnosis
Memory Page Request Rate (Page Requested/sec)
SI-MemoryBottleneckDiagnosis MemPageScanRateCriticalThreshold
Resource Bottleneck Diagnosis
Memory Page Scan Rate (Pages Swapped ln/sec)
SI-MemoryBottleneckDiagnosis MemPageScanRateMajorThreshold
SI-MemoryBottleneckDiagnosis MemPageScanRateMinorThreshold
SI-MemoryBottleneckDiagnosis MemPageScanRateWarningThreshold
SI-MemoryBottleneckDiagnosis MemSwapoutByteRateCriticalThreshold Resource Bottleneck Diagnosis
Memory Swap Out Byte Rate (MB)
SI-MemoryBottleneckDiagnosis MemSwapoutByteRateMajorThreshold
SI-MemoryBottleneckDiagnosis MemSwapoutByteRateMinorThreshold
SI-MemoryBottleneckDiagnosis MemSwapoutByteRateWarningThreshold
SI-MemoryBottleneckDiagnosis MemUtilCriticalThreshold Resource Bottleneck Diagnosis Memory Utilization (%)
SI-MemoryBottleneckDiagnosis MemUtilMajorThreshold
SI-MemoryBottleneckDiagnosis MemUtilMinorThreshold
SI-MemoryBottleneckDiagnosis MemUtilWarningThreshold
SI-MemoryBottleneckDiagnosis MessageGroup Resource Bottleneck Diagnosis
Message group for outgoing messages
SI-MemoryUtilization-AT DebugLevel <Not available> <Not available>
SI-MemoryUtilization-AT MemUtilCutOff <Not available> <Not available>
SI-MemoryUtilization-AT MessageGroup Memory and Swap Utilization Message Classification
SI-MSWindowsNonPagedPoolUtilization-AT DebugLevel <Not available> <Not available>
SI-MSWindowsNonPagedPoolUtilization-AT MessageGroup
Memory and Swap Utilization Message Classification
SI-MSWindowsNonPagedPoolUtilization-AT NonPagedPoolUtilCutOff <Not available> <Not available>
SI-MSWindowsPagedPoolUtilization-AT DebugLevel <Not available> <Not available>
SI-MSWindowsPagedPoolUtilization-AT MessageGroup Memory and Swap Utilization Message Classification
SI-MSWindowsPagedPoolUtilization-AT PagedPoolUtilCutOff <Not available> <Not available>
SI-MSWindowsSvchostCPUUsageTracker CPUUsageHighWaterMark <Policy not in MP> <Policy not in MP>
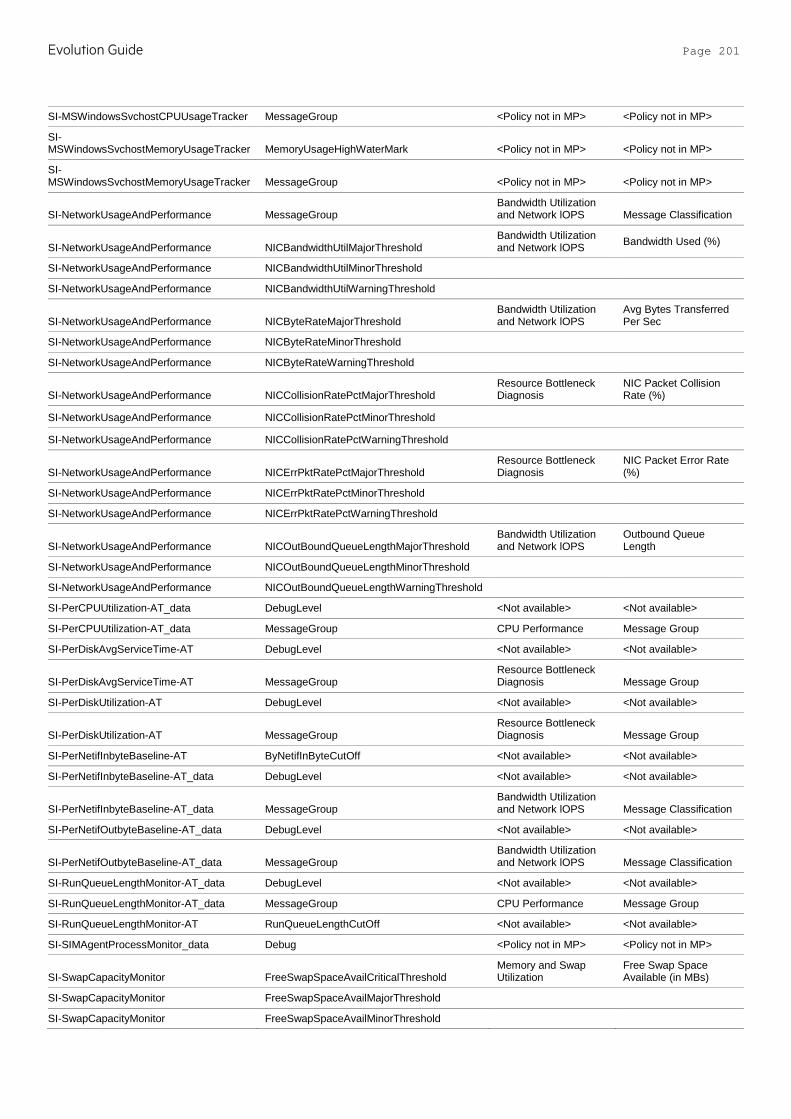
Evolution Guide Page 201
SI-MSWindowsSvchostCPUUsageTracker MessageGroup <Policy not in MP> <Policy not in MP>
SI-MSWindowsSvchostMemoryUsageTracker MemoryUsageHighWaterMark <Policy not in MP> <Policy not in MP>
SI-MSWindowsSvchostMemoryUsageTracker MessageGroup <Policy not in MP> <Policy not in MP>
SI-NetworkUsageAndPerformance MessageGroup Bandwidth Utilization and Network lOPS Message Classification
SI-NetworkUsageAndPerformance NICBandwidthUtilMajorThreshold Bandwidth Utilization and Network lOPS Bandwidth Used (%)
SI-NetworkUsageAndPerformance NICBandwidthUtilMinorThreshold
SI-NetworkUsageAndPerformance NICBandwidthUtilWarningThreshold
SI-NetworkUsageAndPerformance NICByteRateMajorThreshold Bandwidth Utilization and Network lOPS
Avg Bytes Transferred Per Sec
SI-NetworkUsageAndPerformance NICByteRateMinorThreshold
SI-NetworkUsageAndPerformance NICByteRateWarningThreshold
SI-NetworkUsageAndPerformance NICCollisionRatePctMajorThreshold Resource Bottleneck Diagnosis
NIC Packet Collision Rate (%)
SI-NetworkUsageAndPerformance NICCollisionRatePctMinorThreshold
SI-NetworkUsageAndPerformance NICCollisionRatePctWarningThreshold
SI-NetworkUsageAndPerformance NICErrPktRatePctMajorThreshold Resource Bottleneck Diagnosis
NIC Packet Error Rate (%)
SI-NetworkUsageAndPerformance NICErrPktRatePctMinorThreshold
SI-NetworkUsageAndPerformance NICErrPktRatePctWarningThreshold
SI-NetworkUsageAndPerformance NICOutBoundQueueLengthMajorThreshold Bandwidth Utilization and Network lOPS
Outbound Queue Length
SI-NetworkUsageAndPerformance NICOutBoundQueueLengthMinorThreshold
SI-NetworkUsageAndPerformance NICOutBoundQueueLengthWarningThreshold
SI-PerCPUUtilization-AT_data DebugLevel <Not available> <Not available>
SI-PerCPUUtilization-AT_data MessageGroup CPU Performance Message Group
SI-PerDiskAvgServiceTime-AT DebugLevel <Not available> <Not available>
SI-PerDiskAvgServiceTime-AT MessageGroup Resource Bottleneck Diagnosis Message Group
SI-PerDiskUtilization-AT DebugLevel <Not available> <Not available>
SI-PerDiskUtilization-AT MessageGroup Resource Bottleneck Diagnosis Message Group
SI-PerNetifInbyteBaseline-AT ByNetifInByteCutOff <Not available> <Not available>
SI-PerNetifInbyteBaseline-AT_data DebugLevel <Not available> <Not available>
SI-PerNetifInbyteBaseline-AT_data MessageGroup Bandwidth Utilization and Network lOPS Message Classification
SI-PerNetifOutbyteBaseline-AT_data DebugLevel <Not available> <Not available>
SI-PerNetifOutbyteBaseline-AT_data MessageGroup Bandwidth Utilization and Network lOPS Message Classification
SI-RunQueueLengthMonitor-AT_data DebugLevel <Not available> <Not available>
SI-RunQueueLengthMonitor-AT_data MessageGroup CPU Performance Message Group
SI-RunQueueLengthMonitor-AT RunQueueLengthCutOff <Not available> <Not available>
SI-SIMAgentProcessMonitor_data Debug <Policy not in MP> <Policy not in MP>
SI-SwapCapacityMonitor FreeSwapSpaceAvailCriticalThreshold Memory and Swap Utilization
Free Swap Space Available (in MBs)
SI-SwapCapacityMonitor FreeSwapSpaceAvailMajorThreshold
SI-SwapCapacityMonitor FreeSwapSpaceAvailMinorThreshold
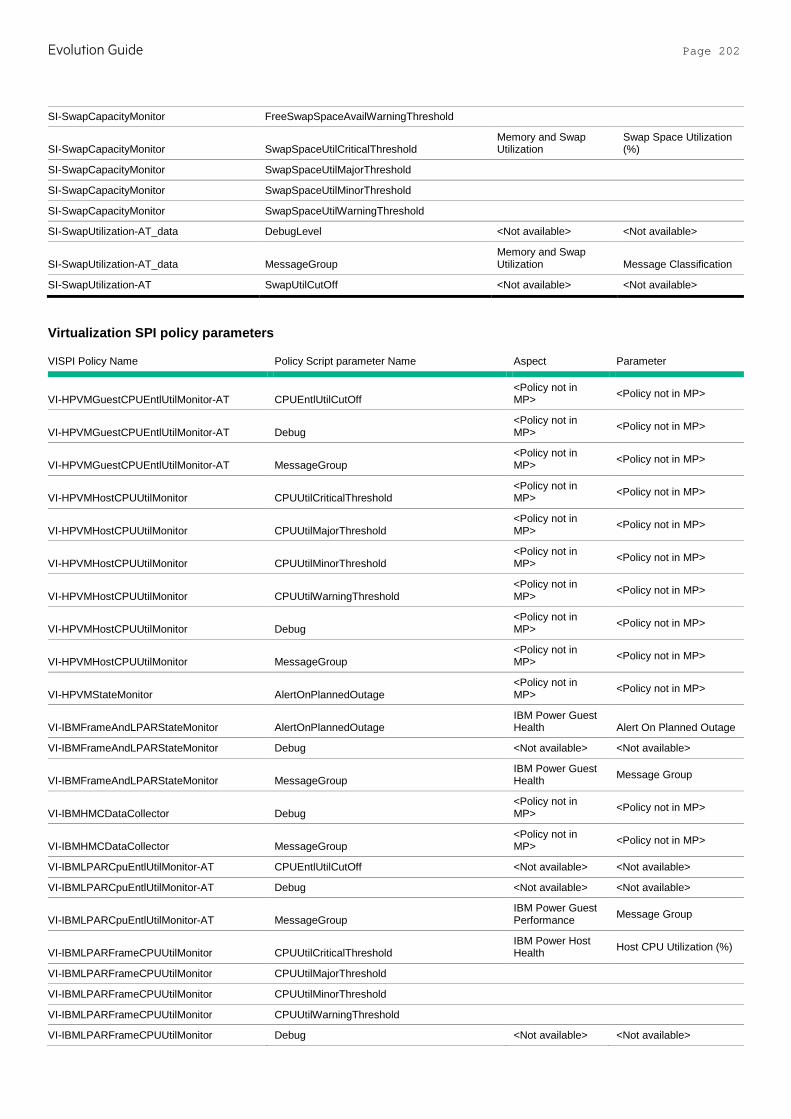
Evolution Guide Page 202
SI-SwapCapacityMonitor FreeSwapSpaceAvailWarningThreshold
SI-SwapCapacityMonitor SwapSpaceUtilCriticalThreshold Memory and Swap Utilization
Swap Space Utilization (%)
SI-SwapCapacityMonitor SwapSpaceUtilMajorThreshold
SI-SwapCapacityMonitor SwapSpaceUtilMinorThreshold
SI-SwapCapacityMonitor SwapSpaceUtilWarningThreshold
SI-SwapUtilization-AT_data DebugLevel <Not available> <Not available>
SI-SwapUtilization-AT_data MessageGroup Memory and Swap Utilization Message Classification
SI-SwapUtilization-AT SwapUtilCutOff <Not available> <Not available>
Virtualization SPI policy parameters
VISPI Policy Name Policy Script parameter Name Aspect Parameter
VI-HPVMGuestCPUEntlUtilMonitor-AT CPUEntlUtilCutOff <Policy not in MP> <Policy not in MP>
VI-HPVMGuestCPUEntlUtilMonitor-AT Debug <Policy not in MP> <Policy not in MP>
VI-HPVMGuestCPUEntlUtilMonitor-AT MessageGroup <Policy not in MP> <Policy not in MP>
VI-HPVMHostCPUUtilMonitor CPUUtilCriticalThreshold <Policy not in MP> <Policy not in MP>
VI-HPVMHostCPUUtilMonitor CPUUtilMajorThreshold <Policy not in MP> <Policy not in MP>
VI-HPVMHostCPUUtilMonitor CPUUtilMinorThreshold <Policy not in MP> <Policy not in MP>
VI-HPVMHostCPUUtilMonitor CPUUtilWarningThreshold <Policy not in MP> <Policy not in MP>
VI-HPVMHostCPUUtilMonitor Debug <Policy not in MP> <Policy not in MP>
VI-HPVMHostCPUUtilMonitor MessageGroup <Policy not in MP> <Policy not in MP>
VI-HPVMStateMonitor AlertOnPlannedOutage <Policy not in MP> <Policy not in MP>
VI-IBMFrameAndLPARStateMonitor AlertOnPlannedOutage IBM Power Guest Health Alert On Planned Outage
VI-IBMFrameAndLPARStateMonitor Debug <Not available> <Not available>
VI-IBMFrameAndLPARStateMonitor MessageGroup IBM Power Guest Health Message Group
VI-IBMHMCDataCollector Debug <Policy not in MP> <Policy not in MP>
VI-IBMHMCDataCollector MessageGroup <Policy not in MP> <Policy not in MP>
VI-IBMLPARCpuEntlUtilMonitor-AT CPUEntlUtilCutOff <Not available> <Not available>
VI-IBMLPARCpuEntlUtilMonitor-AT Debug <Not available> <Not available>
VI-IBMLPARCpuEntlUtilMonitor-AT MessageGroup IBM Power Guest Performance Message Group
VI-IBMLPARFrameCPUUtilMonitor CPUUtilCriticalThreshold IBM Power Host Health Host CPU Utilization (%)
VI-IBMLPARFrameCPUUtilMonitor CPUUtilMajorThreshold
VI-IBMLPARFrameCPUUtilMonitor CPUUtilMinorThreshold
VI-IBMLPARFrameCPUUtilMonitor CPUUtilWarningThreshold
VI-IBMLPARFrameCPUUtilMonitor Debug <Not available> <Not available>
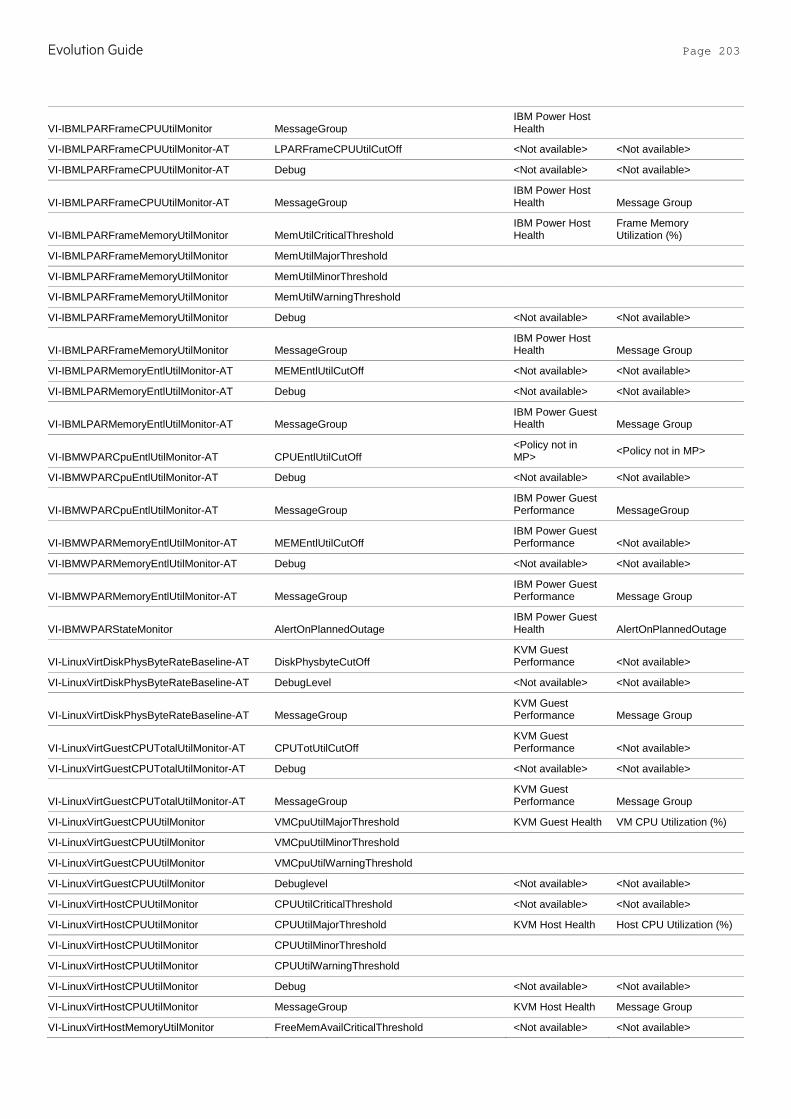
Evolution Guide Page 203
VI-IBMLPARFrameCPUUtilMonitor MessageGroup IBM Power Host Health
VI-IBMLPARFrameCPUUtilMonitor-AT LPARFrameCPUUtilCutOff <Not available> <Not available>
VI-IBMLPARFrameCPUUtilMonitor-AT Debug <Not available> <Not available>
VI-IBMLPARFrameCPUUtilMonitor-AT MessageGroup IBM Power Host Health Message Group
VI-IBMLPARFrameMemoryUtilMonitor MemUtilCriticalThreshold IBM Power Host Health
Frame Memory Utilization (%)
VI-IBMLPARFrameMemoryUtilMonitor MemUtilMajorThreshold
VI-IBMLPARFrameMemoryUtilMonitor MemUtilMinorThreshold
VI-IBMLPARFrameMemoryUtilMonitor MemUtilWarningThreshold
VI-IBMLPARFrameMemoryUtilMonitor Debug <Not available> <Not available>
VI-IBMLPARFrameMemoryUtilMonitor MessageGroup IBM Power Host Health Message Group
VI-IBMLPARMemoryEntlUtilMonitor-AT MEMEntlUtilCutOff <Not available> <Not available>
VI-IBMLPARMemoryEntlUtilMonitor-AT Debug <Not available> <Not available>
VI-IBMLPARMemoryEntlUtilMonitor-AT MessageGroup IBM Power Guest Health Message Group
VI-IBMWPARCpuEntlUtilMonitor-AT CPUEntlUtilCutOff <Policy not in MP> <Policy not in MP>
VI-IBMWPARCpuEntlUtilMonitor-AT Debug <Not available> <Not available>
VI-IBMWPARCpuEntlUtilMonitor-AT MessageGroup IBM Power Guest Performance MessageGroup
VI-IBMWPARMemoryEntlUtilMonitor-AT MEMEntlUtilCutOff IBM Power Guest Performance <Not available>
VI-IBMWPARMemoryEntlUtilMonitor-AT Debug <Not available> <Not available>
VI-IBMWPARMemoryEntlUtilMonitor-AT MessageGroup IBM Power Guest Performance Message Group
VI-IBMWPARStateMonitor AlertOnPlannedOutage IBM Power Guest Health AlertOnPlannedOutage
VI-LinuxVirtDiskPhysByteRateBaseline-AT DiskPhysbyteCutOff KVM Guest Performance <Not available>
VI-LinuxVirtDiskPhysByteRateBaseline-AT DebugLevel <Not available> <Not available>
VI-LinuxVirtDiskPhysByteRateBaseline-AT MessageGroup KVM Guest Performance Message Group
VI-LinuxVirtGuestCPUTotalUtilMonitor-AT CPUTotUtilCutOff KVM Guest Performance <Not available>
VI-LinuxVirtGuestCPUTotalUtilMonitor-AT Debug <Not available> <Not available>
VI-LinuxVirtGuestCPUTotalUtilMonitor-AT MessageGroup KVM Guest Performance Message Group
VI-LinuxVirtGuestCPUUtilMonitor VMCpuUtilMajorThreshold KVM Guest Health VM CPU Utilization (%)
VI-LinuxVirtGuestCPUUtilMonitor VMCpuUtilMinorThreshold
VI-LinuxVirtGuestCPUUtilMonitor VMCpuUtilWarningThreshold
VI-LinuxVirtGuestCPUUtilMonitor Debuglevel <Not available> <Not available>
VI-LinuxVirtHostCPUUtilMonitor CPUUtilCriticalThreshold <Not available> <Not available>
VI-LinuxVirtHostCPUUtilMonitor CPUUtilMajorThreshold KVM Host Health Host CPU Utilization (%)
VI-LinuxVirtHostCPUUtilMonitor CPUUtilMinorThreshold
VI-LinuxVirtHostCPUUtilMonitor CPUUtilWarningThreshold
VI-LinuxVirtHostCPUUtilMonitor Debug <Not available> <Not available>
VI-LinuxVirtHostCPUUtilMonitor MessageGroup KVM Host Health Message Group
VI-LinuxVirtHostMemoryUtilMonitor FreeMemAvailCriticalThreshold <Not available> <Not available>
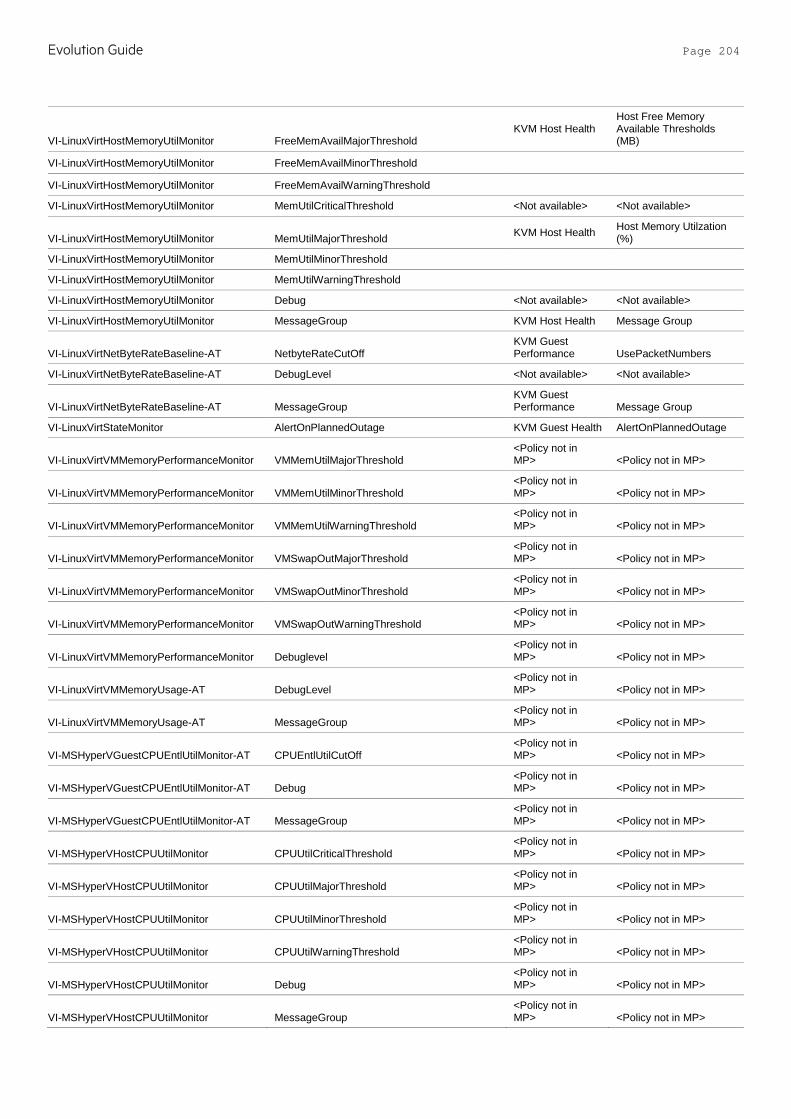
Evolution Guide Page 204
VI-LinuxVirtHostMemoryUtilMonitor FreeMemAvailMajorThreshold KVM Host Health
Host Free Memory Available Thresholds (MB)
VI-LinuxVirtHostMemoryUtilMonitor FreeMemAvailMinorThreshold
VI-LinuxVirtHostMemoryUtilMonitor FreeMemAvailWarningThreshold
VI-LinuxVirtHostMemoryUtilMonitor MemUtilCriticalThreshold <Not available> <Not available>
VI-LinuxVirtHostMemoryUtilMonitor MemUtilMajorThreshold KVM Host Health Host Memory Utilzation (%)
VI-LinuxVirtHostMemoryUtilMonitor MemUtilMinorThreshold
VI-LinuxVirtHostMemoryUtilMonitor MemUtilWarningThreshold
VI-LinuxVirtHostMemoryUtilMonitor Debug <Not available> <Not available>
VI-LinuxVirtHostMemoryUtilMonitor MessageGroup KVM Host Health Message Group
VI-LinuxVirtNetByteRateBaseline-AT NetbyteRateCutOff KVM Guest Performance UsePacketNumbers
VI-LinuxVirtNetByteRateBaseline-AT DebugLevel <Not available> <Not available>
VI-LinuxVirtNetByteRateBaseline-AT MessageGroup KVM Guest Performance Message Group
VI-LinuxVirtStateMonitor AlertOnPlannedOutage KVM Guest Health AlertOnPlannedOutage
VI-LinuxVirtVMMemoryPerformanceMonitor VMMemUtilMajorThreshold <Policy not in MP> <Policy not in MP>
VI-LinuxVirtVMMemoryPerformanceMonitor VMMemUtilMinorThreshold <Policy not in MP> <Policy not in MP>
VI-LinuxVirtVMMemoryPerformanceMonitor VMMemUtilWarningThreshold <Policy not in MP> <Policy not in MP>
VI-LinuxVirtVMMemoryPerformanceMonitor VMSwapOutMajorThreshold <Policy not in MP> <Policy not in MP>
VI-LinuxVirtVMMemoryPerformanceMonitor VMSwapOutMinorThreshold <Policy not in MP> <Policy not in MP>
VI-LinuxVirtVMMemoryPerformanceMonitor VMSwapOutWarningThreshold <Policy not in MP> <Policy not in MP>
VI-LinuxVirtVMMemoryPerformanceMonitor Debuglevel <Policy not in MP> <Policy not in MP>
VI-LinuxVirtVMMemoryUsage-AT DebugLevel <Policy not in MP> <Policy not in MP>
VI-LinuxVirtVMMemoryUsage-AT MessageGroup <Policy not in MP> <Policy not in MP>
VI-MSHyperVGuestCPUEntlUtilMonitor-AT CPUEntlUtilCutOff <Policy not in MP> <Policy not in MP>
VI-MSHyperVGuestCPUEntlUtilMonitor-AT Debug <Policy not in MP> <Policy not in MP>
VI-MSHyperVGuestCPUEntlUtilMonitor-AT MessageGroup <Policy not in MP> <Policy not in MP>
VI-MSHyperVHostCPUUtilMonitor CPUUtilCriticalThreshold <Policy not in MP> <Policy not in MP>
VI-MSHyperVHostCPUUtilMonitor CPUUtilMajorThreshold <Policy not in MP> <Policy not in MP>
VI-MSHyperVHostCPUUtilMonitor CPUUtilMinorThreshold <Policy not in MP> <Policy not in MP>
VI-MSHyperVHostCPUUtilMonitor CPUUtilWarningThreshold <Policy not in MP> <Policy not in MP>
VI-MSHyperVHostCPUUtilMonitor Debug <Policy not in MP> <Policy not in MP>
VI-MSHyperVHostCPUUtilMonitor MessageGroup <Policy not in MP> <Policy not in MP>
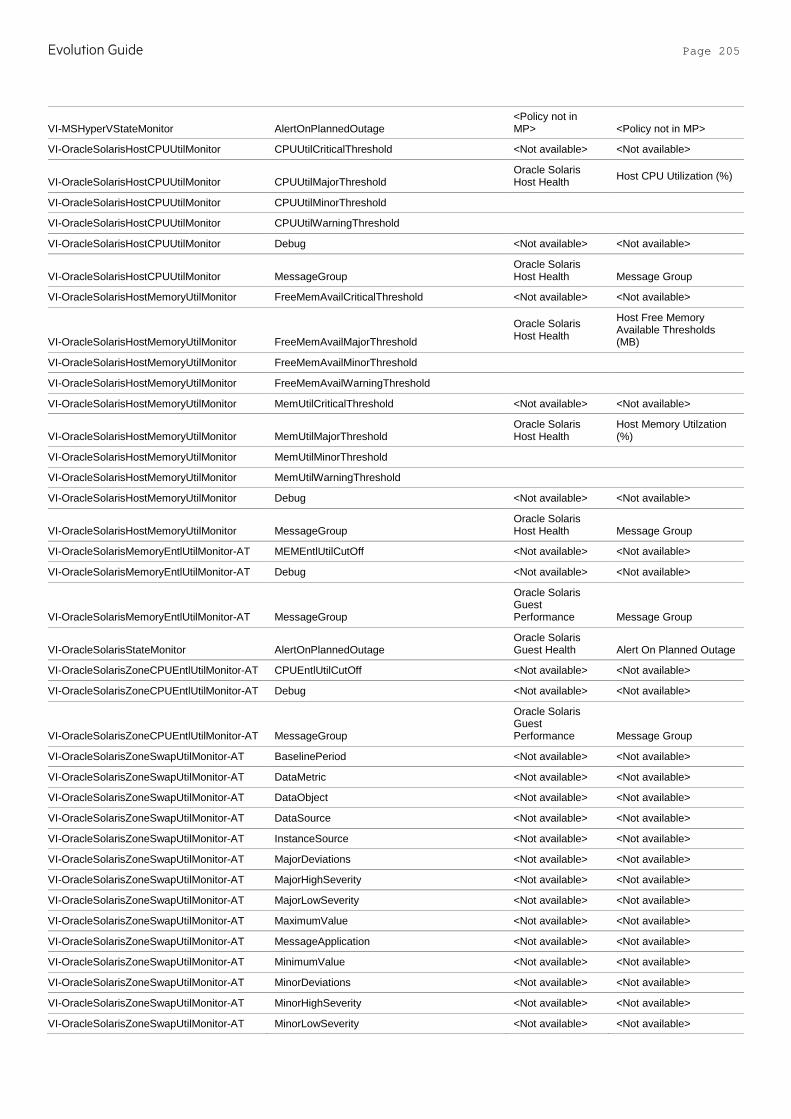
Evolution Guide Page 205
VI-MSHyperVStateMonitor AlertOnPlannedOutage <Policy not in MP> <Policy not in MP>
VI-OracleSolarisHostCPUUtilMonitor CPUUtilCriticalThreshold <Not available> <Not available>
VI-OracleSolarisHostCPUUtilMonitor CPUUtilMajorThreshold Oracle Solaris Host Health Host CPU Utilization (%)
VI-OracleSolarisHostCPUUtilMonitor CPUUtilMinorThreshold
VI-OracleSolarisHostCPUUtilMonitor CPUUtilWarningThreshold
VI-OracleSolarisHostCPUUtilMonitor Debug <Not available> <Not available>
VI-OracleSolarisHostCPUUtilMonitor MessageGroup Oracle Solaris Host Health Message Group
VI-OracleSolarisHostMemoryUtilMonitor FreeMemAvailCriticalThreshold <Not available> <Not available>
VI-OracleSolarisHostMemoryUtilMonitor FreeMemAvailMajorThreshold
Oracle Solaris Host Health
Host Free Memory Available Thresholds (MB)
VI-OracleSolarisHostMemoryUtilMonitor FreeMemAvailMinorThreshold
VI-OracleSolarisHostMemoryUtilMonitor FreeMemAvailWarningThreshold
VI-OracleSolarisHostMemoryUtilMonitor MemUtilCriticalThreshold <Not available> <Not available>
VI-OracleSolarisHostMemoryUtilMonitor MemUtilMajorThreshold Oracle Solaris Host Health
Host Memory Utilzation (%)
VI-OracleSolarisHostMemoryUtilMonitor MemUtilMinorThreshold
VI-OracleSolarisHostMemoryUtilMonitor MemUtilWarningThreshold
VI-OracleSolarisHostMemoryUtilMonitor Debug <Not available> <Not available>
VI-OracleSolarisHostMemoryUtilMonitor MessageGroup Oracle Solaris Host Health Message Group
VI-OracleSolarisMemoryEntlUtilMonitor-AT MEMEntlUtilCutOff <Not available> <Not available>
VI-OracleSolarisMemoryEntlUtilMonitor-AT Debug <Not available> <Not available>
VI-OracleSolarisMemoryEntlUtilMonitor-AT MessageGroup
Oracle Solaris Guest Performance Message Group
VI-OracleSolarisStateMonitor AlertOnPlannedOutage Oracle Solaris Guest Health Alert On Planned Outage
VI-OracleSolarisZoneCPUEntlUtilMonitor-AT CPUEntlUtilCutOff <Not available> <Not available>
VI-OracleSolarisZoneCPUEntlUtilMonitor-AT Debug <Not available> <Not available>
VI-OracleSolarisZoneCPUEntlUtilMonitor-AT MessageGroup
Oracle Solaris Guest Performance Message Group
VI-OracleSolarisZoneSwapUtilMonitor-AT BaselinePeriod <Not available> <Not available>
VI-OracleSolarisZoneSwapUtilMonitor-AT DataMetric <Not available> <Not available>
VI-OracleSolarisZoneSwapUtilMonitor-AT DataObject <Not available> <Not available>
VI-OracleSolarisZoneSwapUtilMonitor-AT DataSource <Not available> <Not available>
VI-OracleSolarisZoneSwapUtilMonitor-AT InstanceSource <Not available> <Not available>
VI-OracleSolarisZoneSwapUtilMonitor-AT MajorDeviations <Not available> <Not available>
VI-OracleSolarisZoneSwapUtilMonitor-AT MajorHighSeverity <Not available> <Not available>
VI-OracleSolarisZoneSwapUtilMonitor-AT MajorLowSeverity <Not available> <Not available>
VI-OracleSolarisZoneSwapUtilMonitor-AT MaximumValue <Not available> <Not available>
VI-OracleSolarisZoneSwapUtilMonitor-AT MessageApplication <Not available> <Not available>
VI-OracleSolarisZoneSwapUtilMonitor-AT MinimumValue <Not available> <Not available>
VI-OracleSolarisZoneSwapUtilMonitor-AT MinorDeviations <Not available> <Not available>
VI-OracleSolarisZoneSwapUtilMonitor-AT MinorHighSeverity <Not available> <Not available>
VI-OracleSolarisZoneSwapUtilMonitor-AT MinorLowSeverity <Not available> <Not available>
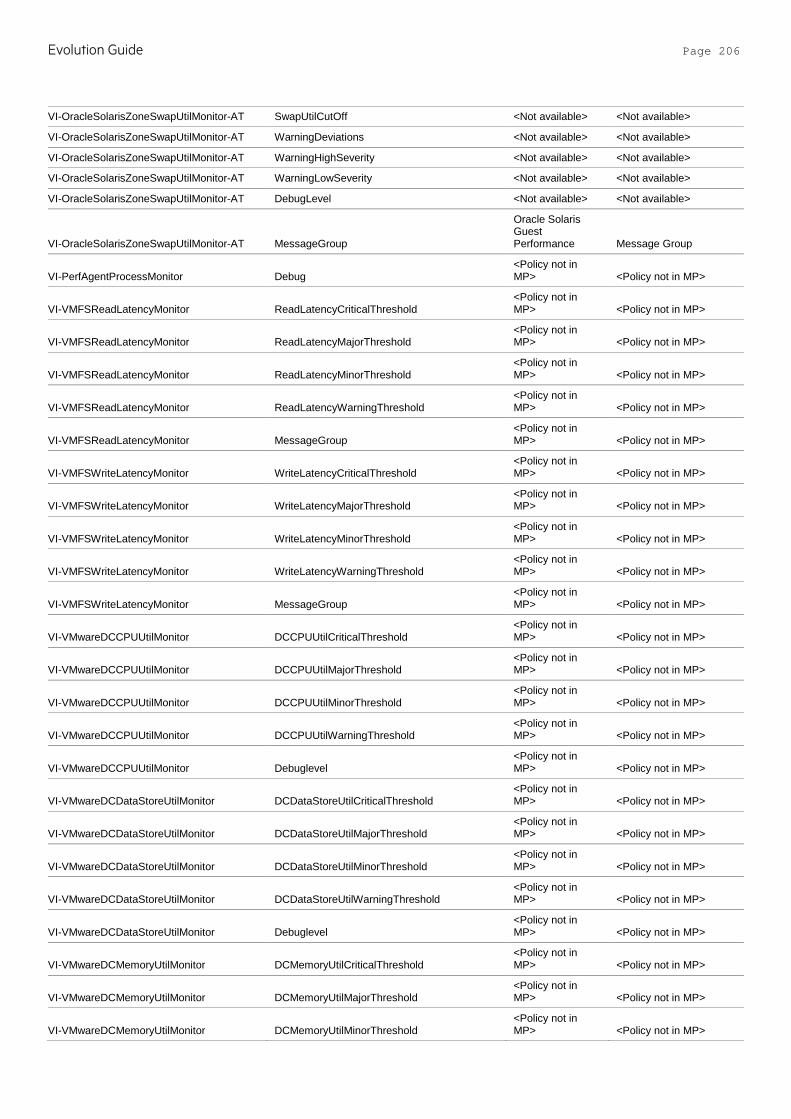
Evolution Guide Page 206
VI-OracleSolarisZoneSwapUtilMonitor-AT SwapUtilCutOff <Not available> <Not available>
VI-OracleSolarisZoneSwapUtilMonitor-AT WarningDeviations <Not available> <Not available>
VI-OracleSolarisZoneSwapUtilMonitor-AT WarningHighSeverity <Not available> <Not available>
VI-OracleSolarisZoneSwapUtilMonitor-AT WarningLowSeverity <Not available> <Not available>
VI-OracleSolarisZoneSwapUtilMonitor-AT DebugLevel <Not available> <Not available>
VI-OracleSolarisZoneSwapUtilMonitor-AT MessageGroup
Oracle Solaris Guest Performance Message Group
VI-PerfAgentProcessMonitor Debug <Policy not in MP> <Policy not in MP>
VI-VMFSReadLatencyMonitor ReadLatencyCriticalThreshold <Policy not in MP> <Policy not in MP>
VI-VMFSReadLatencyMonitor ReadLatencyMajorThreshold <Policy not in MP> <Policy not in MP>
VI-VMFSReadLatencyMonitor ReadLatencyMinorThreshold <Policy not in MP> <Policy not in MP>
VI-VMFSReadLatencyMonitor ReadLatencyWarningThreshold <Policy not in MP> <Policy not in MP>
VI-VMFSReadLatencyMonitor MessageGroup <Policy not in MP> <Policy not in MP>
VI-VMFSWriteLatencyMonitor WriteLatencyCriticalThreshold <Policy not in MP> <Policy not in MP>
VI-VMFSWriteLatencyMonitor WriteLatencyMajorThreshold <Policy not in MP> <Policy not in MP>
VI-VMFSWriteLatencyMonitor WriteLatencyMinorThreshold <Policy not in MP> <Policy not in MP>
VI-VMFSWriteLatencyMonitor WriteLatencyWarningThreshold <Policy not in MP> <Policy not in MP>
VI-VMFSWriteLatencyMonitor MessageGroup <Policy not in MP> <Policy not in MP>
VI-VMwareDCCPUUtilMonitor DCCPUUtilCriticalThreshold <Policy not in MP> <Policy not in MP>
VI-VMwareDCCPUUtilMonitor DCCPUUtilMajorThreshold <Policy not in MP> <Policy not in MP>
VI-VMwareDCCPUUtilMonitor DCCPUUtilMinorThreshold <Policy not in MP> <Policy not in MP>
VI-VMwareDCCPUUtilMonitor DCCPUUtilWarningThreshold <Policy not in MP> <Policy not in MP>
VI-VMwareDCCPUUtilMonitor Debuglevel <Policy not in MP> <Policy not in MP>
VI-VMwareDCDataStoreUtilMonitor DCDataStoreUtilCriticalThreshold <Policy not in MP> <Policy not in MP>
VI-VMwareDCDataStoreUtilMonitor DCDataStoreUtilMajorThreshold <Policy not in MP> <Policy not in MP>
VI-VMwareDCDataStoreUtilMonitor DCDataStoreUtilMinorThreshold <Policy not in MP> <Policy not in MP>
VI-VMwareDCDataStoreUtilMonitor DCDataStoreUtilWarningThreshold <Policy not in MP> <Policy not in MP>
VI-VMwareDCDataStoreUtilMonitor Debuglevel <Policy not in MP> <Policy not in MP>
VI-VMwareDCMemoryUtilMonitor DCMemoryUtilCriticalThreshold <Policy not in MP> <Policy not in MP>
VI-VMwareDCMemoryUtilMonitor DCMemoryUtilMajorThreshold <Policy not in MP> <Policy not in MP>
VI-VMwareDCMemoryUtilMonitor DCMemoryUtilMinorThreshold <Policy not in MP> <Policy not in MP>

Evolution Guide Page 207
VI-VMwareDCMemoryUtilMonitor DCMemoryUtilWarningThreshold <Policy not in MP> <Policy not in MP>
VI-VMwareDCMemoryUtilMonitor Debuglevel <Policy not in MP> <Policy not in MP>
VI-VMwareDiskErrorMonitor DiskBusResetCriticalThreshold <Policy not in MP> <Policy not in MP>
VI-VMwareDiskErrorMonitor DiskBusResetMajorThreshold <Policy not in MP> <Policy not in MP>
VI-VMwareDiskErrorMonitor DiskBusResetMinorThreshold <Policy not in MP> <Policy not in MP>
VI-VMwareDiskErrorMonitor DiskBusResetWarningThreshold <Policy not in MP> <Policy not in MP>
VI-VMwareDiskErrorMonitor DiskCommandsAbortedCriticalThreshold <Policy not in MP> <Policy not in MP>
VI-VMwareDiskErrorMonitor DiskCommandsAbortedMajorThreshold <Policy not in MP> <Policy not in MP>
VI-VMwareDiskErrorMonitor DiskCommandsAbortedMinorThreshold <Policy not in MP> <Policy not in MP>
VI-VMwareDiskErrorMonitor DiskCommandsAbortedWarningThreshold <Policy not in MP> <Policy not in MP>
VI-VMwareDiskErrorMonitor MessageGroup <Policy not in MP> <Policy not in MP>
VI-VMwareDiskThroughputMonitor DiskReadThroughputCriticalThreshold <Policy not in MP> <Policy not in MP>
VI-VMwareDiskThroughputMonitor DiskReadThroughputMajorThreshold <Policy not in MP> <Policy not in MP>
VI-VMwareDiskThroughputMonitor DiskReadThroughputMinorThreshold <Policy not in MP> <Policy not in MP>
VI-VMwareDiskThroughputMonitor DiskReadThroughputWarningThreshold <Policy not in MP> <Policy not in MP>
VI-VMwareDiskThroughputMonitor DiskWriteThroughputCriticalThreshold <Policy not in MP> <Policy not in MP>
VI-VMwareDiskThroughputMonitor DiskWriteThroughputMajorThreshold <Policy not in MP> <Policy not in MP>
VI-VMwareDiskThroughputMonitor DiskWriteThroughputMinorThreshold <Policy not in MP> <Policy not in MP>
VI-VMwareDiskThroughputMonitor DiskWriteThroughputWarningThreshold <Policy not in MP> <Policy not in MP>
VI-VMwareDiskThroughputMonitor MessageGroup <Policy not in MP> <Policy not in MP>
VI-VMwareEventMonitor EventSource <Policy not in MP> <Policy not in MP>
VI-VMwareEventMonitor Debug <Policy not in MP> <Policy not in MP>
VI-VMwareEventMonitor MessageGroup <Policy not in MP> <Policy not in MP>
VI-VMWareGuestCPUEntlUtilMonitor-AT CPUEntlUtilCutOff <Policy not in MP> <Policy not in MP>
VI-VMWareGuestCPUEntlUtilMonitor-AT Debug <Policy not in MP> <Policy not in MP>
VI-VMWareGuestCPUEntlUtilMonitor-AT MessageGroup <Policy not in MP> <Policy not in MP>
VI-VMwareHostChassisHealthMonitor Debug <Policy not in MP> <Policy not in MP>
VI-VMwareHostChassisHealthMonitor MessageGroup <Policy not in MP> <Policy not in MP>

Evolution Guide Page 208
VI-VMwareHostDiskUtilization-AT DebugLevel <Policy not in MP> <Policy not in MP>
VI-VMwareHostDiskUtilization-AT MessageGroup <Policy not in MP> <Policy not in MP>
VI-VMwareHostEthernetPortHealthMonitor Debug <Policy not in MP> <Policy not in MP>
VI-VMwareHostEthernetPortHealthMonitor MessageGroup <Policy not in MP> <Policy not in MP>
VI-VMwareHostFanHealthMonitor Debug <Policy not in MP> <Policy not in MP>
VI-VMwareHostFanHealthMonitor MessageGroup <Policy not in MP> <Policy not in MP>
VI-VMwareHostMemoryHealthMonitor HostMemUtilMajorThreshold <Policy not in MP> <Policy not in MP>
VI-VMwareHostMemoryHealthMonitor HostMemUtilMinorThreshold <Policy not in MP> <Policy not in MP>
VI-VMwareHostMemoryHealthMonitor HostMemUtilWarningThreshold <Policy not in MP> <Policy not in MP>
VI-VMwareHostMemoryHealthMonitor UseMemoryHealthMetric <Policy not in MP> <Policy not in MP>
VI-VMwareHostNICMonitor NICByteRateCriticalThreshold <Policy not in MP> <Policy not in MP>
VI-VMwareHostNICMonitor NICByteRateMajorThreshold <Policy not in MP> <Policy not in MP>
VI-VMwareHostNICMonitor NICByteRateMinorThreshold <Policy not in MP> <Policy not in MP>
VI-VMwareHostNICMonitor NICByteRateWarningThreshold <Policy not in MP> <Policy not in MP>
VI-VMwareHostNICMonitor NICPktRateCriticalThreshold <Policy not in MP> <Policy not in MP>
VI-VMwareHostNICMonitor NICPktRateMajorThreshold <Policy not in MP> <Policy not in MP>
VI-VMwareHostNICMonitor NICPktRateMinorThreshold <Policy not in MP> <Policy not in MP>
VI-VMwareHostNICMonitor NICPktRateWarningThreshold <Policy not in MP> <Policy not in MP>
VI-VMwareHostNICMonitor UsePktInfo <Policy not in MP> <Policy not in MP>
VI-VMwareHostNICMonitor MessageGroup <Policy not in MP> <Policy not in MP>
VI-VMwareHostPhysicalMemoryHealthMonitor Debug
<Policy not in MP> <Policy not in MP>
VI-VMwareHostPhysicalMemoryHealthMonitor MessageGroup
<Policy not in MP> <Policy not in MP>
VI-VMwareHostProcessorHealthMonitor Debug <Policy not in MP> <Policy not in MP>
VI-VMwareHostProcessorHealthMonitor MessageGroup <Policy not in MP> <Policy not in MP>
VI-VMwareHostsCPUUtilMonitor HostsCpuUtilCriticalThreshold <Policy not in MP> <Policy not in MP>
VI-VMwareHostsCPUUtilMonitor HostsCpuUtilMajorThreshold <Policy not in MP> <Policy not in MP>
VI-VMwareHostsCPUUtilMonitor HostsCpuUtilMinorThreshold <Policy not in MP> <Policy not in MP>
VI-VMwareHostsCPUUtilMonitor HostsCpuUtilWarningThreshold <Policy not in MP> <Policy not in MP>
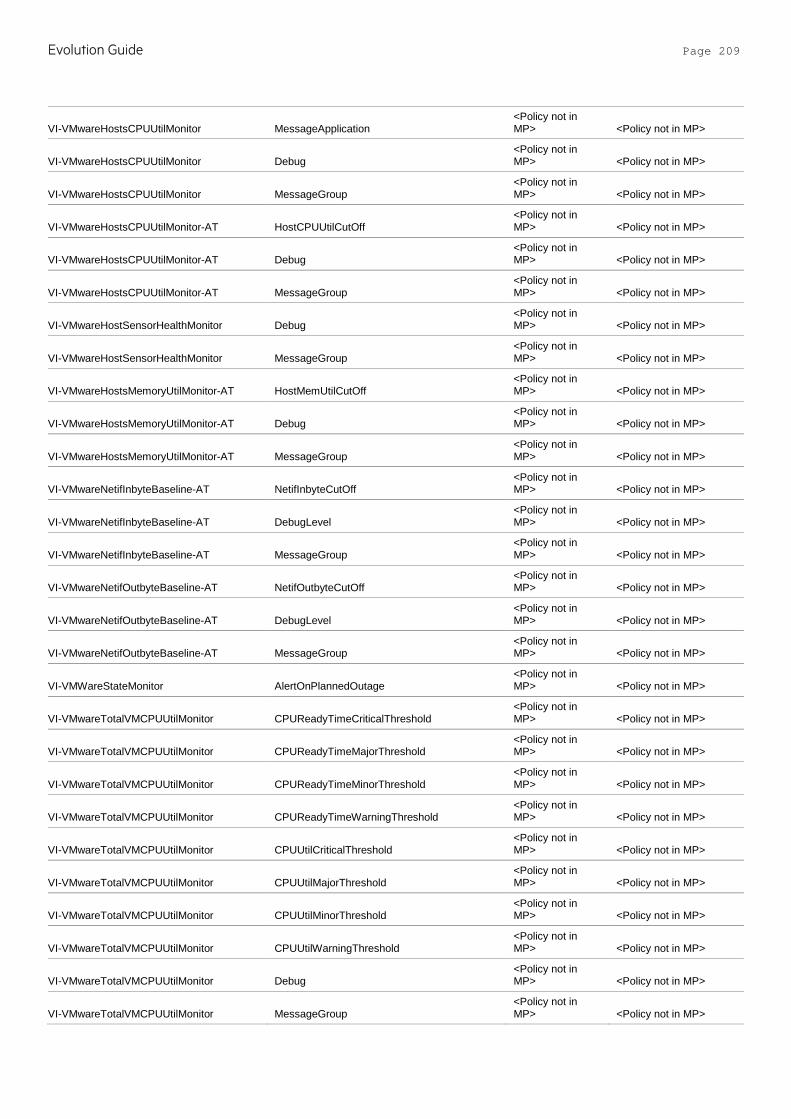
Evolution Guide Page 209
VI-VMwareHostsCPUUtilMonitor MessageApplication <Policy not in MP> <Policy not in MP>
VI-VMwareHostsCPUUtilMonitor Debug <Policy not in MP> <Policy not in MP>
VI-VMwareHostsCPUUtilMonitor MessageGroup <Policy not in MP> <Policy not in MP>
VI-VMwareHostsCPUUtilMonitor-AT HostCPUUtilCutOff <Policy not in MP> <Policy not in MP>
VI-VMwareHostsCPUUtilMonitor-AT Debug <Policy not in MP> <Policy not in MP>
VI-VMwareHostsCPUUtilMonitor-AT MessageGroup <Policy not in MP> <Policy not in MP>
VI-VMwareHostSensorHealthMonitor Debug <Policy not in MP> <Policy not in MP>
VI-VMwareHostSensorHealthMonitor MessageGroup <Policy not in MP> <Policy not in MP>
VI-VMwareHostsMemoryUtilMonitor-AT HostMemUtilCutOff <Policy not in MP> <Policy not in MP>
VI-VMwareHostsMemoryUtilMonitor-AT Debug <Policy not in MP> <Policy not in MP>
VI-VMwareHostsMemoryUtilMonitor-AT MessageGroup <Policy not in MP> <Policy not in MP>
VI-VMwareNetifInbyteBaseline-AT NetifInbyteCutOff <Policy not in MP> <Policy not in MP>
VI-VMwareNetifInbyteBaseline-AT DebugLevel <Policy not in MP> <Policy not in MP>
VI-VMwareNetifInbyteBaseline-AT MessageGroup <Policy not in MP> <Policy not in MP>
VI-VMwareNetifOutbyteBaseline-AT NetifOutbyteCutOff <Policy not in MP> <Policy not in MP>
VI-VMwareNetifOutbyteBaseline-AT DebugLevel <Policy not in MP> <Policy not in MP>
VI-VMwareNetifOutbyteBaseline-AT MessageGroup <Policy not in MP> <Policy not in MP>
VI-VMWareStateMonitor AlertOnPlannedOutage <Policy not in MP> <Policy not in MP>
VI-VMwareTotalVMCPUUtilMonitor CPUReadyTimeCriticalThreshold <Policy not in MP> <Policy not in MP>
VI-VMwareTotalVMCPUUtilMonitor CPUReadyTimeMajorThreshold <Policy not in MP> <Policy not in MP>
VI-VMwareTotalVMCPUUtilMonitor CPUReadyTimeMinorThreshold <Policy not in MP> <Policy not in MP>
VI-VMwareTotalVMCPUUtilMonitor CPUReadyTimeWarningThreshold <Policy not in MP> <Policy not in MP>
VI-VMwareTotalVMCPUUtilMonitor CPUUtilCriticalThreshold <Policy not in MP> <Policy not in MP>
VI-VMwareTotalVMCPUUtilMonitor CPUUtilMajorThreshold <Policy not in MP> <Policy not in MP>
VI-VMwareTotalVMCPUUtilMonitor CPUUtilMinorThreshold <Policy not in MP> <Policy not in MP>
VI-VMwareTotalVMCPUUtilMonitor CPUUtilWarningThreshold <Policy not in MP> <Policy not in MP>
VI-VMwareTotalVMCPUUtilMonitor Debug <Policy not in MP> <Policy not in MP>
VI-VMwareTotalVMCPUUtilMonitor MessageGroup <Policy not in MP> <Policy not in MP>

Evolution Guide Page 210
VI-VMwareTotalVMMemoryUtilMonitor MemUtilCriticalThreshold <Policy not in MP> <Policy not in MP>
VI-VMwareTotalVMMemoryUtilMonitor MemUtilMajorThreshold <Policy not in MP> <Policy not in MP>
VI-VMwareTotalVMMemoryUtilMonitor MemUtilMinorThreshold <Policy not in MP> <Policy not in MP>
VI-VMwareTotalVMMemoryUtilMonitor MemUtilWarningThreshold <Policy not in MP> <Policy not in MP>
VI-VMwareTotalVMMemoryUtilMonitor Debug <Policy not in MP> <Policy not in MP>
VI-VMwareTotalVMMemoryUtilMonitor MessageGroup <Policy not in MP> <Policy not in MP>
VI-VMwareVCDatastoreSpaceUtilizationMonitor DatastoreUtilCriticalThreshold <Not available> <Not available>
VI-VMwareVCDatastoreSpaceUtilizationMonitor DatastoreUtilMajorThreshold
Vmware DataStore Performance
Data Store Utilzation (%)
VI-VMwareVCDatastoreSpaceUtilizationMonitor DatastoreUtilMinorThreshold
VI-VMwareVCDatastoreSpaceUtilizationMonitor DatastoreUtilWarningThreshold
VI-VMwareVCDatastoreSpaceUtilizationMonitor MessageApplication <Not available> <Not available>
VI-VMwareVCDatastoreSpaceUtilizationMonitor Debug <Not available> <Not available>
VI-VMwareVCDatastoreSpaceUtilizationMonitor MessageGroup
Vmware DataStore Performance Message Group
VI-VMwareVCEventMonitor EventSource <Not available> <Not available>
VI-VMwareVCEventMonitor Debug <Not available> <Not available>
VI-VMwareVCEventMonitor MessageGroup Vmware vSphere Events Message Group
VI-VMwareVCGuestLatencyMonitor DiskReadLatencyCriticalThreshold <Not available> <Not available>
VI-VMwareVCGuestLatencyMonitor DiskReadLatencyMajorThreshold Vmware Guest Health
Disk Read Latency for a Guest
VI-VMwareVCGuestLatencyMonitor DiskReadLatencyMinorThreshold
VI-VMwareVCGuestLatencyMonitor DiskReadLatencyWarningThreshold
VI-VMwareVCGuestLatencyMonitor DiskWriteLatencyCriticalThreshold <Not available> <Not available>
VI-VMwareVCGuestLatencyMonitor DiskWriteLatencyMajorThreshold Vmware Guest Health
Disk Write Latency for a Guest
VI-VMwareVCGuestLatencyMonitor DiskWriteLatencyMinorThreshold
VI-VMwareVCGuestLatencyMonitor DiskWriteLatencyWarningThreshold
VI-VMwareVCGuestLatencyMonitor MessageApplication <Not available> <Not available>
VI-VMwareVCGuestLatencyMonitor Debug <Not available> <Not available>
VI-VMwareVCGuestLatencyMonitor MessageGroup Vmware Guest Health Message Group
VI-VMWareVCGuestStateMonitor AlertOnPlannedOutage Vmware Guest Health Alert On Planned Outage
VI-VMwareVCHostCPUSaturationMonitor HighCPUReadyVMCountPercentThreshold <Not available> <Not available>
VI-VMwareVCHostCPUSaturationMonitor HighCPUUtilVMCountPercentThreshold <Not available> <Not available>
VI-VMwareVCHostCPUSaturationMonitor HostCpuUtilCriticalThreshold <Not available> <Not available>
VI-VMwareVCHostCPUSaturationMonitor HostCpuUtilMajorThreshold Vmware Host Health Host CPU Utilization (%)
VI-VMwareVCHostCPUSaturationMonitor HostCpuUtilMinorThreshold
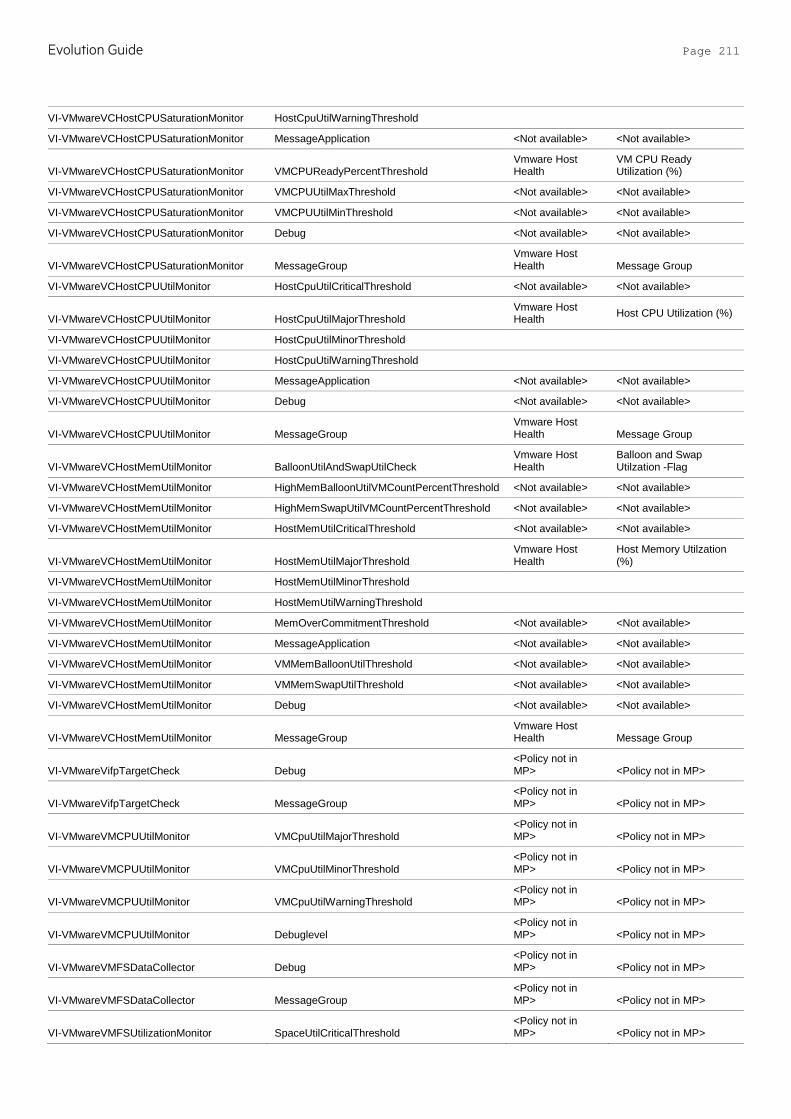
Evolution Guide Page 211
VI-VMwareVCHostCPUSaturationMonitor HostCpuUtilWarningThreshold
VI-VMwareVCHostCPUSaturationMonitor MessageApplication <Not available> <Not available>
VI-VMwareVCHostCPUSaturationMonitor VMCPUReadyPercentThreshold Vmware Host Health
VM CPU Ready Utilization (%)
VI-VMwareVCHostCPUSaturationMonitor VMCPUUtilMaxThreshold <Not available> <Not available>
VI-VMwareVCHostCPUSaturationMonitor VMCPUUtilMinThreshold <Not available> <Not available>
VI-VMwareVCHostCPUSaturationMonitor Debug <Not available> <Not available>
VI-VMwareVCHostCPUSaturationMonitor MessageGroup Vmware Host Health Message Group
VI-VMwareVCHostCPUUtilMonitor HostCpuUtilCriticalThreshold <Not available> <Not available>
VI-VMwareVCHostCPUUtilMonitor HostCpuUtilMajorThreshold Vmware Host Health Host CPU Utilization (%)
VI-VMwareVCHostCPUUtilMonitor HostCpuUtilMinorThreshold
VI-VMwareVCHostCPUUtilMonitor HostCpuUtilWarningThreshold
VI-VMwareVCHostCPUUtilMonitor MessageApplication <Not available> <Not available>
VI-VMwareVCHostCPUUtilMonitor Debug <Not available> <Not available>
VI-VMwareVCHostCPUUtilMonitor MessageGroup Vmware Host Health Message Group
VI-VMwareVCHostMemUtilMonitor BalloonUtilAndSwapUtilCheck Vmware Host Health
Balloon and Swap Utilzation -Flag
VI-VMwareVCHostMemUtilMonitor HighMemBalloonUtilVMCountPercentThreshold <Not available> <Not available>
VI-VMwareVCHostMemUtilMonitor HighMemSwapUtilVMCountPercentThreshold <Not available> <Not available>
VI-VMwareVCHostMemUtilMonitor HostMemUtilCriticalThreshold <Not available> <Not available>
VI-VMwareVCHostMemUtilMonitor HostMemUtilMajorThreshold Vmware Host Health
Host Memory Utilzation (%)
VI-VMwareVCHostMemUtilMonitor HostMemUtilMinorThreshold
VI-VMwareVCHostMemUtilMonitor HostMemUtilWarningThreshold
VI-VMwareVCHostMemUtilMonitor MemOverCommitmentThreshold <Not available> <Not available>
VI-VMwareVCHostMemUtilMonitor MessageApplication <Not available> <Not available>
VI-VMwareVCHostMemUtilMonitor VMMemBalloonUtilThreshold <Not available> <Not available>
VI-VMwareVCHostMemUtilMonitor VMMemSwapUtilThreshold <Not available> <Not available>
VI-VMwareVCHostMemUtilMonitor Debug <Not available> <Not available>
VI-VMwareVCHostMemUtilMonitor MessageGroup Vmware Host Health Message Group
VI-VMwareVifpTargetCheck Debug <Policy not in MP> <Policy not in MP>
VI-VMwareVifpTargetCheck MessageGroup <Policy not in MP> <Policy not in MP>
VI-VMwareVMCPUUtilMonitor VMCpuUtilMajorThreshold <Policy not in MP> <Policy not in MP>
VI-VMwareVMCPUUtilMonitor VMCpuUtilMinorThreshold <Policy not in MP> <Policy not in MP>
VI-VMwareVMCPUUtilMonitor VMCpuUtilWarningThreshold <Policy not in MP> <Policy not in MP>
VI-VMwareVMCPUUtilMonitor Debuglevel <Policy not in MP> <Policy not in MP>
VI-VMwareVMFSDataCollector Debug <Policy not in MP> <Policy not in MP>
VI-VMwareVMFSDataCollector MessageGroup <Policy not in MP> <Policy not in MP>
VI-VMwareVMFSUtilizationMonitor SpaceUtilCriticalThreshold <Policy not in MP> <Policy not in MP>
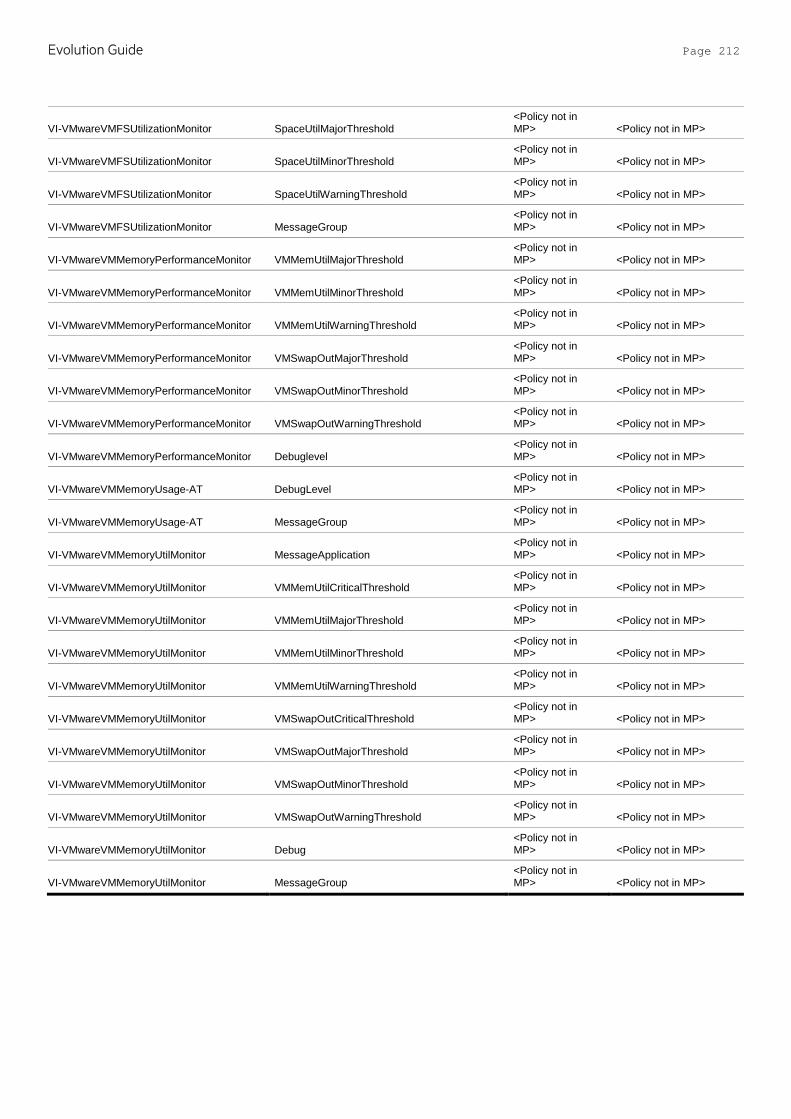
Evolution Guide Page 212
VI-VMwareVMFSUtilizationMonitor SpaceUtilMajorThreshold <Policy not in MP> <Policy not in MP>
VI-VMwareVMFSUtilizationMonitor SpaceUtilMinorThreshold <Policy not in MP> <Policy not in MP>
VI-VMwareVMFSUtilizationMonitor SpaceUtilWarningThreshold <Policy not in MP> <Policy not in MP>
VI-VMwareVMFSUtilizationMonitor MessageGroup <Policy not in MP> <Policy not in MP>
VI-VMwareVMMemoryPerformanceMonitor VMMemUtilMajorThreshold <Policy not in MP> <Policy not in MP>
VI-VMwareVMMemoryPerformanceMonitor VMMemUtilMinorThreshold <Policy not in MP> <Policy not in MP>
VI-VMwareVMMemoryPerformanceMonitor VMMemUtilWarningThreshold <Policy not in MP> <Policy not in MP>
VI-VMwareVMMemoryPerformanceMonitor VMSwapOutMajorThreshold <Policy not in MP> <Policy not in MP>
VI-VMwareVMMemoryPerformanceMonitor VMSwapOutMinorThreshold <Policy not in MP> <Policy not in MP>
VI-VMwareVMMemoryPerformanceMonitor VMSwapOutWarningThreshold <Policy not in MP> <Policy not in MP>
VI-VMwareVMMemoryPerformanceMonitor Debuglevel <Policy not in MP> <Policy not in MP>
VI-VMwareVMMemoryUsage-AT DebugLevel <Policy not in MP> <Policy not in MP>
VI-VMwareVMMemoryUsage-AT MessageGroup <Policy not in MP> <Policy not in MP>
VI-VMwareVMMemoryUtilMonitor MessageApplication <Policy not in MP> <Policy not in MP>
VI-VMwareVMMemoryUtilMonitor VMMemUtilCriticalThreshold <Policy not in MP> <Policy not in MP>
VI-VMwareVMMemoryUtilMonitor VMMemUtilMajorThreshold <Policy not in MP> <Policy not in MP>
VI-VMwareVMMemoryUtilMonitor VMMemUtilMinorThreshold <Policy not in MP> <Policy not in MP>
VI-VMwareVMMemoryUtilMonitor VMMemUtilWarningThreshold <Policy not in MP> <Policy not in MP>
VI-VMwareVMMemoryUtilMonitor VMSwapOutCriticalThreshold <Policy not in MP> <Policy not in MP>
VI-VMwareVMMemoryUtilMonitor VMSwapOutMajorThreshold <Policy not in MP> <Policy not in MP>
VI-VMwareVMMemoryUtilMonitor VMSwapOutMinorThreshold <Policy not in MP> <Policy not in MP>
VI-VMwareVMMemoryUtilMonitor VMSwapOutWarningThreshold <Policy not in MP> <Policy not in MP>
VI-VMwareVMMemoryUtilMonitor Debug <Policy not in MP> <Policy not in MP>
VI-VMwareVMMemoryUtilMonitor MessageGroup <Policy not in MP> <Policy not in MP>
Document type
© Copyright 2016 Hewlett Packard Enterprise Development LP. The information contained herein is subject to change without notice. The only warranties for Hewlett Packard Enterprise products and services are set forth in the express warranty statements accompanying such products and services. Nothing herein should be construed as constituting an additional warranty. Hewlett Packard Enterprise shall not be liable for technical or editorial errors or omissions contained herein.
This document contains confidential and/or legally privileged information. It is intended for Hewlett Packard Enterprise and Channel Partner Internal Use only. If you are not an intended recipient as identified on the front cover of this document, you are strictly prohibited from reviewing, redistributing, disseminating, or in any other way using or relying on the contents of this document.
September 2016
Useful resources • OMi try-now webpage
http://www8.hp.com/us/en/software-solutions/operations-manager-i-operations-management/try-now.html
• My software updates
https://h20575.www2.hpe.com/usbportal/softwareupdate.do
Send documentation feedback If you have comments about this document, you can contact the documentation team by email. If an email client is configured on this system, click the link above and an email window opens with the following information in the subject line:
Feedback on Evolution Guide (OMi Management Pack)
Just add your feedback to the email and click send.
If no email client is available, copy the information above to a new message in a web mail client, and send your feedback to [email protected].
We appreciate your feedback!
Related Documents