arXiv:astro-ph/9711272v1 22 Nov 1997 Ω M AND THE CNOC SURVEYS R.G. CARLBERG, H.K.C. YEE, H. LIN, M. SAWICKI, C.W. SHEPHERD, Department of Astronomy, University of Toronto, Toronto, ON, M5S 3H8, Canada E. ELLINGSON Center for Astrophysics & Space Astronomy, University of Colorado, CO 80309, USA S.L. MORRIS, D. SCHADE, J.E. HESSER, J. B. HUTCHINGS, J. B. OKE National Research Council of Canada, Herzberg Institute of Astrophysics, Dominion Astrophysical Observatory, Victoria, BC, V8X 4M6, Canada D. PATTON, G. WIRTH, M. BALOGH, F.D.A. HARTWICK, C. J. PRITCHET Department of Physics and Astronomy, University of Victoria, Victoria, BC, V8W 3P6, Canada R. ABRAHAM Institute of Astronomy, Madingley Road, Cambridge CB3 0HA, UK T. SMECKER-HANE Department of Physics & Astronomy, University of California, Irvine, CA 92717, USA The CNOC1 cluster survey measures Ω M via Oort’s method, Ω M ≡ M/L × j/ρc, where M/L is the field mass-to-light ratio, j is the field luminosity density and ρc is the closure density. A wide range of potential systematic effects are explicitly controlled by independently deriving the mean cluster mass profile (finding good agreement with theoretical predictions), the cluster light profile, the redshift evo- lution of both cluster and field galaxies, the differential evolution between the two, and the field and cluster efficiencies for the conversion of baryons into galaxies. We conclude that Ω M =0.19 ± 0.06 where the errors are objectively evaluated via resampling methods. The redshift evolution of the numbers of clusters per unit co- moving volume over the 0 ≤ z ≤ 0.6 range is found to be very slow, as is required for consistency with a low density universe. The evolution of galaxy clustering in the field is compatible with a low density universe, and strongly disfavors models of galaxy evolution that associate low density halos with individual galaxies. 1 The Mean Mass Density of the Universe In the Friedmann-Robertson-Walker solution for the structure of the universe the geometry and future of the expansion uniquely depend on the mean mass density, ρ 0 , and a non-zero cosmological constant. It is a statement of arith- metic 25 that Ω M ≡ ρ 0 /ρ c = M/L × j/ρ c , where M/L is the average mass- to-light ratio of the universe and ρ c /j is the closure mass-to-light ratio, with 1

Welcome message from author
This document is posted to help you gain knowledge. Please leave a comment to let me know what you think about it! Share it to your friends and learn new things together.
Transcript

arX
iv:a
stro
-ph/
9711
272v
1 2
2 N
ov 1
997
ΩM AND THE CNOC SURVEYS
R.G. CARLBERG, H.K.C. YEE, H. LIN, M. SAWICKI, C.W. SHEPHERD,
Department of Astronomy, University of Toronto, Toronto, ON, M5S 3H8, Canada
E. ELLINGSON
Center for Astrophysics & Space Astronomy, University of Colorado, CO 80309,
USA
S.L. MORRIS, D. SCHADE, J.E. HESSER, J. B. HUTCHINGS, J. B. OKE
National Research Council of Canada, Herzberg Institute of Astrophysics, Dominion
Astrophysical Observatory, Victoria, BC, V8X 4M6, Canada
D. PATTON, G. WIRTH, M. BALOGH, F.D.A. HARTWICK, C. J. PRITCHET
Department of Physics and Astronomy, University of Victoria, Victoria, BC,
V8W 3P6, Canada
R. ABRAHAM
Institute of Astronomy, Madingley Road, Cambridge CB3 0HA, UK
T. SMECKER-HANE
Department of Physics & Astronomy, University of California, Irvine, CA 92717,
USA
The CNOC1 cluster survey measures ΩM via Oort’s method, ΩM ≡ M/L × j/ρc,where M/L is the field mass-to-light ratio, j is the field luminosity density and ρc
is the closure density. A wide range of potential systematic effects are explicitlycontrolled by independently deriving the mean cluster mass profile (finding goodagreement with theoretical predictions), the cluster light profile, the redshift evo-lution of both cluster and field galaxies, the differential evolution between the two,and the field and cluster efficiencies for the conversion of baryons into galaxies.We conclude that ΩM = 0.19± 0.06 where the errors are objectively evaluated viaresampling methods. The redshift evolution of the numbers of clusters per unit co-moving volume over the 0 ≤ z ≤ 0.6 range is found to be very slow, as is requiredfor consistency with a low density universe. The evolution of galaxy clustering inthe field is compatible with a low density universe, and strongly disfavors modelsof galaxy evolution that associate low density halos with individual galaxies.
1 The Mean Mass Density of the Universe
In the Friedmann-Robertson-Walker solution for the structure of the universethe geometry and future of the expansion uniquely depend on the mean massdensity, ρ0, and a non-zero cosmological constant. It is a statement of arith-metic25 that ΩM ≡ ρ0/ρc = M/L × j/ρc, where M/L is the average mass-to-light ratio of the universe and ρc/j is the closure mass-to-light ratio, with
1

j being the luminosity density of the universe. Estimates of the value of ΩM
have a long history with a substantial range of cited results2. Both the “Dickecoincidence” and inflationary cosmology would suggest that ΩM = 1. Themain thrust of our survey is to clearly discriminate between ΩM = 1 and theclassical, possibly biased, indicators that ΩM ≃ 0.2.
Rich galaxy clusters are the largest collapsed regions in the universe andare ideal to make an estimate of the cluster M/L which can be correctedto the value which should apply to the field as a whole. To use clusters toestimate self-consistently the global ΩM we must, as a minimum, perform fouroperations.• Measure the total gravitational mass within some radius.• Sum the luminosities of the visible galaxies within the same radius.• Measure the luminosity density in the field of an identically defined galaxy
sample.• Account (and ideally physically understand) the differential luminosity and
density evolution between the clusters and the field.The Canadian Network for Observational Cosmology (CNOC) designed
observations to make a conclusive measurement of ΩM using clusters. Theclusters are selected from the X-ray surveys, primarily the Einstein MediumSensitivity Survey18,20,17, which has a well defined flux-volume relation. Thespectroscopic sample, roughly one in two on the average, is drawn from aphotometric sample which goes nearly 2 magnitudes deeper, thereby allowingan accurate measurement of the selection function. The sample contains 16clusters spread from redshift 0.18 to 0.55, meaning that evolutionary effectsare readily visible, and any mistakes in differential corrections should be morereadily detectable. For each cluster, galaxies are sampled all the way fromcluster cores to the distant field. This allows testing the accuracy of the virialmass estimator and the understanding of the differential evolution process.We introduce some improvements to the classical estimates of the velocitydispersion and virial radius estimators, which have somewhat better statisticalproperties. A critical element is to assess the errors in these measurements.The random errors are relatively straightforward and are evaluated using eitherthe statistical jacknife or bootstrap methods16. These resampling methods arecompletely objective and follow the entire complex chain of analysis beginningfrom the input catalogues to the result.
As a result of these measurements and tests we find that ΩM = 0.19±0.06,which is the formal 1σ error. In deriving this result we apply a variety ofcorrections and tests of the assumptions.• The clusters have statistically identical M/L values, once corrected for evo-
lution7.
2
• Cluster and field galaxies are evolving at a comparable rate with redshift,approximately one magnitude per unit redshift.
• Cluster galaxies exhibit no excess in their star formation with respect to thefield1,3. On the average they are faded between 0.1 and 0.3 magnitudeswith respect to luminous field galaxies8,22.
• The virial mass overestimates the true mass of a cluster by about 15%,which can be attributed to the neglect of the surface term in the virialequation8.
• There is no significant change of M/L with radius within the cluster8.• The mass field of the clusters is remarkably well described by the NFW24
profile, both in shape and scale radius11.• The evolution of the number of clusters per unit volume is very slow, in
accord with the PS27 predictions for a low density universe9.• The clusters have statistically identical efficiencies of converting gas into
stars, which is identical to the value in the field12.These results rule out ΩM = 1 in any component with a velocity dispersion
less than about 1000 km s−1.
2 The Future of Clusters as Cosmological Indicators
The dark matter distribution within clusters is now quite well understood andthe differential of field and cluster galaxies is becoming well observed and tosome degree understood. With much larger samples it will be possible to moretightly constrain many cosmological quantities. Of particular interest is thatΩΛ can be measured via the redshift dependence of the M/L× j/ρc indicator,being nearly a 50% change from redshift zero to unity. The main compli-cation is to make sure that differential field-to-cluster evolution is accuratelymeasured and physically well understood at a somewhat better level of preci-sion. Statistically this is not a problem, since the survey will contain sufficientgalaxies in both cluster and field to make the measurement. Straightforwardsimulations show6 that it is statistically possible to measure ΩΛ with a sampleof 30 or so clusters distributed over the 0 ≤ z ≤ 1 range. With a sample of 200to 300 clusters over this range it will be possible to measure the Ω parametersto an accuracy of better than 10%, as well as developing an impressive sampleof both field and cluster galaxies.
3 Slow Structure evolution for ΩM = 0.2
A low density universe “freezes out” structure at redshift26 z ≃ Ω−1M with
relatively slow growth in clustering after that. This allows a test of both thevalue of ΩM and the understanding of the relation between the clustering of
3
dark matter and the galaxies that we observe. The measurements of clusteringcan be conveniently approximated at a level appropriate for existing data by adouble power law19,21 in pairwise separation (measured in physical or properlengths) and in 1 + z.
ξ(r|z) =
(
r
r0
)
−γ
(1 + z)−(3+ǫ). (1)
The (1+z)−3 dilution of the correlation function is simply a result of the changeof the background density of the universe with redshift. At low redshift15,23
γ ≃ 1.7 − 1.8. Very crudely, there are three “interesting” value of ǫ.• ǫ ≃ 0 for a low density, e.g. ΩM ≃ 0.2, universe,• ǫ ≃ −1 for a high density, ΩM = 1, universe,• ǫ ≃ 1 for low overdensity, 〈ρ〉 ≃ 200ρc, dark halos.The last possibility is interesting since a number of “semi-analytic” modelsof galaxy formation identify galaxies with these objects, partly because theycan be counted using the Press-Schechter formula. The correlation proper-ties of halos depend on the details5,4, but to a rough approximation the lowoverdensity halos cluster with a correlation length that is fixed in co-movingco-ordinates.
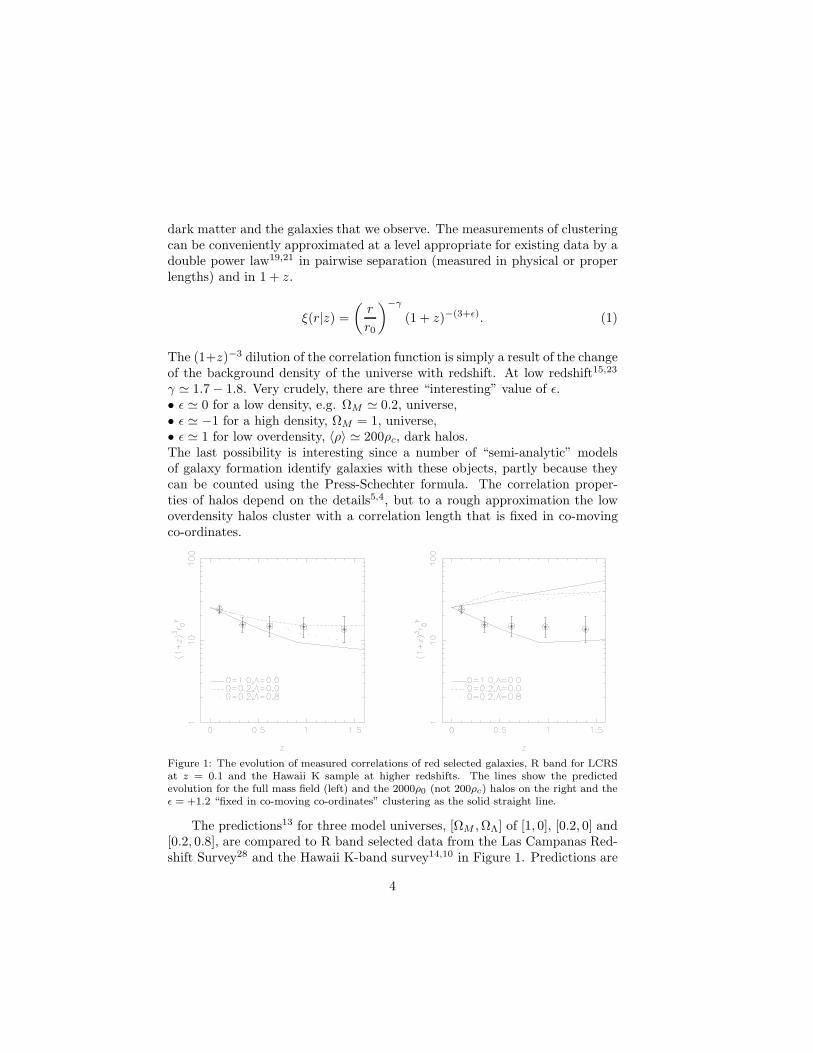
Figure 1: The evolution of measured correlations of red selected galaxies, R band for LCRSat z = 0.1 and the Hawaii K sample at higher redshifts. The lines show the predictedevolution for the full mass field (left) and the 2000ρ0 (not 200ρc) halos on the right and theǫ = +1.2 “fixed in co-moving co-ordinates” clustering as the solid straight line.
The predictions13 for three model universes, [ΩM , ΩΛ] of [1, 0], [0.2, 0] and[0.2, 0.8], are compared to R band selected data from the Las Campanas Red-shift Survey28 and the Hawaii K-band survey14,10 in Figure 1. Predictions are
4
made for both “galaxies-trace-mass” and for “dark halos-trace-mass” galaxyidentification schemes. Red selected galaxies are used because they are foundto be more reliable tracers of the mass distribution in the cluster survey, asexpected on the basis of a reduced sensitivity in the redder pass bands to thehistory of star formation. However in detail the question of how galaxies tracethe mass distribution remains open to investigation and is a major motivatingfactor in the CNOC2 survey of galaxies in the field. The major conclusionto be drawn from Figure 1 is that low overdensity halos, or any other objectwhich clusters in such a way that its correlations remain roughly constantin co-moving co-ordinates, are in conflict with the available measurements ofclustering evolution.
4 The CNOC2 Field Survey
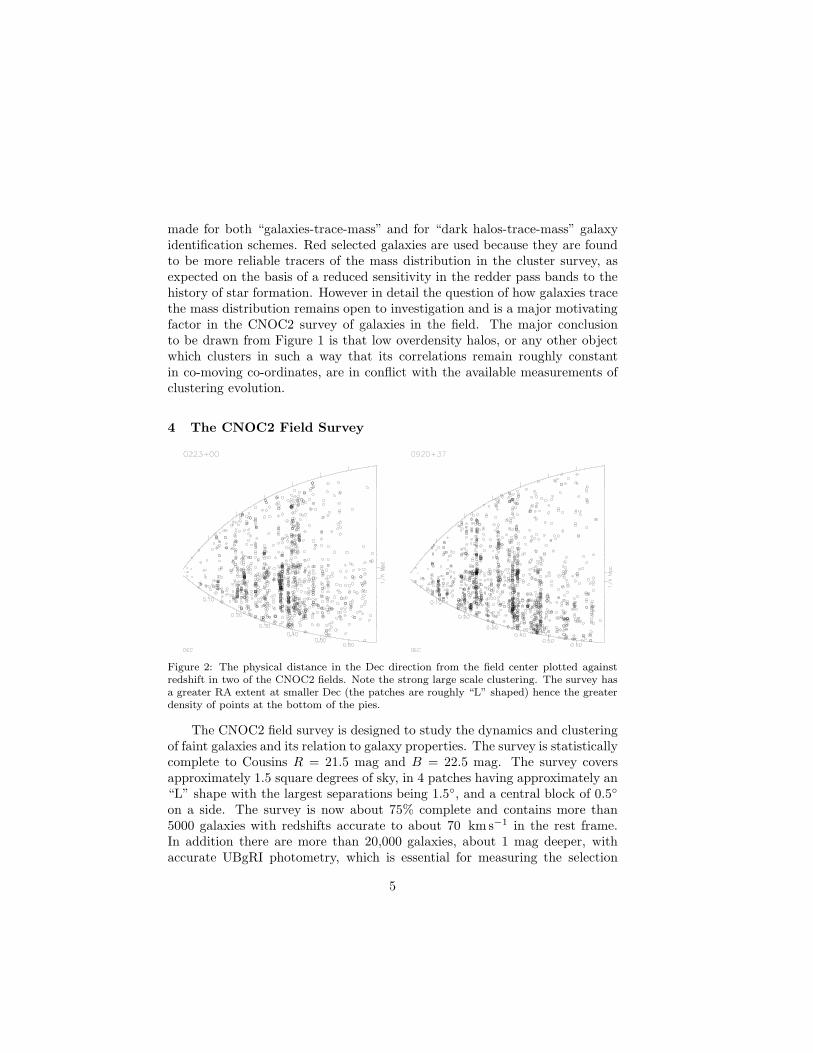
Figure 2: The physical distance in the Dec direction from the field center plotted againstredshift in two of the CNOC2 fields. Note the strong large scale clustering. The survey hasa greater RA extent at smaller Dec (the patches are roughly “L” shaped) hence the greaterdensity of points at the bottom of the pies.
The CNOC2 field survey is designed to study the dynamics and clusteringof faint galaxies and its relation to galaxy properties. The survey is statisticallycomplete to Cousins R = 21.5 mag and B = 22.5 mag. The survey coversapproximately 1.5 square degrees of sky, in 4 patches having approximately an“L” shape with the largest separations being 1.5, and a central block of 0.5
on a side. The survey is now about 75% complete and contains more than5000 galaxies with redshifts accurate to about 70 km s−1 in the rest frame.In addition there are more than 20,000 galaxies, about 1 mag deeper, withaccurate UBgRI photometry, which is essential for measuring the selection
5
function and understanding galaxy evolution.
Acknowledgments
This research was supported by NSERC and NRC of Canada. We thank theCanadian TAC of CFHT for a generous allocation of telescope time.
References
1. Abraham, R. G., Smecker-Hane, T. A., Hutchings, J. B., Carlberg, R.G., Yee, H. K. C., Ellingson, E., Morris, S. L., Oke, J. B., & Rigler, M.1996, ApJ, 471, 694
2. Bahcall, N. A., Lubin, L. M., & Dorman, V. 1995, ApJ(Lett), 447, L813. Balogh, M. L., Morris, S. L., Yee, H. K. C., Carlberg, R. G., & Ellingson,
E. 1997, ApJ 488, L754. Brainerd, T. G. & Villumsen, J. V. 1994, ApJ, 431, 4775. Carlberg, R. G. 1991, ApJ, 367, 3856. Carlberg, R. G. 1997, ApJ, submitted (astroph/9708054)7. Carlberg, R. G., Yee, H. K. C., Ellingson, E., Abraham, R., Gravel, P.,
Morris, S. L., & Pritchet, C. J. 1996, ApJ, 462, 328. Carlberg, R. G., Yee, H. K. C., & Ellingson, E. 1997, ApJ, 478, 4629. Carlberg, R. G., Morris, S. L., Yee, H. K. C., & Ellingson, E. 1997b,
ApJ(Lett), 479, L1910. Carlberg, R. G., Cowie, L., L., Songaila, A., & Hu, E. M. 1997, ApJ, 53811. Carlberg, R. G., Yee, H. K. C., Ellingson, E., Morris, S. L., Abraham,
R., Gravel, P., Pritchet, C. J., Smecker-Hane, T., Hartwick, F. D. A.,Hesser, J. E., Hutchings, J. B., & Oke, J. B. 1997, ApJ(Lett), 485, L13
12. Carlberg, R. G., Yee, H. K. C., Ellingson, E., Morris, S. L., Abraham,R., Gravel, P., Pritchet, C. J., Smecker-Hane, T., Hartwick, F. D. A.,Hesser, J. E., Hutchings, J. B., & Oke, J. B. 1997, ApJ, submitted
13. Colin, P., Carlberg, R. G., & Couchman, H. M. P. 1997, ApJ, in press14. Cowie, L, L., Songaila, A. Hu, E. M., & Cohen, J. G. 1996, AJ, 112, 83915. Davis, M. & Peebles, P. J. E. 1983, ApJ, 267, 46516. Efron, B. & Tibshirani, R. 1986, Statistical Science, 1, 5417. Gioia, I. M. & Luppino, G. A. 1994, ApJS, 94, 58318. Gioia, I. M., Maccacaro, T., Schild, R. E., Wolter, Stocke, J. T., Morris,
S. L., & Henry, J. P. 1990, ApJS, 72, 56719. Groth, E. J. & Peebles, P. J. E. 1977, ApJ, 217, 38520. Henry, J. P., Gioia, I. M., Maccacaro, T., Morris, S. L., Stocke, J. T., &
Wolter, A. 1992, ApJ, 386, 40821. Koo, D. C. & Szalay, A. S. 1984, ApJ, 282, 390
6

22. Lin, H., Yee., H. K. C., Carlberg, R. G., & Ellingson, E. 1997, ApJ, 475,494
23. Loveday, J., Maddox, S. J., Efstathiou, G., & Peterson, B. A. 1995, ApJ,442, 457
24. Navarro, J. F., Frenk, C. S. & White, S. D. M. 1997, ApJ, submitted(astro-ph/9611107, NFW)
25. Oort, J. H. 1958, in La Structure et L’Evolution de L’Univers, OnziemeConseil de Physique, ed. R. Stoops (Solvay: Bruxelles) p. 163
26. Peebles, P. J. E. 1980, Large Scale Structure of the Universe (PrincetonUniversity Press: Princeton)
27. Press, W. H. & Schechter, P. 1974, ApJ, 187, 42528. Tucker, D. L. 1994, Ph. D. thesis, Yale University and personal commu-
nication29. Yee, H. K. C., Ellingson, E. & Carlberg, R. G. 1996, ApJS, 102, 269
7
Related Documents


