PRIVILEGED February 28, 2020 Omega Engineering LLC and Mr. Oscar Rivera v. Republic of Panama Pablo D. López Zadicoff Direct Presentation

Welcome message from author
This document is posted to help you gain knowledge. Please leave a comment to let me know what you think about it! Share it to your friends and learn new things together.
Transcript

PRIVILEGED
February 28, 2020
Omega Engineering LLC and Mr. Oscar Rivera v.Republic of Panama
Pablo D. López ZadicoffDirect Presentation
CONTENTS
Privileged & Confidential
I. Valuation PurposeII. Claimants’ Losses on New ContractsIII. Claimants’ Losses on Existing ContractsIV. Conclusions
2

Privileged & Confidential
I. Valuation Purpose
Privileged & Confidential4
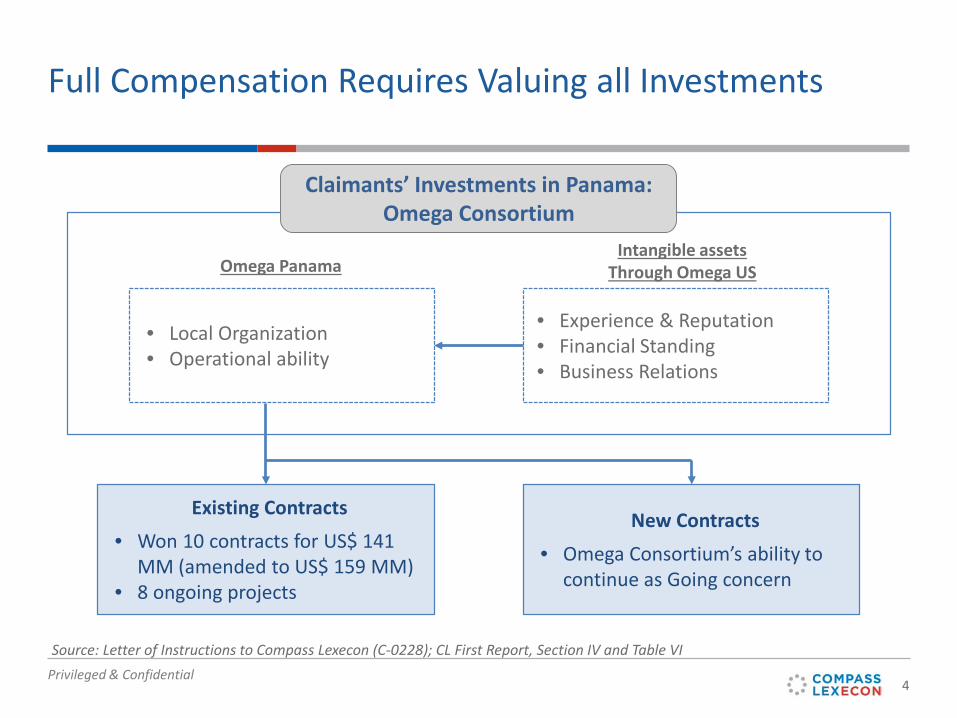
Full Compensation Requires Valuing all Investments
Claimants’ Investments in Panama: Omega Consortium
• Local Organization• Operational ability
• Experience & Reputation• Financial Standing• Business Relations
Omega PanamaIntangible assets
Through Omega US
New Contracts• Omega Consortium’s ability to
continue as Going concern
Existing Contracts• Won 10 contracts for US$ 141
MM (amended to US$ 159 MM)• 8 ongoing projects
Source: Letter of Instructions to Compass Lexecon (C-0228); CL First Report, Section IV and Table VI
Privileged & Confidential5
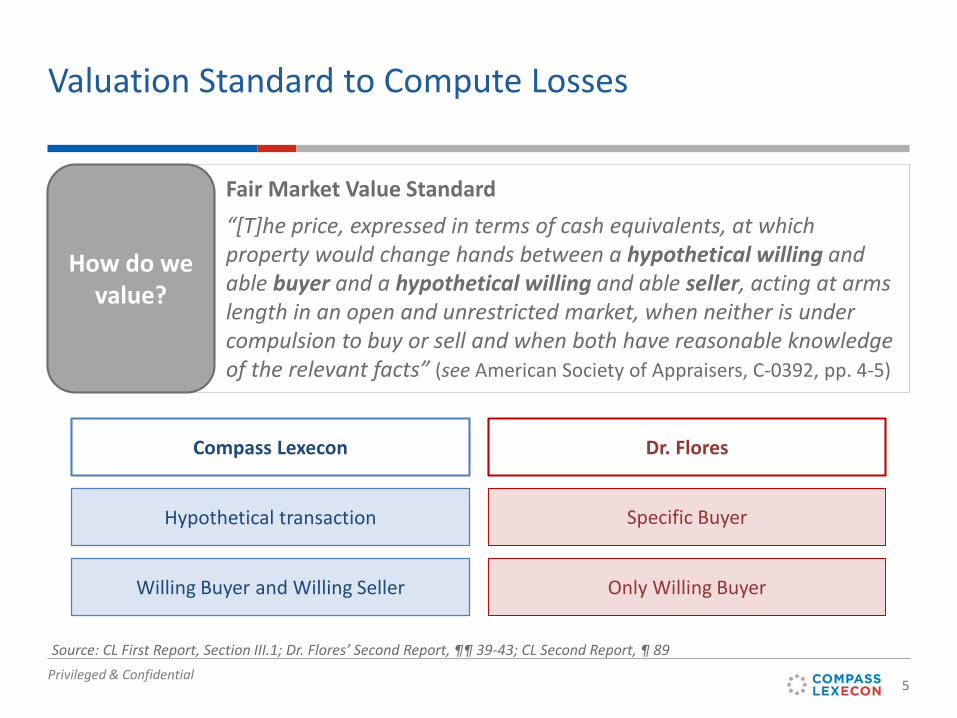
Valuation Standard to Compute Losses
Fair Market Value Standard“[T]he price, expressed in terms of cash equivalents, at which property would change hands between a hypothetical willing and able buyer and a hypothetical willing and able seller, acting at arms length in an open and unrestricted market, when neither is under compulsion to buy or sell and when both have reasonable knowledge of the relevant facts” (see American Society of Appraisers, C-0392, pp. 4-5)
How do we value?
Dr. FloresCompass Lexecon
Willing Buyer and Willing Seller Only Willing Buyer
Hypothetical transaction Specific Buyer
Source: CL First Report, Section III.1; Dr. Flores’ Second Report, ¶¶ 39-43; CL Second Report, ¶ 89
Privileged & Confidential
II. Losses on New Contracts
Privileged & Confidential7
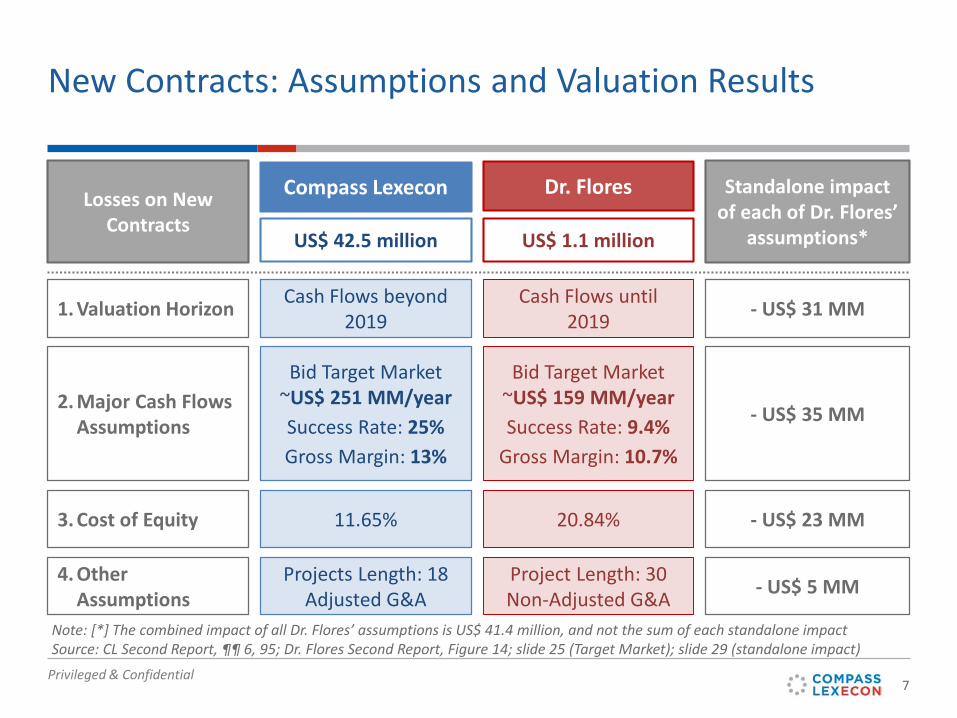
New Contracts: Assumptions and Valuation Results
Dr. FloresCompass Lexecon
1. Valuation Horizon
2. Major Cash Flows Assumptions
Losses on New Contracts
4. Other Assumptions
3. Cost of Equity
US$ 42.5 million US$ 1.1 million
Cash Flows beyond2019
Cash Flows until2019
Bid Target Market~US$ 159 MM/yearSuccess Rate: 9.4%
Gross Margin: 10.7%
Bid Target Market~US$ 251 MM/yearSuccess Rate: 25%Gross Margin: 13%
Projects Length: 18 Adjusted G&A
Project Length: 30Non-Adjusted G&A
11.65% 20.84%
Standalone impact of each of Dr. Flores’
assumptions*
- US$ 31 MM
- US$ 35 MM
- US$ 23 MM
- US$ 5 MM
Note: [*] The combined impact of all Dr. Flores’ assumptions is US$ 41.4 million, and not the sum of each standalone impactSource: CL Second Report, ¶¶ 6, 95; Dr. Flores Second Report, Figure 14; slide 25 (Target Market); slide 29 (standalone impact)
Privileged & Confidential8
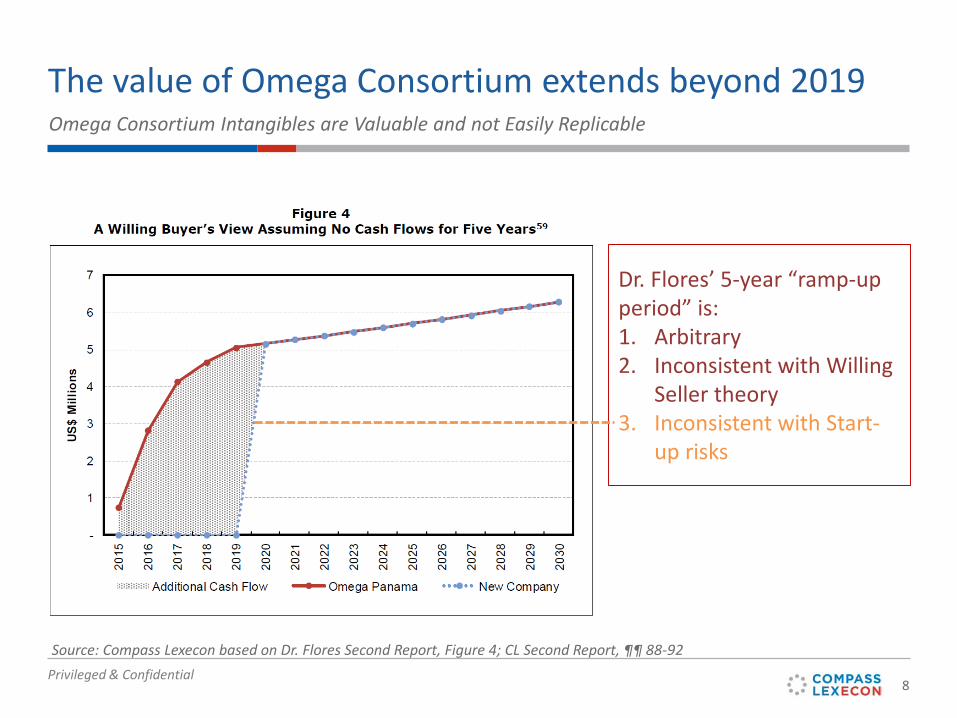
The value of Omega Consortium extends beyond 2019Omega Consortium Intangibles are Valuable and not Easily Replicable
Dr. Flores’ 5-year “ramp-up period” is:1. Arbitrary 2. Inconsistent with Willing
Seller theory3. Inconsistent with Start-
up risks
Source: Compass Lexecon based on Dr. Flores Second Report, Figure 4; CL Second Report, ¶¶ 88-92
Privileged & Confidential9
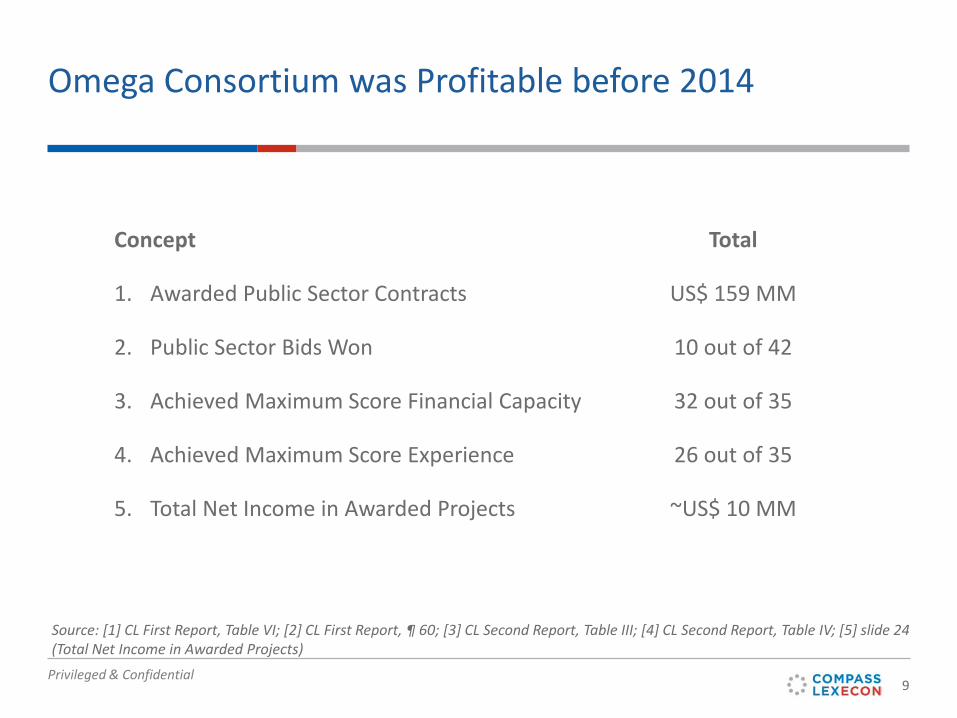
Omega Consortium was Profitable before 2014
Source: [1] CL First Report, Table VI; [2] CL First Report, ¶ 60; [3] CL Second Report, Table III; [4] CL Second Report, Table IV; [5] slide 24 (Total Net Income in Awarded Projects)
Concept Total
1. Awarded Public Sector Contracts US$ 159 MM
2. Public Sector Bids Won 10 out of 42
3. Achieved Maximum Score Financial Capacity 32 out of 35
4. Achieved Maximum Score Experience 26 out of 35
5. Total Net Income in Awarded Projects ~US$ 10 MM
Privileged & Confidential10
209230
155 160
517
674
101133
166 184 193
0
100
200
300
400
500
600
700
800
2010 2011 2012 2013 2014 2015 2016
Mar
ket S
ize fo
r the
Om
ega
Cons
ortiu
m(U
S$ m
illio
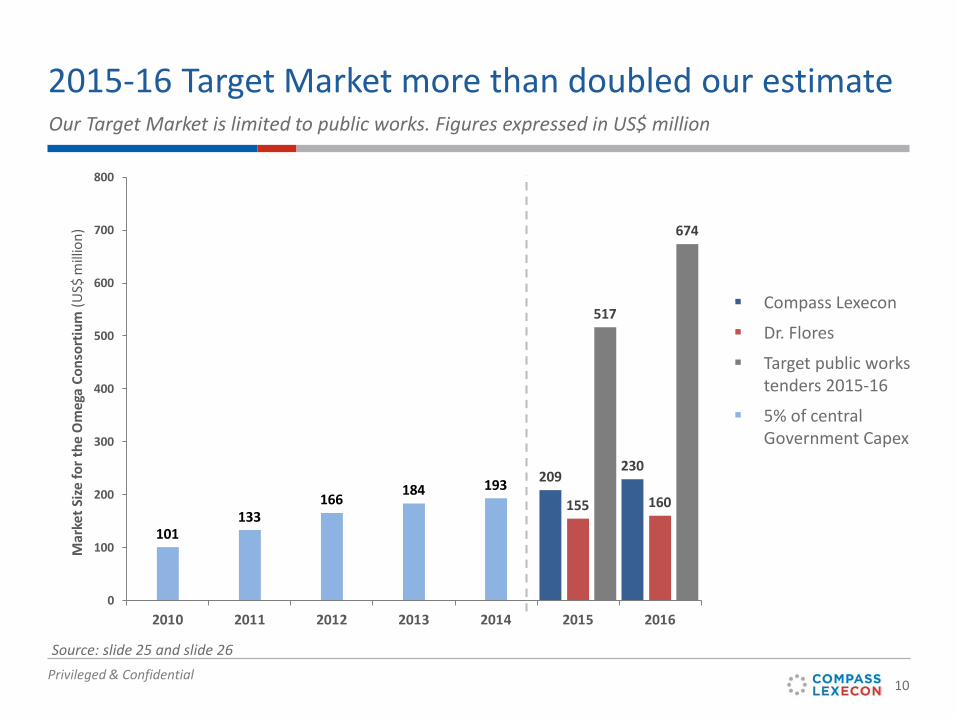
n)2015-16 Target Market more than doubled our estimateOur Target Market is limited to public works. Figures expressed in US$ million
Source: slide 25 and slide 26
Compass Lexecon
Dr. Flores
Target public works tenders 2015-16
5% of central Government Capex
Privileged & Confidential11
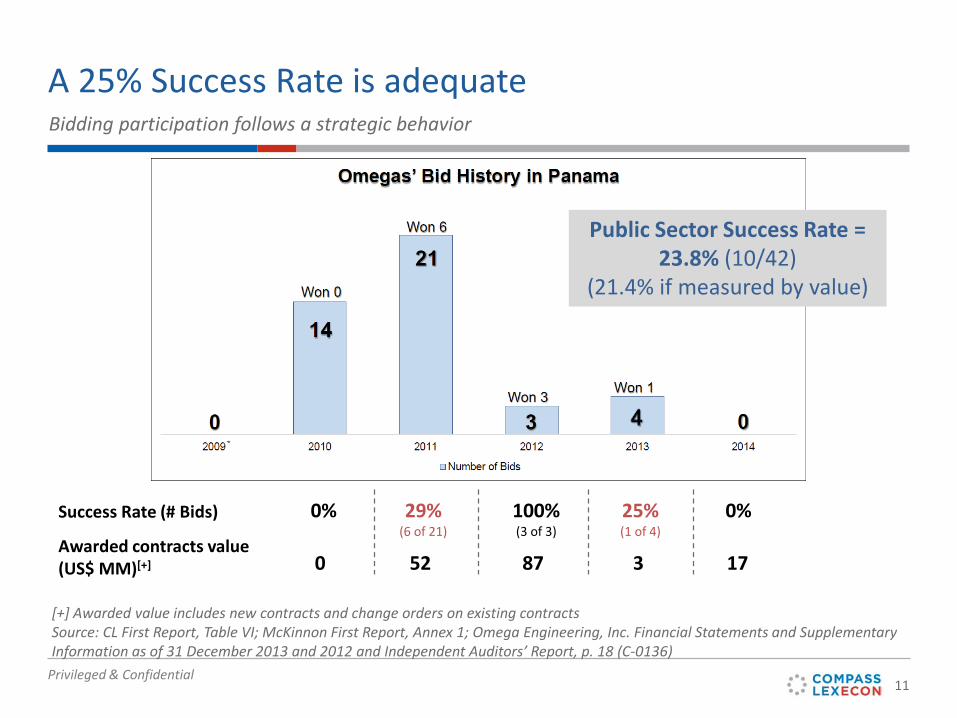
A 25% Success Rate is adequateBidding participation follows a strategic behavior
Public Sector Success Rate = 23.8% (10/42)
(21.4% if measured by value)
52Awarded contracts value (US$ MM)[+] 87 3 170
[+] Awarded value includes new contracts and change orders on existing contractsSource: CL First Report, Table VI; McKinnon First Report, Annex 1; Omega Engineering, Inc. Financial Statements and Supplementary Information as of 31 December 2013 and 2012 and Independent Auditors’ Report, p. 18 (C-0136)
Success Rate (# Bids) 0% 29% (6 of 21)
100% (3 of 3)
25% (1 of 4)
0%
Privileged & Confidential12
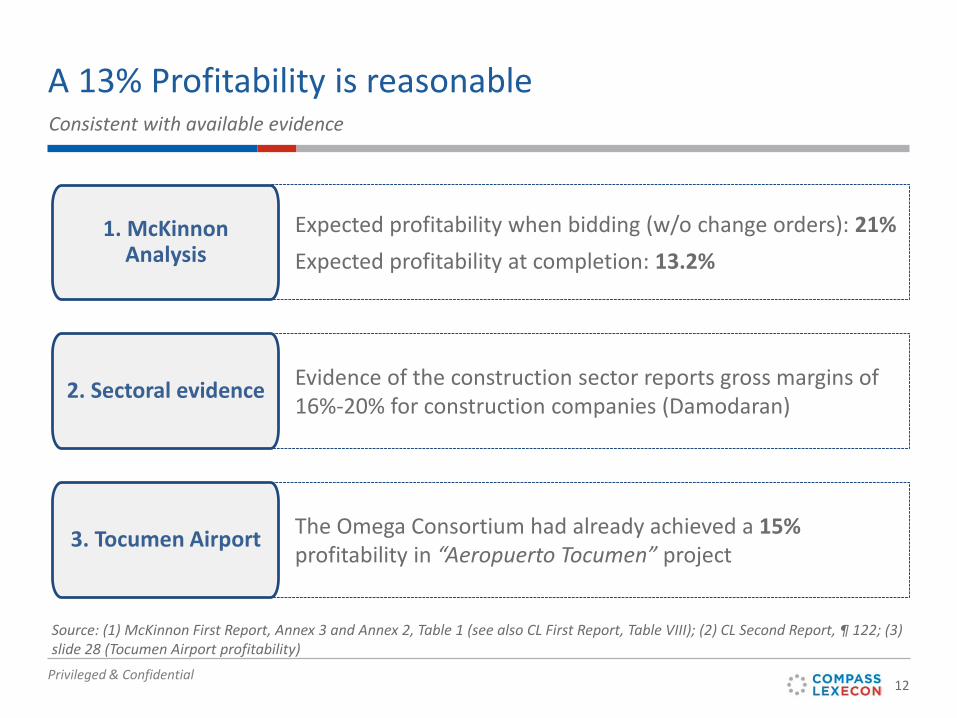
A 13% Profitability is reasonable
Evidence of the construction sector reports gross margins of 16%-20% for construction companies (Damodaran)
The Omega Consortium had already achieved a 15%profitability in “Aeropuerto Tocumen” project
Expected profitability when bidding (w/o change orders): 21%Expected profitability at completion: 13.2%
3. Tocumen Airport
1. McKinnon Analysis
2. Sectoral evidence
Source: (1) McKinnon First Report, Annex 3 and Annex 2, Table 1 (see also CL First Report, Table VIII); (2) CL Second Report, ¶ 122; (3) slide 28 (Tocumen Airport profitability)
Consistent with available evidence
Privileged & Confidential13
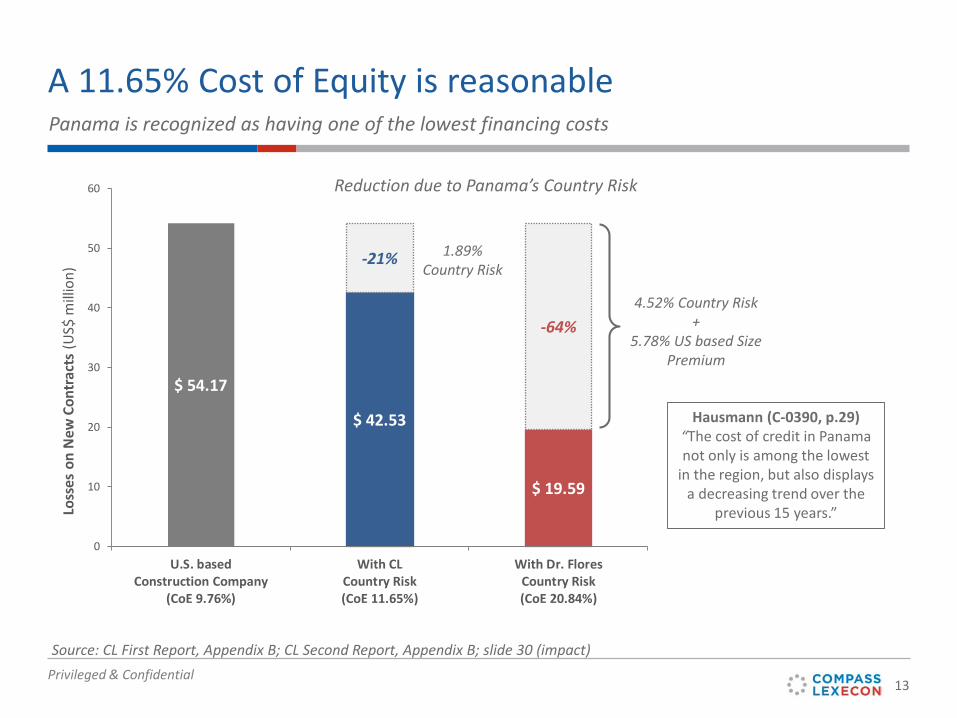
$ 54.17
$ 42.53
$ 19.59
-21%
-64%
0
10
20
30
40
50
60
U.S. basedConstruction Company
(CoE 9.76%)
With CLCountry Risk(CoE 11.65%)
With Dr. FloresCountry Risk(CoE 20.84%)
Loss
es o
n N
ew C
ontr
acts
(US$
mill
ion)
A 11.65% Cost of Equity is reasonable
Reduction due to Panama’s Country Risk
4.52% Country Risk+
5.78% US based Size Premium
Source: CL First Report, Appendix B; CL Second Report, Appendix B; slide 30 (impact)
1.89% Country Risk
Hausmann (C-0390, p.29)“The cost of credit in Panama not only is among the lowest
in the region, but also displays a decreasing trend over the
previous 15 years.”
Panama is recognized as having one of the lowest financing costs
Privileged & Confidential
III. Losses on Existing Contracts
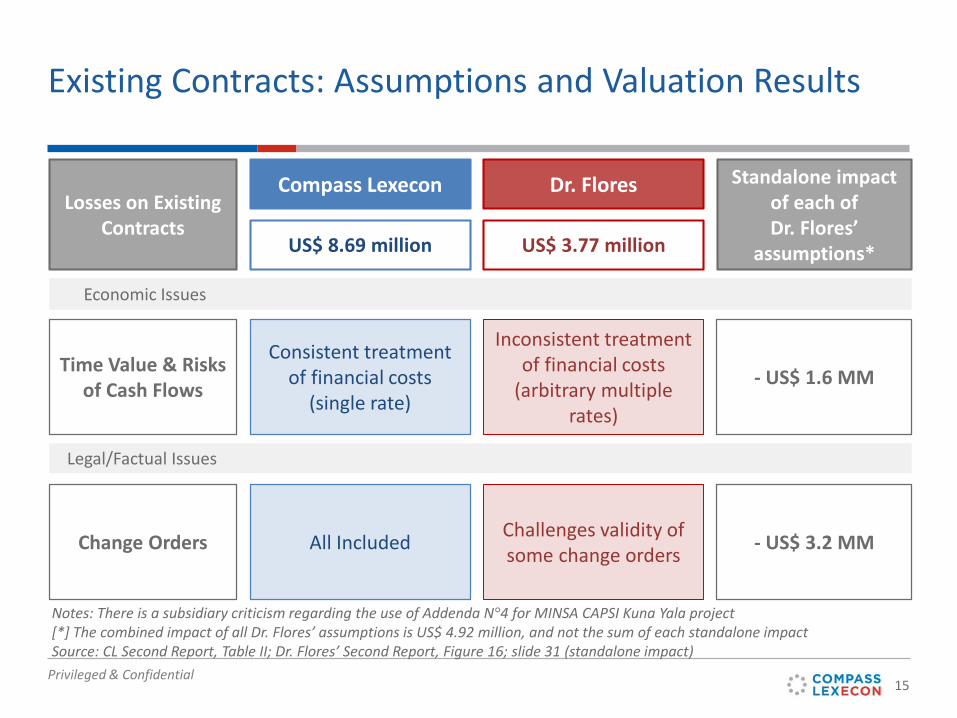
Privileged & Confidential15
Time Value & Risks of Cash Flows
Consistent treatment of financial costs
(single rate)
Inconsistent treatment of financial costs
(arbitrary multiple rates)
- US$ 1.6 MM
Dr. FloresCompass LexeconLosses on Existing
Contracts
Change Orders
US$ 8.69 million US$ 3.77 million
All Included Challenges validity of some change orders
Existing Contracts: Assumptions and Valuation Results
Standalone impact of each ofDr. Flores’
assumptions*
- US$ 3.2 MM
Economic Issues
Legal/Factual Issues
Notes: There is a subsidiary criticism regarding the use of Addenda N°4 for MINSA CAPSI Kuna Yala project[*] The combined impact of all Dr. Flores’ assumptions is US$ 4.92 million, and not the sum of each standalone impactSource: CL Second Report, Table II; Dr. Flores’ Second Report, Figure 16; slide 31 (standalone impact)
Privileged & Confidential16
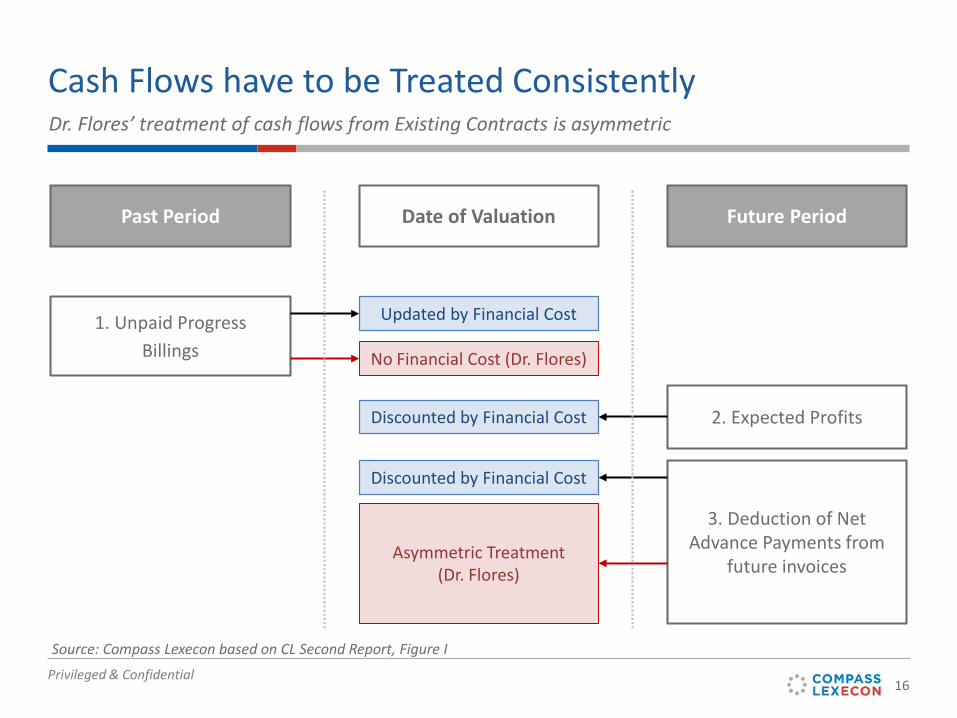
Source: Compass Lexecon based on CL Second Report, Figure I
1. Unpaid ProgressBillings
2. Expected Profits
3. Deduction of Net Advance Payments from
future invoices
Discounted by Financial Cost
Date of ValuationPast Period Future Period
Discounted by Financial Cost
Asymmetric Treatment(Dr. Flores)
Updated by Financial Cost
No Financial Cost (Dr. Flores)
Dr. Flores’ treatment of cash flows from Existing Contracts is asymmetric
Cash Flows have to be Treated Consistently
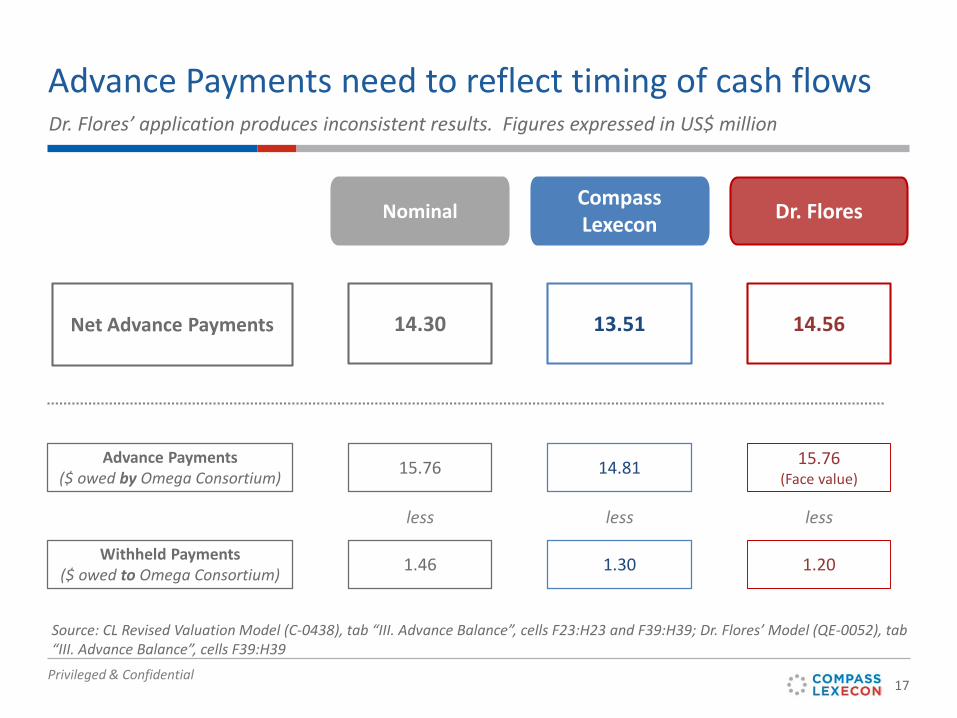
Privileged & Confidential17
14.81
13.51
1.30
Advance Payments need to reflect timing of cash flows
15.76
14.30
1.46
Compass Lexecon Dr. Flores
15.76(Face value)
14.56
1.20
Nominal
Advance Payments ($ owed by Omega Consortium)
Net Advance Payments
Withheld Payments ($ owed to Omega Consortium)
less less less
Dr. Flores’ application produces inconsistent results. Figures expressed in US$ million
Source: CL Revised Valuation Model (C-0438), tab “III. Advance Balance”, cells F23:H23 and F39:H39; Dr. Flores’ Model (QE-0052), tab “III. Advance Balance”, cells F39:H39

Privileged & Confidential
IV. Conclusions
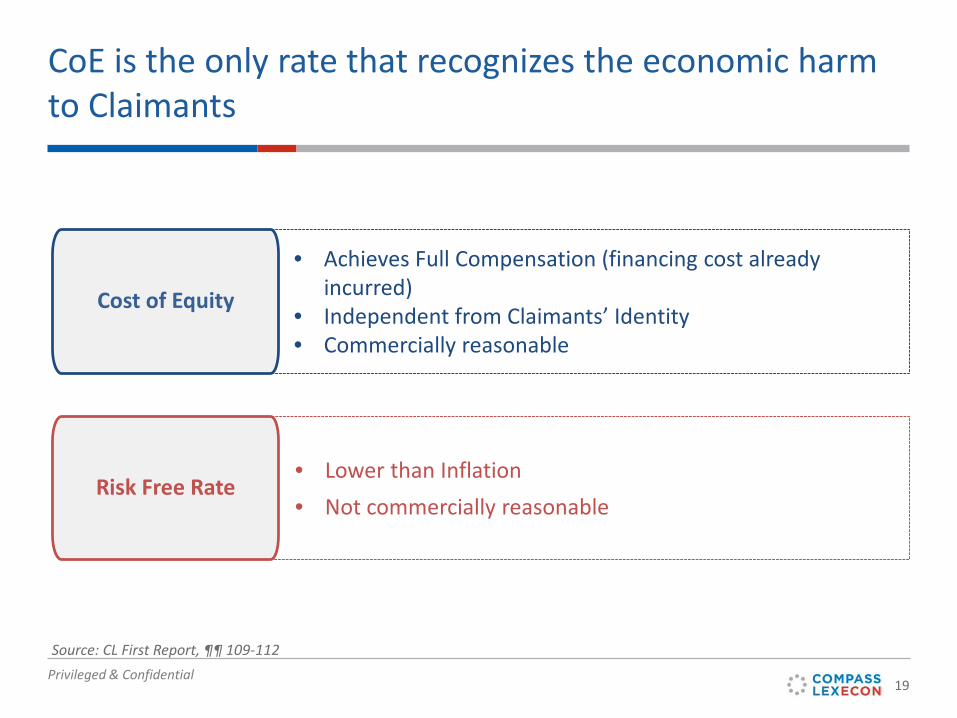
Privileged & Confidential19
CoE is the only rate that recognizes the economic harm to Claimants
• Lower than Inflation• Not commercially reasonable
• Achieves Full Compensation (financing cost already incurred)
• Independent from Claimants’ Identity• Commercially reasonable
Cost of Equity
Risk Free Rate
Source: CL First Report, ¶¶ 109-112

Privileged & Confidential20
Compass Lexecon’s Damages AssessmentFigures expressed in US$ million
Source: CL Second Report, Table VI; Compass Lexecon based on CL Revised Valuation Model (C-0438)
Total Losses as of April 1, 2020 US$ 91.62 MM
Existing ContractsUnpaid progress billings 20.13Expected Profits until Completion 2.06Less Cash Advances for Completion -13.51
Total Losses on Existing Contracts 8.69
New Contracts2015-2019 Cash Flows 11.78Beyond 2019 30.75
Total Losses on New Contracts 42.53
Total Losses (US$ million) 51.22
Total Losses as of December 23, 2014

www.compasslexecon.com

Privileged & Confidential
Back Up & Demonstratives
Privileged & Confidential23
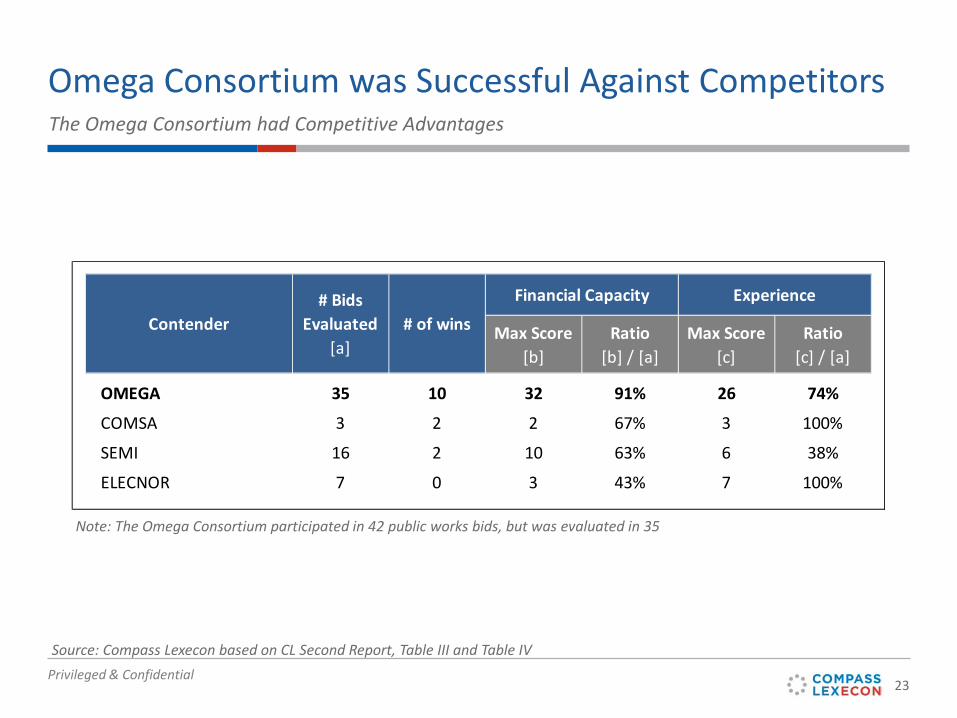
Omega Consortium was Successful Against Competitors
Max Score[b]
Ratio[b] / [a]
Max Score[c]
Ratio[c] / [a]
OMEGA 35 10 32 91% 26 74%
COMSA 3 2 2 67% 3 100%
SEMI 16 2 10 63% 6 38%
ELECNOR 7 0 3 43% 7 100%
Contender# Bids
Evaluated[a]
# of wins
Financial Capacity Experience
Source: Compass Lexecon based on CL Second Report, Table III and Table IV
The Omega Consortium had Competitive Advantages
Note: The Omega Consortium participated in 42 public works bids, but was evaluated in 35
Privileged & Confidential24
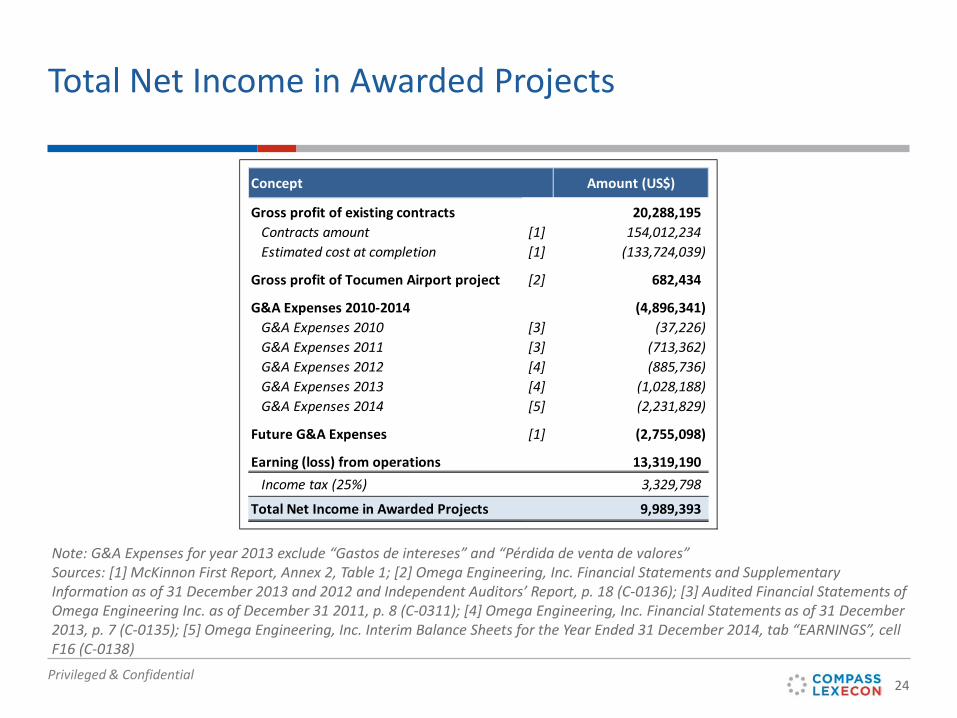
Total Net Income in Awarded Projects
Note: G&A Expenses for year 2013 exclude “Gastos de intereses” and “Pérdida de venta de valores”Sources: [1] McKinnon First Report, Annex 2, Table 1; [2] Omega Engineering, Inc. Financial Statements and Supplementary Information as of 31 December 2013 and 2012 and Independent Auditors’ Report, p. 18 (C-0136); [3] Audited Financial Statements of Omega Engineering Inc. as of December 31 2011, p. 8 (C-0311); [4] Omega Engineering, Inc. Financial Statements as of 31 December2013, p. 7 (C-0135); [5] Omega Engineering, Inc. Interim Balance Sheets for the Year Ended 31 December 2014, tab “EARNINGS”, cell F16 (C-0138)
Concept Amount (US$)
Gross profit of existing contracts 20,288,195 Contracts amount [1] 154,012,234 Estimated cost at completion [1] (133,724,039)
Gross profit of Tocumen Airport project [2] 682,434
G&A Expenses 2010-2014 (4,896,341) G&A Expenses 2010 [3] (37,226) G&A Expenses 2011 [3] (713,362) G&A Expenses 2012 [4] (885,736) G&A Expenses 2013 [4] (1,028,188) G&A Expenses 2014 [5] (2,231,829)
Future G&A Expenses [1] (2,755,098)
Earning (loss) from operations 13,319,190 Income tax (25%) 3,329,798
Total Net Income in Awarded Projects 9,989,393
Privileged & Confidential25
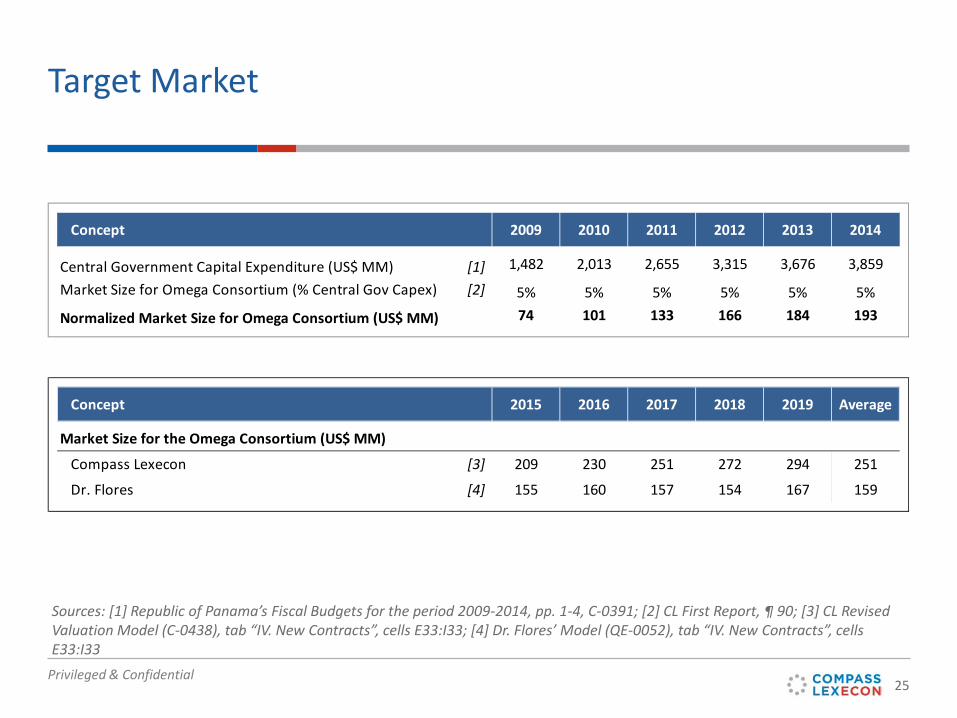
Target Market
Sources: [1] Republic of Panama’s Fiscal Budgets for the period 2009-2014, pp. 1-4, C-0391; [2] CL First Report, ¶ 90; [3] CL Revised Valuation Model (C-0438), tab “IV. New Contracts”, cells E33:I33; [4] Dr. Flores’ Model (QE-0052), tab “IV. New Contracts”, cells E33:I33
Concept 2009 2010 2011 2012 2013 2014
Central Government Capital Expenditure (US$ MM) [1] 1,482 2,013 2,655 3,315 3,676 3,859
Market Size for Omega Consortium (% Central Gov Capex) [2] 5% 5% 5% 5% 5% 5%
Normalized Market Size for Omega Consortium (US$ MM) 74 101 133 166 184 193
Concept 2015 2016 2017 2018 2019 Average
Market Size for the Omega Consortium (US$ MM)
Compass Lexecon [3] 209 230 251 272 294 251
Dr. Flores [4] 155 160 157 154 167 159
Privileged & Confidential26
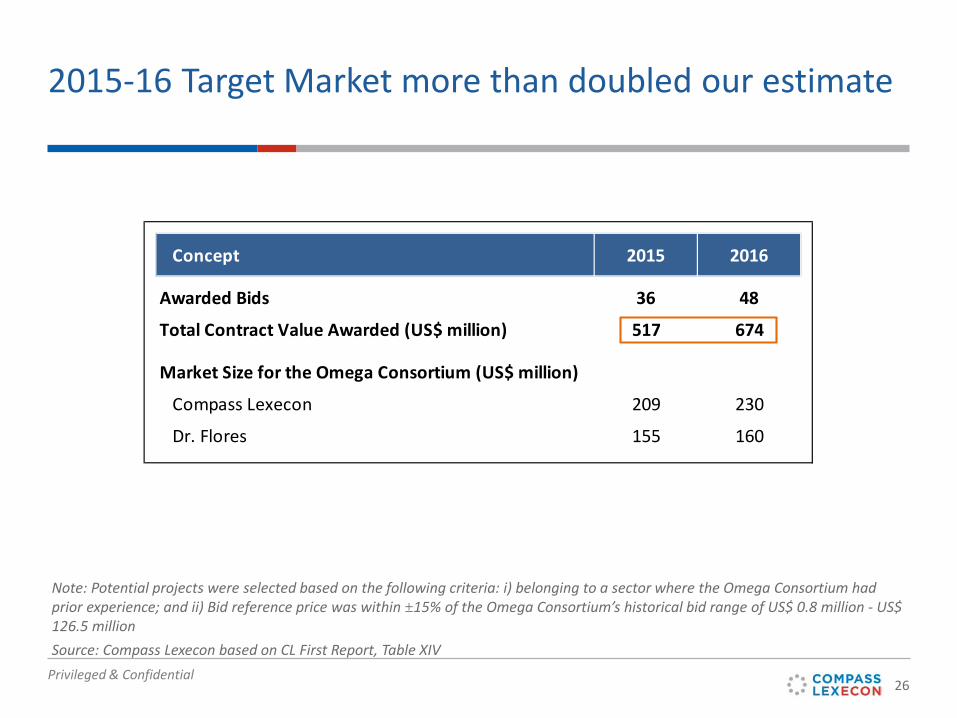
Concept 2015 2016
Awarded Bids 36 48
Total Contract Value Awarded (US$ million) 517 674
Market Size for the Omega Consortium (US$ million)
Compass Lexecon 209 230
Dr. Flores 155 160
2015-16 Target Market more than doubled our estimate
Source: Compass Lexecon based on CL First Report, Table XIV
Note: Potential projects were selected based on the following criteria: i) belonging to a sector where the Omega Consortium had prior experience; and ii) Bid reference price was within ±15% of the Omega Consortium’s historical bid range of US$ 0.8 million - US$ 126.5 million
Privileged & Confidential27
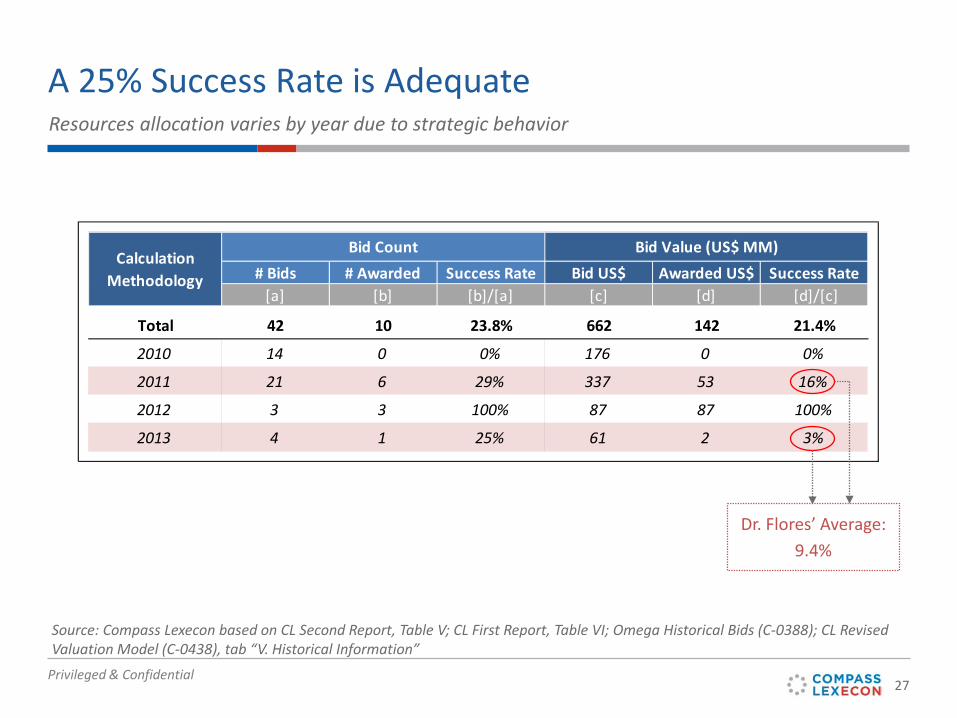
# Bids # Awarded Success Rate Bid US$ Awarded US$ Success Rate[a] [b] [b]/[a] [c] [d] [d]/[c]
Total 42 10 23.8% 662 142 21.4%
2010 14 0 0% 176 0 0%
2011 21 6 29% 337 53 16%
2012 3 3 100% 87 87 100%
2013 4 1 25% 61 2 3%
Calculation Methodology
Bid Count Bid Value (US$ MM)
A 25% Success Rate is Adequate
Source: Compass Lexecon based on CL Second Report, Table V; CL First Report, Table VI; Omega Historical Bids (C-0388); CL Revised Valuation Model (C-0438), tab “V. Historical Information”
Resources allocation varies by year due to strategic behavior
Dr. Flores’ Average:9.4%
Privileged & Confidential28
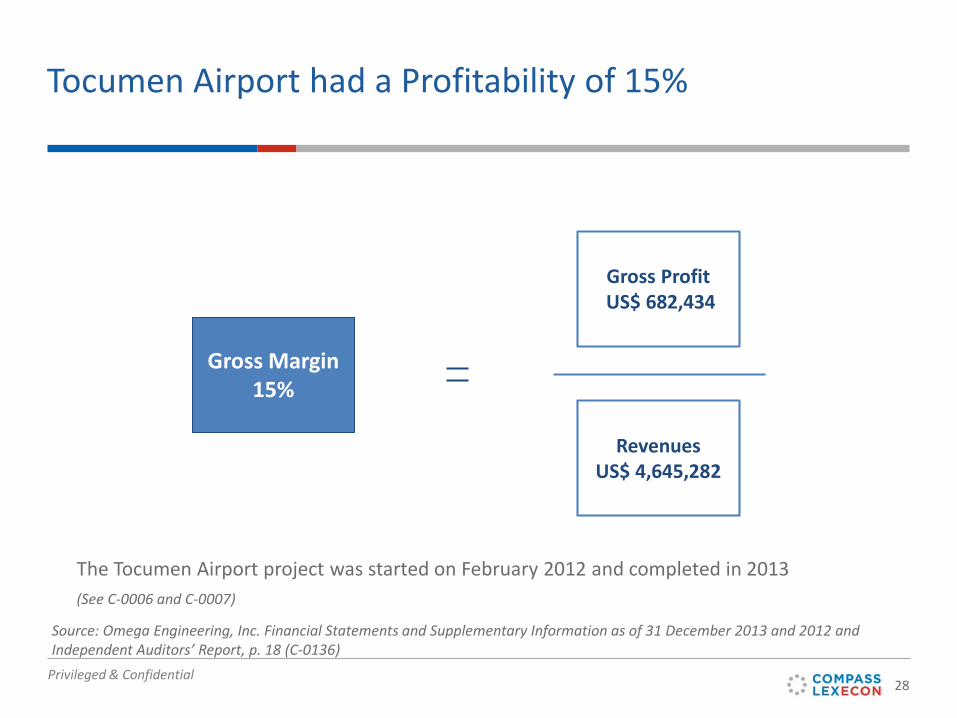
Tocumen Airport had a Profitability of 15%
The Tocumen Airport project was started on February 2012 and completed in 2013(See C-0006 and C-0007)
Gross Margin15%
RevenuesUS$ 4,645,282
Gross ProfitUS$ 682,434
Source: Omega Engineering, Inc. Financial Statements and Supplementary Information as of 31 December 2013 and 2012 and Independent Auditors’ Report, p. 18 (C-0136)

Privileged & Confidential29
Standalone Impacts on New Contracts
See CL Revised Valuation Model (C-0438), tab “Summary”• Compass Lexecon New Contracts estimate, press button “Run scenario CLEX” (cell P3)
• See cell M13:N13 = US$ 42.53 MM• Standalone impact of “Valuation Horizon” assumption, press button “Run scenario CLEX” (cell P3)
• In cell G33 choose option “QE (2019)”. See cell M13:N13 = US$ 11.78 MM (which is US$ 31 MM less than Compass Lexecon)
• Standalone impact of “Major Cash Flows Assumptions”, press button “Run scenario CLEX” (cell P3)• In cell G38 choose option “QE (5.44%)”; in cell G44 choose option “QE (9.39%)”; in cell G45 choose
option “QE (10.71%)”. See cell M13:N13 = US$ 7.29 MM (which is US$ 35 MM less than Compass Lexecon)
• Standalone impact of “Cost of Equity” assumption, press button “Run scenario CLEX” (cell P3)• In cell G21 choose option “Cost of Equity QE (Midpoint 20.8%)”. See cell M13:N13 = US$ 19.59 MM
(which is US$ 23 MM less than Compass Lexecon)
See Dr. Flores Updated Valuation Model (QE-0052 XLS), tab “Summary”• Dr. Flores New Contracts estimate, press button “Run scenario QE” (cell Q3)
• See cell M13:N13 = US$ 1.14 MM• Standalone impact of “Other Assumptions”, press button “Run scenario CLEX” (cell P3)
• In cell G51 choose option “QE (Ignores Existing Contracts G&A)”; in cell G57 choose option “30 Months”. See cell M13:N13 = US$ 38.00 MM (which is US$ 5 MM less than Compass Lexecon)
Privileged & Confidential30
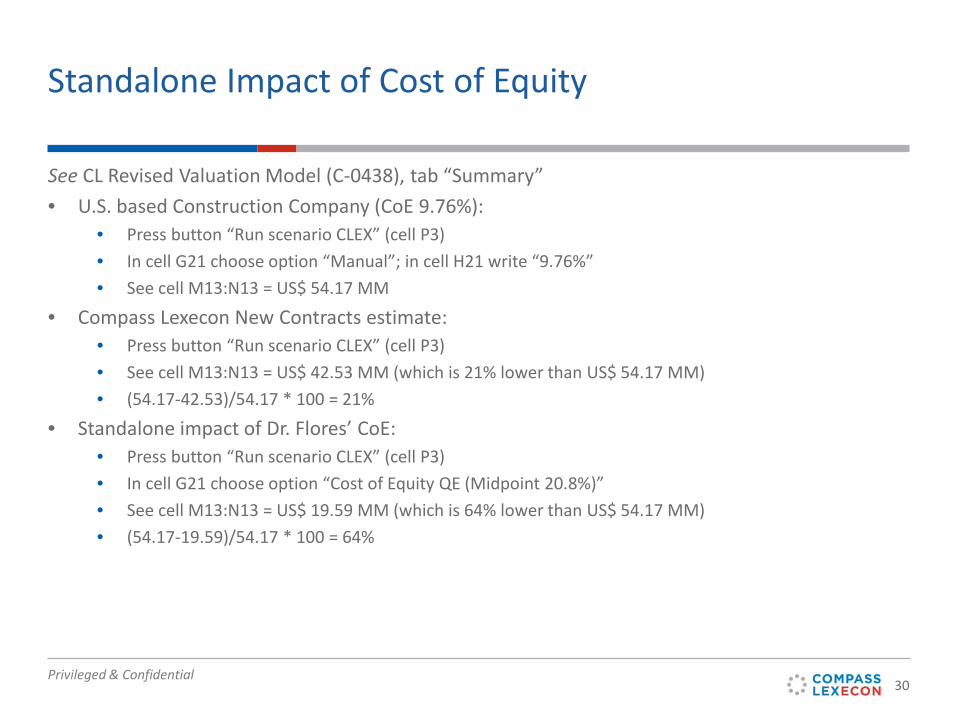
Standalone Impact of Cost of Equity
See CL Revised Valuation Model (C-0438), tab “Summary”• U.S. based Construction Company (CoE 9.76%):
• Press button “Run scenario CLEX” (cell P3)• In cell G21 choose option “Manual”; in cell H21 write “9.76%”• See cell M13:N13 = US$ 54.17 MM
• Compass Lexecon New Contracts estimate:• Press button “Run scenario CLEX” (cell P3)• See cell M13:N13 = US$ 42.53 MM (which is 21% lower than US$ 54.17 MM)• (54.17-42.53)/54.17 * 100 = 21%
• Standalone impact of Dr. Flores’ CoE:• Press button “Run scenario CLEX” (cell P3)• In cell G21 choose option “Cost of Equity QE (Midpoint 20.8%)”• See cell M13:N13 = US$ 19.59 MM (which is 64% lower than US$ 54.17 MM)• (54.17-19.59)/54.17 * 100 = 64%
Privileged & Confidential31
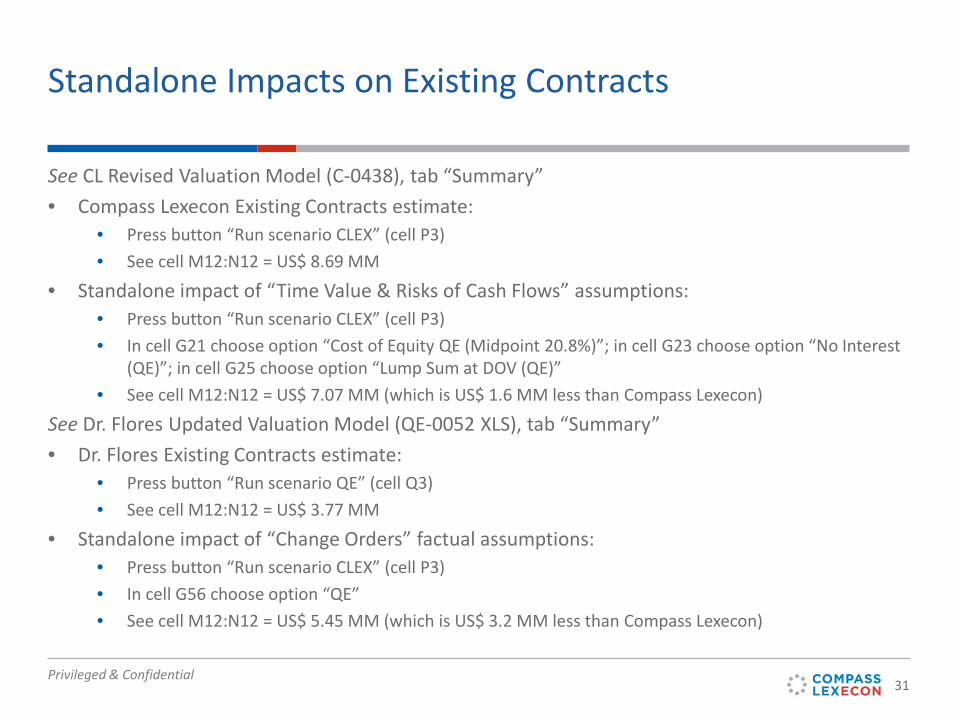
Standalone Impacts on Existing Contracts
See CL Revised Valuation Model (C-0438), tab “Summary”• Compass Lexecon Existing Contracts estimate:
• Press button “Run scenario CLEX” (cell P3)• See cell M12:N12 = US$ 8.69 MM
• Standalone impact of “Time Value & Risks of Cash Flows” assumptions:• Press button “Run scenario CLEX” (cell P3)• In cell G21 choose option “Cost of Equity QE (Midpoint 20.8%)”; in cell G23 choose option “No Interest
(QE)”; in cell G25 choose option “Lump Sum at DOV (QE)”• See cell M12:N12 = US$ 7.07 MM (which is US$ 1.6 MM less than Compass Lexecon)
See Dr. Flores Updated Valuation Model (QE-0052 XLS), tab “Summary”• Dr. Flores Existing Contracts estimate:
• Press button “Run scenario QE” (cell Q3)• See cell M12:N12 = US$ 3.77 MM
• Standalone impact of “Change Orders” factual assumptions:• Press button “Run scenario CLEX” (cell P3)• In cell G56 choose option “QE”• See cell M12:N12 = US$ 5.45 MM (which is US$ 3.2 MM less than Compass Lexecon)

www.compasslexecon.com
Related Documents


