Hindawi Publishing Corporation Cardiology Research and Practice Volume 2012, Article ID 201742, 11 pages doi:10.1155/2012/201742 Research Article Omega-3 Status and the Relationship between Plasma Asymmetric Dimethylarginine and Risk of Myocardial Infarction in Patients with Suspected Coronary Artery Disease Heidi Borgeraas, 1 Elin Strand, 1 Eva Ringdal Pedersen, 1 Jutta Dierkes, 1 Per Magne Ueland, 1 Reinhard Seifert, 2 Eirik Rebnord Wilberg, 2 Pavol Bohov, 1 Rolf K. Berge, 1 Dennis W. T. Nilsen, 1, 3 and Ottar Nyg˚ ard 1, 2 1 Institute of Medicine, Haukeland University Hospital, 5021 Bergen, Norway 2 Department of Heart Disease, Haukeland University Hospital, 5021 Bergen, Norway 3 Division of Cardiology, Stavanger University Hospital, 4011 Stavanger, Norway Correspondence should be addressed to Heidi Borgeraas, [email protected] Received 21 May 2012; Accepted 27 November 2012 Academic Editor: Vicky A. Cameron Copyright © 2012 Heidi Borgeraas et al. This is an open access article distributed under the Creative Commons Attribution License, which permits unrestricted use, distribution, and reproduction in any medium, provided the original work is properly cited. Background. Asymmetric dimethylarginine (ADMA) is an endogenous inhibitor of nitric oxide synthase. A previous rat study revealed an ADMA lowering effect following treatment with omega-3 polyunsaturated fatty acids (n-3 PUFAs). We sought to examine if an association between plasma ADMA and risk of acute myocardial infarction (AMI) was modified by serum n-3 PUFA status. Methods. The cohort included 1364 patients who underwent coronary angiography for suspected coronary artery disease in 2000-2001. Fatal and nonfatal AMI events were registered until December 31, 2006. Risk associations with AMI were estimated across ADMA quartiles (linear trend) and the upper decile. Results. No association between concentration of any n-3 PUFA and ADMA was observed. Only ADMA levels in upper decile were significantly associated with AMI with a multivariate adjusted hazard ratio (HR) (95% confidence interval) versus the rest of the population of 2.11 (1.34, 3.32). The association was strengthened among patients with below median levels of α-linolenic acid (ALA) (HR 3.12 (1.64, 5.93)), but was only influenced by longer chain n-3 PUFA after additional adjustments for HbA1c, estimated glomerular filtration rate, and hypercholesterolemia. Conclusions. The association of ADMA with risk of AMI is influenced by serum n-3 PUFA and particularly ALA. 1. Introduction An early and critical event in the pathogenesis of cardiovas- cular disease (CVD) is endothelial (vasodilator) dysfunction. Normal endothelial function depends on adequate levels of nitric oxide (NO), which acts as a vasodilator, inhibits the excessive proliferation of vascular smooth muscle cells [1], enhances endothelial cell survival and proliferation [2], and suppresses the adhesion of platelets and inflammatory cells to the vessel wall [3]. NO is synthesized from the amino acid L-arginine by a family of NO synthase enzymes (NOS). Asymmetric dimethylarginine (ADMA) acts as an inhibitor of NOS and thus decreases the synthesis and availability of NO. A high plasma level of ADMA is regarded as an independent predictor of CVD and is also associated with end stage renal disease [4]. Altered activity of the ADMA metabolizing enzymes, dimethylarginine dimethylaminohydrolase I and II (DDAH- I and DDAH-II), has been suggested as a possible cause for plasma ADMA accumulation. DDAH activity is directly downregulated by reactive oxygen species (ROS) generated by high glucose levels [5], oxidized LDL cholesterol (oxLDL), and the cytokine, tumor necrosis factor α (TNF-α)[6]. Addi- tionally, the expression of endothelial cell protein arginine N- methyltransferases (PRMT), the enzymes which synthesize ADMA, is upregulated in the presence of oxLDL [7]. Studies have revealed altered DDAH activity through activation of peroxisome proliferator-activated receptor γ (PPARγ)[8] and sterol regulatory binding protein 1c and 2

Welcome message from author
This document is posted to help you gain knowledge. Please leave a comment to let me know what you think about it! Share it to your friends and learn new things together.
Transcript
Hindawi Publishing CorporationCardiology Research and PracticeVolume 2012, Article ID 201742, 11 pagesdoi:10.1155/2012/201742
Research Article
Omega-3 Status and the Relationship between PlasmaAsymmetric Dimethylarginine and Risk of Myocardial Infarctionin Patients with Suspected Coronary Artery Disease
Heidi Borgeraas,1 Elin Strand,1 Eva Ringdal Pedersen,1 Jutta Dierkes,1
Per Magne Ueland,1 Reinhard Seifert,2 Eirik Rebnord Wilberg,2 Pavol Bohov,1
Rolf K. Berge,1 Dennis W. T. Nilsen,1, 3 and Ottar Nygard1, 2
1 Institute of Medicine, Haukeland University Hospital, 5021 Bergen, Norway2 Department of Heart Disease, Haukeland University Hospital, 5021 Bergen, Norway3 Division of Cardiology, Stavanger University Hospital, 4011 Stavanger, Norway
Correspondence should be addressed to Heidi Borgeraas, [email protected]
Received 21 May 2012; Accepted 27 November 2012
Academic Editor: Vicky A. Cameron
Copyright © 2012 Heidi Borgeraas et al. This is an open access article distributed under the Creative Commons AttributionLicense, which permits unrestricted use, distribution, and reproduction in any medium, provided the original work is properlycited.
Background. Asymmetric dimethylarginine (ADMA) is an endogenous inhibitor of nitric oxide synthase. A previous rat studyrevealed an ADMA lowering effect following treatment with omega-3 polyunsaturated fatty acids (n-3 PUFAs). We sought toexamine if an association between plasma ADMA and risk of acute myocardial infarction (AMI) was modified by serum n-3PUFA status. Methods. The cohort included 1364 patients who underwent coronary angiography for suspected coronary arterydisease in 2000-2001. Fatal and nonfatal AMI events were registered until December 31, 2006. Risk associations with AMI wereestimated across ADMA quartiles (linear trend) and the upper decile. Results. No association between concentration of any n-3PUFA and ADMA was observed. Only ADMA levels in upper decile were significantly associated with AMI with a multivariateadjusted hazard ratio (HR) (95% confidence interval) versus the rest of the population of 2.11 (1.34, 3.32). The association wasstrengthened among patients with below median levels of α-linolenic acid (ALA) (HR 3.12 (1.64, 5.93)), but was only influencedby longer chain n-3 PUFA after additional adjustments for HbA1c, estimated glomerular filtration rate, and hypercholesterolemia.Conclusions. The association of ADMA with risk of AMI is influenced by serum n-3 PUFA and particularly ALA.
1. Introduction
An early and critical event in the pathogenesis of cardiovas-cular disease (CVD) is endothelial (vasodilator) dysfunction.Normal endothelial function depends on adequate levels ofnitric oxide (NO), which acts as a vasodilator, inhibits theexcessive proliferation of vascular smooth muscle cells [1],enhances endothelial cell survival and proliferation [2], andsuppresses the adhesion of platelets and inflammatory cellsto the vessel wall [3].
NO is synthesized from the amino acid L-arginine bya family of NO synthase enzymes (NOS). Asymmetricdimethylarginine (ADMA) acts as an inhibitor of NOSand thus decreases the synthesis and availability of NO. Ahigh plasma level of ADMA is regarded as an independent
predictor of CVD and is also associated with end stage renaldisease [4].
Altered activity of the ADMA metabolizing enzymes,dimethylarginine dimethylaminohydrolase I and II (DDAH-I and DDAH-II), has been suggested as a possible causefor plasma ADMA accumulation. DDAH activity is directlydownregulated by reactive oxygen species (ROS) generatedby high glucose levels [5], oxidized LDL cholesterol (oxLDL),and the cytokine, tumor necrosis factor α (TNF-α) [6]. Addi-tionally, the expression of endothelial cell protein arginine N-methyltransferases (PRMT), the enzymes which synthesizeADMA, is upregulated in the presence of oxLDL [7].
Studies have revealed altered DDAH activity throughactivation of peroxisome proliferator-activated receptor γ(PPARγ) [8] and sterol regulatory binding protein 1c and 2
2 Cardiology Research and Practice
(SREBP-1c and SREBP-2) [9]. Activation of PPARγ upreg-ulates DDAH-II expression and enzyme activity [8]. Inhi-bition of SREBP-1c upregulates DDAH-I expression andactivity, while inhibition of SREBP 2 has the opposite effects[9]. Fatty acids (FAs) are natural ligands for PPARγ [10] andSREBPs [11], and omega-3 polyunsaturated FA (n-3 PUFA)may act as PPARγ agonists [10] and SREBP-1c antagonists[11].
n-3 PUFAs include the plant-derived α-linolenic acid(ALA) and the fish oil-derived eicosapentaenoic acid (EPA),docosapentaenoic acid (DPA), and docosahexaenoic acid(DHA). Although both groups of n-3 PUFA may havecardiovascular protective properties, the clinical implicationsof a high intake of n-3 PUFA derived from plant or fish oil insecondary prevention of coronary artery disease (CAD) arestill controversial [12–14].
Studies investigating the association between n-3 PUFAand ADMA are scant and inconsistent. A randomizedintervention trial, among men with long-standing hyper-lipidemia, revealed no differences in ADMA levels after n-3PUFA supplementation [15]. However, a prospective studyrevealed lower plasma ADMA concentrations in rats treatedwith EPA and DHA compared with rats given olive oil [16],and ingestion of a high fat meal, in diabetes patients, has beenassociated with elevated plasma ADMA levels [17].
The aim of the present study was to investigate if n-3 PUFA influences the association between ADMA levelsand risk of AMI in patients with coronary heart disease,hypothesizing that the relationship would be the strongest inpatients with impaired n-3 PUFA status.
2. Methods
2.1. Study Population. The Bergen coronary angiographycohort (BECAC) includes 3718 patients who underwentcoronary angiography for suspected CAD during 2000–2004.The majority (92%) had stable angina. The present studyincluded 1364 initial patients recruited to BECAC during2000-2001. More than half of these patients (n = 707) didalso participate in the Western Norway B Vitamin Interven-tion Trial (WENBIT), an RCT that investigated the effectof high dose B vitamin supplementation on risk of CVDand mortality [18]. About 80% of the WENBIT participantscompleted a semiquantitative food-frequency questionnaire(FFQ) at trial enrolment, providing information on dietaryhabits during the last year [19]. The study protocol met themandate of the Declaration of Helsinki and was approvedby the Regional Committee for Medical Research Ethics andthe Norwegian Data Inspectorate. A signed consent form wasobtained from all participants.
2.2. Baseline Data. Information about medical history, riskfactors and medications were provided through a self-administered questionnaire completed by each patient aspreviously reported [18]. Hypertension and diabetes mellitus(DM) were classified by preexisting diagnosis, and DMincludes both type 1 and 2. Smokers included self-reportedcurrent smoking, those who quit smoking within <1 month,
and patients with plasma cotinine > 85 ng/mL [20]. Familyhistory of CAD included those reporting to have at leastone 1st degree relative suffering from CAD before the ageof 55 for men and 65 for women. Information from thequestionnaires was checked against medical records. Fastingwas referred to as not having ingested any food 6 hoursprior to blood sample collection. Untreated serum levelsof total cholesterol ≥ 6.5 mmol/L were regarded as hyperc-holesterolemic. Left ventricular ejection fraction (LVEF) (%)was determined by ventriculography or echocardiographyand values < 50% were considered as impaired. The extentof CAD was angiographically verified and scored 0 to 3according to the number of main vessels with significantdiameter stenosis (≥50%).
2.3. Endpoint and Followup. The participants were followedfrom angiography in 2000 or 2001 and until they experiencedan acute AMI or throughout December 31, 2006.
Information on clinical events was collected from hos-pitals and from the Norwegian Cause of Death Registry.AMI definition, published in 2000 [21], was used as diag-nostic criteria. Procedure-related nonfatal AMI occurringwithin 24 h of coronary angiography, percutaneous coronaryintervention (PCI), or coronary artery bypass graft surgery(CABG) was excluded from the endpoint. All events wereadjudicated by members of the endpoints committee.
2.4. Biochemical Analyses. Serum samples were collectedbefore angiography and stored at −80◦C until analysis.Serum apolipoprotein A-I, apolipoprotein B, and lipoprotein(a) were measured on the Hitachi 917 system (Roche Diag-nostics, GmbH, Mannheim, Germany). C-reactive protein(CRP) was determined using a latex, high sensitive assay(Behring Diagnostics, Marburg, Germany). Serum fatty acidmethyl esters were extracted by treatment of serum with2% (v/v) of sulfuric acid in methanol [22] and analyzedby gas-liquid chromatography (GC 8000 TOP, Finnigan,USA) on DB1-ms capillary column (j & W Scientific,USA) coupled to a flame-ionization detector [23]. Within-day coefficient of variation (CV) was 1.4% for total FAs(TFAs) (mg/L) and 0.37% for ALA (wt%). Within-day CVfor the combination of the long chain n-3 PUFA (n-3LCPUFA) EPA, DPA, and DHA (wt%) was 2.2% and rangedbetween 0.97% and 1.88% for the individual n-3 LCPUFA.Plasma ADMA was determined by high performance liquidchromatography/tandem mass spectrometry (LC-MS/MS)at BEVITAL AS (http://www.bevital.no/), and within-dayCV was 4%. Cotinine was measured by LC-MS/MS [24].LDL cholesterol was calculated by using the Friedewaldformula, and estimated glomerular filtration rate (eGFR) wascalculated using the Chronic Kidney Disease EpidemiologyCollaboration [25].
2.5. Statistical Methods. Continuous variables are presentedas means (±SD) and categorical variables as counts (per-centage). Mean trends over plasma ADMA quartiles wereestimated using linear regression for continuous variablesand logistic regression for binary variables.
Cardiology Research and Practice 3
Hazard ratios of AMI events over quartiles of plasmaADMA and for ADMA as a dichotomous variable (cutoff
at 90th percentile) were estimated with Cox proportionalhazard models. Nonlinear effects were additionally investi-gated with GAM plots using penalized smoothing splinesfor the functional form of the covariate [26]. The adjustedmodel included age (continuous), sex, acute coronary syn-drome (ACS; yes/no), DM (yes/no), hypertension (yes/no),current smoking (yes/no), extent of significant CAD (nosignificant CAD, 1 vessel disease, 2 vessel disease and 3 vesseldisease (0–3)), and LVEF (continuous). HbA1c (continu-ous), hypercholesterolemia (yes/no), and eGFR (continuous)adjustments were included in an additional model. Effectmodifications by serum levels of TFAs, ALA, n-3 LCPUFA,or total n-3 PUFA (ALA plus n-3 LCPUFA) were investigatedby including dichotomous transformed cofactors of therespective FA as interaction terms in the Cox model.
All probability values are 2-tailed and were consideredsignificant when <0.05. Statistical analyses were performedwith SPSS 18 (SPSS Inc., Chicago, IL, USA) and R 2.14.2 (theR Foundation for Statistical Computing, Vienna, Austria).
3. Results
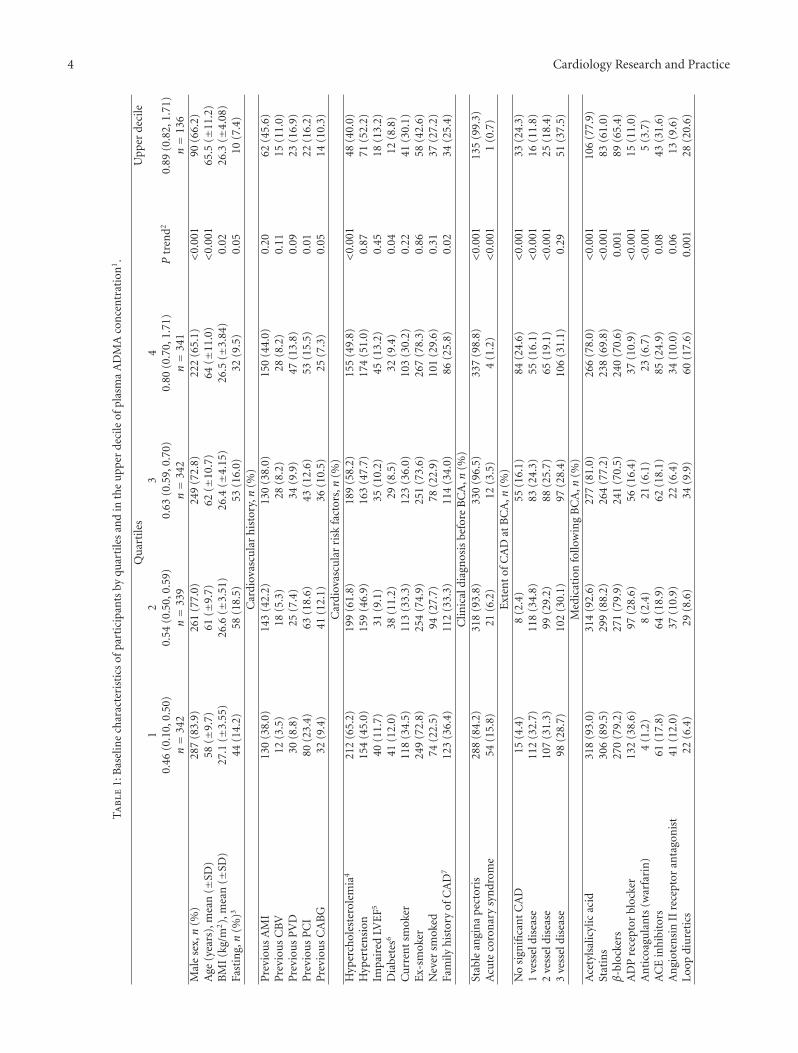
3.1. Baseline Characteristics. Baseline characteristics of the1364 participants, according to quartiles of plasma ADMAconcentrations, are presented in Table 1. Mean (±SD)plasma ADMA concentrations were 0.45 (0.05) and 0.82(0.11) μmol/L for quartile 1 and 4, respectively, and 0.92(0.11) for the upper decile. The overall mean age was 61.0years and 74.7% were men. Higher ADMA levels were asso-ciated with increasing age and higher proportion of femalegender. BMI showed a negative association with ADMAquartiles, which, however, disappeared after adjustment forage and sex (data not shown). There was no associationbetween fasting status and ADMA after adjustment for ageand sex (data not shown). FFQ data on dietary habitsduring last year were available from 705 patients who alsoparticipated in WENBIT, and the mean (SD) intake of fishwas 119 (67.7) g/d and 116 (63.3) g/d for quartile 1 and4, respectively, with no significant difference in fish intakebetween the ADMA quartiles.
Patients with high ADMA levels were less likely to havebeen treated with PCI, having hypercholesterolemia, DM,or family history of CAD. Patients with low ADMA weremore often diagnosed with ACS and significant CAD atangiography. However, the prevalence of 3-vessel disease didnot differ across ADMA quartiles.
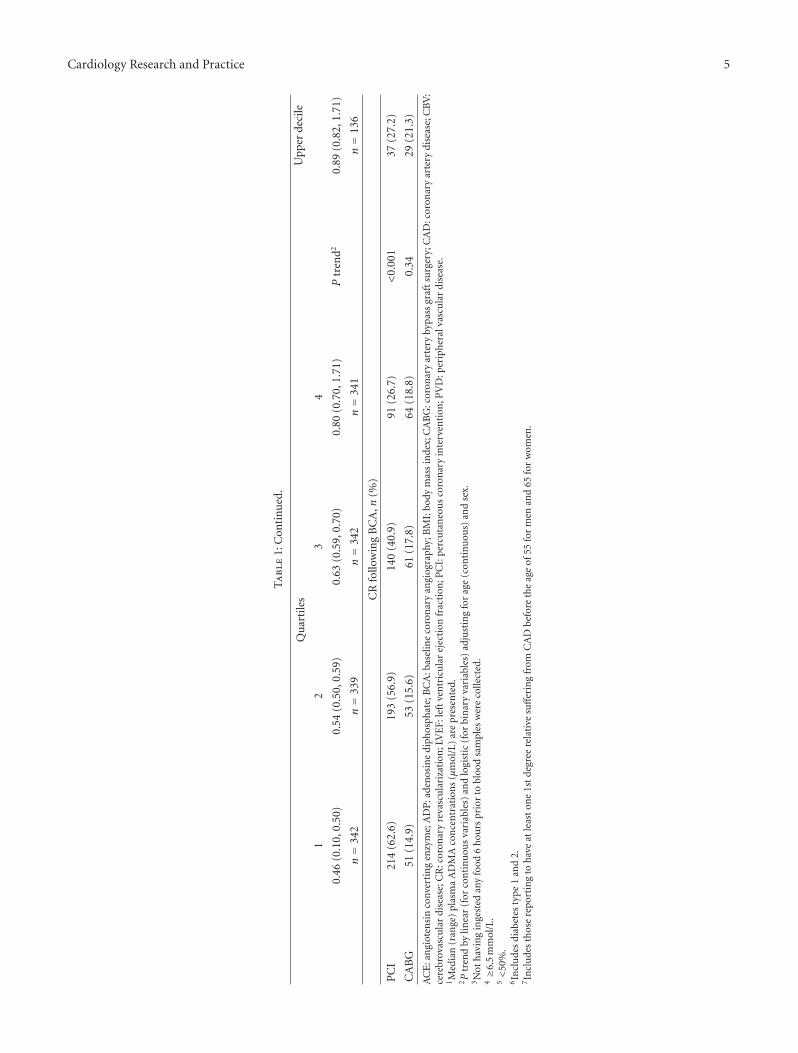
Because the majority was diagnosed with significantCAD, most patients were discharged with various medi-cations. Antiplatelet therapy (acetylsalicylic acid and ADPreceptor blockers), statins, and β-blockers were more fre-quently used by patients with low ADMA levels, whereasuse of warfarin and loop diuretics was more frequent inpatients with high ADMA. A total of 860 (63.0%) patientswere treated with either PCI or CABG as a result of thebaseline angiography.
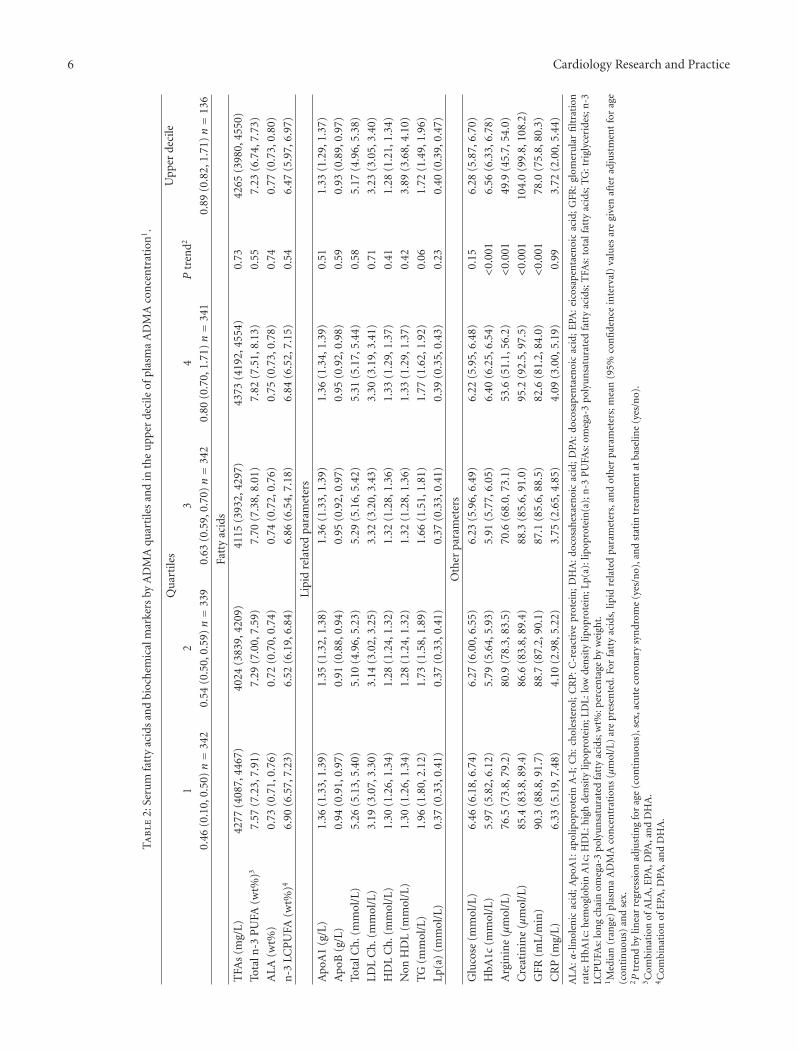
3.2. Serum n-3 PUFA and Biochemical Markers accordingto Plasma ADMA Levels. FA and biochemical markers,relevant for CAD, by quartiles of ADMA are presented inTable 2. After adjustment for age, gender, statin therapy,and ACS, ADMA concentration was not associated withany FA (as percentage by weight (wt%) or concentration),any lipid parameter, glucose, or CRP. ADMA showed apositive association with HbA1c and creatinine and inverseassociation with eGFR and arginine.
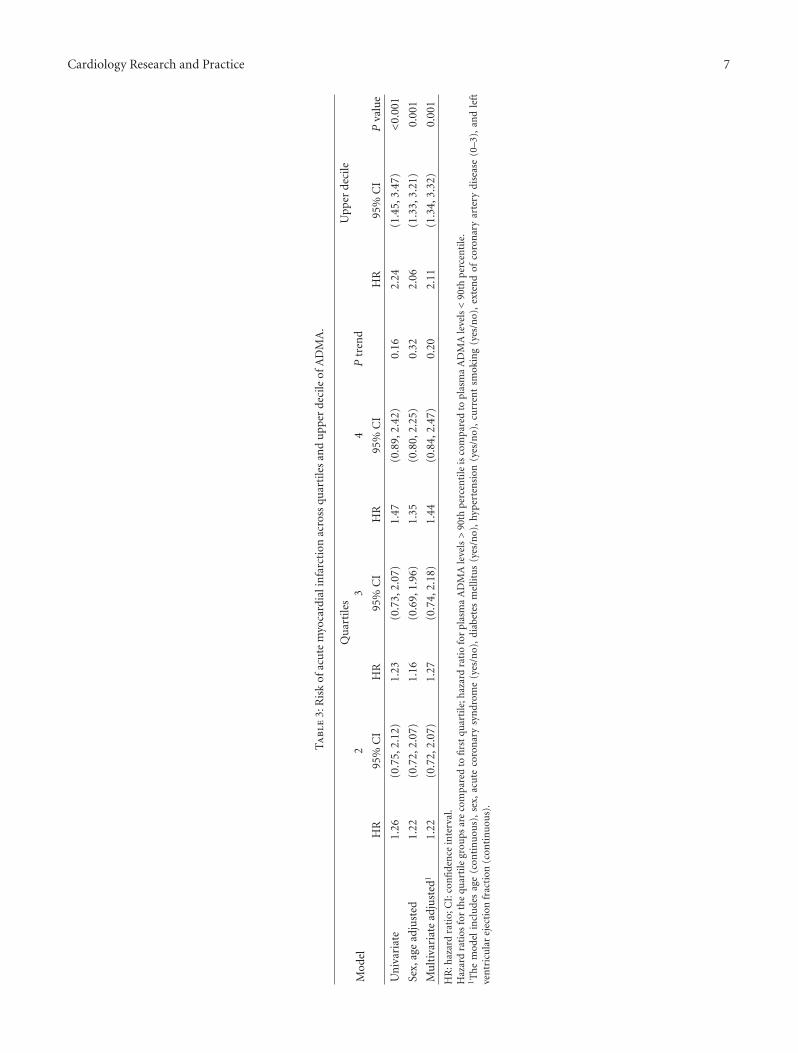
3.3. ADMA and Risk of AMI. During the follow-up period(mean 63 (SD 20) months), a total of 129 patients expe-rienced an AMI, of which 44 were fatal. The relationshipbetween ADMA levels and subsequent risk of AMI afterangiography was evaluated across ADMA quartiles usinglower quartile 1 as reference, and for the upper decilecompared to ADMA below the upper decile.
ACS and extent of CAD were strongly associated withADMA and were included in a multivariate adjusted survivalmodel together with other important risk factors for AMI.Hazard ratios (HR (95% CI)) for AMI according to ADMAlevels are presented in Table 3. We observed only a weak,nonsignificant trend of an increased risk of AMI acrossADMA quartiles. However, patients with ADMA levels inthe upper decile had a significantly increased risk comparedwith the rest; HR 2.11 (1.34, 3.32), P = 0.001. Furtheradjustment for eGFR, hypercholesterolemia, HbA1c, lipidparameters, CRP, or coronary revascularization followingbaseline angiography (PCI or CABG) only minimallyaffected the estimate (data not shown).
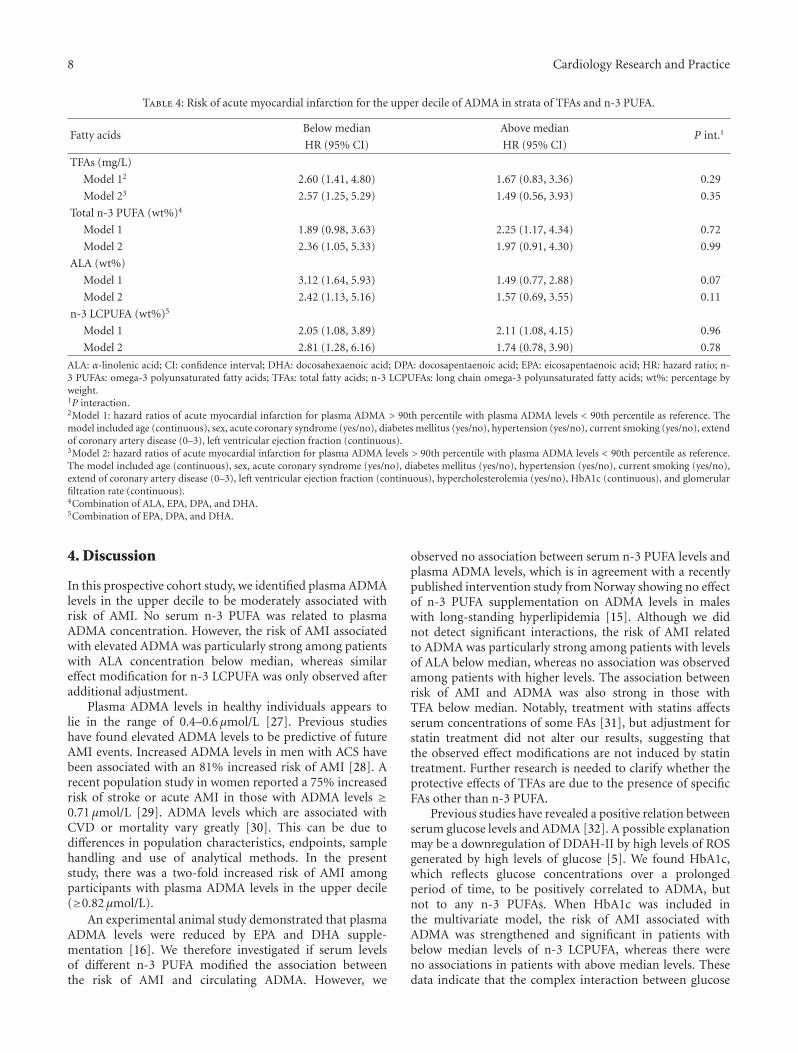
3.4. Stratification by n-3 PUFA. Possible effect modificationsof n-3 PUFA on the relationship between ADMA and riskof AMI were evaluated by repeating the survival analysesafter stratifying the study population according to medianlevels of TFA concentration or wt% of ALA, n-3 LCPUFA(Table 4) and EPA, and DPA and DHA individually (data notshown). We observed particularly strong and significant riskassociations among patients with below median levels (wt%)of ALA (HR 3.12 (1.64, 5.93)) and TFA (HR 2.60 (1.41,4.80)) whereas no significant risk associations were observedwith higher levels of ALA and TFA (Table 4, Figure 1). Effectmodification was, however, close to being statistically signif-icant only according to median ALA (P = 0.07) (Table 4).We observed no effect modification according to wt% of n-3LCPUFA (Table 4) or EPA, and DPA and DHA individually(data not shown), with almost identical and statisticallysignificant risk estimates in those with levels above andbelow the respective median concentrations. However, afteradditional adjustment for HbA1C, hypercholesterolemia,and eGFR, the risk association was strengthened in thosewith below median levels of n-3 LCPUFA, HR 2.81 (1.28,6.16), P = 0.01, whereas the association was attenuatedand no longer statistically significant in those with n-3LCPUFA levels above median. Further adjustment for CRPor triglycerides did not appreciably alter our results.
4 Cardiology Research and Practice
Ta
ble
1:B
asel
ine
char
acte
rist
ics
ofpa
rtic
ipan
tsby
quar
tile
san
din
the
upp
erde
cile
ofpl
asm
aA
DM
Aco
nce
ntr
atio
n1.
Qu
arti
les
Upp
erde
cile
12
34
0.46
(0.1
0,0.
50)
0.54
(0.5
0,0.
59)
0.63
(0.5
9,0.
70)
0.80
(0.7
0,1.
71)
Ptr
end2
0.89
(0.8
2,1.
71)
n=
342
n=
339
n=
342
n=
341
n=
136
Mal
ese
x,n
(%)
287
(83.
9)26
1(7
7.0)
249
(72.
8)22
2(6
5.1)
<0.
001
90(6
6.2)
Age
(yea
rs),
mea
n(±
SD)
58(±
9.7)
61(±
9.7)
62(±
10.7
)64
(±11
.0)
<0.
001
65.5
(±11
.2)
BM
I(k
g/m
2),
mea
n(±
SD)
27.1
(±3.
55)
26.6
(±3.
51)
26.4
(±4.
15)
26.5
(±3.
84)
0.02
26.3
(±4.
08)
Fast
ing,n
(%)3
44(1
4.2)
58(1
8.5)
53(1
6.0)
32(9
.5)
0.05
10(7
.4)
Car
diov
ascu
lar
his
tory
,n(%
)P
revi
ous
AM
I13
0(3
8.0)
143
(42.
2)13
0(3
8.0)
150
(44.
0)0.
2062
(45.
6)P
revi
ous
CB
V12
(3.5
)18
(5.3
)28
(8.2
)28
(8.2
)0.
1115
(11.
0)P
revi
ous
PV
D30
(8.8
)25
(7.4
)34
(9.9
)47
(13.
8)0.
0923
(16.
9)P
revi
ous
PC
I80
(23.
4)63
(18.
6)43
(12.
6)53
(15.
5)0.
0122
(16.
2)P
revi
ous
CA
BG
32(9
.4)
41(1
2.1)
36(1
0.5)
25(7
.3)
0.05
14(1
0.3)
Car
diov
ascu
lar
risk
fact
ors,n
(%)
Hyp
erch
oles
tero
lem
ia4
212
(65.
2)19
9(6
1.8)
189
(58.
2)15
5(4
9.8)
<0.
001
48(4
0.0)
Hyp
erte
nsi
on15
4(4
5.0)
159
(46.
9)16
3(4
7.7)
174
(51.
0)0.
8771
(52.
2)Im
pair
edLV
EF5
40(1
1.7)
31(9
.1)
35(1
0.2)
45(1
3.2)
0.45
18(1
3.2)
Dia
bete
s641
(12.
0)38
(11.
2)29
(8.5
)32
(9.4
)0.
0412
(8.8
)C
urr
ent
smok
er11
8(3
4.5)
113
(33.
3)12
3(3
6.0)
103
(30.
2)0.
2241
(30.
1)E
x-sm
oker
249
(72.
8)25
4(7
4.9)
251
(73.
6)26
7(7
8.3)
0.86
58(4
2.6)
Nev
ersm
oked
74(2
2.5)
94(2
7.7)
78(2
2.9)
101
(29.
6)0.
3137
(27.
2)Fa
mily
his
tory
ofC
AD
712
3(3
6.4)
112
(33.
3)11
4(3
4.0)
86(2
5.8)
0.02
34(2
5.4)
Clin
ical
diag
nos
isbe
fore
BC
A,n
(%)
Stab
lean
gin
ap
ecto
ris
288
(84.
2)31
8(9
3.8)
330
(96.
5)33
7(9
8.8)
<0.
001
135
(99.
3)A
cute
coro
nar
ysy
ndr
ome
54(1
5.8)
21(6
.2)
12(3
.5)
4(1
.2)
<0.
001
1(0
.7)
Ext
ent
ofC
AD
atB
CA
,n(%
)N
osi
gnifi
can
tC
AD
15(4
.4)
8(2
.4)
55(1
6.1)
84(2
4.6)
<0.
001
33(2
4.3)
1ve
ssel
dise
ase
112
(32.
7)11
8(3
4.8)
83(2
4.3)
55(1
6.1)
<0.
001
16(1
1.8)
2ve
ssel
dise
ase
107
(31.
3)99
(29.
2)88
(25.
7)65
(19.
1)<
0.00
125
(18.
4)3
vess
eldi
seas
e98
(28.
7)10
2(3
0.1)
97(2
8.4)
106
(31.
1)0.
2951
(37.
5)M
edic
atio
nfo
llow
ing
BC
A,n
(%)
Ace
tyls
alic
ylic
acid
318
(93.
0)31
4(9
2.6)
277
(81.
0)26
6(7
8.0)
<0.
001
106
(77.
9)St
atin
s30
6(8
9.5)
299
(88.
2)26
4(7
7.2)
238
(69.
8)<
0.00
183
(61.
0)β
-blo
cker
s27
0(7
9.2)
271
(79.
9)24
1(7
0.5)
240
(70.
6)0.
001
89(6
5.4)
AD
Pre
cept
orbl
ocke
r13
2(3
8.6)
97(2
8.6)
56(1
6.4)
37(1
0.9)
<0.
001
15(1
1.0)
An
tico
agu
lan
ts(w
arfa
rin
)4
(1.2
)8
(2.4
)21
(6.1
)23
(6.7
)<
0.00
15
(3.7
)A
CE
inh
ibit
ors
61(1
7.8)
64(1
8.9)
62(1
8.1)
85(2
4.9)
0.08
43(3
1.6)
An
giot
ensi
nII
rece
ptor
anta
gon
ist
41(1
2.0)
37(1
0.9)
22(6
.4)
34(1
0.0)
0.06
13(9
.6)
Loop
diu
reti
cs22
(6.4
)29
(8.6
)34
(9.9
)60
(17.
6)0.
001
28(2
0.6)
Cardiology Research and Practice 5
Ta
ble
1:C
onti
nu
ed.
Qu
arti
les
Upp
erde
cile
12
34
0.46
(0.1
0,0.
50)
0.54
(0.5
0,0.
59)
0.63
(0.5
9,0.
70)
0.80
(0.7
0,1.
71)
Ptr
end2
0.89
(0.8
2,1.
71)
n=
342
n=
339
n=
342
n=
341
n=
136
CR
follo
win
gB
CA
,n(%
)
PC
I21
4(6
2.6)
193
(56.
9)14
0(4
0.9)
91(2
6.7)
<0.
001
37(2
7.2)
CA
BG
51(1
4.9)
53(1
5.6)
61(1
7.8)
64(1
8.8)
0.34
29(2
1.3)
AC
E:a
ngi
oten
sin
conv
erti
ng
enzy
me;
AD
P:a
den
osin
edi
phos
phat
e;B
CA
:bas
elin
eco
ron
ary
angi
ogra
phy;
BM
I:bo
dym
ass
inde
x;C
AB
G:c
oron
ary
arte
ryby
pass
graf
tsu
rger
y;C
AD
:cor
onar
yar
tery
dise
ase;
CB
V:
cere
brov
ascu
lar
dise
ase;
CR
:cor
onar
yre
vasc
ula
riza
tion
;LV
EF:
left
ven
tric
ula
rej
ecti
onfr
acti
on;P
CI:
perc
uta
neo
us
coro
nar
yin
terv
enti
on;P
VD
:per
iph
eral
vasc
ula
rdi
seas
e.1M
edia
n(r
ange
)pl
asm
aA
DM
Aco
nce
ntr
atio
ns
(μm
ol/L
)ar
epr
esen
ted.
2P
tren
dby
linea
r(f
orco
nti
nu
ous
vari
able
s)an
dlo
gist
ic(f
orbi
nar
yva
riab
les)
adju
stin
gfo
rag
e(c
onti
nu
ous)
and
sex.
3N
oth
avin
gin
gest
edan
yfo
od6
hou
rspr
ior
tobl
ood
sam
ples
wer
eco
llect
ed.
4≥6
.5m
mol
/L.
5<
50%
.6In
clu
des
diab
etes
typ
e1
and
2.7In
clu
des
thos
ere
port
ing
toh
ave
atle
ast
one
1st
degr
eere
lati
vesu
ffer
ing
from
CA
Dbe
fore
the
age
of55
for
men
and
65fo
rw
omen
.
6 Cardiology Research and Practice
Ta
ble
2:Se
rum
fatt
yac
ids
and
bioc
hem
ical
mar
kers
byA
DM
Aqu
arti
les
and
inth
eu
pper
deci
leof
plas
ma
AD
MA
con
cen
trat
ion
1.
Qu
arti
les
Upp
erde
cile
12
34
Ptr
end2
0.46
(0.1
0,0.
50)n=
342
0.54
(0.5
0,0.
59)n=
339
0.63
(0.5
9,0.
70)n=
342
0.80
(0.7
0,1.
71)n=
341
0.89
(0.8
2,1.
71)n=
136
Fatt
yac
ids
TFA
s(m
g/L)
4277
(408
7,44
67)
4024
(383
9,42
09)
4115
(393
2,42
97)
4373
(419
2,45
54)
0.73
4265
(398
0,45
50)
Tota
ln-3
PU
FA(w
t%)3
7.57
(7.2
3,7.
91)
7.29
(7.0
0,7.
59)
7.70
(7.3
8,8.
01)
7.82
(7.5
1,8.
13)
0.55
7.23
(6.7
4,7.
73)
ALA
(wt%
)0.
73(0
.71,
0.76
)0.
72(0
.70,
0.74
)0.
74(0
.72,
0.76
)0.
75(0
.73,
0.78
)0.
740.
77(0
.73,
0.80
)
n-3
LCP
UFA
(wt%
)46.
90(6
.57,
7.23
)6.
52(6
.19,
6.84
)6.
86(6
.54,
7.18
)6.
84(6
.52,
7.15
)0.
546.
47(5
.97,
6.97
)
Lipi
dre
late
dpa
ram
eter
s
Apo
A1
(g/L
)1.
36(1
.33,
1.39
)1.
35(1
.32,
1.38
)1.
36(1
.33,
1.39
)1.
36(1
.34,
1.39
)0.
511.
33(1
.29,
1.37
)
Apo
B(g
/L)
0.94
(0.9
1,0.
97)
0.91
(0.8
8,0.
94)
0.95
(0.9
2,0.
97)
0.95
(0.9
2,0.
98)
0.59
0.93
(0.8
9,0.
97)
Tota
lCh
.(m
mol
/L)
5.26
(5.1
3,5.
40)
5.10
(4.9
6,5.
23)
5.29
(5.1
6,5.
42)
5.31
(5.1
7,5.
44)
0.58
5.17
(4.9
6,5.
38)
LDL
Ch
.(m
mol
/L)
3.19
(3.0
7,3.
30)
3.14
(3.0
2,3.
25)
3.32
(3.2
0,3.
43)
3.30
(3.1
9,3.
41)
0.71
3.23
(3.0
5,3.
40)
HD
LC
h.(
mm
ol/L
)1.
30(1
.26,
1.34
)1.
28(1
.24,
1.32
)1.
32(1
.28,
1.36
)1.
33(1
.29,
1.37
)0.
411.
28(1
.21,
1.34
)
Non
HD
L(m
mol
/L)
1.30
(1.2
6,1.
34)
1.28
(1.2
4,1.
32)
1.32
(1.2
8,1.
36)
1.33
(1.2
9,1.
37)
0.42
3.89
(3.6
8,4.
10)
TG
(mm
ol/L
)1.
96(1
.80,
2.12
)1.
73(1
.58,
1.89
)1.
66(1
.51,
1.81
)1.
77(1
.62,
1.92
)0.
061.
72(1
.49,
1.96
)
Lp(a
)(m
mol
/L)
0.37
(0.3
3,0.
41)
0.37
(0.3
3,0.
41)
0.37
(0.3
3,0.
41)
0.39
(0.3
5,0.
43)
0.23
0.40
(0.3
9,0.
47)
Oth
erpa
ram
eter
s
Glu
cose
(mm
ol/L
)6.
46(6
.18,
6.74
)6.
27(6
.00,
6.55
)6.
23(5
.96,
6.49
)6.
22(5
.95,
6.48
)0.
156.
28(5
.87,
6.70
)
HbA
1c(m
mol
/L)
5.97
(5.8
2,6.
12)
5.79
(5.6
4,5.
93)
5.91
(5.7
7,6.
05)
6.40
(6.2
5,6.
54)
<0.
001
6.56
(6.3
3,6.
78)
Arg
inin
e(μ
mol
/L)
76.5
(73.
8,79
.2)
80.9
(78.
3,83
.5)
70.6
(68.
0,73
.1)
53.6
(51.
1,56
.2)
<0.
001
49.9
(45.
7,54
.0)
Cre
atin
ine
(μm
ol/L
)85
.4(8
3.8,
89.4
)86
.6(8
3.8,
89.4
)88
.3(8
5.6,
91.0
)95
.2(9
2.5,
97.5
)<
0.00
110
4.0
(99.
8,10
8.2)
GFR
(mL/
min
)90
.3(8
8.8,
91.7
)88
.7(8
7.2,
90.1
)87
.1(8
5.6,
88.5
)82
.6(8
1.2,
84.0
)<
0.00
178
.0(7
5.8,
80.3
)
CR
P(m
g/L)
6.33
(5.1
9,7.
48)
4.10
(2.9
8,5.
22)
3.75
(2.6
5,4.
85)
4.09
(3.0
0,5.
19)
0.99
3.72
(2.0
0,5.
44)
ALA
:α
-lin
olen
icac
id;
Ap
oA1:
apol
ipop
rote
inA
-I;
Ch
:ch
oles
tero
l;C
RP
:C
-rea
ctiv
epr
otei
n;
DH
A:
doco
sah
exae
noi
cac
id;
DPA
:do
cosa
pen
taen
oic
acid
;E
PA:
eico
sape
nta
enoi
cac
id;
GFR
:gl
omer
ula
rfi
ltra
tion
rate
;HbA
1c:h
emog
lobi
nA
1c;H
DL:
hig
hde
nsi
tylip
opro
tein
;LD
L:lo
wde
nsi
tylip
opro
tein
;Lp(
a):l
ipop
rote
in(a
);n
-3P
UFA
s:om
ega-
3p
olyu
nsa
tura
ted
fatt
yac
ids;
TFA
s:to
talf
atty
acid
s;T
G:t
rigl
ycer
ides
;n-3
LCP
UFA
s:lo
ng
chai
nom
ega-
3po
lyu
nsa
tura
ted
fatt
yac
ids;
wt%
:per
cen
tage
byw
eigh
t.1M
edia
n(r
ange
)pl
asm
aA
DM
Aco
nce
ntr
atio
ns
(μm
ol/L
)ar
epr
esen
ted.
For
fatt
yac
ids,
lipid
rela
ted
para
met
ers,
and
oth
erpa
ram
eter
s;m
ean
(95%
con
fide
nce
inte
rval
)va
lues
are
give
naf
ter
adju
stm
ent
for
age
(con
tin
uou
s)an
dse
x.2P
tren
dby
linea
rre
gres
sion
adju
stin
gfo
rag
e(c
onti
nu
ous)
,sex
,acu
teco
ron
ary
syn
drom
e(y
es/n
o),a
nd
stat
intr
eatm
ent
atba
selin
e(y
es/n
o).
3C
ombi
nat
ion
ofA
LA,E
PA,D
PA,a
nd
DH
A.
4C
ombi
nat
ion
ofE
PA,D
PA,a
nd
DH
A.
Cardiology Research and Practice 7
Ta
ble
3:R
isk
ofac
ute
myo
card
iali
nfa
rcti
onac
ross
quar
tile
san
du
pper
deci
leof
AD
MA
.
Mod
el
Qu
arti
les
Upp
erde
cile
23
4P
tren
d
HR
95%
CI
HR
95%
CI
HR
95%
CI
HR
95%
CI
Pva
lue
Un
ivar
iate
1.26
(0.7
5,2.
12)
1.23
(0.7
3,2.
07)
1.47
(0.8
9,2.
42)
0.16
2.24
(1.4
5,3.
47)
<0.
001
Sex,
age
adju
sted
1.22
(0.7
2,2.
07)
1.16
(0.6
9,1.
96)
1.35
(0.8
0,2.
25)
0.32
2.06
(1.3
3,3.
21)
0.00
1
Mu
ltiv
aria
tead
just
ed1
1.22
(0.7
2,2.
07)
1.27
(0.7
4,2.
18)
1.44
(0.8
4,2.
47)
0.20
2.11
(1.3
4,3.
32)
0.00
1
HR
:haz
ard
rati
o;C
I:co
nfi
den
cein
terv
al.
Haz
ard
rati
osfo
rth
equ
arti
legr
oups
are
com
pare
dto
firs
tqu
arti
le;h
azar
dra
tio
for
plas
ma
AD
MA
leve
ls>
90th
per
cen
tile
isco
mpa
red
topl
asm
aA
DM
Ale
vels<
90th
per
cen
tile
.1T
he
mod
elin
clu
des
age
(con
tin
uou
s),
sex,
acu
teco
ron
ary
syn
drom
e(y
es/n
o),
diab
etes
mel
litu
s(y
es/n
o),
hyp
erte
nsi
on(y
es/n
o),
curr
ent
smok
ing
(yes
/no)
,ex
ten
dof
coro
nar
yar
tery
dise
ase
(0–3
),an
dle
ftve
ntr
icu
lar
ejec
tion
frac
tion
(con
tin
uou
s).
8 Cardiology Research and Practice
Table 4: Risk of acute myocardial infarction for the upper decile of ADMA in strata of TFAs and n-3 PUFA.
Fatty acidsBelow median Above median
P int.1HR (95% CI) HR (95% CI)
TFAs (mg/L)
Model 12 2.60 (1.41, 4.80) 1.67 (0.83, 3.36) 0.29
Model 23 2.57 (1.25, 5.29) 1.49 (0.56, 3.93) 0.35
Total n-3 PUFA (wt%)4
Model 1 1.89 (0.98, 3.63) 2.25 (1.17, 4.34) 0.72
Model 2 2.36 (1.05, 5.33) 1.97 (0.91, 4.30) 0.99
ALA (wt%)
Model 1 3.12 (1.64, 5.93) 1.49 (0.77, 2.88) 0.07
Model 2 2.42 (1.13, 5.16) 1.57 (0.69, 3.55) 0.11
n-3 LCPUFA (wt%)5
Model 1 2.05 (1.08, 3.89) 2.11 (1.08, 4.15) 0.96
Model 2 2.81 (1.28, 6.16) 1.74 (0.78, 3.90) 0.78
ALA: α-linolenic acid; CI: confidence interval; DHA: docosahexaenoic acid; DPA: docosapentaenoic acid; EPA: eicosapentaenoic acid; HR: hazard ratio; n-3 PUFAs: omega-3 polyunsaturated fatty acids; TFAs: total fatty acids; n-3 LCPUFAs: long chain omega-3 polyunsaturated fatty acids; wt%: percentage byweight.1P interaction.2Model 1: hazard ratios of acute myocardial infarction for plasma ADMA > 90th percentile with plasma ADMA levels < 90th percentile as reference. Themodel included age (continuous), sex, acute coronary syndrome (yes/no), diabetes mellitus (yes/no), hypertension (yes/no), current smoking (yes/no), extendof coronary artery disease (0–3), left ventricular ejection fraction (continuous).3Model 2: hazard ratios of acute myocardial infarction for plasma ADMA levels > 90th percentile with plasma ADMA levels < 90th percentile as reference.The model included age (continuous), sex, acute coronary syndrome (yes/no), diabetes mellitus (yes/no), hypertension (yes/no), current smoking (yes/no),extend of coronary artery disease (0–3), left ventricular ejection fraction (continuous), hypercholesterolemia (yes/no), HbA1c (continuous), and glomerularfiltration rate (continuous).4Combination of ALA, EPA, DPA, and DHA.5Combination of EPA, DPA, and DHA.
4. Discussion
In this prospective cohort study, we identified plasma ADMAlevels in the upper decile to be moderately associated withrisk of AMI. No serum n-3 PUFA was related to plasmaADMA concentration. However, the risk of AMI associatedwith elevated ADMA was particularly strong among patientswith ALA concentration below median, whereas similareffect modification for n-3 LCPUFA was only observed afteradditional adjustment.
Plasma ADMA levels in healthy individuals appears tolie in the range of 0.4–0.6 μmol/L [27]. Previous studieshave found elevated ADMA levels to be predictive of futureAMI events. Increased ADMA levels in men with ACS havebeen associated with an 81% increased risk of AMI [28]. Arecent population study in women reported a 75% increasedrisk of stroke or acute AMI in those with ADMA levels ≥0.71 μmol/L [29]. ADMA levels which are associated withCVD or mortality vary greatly [30]. This can be due todifferences in population characteristics, endpoints, samplehandling and use of analytical methods. In the presentstudy, there was a two-fold increased risk of AMI amongparticipants with plasma ADMA levels in the upper decile(≥0.82 μmol/L).
An experimental animal study demonstrated that plasmaADMA levels were reduced by EPA and DHA supple-mentation [16]. We therefore investigated if serum levelsof different n-3 PUFA modified the association betweenthe risk of AMI and circulating ADMA. However, we
observed no association between serum n-3 PUFA levels andplasma ADMA levels, which is in agreement with a recentlypublished intervention study from Norway showing no effectof n-3 PUFA supplementation on ADMA levels in maleswith long-standing hyperlipidemia [15]. Although we didnot detect significant interactions, the risk of AMI relatedto ADMA was particularly strong among patients with levelsof ALA below median, whereas no association was observedamong patients with higher levels. The association betweenrisk of AMI and ADMA was also strong in those withTFA below median. Notably, treatment with statins affectsserum concentrations of some FAs [31], but adjustment forstatin treatment did not alter our results, suggesting thatthe observed effect modifications are not induced by statintreatment. Further research is needed to clarify whether theprotective effects of TFAs are due to the presence of specificFAs other than n-3 PUFA.
Previous studies have revealed a positive relation betweenserum glucose levels and ADMA [32]. A possible explanationmay be a downregulation of DDAH-II by high levels of ROSgenerated by high levels of glucose [5]. We found HbA1c,which reflects glucose concentrations over a prolongedperiod of time, to be positively correlated to ADMA, butnot to any n-3 PUFAs. When HbA1c was included inthe multivariate model, the risk of AMI associated withADMA was strengthened and significant in patients withbelow median levels of n-3 LCPUFA, whereas there wereno associations in patients with above median levels. Thesedata indicate that the complex interaction between glucose
Cardiology Research and Practice 9
Haz
ard
rati
o
0.3 0.4 0.5 0.6 0.7 0.8 0.9 1
0.5
1
2
4
Plasma ADMA (μmol/L)
Serum α-linolenic acid < median
(a)
Haz
ard
rati
o
0.3 0.4 0.5 0.6 0.7 0.8 0.9 1
0.5
1
2
4
Plasma ADMA (μmol/L)
Serum α-linolenic acid ≥median
(b)
Haz
ard
rati
o
0.3 0.4 0.5 0.6 0.7 0.8 0.9 1
0.5
1
2
4
Plasma ADMA (μmol/L)
Total fatty acids < median
(c)
Haz
ard
rati
o
0.3 0.4 0.5 0.6 0.7 0.8 0.9 1
0.5
1
2
4
Plasma ADMA (μmol/L)
Total fatty acids ≥median
(d)
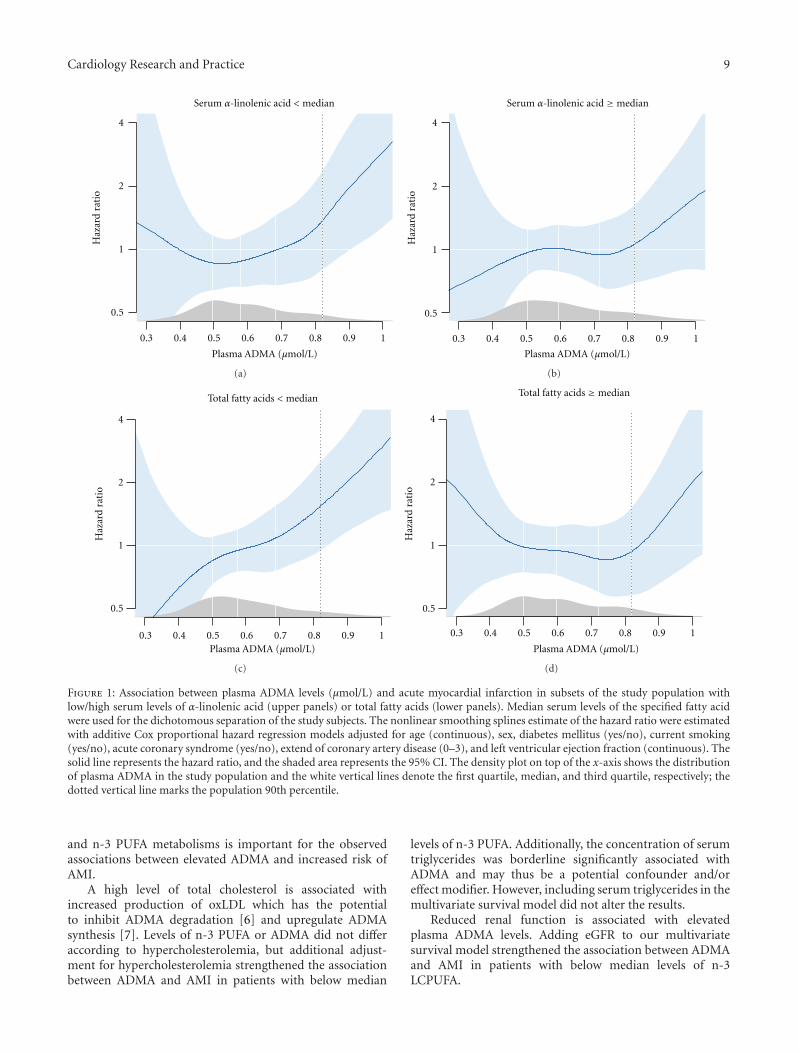
Figure 1: Association between plasma ADMA levels (μmol/L) and acute myocardial infarction in subsets of the study population withlow/high serum levels of α-linolenic acid (upper panels) or total fatty acids (lower panels). Median serum levels of the specified fatty acidwere used for the dichotomous separation of the study subjects. The nonlinear smoothing splines estimate of the hazard ratio were estimatedwith additive Cox proportional hazard regression models adjusted for age (continuous), sex, diabetes mellitus (yes/no), current smoking(yes/no), acute coronary syndrome (yes/no), extend of coronary artery disease (0–3), and left ventricular ejection fraction (continuous). Thesolid line represents the hazard ratio, and the shaded area represents the 95% CI. The density plot on top of the x-axis shows the distributionof plasma ADMA in the study population and the white vertical lines denote the first quartile, median, and third quartile, respectively; thedotted vertical line marks the population 90th percentile.
and n-3 PUFA metabolisms is important for the observedassociations between elevated ADMA and increased risk ofAMI.
A high level of total cholesterol is associated withincreased production of oxLDL which has the potentialto inhibit ADMA degradation [6] and upregulate ADMAsynthesis [7]. Levels of n-3 PUFA or ADMA did not differaccording to hypercholesterolemia, but additional adjust-ment for hypercholesterolemia strengthened the associationbetween ADMA and AMI in patients with below median
levels of n-3 PUFA. Additionally, the concentration of serumtriglycerides was borderline significantly associated withADMA and may thus be a potential confounder and/oreffect modifier. However, including serum triglycerides in themultivariate survival model did not alter the results.
Reduced renal function is associated with elevatedplasma ADMA levels. Adding eGFR to our multivariatesurvival model strengthened the association between ADMAand AMI in patients with below median levels of n-3LCPUFA.
10 Cardiology Research and Practice
FAs of the n-3 PUFA family have anti-inflammatoryproperties [33] and increased levels would potentially down-regulate the level of inflammatory markers, such as TNF-α.Including CRP in our multivariate model did not affect theassociation between the risk of AMI and ADMA, across levelsof n-3 PUFA or TFA. Additionally, no correlation betweenCRP and ADMA was observed after adjustment for ACS.Based on these results, it is unlikely that the observed riskmodifications are due to reduced inflammation.
This study is based on a large, well-characterized pop-ulation with complete followup with respect to clinicalendpoints. However, despite the clear differences in risk asso-ciations observed, even this cohort was too small to demon-strate significant effect modification. Limitations also includethe single baseline measurement of FAs and biomarkers,which may have introduced underestimated associations(regression dilution bias) [34]. Furthermore, membranes oferythrocytes are less sensitive to recent FAs intake [35, 36]and would probably give a more accurate picture of thebody’s content of FAs or long-term FAs intake than serumlevels do. The survival model was adjusted for importantcovariates such as DM, current smoking, ACS, hypertension,extent of CAD, and LVEF without materially altering ourfindings. However, residual confounding cannot be ruledout. Moderate-to-strong correlations between intake andplasma concentrations of FAs have been observed [37]. Theimportance of diet for the current results should therefore bedetermined in further studies.
5. Conclusions
The association between plasma ADMA and risk of AMIwas influenced by serum n-3 PUFA and primarily ALA.Additional research is needed to further elucidate the clinicalimplications of these findings and whether the relationshipbetween ADMA and AMI is modified by other FAs.
Acknowledgments
The authors thank all WENBIT coworkers at Haukeland andStavanger University Hospitals. The authors also thank thestaff at the Department of Nutrition, University of Oslo, forhelp with extracting the dietary data. They are grateful toLiv Kristine Øysæd, Kari Helland Mortensen, Randi Sandvik,and Marte Aanestad for excellent technical assistance duringFA composition analyses, and Gry Kvalheim and her staff atBEVITAL AS for the analyses of ADMA and HbA1C.
References
[1] M. R. Kapadia, L. W. Chow, N. D. Tsihlis et al., “Nitric oxideand nanotechnology: a novel approach to inhibit neointimalhyperplasia,” Journal of Vascular Surgery, vol. 47, no. 1, pp.173–182, 2008.
[2] J. Dulak, A. Jozkowicz, A. Dembinska-Kiec et al., “Nitric oxideinduces the synthesis of vascular endothelial growth factor byrat vascular smooth muscle cells,” Arteriosclerosis, Thrombosis,and Vascular Biology, vol. 20, no. 3, pp. 659–666, 2000.
[3] J. P. Cooke, “Flow, NO, and atherogenesis,” Proceedings of theNational Academy of Sciences of the United States of America,vol. 100, no. 3, pp. 768–770, 2003.
[4] P. Vallance, A. Leone, A. Calver, J. Collier, and S. Moncada,“Accumulation of an endogenous inhibitor of nitric oxidesynthesis in chronic renal failure,” The Lancet, vol. 339, no.8793, pp. 572–575, 1992.
[5] V. Sorrenti, F. Mazza, A. Campisi, L. Vanella, G. Li Volti,and C. di Giacomo, “High glucose-mediated imbalance ofnitric oxide synthase and dimethylarginine dimethylaminohy-drolase expression in endothelial cells,” Current NeurovascularResearch, vol. 3, no. 1, pp. 49–54, 2006.
[6] A. Ito, P. S. Tsao, S. Adimoolam, M. Kimoto, T. Ogawa, andJ. P. Cooke, “Novel mechanism for endothelial dysfunction:dysregulation of dimethylarginine dimethylaminohydrolase,”Circulation, vol. 99, no. 24, pp. 3092–3095, 1999.
[7] R. H. Boger, K. Sydow, J. Borlak et al., “LDL cholesterol upreg-ulates synthesis of asymmetrical dimethylarginine in humanendothelial cells: involvement of S-adenosylmethionine-dependent methyltransferases,” Circulation Research, vol. 87,no. 2, pp. 99–105, 2000.
[8] S. Wakino, K. Hayashi, S. Tatematsu et al., “Pioglitazonelowers systemic asymmetric dimethylarginine by inducingdimethylarginine dimethylaminohydrolase in rats,” Hyperten-sion Research, vol. 28, no. 3, pp. 255–262, 2005.
[9] C. Y. Ivashchenko, B. T. Bradley, Z. Ao, J. Leiper, P. Vallance,and D. G. Johns, “Regulation of the ADMA-DDAH system inendothelial cells: a novel mechanism for the sterol responseelement binding proteins, SREBP1c and -2,” American Journalof Physiology, vol. 298, no. 1, pp. H251–H258, 2010.
[10] H. E. Xu, M. H. Lambert, V. G. Montana et al., “Molecularrecognition of fatty acids by peroxisome proliferator-activatedreceptors,” Molecular Cell, vol. 3, no. 3, pp. 397–403, 1999.
[11] J. Xu, M. Teran-Garcia, J. H. Y. Park, M. T. Nakamura, andS. D. Clarke, “Polyunsaturated fatty acids suppress hepaticsterol regulatory element-binding protein-1 expression byaccelerating transcript decay,” Journal of Biological Chemistry,vol. 276, no. 13, pp. 9800–9807, 2001.
[12] D. Mozaffarian, “Does alpha-linolenic acid intake reduce therisk of coronary heart disease? A review of the evidence,”Alternative Therapies in Health and Medicine, vol. 11, no. 3,pp. 24–31, 2005.
[13] S. M. Kwak, S. K. Myung, Y. J. Lee, H. G. Seo, Korean Meta-analysis Study Group et al., “Efficacy of omega-3 fatty acidsupplements (eicosapentaenoic acid and docosahexaenoicacid) in the secondary prevention of cardiovascular dis-ease: a meta-analysis of randomized, double-blind, placebo-controlled trials,” Archives of Internal Medicine, vol. 172, no. 9,pp. 686–694, 2012.
[14] C. R. Harper and T. A. Jacobson, “Usefulness of omega-3 fattyacids and the prevention of coronary heart disease,” AmericanJournal of Cardiology, vol. 96, no. 11, pp. 1521–1529, 2005.
[15] H. M. A. Eid, H. Arnesen, E. M. Hjerkinn, T. Lyberg, I.Ellingsen, and I. Seljeflot, “Effect of diet and omega-3 fattyacid intervention on asymmetric dimethylarginine,” Nutritionand Metabolism, vol. 3, article 4, 2006.
[16] L. Raimondi, M. Lodovici, F. Visioli et al., “n-3 polyun-saturated fatty acids supplementation decreases asymmetricdimethyl arginine and arachidonate accumulation in agingspontaneously hypertensive rats,” European Journal of Nutri-tion, vol. 44, no. 6, pp. 327–333, 2005.
[17] A. Fard, C. H. Tuck, J. A. Donis et al., “Acute elevations ofplasma asymmetric dimethylarginine and impaired endothe-lial function in response to a high-fat meal in patients with
Cardiology Research and Practice 11
type 2 diabetes,” Arteriosclerosis, Thrombosis, and VascularBiology, vol. 20, no. 9, pp. 2039–2044, 2000.
[18] M. Ebbing, Ø. Bleie, P. M. Ueland et al., “Mortality andcardiovascular events in patients treated with homocysteine-lowering B vitamins after coronary angiography: a ran-domized controlled trial,” Journal of the American MedicalAssociation, vol. 300, no. 7, pp. 795–804, 2008.
[19] M. S. Manger, E. Strand, M. Ebbing et al., “Dietary intake of n-3 long-chain polyunsaturated fatty acids and coronary eventsin Norwegian patients with coronary artery disease,” AmericanJournal of Clinical Nutrition, vol. 92, no. 1, pp. 244–251, 2010.
[20] “Biochemical verification of tobacco use and cessation,”Nicotine and Tobacco Research, vol. 4, no. 2, pp. 149–159, 2002.
[21] J. S. Alpert, K. Thygesen, E. Antman, and J. P. Bassand,“Myocardial infarction redefined—a consensus document ofThe Joint European Society of Cardiology/American Collegeof Cardiology Committee for the redefinition of myocardialinfarction,” European Heart Journal, vol. 21, no. 18, pp. 1502–1513, 2000.
[22] M. Kates, General Analytical ProcEdures. Techniques of Lipidol-ogy, Elsevier Science, Amsterdam, The Netherlands, 1986.
[23] T. Grimstad, B. Bjørndal, D. Cacabelos et al., “Dietarysupplementation of krill oil attenuates inflammation andoxidative stress in experimental ulcerative colitis in rats,”Scandinavian Journal of Gastroenterology, vol. 47, no. 1, pp. 49–58, 2012.
[24] O. Midttun, S. Hustad, and P. M. Ueland, “Quantitative pro-filing of biomarkers related to B-vitamin status, tryptophanmetabolism and inflammation in human plasma by liquidchromatography/tandem mass spectrometry,” Rapid Commu-nications in Mass Spectrometry, vol. 23, no. 9, pp. 1371–1379,2009.
[25] A. S. Levey, L. A. Stevens, C. H. Schmid et al., “A new equationto estimate glomerular filtration rate,” Annals of InternalMedicine, vol. 150, no. 9, pp. 604–612, 2009.
[26] T. M. Therneau and P. M. Grambsch, Modeling SurvivalData—Extending the Cox Model, Springer, New York, NY,USA, 2000.
[27] J. D. Horowitz and T. Heresztyn, “An overview of plasmaconcentrations of asymmetric dimethylarginine (ADMA) inhealth and disease and in clinical studies: methodologicalconsiderations,” Journal of Chromatography B, vol. 851, no. 1-2, pp. 42–50, 2007.
[28] E. Cavusoglu, C. Ruwende, V. Chopra et al., “Relationship ofbaseline plasma ADMA levels to cardiovascular outcomes at2 years in men with acute coronary syndrome referred forcoronary angiography,” Coronary Artery Disease, vol. 20, no.2, pp. 112–117, 2009.
[29] T. Leong, D. Zylberstein, I. Graham et al., “Asymmetricdimethylarginine independently predicts fatal and nonfatalmyocardial infarction and stroke in women: 24-year follow-up of the population study of women in Gothenburg,”Arteriosclerosis, Thrombosis, and Vascular Biology, vol. 28, no.5, pp. 961–967, 2008.
[30] R. H. Boger, R. Maas, F. Schulze, and E. Schwedhelm, “Asym-metric dimethylarginine (ADMA) as a prospective marker ofcardiovascular disease and mortality—an update on patientpopulations with a wide range of cardiovascular risk,” Phar-macological Research, vol. 60, no. 6, pp. 481–487, 2009.
[31] J. I. Harris, J. R. Hibbeln, R. H. Mackey, and M. F. Muldoon,“Statin treatment alters serum n-3 and n-6 fatty acids inhypercholesterolemic patients,” Prostaglandins Leukotrienesand Essential Fatty Acids, vol. 71, no. 4, pp. 263–269, 2004.
[32] F. Abbasi, T. Asagmi, J. P. Cooke et al., “Plasma concentrationsof asymmetric dimethylarginine are increased in patients withtype 2 diabetes mellitus,” American Journal of Cardiology, vol.88, no. 10, pp. 1201–1203, 2001.
[33] R. Wall, R. P. Ross, G. F. Fitzgerald, and C. Stanton, “Fattyacids from fish: the anti-inflammatory potential of long-chainomega-3 fatty acids,” Nutrition Reviews, vol. 68, no. 5, pp. 280–289, 2010.
[34] F. B. Hu, M. J. Stampfer, E. Rimm et al., “Dietary fatand coronary heart disease: a comparison of approachesfor adjusting for total energy intake and modeling repeateddietary measurements,” American Journal of Epidemiology, vol.149, no. 6, pp. 531–540, 1999.
[35] Q. Sun, J. Ma, H. Campos, S. E. Hankinson, and F. B.Hu, “Comparison between plasma and erythrocyte fatty acidcontent as biomarkers of fatty acid intake in US women,”American Journal of Clinical Nutrition, vol. 86, no. 1, pp. 74–81, 2007.
[36] M. B. Katan, J. P. Deslypere, A. P. J. M. Van Birgelen, M.Penders, and M. Zegwaard, “Kinetics of the incorporation ofdietary fatty acids into serum cholesteryl esters, erythrocytemembranes, and adipose tissue: an 18-month controlledstudy,” Journal of Lipid Research, vol. 38, no. 10, pp. 2012–2022,1997.
[37] W. Willett, Nutritional Epidemiology, Oxford University Press,Oxford, UK, 2nd edition, 1998.
Related Documents