Oligosaccharides production and purification from barley bran using sequential supercritical CO 2 extraction, subcritical water hydrolysis and membrane filtration by Azadeh Aghashahi A thesis submitted in partial fulfillment of the requirements for the degree of Master of Science In Bioresource and Food Engineering Department of Agricultural, Food and Nutritional Science University of Alberta © Azadeh Aghashahi, 2020

Welcome message from author
This document is posted to help you gain knowledge. Please leave a comment to let me know what you think about it! Share it to your friends and learn new things together.
Transcript

Oligosaccharides production and purification from barley bran using sequential
supercritical CO2 extraction, subcritical water hydrolysis and membrane filtration
by
Azadeh Aghashahi
A thesis submitted in partial fulfillment of the requirements for the degree of
Master of Science
In
Bioresource and Food Engineering
Department of Agricultural, Food and Nutritional Science
University of Alberta
© Azadeh Aghashahi, 2020

ii
Abstract
Barley bran is a by-product of the food industry, and a good source of lipid, protein and fiber. In
this thesis research, fractionation of barley bran was carried out to remove lipid, starch and protein
to obtain a sample enriched in fiber, specially arabinoxylan. Fiber concentrate was used for further
hydrolysis, targeting the production of xylooligosaccharides (XOS) with degree of polymerization
2-4. Lipid was extracted using supercritical CO2, followed by enzymatic hydrolysis to remove
starch. Defatted bran with 0.3% lipid was obtained. Defatted-destarched bran had 1% starch and
26.3% db arabinoxylan. Subcritical water (SCW) was used as an environmentally friendly
approach to hydrolyse defatted-destarched bran. Temperature had a significant effect on the XOS
production. The highest XOS content was produced at 180℃, where 112.5 mg of total XOS was
obtained within 30 min, with no significant difference after 60 min hydrolysis. Deproteinized bran
with 42.2% db arabinoxylan was hydrolyzed using SCW at 180℃/50 bar/30 min. Amounts of
100.9, 120.6, 112.4 and 334 mg of xylobiose, xylotriose, xylotetraose and total XOS were obtained
in the hydrolysate. Deproteinized bran was also treated using enzymatic hydrolysis with endo-
xylanase. Maximum amount of total XOS was 21.11 mg obtained using 10 U of enzyme at 40℃,
pH of 4.5 after 4 h incubation. The recovery of total XOS from initial xylan of deproteinized bran
was 78.4 and 45.1% for SCW and enzymatic hydrolysis, respectively. Purification of deproteinized
bran SCW hydrolysate was performed using ultrafiltration with 1 kDa membrane to remove
compounds with high molecular weight. In total, 68% of initial total XOS was recovered after
passing through 1 kDa membrane. This permeate was treated by activated carbon adsorption (10%
w/w) to remove monomers (arabinose and xylose) from XOS. Activated carbon was washed with
aqueous ethanol solutions (15 and 30% v/v) to liberate the adsorbed XOS. Finally, 55% of xylose
and 51% of arabinose were removed and 52% of total XOS was recovered in the ethanol fraction.

iii
The results suggest that SCW hydrolysis is a promising method to produce XOS from barley bran
in a short time with higher recovery than the enzymatic hydrolysis. The obtained XOS has potential
use in the functional food products as prebiotics.
Keywords: Arabinoxylan, Barley bran, Nano/ultrafiltration, Subcritical water, Supercritical CO2,
Xylooligosaccharides.

iv
Preface
Financial support for this research was provided by Alberta Pulse Growers, Natural Sciences and
Engineering Research Council of Canada (Dr. Saldaña's NSERC Discovery Grant) and Alberta
Innovates. This project originated with the idea of Dr. Saldaña to add value to waste or by-products
from the food industry using green technologies.
This thesis is an original work by Azadeh Aghashahi and part of the chapters have been presented
in conferences. Chapter 3 of this thesis has been presented as: “Aghashahi, A. and Saldaña, M.D.A.
(2019) Lipid extraction from barley bran using supercritical CO2 at the ALES
GSA Research Symposium, University of Alberta, Edmonton”. I was responsible for the
experimental design, performing experiments, data collection and analysis, and drafting the poster.
The experimental design and data obtained were discussed with my supervisor Dr. Saldaña. She
revised the poster. Also, Chapter 3 has been presented as: “Aghashahi, A. and Saldaña, M.D.A.
(2019) Bioactive lipids and protein removal by fractionation of barley bran at the 16th Annual
Conference of the Natural Health Product Research Society (NHPRS) of Canada: Growing NHPs
for the Future, Edmonton”. I was responsible for the experimental design, performing experiments,
data collection and analysis, and drafting the poster. Dr. Saldaña helped with the experimental
design, data discussion, and revised the poster.

v
Chapter 3 will be submitted as: “Aghashahi, A. and Saldaña, M.D.A. (2020). Oligosaccharides
production from barley bran using sequential supercritical CO2 extraction and subcritical water
hydrolysis to the Journal of Supercritical Fluids”. I was responsible for the experimental design,
performing experiments, data collection and analysis. Dr. Saldaña helped me with the experimental
design and data discussion.

vi
ACKNOWLEDGEMENTS
I would like to express my thanks to many people, who have helped me in this Master thesis
journey. Foremost, my sincere gratitude to my supervisor, Dr. Marleny Aranda Saldaña, for her
patience, guidance, encouragement and advice that she has provided me throughout my research.
It has been a great privilege to spend a couple of years under her supervision in the Department of
Agricultural, Food and Nutritional Science at the University of Alberta, and this experience has
been grateful and valuable for me. She was really supportive during my research and thesis writing
and gave me confidence with her positive attitude. I would also like to extend my special thanks
to my committee member, Dr. Feral Temelli for her support, and helpful suggestions.
Thanks to my labmates Carla, Raquel, Alaleh, Angelica, Yujia, Idaresit, Srujana, Eric and Ricardo.
They helped me with their constant suggestions and providing me a supportive and positive
environment. I would also like to thank Edwin Sunchez for his help during the purification process.
Foremost, I am forever thankful to my husband, Amir, who helped me throughout the difficult
times, and all the emotional support, entertainment and caring. I would also thank my lovely
daughter, Kimia, who gave me energy during my research with her kindness and amiability. Lastly,
and most importantly, I would like to thank Alberta Pulse Growers, Natural Sciences and
Engineering Research Council of Canada (Dr. Saldaña's NSERC Discovery Grant) and Alberta
Innovates for providing the funds to carry out this thesis research.
vii
TABLE OF CONTENTS
ABSTRACT ............................................................................................................................ ii
PREFACE .............................................................................................................................. iv
ACKNOWLEDGEMENTS .................................................................................................. vi
LIST OF TABLES ............................................................................................................... xiii
LIST OF FIGURES .............................................................................................................. xv
NOMENCLATURE .............................................................................................................. xx
Chapter 1: Introduction ......................................................................................................... 1
1.1. Rationale ........................................................................................................................... 1
1.2. Hypothesis .......................................................................................................................... 6
1.3. Objectives.............................................................................................................................7
Chapter 2: Literature review ................................................................................................. 9
2.1. Barley grain ........................................................................................................................ 9
2.1.1. Classification and uses ............................................................................................... 9
2.1.2. Structure and chemical composition ......................................................................... 10
2.2. Barley bran ........................................................................................................................ 11
2.2.1. Structure .................................................................................................................... 11
2.2.2. Chemical composition ............................................................................................... 12
2.3. Fractionation of barley bran .............................................................................................. 18
2.3.1. Extraction of lipids .................................................................................................... 18
2.3.2. Starch and protein removal ........................................................................................ 21
2.4. Oligosaccharides ................................................................................................................ 22

viii
2.4.1. Classification .............................................................................................................22
2.4.2. Physicochemical properties of oligosaccharides........................................................23
2.4.3. Health benefits of oligosaccharides ...........................................................................23
2.4.4. Production of oligosaccharides ................................................................................. 24
2.4.4.1. Chemical and biochemical synthesis of oligosaccharides..................................... 24
2.4.4.2. Enzymatic glycosylation ....................................................................................... 25
2.4.4.3. Polysaccharide depolymerization ......................................................................... 26
2.4.4.4. Hydrothermal production of oligosaccharides from hemicellulosic biomass ...... 26
2.5. Subcritical water technology ............................................................................................. 28
2.5.1. Subcritical water production of oligosaccharides ..................................................... 30
2.6. Production of oligosaccharides by enzymatic depolymerization ....................................... 35
2.7. Xylo-oligosaccharides (XOS) separation and purification ................................................ 40
Chapter 3. Xylo-oligosaccharides production from barley bran using subcritical water
technology and enzymatic hydrolysis .................................................................................... 46
3.1. Introduction ........................................................................................................................ 46
3.2. Materials and methods ....................................................................................................... 50
3.2.1. Raw material and chemicals ...................................................................................... 50
3.2.2. Proximate compositional analysis of barley bran and defatted, destarched and
deproteinized fractions .............................................................................................. 51
3.2.2.1. Moisture content ................................................................................................ 51
3.2.2.2. Ash content ........................................................................................................ 51
3.2.2.3. Protein content ................................................................................................... 52
3.2.2.4. Lipid content ...................................................................................................... 52

ix
3.2.2.5. Carbohydrates .................................................................................................... 53
3.2.2.6. Starch content .................................................................................................... 53
3.2.2.7. Beta-glucan content............................................................................................. 55
3.2.2.8. Determination of structural carbohydrates and lignin ........................................ 56
3.2.3. Lipid extraction from barley bran .............................................................................. 58
3.2.3.1. Lipid extraction from barley bran using supercritical CO2 (SC-CO2) within
a 10 mL extraction vessel .................................................................................. 58
3.2.3.2. Tocopherol analysis ......................................................................................... 60
3.2.3.3. Lipid extraction from barley bran using SC-CO2 within a 300 mL extraction
vessel ................................................................................................................. 60
3.2.4. Starch removal from defatted barley bran ................................................................. 61
3.2.4.1. Subcritical water hydrolysis .............................................................................. 62
3.2.5. Protein removal from defatted and destarched bran ................................................... 63
3.2.5.1. Enzymatic hydrolysis of defatted – destarched and deproteinized bran ............. 64
3.2.5.1.1. Substrate and enzyme preparation ........................................................... 64
3.2.5.1.2. Enzymatic hydrolysis with endo beta-xylanase ....................................... 65
3.2.6. Characterization of hydrolysates .......................................................................... 65
3.2.6.1. pH determination ........................................................................................ 65
3.2.6.2. Reducing sugar determination .................................................................... 65
3.2.6.3. Total sugars determination ......................................................................... 66
3.2.6.4. Monosaccharides and organic acids determination .................................... 67
3.2.6.5. Xylo-oligosaccharides determination by HPLC ......................................... 67

x
3.2.7. Statistical analysis .................................................................................................... 68
3.3. Results and discussion ...................................................................................................... 68
3.3.1. Lipid extraction with supercritical CO2 using 10 and 300 mL extraction
vessels ..................................................................................................................... 68
3.3.2. Proximate composition of raw, defatted and defatted-destarched bran .................. 73
3.3.3. Characterization of SCW hydrolysates ................................................................... 76
3.3.3.1. Change in pH .................................................................................................. 76
3.3.3.2. Reducing sugar content of SCW hydrolysates ............................................... 79
3.3.3.3. Total sugars composition ................................................................................ 83
3.3.3.4 Xylo-oligosaccharides (XOS) and monosaccharides by HPLC....................... 91
3.3.4. Removal of protein from defatted–destarched bran .................................................103
3.3.5. Characterization of enzymatic hydrolysates ............................................................ 110
3.3.5.1. Reducing sugar ................................................................................................ 110
3.3.5.2. Xylo-oligosaccharides (XOS) content by HPLC............................................. 111
3.3.6. Characterization of subcritical water hydrolysates from deproteinized bran .......... 117
3.3.6.1. Reducing sugar................................................................................................. 117
3.3.6.2. Xylo-oligosaccharides content (XOS) by HPLC............................................. 117
3.4. Conclusions .................................................................................................................. 124
Chapter 4. Xylo-oligosaccharides purification of SCW-treated barley bran
using membrane separation followed by activated carbon
adsorption ..........................................................................................................126
4.1. Introduction .................................................................................................................... 126

xi
4.2. Materials and methods ..................................................................................................... 132
4.2.1. Purification by ultrafiltration .................................................................................... 134
4.2.1.1. Ultrafiltration of the defatted-destarched bran SCW hydrolysate ..................... 136
4.2.1.2. Ultrafiltration of the deproteinized bran SCW hydrolysate ............................... 137
4.2.1.3. Cleaning of the ultrafiltration System ................................................................ 137
4.2.2. Purification of the model system of PreticXTM XOS + xylose solution by
Nanofiltration ............................................................................................................. 138
4.2.3. Purification of PreticXTM XOS + xylose solution by activated carbon
adsorption Method ....................................................................................................... 140
4.2.4. Purification and decolorization of permeates E and F by activated carbon
adsorption method ........................................................................................................ 141
4.2.5. Xylooligosaccharides and monosaccharides determination by HPLC …................... 142
4.2.6. Statistical analysis ....................................................................................................... 142
4.3. Results and discussion ..................................................................................................... 142
4.3.1. Xylooligosaccharides content after ultrafiltration of defatted-destarched
bran SCW hydrolysate ................................................................................................ 142
4.3.2. Xylooligosaccharides content after ultrafiltration of deproteinized bran
SCW hydrolysate .......................................................................................................... 148
4.3.3. Xylooligosaccharides content after nanofiltration and activated carbon
treatment of a model system PreticXTM XOS + xylose solution ............................... 154
4.3.4. Xylooligosaccharide and monomer contents after activated carbon
treatment of ultrafiltration permeates E and F obtained from deproteinized
xii
bran SCW hydrolysate ............................................................................................................ 161
4.4. Conclusions ...................................................................................................................... 168
Chapter 5: Conclusions and recommendations .................................................................. 170
5.1. Conclusions....................................................................................................................... 170
5.2. Recommendations and future work.................................................................................. 175
References............................................................................................................................... 177
APPENDIX A. Calibration curves ...................................................................................... 194
APPENDIX B. XOS production using SCW and enzymatic hydrolysis........................... 200
APPENDIX C. XOS purification using filtration and adsorption..................................... 212

xiii
LIST OF TABLES
Table 2.1. Composition of minor components of whole barley and barley fractions (Adapted
from van Donkelaaretal., 2015). ............................................................................................. 16
Table 2.2. Physical and chemical properties of water at ambient and subcritical
condition.................................................................................................................................. 29
Table 2.3. Production of oligosaccharides from agricultural by-products using different
hydrothermal treatments. ........................................................................................................ 31
Table 2.4. Production of XOS from agricultural by-products using enzymatic hydrolysis....39
Table 2.5. Purification of XOS produced from agricultural by-products using enzymatic and
hydrothermal hydrolysis. ........................................................................................................ 45
Table 3.1. Composition of barley bran. ................................................................................. 74
Table 3.2. Structural carbohydrates in defatted and defatted-destarched bran ...................... 74
Table 3.3.a. Sugar composition after SCW treatment ........................................................... 84
Table 3.3.b. Sugar recovery after SCW treatment.................................................................. 85
Table 3.4. Recoveries of XOS and monosaccharides in the SCW hydrolysates at 50 bar/5
mL/min. .................................................................................................................................. 94
Table 3.5. Xylo-oligosaccharides recovery from selected literature raw materials and
corresponding extraction conditions. .................................................................................... 101
Table 3.6. Extraction yield and sugars recovery of defatted-destarched bran. .....................108
Table 3.7. Extraction yield and sugars recovery of deproteinized bran. ...............................109
Table 3.8. Recoveries of XOS obtained after enzymatic hydrolysis. ...................................112

xiv
Table 3.9. Amounts of xylo-oligosaccharides (XOS) obtained by SCW and enzymatic
hydrolysis.............................................................................................................................. 123
Table 4.1. XOS and xylose contents of PretricXTM + xylose solution, the retentate and
permeate obtained after membrane filtration, water and ethanol fraction obtained after
activated carbon adsorption. ................................................................................................. 160
Table 4.2. XOS, xylose and arabinose contents after activated carbon treatment (10%) of
permeates (E and F) obtained from deproteinized bran SCW hydrolysate. ......................... 166

xv
LIST OF FIGURES
Figure 2.1. Anatomy of barley grain: a) whole grain and b) layers (Adapted from Kent, 1983)
.............................................................................................................................................. 11
Figure 2.2. Barley milling flow; SD, shorts duster; bran and fiber-rich fraction ............... 17
Figure 2.3. Chemical synthesis of oligosaccharides (Adapted from Barreteau et al., 2006)
.............................................................................................................................................. 25
Figure 2.4. Phase diagram of water (Adapted from Morphy and Koop, 2005). ................ 28
Figure 2.5. Reaction pathways for hemicellulose hydrolysis and formation of degradation
products in SCW (Adapted from Ruiz et al., 2017) ............................................................ 33
Figure 3.1. Supercritical CO2 extraction equipment with 10 mL extraction vessel:
V= check valve, V1= cylinder valve 1, V2 and V3 = micrometering valves,
TIC= temperature indicator controller................................................................................. 59
Figure 3.2. Subcritical fluid system: P= pressure gauge,
and T1 and T2= thermocouples........................................................................................... 63
Figure 3.3. Lipid extraction from barley bran using supercritical CO2: (a) extract weight (g)
within 10 mL vessel, (b) extract yield within 10 mL vessel, (c) extract weight
(g) within a 300 mL vessel................................................................................................... 69
Figure 3.4. Lipid extraction recovery as a function of CO2/feed (g/g) ratio at 300 bar and
70°C..................................................................................................................................... 72

xvi
Fig. 3.5. Content of α- tocopherol in lipids extracted at different temperatures and pressures
for 30 min within 10 mL vessel. Means with different letters are significantly different at
p<0.05.................................................................................................................................... 73
Figure 3.6. Structural carbohydrates of defatted bran and defatted-destarched bran. Means
within the same group of structural carbohydrates with different letters are significantly
different at p<0.05 .................................................................................................................76
Figure 3.7. pH values of the SCW extracts at different temperatures and time .................. 78
Figure 3.8. Organic acids of the SCW extracts at different temperatures after 15 min….... 78
Figure 3.9. Yield of reducing sugar after SCW hydrolysis at different temperatures
and times, at 5 mL/min water flow rate and 50 bar ............................................................. 80
Figure 3.10. Total recovery of (a) glucose (b) xylose (c) arabinose in the liquid extracts
at 50 bar and 5 mL/min ......................................................................................................... 86
Figure 3.11. Total recovery of sugars (glucose, xylose, arabinose, galactose) in the liquid
extracts at 50 bar and 5 mL/min............................................................................................. 87
Figure 3.12. Chromatograms obtained from DF-DS bran hydrolysis by SCW at
temperatures (a) 120°C (b) 140°C (C) 160°C (d) 180°C (e) 200°C. X4: 14.5 min,
X3: 16.1 min, X2: 18.0 min, xylose: 20.3 min, arabinose: 22.4 min. .................................. 92
Figure 3.13. Total recovery of xylo-oligosaccharides (XOS) in the liquid extracts at
180°C, 50 bar and 5 mL/min. Means within the same group of XOS with different letters are
significantly different at p<0.05 ........................................................................................... 95

xvii
Figure 3.14. Reaction pathways for conversion of glucose and fructose to organic
acids in subcritical water media........................................................................................... 96
Figure 3.15. The dried deproteinized fraction obtained after protein removal……........... 103
Figure 3.16. Structural carbohydrates of defatted, defatted-destarched and
deproteinized bran. Means within the same group of structural carbohydrates with different
letters are significantly different at p<0.05......................................................................... 104
Figure 3.17. Overview of the structural carbohydrates of defatted-destarched bran ........ 108
Figure 3.18. Overview of the structural carbohydrates of deproteinized bran.................. 109
Figure 3.19. Yield of reducing sugars for enzymatic hydrolysates................................... 111
Figure 3.20. Recovery of xylo-oligosaccharides (XOS) in the enzymatic
hydrolysates using (a) 10 U xylanase and (b) 2.5 U xylanase. Means within the same group
of XOS with different letters are significantly different at p<0.05..................................... 116
Figure 3.21. Chromatograms obtained from deproteinized bran hydrolysis by (a) SCW
(180°C/50 bar/30 min) and (b) xylanase enzyme (10 U/4 h).............................................. 119
Figure 3.22. Total recovery of xylo-oligosaccharides (XOS) in the SCW and enzymatic
hydrolysates from deproteinized bran. Means within the same group of XOS with different
letters are significantly different at p<0.05......................................................................... 120
Figure 4.1. Minimate TFF Capsule System: (a) ultrafiltration system, (b) membrane, and (C)
overall diagram.................................................................................................................... 134

xviii
Figure 4.2. (a) Semi-continuous nanofiltration system and (b) membrane loading
inside the reactor.................................................................................................................. 139
Figure 4.3. Mass balance after ultrafiltration of defatted-destarched bran SCW
hydrolysate with 1 and 3 kDa membranes........................................................................... 146
Figure 4.4. Ultrafiltration of defatted-destarched bran SCW hydrolysate using:
(a) 1 kDa and (b) 3 kDa membranes.Means within the same group of XOS with different
letters are significantly different at p<0.05 (A-B) for Fig 4.4a between permeate C and
retentate C, (a-b) for Fig. 4.4a-b between permeate A and permeate B, retentate A and
retentate B............................................................................................................................ 147
Fig. 4.5. (a) Ultrafiltration of XOS from deproteinized bran SCW hydrolysate and
obtained retentate and (b) permeates (E and F) obtained by 1 kDa membrane................... 150
Figure 4.6. HPLC chromatographs of xylobiose (X2), xylotriose (X3), xylotetraose
(X4) and arabinose obtained after the ultrafiltration process through 1 kDa membrane:
(a) deproteinized bran SCW hydrolysate; (b) permeate E; (c) retentate E; (d) permeate F;
and (e) retentate F..................................................................................................................151
Figure 4.7. Mass balance after ultrafiltration of deproteinized bran SCW hydrolysate
with 1 kDa membrane.......................................................................................................... 153
Figure 4.8. Recovery of XOS from deproteinized bran SCW hydrolysate using 1 kDa
membrane. Means within the same group of XOS with different letters are significantly
different at p<0.05................................................................................................................. 154

xix
Figure 4.9. Mass balance after: (a) nanofiltration and (b) activated carbon adsorption of
PreticXTM XOS + xylose solution....................................................................................... 159
Figure 4.10. (a) Color of the permeate E from deproteinized bran SCW hydrolysate after
ultrafiltration using 1 kDa membrane and (b) ethanol fraction C from permeate E
after activated carbon adsorption (10%)............................................................................. 163
Figure 4.11. HPLC chromatographs of xylobiose (X2), xylotriose (X3), xylotetraose (X4),
xylose and arabinose obtained after activated carbon adsorption treatment. (a) permeate
E from ultrafiltration with1 kDa membrane; (b) ethanol fraction C from 10% activated
carbon adsorption; and (c) water fraction C from 10% activated carbon adsorption for 30
min...................................................................................................................................... 165
Figure 4.12. Mass balance after activated carbon adsorption (a) permeate E and
(b) permeate F obtained from ultrafiltration of deproteinized bran
SCW hydrolysate............................................................................................................... 166
Figure 4.13. Overall scheme of sequential purification of deproteinized bran
SCW hydrolysate using ultrafiltration followed by activated carbon adsorption.............. 167

xx
NOMENCLATURE
Symbols and abbreviations
ANOVA: Analysis of variance
AXOS: Arabinoxylo-oligosaccharides
AX: Arabinoxylan
DF-DS: Defatted-destarched
DNS: Dinitrosalicylic acid
DP: Degree of polymerisation
EDTA: Ethylenediamine tetra acetic acid
FOS: Fructo-oligosaccharides
HCl: Hydrochloric acid
HMF: Hydroxyl methyl furfural
KOH: Potassium hydroxide
LCM: Lignocellulosic material
MWCO: Molecular weight cut off
NaOH: Sodium hydroxide
NREL: National Renewable Energy Laboratory
OS: Oligosaccharides
POS: Pectic-oligosaccharides

xxi
P: Pressure
SCW: Subcritical water
SC-CO2: Supercritical CO2
T: Temperature
TFF: Tangential flow filtration
XOS: Xylo-oligosaccharides
X2: Xylobiose
X3: Xylotriose
X4: Xylotetraose
X6: Xylohexaose

1
Chapter 1: Introduction
1.1. Rationale
Barley (Hordeum Vulgare L) is one of the most important crops grown in large amounts
worldwide. It is mainly used as animal feed or as a raw material for malt production (Baik and
Ullrich, 2008). However, it is considered as a major food source in some regions of Asia and
northern Africa (Newman and Newman, 2006). In recent years, barley has grown as an alternative
to most commonly used cereals in the food industry. There is a growing interest in barley research
due to the existence of non-starch polysaccharides such as mixed linkage (1-3), (1-4)-beta-D-
glucans and arabinoxylans (Izydorczyk and Dexter, 2008). In addition, barley contains other
valuable dietary fiber components such as cellulose, fructans, galactomannans, and
arabinogalactans (MacGregor and Fincher, 1993).
Native barley kernel consists of an embryo and endosperm, which are surrounded by outer tissue
layers including aleurone, testa, pericarp and hull (Jadhav et al., 1998). Pearling is a primary
process in which pericarp, testa, aleurone, subaleurone layers and germ are removed as bran or
pearling flour fraction and the remaining part is called pearled barley. Therefore, barley bran has
a complex lignocellulosic–starch structure (Gómez et al., 2005). Barley endosperm is rich in
starch, protein and beta-glucan while most arabinoxylans are present in the husk and bran (Kunze,
2010; Yeung and Vasanthan, 2001). Wang (1992) investigated the pearling of waxy and hulless

2
barley and reported 6-12% lipids in barley bran formed by outer layers of grain. Sullivan et al.
(2010) investigated the chemical composition of whole grain barley flour and bran. These authors
reported higher total starch content in flour (76.80%) than in the bran fraction (36.80%). Also, in
this study, flour had 3.5% total fiber (1.9% soluble and 1.6% insoluble fiber), while bran had
37.6% total fiber (11% soluble and 26.6% insoluble fiber). The flour had lower protein content
(5.41%) than the bran (10.47%). Barley grain has 8-13% (w/w) protein, but different protein types
are present in barley grain tissues (Pomeranz and Shands, 1974). Barley endosperm contains
mainly hordein (35–45%) and glutelin (35–45%) proteins, while cytoplasmic proteins (mainly
albumin and globulin) are mostly present in the bran and germ (Lâsztity, 1984).
Currently, barley bran rich in protein, carbohydrates and lipids is a by-product and has been used
for the extraction of lipids. Solvent extraction of lipids from different by products using hexane or
petroleum ether as a traditional method has been reported in the literature (Devittori et al., 2000;
Kok and Dowd, 1998). Supercritical CO2 (SC-CO2) is an alternative green extraction method, in
which carbon dioxide is used as a solvent above its critical temperature (31.1°C) and pressure (73.8
bar). CO2 is non-toxic, recyclable, cheap, non-flammable and can easily be separated from the
extracts. Extraction of cocoa butter from Brazilian cocoa beans using supercritical CO2 and ethane
was reported by Saldaña et al. (2002). Also, extraction of lipids from different cereal products and
oilseeds including millet bran (Devittori et al., 2000), rice bran (Sparks et al., 2006), and barley
pearling flour (Temelli et al., 2013) was reported.

3
The other component in barley bran is arabinoxylans (AX), which are polymers composed of
pentose sugars, known as pentosans. They are the major hemicellulosic component in the cell wall
of cereal plants, such as wheat, rice and barley. Wheat, rye, barley and oat bran has 9.0–18%, 12.1–
14.8%, 4.8–9.8% and 4.0–13.0% db of total arabinoxylan, respectively (Andersson et al., 2008).
Arabinoxylans are often water-unextractable in the bran due to the strong interactions with other
cell wall components such as proteins and lignin and only a small part of them (6%) is water-
extractable (Maes and Delcour, 2002). Arabinoxylans are composed of a linear backbone of
(1→4)-linked β-D-xylopyranose units, with attached residues of α-L-arabinofuranose to either
O(2) or O(3) of xylose or to both O(2) and O(3). Phenolic compounds, mainly ferulic acid (FA),
can further substitute the arabinose residues in the C-5 position (Rattan et al., 1994; Izydorczyk
and Biliaderis, 1995).
Arabinoxylans hemicellulose has a potential value as a food ingredient, either as a dietary fiber or
converted into different value-added biomolecules such as prebiotic xylo-oligosaccharides (XOS)
and arabinoxylo-oligosaccharides (AXOS) (Broekaert et al., 2011). The XOS and AXOS can be
produced from polymeric AX using acid hydrolysis, hydrothermal treatment, extensive dry ball
milling or enzymatic hydrolysis (Sun et al., 2002; Falck et al., 2014). Endo-1,4-β-xylanase is the
most commonly used enzyme in order to breakdown β-1,4-linked xylan. Therefore, water-
unextractable arabinoxylans can be solubilized, and further released as solubilised AX. The
enzyme breaks the AX to XOS and AXOS with different lengths and structures (Courtin et al.,

4
1999). Traditionally, extraction of hemicelluloses from cereal and other plant biomass is carried
out using alkaline treatment. But alkaline treatment leads to the removal of acetyl, uronic acid and
phenolic substitutions, which are valuable compounds (Egüés et al., 2014). Other methods have
also been used for the extraction and purification of AX from cereal by-products, including acid
pretreatment of barley husk with the AX yield of 26.1% (Höije et al., 2005), ultrasound assisted
extraction from corn cob with the yield of 28.8% (Ebringerová et al., 1998) and steam pretreatment
of barley husk with the yield of 25% (Persson et al., 2009). Different approaches have been used
to produce XOS from xylan-rich substrates including: i) enzymatic degradation of xylan, and ii)
physical, physico-chemical or chemical degradation of xylan. Zhao and Dong (2016) extracted
xylan from wheat bran using alkaline treatment at pH 9 and further hydrolyzed it with endo-
xylanase, obtaining 57.55% XOS with degree of polymerization (DP) 2–4 after membrane
filtration using 20 and 1 kDa cutoff membranes sequentially.
An alternative method for the production of XOS is subcritical water (SCW) processing, also
known as high temperature water, superheated water or hot liquid water. This technology is
considered as a promising green hydrothermal treatment in which water is used at temperatures
between its boiling and critical points (100 and 374°C, respectively). Enough pressure below the
critical point (221 bar) is also needed to maintain water in the liquid phase (Moran and Shapiro,
2006). In SCW technology, water polarity decreases by increasing the temperature under pressure,
therefore it can extract selectively polar and non-polar organic compounds of different biomass
5
matrices (Alvarez et al., 2014). Moreover, fast, homogeneous and efficient reactions can take place
in SCW due to the formation of ionic products and decrease in the dielectric constant, viscosity,
and density of water (Kruse and Dinjus, 2007). Subcritical water hydrolysis showed promising
hydrolysis of hemicellulose polymers from biomass with low cost and no use of chemicals. Also,
this method allows extraction of hemicelluloses as oligomers rather than monomeric sugars (Saha,
2003). SCW hydrolysis of hemicellulose to oligomers from wheat bran (Ruthes et al., 2017),
triticale, wheat, barley, oat, canola, and mustard straws (Pronyk and Mazza, 2012), corn cob
(Makishima et al., 2009), and bagasse (Sukhbaatar et al., 2014) was reported. Ciftci and Saldaña
(2015) investigated the hydrolysis of sweet blue lupin hull to obtain hemicellulose sugars using
SCW. They reported 25.4% of hemicellulose (12.8, 6.7, 4.1, and 1.8% of xylose, galactose,
arabinose and mannose, respectively) in the raw material. In that study, maximum hemicellulose
sugar recovery was 85.5% in the extracts obtained at 180°C, 50 bar, flow rate of 5 mL/min, and
pH 6.2. Lu et al. (2009) studied the decomposition of Japanese beech by semi-continuous hot-
compressed water at 200–230°C/100 bar and reported the hydrolysis of 55.1% of initial
hemicellulose and obtaining XOS with 14.1% in the water soluble portion.
The oligosaccharides obtained after hydrolysis is a mixture of different compounds. Therefore,
further purification is needed to obtain the crude oligosaccharides. Vacuum evaporation is a
suitable method that removes acetic acid and flavours from the product, increasing the
concentration of oligomers (Eden et al., 1998). Membrane techniques have been studied to remove

6
oligosaccharides with undesired DP range and non-saccharide compounds. Zhao and Dong (2016)
used ultrafiltration (20 kDa) and nanofiltration (1 kDa) to purify xylo-oligosaccharides with DP 2-
4 obtained from wheat bran. Rico et al. (2018) investigated the application of nanofiltration using
a 0.3 kDa membrane for the XOS purification with DP 2-17 from autohydrolysis of peanut shells
to remove low molecular weight compounds such as monosaccharides, acetic acid, and some non-
saccharide compounds.
To date, there are no studies using barley bran to obtain XOS with this green technology.
Therefore, barley bran rich in xylan and arabinan will be used to produce XOS as value added
products.
1.2. Hypothesis
It is hypothesized that fractionation of barley bran can be performed using SC-CO2 for lipid
extraction followed by enzymatic and alkaline treatments for starch and protein removal,
respectively. It is also hypothesized that SCW can be used as an alternative technology for the
hydrolysis of defatted, destarched and deproteinized bran to obtain XOS. It is hypothesized that
membrane separation can be effective to purify SCW hydrolysates and obtain XOS with less
impurities.
7
1.3. Objectives
The main objective of this study was to hydrolyse the hemicellulose fraction of barley bran to
obtain oligosaccharides using SCW and separate oligomers with desired DP range. To achieve this
main objective, some specific objectives were to:
• Evaluate of process parameters including time, pressure and temperature on lipid extraction
yield from raw barley bran using supercritical CO2 (Chapter 3).
• Remove starch from defatted bran using enzymatic hydrolysis by incubation with alpha-
amylase for 40 min at 98-100°C followed by amyloglucosidase at 60°C for 30 min (Chapter
3).
• Remove protein from defatted-destarched bran using alkaline treatment with NaOH
solution (Chapter 3).
• Study the effect of parameters including temperature and time on the generation of XOS
from defatted-destarched bran using SCW technology (Chapter 3).
• Study the ability of endo-1,4-β-xylanase to hydrolyze defatted, destarched and
deproteinized bran to produce XOS with two concentrations of enzyme 2.5 and 10 U for
different incubation times 1, 4, 8 and 16 h (Chapter 3).
• Compare SCW hydrolysis with traditional enzymatic approach based on the recovery of
XOS obtained (Chapter 3).

8
• Purify XOS obtained from SCW hydrolysis using ultrafiltration with 3 and 1 kDa cutoff
and quantification (Chapter 4).
• Purify XOS obtained from SCW hydrolysis using nanofiltration and activated carbon
adsorption (Chapter 4).

9
Chapter 2: Literature review
2.1. Barley grain
The most important cereal crops produced in Canada are wheat, canola, soy bean, corn, oat and
barley with 8.4 million tonnes of barley harvested in 2018 (Statistics Canada, 2018).
2.1.1. Classification and uses
Barley (Hordeum vulgare L.), a cereal grain with a huge production worldwide (Baik and Ullrich,
2008), is mostly used in malting and the feed industry (Newman and Newman, 2006). Barley grain
is also converted to pot barley by abrasive action and may be further processed to grits, flakes and
flour (Chatterjee and Abrol, 1977). Whole, pearled, flaked and ground barley are used in breakfast
cereals, stews, soups, porridge, bakery flour blends and baby foods (Bhatty, 1993). In addition,
pearled barley flour can be combined with wheat based products such as bread, cakes, cookies,
noodles and extruded snack foods (Newman and Newman, 1991).
Barley is classified into different groups including spring or winter, two rowed or six rowed and
hulled or hull-less, depending on the presence or absence of hull attached to the grain. Also,
depending on the grain composition, barley is classified into normal, waxy or high amylose starch,
high beta-glucan and proanthocyanidin free types (Baik and Ullrich, 2008).

10
2.1.2. Structure and chemical composition
The structure of barley grain is similar to other cereals like wheat. It is composed of endosperm,
the embryo and outer covering layers. The endosperm is made up of starchy endosperm and a
surrounding aleurone layer. The starchy endosperm is the largest morphological part of the barley
kernel accounting for 75% of the whole grain weight (Evers and Millar, 2002). The outer layers
of barley including testa, pericarp and hull embrace the endosperm (Yeung and Vasanthan, 2001).
Hull is composed of two distinct overlapping structures named lemma and palea, which are tightly
attached to the pericarp layer by a cementing layer (Olkku et al., 2005). Fig. 2.1 illustrates the
anatomy of barley kernel. Whole barley grain contains about 65–68% starch, 10–17% protein, 4
9% beta-glucan, 2–3% lipids and 1.5–2.5% mineral (Czuchajowska et al., 1998; Izydorczyk et al.,
2000; Quinde et al., 2004). Total dietary fiber content ranges from 11 to 34% and soluble dietary
fiber content from 3 to 20% (Fastnaught, 2001). The endosperm contains starch granules
embedded in a protein matrix (Fincher and Stone, 1986).
11
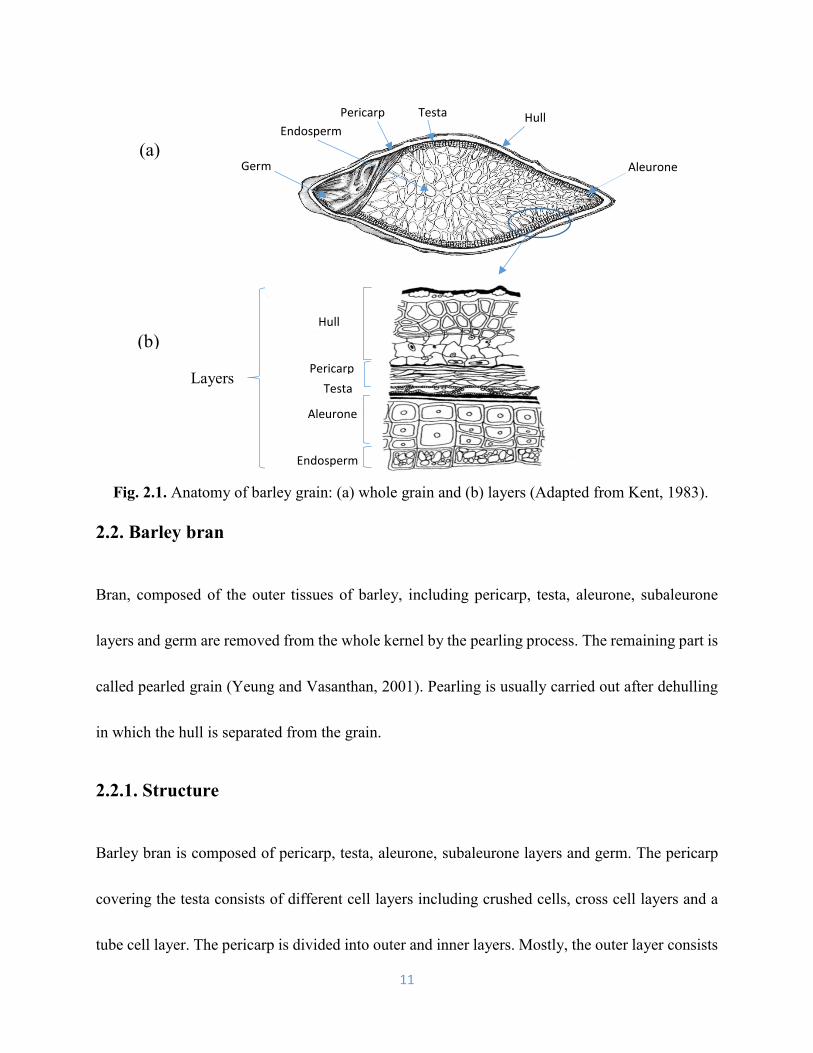
Fig. 2.1. Anatomy of barley grain: (a) whole grain and (b) layers (Adapted from Kent, 1983).
2.2. Barley bran
Bran, composed of the outer tissues of barley, including pericarp, testa, aleurone, subaleurone
layers and germ are removed from the whole kernel by the pearling process. The remaining part is
called pearled grain (Yeung and Vasanthan, 2001). Pearling is usually carried out after dehulling
in which the hull is separated from the grain.
2.2.1. Structure
Barley bran is composed of pericarp, testa, aleurone, subaleurone layers and germ. The pericarp
covering the testa consists of different cell layers including crushed cells, cross cell layers and a
tube cell layer. The pericarp is divided into outer and inner layers. Mostly, the outer layer consists
Layers
(a)
(b)
Testa
Hull
Pericarp
Aleurone
Endosperm
Aleurone
Hull Pericarp Testa
Germ
Endosperm
12
of remnants of thin-walled cells and the inner layer is made up of intermediate cells, cross cells,
and tube cells. The seed coat is the testa attached to the cuticle of the epidermis. It is one layer in
barley responsible for the impermeability of the grain to water over its surface. The thickness of
seed coat is about 5 to 8 μm (Evers and Millar, 2002). On the other hand, the aleurone layer is the
outer layer of the endosperm that surrounds both starchy endosperm and the germ (embryo). The
aleurone cells consist of a nucleus and aleurone granules rich in ash, protein, minerals, ferulic acid
and lipid. Barley has three layers of aleurone cells, while other cereals like wheat and maize have
just one layer (Pomeranz, 1973; Fincher, 1976).
2.2.2. Chemical composition
The main components of barley bran are non-starch polysaccharides, protein, lipid and lignin. It
has also been considered as a lignocellulosic material (LCM). LCM is composed of three types of
polymers: lignin (with phenolic nature), cellulose (a linear polymer made of glucose units linked
by β,1-4 glycosidic bonds) and hemicellulose (branched hetero-polysaccharides that consist of
various monosaccharides such as xylose, arabinose, mannose, glucose and rhamnose) (Garrote et
al., 1999). Depending on the nature of the LCM, polymers of xylose (xylan), arabinose (arabinan),
mannose (mannan) and glucose (glucan) are the main hemicellulosic components, which can be
substituted via ether or ester bonds (Ebringerova and Heinze, 2000). Different types of
hemicelluloses originating from various plant materials, including glucuronoxylan (Spiridon and

13
Popa, 2008), glucomannan (Teleman et al., 2003; Laine, 2005), xyloglucan (Ebringerova et al.,
2005), arabinoglucuronoxylan (Shi et al., 2011), and arabinoxylan (Persson et al., 2009) have been
reported in the literature. Arabinoglucuronoxylan, which is composed of a backbone of β-(1-4)
linked xylopyranose units attached with different substitutions like 4-O-methyl-D-glucuronic acid
and α-L-arabinofuranose units were found in the cereals. Also, arabinoxylan with a backbone of
β-(1-4) linked xylopyranose units attached to α-D-glucopyranosyl uronic units, α-L-
arabinofuranose and O-acetyl substitutes has been reported as the major component of the cell
walls of cereals (Persson et al., 2009; Peng et al., 2009). Xylans of many plant materials are
heteropolysaccharides composed of xylose backbone with different branching substitutions
including L-arabinose, D-glucose, D-galactose, D-mannose, D-glucuronic acid, 4- O-methyl
glucuronic acid, D-galacturonic acid, ferulic acid, and acetic acid residues, and smaller amounts
of L-rhamnose, L-fucose, and various O-methylated neutral sugars (Sun et al., 2000).
Cruz et al. (2000) reported 23% cellulose, 27% hemicellulose, 21% lignin and 29% others (oven-
dry basis) for the composition of barley bran. According to Izydorczyk and Dexter (2008),
arabinoxylan and mixed linkage beta-glucan are the major non-starch polysaccharides in various
tissues of barley. They reported the neutral monosaccharide composition as 3, 2.8, 33.7, 30.1, and
30.4% of total polysaccharides for galactose, mannose, arabinose, xylose and glucose and major
polysaccharide components as cellulose 25.8%, beta-glucan plus arabinoxylan 63.8% in the

14
pericarp of barley (AC Metcalfe). However, there was less amount of arabinoxylan (11.8%) and
cellulose (2%), and a higher amount of beta-glucan (62.1%) in the starchy endosperm.
The chemical composition of bran relies on the degree of pearling, which is defined as the amount
of kernel removed through the pearling process. Klamczynski et al. (1998) found that starch and
beta-glucan contents increased in the pearled grain after pearling. Bhatty and Rossnagel (1998)
reported a reduction in total dietary fiber, ash, and protein contents and an increase in the starch
and soluble fiber contents after 50% pearling of Canadian and Japanese barley. Significant
amounts of protein and minerals (ash) are reported in the outer layers removed from barley grain
(Klamczynski et al., 1998). Yeung and Vasanthan (2001) investigated the impact of pearling
process on the composition of removed outer grain layers and the remaining fractions from Regular
(Phoenix) and Waxy (Candle) hull-less barley. Samples were pearled to 10-80% (w/w) degree of
pearling using a testing mill fitted with an abrasive roller. These authors reported that, regardless
of the degree of pearling starch content decreased in the outer grain layers fraction compared to
the whole grain and remaining fraction, meanwhile it increased as the degree of pearling increased
gradually from 10 to 80%. However, beta-glucan content decreased in the outer grain layers
fraction as pearling increased from 10 to 32%, but it increased with the increasing degree of
pearling from 32% to 80%. All outer grain layer fractions had more protein, lipid and ash contents
than the whole barley and pearled grain in both varieties. The highest protein amount was reported
for pearling flour removed after 23-25% pearling with 23.9±0.5 and 22.7±0.6% db for Phoenix

15
and Candle, respectively. Such results indicate that ash, protein and lipid are concentrated in the
outer layers, while starch and beta-glucan are mainly present in the inner tissues of barley grain.
Similar composition pattern was reported by van Donkelaar et al. (2015), who removed 5, 10, 15
and 25 wt% of the whole barley kernel by pearling and prepared fractions 1-4, respectively, 75%
of the original kernel weight remained and made the 5th fraction. Microscopic images were used
to identify starch and fibrous fragments in all these fractions. Table 2.1 shows the chemical
components present in the whole barley and different fractions obtained by the pearling process.
They reported fewer starch granules and more fibrous material in the outer layers. Fractions 3 and
4 had higher amounts of protein, indicating high protein content in the aleurone layer of barley
grain. Also, beta-glucan was mostly present in fraction 4 due to the existence of thick cell walls
composed of beta-glucan and arabinoxylans (Jadhav et al., 1998). Wang et al. (1997) reported
similar results for starch (58.7% db) and protein (11.7% db) contents of whole barley grain, and
removal of 32.6 wt% of the kernel after pearling process led to the higher concentrations of starch
(71.5% db) in the pearled grain and protein (16.2% db) in the pearling flour, compared to the initial
whole grain. van Donkelaar et al. (2015) also reported the highest concentration of fat (7.2±0.3
%db) in fraction 3, due to the existence of germ in this part. Marconi et al. (2000) reported similar
data about fat concentration. Fractions 1 and 2 had more ash and insoluble fiber (cellulose, lignin
and pentosane) compared to the other fractions and whole kernel due to the presence of the hull

16
layer. These authors found that fractions 2 and 3 had the highest amount of total arabinoxylan with
21.3±25 and 17±9 (% db), respectively.
Table 2.1. Composition of minor components of whole barley and barley fractions (Adapted
from van Donkelaar et al., 2015).
Zheng et al. (2011) studied arabinoxylan and beta-glucan concentration patterns in three different
fractions of six varieties of hull-less barley. These authors separated the outer layers as bran,
aleurone and subaleurone layers known as short, and the remaining part of the kernel made the
flour part. Beta-glucan content was 8.12–13.01%, 6.15–7.58%, 2.48–2.95% and 4.96% to 7.62%
db for short, bran, flour and whole barley, respectively. While arabinoxylan was mostly present in
the bran fraction (7.99–9.59%) compared to the short (2.29–3.86%), flour (1.2–2.29%) and whole
barley (2.97–4.73% db). According to Bhatty (1997), beta-glucan concentration depends on the
variety of the barley kernel. They reported that beta-glucan was mostly present in the subaleurone
layer for low beta-glucan content hull-less barley, while in barley that contains high amounts of
beta-glucan, it is present more uniformly in the endosperm. Knuckles and Chiu (1995) and
Fraction
Starch
(% db)
Beta-glucan
(% db)
Protein
(% db)
Fat
(% db)
Ash
(% db)
IF
(% db)
A+X
(% db)
Fraction 1 2.5 0.3 5.7 1.2 7 82.9 14.8
Fraction 2 7.8 1.3 10.8 3.7 6.59 68.8 21.3
Fraction 3 24.3 3.1 18.3 7.2 5.78 39.5 17
Fraction 4 44.6 4.9 17 4.2 3.79 23.9 9.1
Fraction 5 77.2 4.5 8.2 0.9 0.85 6.3 2.3
Whole barley 62.7 3.6 9.8 1.3 2.2 18.2 6.4
db: Dry basis; IF: Insoluble fiber; A: Arabinose; X: Xylose

17
Rolando et al. (2005) reported the existence of most beta-glucan in the aleurone layer. Izydorczyk
et al. (2003) investigated the composition and structural properties of three fractions of barley
kernel. These authors used Falcon (normal), CDC Candle (waxy), and CDC 92-55-06-48 (high-
amylose) hull-less barley cultivars from western Canada. Barley samples were pearled and 10%
of the outer layers of the kernel were removed. Then, pearled grain was ground after passing four
corrugated rolls, followed by sieving to obtain flour and coarse fractions (>600 μm and >183 μm).
The coarse fraction (>600 μm) was passed through a shorts duster followed by sieving on a 183
μm sieve to obtain flour and a coarser fraction, which made up the bran. Another coarse fraction
(>183μm) passed through a shorts duster and sieved on a 183μm, followed by passing a sizing
passage, then a coarse fraction was obtained as fiber rich fraction. Fig 2.2 presents the process to
obtain different fractions from barley.
Fig. 2.2. Barley milling flow; SD: shorts duster; bran and fiber-rich fraction.
Milling
600 µm
Flour
Sieving 183 µm
Flour Flour Bran Fiber rich
fraction
183 µm 183 µm
18
The highest amounts of total arabinoxylan, protein and ash contents were in the bran compared to
the flour, fiber fraction and the whole grain for all three barley varieties. Total arabinoxylan was
determined for high amylose, normal and waxy barley brans as 14.27±0.72, 17.21±0.18 and 18.47
±0.19%, respectively. Also, whole normal and waxy barley and their brans had higher amounts of
arabinoxylan than high-amylose barley and its bran fraction, while fiber fraction had the highest
amount of total beta-glucan compared to the flour and whole kernel for all three barley varieties.
2.3. Fractionation of barley bran
Barley bran is a by-product and complex material composed of protein, lipid, carbohydrates (non-
starch polysaccharides and starch) and ash. The removal of proteins, oil and starch can be achieved
through fractionation of the bran, leading to obtain pure non-starch polysaccharides rich in
arabinoxylan that can be used for the production of valuable compounds and nutraceuticals.
2.3.1. Extraction of lipids
Bran lipid is a valuable ingredient for food, nutraceutical, pharmaceutical and cosmetic
applications (Alonso, 2018). Conventionally, lipid extraction is performed using chemical solvents
such as hexane and petroleum ether. These techniques usually need long extraction times and
produce large amounts of toxic solvent wastes (Brooks et al., 1998). An alternative technique is
supercritical carbon dioxide (SC-CO2) extraction in which CO2 is used as a solvent at pressure and
temperature above its critical point (31°C and 74 bar). Some properties of CO2 including density,

19
viscosity, diffusivity, heat capacity and thermal conductivity change at supercritical conditions.
SC-CO2 has a strong ability to solubilize compounds due to its high density and great penetration
power into the solid matrix by low viscosity (Dunford et al., 2003; Saldaña et al., 2002). Some
advantages of SC-CO2 extraction are as follows:
• CO2 is nontoxic, nonflammable, and low cost.
• Due to the low critical temperature of CO2, extractions can be performed at mild
temperatures, leading to less degradation of heat-sensitive components to obtain extracts
with natural properties (Dron et al., 1997).
• CO2 is released as a gas after extraction through pressure reduction, therefore there is no
solvent left in the final product (Henning et al., 1994).
• SC-CO2 has high mass transfer, leading to fast extraction and high recovery (Wheeler and
McNally, 1989; Henning et al., 1994).
• The crude oil obtained by SC-CO2 has less impurities compared to the conventionally
solvent extracted oil (Devittori et al., 2000).
Jung et al. (2012) extracted oil from wheat bran using SC-CO2 and compared its quality with the
oil obtained by hexane extraction. They observed lower acid value (AV), peroxide value (POV)
and higher radical scavenging activity in SC-CO2 extracted oil, which indicates its better quality.
Kwon et al. (2010) also investigated SC-CO2 extraction of oil from wheat bran at temperatures

20
ranging from 40 to 60ºC and pressures ranging from 100 to 300 bar, with a CO2 flow rate of 26.81
g/min. At a constant temperature from 40 to 60ºC, they reported an increase in extracted oil from
bran with increasing pressure from 100 to 300 bar. Similarly, at constant pressure from 100 to 300
bar, the oil yield increased with temperature rise from 40 to 60ºC due to the increase of oil
components vapour pressure and its predominance over the drop in solvent density. They obtained
the highest amount of oil at 60ºC and 300 bar with a yield of 2.69 g/12 g of wheat bran. Soares et
al. (2016) studied the effect of pressure (150-250 bar) and temperature (40-80°C) on the extraction
yield of rice bran oil using SC-CO2. In that study, total oil content of the raw material was
15.44±0.11 wt%, which was determined by Soxhlet extraction using hexane. They showed an
increase in extraction yield with pressure rise from 150 to 250 bar at 40 and 80°C due to the
increase in density and solvating power of CO2, resulting in solubility enhancement of rice bran
oil. However, when the temperature increased from 40 to 80°C at 150 and 250 bar, the extraction
yield of oil decreased due to the reduction of CO2 density and solvation power. They reported the
highest yield (12.68 wt%) and oil recovery (82.12 wt%) obtained at 40°C and 250 bar. The
decrease in extract amount with increasing temperature at low pressures indicates a crossover
behavior of the solubility isotherms, which was reported by Dunford and Temelli (1997), who
reported a decrease in the amount of extract from canola flakes at 207 bar and increase at 414 and
620 bar with increasing temperature.

21
2.3.2. Starch and protein removal
Starch is one of the most abundant carbohydrates in barley grain and it ranges from 62 to 77% of
the grain dry weight (Bhatty and Rossnagel, 1998). However, starch is mostly concentrated in the
barley endosperm. Bran, which is composed of outer layers, contains less amount of this
polysaccharide. This polysaccharide is composed of glucose monomers connected with α-(1-4)
and α-(1-6) linkages. Starch is made up of a mixture of amylose (15-20%), a linear chain polymer,
and amylopectin (80-85%), which is a branched molecule. Removal of starch was performed using
an enzymatic approach, including alpha-amylase hydrolysis (Yu et al., 2018), and a combination
of alpha-amylase and amyloglucosidase hydrolysis of barley bran (Karimi et al., 2018). Enzymatic
starch removal using alpha-amylase was based on the hydrolysis of α-(1-4) linkages and produced
maltose, maltotriose and branched dextrins. Further, they are converted to glucose by
amyloglucosidase and non-starch polysaccharides are precipitated with ethanol, followed by its
separation from the liquid and drying to obtain a destarched product.
Removal of protein was also investigated using enzymatic hydrolysis with protease in wheat bran
(Swennen et al., 2005) and rye bran (Flack et al., 2014). Another approach is alkaline treatment
using NaOH reported for protein removal from barley (Wang et al., 2010; Song et al., 2012). In
lignocellulosic materials, protein is attached to the hemicellulose via covalent bonds. Protein can
be solubilized with alkali and further precipitated at isoelectric pH (Zhu et al., 2010). Song et al.

22
(2012) reported the removal of protein from barley bran using alkaline treatment (3 N NaOH) at
pH of 9.5 for 1 h. They centrifuged the solution and adjusted the pH of supernatant to 4.5 with (2
N HCl) to precipitate the protein. They recovered 33 g of protein from 100 g of barley bran.
Solubilization and removal of protein from barley outer layers (mainly bran and germ) was also
reported by salt and alkaline solutions. Wang et al. (2010) reported the maximum recovery of
protein (64% of initial protein content) using alkaline solution (0.5M NaOH) at pH of 11.5. The
protein recovery using salt solution (1M NaCl) was 25-30%, which was lower compared to the
protein recovery using alkaline solution (64%).
2.4. Oligosaccharides
According to the international carbohydrate community, oligosaccharides are carbohydrate
polymers composed of 2-10 monosaccharide units linked by O-glycosidic bonds (Roberfroid and
Slavin, 2000), although carbohydrates with 2-20 monosaccharide units are also considered as
oligosaccharides according to Rohrer (2002).
2.4.1. Classification
Oligosacharides are classified into two groups. Primary oligosaccharides are synthesised from a
mono or oligosaccharide and a glycosyl donor by the action of a glycosyl transferase (Kandler and
Hopf, 1980). Secondary oligosaccharides are those formed by hydrolysis of higher
oligosaccharides, polysaccharides, glycoproteins, and glycolipids.

23
2.4.2. Physicochemical properties of oligosaccharides
Oligosaccharides are water soluble and their sweetness is 0.3–0.6 times as sucrose. The sweetness
of the oligosaccharide product relies on the chemical structure, the degree of polymerization and
the presence of mono and disaccharides in the product mixture (Playne and Crittenden, 1996);
Voragen, 1998). Oligosaccharides with longer chain length have less sweetness than the molecules
with shorter chain. Therefore, due to the low sweetness of oligosaccharides, they can be used in
the food products with the restriction of sucrose usage (Roberfroid and Slavin, 2000). Compared
with mono- and disaccharides, oligosaccharides can provide more viscosity, improved body and
mouthfeel of food products due to their higher molecular weight, compared to mono- and
disaccharides (Playne and Crittenden, 1996).
2.4.3. Health benefits of oligosaccharides
Oligosaccharides are non- digestible carbohydrates and cannot be hydrolyzed by human intestinal
digestive enzymes due to the arrangement of anomeric carbon atoms (C1 or C2) of the
monosaccharide units and the nature of their glycosidic bonds (Roberfroid and Slavin, 2000).
Therefore, they have potential use as prebiotics that are fermented in the colon by anaerobic
microorganisms to release energy, metabolic substrates, lactic and short-chain carboxylic acids
(Quigley, 2010). Besides, they promote the growth of probiotics that are live microorganisms
associated with health benefits on the host such as Bifidobacteria and Lactobacilli (Qiang et al.,

24
2009). They improve the intestinal absorption of minerals such as calcium, magnesium and iron.
They have beneficial effect on the carbohydrate and lipid metabolism, leading to a decrease in
cholesterol, triglyceride and phospholipid concentrations in the blood, reducing the risk of diabetes
and obesity (Mussatto and Mancilha, 2007). Oligosaccharides have been studied widely both as
food ingredients and pharmacological supplements. Many studies showed that arabinoxylan
oligosaccharides (AXOS) have antidiabetic effect due to the decrease of blood glucose level and
insulin response (Charalampopoulos et al., 2002; Grootaert et al., 2007; Muzzarelli, 2009). Wang
et al. (2011) showed that supplementation of 5% wheat bran xylo-oligosaccharides in the high fat
diets can be effective in controlling body weight, improving blood glucose and lipid levels of blood
in rats.
2.4.4. Production of oligosaccharides
Bioactive oligosaccharides are produced by either synthesis (with enzymatic or chemical
approach) or polysaccharide depolymerization (with physical, chemical or enzymatic methods).
2.4.4.1. Chemical and biochemical synthesis of oligosaccharides
The chemical or biochemical synthesis of oligosaccharides is difficult to control compared to the
synthesis of other biopolymers such as peptides and nucleic acids due to the existence of
monomeric unit combinations (Barreteau et al., 2006). The chemical glycosylation reaction occurs

25
between a glycosyl donor and a glycosyl acceptor with only one free hydroxyl group (Barreteau
et al., 2006). Fig. 2.3. illustrates the steps of chemical synthesis of oligosaccharides.
Fig. 2.3. Chemical synthesis of oligosaccharides (Adapted from Barreteau et al., 2006).
2.4.4.2. Enzymatic glycosylation
Large scale oligosaccharides production is performed using enzymes, including glycosidases and
glycosyltransferases. Glycosyltransferases catalyse the transfer of sugar units from activated donor
molecules to acceptor molecules, forming glycosidic bonds. Many bioactive oligosaccharides are
formed by the enzymatic approach such as fructo-oligosaccharides (FOS) from sucrose using
fructosyltransferase (Sangeetha et al., 2005), galactosyl-oligosaccharides from lactose using beta-
galactosidase (Czermak et al., 2004) and gentio-oligosaccharides from glucose by
transglycosylation (Playne and Crittenden, 1996).
Glycosyl donor
Glycosyl acceptor
acceptor Disaccharide donor
Oligosaccharides
26
2.4.4.3. Polysaccharide depolymerization
Oligosaccharides are produced using chemical treatments like acid hydrolysis. Enzymatic
hydrolysis of polymers is also employed as the main method to produce oligomers (Barreteau et
al., 2006). Xylo-oligosaccharides (XOS) are the most common oligomers produced at industrial
scale by the hydrolysis of polysaccharide xylan, which is obtained from lignocellulosic materials
such as hardwoods, corn cobs, straws, bagasse, hulls, malt cakes and bran. Different methods are
used to produce this type of oligosaccharides, including: i) isolation of xylan from lignocellulosic
material by chemical treatments, and further enzymatic hydrolysis of xylan to xylo-
oligosaccharides; and ii) hydrolysis of xylan to xylo-oligosaccharide by water or dilute mineral
acid solutions (Vázquez et al., 2000).
2.4.4.4. Hydrothermal production of oligosaccharides from hemicellulosic
biomass
Hemicelluloses are considered the second abundant polysaccharide in lignocellulosic materials.
They are composed of various polymers, including xylans, mannans, xyloglucans,
arabinogalactans, galactomannans, or mixed β-glucans (Gullon et al., 2014). These compounds
have amorphous structure and connect the cellulose and lignin in the biomass (Bajpai, 2016). They
have potential for use as feedstocks to produce novel valuable oligosaccharides (Moniz et al.,
2016). There is a growing interest for this component due to unexplored properties and

27
applications. Moreover, few hemicellulosic oligosaccharides are produced in the industry, for
instance commercial xylooligosaccharides are manufactured by Suntory Ltd. in Japan using a
combined alkaline extraction of hemicelluloses from biomass and enzymatic hydrolysis, which
leads to a poor substitution pattern such as glucose or arabinose chains in the obtained
oligosaccharides (Moniz et al., 2016). Hydrothermal technologies are suitable to obtain valuable
compounds from biomass in which water is used at high temperatures and pressures without the
addition of catalysts. Hemicellulose is selectively solubilized by hydrothermal processing (160-
200°C, 30-50 bar, 5-60 min,) and oligosaccharides with a wide distribution of degree of
polymerization (DP) and high variety of substituents are obtained (Moniz et al., 2016). In addition,
hydrothermal treatment is an environmentally friendly process because only water and feedstock
are reagents with no other chemicals added (Moure et al., 2006). However, besides hemicellulose
thermal solubilization, various side reactions occur, including saponification of acetyl groups,
removal of extractives such as waxes, phenols, aromatics and other chemical components that are
not chemically bound to components of biomass, solubilization and removal of ash, removal of
some acid-soluble lignin fractions, Maillard reaction between proteins and sugars and formation
of new products. Therefore, the final product is composed of different complex materials with
undesired and non-saccharide compounds and further purification is needed to refine hydrothermal
liquors and improve the purity of oligosaccharides before their application (Vegas et al., 2004;
Garrote et al., 2007). Autohydrolysis, subcritical hydrolysis and supercritical hydrolysis are the

28
most studied hydrothermal techniques for the production of value-added compounds from cereal
by-products. Using autohydrolysis, biomass was treated with hot water at high temperature (150–
220°C), pressure (5–20 bar), and solvent/feed ratio (5–15 mL/g) (Ruiz et al., 2017). Earlier, steam
explosion has been used for the pretreatment of biomass before xylan extraction and enzymatic
hydrolysis.
2.5. Subcritical water technology
In the subcritical water (SCW) process, water is used as a solvent at temperatures and pressures
above its boiling point (100°C, 1 bar) and below its critical point (374°C, 221 bar). Applied
pressure helps to maintain water in the liquid state. Fig. 2.4 illustrates the phase diagram of water.
Fig. 2.4. Phase diagram of water (Adapted from Morphy and Koop, 2005; Brunner, 2014).
Table 2.2 shows physical and chemical properties of subcritical water compared with water at
ambient condition. The physicochemical properties of water, such as the density, viscosity,

29
dielectric constant and ionic product, changes considerably under subcritical conditions due to the
increase of temperature and pressure compared with the properties under normal conditions. Due
to the disruption of hydrogen bonds and reduction of electrostatic interactions between the water
molecules, and between water and surrounding molecules, its dielectric constant (ε) decreases from
78.5 to 27.1 and 18.2 by increasing the temperature from 25°C (1 bar) to 250°C (50 bar) and 330°C
(300 bar) (Moller et al., 2011). Therefore, this dielectric constant becomes similar to less or non-
polar solvents at room temperature, such as methanol (ε=32.6) and 1-butanol (ε=17.8) at 25°C/1
bar (Curren and King, 2009). Also, mass transfer improves at elevated temperatures due to the
decrease of water viscosity (Moller et al., 2011). In addition, permittivity and surface tension of
water declines, while there is an increase in its diffusivity.
Properties Ambient water Subcritical water
Temperature (°C) 0-100 100-374
Density (g cm-3) 0.997 (25°C) 0.958 (101°C, 1.1 bar)
0.692 (330°C, 300 bar)
Viscosity (µPas) 884 (25°C) 277 (101°C)
50.4 (371°C)
Heat capacity
(J g-1 K-1) 4.2 (25°C)
4.2, (101°C)
69, (371°C)
Dielectric constant 78.5 (25°C, 1 bar) 27.1 (250 °C, 50 bar)
18.2 (330°C, 300 bar)
Compressibility No Slightly increased, but still a
liquid at 370°C
Ion product
(mol2 L-2)
10-14 increased to
10-12 at 100 °C
Increases from 10-12 (100°C) to
10-11 (300°C)
Table 2.2. Physical and chemical properties of water at ambient and subcritical conditions.

30
2.5.1. Subcritical water production of oligosaccharides
Subcritical water treatment is a promising technology for conversion of polysaccharides of
different agricultural by-products into high value oligosaccharides. Table 2.3 presents maximum
oligosaccharides production using different hydrothermal treatments.
Khuwijitjaru et al. (2014) used successfully SCW at temperatures of 100–300°C, solvent/solid of
10 (mL/g), for 15 min to hydrolyze the mannan polysaccharides of coconut meal into mono and
oligosaccharides and obtained manno-oligosaccharides (72% of total carbohydrates) in the liquid
extracts collected at 250°C. Wang et al. (2014) also treated apple pomace and citrus peel using
subcritical water to obtain pectin with low molecular weight. They reported the highest pectin
yield from citrus peel and apple pomace (21.95% and 16.68%, respectively) in the liquid extracts.
Klinchongkon et al. (2015) investigated the production of oligosaccharides from passion fruit peel
by subcritical water with temperatures in the range of 100–245°C, and reported the highest total
oligosaccharide yield (20.5 and 21.2%) at 150 and 175°C. Martinez et al. (2010) obtained the
highest pectic oligosaccharides yield of 25.1% by hydrothermal treatment of orange peel waste at
160°C, with a liquid to solid ratio of 12 kg water/kg of dry feedstock.

31
Table 2.3. Production of oligosaccharides from agricultural by-products using different hydrothermal treatments.
Raw material
T
(°C)
t
(min)
P
(bar)
Solvent
/solid
(mL/g)
System OS
(DP)
OS
Recovery/yield
(%)
Reference
Corn cob
200
10
30
7 Continuous
SCW XOS, 2-10 57.8
Makishima et al.
(2009)
Coconut
meal
250
15 NR 10 Batch SCW MOS, 2-6 20.4 (% raw
material)
Khuwijitjaru et al.
(2014)
Orange peel 160 NR NR 12
Autohydrolysis
POS 25.1 (% raw
material)
Martínez et al.
(2010)
Sugarcane
bagasse 200 10 NR 10
Autohydrolysis XOS, 2-5 50.4 Zhang et al. (2018)
Wheat bran 200 NR NR 10 Autohydrolysis XOS, ˃2 70 Rose and Inglett
(2010)
Wheat straw 180 30 NR 10 Autohydrolysis
XOS, ˃2
44 Ruiz et al. (2011)
Wheat straw
180 NR 10 - Autohydrolysis
XOS, ˃2
50 Rodriguez et al.
(2019) Corn stover 70 Sugarcane
bagasse 80
T: Temperature, t: Time, P: Pressure, OS: Oligosaccharides, DP: Degree of polymerization.
MOS: Manno-oligosaccharides, POS: Pectic-oligosaccharides, XOS: Xylo-oligosaccharides, SCW: Subcritical water.
NR: Not reported. XOS Recovery (%): (mass of XOS/mass of initial xylan) x 100.
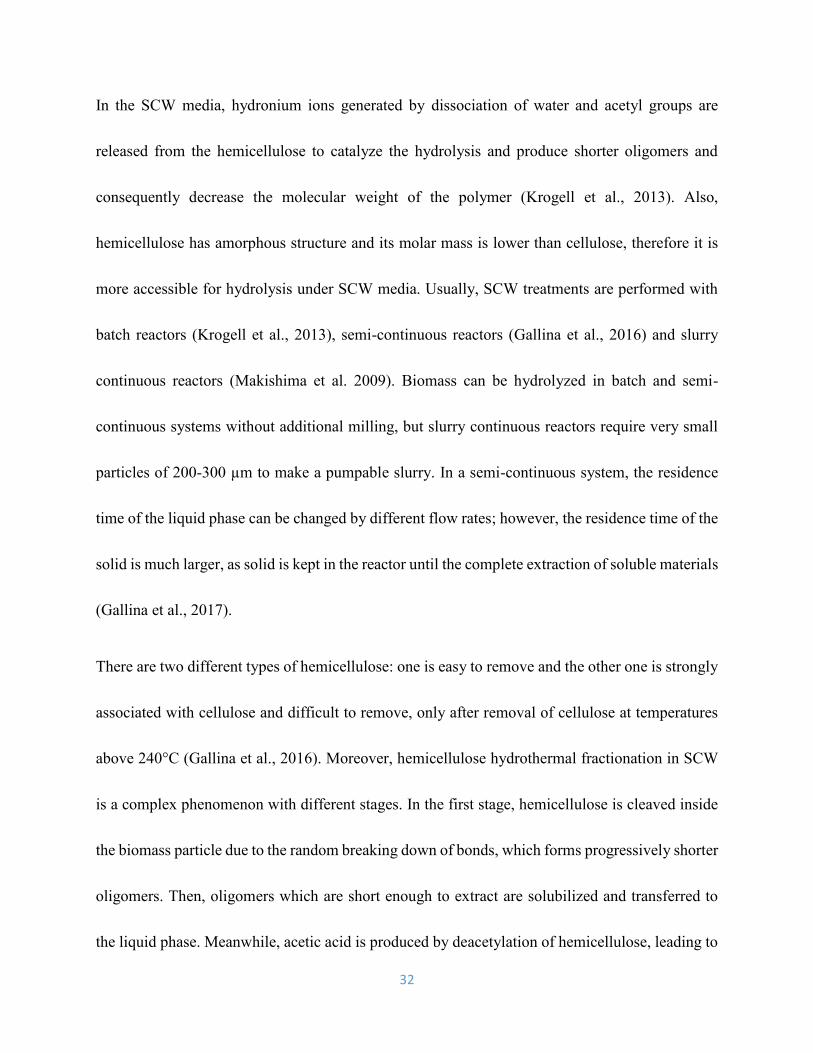
32
In the SCW media, hydronium ions generated by dissociation of water and acetyl groups are
released from the hemicellulose to catalyze the hydrolysis and produce shorter oligomers and
consequently decrease the molecular weight of the polymer (Krogell et al., 2013). Also,
hemicellulose has amorphous structure and its molar mass is lower than cellulose, therefore it is
more accessible for hydrolysis under SCW media. Usually, SCW treatments are performed with
batch reactors (Krogell et al., 2013), semi-continuous reactors (Gallina et al., 2016) and slurry
continuous reactors (Makishima et al. 2009). Biomass can be hydrolyzed in batch and semi-
continuous systems without additional milling, but slurry continuous reactors require very small
particles of 200-300 µm to make a pumpable slurry. In a semi-continuous system, the residence
time of the liquid phase can be changed by different flow rates; however, the residence time of the
solid is much larger, as solid is kept in the reactor until the complete extraction of soluble materials
(Gallina et al., 2017).
There are two different types of hemicellulose: one is easy to remove and the other one is strongly
associated with cellulose and difficult to remove, only after removal of cellulose at temperatures
above 240°C (Gallina et al., 2016). Moreover, hemicellulose hydrothermal fractionation in SCW
is a complex phenomenon with different stages. In the first stage, hemicellulose is cleaved inside
the biomass particle due to the random breaking down of bonds, which forms progressively shorter
oligomers. Then, oligomers which are short enough to extract are solubilized and transferred to
the liquid phase. Meanwhile, acetic acid is produced by deacetylation of hemicellulose, leading to

33
pH reduction of water. These two phenomena occur for hemicellulose dissolution and further mass
transfer between the biomass and the liquid (Cabeza et al., 2016). In the next stage, monomeric
sugars can be produced and released from the polymer or obtained from further hydrolysis of
oligomers. As the process continues, sugars can be converted to degradation products such as
furfural and hydroxyl methyl furfural (HMF) or other substances. Also, sugars degradation can
release acetic acid in the liquid phase. The possible pathways of hemicelluloses fractionation in a
hydrothermal process is illustrated in Fig. 2.5.
Fig. 2.5. Reaction pathways for hemicellulose hydrolysis and formation of degradation products
in SCW (Adapted from Ruiz et al., 2017).
Makishima et al. (2009) investigated the recovery of corn cob hemicellulose using a continuous
flow type reactor with 29.9 and 3.4%db of xylan and arabinan, respectively, for 9-12 min at 200,
205 and 210°C with a pressure of 30 bar and 13.5 wt% slurry as a feed in the reactor. In all
Hemicellulose
Hydrolysis
Oligosaccharides
Acetic acid
Glucose
Mannose
Galactose
Xylose
Arabinose
Formic acid
Furfural
5-Hydroxymethylfurfural
Levulinic acid

34
treatments, xylo-oligosaccharides with DP2-DP10 (XOL) and DP>11(XOH), xylose, glucose,
arabinose and furfural were found in the liquid extracts. They concluded that the yield of XOH
decreased with increasing temperature, while the yield of XOL, xylose and furfural increased.
Yedro et al. (2017) used a semi-continuous SCW system to extract hemicelluloses from Holm oak
Quercusilex with 25 g feed, flow rate of 150 L.h-1 and temperatures between 130 and 170°C. The
molar mass decreased by increasing temperature and the largest hemicelluloses were extracted at
the shortest reaction times. They showed reduction in the molar mass of hemicelluloses as a
function of time in all the experiments. The molar mass was significantly reduced at 160 and 170°C
compared to the initial value at the beginning of the extraction process. They reported that a
mixture of lower molar mass hemicelluloses was obtained in the liquid extracts. In their study, the
lowest molar mass of 1.8 kDa was obtained at 170°C after 60 min, where 60% yield of total
hemicellulose was obtained.

35
2.6. Production of oligosaccharides by enzymatic depolymerization
Enzymatic depolymerization of polysaccharides for oligosaccharide production has been widely
reported in the literature. Different prebiotic oligosaccharides were produced with enzymes,
including malto-oligosaccharides (MOS) using α-amylase on starch; isomalto-oligosaccharides by
action of α,β-amylase and α-glycosidase on starch (Mussatto and Mancilha, 2007); fructo-
oligosaccharides (FOS) using inulinase on inulin and fructans (Cazetta et al., 2005), oligo-
galacturonides by the action of pectinase, pectolyases, and other polygalacturonases on the pectic
substrate (Holck et al., 2011).
Hemicellulose, mainly composed of xylan and arabinoxylan has been converted into xylo-
oligosaccharides (XOS) using different cereal by-products such as corn cob (Chapla et al., 2011),
wheat bran (Zhao and Dong, 2016), wheat straw (Akpinar et al., 2009) and sugarcane bagasse
(Jayapal et al., 2013) and β,1-4 xylanases. There is a growing interest for XOS production with DP
of 2-5, especially xylobiose due to their faster fermentation by probiotic microorganisms to
improve the gastrointestinal environment (Gullon et al., 2011). Moniz et al. (2016) reported that
the fermentation of high DP 9–21 oligosaccharides was slower than the one of low DP (4–6)
oligosaccharides. XOS are usually produced from xylan rich materials using chemical
fractionation of the raw material to isolate xylan with further enzymatic hydrolysis (Teng et al.,
2010; Akpinar et al., 2007). Hardwood (e.g., birchwood, beechwood), corn cob, straw, bagasse,

36
rice hull, malt cake, and bran are the typical raw materials rich in xylan that are used for the
production of XOS (Vazquez et al., 2000).
Hemicellulose, which is rich in xylan, can be solubilized using strong alkaline solutions such as
NaOH, KOH, Ca(OH)2, ammonia or a mixture of these compounds, and the solubilized fraction is
recovered from the suspension by further processing. Alkaline treatment hydrolyzes ester linkages
between the hemicelluloses and other structural components, leading to dissolve hemicelluloses
and lignin and disrupts the cell wall of lignocellulosic materials by swelling the cellulose and
decreasing cellulose crystallinity (Ebringerova and Heinze, 2000; Sun and Tomkinson, 2002).
Acetyl groups and uronic acids are separated from the hemicellulose by saponification during
alkaline extraction, which leads to the structural change in the final extracted hemicellulose (Zheng
et al., 2009). In some cases, the raw material has been pre-treated with oxidizing agents, salts or
alcohols to remove lignin or pectic substances. Organic compounds such as acids and alcohols can
be used to precipitate and recover the solubilized hemicelluloses and hemicellulose-degradation
products (Vazquez et al., 2000).
Consequently, this complex hemicellulosic material is hydrolyzed using the synergistic action of
different enzymes and compounds such as XOS with reduced DP are produced. Generally, endo-
β-1-4-xylanases degrade xylan by attacking the β-1,4-bonds between xylose units to produce XOS,
and β-xylosidase converts lower-DP XOs into monomeric xylose. To avoid the production of

37
xylose, enzyme complexes with low exo-xylanase and/or β-xylosidase activity are desired (Uffen,
1997). Table 2.4 presents performed treatments on various raw materials and maximum XOS
production using enzymatic hydrolysis (xylanase). Wang et al. (2009) examined 10 family endo-
1,4-beta-xylanase from Bacillus subtilis for the production of XOS from wheat bran. In this study,
insoluble dietary fiber was isolated from deproteinized and destarched wheat bran using alpha
amylase and protease to hydrolyze starch and protein, respectively. The yield of XOS (mixture of
xylose (X), xylobiose (X2), xylotriose (X3), xylotetraose (X4), xylopentaose (X5) and
xylohexaose (X6) was 13.36% of raw material and 31.32% of isolated insoluble dietary fiber.
Flack et al. (2014) reported the production of arabinoxylan-oligosaccharides mixture (AXOS)
from rye bran using thermostable xylanase GH10 (RmXyn10A) and GH11 (pentopan). Rye bran
was autoclaved at 121°C for 15 h for the solubilisation of AX. The yield of X2, X3, X4, A3X,
A2XX mixture was 10% and 15% of arabinoxylan content in rye bran, for RmXyn10A and
pentopan, respectively. Chapla et al. (2011) extracted xylan from corncobs by four different
treatments, including dilute acid (H2SO4), sodium hypochlorite, NaOH and autoclaving, then the
extracted xylan was hydrolyzed by A. feotidus xylanase. The highest yield of XOS was for
xylobiose (X2) 1.2±0.9 mg/mL and xylotriose (X3) 1.5±0.1 mg/mL obtained by NaOH treatment
of raw material. Akpinar et al. (2009) examined cotton stalk, tobacco stalk, sunflower stalk and
wheat straw to produce XOS by extracting xylan with KOH solution followed by hydrolysis with
endoxylanase from Aspergillus niger and Trichoderma longibrachiatum. The yield of total XOS

38
from A. niger was higher than T. longibrachiatum. Yields of xylobiose and xylotriose obtained
from tobacco stalk, cotton stalk, sunflower stalk and wheat straw were in the following order:
1.56±0.03, 1.18±0.01; 1.03±0.29, 0.80±0.026; 1.49±0.01, 1.20±0.01; 0.78± 0.07 and 0.71±0.07
mg/mL. Zhao and Dong (2016) reported the production of XOS (DP=2-4) with cellulase enzyme
for hydrolyzing the cell walls followed by extraction of xylan with NaOH solution. Commercial
xylanase (pentopan) was used and 51 (mg/g raw material) XOS mixture was obtained. Jayapal et
al. (2012) obtained yields of X2 and X3 of 0.56 mg /mL and 0.79 mg/mL, respectively, from
sugarcane bagasse. The xylan was extracted with NaOH solution and steam explosion, and then
hydrolyzed by xylanase enzyme from Trichoderma viridae.

39
Table 2.4. Production of XOS from agricultural by-products using enzymatic hydrolysis.
Raw
material Treatments XOS Yield/Recovery Reference
Corn cob
Steam explosion
(165°C for 35 min) DP 2-5
75
(%w/w xylan in corn cob)
Liu et al.
(2018)
Corn cob Alkali extraction
(NaOH 1.25 M) DP 2-5
X2: 1.2 mg/mL
X3: 1.5 mg/mL
X4: 1 mg/mL
X5: 1.4 mg/mL
Total XOS: 107 mg/g raw
material
Chapla et al.
(2011)
Eucalyptus
Lignin removal: sodium chlorite (0.93%,
w/v) + acetic acid (0.31% v/v)
(70°C for 4h)
2O2Alkali extraction of xylan: H 6% (w/v) + NaOH 2-5 M
DP 2 and 4
3.39 mg/mL
30.8 %
(%w/w xylan in eucalyptus)
Mafei et al.
(2019)
Poplar
Lignin removal: hydrogen peroxide
(30%,
w/w + acetic acid (99%, w/w)
(60°C for 2 h)
DP 2-4 19.8
(%w/w xylan in poplar)
Hao et al.
(2019)
Rye bran Heat treatment
(Autoclave at 121℃ for 15h) DP 2-4
Xylanase GH10 enzyme: 15%
Pentopan enzyme: 10% w/w of
AX content in rye bran
Flack et al.
(2014)
Sugarcane
bagasse
Alkali extraction
(NaOH 12%+steam)
DP 2-3 X2: 1.15 mg /mL
X3: 0.56 mg/mL
Jayapal et al.
(2013)
Wheat straw Alkali extraction of xylan
(KOH 24%) DP 2-6
X2: 0.78 mg/mL
X3: 0.71 mg/mL
Akpinar et al.
(2009)
Wheat bran Screening-cellulase-colloid milling-
alkali extraction DP 2-4 57 mg/g raw material
Zhao and
Dong (2016)
DP: Degree of polymerization, XOS: Xylo-oligosaccharides, XOS Recovery (%): (mass of XOS/mass of initial xylan) x 100.
40
2.7. Xylo-oligosaccharides (XOS) separation and purification
Xylo-oligosaccharides produced by hydrothermal or enzymatic treatment are a mixture composed
of a wide DP range of oligomers, monomers or non-saccharide compounds. Therefore, purification
and separation are required to remove undesired compounds such as high molecular weight
compounds, enzymes, monomers and acids to obtain a pure XOS that can be used as a prebiotic
or pharmaceutical compound with anti-allergy, anti-infection and anti-inflammatory properties
(Vazquez et al., 2005). Moreover, studies showed that oligomers with low DP (preferentially 2-4)
have better prebiotic potential, because they can be utilized in higher amounts by beneficial
bacteria (Chen et al., 2016). Therefore, it is required to purify the obtained XOS mixture to obtain
oligomers with a desired DP range.
Various techniques have been studied to refine the XOS mixture, including solvent extraction with
ethyl acetate, vacuum evaporation (Vazquez et al., 2005; Alonso et al., 2003), adsorption with
activated carbon, acid clay, bentonite, diatomaceous earth, aluminum hydroxide or oxide, titanium
and silica (Zhu et al., 2006; Pellerin et al., 1991) and membrane separation (Swennen et al., 2005;
Vegas et al., 2006). Among all these separation technologies, membrane separation including ultra
and nanofiltration has been reported as a promising method to purify XOS mixture.
For membrane purification, the basis for separation is molecular size, although solute–membrane
interactions, chemical and electrostatic properties of the sample influence the permeability of the

41
membrane. Materials with molecular weight in the range of 1 to 1000 kDa are retained in the
retentate by specific ultrafiltration membranes, while salts and water pass through to recover
compounds of interest in the permeate. Nanofiltration is effective to retain the compounds with
molecular weight in the range of 200-1000 Da (Singh et al., 2019). Ultrafiltration was used to
remove compounds with high molecular weight and nanofiltration was performed to separate
monomers and acids from the XOS mixture.
Membrane separation can be performed with dead-end or cross-flow filtration systems. The dead-
end filtration is a batch process, in which feed is forced vertically to the membrane and the retained
materials are accumulated on the surface of the membrane. In cross-flow filtration, feed flows with
a constant turbulent flow parallel to the membrane, avoiding the accumulation of materials on the
membrane surface (Calabro and Basile, 2011).
Singh et al. (2019) proposed a sequential purification of XOS mixture obtained from almond shell
by autohydrolysis at 200°C for 5 min, followed by endo-xylanase treatment (10 U, 36 h). First,
they used a dead-end ultrafiltration system with a membrane of 1 kDa molecular weight cut-off to
separate compounds with high molecular weight like enzymes in the retentate fraction. The
obtained permeate had 90.18 and 95.69% of initial xylobiose and xylotriose, respectively.
Monomers were also recovered in the permeate with 92.42, 96.56 and 95.47% for xylose, glucose
and arabinose, respectively. Then, they used a further nanofiltration system through a 250 Da

42
membrane to remove monomers from xylobiose and xylotriose mixture obtained in the resulting
permeate from 1 kDa membrane. After passing the permeate through 250 Da membrane, 80% of
xylobiose and 41% of xylotriose with respect to their amounts in the feed were recovered in the
retentate, besides monomers including xylose, glucose and arabinose were obtained with 54, 38.7
and 40.8% recovery, respectively. As a result, they recovered 80% of xylobiose and 41% of
xylotriose in the final retentate, along with the removal of 46% xylose, 61.3% glucose and 59.2%
arabinose.
Rico et al. (2018) produced XOS from peanut shells using a stainless-steel reactor and a liquid-to
solid ratio of 8 kg water/kg dry shell under non-isothermal conditions at 190-220°C. Then, a
nanofiltration system with 3.5 bar and a 300 Da membrane was used to remove low molecular
weight compounds such as monosaccharides, acetic acid, and some non-saccharide compounds in
the hydrolysates obtained under the best autohydrolysis conditions. Peanut shells were composed
of 20.87, 12.38, 0.89 and 42.68 wt% of oven dry mass glucan, xylan, arabinan and lignin,
respectively. They obtained the highest amount of XOS with a concentration of 7.60 g/L at 210°C
and the liquors obtained were further processed by nanofiltration. After nanofiltration, the
concentration of XOS increased from 40.71 g/100g non-volatile compounds of the starting
autohydrolysis solution to 52.88 g/100g non-volatile compounds of the retentate obtained. They
observed a significant drop in the acetic acid concentration from 12.0 to 4.79 g/100 g nonvolatile

43
compounds and no significant differences were reported in the concentrations of monosaccharides
and soluble lignin.
Table 2.5 shows different methods used for the purification of XOS produced by enzymatic and
hydrothermal treatments. It also summarizes the recovery of obtained XOS with specific DP range
in the final purified fraction.
Activated carbon adsorption is another method that has been used to remove monosaccharides and
acids like acetic acid from the XOS mixture. Activated carbon has a large internal surface area and
highly porous structure, which allows adsorb materials from the liquid and gas phase (Jankowska
et al., 1991). Its surface area ranges typically from 800 to 1500 m2/g (Bansal and Goyal, 2005).
Monosaccharides and acids are not adsorbed on activated carbon and hence are removed easily
from the hydrolysate. Further, adsorbed XOS with DP ≥ 2 can be eluted with different ethanol
concentrations to obtain the desired purified oligomers. At the same time, activated carbon
treatment contributes to decoloration of the XOS solution, especially when it was produced by
hydrothermal treatment from plant materials. Because of final transparent color, XOS can be used
as additives in the processed foods, drinks and pet foods.
Chen et al. (2014) obtained XOS (DP2-DP9) from Miscanthus x giganteus by autohydrolysis at
180°C/20 min (65% w/w xylan) and 200°C/5 min (69% w/w xylan). They added activated carbon
with 1%, 5%, 10% and 20% (w/v) of the liquid volume and placed the mixture in a shaker at 100

44
rpm for 60 min. Further, they separated the activated carbon and washed it using distilled water to
remove monomers. Then, ethanol elution was carried out using solutions with concentrations of
5%, 30%, 50%, 70% and 95% (v/v) to obtain the adsorbed XOS. They evaluated separate fractions
obtained from ethanol washing and reported that XOS with DP 2, 3, 4, 5, 6, 7, 8 and 9 were
recovered at 70.5, 86.9, 66.3, 56.2, 48.9, 39, 33.3 and 33.3%, respectively. The maximum recovery
of oligomers was achieved in the first 5, 30 and 50% ethanol eluted fractions. For example,
xylobiose (DP 2) was recovered at 31.6, 27 and 8.1% by 5, 30 and 50% ethanol elution,
respectively. Xylotriose was obtained at 11.7, 38.5 and 22.6% by 5, 30 and 50% ethanol elution,
respectively. Xylobiose and xylotriose were recovered by ethanol elution in high amounts
compared to the rest of the other XOS. Chapla et al. (2012) also purified the XOS mixture (DP 2-
5) obtained from corn cob using xylanase hydrolysis. They used 10% (w/v) activated carbon and
the bound fractions of XOS were eluted with a gradient of 30–100% (v/v) ethanol. They concluded
that around 80% of XOS were recovered in the ethanol elution fractions, and xylobiose and
xylotriose had the highest recovery among the other types of XOS.

45
Table 2.5. Purification of XOS produced from agricultural by-products using enzymatic and hydrothermal hydrolysis.
Raw material XOS production Purification Recovery (%) Reference
Almond shell Autohydrolysis +
endoxylanase
1 kDa, ultrafiltration,
250 Da nanofiltration
X2: 80
X3: 41
Singh et al. (2019)
Birch wood Autohydrolysis 1 kDa, ultrafiltration X2-X6: 37 Rivas et al. (2016)
Corn cob Endoxylanase Activated carbon X2-X5: 80 Chapla et al. (2012)
Corn stover Endoxylanase Activated carbon X2-X4: 54.8 Zhu et al. (2006)
Cotton stalk
Endoxylanase 1, 3 kDa, ultrafiltration X2: 89 (1, 3 kDa)
X3: 93 (1 kDa)
X3: 96 (3 kDa)
Akpinar et al. (2007)
Miscanthus x
giganteus
Autohydrolysis Activated carbon X2: 70.5
X3:86.9
X4:66.3
X5:56.2
Chen et al. (2014)
Peanut shell Autohydrolysis 300 Da, nanofiltration X2-X6:75.7 Rico et al. (2018)
Wheat bran Endoxylanase 1 kDa, ultrafiltration X2+X3: 57.55 Zhao and Dong. (2016)
X2: Xylobiose, X3: Xylotriose, X4: Xylotetraose, X5: Xylopentaose, X6: Xylohexaose.
Recovery was calculated with respect to the initial individual XOS in the hydrolysates.

46
Chapter 3. Xylo-oligosaccharides production from barley bran using subcritical water
technology and enzymatic hydrolysis
3.1. Introduction
Bran composed of outer tissues of barley (pericarp, testa, aleurone, subaleurone layers and germ)
is rich in ash, protein and lipids, while starch and beta-glucan were concentrated in the inner tissues
of barley grain.
After cellulose, hemicelluloses comprise the highest amount of plant cell wall polysaccharides in
lignocellulosic materials (Peng et al., 2012), and are tightly linked to cellulose with non-covalent
linkages (Anwar et al., 2014). Hemicelluloses are amorphous polysaccharides composed of xylose,
arabinose, glucose, galactose and mannose, with different structures and the average degree of
polymerization (DP) is in the range of 80–200 DP (Saha, 2003; Ebringerova, 2005). Organic acids,
such as D-glucuronic acid, 4-O-methyl-D-glucuronic acid, and D-galacturonic acid are also
present in the structure of these polysaccharides (Sjostrom, 1993). Arabinoxylan (AX), the most
abundant hemicellulose in cereal by-products, was high in barley bran (14-30%). Gong et al.
(2012) reported 14.21-21.06% of AX in the bran of three Tibetan hull-less barley varieties. In
another study, hull-less barley bran was composed of 31.65±0.21 (% w/w) AX and 0.76±0.07 (%
w/w) beta-glucan and other polysaccharides, for which values were not reported (Guo et al., 2019).

47
Fractionation of cereal by-products to remove lipid, starch and protein was reported in the
literature. Lipid extraction was carried out traditionally using chemical solvents such as hexane
and petroleum ether. Instead of the conventional method, supercritical CO2, a green technology is
widely used in recent years. Starch removal was performed using different methods, including
enzymatic hydrolysis by alpha-amylase for barley (Izydorczyk et al., 1998; Yu et al., 2018), wheat
bran (Ruthes et al., 2017), Termamyl in wheat bran (Maes and Delcour, 2002) and combination of
alpha-amylase and amyloglucosidase for barley bran (Karimi et al., 2018), screening with mesh
sieves to obtain fractions with different particle sizes of wheat bran (Zhao and Dong, 2016) and
hot water extraction of wheat bran (Gullon et al., 2014). Removal of protein was also studied by
enzymatic hydrolysis using Neutrase for wheat bran (Swennen et al., 2005) and protease for rye
bran (Flack et al., 2014), alkaline solutions with NaOH for barley (Wang et al., 2010; Song et al.,
2012) and salt and alcohol solutions for barley (Wang et al., 2010). Yan et al. (2019) removed
lipids from wheat bran using refluxing petroleum ether twice for 6 h, then starch and protein were
sequentially removed using hydrolysis with alpha-amylase and papain, respectively, followed by
air drying in an oven at 50°C for 12 h. Alonso (2018) proposed a sequential process for wheat bran
fractionation, including lipid extraction by supercritical CO2 at 70°C and 300 bar, starch removal
by alpha-amylase using ultrasound-assisted extraction at 55°C and 7 min, and protein removal by
NaOH treatment at 80°C and pH of 9.3.

48
Hemicellulose was solubilized selectively using mild hydrothermal treatments at 160-200°C, 15-
45 min with different systems, including batch, semi-continuous and continuous, where a mixture
of oligomers with a wide range of molecular weight distribution was obtained (Cocero et al., 2018;
Yedro et al., 2017). In general, hemicellulose was hydrolyzed into high molecular weight
oligomers (DP˃11), low molecular weight oligomer (DP 2-11), monomers, furfural and
degradation products (Makishima et al., 2009).
Different hydrothermal approaches have been used for the production of oligosaccharides from
different matrices, such as autohydrolysis of corncobs, almond shells, olive stones, rice husks,
wheat straw, and barley straw at 179°C for 23 min (Nabarlatz et al., 2007); wheat straw at 120-
200°C for 30 min (Chen et al., 2017); barley hull at 207°C (Vegas et al., 2005), hazelnut shell at
150-200°C for 20-46 min (Surek and Buyukkileci, 2017).
Subcritical water technology (SCW) is considered a green method for hydrolysis of lignocellulosic
biomass, such as cereal by-products. Subcritical water is used as a solvent at temperatures above
100°C under pressure to keep water in liquid state and below its critical point 374°C/221 bar
(Smith, 2002). Using SCW, hydronium ions produced by autoionization of water at high
temperatures are responsible for the hydrolysis reactions and breaking of hemicellulosic chains
(Gullon et al., 2009). The release of O-acetyl groups from hemicellulose produces organic acids,
such as acetic and uronic acids, which promote the hydrolysis of hemicelluloses and formation of

49
oligosaccharides from hemicellulosic materials (Alvarez et al., 2014). Oligosaccharides
production with SCW has been studied for passion fruit peel (Klinchongkon et al., 2015); wheat
bran (Ruthes et al., 2017) and coconut meal (Khuwijitjaru et al., 2014). Pronky and Mazza (2010)
investigated the fractionation behavior of barley straw using SCW treatment with a flow type
reactor at 165°C, flow rate of 115 mL/min, and a solvent-to-solid ratio of 60 mL/g. Among
oligomers characterized, xylo-oligosaccharides (32.28% db) and gluco-oligosaccharides (6.32%
db) had the highest amounts in the liquid extract. Makishima et al. (2009) hydrolyzed corn cob
(29.9% db xylan and 3.4% db arabinan) using a continuous SCW process for 9-12 min at a pressure
of 30 bar. They obtained the highest yields of xylo-oligosaccharides with a degree of
polymerization (DP) > 11 at 200°C/9 min (23.7%) and DP of 2-11 at 205°C/9 min (57.8%). But,
to the best of my knowledge, there is no study on barley bran fractionation and hydrolysis in SCW
media. Therefore, the main objective of this study was to investigate the process conditions for the
fractionation of barley bran aiming to remove lipids and starch, enriching the residual meal in
protein and carbohydrates, from which protein is removed later from destarched bran. Then, this
barley bran fraction was hydrolyzed with SCW and enzyme to obtain oligosaccharides.
Hydrolysates were characterized for the structural carbohydrates and xylo-oligosaccharides (XOS)
contents.

50
3.2. Materials and methods
3.2.1. Raw material and chemicals
Whole barley grains were separated using 1.0 mm sieve from barley bran sample (Falcon variety)
provided by the company (Progressive Foods Inc., Edmonton, AB, Canada). The bran fraction
with a maximum particle size of 1.0 mm was ground, vacuum packed and stored at -20°C for the
further fractionation process.
Thermostable alpha-amylase (E-BLAAM), amyloglucosidase (E-AMGDF) and endo-1,4-β-D-
xylanase (E-XYAN4) from Aspergillus niger were purchased from Megazyme (Wicklow,
Ireland). Xylooligosaccharide standards, xylobiose (X2), xylotriose (X3), xylotetraose (X4) and
xylohexaose (X6) were obtained from Megazyme (Wicklow, Ireland). All sugar standards, D(+)
glucose, D(+) xylose, D(+) galactose, L(+) arabinose, and D(+)mannose with a purity of ≥ 96%
and Alpha tocopherol standard were purchased from Sigma Aldrich (St. Louis, MO, USA).
3,5-Dinitrosalicylic acid (98%) and DL-lactic acid (90%) were purchased from Sigma Aldrich (St.
Louis, MO, USA). HPLC grade water was purchased from Fisher Scientific (Ottawa, ON,
Canada). Analytical grade sulfuric acid (72%) and petroleum ether were obtained from Fisher
Scientific (Fair Lawn, NJ, USA). Liquid CO2 was purchased from Praxair (Edmonton, AB,
Canada).

51
3.2.2. Proximate compositional analysis of barley bran, and defatted, destarched and
deproteinized fractions
All proximate compositional analysis was performed at least in duplicate.
3.2.2.1. Moisture content
Moisture content was measured using a gravimetric method 935.29 (AOAC, 2000). Briefly, barley
bran (2 g) was weighed with an analytical balance (Mettler Toledo, Mississauga, ON, Canada) in
a pre-weighed aluminum container and dried in an oven (Model 655G, Fisher Scientific Iso Temp,
Toronto, ON, Canada) at 105°C for 3 h. Then, the container with dried bran was weighed after
cooling in a desiccator. The moisture content was calculated using equation (3.1).
Moisture content (%) = 100 × [𝑋−𝑌
𝑋] (3.1)
where, X= weight (g) of the sample before drying, and Y= weight (g) of the sample after drying.
3.2.2.2. Ash content
Ash content of the barley bran was measured according to the official method 936.07 (AOAC,
2000). Approximately, 1 g sample was weighed in the clean and pre-weighed porcelain crucibles.
Then, crucibles containing samples were transferred to the muffle furnace (Model F-A1730,
Thermolyne Corporation, Dubuque, IA, USA) and kept at 550°C overnight. The crucibles were
then removed from the muffle furnace and cooled in a desiccator. The crucibles were weighed
after cooling and the ash content was calculated according to equation (3.2).
𝐴𝑠ℎ 𝑐𝑜𝑛𝑡𝑒𝑛𝑡 (% 𝑤/𝑤) = [X−Y
Z−Y ] × 100 (3.2)
52
where, X = weight of the crucible and ash, Z = weight of crucible and sample, and Y = weight of
crucible.
3.2.2.3. Protein content
Protein content was determined using a Leco TruSpec nitrogen analyzer (Model FP- 428, Leco
Instruments Ltd., Mississauga, ON, Canada). Barley bran (0.1 g) was weighed into an aluminum
foil cone and then pressed to form a pellet. The sample was placed into the loading head followed
by sealing the system and purging the sample to avoid the entry of air during the loading phase.
The sample was combusted inside a furnace at 950°C by pure oxygen. Orchard leaves and ethylene
diamine tetra acetic acid (EDTA) were used as standards to calibrate the system. The nitrogen
content of the sample was measured and multiplied by a conversion factor of 6.25 previously
reported for barley (Temelli, 1997). The final protein content was calculated using equation (3.3).
𝑃𝑟𝑜𝑡𝑒𝑖𝑛 𝑐𝑜𝑛𝑡𝑒𝑛𝑡 (%) = 𝑁𝑖𝑡𝑟𝑜𝑔𝑒𝑛 𝑐𝑜𝑛𝑡𝑒𝑛𝑡 × 6.25 (3.3)
3.2.2.4. Lipid content
The lipid content of barley bran was determined according to the AACC method 30-25 (AACC,
1982) using the Goldfisch extraction unit (Labconco, Kansas City, MO, USA). Approximately 2
g of barley bran was weighed into the extraction thimbles (25 mm I.D × 80 mm length, Whatman
International Ltd., Maidstone, England). Petroleum ether (40 mL) used as a solvent was added to
the sample inside the thimble. A similar thimble containing only 40 mL of petroleum ether was
used as a blank at 60°C for 6 h. The extraction thimbles were placed into the Goldfisch extraction
unit and preweighed clean extraction beakers were used for collecting the solvent and dissolved

53
lipid. The system ran at a temperature of 60°C for 6 h. The weight of the beakers containing the
lipid was recorded after cooling and used to calculate the lipid content according to equation (3.4).
𝐿𝑖𝑝𝑖𝑑 𝑐𝑜𝑛𝑡𝑒𝑛𝑡 (%) = [𝑋−𝑌
𝑍] × 100 (3.4)
where, X= weight of the beaker containing the lipid, Y= weight of the empty beaker, and Z= weight
of the sample.
3.2.2.5. Carbohydrates
The total carbohydrate content of barley bran was calculated by deduction of the sum of the
percentage of moisture, ash, protein and lipid contents from 100% using equation (3.5).
𝑇𝑜𝑡𝑎𝑙 𝑐𝑎𝑟𝑏𝑜ℎ𝑦𝑑𝑟𝑎𝑡𝑒𝑠 (%) = 100% − (𝑚𝑜𝑖𝑠𝑡𝑢𝑟𝑒% + 𝑎𝑠ℎ% + 𝑝𝑟𝑜𝑡𝑒𝑖𝑛% + 𝑙𝑖𝑝𝑖𝑑 %) (3.5)
3.2.2.6. Starch content
The starch content of barley bran was determined according to the AOAC method 996.11 using
the "Total starch assay kit" (Megazyme, Wicklow, Ireland). First, 95% of powder barley bran (1
mm) passed through the 0.5 mm sieve to obtain the appropriate particle size for this starch
determination. Then, 100 mg of sample was weighed in duplicate into the glass test tubes (16 ×
120 mm). Ethanol 80% (0.2 mL) was added to wet the samples and then vortexed. Then, 3 mL of
diluted thermostable alpha-amylase in 100 mM sodium acetate buffer (300 U) was added to each
tube followed by incubation in a boiling water bath for 6 min. The tubes were stirred using a vortex
after 2, 4 and 6 min. Then, 0.1 mL amyloglucosidase (330 U) was added and the tubes containing
the enzyme were placed in a water bath at 50°C for 30 min. After incubation, the entire content of

54
the tube was transferred to the 100 mL volumetric flask and the volume was adjusted to 100 mL
by addition of 96.7 mL distilled water. The solution was mixed, and 1 mL of the obtained solution
was transferred into 2 mL micro-centrifuge tubes and centrifuged at 3000g for 10 min. Duplicate
aliquots (0.1 mL) of the clear supernatant from each tube was transferred to the glass culture tubes.
D-Glucose standard solutions (0.1 mL) and water were used as the control sample and reagent
blank solution, respectively. The GOPOD reagent (3 mL) was added to each tube (including the
D-glucose control and reagent blank) and incubated at 50°C for 20 min. Then, the absorbances of
each sample and control were measured at 510 nm against the reagent blank. The content of total
starch was calculated using equation (3.6).
𝑆𝑡𝑎𝑟𝑐ℎ 𝑐𝑜𝑛𝑡𝑒𝑛𝑡 (%) = 𝐴 × 𝐹 × [𝐹𝑉
0.1] × [
1
1000] × [
100
𝑊] × [
162
180] (3.6)
where, A = absorbance of the sample against the reagent blank, FV= final volume (100 mL), 0.1
= volume of sample analyzed, (1/1000) = conversion from µg to mg, (100/W) = starch content as
a percentage of sample, W = sample weight (mg), (162/180) = a factor to convert from free D-
glucose, determined in the experiment, to anhydroglucose, that is present in starch.
𝐹 = [100 µ𝑔 𝑜𝑓 𝐷−𝑔𝑙𝑢𝑐𝑜𝑠𝑒
𝐴𝑏𝑠𝑜𝑟𝑏𝑎𝑛𝑐𝑒 𝑓𝑜𝑟 100 µ𝑔 𝑜𝑓 𝐷−𝑔𝑙𝑢𝑐𝑜𝑠𝑒 𝑠𝑡𝑎𝑛𝑑𝑎𝑟𝑑] (3.7)

55
3.2.2.7. Beta-glucan content
Beta-glucan content was measured according to the AOAC method 995.16 using the "Mixed
linkage beta-glucan assay kit" (Megazyme, Wicklow, Ireland). First, 95% of barley bran passed
through the 0.5 mm sieve to obtain the appropriate particle size for the experiment. Then, 80-120
mg of barley bran was weighed in duplicate into the glass test tubes (16 × 120 mm) and 0.2 mL
ethanol (50%) was added to aid dispersion. Sodium phosphate buffer 20 mM (4 mL) was added
and the content was mixed using a vortex for 3 min. Test tubes were placed in a boiling water bath
and incubated for 1 min, vortexed again for 3 min and incubated at 100°C for an additional 2 min.
Then, the tubes were incubated at 50°C for 5 min and lichenase (0.2 mL) was added followed by
incubation at 50°C for 1 h with regular vigorous vortexing (3-4 times). Sodium acetate buffer (200
mM, 5 mL) was added to the tubes and mixed using a vortex in order to adjust the pH to 4. Then,
the tubes with the samples were placed at room temperature (22°C) for 5 min and centrifuged at
1000g for 10 min. An aliquot (0.1 mL) of the content of the tube was transferred into three culture
tubes and beta-glucosidase (0.1 mL) was added to two of these tubes. Sodium acetate buffer (0.1
mL) was added to the third tube to prepare the blank. The GOPOD reagent (3 mL) was added to
each tube and incubated at 50°C for 20 min. Finally, all tubes were removed from the water bath
and the absorbances were measured at 510 nm against the blank. The beta-glucan content was
calculated using equation (3.8).
𝐵𝑒𝑡𝑎 − 𝑔𝑙𝑢𝑐𝑎𝑛 (%) = 𝐴 × 𝐹 × [𝐹𝑉
0.1] × [
100
𝑊] × [
162
180] × [
1
1000] (3.8)

56
where, A = absorbance of the sample against the blank, FV= final volume (9.4 mL), 0.1 = volume
of sample analyzed, (1/1000) = conversion from µg to mg, (100/W) = beta-glucan content as a
percentage of sample, W = sample weight (mg), (162/180) = a factor to convert from free D-
glucose determined in the experiment, to anhydroglucose, that occurs in β-glucan.
𝐹 = [100 µ𝑔 𝑜𝑓 𝐷−𝑔𝑙𝑢𝑐𝑜𝑠𝑒
𝐴𝑏𝑠𝑜𝑟𝑏𝑎𝑛𝑐𝑒 𝑓𝑜𝑟 100 µ𝑔 𝑜𝑓 𝐷−𝑔𝑙𝑢𝑐𝑜𝑠𝑒 𝑠𝑡𝑎𝑛𝑑𝑎𝑟𝑑] (3.9)
3.2.2.8. Determination of structural carbohydrates and lignin
The NREL standard analytical procedure was used for the determination of structural
carbohydrates and lignin (Sluiter et al., 2008). First, 92% of barley bran was passed through the
0.25 mm sieve to obtain the appropriate particle size for the experiment. Then, 300 mg of the
sample was weighed and transferred into the Pyrex pressure tubes, sulfuric acid 72% (3 mL) was
added and mixed with the sample using vortex for 5 min. The tubes were placed in a water bath at
30°C and incubated for 1 h with continuous stirring using magnetic stirrers. After completion of
hydrolysis, deionized water (84 mL) was added to dilute the acid to a 4% concentration. Then, the
tubes were sealed and placed in an autoclave at 120°C for 1 h. After the autoclave cycle, the tubes
containing hydrolysates were cooled at room temperature (22°C). The empty porcelain porous
bottom crucibles (Coors #60531) were placed in the muffle furnace at 575°C for ashing, followed
by cooling in the desiccator and the weights were recorded. The hydrolysates were vacuum filtered
using crucibles and filtrates were captured. The remaining solids were transferred out the pressure
tubes using 50 mL hot deionized water. Soluble lignin in the filtrate was measured using the

57
spectrophotometer at 320 nm. Then, the filtrates were neutralized using calcium carbonate in order
to adjust the pH between 5 and 6 followed by passing through 0.22 µm filters and the content of
sugars was determined by HPLC. Structural carbohydrates, including xylose, galactose, arabinose,
and glucose in the filtrate were determined by HPLC using a Shimadzu LC-10AD pump
(Shimadzu Co., Kyoto, Japan) equipped with an autosampler (SIL- 10A), a refractive index
detector (RID-10A) (Shimadzu Co., Kyoto, Japan) and Aminex HPX 42-P column (dimension:
300 mm X 7.8 mm; average particle size: 25 µm; Bio-Rad laboratories, CA, USA) at 85°C with
HPLC grade water as the mobile phase at a flow rate of 0.6 mL/min. The sugar concentrations
were determined by comparison against a set of known sugar standards. The concentration of the
polymeric sugars was calculated from the concentration of the corresponding monomeric sugars,
using an anhydro correction of 0.88 for xylose and arabinose and 0.90 for glucose and galactose.
The crucibles containing acid insoluble residue were dried in an oven at 105°C overnight and
weighed after cooling in the desiccator. Then, one of the crucibles was placed in the muffle furnace
at 575°C overnight and cooled in the desiccator and the weight was recorded. The insoluble residue
from the other crucible was used for the protein quantification using the Leco nitrogen analyzer.
Polymeric sugars, acid soluble and insoluble lignin contents were determined using equations
(3.10), (3.11) and (3.12).
𝑃𝑜𝑙𝑦𝑚𝑒𝑟𝑖𝑐 𝑠𝑢𝑔𝑎𝑟𝑠 (%) = [𝑀𝑜𝑛𝑜𝑚𝑒𝑟𝑖𝑐 𝑠𝑢𝑔𝑎𝑟𝑠 𝑐𝑜𝑛𝑐𝑒𝑛𝑡𝑟𝑎𝑡𝑖𝑜𝑛 ×𝑎𝑛ℎ𝑦𝑑𝑟𝑜 𝑐𝑜𝑟𝑟𝑒𝑐𝑡𝑖𝑜𝑛 ×86.73 ×1/1000
𝑂𝐷𝑊] × 100 (3.10)
𝐴𝑐𝑖𝑑 𝑠𝑜𝑙𝑢𝑏𝑙𝑒 𝑙𝑖𝑔𝑛𝑖𝑛 (%) = [𝐴×86.73×𝐷
𝑊×30] × 100 (3.11)

58
𝐴𝑐𝑖𝑑 𝑖𝑛𝑠𝑜𝑙𝑢𝑏𝑙𝑒 𝑙𝑖𝑔𝑛𝑖𝑛 (%) = [(𝑋−𝑌)−(𝑍−𝑌)−𝑃
𝑂𝐷𝑊] × 100 (3.12)
where, X = weight of crucible plus dry residue (g), Y= weight of crucible (g), Z= weight of crucible
plus ash (g), P = weight of protein (g), ODW = [ (weight of sample (g) × total solids (%)) / 100],
A = Absorbance of the sample at 320 nm, 86.73 = volume of the filtrate (mL), D = dilution factor,
W = weight of sample (mg) and 30 = absorptivity of biomass at 320 nm.
3.2.3. Lipid extraction from barley bran
3.2.3.1. Lipid extraction from barley bran using supercritical CO2 (SC-CO2) within a 10 mL
extraction vessel
Barley bran (3.0 g) was used to study the process conditions for maximum removal of lipid using
the supercritical CO2 extraction system (ISCO SFX 220, Lincoln, NE, USA) (Fig. 3.1). First, the
sample was weighed and loaded inside the extraction cell, which had filters at the bottom and top.
Then, the cell was inserted into the extraction chamber. Cooler was turned on to reach 0°C so that
CO2 is in the liquid to be pumped. The one-way valve was opened between CO2 tank and the
extraction chamber. The working temperature was set on the extractor. Then, the desired pressure
and time were set. After reaching the desired temperature and pressure, the dynamic extraction
started. The extraction was performed at different pressures of 200 and 300 bar and temperatures
of 40 and 70°C with 2 mL/min of CO2 flow rate (at pump condition). All extractions were
performed in duplicate and total lipid extract was collected every 30 min in pre-weighed glass
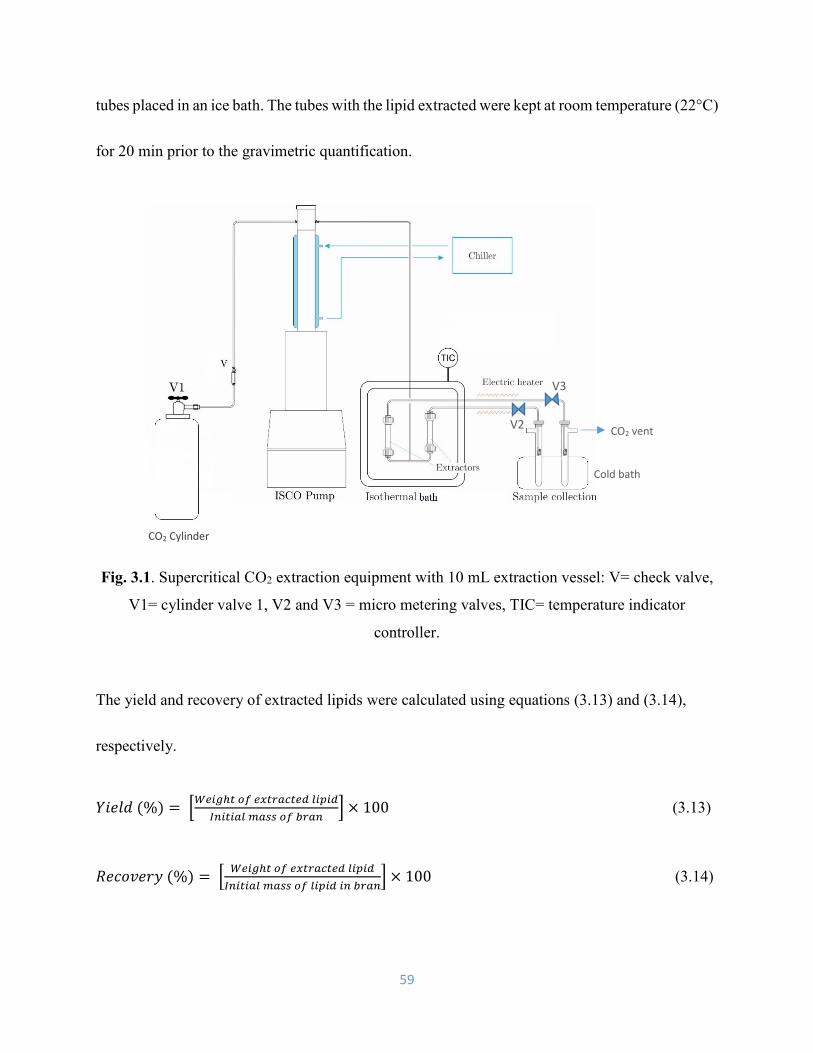
59
tubes placed in an ice bath. The tubes with the lipid extracted were kept at room temperature (22°C)
for 20 min prior to the gravimetric quantification.
Fig. 3.1. Supercritical CO2 extraction equipment with 10 mL extraction vessel: V= check valve,
V1= cylinder valve 1, V2 and V3 = micro metering valves, TIC= temperature indicator
controller.
The yield and recovery of extracted lipids were calculated using equations (3.13) and (3.14),
respectively.
𝑌𝑖𝑒𝑙𝑑 (%) = [𝑊𝑒𝑖𝑔ℎ𝑡 𝑜𝑓 𝑒𝑥𝑡𝑟𝑎𝑐𝑡𝑒𝑑 𝑙𝑖𝑝𝑖𝑑
𝐼𝑛𝑖𝑡𝑖𝑎𝑙 𝑚𝑎𝑠𝑠 𝑜𝑓 𝑏𝑟𝑎𝑛] × 100 (3.13)
𝑅𝑒𝑐𝑜𝑣𝑒𝑟𝑦 (%) = [𝑊𝑒𝑖𝑔ℎ𝑡 𝑜𝑓 𝑒𝑥𝑡𝑟𝑎𝑐𝑡𝑒𝑑 𝑙𝑖𝑝𝑖𝑑
𝐼𝑛𝑖𝑡𝑖𝑎𝑙 𝑚𝑎𝑠𝑠 𝑜𝑓 𝑙𝑖𝑝𝑖𝑑 𝑖𝑛 𝑏𝑟𝑎𝑛] × 100 (3.14)
CO2 Cylinder
Cold bath
CO2 vent V2
V3

60
3.2.3.2. Tocopherol analysis
The concentration of α-tocopherol was measured in the lipid samples obtained at different
pressures (200 and 300 bar) and temperatures (40 and 70°C) for 30 min extraction. Briefly, 36 mg
of lipid was dissolved in 1 mL hexane and passed through the 0.22 µm filter. Then, 20 uL of
sample was injected into a HPLC system equipped with a fluorescence detector RF-535 (Shimadzu
Co., Kyoto, Japan), a Supelcosil-LC-Diol column (25 cm × 4.6 mm, 5 µm, Supelco, Oakville, ON,
Canada). The mobile phase was a mixture of n-hexane/isopropanol (99.4:0.6, vol/vol) with a flow
rate of 1 mL/min. The concentration of α-tocopherol was quantified using the standard and
reported as µg α-tocopherol per mL of sample.
3.2.3.3. Lipid extraction from barley bran using SC-CO2 within a 300 mL extraction vessel
SC-CO2 extraction of lipid from barley bran was carried out using a laboratory scale equipment
(Newport Scientific Inc., Jessup, Md., USA) described by Bozan and Temelli (2002). Barley bran
(40 g) was loaded inside the basket and mixed with glass beads (3 mm in diameter) to improve the
extraction process. Glass wool was used at both ends to hold the sample and the basket was placed
inside the 300 mL extraction chamber. Extraction temperature was maintained within ± 2°C using
a thermocouple placed inside the extractor, a temperature controller and a heating jacket placed
around the extractor. A back-pressure regulator was used to maintain the pressure constant during
the extraction process. Lipid extraction was performed at the optimum temperature and pressure

61
(70°C and 300 bar) obtained previously using the 10 mL SC-CO2 system at a flow rate of 1.5 L/min
(measured at ambient conditions) for 8 h. The cumulative amounts of extracts were reported as a
function of time.
3.2.4. Starch removal from defatted barley bran
Defatted barley bran (100 g) was used for enzymatic starch removal with heat stable alpha-
amylase and amyloglucosidase according to the AOAC Method 991.43 with some modifications.
The bran was mixed with potassium phosphate buffer (0.05 M, pH of 6.5) in a ratio of 1:10 w/v
and incubated with alpha-amylase (150 U g-1 of defatted bran) for 40 min at 98-100°C. Then, HCl
(0.561 N) was added for pH adjustment to 4.1- 4.8, followed by incubation with amyloglucosidase
(660 U g-1 of defatted bran) at 60°C for 30 min. The polysaccharides were precipitated using the
addition of 4 times volume of 95% ethanol with a total of 4 L for each batch and separated by
centrifugation at 5000g for 15 min followed by drying in an oven at 40°C overnight. The dried
sample was ground in a centrifugal mill (Retsch, Haan, Germany) to obtain a powder with a
maximum particle size of 1.0 mm, then vacuum packed and stored at -20°C. This defatted and
destarched sample was used as a feed material for the SCW hydrolysis.

62
3.2.4.1. Subcritical water hydrolysis
The defatted and destarched sample (2 g) was hydrolyzed using a SCW system. Hydrolysis was
carried out in a semi-continuous flow type equipment similar to the one described by Ciftci and
Saldaña (2015). The main components of the SCW system are high performance liquid
chromatograph (HPLC) pump a pre-heater, a stainless steel high pressure reactor, a digital pressure
gauge, a cooling system an oven and a back pressure regulator (Fig. 3.2). Defatted and destarched
barley bran (2 g) was mixed with 20 g of glass beads (2.3 mm diameter) and then loaded into the
reactor, which had inlet and outlet filters of 20 μm. The system was heated by the oven and its
temperature was monitored by a digital thermometer during the process. Distilled water was first
degassed in an ultrasound bath for 20 min and delivered with the HPLC pump at a 5 mL/min flow
rate to the preheating section and then passed through the sample inside the reactor vessel. Pressure
of the system was maintained constant using the back-pressure regulator. The extracts were
collected in vials after passing through the cooling system placed after the reactor and stored at -
18°C for further analysis. The experiments were carried out at temperatures of 120–200°C, a
constant pressure of 50 bar for 15, 30 and 60 min. Pressure was selected above the maximum
pressure studied in the literature (30 bar) for the production of oligosaccharides using SCW. In
general, the main role of pressure in SCW is to maintain water in the liquid state. The changes in
pH values after hydrolysis were recorded in the liquid extracts. All experiments were performed

63
in duplicates. The solid residue left in the reactor vessel after each experiment was dried in an oven
at 40°C overnight.
Fig. 3.2. Subcritical fluid system: P= pressure gauge, and T1 and T2= thermocouples.
3.2.5. Protein removal from defatted and destarched bran
Defatted and destarched bran (20 g) was used for protein removal and polysaccharides extraction
with alkaline treatment (Song et al., 2012). Briefly, the bran was mixed with sodium hydroxide (3
N) at a liquid to solid ratio of 20:1 v/w, for almost 6 h at 60°C under constant stirring. After
extraction, the solid residue was separated from the liquid extract by centrifugation at 5000g for
15 min. Then, the soluble protein was precipitated by adjusting the pH to 4.5 in the liquid extract
by adding HCl (0.5 N) and the precipitated protein was removed from the supernatant by

64
centrifugation at 5000g for 10 min. Ethanol (90%, 800 mL) was added to the second obtained
supernatant and polysaccharides were precipitated overnight at 4°C. Then, the precipitated fraction
was dried in an oven at 40°C overnight. The dried sample was ground in a centrifugal mill (Retsch,
Haan, Germany) to obtain a powder with a maximum particle size of 1.0 mm, then vacuum packed
and stored at -20°C for further analysis. This bran fraction was used for enzymatic and SCW
hydrolysis.
3.2.5.1. Enzymatic hydrolysis of defatted – destarched and deproteinized bran
3.2.5.1.1. Substrate and enzyme preparation
Sodium acetate buffer (100 Mm) with pH of 4.5 containing bovine serum albumin (0.5 mg/mL)
was used for enzymatic hydrolysis. The buffer was prepared by the addition of 5.71 mL acetic acid
(1.049 g/mL) to 900 mL distilled water and the pH was adjusted to 4.5 using NaOH (1 N). Then,
the bovine serum albumin (500 mg) was added and the total volume was adjusted to 1L using
distilled water. Defatted – destarched and deproteinized bran (2.2 g) was added to 90 mL of buffer
and dispersed at 50°C by stirring. The solution volume was adjusted to 100 mL with the same
acetate buffer. Two endo beta-xylanase concentrations (50 and 200 U) were prepared by dilution
of 50 and 200 µL of the initial enzyme in 3950 and 3800 µL of sodium acetate buffer and stored
in an ice bath for further use.

65
3.2.5.1.2. Enzymatic hydrolysis with endo beta-xylanase
Defatted – destarched and deproteinized bran solution (10 mL) in two series of 50 mL Falcon tubes
(10 tubes in each series) were incubated at 40°C for about 5 min. Then, diluted endo-xylanase (0.2
mL) from 50 U solution was added to the contents of first tube series and the same amount of 200
U enzyme solution was added to the second series of tubes. Two tubes without enzyme were used
as control samples. All tubes were incubated in a water bath at 40°C with continuous agitation.
Two tubes from both series were taken out from the water bath at different time intervals (1, 4, 8
and 16 h) and incubated at 100°C for 5 min to inactivate the enzyme. Then, the aliquots and control
samples were transferred to the 1 mL micro centrifugal tubes and centrifuged at 5000g for 5 min.
Then, supernatants from centrifuged solutions were taken and kept at 4°C for further analysis.
3.2.6. Characterization of hydrolysates
3.2.6.1. pH determination
The pH of the liquid extracts was measured using a pH meter (Denver Instrument, Model 220,
USA) at all temperature investigated and 50 bar for 15, 30 and 60 min.
3.2.6.2. Reducing sugar determination
Liquid extracts obtained at 50 bar and 120, 140, 160, 180 and 200°C with residence times of 15,
30 and 60 min were used for reducing sugar determination according to the method described by
Miller (1959). First, the DNS reagent was prepared by dissolving 3,5-dinitrosalicylic acid (10 g)
and sodium sulfite (0.5 g) in 250 mL NaOH (1.0 N) and adjusting the volume to 1 L by miliQ
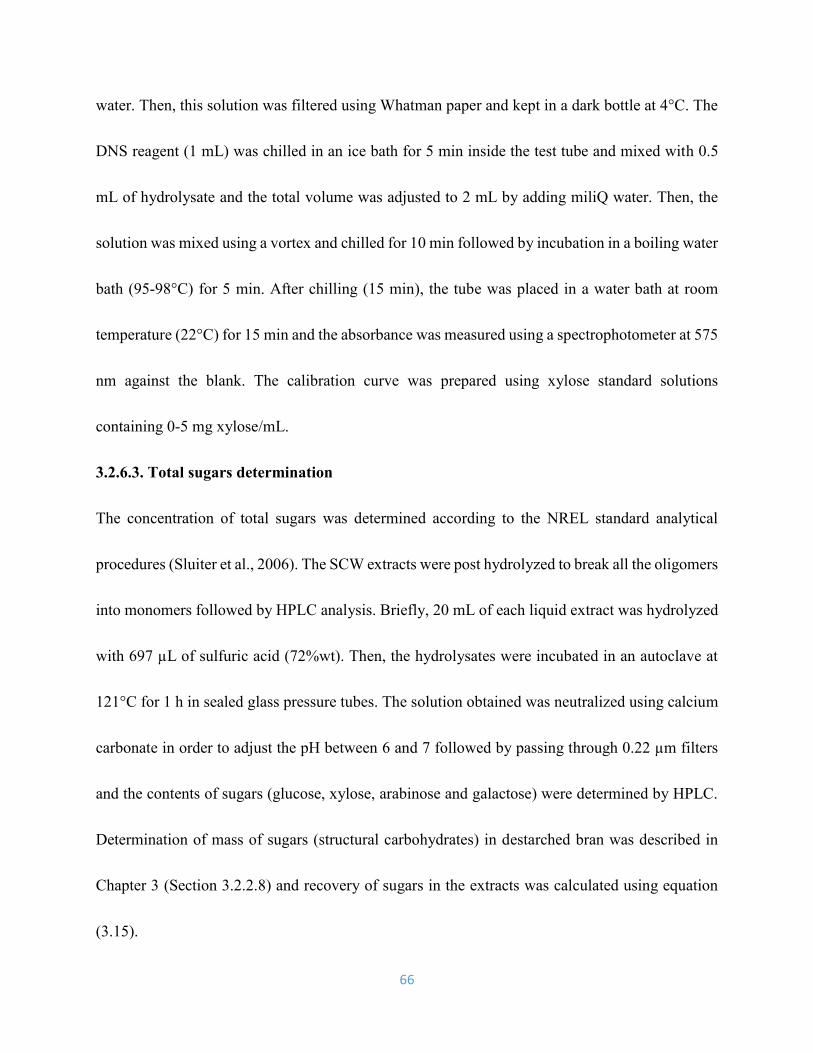
66
water. Then, this solution was filtered using Whatman paper and kept in a dark bottle at 4°C. The
DNS reagent (1 mL) was chilled in an ice bath for 5 min inside the test tube and mixed with 0.5
mL of hydrolysate and the total volume was adjusted to 2 mL by adding miliQ water. Then, the
solution was mixed using a vortex and chilled for 10 min followed by incubation in a boiling water
bath (95-98°C) for 5 min. After chilling (15 min), the tube was placed in a water bath at room
temperature (22°C) for 15 min and the absorbance was measured using a spectrophotometer at 575
nm against the blank. The calibration curve was prepared using xylose standard solutions
containing 0-5 mg xylose/mL.
3.2.6.3. Total sugars determination
The concentration of total sugars was determined according to the NREL standard analytical
procedures (Sluiter et al., 2006). The SCW extracts were post hydrolyzed to break all the oligomers
into monomers followed by HPLC analysis. Briefly, 20 mL of each liquid extract was hydrolyzed
with 697 µL of sulfuric acid (72%wt). Then, the hydrolysates were incubated in an autoclave at
121°C for 1 h in sealed glass pressure tubes. The solution obtained was neutralized using calcium
carbonate in order to adjust the pH between 6 and 7 followed by passing through 0.22 µm filters
and the contents of sugars (glucose, xylose, arabinose and galactose) were determined by HPLC.
Determination of mass of sugars (structural carbohydrates) in destarched bran was described in
Chapter 3 (Section 3.2.2.8) and recovery of sugars in the extracts was calculated using equation
(3.15).

67
𝑅𝑒𝑐𝑜𝑣𝑒𝑟𝑦 (%) = [𝑀𝑎𝑠𝑠 𝑜𝑓 𝑠𝑢𝑔𝑎𝑟𝑠 𝑖𝑛 𝑡ℎ𝑒 𝑒𝑥𝑡𝑟𝑎𝑐𝑡
𝐼𝑛𝑖𝑡𝑖𝑎𝑙 𝑚𝑎𝑠𝑠 𝑜𝑓 𝑠𝑢𝑔𝑎𝑟𝑠 𝑖𝑛 𝑑𝑒𝑠𝑡𝑎𝑟𝑐ℎ𝑒𝑑 𝑏𝑟𝑎𝑛 ] × 100 (3.15)
3.2.6.4. Monosaccharides and organic acids determination
The monosaccharides of SCW extracts were determined using a HPLC system equipped with a
refractive index detector (RID-10A) (Shimadzu Co., Kyoto, Japan) and a BioRad Aminex HPX-
87H column (300 × 7.8 mm, Bio-Rad laboratories, CA, USA) with 0.005 M sulfuric acid as the
mobile phase at a flow rate of 0.6 mL/min at temperature of 65°C for 50 min. The contents of
monosaccharides (glucose, xylose and arabinose) and organic acids (lactic acid, acetic acid) were
determined by HPLC using calibration curves that were prepared with standard solutions (See
Appendix A).
3.2.6.5. Xylo-oligosaccharides determination by HPLC
Xylo-oligosaccharides were measured using a HPLC system equipped with a refractive index
detector (RID-10A) (Shimadzu Co., Kyoto, Japan) and a Shimadzu LC-10AD pump (Shimadzu
Co., Kyoto, Japan). Xylo-oligosaccharides were eluted with HPLC grade water as the mobile phase
in the Aminex HPX 42-A column (300 mm × 7.8 mm, 25 µm, Bio-Rad laboratories, CA, USA)
with de-ashing and micro-guard carbo-p cartridges. Elution was performed at 85°C at a flow rate
of 0.4 mL/min for 45 min. The concentration of each oligosaccharide was quantified using peak
areas compared with standard oligosaccharides including xylobiose (X2), xylotriose (X3),
xylotetraose (X4) and xylohexaose (X6) and reported as mg/mL oligosaccharides. The XOS
recovery or XOS production by xylan conversion to XOS was determined by equation (3.16).

68
𝑋𝑦𝑙𝑜 − 𝑜𝑙𝑖𝑔𝑜𝑠𝑎𝑐𝑐ℎ𝑎𝑟𝑖𝑑𝑒𝑠 𝑟𝑒𝑐𝑜𝑣𝑒𝑟𝑦 (%) = [𝑀𝑎𝑠𝑠 (𝑔) 𝑖𝑛 𝑡ℎ𝑒 𝑙𝑖𝑞𝑢𝑖𝑑 𝑒𝑥𝑡𝑟𝑎𝑐𝑡 (𝑒𝑛𝑧𝑦𝑚𝑎𝑡𝑖𝑐 𝑎𝑛𝑑 𝑆𝐶𝑊)
𝑀𝑎𝑠𝑠 𝑜𝑓 𝑖𝑛𝑖𝑡𝑖𝑎𝑙 𝑥𝑦𝑙𝑎𝑛 (𝑔)] × 100 (3.16)
3.2.7. Statistical analysis
Data are shown as mean ± standard deviation according to the results obtained from at least
duplicate experiments and analysis. Two- and one-way analysis of variance (ANOVA) and the
multiple comparisons of the means with Tukey’s test at p < 0.05 were performed using Minitab
version 18.0 (Minitab Inc., State College, PA, USA) at 95% confidence interval.
3.3. Results and discussion
3.3.1. Lipid extraction with supercritical CO2 using 10 and 300 mL extraction vessels
The SC-CO2 extraction of lipids from barley bran at three extraction conditions are shown in Fig.
3.3 (a,b) in terms of the extract weight (g) and extract yield (%) using 10 mL vessel. Fig. 3.3 c
presents the extract weight (g) using 300 mL vessel. Different fractions were collected in tubes
every 30 min for a total of 120 min. The lipid content of barley bran was 9.46 ± 0.27% using
petroleum ether for 6 h based on Goldfisch determination. Using SC-CO2, the majority of lipid
was removed in the first 30 min of extraction (solubility effect), but no significant increase (p >
0.05) was observed after 60, 90 and 120 min (mass transfer predominance) at 300 bar/40°C and
300 bar/70°C. At 200 bar/40°C, the amount of lipid extracted increased significantly (p < 0.05)
from 30 to 60 min with the increasing of CO2 mass, leading to the higher solubilization of lipid
and no change was observed from 60 to 120 min. The total amount of lipid obtained was

69
significantly (p ˂ 0.05) influenced by temperature and pressure. The total lipid extracted after 30
min increased using high pressures from 200 bar (0.19 g) to 300 bar (0.24 g) at a constant
temperature of 40°C due to the increase of CO2 density, which leads to the higher solubility of
lipid (0.24 g).
Fig. 3.3. Lipid extraction from barley bran using supercritical CO2: (a) extract weight (g) using
10 mL vessel, (b) extract yield within 10 mL vessel and (c) extract weight (g) using a 300 mL
vessel.
Saldaña et al. (2002) investigated the extraction of cocoa butter from Brazilian cocoa beans using
SC-CO2 at a temperature of 50°C, pressures of 152 and 248 bar and a flow rate of 1.3 g/min.
0
0.05
0.1
0.15
0.2
0.25
0.3
0.35
0.4
0 30 60 90 120 150
Extr
act
wei
gh
t (g
)
Time (min)
200bar,40°C
300bar,40°C
300bar,70°C0
2
4
6
8
10
0 30 60 90 120 150
Extr
act
yie
ld (
g/g
bra
n%
)
Time (min)
200bar,40°C
300bar,40°C
300bar,70°C
0
1
2
3
4
0 100 200 300 400 500
Extr
act
wei
gh
t (g
)
Time (min)
70◦C, 300 bar
(a) (b)
(c)
Region 2 Region 3
Region 1

70
Pressure had a significant effect on the extraction yield of cocoa butter, where it increased three
times from 4.5 to 13% by pressure rise with the same CO2 mass (2.6 kg).
Prado and Saldaña (2014) studied the effect of pressure and temperature for flax hulls (26% lipid)
oil recovery at three pressures (100, 200 and 300 bar) and two temperatures (40 and 60°C) at a
flow rate of 3.15 × 10⁵ kg/s for 120 min. They reported the increase of lipid extraction yield by
pressure rise from 100 to 300 bar (almost 9 to 14% db) at 40°C and (almost 5 to 17% db) at 60°C.
With an increase in temperature, the lipid yield increased at a high pressure of 300 bar but
decreased at low pressures of 100 and 200 bar, which reflects the crossover behavior that was also
reported by Fattori et al. (1988).
An increase from 0.24 to 0.26 g of extracted lipid was achieved when extraction was carried out
at 40 and 70°C, respectively at a constant pressure of 300 bar and 30 min. These results agree with
previous data reported by Temelli et al. (2013), who studied the effect of pressure and temperature
on lipid recovery from 35% barley pearling flour. The authors reported an increase in the amount
of total extract from 0.19 to 0.23 g after 180 min with a pressure rise from 240 to 450 bar. The
density of CO2 decreased at high temperatures (0.9 g/mL at 40°C/300 bar versus 0.7 g/mL at
70°C/300 bar). However, the vapor pressure and diffusivity of the lipid increased with temperature.
In this study, after 120 min, yields of 7.7%, 8.3% and 9.3% were obtained for 200 bar/40°C, 300
bar/40°C and 300 bar/70°C, respectively (Fig. 3.3 b). The lowest lipid recovery was about 66% at
200 bar and 40°C for 30 min while the highest lipid recovery was 98% at 300 bar and 70°C for

71
120 min. Therefore, predominance of solute vapour pressure over solvent density was observed
similarly to the reported by Azevedo et al. (2008) and Kwon et al. (2010) for SC-CO2 extraction
of green coffee oil and wheat bran oil, respectively.
As 300 bar and 70°C was the best condition to obtain the highest lipid recovery from barley bran,
this condition was used for the large scale extraction vessel (300 mL), and the extraction curve is
shown in Fig. 3.3 c. The SC-CO2 extraction curve as a function of time has three main regions. In
the first region, the free lipid on the surface of the barley bran is solubilized in SC-CO2 and
transferred by convection at a constant extraction rate region (solubility predominant). In general,
50 to 90% of total lipid is extracted during this period. The second region shows the falling
extraction rate, in which free lipid available on the surface is reduced and diffusion of CO2 starts
to solubilize the rest of lipid inside the particles. The last region is the diffusion-controlled region,
and mass transfer mechanism is mainly related to the diffusion of CO2 and lipids inside the barley
bran matrix (Fig. 3.3). The highest weight of lipid (3.62 g) corresponding to 95.4% from 40.2 g of
initial sample was obtained after 480 min extraction. However, there was no significant change in
the weight of the extracted lipid after 240 min.
From Fig 3.4, the ratio between the mass of total CO2 to the mass of feed was 15.7 for a 30 min
extraction using a 10 mL extraction vessel with a lipid recovery of 94% at 300 bar/70°C. Using
the 300 mL extraction vessel, after 4 h extraction at the same solvent/feed ratio of 15.7, the
recovery was 92%. Using 10 mL vessel and 3 g sample, with 2 mL/min of flow rate at pump

72
conditions (CO2 density at 300 bar/70°C is 0.7879 g/mL, NIST Chemistry WebBook), the mass of
CO2 used was 47.27 g after 30 min extraction. Using 300 mL vessel and 40.2 g sample, with a
flow rate of 1.4-1.5 L/min at ambient condition, the mass of CO2 used was 47.22 g (CO2 density
at ambient condition is 0.00178 g/mL, NIST Chemistry WebBook) after 4 h extraction 640.8 g.
Fig. 3.4. Lipid recovery as a function of CO2/feed (g/g) ratio at 300 bar and 70°C.
Water extraction or moisture removal is another phenomenon which takes place during SC-CO2
lipid extraction and final defatted product has lower moisture content compared to the initial
material. Dunford and Temelli (1997) reported the reduction of moisture in defatted canola flakes
after SC-CO2 lipid extraction. In this study, moisture content was reduced in the final defatted bran
compared to the initial barley bran and related results are discussed in Chapter 3 (Section 3.3.2)
The effect of temperature and pressure on the α-tocopherol content in the extracted lipids is shown
in Fig. 3.5. The amount of α-tocopherol was 420.86 µg/g lipid at 200 bar and 40°C, then it
increased to 613.91 µg/g lipid at 300 bar and 40°C. The increase of α-tocopherol content with
pressure increase was due to the increase in CO2 density and its solvating power. The amount of
0
20
40
60
80
100
0 10 20 30 40
Extr
act
ion
rec
ov
ery
(%
)
Mass of CO2/mass of feed (g/g)
10mL vessel
300mL vessel

73
α-tocopherol did not change at 300 bar and 70°C (605.66 µg/g lipid). Therefore, the best condition
to obtain α-tocopherol was 300 bar and 40°C.
Fig. 3.5. Content of α-tocopherol in lipids extracted at different temperatures and pressures for
30 min within 10 mL vessel. Means with different letters are significantly different at p<0.05.
3.3.2. Proximate composition of raw, defatted and defatted-destarched bran
Moisture, fat, ash, protein, starch, and beta-glucan contents were reported in Table 3.1 for bran,
defatted and defatted-destarched bran (DF-DS bran). Supercritical CO2 lipid extraction was
successful in reducing the lipid content of barley bran from 9.4 to 0.35%, while the protein content
increased significantly from 25.7 to 28.6%. Moreover, moisture content dropped to 3.02% in
defatted bran. Dunford and Temelli (1997) observed the reduction of moisture content of cooked
canola from 12.7 to 9% and preheated canola from 15.9 to 12.2% at 75°C and 414 bar while
extracting lipid from canola flakes. In another study, lipid was extracted from wheat germ by SC-
CO2 at 55°C and 380 bar where the moisture content reduced from 8 to 5% and the protein content
increased from 31 to 36% in defatted cake (Panfilli et al., 2003).
0
200
400
600200 bar,40°C
300 bar,40°C
300 bar,70°C
Processing conditions
a
b b

74
Table 3.1. Composition of barley bran.
Data are expressed as mean ± standard deviation of two replicates. a-b Different letters in the same row indicate significant differences (p < 0.05), ND: Not determined.
Structural carbohydrates were quantified in defatted and defatted-destarched bran (Table 3.2). The
difference between the composition of defatted and defatted-destarched bran is illustrated in Fig.
3.6.
Table 3.2. Structural carbohydrates in defatted and defatted-destarched bran.
Constituent Defatted bran
(db %)
Defatted-destarched bran
(db %)
Glucan (with beta glucan and
starch) 29.40 ± 0.61a 19.17 ± 0.93b
Xylan 8.36 ± 0.17b 12.83 ± 0.35a
Galactan 3.06 ± 0.21a 3.65 ± 0.15a
Arabinan 9.55 ± 0.48b 13.47 ± 0.61a
Lignin 8.13 ± 0.32a 7.17 ± 0.53a
Data are expressed as mean ± standard deviation of two replicates. a-b Different letters in the same row indicate significant differences (p < 0.05).
Constituent bran
(% w/w)
Defatted bran
(% w/w) Defatted-destarched bran
(% w/w)
Moisture 5.3 ± 0.1a 3.0 ± 0.2
b 2.7 ± 0.0b
Protein 25.7 ± 0.3c 28.6 ± 0.1
b 31.2 ± 0.6a
Lipid 9.4 ± 0.2a 0.3 ± 0.0b
ND
Ash 4.1 ± 0.2b 5.9 ± 0.0
a 6.9 ± 0.2a
Starch 10.4 ± 0.6a 12.0 ± 0.4
a 1.0 ± 0.1b
Beta-glucan 1.8 ± 0.1a ND 2.6 ± 0.4
b
Image
75
Enzymatic destarching was performed using alpha-amylase to hydrolyze α-(1→4) linkages and
produce maltose, maltotriose and branched dextrins, followed by their conversion to glucose by
±amyloglucosidase and further precipitation of non-starch polysaccharides with ethanol. This
enzymatic method was effective in reducing starch content to almost 1%. Total glucose content
(glucan), determined after acid hydrolysis of mainly beta-glucan, starch and cellulose reduced
from 29.40 to 19.17% compared to the defatted bran due to the removal of starch. However, beta-
glucan, xylan and arabinan increased to 2.66, 12.83 and 13.47%, respectively. The reason why
beta-glucan increased could be due to the method used for its determination (enzymatic hydrolysis)
where glucose coming from only beta-glucan was accounted in the measurement (Fig. 3.6). Also,
by removing starch, the other components increased.
Enzymatic removal of starch and further precipitation of non-starch polysaccharides was reported
in the literature. Aguedo et al. (2013) removed starch from wheat bran using alpha-amylase
treatment at 90°C for 90 min, where the glucan content was reduced from 10.23 to 3.08% db in
the final destarched bran. Wang et al. (2009) treated wheat bran using a combination of alpha-
amylase and amyloglucosidase to obtain destarched bran. In that study, starch content reduced
from 14.21 to 0.23, while the amounts of xylan and arabinan increased from 15.66 to 42.78 and
from 8.72 to 19.45% (db), respectively. Ruthes et al. (2017) removed starch from wheat bran
before subcritical water hydrolysis to obtain beta-gluco-oligosaccharides and arabinoxylo-
oligosaccharides. The authors reported an increase from 57 to 60.8 mg/g (db) for beta-glucan and

76
from 289.6 to 405.3 mg/g (db) for arabinoxylan content after removal of starch, however reduction
of glucan from 45.5 to 35.7 was observed (% of total carbohydrates).
Fig. 3.6. Structural carbohydrates of defatted bran and defatted-destarched bran. Means within
the same group of structural carbohydrates with different letters are significantly different at
p<0.05.
3.3.3. Characterization of SCW hydrolysates
3.3.3.1. Change in pH
The pH values of the SCW extracts as a function of time are shown in Fig. 3.7. Initially, a pH value
of 6.24 for barley bran was measured in the first 10 min using the SCW equipment with distilled
water at ambient condition with a flow rate of 5 mL/min as the control. For all the other SCW
extracts, after 15 min, the pH reduced sharply, showing only minor changes until the end of the
process. Released acetyl groups in the hemicellulose are decreased with time and the continuous
incoming water (Gallina et al. 2016). The trend is similar at all conditions investigated and the
0
5
10
15
20
25
30
35
Glucan Arabinan Xylan Galactan Arabinoxylan Lignin
Co
mp
osi
tio
n %
(dry
ba
sis)
Structural carbohydrates
Defatted bran
Defatted-Destarched bran
a
a a
a
a
b
a
b a
a
b
b
77
temperature had the strongest influence in the pH change. The highest pH of 5.76-5.85 was
obtained at 120°C, while the lowest pH of 3.89-4.37 was obtained at 200°C due to the higher extent
of depolymerization of hemicellulose and greater deacetylation with further formation of acetic
acid. The pH change was in agreement with Sarkar (2013), who studied the extraction of total
carbohydrates and phenolic compounds from barley hull using subcritical water treatment. They
reported a pH of 7.12 in the extract collected at 120°C, and acidic pH of 3.86 in the extract collected
at 180°C. Release of acetyl groups from hemicellulosic sugars and formation of acetic acid
increase the concentration of hydronium ions and reduce the pH in the subcritical water media
(Fig. 3.7). Gallina et al. (2018) reported a pH change in hot pressurized water pre-treatment of 10
different types of wood at 160ºC, a flow rate of 150 L h-1, pressure of 9 bar and solvent to feed
ratio of 150:1 (mL/g). They observed that the highest increase in the concentration of H3O+ ions
was within the first 40 min, with minor change until the end of the process. Acetic acid promotes
the breaking down of extracted hemicellulose and increases the yield of reducing sugars. Also,
acetic acid aids hydrolysis of the oligomeric fractions and reduces the molecular weight of
extracted hemicellulose (Garrote et al., 2001). In this study, acetic acid was not detected in the
liquid extracts obtained at 120 and 160°C. However, acetic acid was detected at conditions of
180°C (5.96±0.86 mg) and 200°C (10.83±0.93 mg) in the extracts collected after 15 min that led
to the pH reduction from 5.76 to 4.06 and 3.89 at 120, 180 and 200°C, respectively. Also, lactic
acid was detected in the liquid extracts obtained at high temperatures and could be responsible for

78
the increase of acidity. Lactic acid was quantified as 46±7.14 mg and 70.32±2.29 mg in the SCW
extracts obtained at 180 and 200°C, respectively, after 15 min extraction time (Fig. 3.8). Lactic
acid has important applications in the food industry such as mild acid flavor agent, pH regulator
or preservative in olives and pickled vegetables (Komesu et al., 2017).
Fig. 3.7. pH values of the SCW extracts at different temperatures and time.
Fig. 3.8. Organic acids in the SCW extracts obtained at different temperatures after 15 min.
3
3.5
4
4.5
5
5.5
6
6.5
0 10 20 30 40 50 60 70
pH
Time (min)
120 °C140 °C160 °C180 °C200 °C
0
10
20
30
40
50
60
70
80
120 180 200
Org
an
ic a
cid
s (m
g)
Lactic acid
Acetic acid
Temperature (°C)

79
3.3.3.2. Reducing sugar content of SCW hydrolysates
The effect of temperature (120-200°C) on reducing sugar yield at a constant flow rate (5 mL/min)
and pressure (50 bar) is shown in Fig. 3.9. The DF-DS bran is mainly composed of biopolymers,
including glucan (19.17% db) and arabinoxylan (26.31% db) (Fig. 3.6), which were hydrolyzed in
the SCW media and converted to smaller compounds with reducing ends. An increase in these
reducing sugars shows a higher rate of depolymerization and formation of low molecular weight
compounds. Zhao and Saldaña (2019) studied the hydrolysis of cassava starch and chitosan by
SCW treatment at temperatures of 75, 100, 125 and 150°C and pressures of 50, 85, 120 and 155
bar. They reported an increase of reducing end yield around five times in extracts collected at 150
°C compared with the extracts at 75°C, which indicated the hydrolysis of these polymers and
formation of smaller compounds with reducing ends.
Hydronium ions produced from water auto-ionization led to hemicellulose depolymerization by
cleavage of glycosidic linkages and release of O-acetyl groups, which form acetic and uronic acids.
These acids accelerate the hydrolysis of hemicellulose, further producing reducing sugars (Alvarez
et al., 2014). The temperature had a significant effect on the hydrolysis rate and promoted the
breaking down of polymers, leading to more reducing sugar production. The formation of reducing
sugar was less significant at 120 and 140°C. Increasing the temperature from 160 to 180°C led to
higher reducing sugar yield from 2.63 to 7.28%, 4.43 to 10.09% and 6.99 to 12.17% for 15, 30 and
60 min extraction time, respectively.

80
Fig. 3.9. Yield of reducing sugar after SCW hydrolysis at different temperatures and times at 5
mL/min water flow rate and 50 bar.
The effect of temperature on the reducing sugar yield is due to the thermal effects and increase in
the concentration of H+ and OH-, which promotes the acid-catalyzed hydrolysis of cellulose and
hemicellulose and formation of more reducing sugars. However, at elevated temperature of 200°C,
the yield declined to 4.11, 8.39 and 9.7% for 15, 30 and 60 min extraction time, respectively.
Pourali et al. (2010) reported similar results in the hydrolysis of rice bran using a batch SCW
system over a temperature range of 180–360°C for 10 min, where the total soluble sugars yield
increased with temperature and reached the maximum amount of almost 200 mg/g db at 190°C,
and then decreased sharply at temperatures above 200°C. This reduction could be an evidence of
conversion of sugars into other secondary compounds, such as hydroxymethyl furfural (HMF),
furfural, acetic acid, levulinic acid, formic acid, lactic acid, etc. (Abaide et al. 2019; Pinkowska et
al., 2011). In this study, increased levels of acetic acid and lactic acid were detected in the
0
2
4
6
8
10
12
14
120 140 160 180 200Red
uci
ng
su
gar
(xy
lose
eq
uiv
ale
nt
(g/g
bra
n %
)
15 min
30 min
60 min
Temperature (°C)

81
hydrolysates collected at 180 and 200°C, leading to a decrease of reducing sugars and further
reduction in pH, which was explained in Chapter 3 (Section 3.3.3.1). According to Fig. 3.7, pH
values decreased in the liquid extracts obtained at 200°C from an initial pH of 6.2 to almost pH of
3-4. However, this further increase in acidity did not improve the yield of reducing sugars, as
organic acids like lactic acid was produced as a result of sugars degradation. Phaiboonsilpa and
Saka (2011) investigated the effect of acetic acid addition on the hydrolysis of Japanese beech in
the SCW media and reported no improvement of hemicellulose hydrolysis by additional acetic
acid (0.1–3%) compared to the control sample (0%), which showed the auto formation of acetic
acid during the hydrolysis of hemicellulose. Similar findings were obtained by Ciftci and Saldaña
(2015), who hydrolyzed sweet blue lupin hull in SCW and reported that the yield of hemicellulosic
sugars in the extracts increased from 160°C (64.2%) to 180°C (85.5%), and then decreased at 200
and 220°C. Abaide et al. (2019) obtained fermentable sugars from rice husk by SCW hydrolysis
using a semi-continuous system with at a flow rate of 15 mL/min, 30 g feed, pressure of 250 bar
and different temperatures (180, 220, and 260°C) for a total reaction time of 15 min. They reported
an increase in reducing sugar yield from 0.8 to 18.3 g/100 g rice husk at 180 and 220°C and a
reduction to 5.5 g/100 g rice husk at 260°C, where the lower sugar content at 260°C was associated
with the increase of acetic acid concentration at 220 and 260°C from 4.5 to 21.9 g/L due to the
degradation of sugars.

82
The yield of reducing sugar increased significantly (p < 0.05) with increasing solid residence time
at 180°C from 15 min (7.28%) to 30 min (10.09%) and no statistical change was observed at 60
min (12.17%). Improvement of reducing sugar yield after 30 min extraction was due to the
complete soaking and more interaction of the feed and dissolution of biopolymers from surface of
the matrix, enhancing their extraction and depolymerization, leading to a higher yield of reducing
sugars. Overall, the highest reducing sugar yield was obtained at 180°C and 30 min (10.09±0.90%)
and 180°C and 60 min (12.17±0.98%).
Mayanga et al. (2018) investigated the hydrolysis of brewer’s spent grains in a semi-continuous
SCW system at 140, 160, 180 and 210°C with flow rates of 10 and 20 mL min-1 and 150 bar. These
authors reported a significant increase in reducing sugar yield with temperature rise from 140 to
210°C. They obtained the maximum reducing sugar yields (6.4 g reducing sugar/100 g) at 210°C
for 56 min (10 mL min-1) and 28 min (20 mL min-1), which were less than the yield in this study.
Also, they did not observe reduction of reducing sugars at temperatures above 180°C, probably
because of the higher flow rate, which led to the short residence and contact time of brewer’s spent
grains with water to produce acids. Therefore, the hydrolysis rate of hemicellulose was reduced
(Abdelmoez et al., 2014; Zhu et al., 2011).

83
3.3.3.3. Total sugars composition
The production of reducing sugars indicates the trend of hydrolysis based on temperature and time.
Further quantifications are needed to determine the individual sugars as monomeric units after post
hydrolysis with sulfuric acid. Table 3.3 summarizes sugars composition of SCW hydrolysates
obtained in this study, including arabinose, xylose, galactose, glucose and total sugars and the
resulting pH of the hydrolysates. Figs. 3.10 and 3.11 show the recovery (%) of individual and total
sugars obtained after SCW treatment at 15, 30 and 60 min as a function of temperature from 120
to 180°C. The recovery was calculated with respect to the initial weight of structural carbohydrates
in the destarched bran.
The main sugars obtained from the DF-DS bran were xylose, glucose and arabinose. Glucose from
hydrolysis of hemicellulose, cellulose and starch was obtained in the first 15 min with 10.5, 10.6,
13.8 and 16.5% recovery at 120, 140, 160 and 180°C, respectively. There was an increase in the
glucose recovery only when the temperature increased from 120 to 140°C, but there was no
significant difference at 160 and 180°C after 30 and 60 min extraction times. The maximum
recovery of glucose was 29.86% at the best condition of 140°C/ 50 bar/ 5 mL/min/ 60 min, without
any noticeable change up to 160 and 180°C (Fig. 3.10 a).

84
Table 3.3.a. Sugar composition after SCW treatment.
Processing
conditions
SCW extracts
T
(°C)
t
(min) pH
Glucose
(mg)
Galactose
(mg)
Xylose
(mg)
Arabinose
(mg)
Ratio
(p/g)
Total sugars
(mg)
120 15 5.76 40.2±2.1e 12.3±0.5de 14.5±0.4h 21.4±3.6g 0.89 88.6±2.4e
120 30 5.78 59.3±5.8d 15.3±1.62de 21.4±1.4gh 32.7±3.2fg 0.91 128.9±12.2e
120 60 5.85 101.2±6.6ab 41.9±1.4b 46.6±2.8ef 73.9±3.4e 1.19 263.7±11.4c
140 15 4.88 40.6±2.8e 13.6±0.1de 16.3±2.78gh 27.1±3.9fg 1.06 97.7±9.5e
140 30 4.75 89.13±3.1bc 28.8±1.5c 53.2±4.3ef 72.7±4.8e 1.41 243.9±13.9c
140 60 4.89 114.5±3.4a 44.9±1.3ab 84.5±4.2d 126.4±2.2c 1.84 370.3±1.8b
160 15 4.68 53.1±4.5de 12.17±0.3e 35.1±5.5fg 37.4±4.4fg 1.36 137.8±7.0de
160 30 4.55 83.0±1.9c 24.9±1.1c 77.8±4.3d 90.5±4.1d 2.02 276.4±11.7c
160 60 4.66 103.6±3.2ab 44.8±0.7ab 112.6±5.0c 147.6±5.2b 2.51 408.7±14.2b
180 15 4.06 63.6±3.7d 17.5±0.23d 58.9±2.1e 43.3±2.8f 1.60 183.49±4.2d
180 30 4.16 80.3±0.9c 39.9±2.74b 126.8±6.7b 99.3±5.2d 2.81 376.2±25.3b
180 60 4.33 102.8±5.0ab 47.8±0.07a 169.8±9.4a 174.±4.5a 3.34 487.8±10.6a
T: temperature; t: time, Data are expressed as mean ± standard deviation of two replicate
a-h Different letters in the same column indicate significant differences (p < 0.05), p/g: pentose/glucose.
Total sugars: Glucose + galactose + arabinose + xylose, Recovery is expressed as (%) based on each structural
carbohydrate present in the feed material.

85
Table 3.3.b. Sugar recovery after SCW treatment.
T: temperature; t: time, Data are expressed as mean ± standard deviation of two replicates.
a-h Different letters in the same column indicate significant differences (p < 0.05), p/g: pentose/glucose.
Total sugars: Glucose + galactose + arabinose + xylose, Recovery is expressed as (%) based structural carbohydrate
present in the feed material.
Processing
conditions SCW extracts
T
(°C)
t
(min)
Glucose
(%)
Galactose
(%)
Xylose
(%)
Arabinose
(%)
Total sugars
(%)
120 15 10.5±0.5e 16.9±0.7de 5.6±0.1h 7.9±1.3g 9.0±0.2e
120 30 15.4±1.5d 21.0±2.2de 8.3±0.5gh 12.1±1.2fg 13.1±1.2e
120 60 26.3±1.7ab 57.5±1.9b 18.1±1.0ef 27.4±1.2e 26.8±1.1c
140 15 10.6±0.7e 18.6±0.2de 6.3±1.0gh 10.4±1.4fg 9.9±0.9e
140 30 22.6±0.8bc 39.4±2.1c 20.7±1.6ef 26.9±1.7e 24.8±1.4c
140 60 29.8±0.8a 61.5±1.8ab 32.9±1.6d 46.9±0.8c 37.6±0.1b
160 15 13.8±1.1de 16.6±0.5e 13.6±2.1fg 13.8±1.6fg 14.0±1.4de
160 30 21.6±0.5c 34.2±1.6c 30.3±1.6d 33.6±1.5d 28.1±1.1c
160 60 27.0±0.8ab 61.4±0.9ab 43.8±1.9c 54.7±1.9b 41.6±1.4b
180 15 16.5±0.9d 24±1.7d 22.9±0.8e 16.0±1.0f 18.6±0.43d
180 30 20.9±0.2c 54.7±3.7b 51.2±2.6b 36.8±1.0d 38.2±2.5b
180 60 26.8±1.3ab 65.4±0.9a 63.5±3.6a 64.6±1.6a 49.6±1.0a

86
0
5
10
15
20
25
30
35
120 140 160 180
Rec
over
y
(% I
nit
ial
wei
gh
t of
glu
can
)
15 min
30 min
60 min
Temperature (°C)
0
20
40
60
80
120 140 160 180
Rec
over
y
(% I
nit
ial
wei
gh
t of
xy
lan
) 15 min
30 min
60 min
0
20
40
60
80
120 140 160 180
Rec
over
y
(% I
nit
ial
wei
gh
t of
ara
bin
an
)
15 min
30 min
60 min
Fig. 3.10. Total recovery of: (a) glucose, (b) xylose, and (c) arabinose in the SCW extracts at 50
bar and 5 mL/min.
(a)
(b)
(c)
Temperature (°C)
Temperature (°C)

87
Fig. 3.11. Total recovery of sugars (glucose, xylose, arabinose and galactose) in the SCW
extracts at 50 bar and 5 mL/min.
In the SCW condition, low temperatures of 100-135°C are sufficient to obtain the maximum
amount of glucose as a free monosaccharide or coming from starch hydrolysis or from the
degradation of hemicelluloses, mainly beta-glucan (Cara et al., 2012; Benito-Roman et al., 2013).
Therefore after 30 and 60 min, no increase in the recovery of glucose was observed.
Recovery of pentose sugars, including xylose and arabinose, which are the main constituents of
hemicellulose increased with an increase of temperature. The amount of xylose was determined as
14.5, 16.3, 35.1 and 58.9 mg in the hydrolysates obtained after 15 min reaction time at 120, 140,
160 and 180°C, respectively. Also, there is a continuous increase with temperature rise from 120
to 180°C after 30 and 60 min (Fig. 3.10 b). In terms of arabinose recovery, a similar trend was
observed after 30 and 60 min extraction (Fig. 3.10 c). For the liquid extracts obtained at 180°C
and 60 min, xylose and arabinose contents were 169.8±9.4 and 174.1±4.5 mg (70.31% of total
0
10
20
30
40
50
60
120 140 160 180
Rec
over
y
(% I
nit
ial
wei
gh
t of
tota
l su
gars
)
15 min
30 min
60 min
Temperature (°C)

88
sugars), corresponding to a maximum recovery of 63.58 and 64.62%, respectively. Gallina et al.
(2016) hydrolyzed eucalyptus globulus wood in a semi-continuous reactor with 5 g feed, flow rate
of 5 mL/min and pressure of 100 bar for 90 min and reported a similar trend with an increase in
the recovery of pentose sugars (arabinose and xylose) from 0 to 67.40% at 135 and 180°C,
respectively. They obtained pentose sugars with similar recovery at 180°C and 90 min compared
to that in this study at 180°C and 60 min. This might be due to the lower solvent-to-feed ratio used
(90 mL/g) compared to this study (150 mL/g). Yu et al. (2013) used SCW treatment to obtain
sugars from sugarcane bagasse with 45.2% glucan, 23.6% xylan and 2.1% arabinan, using 35 g of
the raw material (5% w/v in water) inside a batch reactor for 20 min. They recovered the highest
level of xylose (74.3%) at 160°C, and then a reduction was observed by increasing the temperature
to 180 and 200°C with 60 and 15% recovery, respectively. They reported an increase in the
concentration of degradation products such as furfural and acetic acid from approximately 1 to 2.5
g/L and 1 to 1.7 g/L in the liquid extracts obtained at 180 and 200°C, respectively. In this study,
xylose recovery reduction was not observed at 180°C, because in a semi-continuous SCW system,
the liquid flows rapidly out of the reactor, minimizing degradation of sugars compared to the batch
system.
Ruthes et al. (2017) also extracted sugars from destarched wheat bran using 1 g of raw material at
100, 120, 140 and 160°C for 15 min and pH of 5, 7 and 9 by addition of formic acid or NaOH.

89
They obtained the highest extraction yields at 160°C and pH 7 with the total recovery of arabinose
and xylose (55.1%).
Low recovery of glucose compared to xylose and arabinose might be due to the fact that cellulose
is one of the sources of glucose, which is difficult to hydrolyze at temperatures below 240°C.
According to Table 3.3, the presence of glucose was higher than the pentose sugars (xylose and
arabinose) in the fractions obtained at low temperature (120°C). However, the ratio between the
content of pentoses and glucose increased at elevated temperatures (>140°C) and it reached to 3.34
at 180°C/60 min. Ruthes et al. (2017) reported a similar behavior for the extraction of sugars from
destarched wheat bran. In their study, glucose had higher concentrations at lower temperatures of
100°C with 530 (mg/g DW of the extracts) compared to the pentose sugars (arabinose and xylose)
with 200 mg/g (mg/g DW of the extracts). Moreover, they observed a similar increase in the ratio
between pentose sugars and glucose from 0.37 to 3.6 when temperature increased from 100 to
160°C. Therefore, polysaccharides composed of glucose, including beta-glucan and starch were
easier to hydrolyze than arabinan and xylan in the SCW media. This phenomenon was also
reported by Benito-Roman et al. (2013), who hydrolyzed wheat bran using a semi-continuous
rector with 10-12 g feed, pressure of 20 bar, flow rate of 4 g/min, temperatures of 110-175°C for
105 min. In their study, free glucose or glucose from starch hydrolysis was extracted easily at 110
and 135°C with 150 and 80 mg obtained in the total extract, while trace amounts of xylose and

90
arabinose were observed at these temperatures. However, the concentration of pentose sugars
increased dramatically at 160 and 180°C with approximately 100 and 320 mg, respectively.
The effect of temperature on the recovery of total sugars after SCW treatment (Fig. 3.11) was
similar to the trend observed for the reducing sugars (Fig. 3.9). Total sugars recovered after SCW
treatment was in the range of 88.6 and 487.8 mg corresponding to 9.02 and 49.66% recovery in
the liquid extracts at 120°C/15 min and 180°C/60 min, respectively. Extraction time of 15-60 min
had a significant effect on the total amount of sugars at all temperatures investigated. For example,
88.6 and 263.7 mg of total sugars were obtained in the liquid extracts after 15 and 60 min at 120°C.
By increasing the time, the solvent-to-feed ratio increased leading to hydrolysis of
polysaccharides, resulting in a significant influence on the recovery of sugars. The effect of
temperature was significant between 120°C (9.02, 13.12, 26.84% recovery) and 180°C (18.67,
38.29, 49.66% recovery) for 15, 30 and 60 min, respectively, and there was no difference between
the total amount of sugars obtained at 140 and 160°C.
Sunphorka et al. (2012) reported sugar extraction from rice bran and de-oiled rice bran using SCW
in a semi-continuous reactor with a flow rate of 0.5 mL/min, pressures of 40-100 bar and
temperatures of 150 and 250°C for 5 and 60 min. The authors reported an increase in total sugars
yield by an increase of time from 5 min (18.3 mg/g rice bran) to 60 min (165.1 mg/g rice bran) in
the extracts for treatment at 150°C and 0.5 mL/min. Also, they reported an increase from 18.3 to

91
94.3 mg/g of total sugars in the extracts obtained at 150 and 250°C for 5 min and 165.1 to 119
mg/g for 60 min, which showed the positive effect of time on the total sugars yield.
3.3.3.4. Xylo-oligosaccharides (XOS) and monosaccharides by HPLC
Xylo-oligosaccharides with different degrees of polymerization (DP) were determined by HPLC
for all the hydrolysates obtained at 120, 140, 160, 180 and 200°C. Standards of xylose (X1),
xylobiose (X2), xylotriose (X3), and xylohexaose (X6) were used to determine the molecular
weight (MW) and degree of polymerization (DP) calibration curve (see Appendix A, Fig. A2 a,b).
Chromatograms obtained from DF-DS bran hydrolysis by SCW at temperatures in a range of 120-
200°C are shown in Fig. 3.12 a-e. Different peaks with retention times in the range of 7.4 to 26.2
min corresponding to DP 1-12, and MW of 150 – 1698 Da were identified in the liquid extracts.
For the liquid extracts obtained at 120 and 140°C, only three peaks with retention times of 7.24
(compounds with DP ≥ 12), 23.2 and 26.5 min were found and any peaks related to the XOS with
DP<12 were not detected (Fig. 3.12 a,b). Only SCW hydrolysates obtained at 160, 180 and 200°C
showed peaks related to XOS.

92
Fig. 3.12. Chromatograms obtained for DF-
DS bran SCW hydrolysates at temperatures
of: (a) 120°C, (b) 140°C, (c) 160°C, (d) 180°C
and (e) 200°C. X4: 14.5 min, X3: 16.1 min,
X2: 18.0 min, xylose: 20.3 min, arabinose:
22.4 min.
X2 X3
X4
(a) (b)
(c) (d)
(e)
DP≥ 12
2 12 16 20 2 12 16 20 28
2 12 20 28
2 10 20 24 28
8 10 12 20 22 24 28
Time (min)
Time (min)
Time (min) Time (min)
Time (min)
Arabinose
Xylose
Glucose
Monosaccharides

93
Table 3.4 summarizes the contents and recovery of XOS such as xylobiose, xylotriose and
xylotetraose and liberated monosaccharides, including glucose, xylose and arabinose, which were
determined in the hydrolysates collected at 160, 180 and 200°C. Total recovery of XOS in the
liquid extracts at 180°C obtained at different times is shown in Fig. 3.13.
For all the extracts collected at 120°C, a large peak of the high-molecular weight fraction with
DP≥12 and glucose as monosaccharide were present (Fig. 3.12 a). Xylose, arabinose and XOS
were not detected at 120°C/50 bar. However, glucose was detected with contents of 2.83±0.19,
4.63±0.56 and 7.80±0.47 mg after 15, 30 and 60 min, respectively. Studies showed that glucose as
a free monosaccharide or coming from starch hydrolysis was obtained at relatively low
temperatures of 100-135°C (Benito-Roman et al., 2013). Also, at 160°C, free glucose was
quantified with contents of 8.94±1.4 and 11.04±1.15 mg in the extracts obtained at 15 and 30 min,
respectively. Generally, hydrolysis of cellulose is difficult at mild temperatures (<250°C) (Prado
et al., 2014). Therefore, glucose in the hydrolysates obtained at mild extraction conditions was
derived probably from the degradation of hemicelluloses, mainly beta-glucan (Cara et al., 2012).
A decrease in the amount of glucose was observed at 180 and 200°C, where trace amounts were
detected.

94
Tem
peratu
re, t: time, N
D: N
ot d
etected; X
2: x
ylo
bio
se, X3: x
ylo
triose, X
4: x
ylo
tetraose, T
otal X
OS
: X2+
X3+
X4. X
OS
Reco
very
(%): (m
ass of X
OS
/mass o
f initial x
ylan
) x 1
00.
Data are ex
pressed
as mean
± stan
dard
dev
iation o
f two rep
licates.
a-d
Differen
t letters in th
e same co
lum
n in
dicate sig
nifican
t differen
ces (p <
0.0
5).
kj
vcv
cxcx
xcc
20
0
20
0
18
0
18
0
18
0
16
0
T
(°C)
Pro
cessing
con
ditio
ns
Tab
le 3.4
. Reco
veries o
f XO
S an
d m
onosacch
arides in
the S
CW
hydro
lysates at 5
0 b
ar/5 m
L/m
in.
30
15
60
30
15
30
t
(min
)
Trace
Trace
11
.2±
1.5
b
40
.0±
1.3
a
8.0
±1.0
b
ND
X2
Xy
lo-o
ligo
sacch
arid
es
Co
nte
nt (m
g)
Trace
Trace
55
.4±
0.1
a
46
.1±
0.4
b
14
.9±
1.8
c
Trace
X3
Trace
Trace
46
.7±
1.4
a
26
.2±
1.0
b
7.7
±0.7
d
12
.5±
1.0
c
X4
Trace
Trace
11
3.4
±1
.0a
11
2.5
±2
.8a
30
.7±
3.6
b
12
.5±
1.9
c
Tota
l
XO
S
ND
ND
4.3
±0.5
b
15
.6±
0.5
a
3.1
±0.4
b
ND
X2
Xylo
-olig
osa
ccharid
es recovery
(%)
ND
ND
21
.5±
0a
17
.9 ±
0.1
b
5.8
±0.7
c
Trace
X3
ND
ND
18
.2±
0.5
a
10
.2±
0.4
b
3±
0.2
c
4.8
±0.3
d
X4
ND
ND
44
.2±
0.0
a
43
.8±
1.1
a
11
.9±
1.4
b
7.3
±0.7
c
Tota
l XO
S
ND
ND
ND
ND
ND
11
±1
.1
Glu
cose
Mo
nosa
cch
arid
es
Co
nte
nt (m
g)
12
.6±
0.1
a
11
.5±
0.5
ab
13
.3±
1.7
a
14
.9±
0.1
a
6.3
±0.7
b
ND
Xylo
se
ND
ND
23
.3±
2.0
a
26
.3±
2.9
a
24
.2±
1.1
a
13
.4±
2.8
b
Ara
bin
ose
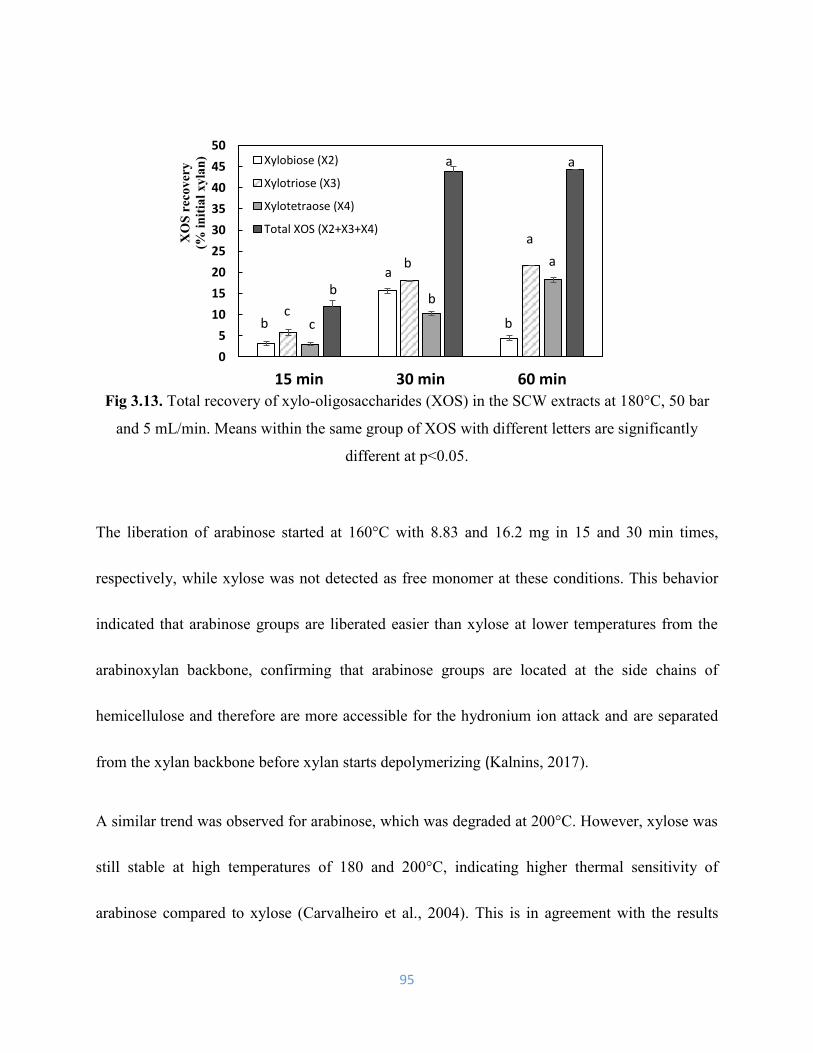
95
Fig 3.13. Total recovery of xylo-oligosaccharides (XOS) in the SCW extracts at 180°C, 50 bar
and 5 mL/min. Means within the same group of XOS with different letters are significantly
different at p<0.05.
The liberation of arabinose started at 160°C with 8.83 and 16.2 mg in 15 and 30 min times,
respectively, while xylose was not detected as free monomer at these conditions. This behavior
indicated that arabinose groups are liberated easier than xylose at lower temperatures from the
arabinoxylan backbone, confirming that arabinose groups are located at the side chains of
hemicellulose and therefore are more accessible for the hydronium ion attack and are separated
from the xylan backbone before xylan starts depolymerizing (Kalnins, 2017).
A similar trend was observed for arabinose, which was degraded at 200°C. However, xylose was
still stable at high temperatures of 180 and 200°C, indicating higher thermal sensitivity of
arabinose compared to xylose (Carvalheiro et al., 2004). This is in agreement with the results
0
5
10
15
20
25
30
35
40
45
50
15 min 30 min 60 min
XO
S r
eco
ver
y
(% i
nit
ial
xy
lan
) Xylobiose (X2)
Xylotriose (X3)
Xylotetraose (X4)
Total XOS (X2+X3+X4)
b b
b
b a
a
b
a
a
a
c c

96
obtained by Mayanga et al. (2018), who hydrolyzed brewer’s spent grains in a semi-continuous
SCW reactor. They reported an increase in the yield of xylose from 0.3 to 1.1 g/100g feed and
arabinose from 1.2 to 2.4 g/100g feed in the liquid extracts obtained at 140 and 180°C,
respectively. However, they observed the degradation of arabinose liberated by temperature rise
from 180 to 210°C with the yields of 3.1 to 2 g /100 g feed, which was more heat-sensitive
compared to xylose with the yields of 0.8 to 1.6 g /100 g feed. Carbohydrate-derived organic acids
such as lactic, formic, acetic, succinic and levulinic acids were detected as degradation products
at high temperatures of 210°C (Gallina et al., 2016; Pinkowska et al., 2011). Fig. 3.14 shows the
reaction pathways of glucose and fructose in subcritical water and conversion to lactic acid. In this
study, 46 and 70.32 mg of lactic acid with 5.96 and 10.83 mg of acetic acid were determined at
180°C/15 min and 200°C/15 min, respectively (Fig. 3.8).
Fig. 3.14. Reaction pathways for conversion of glucose and fructose to organic acids in
subcritical water media.
D-glucose D-fructose
gluceraldehyde pyruvaldehyde
Lactic acid
hydroxyacetone
glycol-aldehyde erythrose Formic acid acetic acid

97
In the liquid extracts collected at 120 and 140°C xylan started to solubilize in the liquid fraction
due to the presence of xylose after post hydrolysis with sulfuric acid (Fig. 3.10 b), while xylose
and XOS were not detected, indicating that solubilized xylan had high molecular weight and
temperature was still not sufficient to hydrolyze the dissolved xylan to smaller oligomers. When
the temperature increased to 160°C, the area of a large peak related to the compounds with DP≥12
raised and formation of XOS started (Fig. 3.12 c). For the liquid extracts collected at 160°C/15min,
XOS was not detected as probably the residence time was not enough to hydrolyze and convert
the feed to smaller oligomers. However, the presence of reducing sugars at 2.63% (Fig. 3.9) at this
condition (160°C/15min) could be because of the liberation of monosaccharides including glucose
with 8.94 mg and arabinose with 8.83 mg. Trace amounts of xylotriose (X3) and 12.5 mg of
xylotetraose (X4) were detected with an increase in the residence time in the extracts obtained at
160°C/30 min.
According to Table. 3.4, a large content of XOS was found in the hydrolysates obtained at 180°C,
where the area of the large peak (DP≥12) reduced, indicating the cleavage of large fraction or
arabinoxylan hydrolysis and production of xylobiose, xylotriose, xylotetraose and xylose. For the
liquid extracts collected at 180°C/15 min, 8.05±1.09, 14.93±1.83, 7.79±0.72 and 30.78±3.65 mg
of X2, X3, X4 and total XOS were obtained, corresponding to 3.14, 5.81, 3.03 and 11.99% initial
xylan recovery.

98
By increasing the residence time to 30 min, the recovery of X2, X3, X4 and total XOS improved
significantly to 15.61, 17.99, 10.23 and 43.85% initial xylan, respectively, which indicated the
increase in the rate of hydrolysis and formation of high contents of XOS due to an increase in the
solvent-to-feed ratio, leading to hydrolysis of polysaccharides. Moreover, the molecular weight of
hemicellulose obtained reduced as a function of time in the SCW media due to more deacetylation
(Yedro et al., 2017).
A similar trend was observed for reducing sugars (Fig. 3.9). However, a further increase in
residence time to 60 min did not have an effect to improve the content of total XOS, but increased
the contents of X4 and X3 with a reduction in the content of X2. Studies showed that using a semi-
continuous SCW hydrolysis of walnut and cherry, fractions with very low molecular mass were
produced at the beginning of the process (first 20 min) due to the liberation of acetic acid from
acetylated hemicellulose, which helped the hydrolysis and formation of shorter oligomers. Later
within 20-60 min, temperature effect led to the breaking of non-acetylated hemicelluloses and the
production of longer oligomers (Gallina et al., 2018).
After increasing the temperature up to 200°C, the peak for high molecular weight compounds
disappeared and XOS was not detected (Fig 3.12 e). However, large amounts of organic acids such
as lactic acid and acetic acid were determined, which indicates the degradation of sugars at this
condition (Fig 3.8).

99
Chen et al. (2017) reported the production of oligosaccharides in SCW media from wheat straw
with 41.23% cellulose, 27.70% hemicellulose and 17.99% lignin, using a 100 mL batch reactor
with 5.0 g of dewaxed straw and 50 mL of water (solvent-to-feed ratio: 10 mL/g) at 120, 140, 160,
180 and 200°C for 0.5 h. They reported a similar composition of the liquid extracts with xylobiose,
xylotriose, xylotetraose and xylopentaose as the main XOS produced and liberated monomers,
including arabinose, xylose and glucose. In that study, XOS production started at 120°C with 0.25
g/kg raw material for X2-X6 and further increased up to 180°C, where a maximum total XOS of
61.69 g/kg was obtained, composed of xylobiose (5.37 g/kg), xylotriose (4.25 g/kg), xylotetraose
(2.27 g/kg), xylopentaose (1.55 g/kg), xylohexaose (0.15 g/kg), and XOS with DP > 6 (48.10 g/kg).
Then, similar to this study, they reported the degradation of XOS with DP˃6 at 200°C. They also
observed a similar upward trend for the liberation of arabinose up to 180°C, and then a significant
reduction at 200°C. Similar to this study, they detected acetic, lactic and formic acids as
degradation products with the highest total amount at 200°C with 39.41, 12.20 and 14.76 g/kg,
respectively. XOS formation from 2 g destarched barley bran at 180°C/30 min in this study with
the yields of 20, 23 and 13 mg/kg for X2, X3 and X4, respectively, were higher than those obtained
by Chen et al. (2017), probably due to the higher solvent-to-feed ratio (75 mL/g), or lower feed
lignin content (7.17%) of the barley bran used in this study.
The XOS recovery values from different raw materials using hydrothermal treatments are
summarized in Table 3.5. XOS recovery obtained in this study was higher or lower compared to

100
the different studies in the literature; however, comparisons should be performed with care
considering the differences in the hydrolysis system and oligosaccharides definitions. For example,
in this study XOS recovery was calculated based on the mass of oligosaccharides with DP 2-5,
which have been shown to have the highest prebiotic effect (Okazaki et al., 1990; Moura et al.,
2008). These results indicate that temperatures above 160°C are needed to hydrolyze the xylan
polymer to form lower molecular weight XOS.

101
Table 3.5: Xylo-oligosaccharides recovery from selected literature raw materials and
corresponding extraction conditions.
Biomass T
(°C)
t
(min)
P
(bar)
Solvent
/solid
(mL/g)
System XOS
(DP)
XOS
(recovery)
(%)
Reference
Corn cob X:29.5%
A:3.3%
L:18.7%
G:38.5%
190
15
NR
8
Autohydrolysis
ND
58
Nabarlatz et al.
(2004)
Corn cob G:29.7%
X:29.9%
A:3.4%
L: 12.7%
200
10.7
30
7
Continuous
SCW
2-10 57.8
Makishima et al.
(2009) >11 23.7
Total 82.2
Wheat
straw G:37.4%
X:29.4%
A:1.9%
L: 23.6%
180
30
NR
10
Autohydrolysis
DF
44
Ruiz et al. (2011)
Wheat
straw G:31.5%
X:19.8%
A:2.8%
L: 5.9%
179
23
NR
16
Autohydrolysis
ND
43
Nabarlatz et al.
(2007) Barley
straw G:30.8%
X:19.8%
A:3%
L: 16.7%
16
43
Corn stover G:37.8%
X:21.3%
A:1.6%
L: 17.8%
200
10
NR
20 Batch SCW
1-30
>30
28.1
10
Yang and Wyman
(2008)
10 Semi
continuous
SCW
1-30
>30
20.3
27.9
125 Semi
continuous
SCW
1-30
>30
9.1
64.2
Oat spelt
xylan
X:78.9%
20 Batch SCW
1-30
>30
30.1
43
10 Semi
continuous
SCW
1-30
>30
0.3
91.8
125 Semi
continuous
SCW
1-30
>30
0.4
90.8

102
Table 3.5. Continued.
Biomass T
(°C)
T
(min)
P
(bar)
Solvent
/solid
(mL/g)
System XOS
(DP)
XOS
(recovery)
(%)
Reference
Wheat bran
G:31.7%
X+ A: 18.4% 200 NR NR 10 Autohydrolysis DF 70
Rose and Inglett
(2010)
Sugarcane
bagasse 200 10 NR 10
Autohydrolysis
2-5 50.4 Zhang et al. (2018)
Wheat
straw
180 NR 10 NR Autohydrolysis
DF
50
Rodriguez et al.
(2019)
Corn stover 70
DF-DS bran 180 30 50 75
Semi
continuous
SCW
2-4 43.8 This study
Deproteiniz
ed bran 180 30 50 75
Semi
continuous
SCW
2-4 78.4 This study
T: Temperature; t: Time; P: Pressure; G: glucan; X: xylan; A: arabinan; L: lignin.
ND: Not detected, NR: Not reported.
DF: Calculated based on the difference between monomers concentration after acid hydrolysis refers
to DP two or higher, XOS Recovery (%): (mass of XOS/mass of initial xylan) x 100.

103
3.3.4. Removal of protein from defatted–destarched bran
Alkaline treatment of lignocellulosic materials and agricultural by-products is an efficient method
for the removal of protein and hemicellulose (Sun et al., 1995; Wang et al., 2010). Uronic and ester
groups are hydrolyzed under alkali conditions, leading to solubilization of hemicellulose in the
liquid medium. Also, cellulose swells with a decrease in its crystallinity, which helps better
extraction of hemicellulose (Sun and Cheng, 2002). Alkali treatment also leads to the separation
of structural linkages between lignin and carbohydrates with disruption of the lignin structure
(Carvalheiro et al., 2008). Protein, which is also associated closely with the hemicellulose via
covalent bonds, can be solubilized with alkali and further precipitated at isoelectric pH and
removed from the mixture (Zhu et al., 2010). The alkaline extraction (NaOH, 3 N) resulted in a
deproteinized and arabinoxylan-rich fraction with a yellow-white color (Fig. 3.15).
Fig. 3.15. Dried deproteinized fraction obtained after protein removal.

104
Fig. 3.16. Structural carbohydrates of defatted, defatted-destarched and deproteinized bran.
Means within the same group of structural carbohydrates with different letters are significantly
different at p<0.05.
The concentration of structural carbohydrates of DF, DF-DS and DP bran is provided in Fig. 3.16.
Arabinan, xylan and arabinoxylan concentrations increased in the isolated deproteinized fraction
in comparison with DF and DF-DS bran. Arabinoxylan was recovered (86.42% of the initial
amount in DF-DS bran) in the final dried deproteinized bran with 42.24±1.61% (db). However,
lignin and protein reduced to 1.9±0.37 and 4.62±0.59% (db), respectively. The deproteinized
fraction had a high percentage of glucose (16.35%, db), which might be due to the linkage of
glucose to arabinoxylan already reported in the literature (Verbruggen et al., 1995).
Qiu et al. (2017) extracted hemicellulose from defatted and destarched sorghum bran using
alkaline solution (NaOH 50% w/v) at 85°C and precipitated the major arabinoxylan fraction using
two volumes of ethanol with further separation using vacuum filtration. They reported the presence
0
10
20
30
40
50
Co
mp
osi
tio
n %
(dry
ba
sis)
Structural carbohydrates
Defatted bran
Defatted-Destarched bran
Deproteinized bran
a
b c
b
b
a a b
a a
b
a
b
c
a a
b
c

105
of xylose, arabinose and glucose as the main monomeric sugars with concentrations of 41.52,
35.08 and 7.07 relative mole%, respectively. Kiran et al. (2013) also investigated the alkali
extraction of the xylan rich fraction from cotton stalk, sunflower stalk, corn cob, wheat straw and
rice hull. They reported a highly branched structure in the composition of rice hull hemicellulose
with different types of sugar moieties, including 67, 14 and 8.7% xylose, arabinose and glucose in
the xylan fraction obtained.
According to Ebringerova et al. (2005), hemicellulose in rice hull has a complex
glucuronoarabinoxylan structure. The recovery of xylan varies in different lignocellulosic
materials and depends on the presence and amount of lignin, hydrogen bonds, cellulose content,
alkali type and its concentration (Donor and Hicks, 1997). Japayal et al. (2013) recovered around
85% of initial xylan from sugarcane bagasse using an alkali treatment with 12% sodium hydroxide.
They mentioned that high xylan recovery could be related to the low content of lignin (6.04 ±
0.06%) in their raw material.
In this study, lignin content was reduced significantly (76%) in the deproteinized fraction due to
the alkaline treatment. Decrease of lignin content and the increase of surface area were reported
by Kim et al. (2003) from corn stover, Sun et al. (1995) from wheat straw and Kang et al. (2012)
from rapeseed straw due to the cleavage of alpha-ether linkages between hemicellulose and lignin
(Spencer and Akin, 1980).

106
Studies showed that lignin removal can improve the efficiency of the xylanase enzyme for the
hydrolysis of xylan. Selig et al. (2009) reported a dramatic increase in the xylan conversion to
xylose from 5% to almost 50% using xylanase treatment for 72 h in corn stover, when lignin
content was reduced from 15.8 to 5.4% (db) by alkaline treatment.
The effect of lignin content on hemicellulose recovery using hydrothermal treatment was also
investigated in the literature. Gallina et al. (2018) observed that hemicellulose extraction from
different raw materials by a semi-continuous SCW at 160°C with a pressure of 9 bar and a flow
rate of 150 L/h, depends on the structural composition and lignin content of the feed material. They
reported that 40% hemicellulose was recovered with from eucalyptus that had 25% lignin. On the
other hand, maple, cedar and plane wood with over 38% lignin showed low hemicellulose
recoveries of 9.7, 10.9 and 18.8%, respectively. This hindering effect of lignin on hydrothermal
hemicellulose extraction was also reported by Yedro et al. (2015). Lignin contains phenylpropane
units strongly attached to hemicellulose and cellulose that holds them together (Maurya et al.,
2015). It is hydrophobic, resistant to water penetration and enzymatic degradation, thus protecting
the cellulose and hemicellulose (Mokhothu and John, 2015). Therefore, lignin diminishes the
accessibility to hemicellulose for hydrolysis by xylanase. Also, its content negatively affects the
hemicellulose extraction, leading to low recovery of xylan during hydrothermal treatment.

107
Mass balance
Two batches of defatted-destarched bran were produced from DF bran (Fig. 3.17) and two batches
of deproteinized bran were produced from DF-DS bran (Fig. 3.18). The following formulas were
used to calculate the extraction yield, arabinoxylan and total sugar recovery of destarched bran and
deproteinized bran and the results are provided in Tables 3.6 and 3.7.
𝐸𝑥𝑡𝑟𝑎𝑐𝑡𝑖𝑜𝑛 𝑦𝑖𝑒𝑙𝑑 (%) = [𝐷𝑟𝑦 𝑤𝑒𝑖𝑔ℎ𝑡 𝑜𝑓 𝑑𝑒𝑠𝑡𝑎𝑟𝑐ℎ𝑒𝑑 𝑏𝑟𝑎𝑛 (𝑔)
𝐷𝑟𝑦 𝑤𝑒𝑖𝑔ℎ𝑡 𝑜𝑓 𝑑𝑒𝑓𝑎𝑡𝑡𝑒𝑑 𝑏𝑟𝑎𝑛 (𝑔)] (3.15)
𝐴𝑟𝑎𝑏𝑖𝑛𝑜𝑥𝑦𝑙𝑎𝑛 𝑟𝑒𝑐𝑜𝑣𝑒𝑟𝑦 (%) = [𝑊𝑒𝑖𝑔ℎ𝑡 𝑜𝑓 𝑎𝑟𝑎𝑏𝑖𝑛𝑜𝑠𝑒 𝑎𝑛𝑑 𝑥𝑦𝑙𝑜𝑠𝑒 (𝑑𝑏) 𝑖𝑛 𝑑𝑒𝑠𝑡𝑎𝑟𝑐ℎ𝑒𝑑 𝑏𝑟𝑎𝑛 (𝑔)
𝑤𝑒𝑖𝑔ℎ𝑡 𝑜𝑓 𝑎𝑟𝑎𝑏𝑖𝑛𝑜𝑠𝑒 𝑎𝑛𝑑 𝑥𝑦𝑙𝑜𝑠𝑒 (𝑑𝑏) 𝑖𝑛 𝑑𝑒𝑓𝑎𝑡𝑡𝑒𝑑 𝑏𝑟𝑎𝑛 (𝑔)] (3.16)
𝑇𝑜𝑡𝑎𝑙 𝑠𝑢𝑔𝑎𝑟 𝑟𝑒𝑐𝑜𝑣𝑒𝑟𝑦 (%) = [
𝑊𝑒𝑖𝑔ℎ𝑡 𝑜𝑓 𝑡𝑜𝑡𝑎𝑙 𝑚𝑜𝑛𝑜𝑠𝑎𝑐𝑐ℎ𝑎𝑟𝑖𝑑𝑒𝑠 (𝑎𝑟𝑎𝑏𝑖𝑛𝑜𝑠𝑒, 𝑥𝑦𝑙𝑜𝑠𝑒, 𝑔𝑙𝑢𝑐𝑜𝑠𝑒 𝑎𝑛𝑑 𝑔𝑎𝑙𝑎𝑐𝑡𝑜𝑠𝑒)
𝑖𝑛 𝑑𝑒𝑠𝑡𝑎𝑟𝑐ℎ𝑒𝑑 𝑏𝑟𝑎𝑛(𝑑𝑏) (𝑔)
𝑊𝑒𝑖𝑔ℎ𝑡 𝑜𝑓 𝑡𝑜𝑡𝑎𝑙 𝑚𝑜𝑛𝑜𝑠𝑎𝑐𝑐ℎ𝑎𝑟𝑖𝑑𝑒𝑠 (𝑑𝑏) 𝑖𝑛 𝑑𝑒𝑓𝑎𝑡𝑡𝑒𝑑 𝑏𝑟𝑎𝑛(𝑔)] (3.17)
Dried destarched brans with masses of 50.34 and 49.05 g were obtained from 80.96 and 80.56g of
defatted bran in batches 1 and 2, corresponding to 62.38 and 61.08% yield, respectively. An
average of total sugar recovery was around 60.22%. However, more arabinoxylan was recovered
(90.69%) after starch enzymatic digestion by alpha-amylase during 40 min at 98-100°C followed
by amyloglucosidase treatment for 30 min at 60°C. Lower extraction recovery of total sugar
compared with arabinoxylan was due to the starch hydrolysis and removal of glucose (Table 3.6).

108
Dried deproteinized bran with masses of 11.33 and 10.87 g were obtained from 20.12 and 20.07g
of DF-DS bran using sodium hydroxide (3 N) for 6 h at 60°C in batches 1 and 2 corresponding to
56.27 and 54.12% yield, respectively. High amounts of arabinoxylan (86.42%) and total sugars
(72.72%) were recovered after protein removal (Table 3.7).
Fig. 3.17. Overview of the structural carbohydrates of defatted-destarched bran.
Table 3.6. Extraction yield and sugars recovery of defatted-destarched bran.
Batch number Extraction yield
(%)
Arabinoxylan recovery
(%)
Total sugars recovery
(%)
1 62.38 94.23 ± 2.89 62.61± 0.22
2 61.08 87.37 ± 0.94 57.83 ± 0.83
Batch number
Structural carbohydrates composition of dried destarched bran
(%db)
Xylose Arabinose Glucose Galactose
1 13.02 ± 0.44 13.96 ± 0.38 19.81± 0.93 3.76 ± 0.08
2 12.64 ± 0.20 12.97 ± 0.35 18.53 ± 0.27 3.54 ± 0.13
BATCH 1
50.34 g
Dried destarched bran by enzymatic hydrolysis
80.96 g
Defatted bran
BATCH 2
49.05 g
Dried destarched bran by enzymatic hydrolysis
80.56 g
Defatted bran
Barley bran
Defatted bran by SC-CO2

109
Fig. 3.18. Overview of the structural carbohydrates of deproteinized bran
Table 3.7. Extraction yield and sugars recovery of deproteinized bran.
Batch
number
Extraction yield
(%)
Arabinoxylan recovery
(%)
Total sugars
recovery
(%)
1 56.27 90.44 ± 1.71 76.40 ± 1.82
2 54.12 82.41 ± 2.20 69.04 ± 0.78
Batch number
Structural carbohydrates composition of dried deproteinized bran
(%db)
Xylose Arabinose Glucose Galactose
1 21.28 ± 0.5 22.10 ± 0.45 17.19 ± 0.52 8.08 ± 0.19
2 19.00 ± 1.13 20.15 ± 0.12 15.52 ± 1.19 7.89 ± 0.04
BATCH 2
20.07 g
Defatted-destarched bran
10.87 g
Dried deproteinized bran by NaOH
treatment
BATCH 1
20.12 g
Defatted-destarched bran
11.33 g
Dried deproteinized bran by NaOH
treatment
Barley bran
Defatted bran by SC-CO2
Destarched bran by enzymatic hydrolysis
110
3.3.5. Characterization of enzymatic hydrolysates
3.3.5.1. Reducing sugar
Fig. 3.19 shows reducing sugars production from deproteinized bran with xylanase using two
enzyme concentrations of 2.5 and 10 U and four reaction times (1, 4, 8 and 16 h). The yield of
reducing sugars in the control sample, which is defined as 22 mg/mL deproteinized bran dispersion
(10 mg/mL or 1% w/v arabinoxylan solution) without enzyme was determined as 0.24±0.04%. As
observed from the hydrolysis with xylanase (2.5 U), the hydrolysis rate of xylan was fast up to 1
h period, where reducing sugar yield increased significantly to 4.78±0.23%, indicating the
production of smaller compounds, which had more reducing ends. Then, the yield of reducing
sugars increased to 5.82±0.19% after 4 h incubation and stopped increasing after this period,
reaching a plateau. This reduction in hydrolysis rate was probably due to the diminishing of
accessible hydrolysis sites in the xylan chain or decrease of endo xylanase activity because of the
end product inhibitory effect (Akpinar et al., 2009).
Using 10 U of xylanase, reducing sugars yield was determined as 4.99±0.07, 6.61±0.03, 6.58±0.05
and 6.66±0.00% after 1, 4, 8 and 16 h incubation, respectively. Increasing the concentration of
enzyme to 10 U improved the yield of reducing sugars after 4, 8 and 16 h. The same behavior was
observed after 4 h incubation and no significant change was detected up to 16 h (Fig. 3.19).

111
A similar pattern was reported by Akpinar et al. (2009), who studied the hydrolysis of xylan from
wheat straw using xylanase from A. niger. They incubated 10 mL of 2% xylan solution in citrate
buffer pH 4.6 at 40°C for 48 h with 1 U of enzyme and observed a sharp increase in the
concentration of reducing sugars up to 8 h (23 mM) and no significant change was reported after
this period.
Fig. 3.19. Yield of reducing sugars for enzymatic hydrolysates.
3.3.5.2. Xylo-oligosaccharides (XOS) content by HPLC
Xylo-oligosaccharides with different degrees of polymerization (DP) were determined using
HPLC for all the enzymatic hydrolysates obtained with 2.5 and 10 U concentrations of xylanase.
Xylobiose (X2) and xylotriose (X3) were the most abundant XOS with a trace amount of
xylohexaose (X6) produced by enzymatic incubation and their contents plus recoveries are shown
in Table 3.8.
0
1
2
3
4
5
6
7
8
0 4 8 12 16
Red
uci
ng
su
ga
rs
( g
xy
lose
eq
uiv
ale
nt
/g b
ran
%)
Time (h)
10 U
2.5 UControl

112
XO
S R
ecovery
(%): (m
ass of X
OS
/mass o
f initial x
ylan
) x 1
00.
10
2.5
2.5
En
zym
e
con
centra
tion
(U)
Hy
dro
lysis co
nd
ition
s
Tab
le 3.8
. Reco
veries o
f XO
S o
btain
ed after en
zym
atic hydro
lysis.
Tab
le. 3.8
. Reco
very
of X
OS
after enzy
matic h
yd
roly
sis.
16
8
4
1
16
8
4
1
Tim
e
(h)
15
.13
±0
.35
a
13
.44
±0
.2b
13
.14
±0
.7b
8.1
6±
0.2
8c
1.1
0±
0.0
4A
1±
0.0
6A
0.5
7±
0.1
0B
0.1
4±
0.0
5C
Xy
lob
iose
(X2
)
XO
S co
nten
t
(mg)
3.1
2±
0.2
5c
5.7
5±
0.2
5b
7.4
±0
.68
a
5.9
1±
0.3
6ab
1.1
3±
0.1
2A
0.8
0±
0.1
6A
B
1.0
8±
0.1
2A
0.4
3±
0.0
7B
Xy
lotrio
se
(X3
)
0.6
3±
0.0
0ab
0.4
5±
0.0
8b
c
0.5
6±
0.0
6ab
0.6
7±
0.0
3a
0.2
1±
0.0
1B
0.2
6±
0.0
0A
B
0.3
7±
0.0
3A
0.2
3±
0.0
5B
Xy
loh
exa
ose
(X6
)
18.8
8±
0.6
2b
19.6
5±
0.4
5b
21.1
1±
0.0
8a
14.7
4±
0.1
1c
2.4
5±
0.1
5A
2.0
7±
0.2
3A
2.0
3±
0.1
9A
0.8
1±
0.0
6B
To
tal X
OS
(X2
+X
3+
X6
)
32.3
3±
0.7
6a
28.7
2±
0.4
3b
28.0
9±
1.5
1b
17.4
3±
0.6
c
2.3
5±
0.0
9A
2.1
5±
0.1
3A
1.2
2±
0.2
1B
0.3
5±
0.1
C
Xy
lob
iose
(X2
)
XO
S reco
very
(%)
6.6
6±
0.5
5c
12.3
±1.5
9b
15.8
1±
1.4
6a
12.6
3±
0.7
7ab
2.4
2±
0.2
6A
1.7
1±
0.3
4A
B
2.3
1±
0.2
7A
0.9
3±
0.1
5B
Xy
lotrio
se
(X3
)
1.3
4±
0.0
1ab
0.9
6±
0.1
8bc
1.2
0±
0.1
3ab
1.4
4±
0.0
7a
0.4
6±
0.0
2B
0.5
5±
0.0
1A
B
0.8
±0.0
7A
0.5
±0.1
2B
Xy
loh
exa
ose
(X6
)
40.3
6±
1.3
3b
41.9
9±
0.9
7b
45
.11
±0
.18
a
31
.51
±0
.24
c
5.2
5±
0.3
3A
4.4
2±
0.5
A
4.3
5±
0.4
1A
1.7
3±
0.1
3B
To
tal X
OS
(X2
+X
3+
X6
)

113
Figs. 3.20 a,b also illustrate the XOS recovery from initial xylan using 10 and 2.5 U of xylanase,
respectively. Using 2.5 and 10 U of xylanase, the content of total XOS increased significantly from
1 h to 4 h, from 0.81 to 2.03 and from 14.74 to 21.11 mg, respectively. There was no change after
this period, similar to the behavior with reducing sugars yield (Fig. 3.19). Xylobiose (X2) and
xylotriose (X3) had higher concentrations compared with xylohexaose (X6) (Faryar et al., 2015;
Flack et al., 2014; Akpinar et al., 2009).
Xylobiose content showed a significant increase by incubation time at 1, 4 and 8 h with 0.14, 0.57
and 1 mg, corresponding to 0.3, 1.2 and 2.15% recovery with no significant change after 16 h (2.5
U). Xylotriose had a similar concentration behavior with an increase from 0.43 to 1.08 mg at 1 and
4 h incubation and no statistical difference after this period. However, using a higher concentration
of enzyme (10 U), xylobiose content increased progressively from 8.16 to 13.14, 13.44 and 15.13
mg after 1, 4, 8 and 16 h, which corresponded to 17.43, 28.09, 28.72 and 32.34% recovery,
respectively. Xylotriose was determined as 5.91 mg after 1 h incubation and did not show any
significant change after 4 h, while it reduced to 5.75 and 3.12 mg after 8 and 16 h incubation,
respectively. The reduction of xylotriose after 16 h could be related to the further conversion of
this compound to xylobiose by longer incubation time (8-16 h). Therefore, by increasing the
enzyme concentration (10 U), after 16 h incubation, more xylobiose was obtained as a result of
further xylotriose hydrolysis.

114
The DP of the XOS produced depends on the enzyme variety, since some endo-xylanases produced
xylose and xylobiose from xylan, while some other types liberated mostly XOS with higher DP.
For example, the xylanase from Streptomyces, with an optimal temperature of 60°C and pH of 6
attacked on xylan backbone and produced X4 and X3, followed by conversion to X2 and xylose.
However, the Trichoderma xylanase provided a mixture of X2-X5 but no xylose was produced
(Reilly, 1981).
Structure of the extracted xylan plays an important role in the production of XOS with different
DP and might influence the level of enzymatic hydrolysis, the yield of reducing sugars and XOS
produced (Kiran et al., 2013). Faryar et al. (2015) produced XOS from alkali extracted wheat straw
using K80R variant of endo-xylanase with 1% (w/v) xylan solution and 0.48 U of enzyme. They
reported the production of xylobiose and xylotriose as the most abundant XOS liberated as a result
of incubation at 50, 55 and 60°C. They observed a progressive increase of xylobiose yield up to
15 h (25%), while xylotriose increased until 3 h with further lowering up to the end of the process.
In that study, 60°C was the optimal temperature to produce the highest amount of total XOS with
a yield of 35% (initial xylan), which was lower than the highest XOS recovery in this study
(45.11±0.18%) (Fig. 3.20). This difference might be due to the usage of a lower concentration of
enzyme (0.48 U) and different type of xylanase. Akpinar et al. (2009) investigated the XOS
production from extracted xylan obtained from tobacco stalk, sunflower stalk, cotton stalk and
wheat straw using two different types of endo-xylanase from Aspergillus niger and Trichoderma

115
longibrachiatum. They performed the hydrolysis of alkali extracted xylan by mixing 1 U of each
enzyme with 10 mL of 2% xylan at 40°C with A. niger and at 50°C with T. longibrachiatum (1 U,
40°C). They found that xylobiose and xylotriose were the most predominant XOS produced by
these two types of enzymes. However, the enzyme from A. niger produced more X2 and X3
compared to the enzyme from T. longibrachiatum, which produced more xylose. The hydrolysate
obtained from enzymatic hydrolysis of wheat straw xylan, with 79.9% xylose and 10.8%
arabinose, had 0.786 and 0.719 mg/mL X2 and X3, respectively. In this study, 0.74 and 1.51
mg/mL were the maximum amounts for X3 and X2, respectively. The higher content of xylobiose
might be due to the usage of enzyme at high concentration (10 U). Akpinar et al. (2009) obtained
more X2 and X3 from tobacco stalk, sunflower stalk, cotton stalk xylan than wheat straw xylan.
Because wheat straw xylan had a more branched arabinoxylan structure with a higher amount of
arabinose chain. Branched arabinoxylan was not accessible for hydrolysis by xylanase from A.
niger and less X2 and X3 were produced.

116
Fig. 3.20. Recovery of xylo-oligosaccharides (XOS) after enzymatic hydrolysis using: (a) 10 U
xylanase and (b) 2.5 U xylanase. Means within the same group of XOS with different letters are
significantly different at p<0.05.
0
5
10
15
20
25
30
35
40
45
50
1 4 8 16
XO
S r
eco
ver
y
(%in
itia
l x
yla
n)
Time (h)
Xylobiose (X2)Xylotriose (X3)Xylohexaose (X6)Total XOS (X2+X3+X6)
0
1
2
3
4
5
6
1 4 8 16
XO
S r
eco
ver
y
(% i
nit
ial
xy
lan
)
Time (h)
Xylobiose (X2)
Xylotriose (X3)
Xylohexaose (X6)
Total XOS (X2+X3+X6)
(a)
c
b
a
b
b b
b
c
c a
ab
a ab bc ab
a
(b)
c
b
a a a a
a ab b
ab
b
b
b
a a
a

117
3.3.6. Characterization of subcritical water hydrolysates from deproteinized bran
3.3.6.1. Reducing sugar
Reducing sugar was determined in the SCW hydrolysates collected at 180°C/30 min/50 bar/5
mL/min. This hydrolysis was performed to compare the processes of subcritical water versus
enzymatic hydrolysis for the same deproteinized samples for the production of XOS.
Deproteinized bran from batch 1 with 21.28 and 22.10% (db) xylose and arabinose, respectively,
were selected for hydrolysis with SCW. This fraction was also used for the enzymatic hydrolysis.
The yield of reducing sugars was determined as 22.19±1.66% deproteinized bran, which was
significantly higher than the yield of enzymatic hydrolysis (6.61±0.03% deproteinized bran)
showing more depolymerization of deproteinized bran with SCW.
3.3.6.2. Xylo-oligosaccharides (XOS) content by HPLC
Fig. 3.21 a,b show the chromatograms obtained from deproteinized bran hydrolyzed by SCW
(180°C, 50 bar and 30 min) and xylanase enzyme (10 U, 40°C and 4 h). The X4, X3 and X2
contents were determined in SCW hydrolysate of deproteinized bran, together with other
oligosaccharides in the hydrolysate. The SCW produced XOS with a wide range of DP composed
of DP ˃ 6; DP = 2-6 and DP ˂ 2. A peak with a retention time of 13.4 min might correspond to X5
which was not identified. Enzymatic hydrolysis led to the production of X2, X3, X5 and X6, while
X4 was not detected in any of the samples. Maximum xylotriose obtained by enzymatic hydrolysis
118
was determined as 7.4±0.68 mg (15.81% recovery), while SCW hydrolysate at 180/50 bar/30 min
had 16 times xylotriose (120.6±9.9 mg with 28.3% recovery). Also, total XOS recovery was higher
in the SCW hydrolysates with 78.45% compared to the enzymatic hydrolysis, which was only
45.11% (Fig. 3.22). Moreover, the enzymatic process was more time-consuming (4 h) than the
SCW process (30 min) to obtain the maximum amount of total XOS from the same initial
deproteinized bran. Xylanase activity depends on the nature of the substrate including side chain
molecules and length, the degree of branching, and the presence of substituents (Reilly, 1981; Li
et al., 2000). Arabinose and acetyl side groups can interfere with the endo-xylanase function and
eliminates its cleaving ability leading to less production of oligomers (Akpinar et al., 2009; Polizeli
et al., 2005).
Obtaining lower amounts of XOS and resulting reducing sugars after longer time enzymatic
hydrolysis (4 h) compared to the fast SCW hydrolysis (30 min) is probably due to the complex and
heterogeneous structure of the xylan extracted from DF-DS bran, which had arabinose groups
(22.10% db) located as side chains attached to the xylan backbone. However, SCW hydrolysis was
able to separate arabinose groups in the form of monomers from deproteinized bran (102.8±6.55
mg) in the liquid hydrolysate at 180°C/50 bar/30 min. Reduction of accessible hydrolysis sites in
the xylan chain or decrease of endo-xylanase activity because of the end product inhibitory effect
after

119
specific time (4 h in this study) could be another factor that had a negative influence on the
production of XOS by xylanase treatment (Akpinar et al., 2009).
Fig. 3.21. Chromatograms obtained from deproteinized bran hydrolysis by: (a) SCW (180°C/50
bar/30 min) and (b) xylanase enzyme (10 U/4 h).
X6 X4 X3 X2
Xylose Arabinose
X6 X3 X2 Xylose
(a)
(b)
4 8 10 24 26 28 30
4 8 10 22 24 26 28 30

120
Fig. 3.22. Recovery of xylo-oligosaccharides (XOS) in the SCW and enzymatic hydrolysates
from deproteinized bran. Means within the same group of XOS with different letters are
significantly different at p<0.05.
Rose et al. (2010) investigated the hydrothermal treatment of wheat bran using autohydrolysis in
a batch reactor at a temperature range of 170 to 220°C. They obtained arabino-
xylooligosaccharides (AXOS) with the highest recovery around 70% (initial xylan%), composed
of different compounds with DP ˂ 3 (31.6%), DP = 3-10 (26%) and DP ˃ 10 (42.4%). The recovery
of wheat bran oligosaccharides using autohydrolysis was also higher than the recovery of AXOS
released after enzymatic treatment with xylanase.
Mathew et al. (2018) used wheat bran xylan extracted after removal of starch and protein with
alpha-amylase and protease treatment, respectively, for the production of XOS with xylanase
(pentopan) with a ratio of 0.18 U/g bran at 50°C and pH 6. They reported the production of X2
0
10
20
30
40
50
60
70
80
90
SCW Enzymatic hydrolysis
XO
S r
eco
very
(% i
nit
ial
xy
lan
)
Xylobiose (X2)
Xylotriose (X3)
Xylotetraose (X4)
Total XOS (X4+X3+X2)
a a a
b
b
a

121
and X3 as major XOS with a maximum amount of total XOS obtained after 28 h (22.8% w/w
recovery of the total initial xylan).
Jacobsen and Wyman (2002) studied hydrothermal hydrolysis of sugarcane bagasse using batch
reactors with a mixture of water and bagasse with different final solid contents of 0.5, 1.0, 3.0, 7.0,
and 10.0 wt % at 200°C for 20 min. They recovered the maximum XOS yield between 70 and 75%
within 10 min hydrolysis. Brienzo et al. (2010) used sugarcane bagasse xylan extracted from
dewaxed sugarcane bagasse by alkaline hydrogen peroxide and further precipitated with ethanol.
They used 2% xylan solution with 60 U/g of xylanase from Thermoascus aurantiacus for 3, 6, 12,
24, 48, 72, and 96 h of hydrolysis. Xylobiose was the major XOS produced with the maximum
recovery of 38.48±0.99% after 96 h, while xylotriose and xylopentaose were found in trace
amounts. These studies also confirmed that enzymatic hydrolysis led to a lower yield of XOS
obtained for a longer time compared to the SCW treatment.
In terms of the other types of oligosaccharides produced using SCW and enzymatic hydrolysis,
manno-oligosaccharides (MOS) were obtained from coconut meal. Khuwijitjaru et al. (2014)
produced MOS from coconut meal by SCW treatment using a batch-type vessel at temperatures in
the range of 100–300°C, solvent-to-feed ratio of 10 mL/g, for 15 min. The maximum
oligosaccharides were obtained at 250°C after 14 min treatment (MOS with DP of 2–6, 72% of
total carbohydrates) and a small amount of oligosaccharides with DP>6 (8% of total

122
carbohydrates). However, in another study by Kanatani et al. (2012), who used beta-1,4-
mannanase enzyme for the production of MOS from coconut flour after defatting with hexane and
washing with hot water, they obtained hydrolysates with mainly mannobiose (64.9%) and other
monosaccharides.
The results obtained in this thesis and the literature studies discussed confirmed that SCW acts
efficiently, compared to the enzymatic method for the hydrolysis and breaking the polysaccharides
with a complex structure with several side chains. SCW has the ability to cleave the substituents
attached to the backbone, which makes it more accessible for hydrolysis leading to higher amounts
of oligomers with wider range of DP.

123
ND
: No
t detected
, Data are ex
pressed
as mean
± stan
dard
dev
iation
of tw
o rep
licates. a
-d D
ifferent letters in
the sam
e colu
mn
ind
icate sign
ificant d
ifferences (p
< 0
.05
). XO
S R
ecov
ery (%
): (mass o
f XO
S/m
ass of in
itial xy
lan) x
100
.
kj
vcv
cxcx
xcc
En
zym
atic
(xy
lan
ase)
SC
W
Ty
pe o
f
hy
dro
lysis
Tab
le. 3.9
. Am
ounts o
f xylo
-olig
osacch
arides (X
OS
) obtain
ed b
y S
CW
and en
zym
atic hydro
lysis.
13
.1±
0.7
b
10
0.9
±7
.0a
Xy
lob
iose
Xylo
-olig
osa
ccharid
es con
tent
(mg)
7.4
±0.6
b
12
0.6
±9
.9a
Xy
lotrio
se
ND
11
2.4
±1
3.7
Xy
lotetra
ose
0.5
±0.0
6
ND
Xy
loh
exa
ose
21
.1±
0.0
8b
33
4±
30
.7a
To
tal X
OS
28
.09±
1.5
a
23
.7±
1.6
a
Xy
lob
iose
Xylo
-olig
osa
ccharid
es reco
very
(%)
15
.8 ±
1.4
b
28
.3±
2.3
a
Xy
lotrio
se
ND
26
.4 ±
3.2
Xy
lotetra
ose
1.2
± 0
.1
ND
Xy
loh
exa
ose
45.1
±0.1
8b
78.4
± 5
.5 a
To
tal X
OS

124
3.4. Conclusions
This study provided a sequential process for the production of xylooligosaccharides (XOS) from
barley bran, including lipid removal, starch removal and protein removal with further hydrolysis
of the obtained fraction (defatted- destarched and deproteinized bran) using SCW and enzymatic
approach.
Lipid removal was successful using a SC-CO2 system (10 mL vessel) with the highest recovery of
94% at 300 bar/70°C using a ratio of 15.7 (mass of CO2/mass of feed) after 30 min. Scale-up of
this process was also performed using a 300 mL vessel at the same condition (300 bar/70°C) with
the maximum lipid recovery of 92% after 4 h extraction at the same solvent-to-feed ratio.
Starch removal from defatted bran was performed using enzymatic hydrolysis with a combination
of alpha-amylase (150 U/g DF bran/98-100°C/40 min) and amyloglucosidase (660 U/g DF
bran/60◦C/30 min) with further precipitation of non-starch polysaccharides using ethanol.
Defatted-destarched bran resulted in only 1.03% starch compared to the initial bran (10.4%), along
with an increase of xylose from 8.3 to 12.83% db.
SCW was used for the hydrolysis of DF-DS bran at 120-200°C/50 bar/5 mL/min for 15-60 min.
Reducing sugars yield increased with the elevation of temperature and time, and the maximum
yield was obtained at 180°C/30 min (10.09±0.90%). XOS was obtained only at 160 and 180°C,
with the maximum amounts at 180°C/30 min (40 mg of X2, 46.1 mg of X3, 26.2 mg of X4 and

125
112.5 mg of total XOS) and 180°C/60 min (11.2 mg of X2, 55.4 mg of X3, 46.7 mg of X4 and
113.4 mg of total XOS).
Deproteinized bran was also obtained after alkaline treatment to remove protein, resulting in a
fraction rich in xylan (20.14% db) and arabinan (21.13% db) with a final protein content of 4.62%.
This fraction was hydrolyzed by enzymatic treatment using endo-xylanase and SCW treatment.
The maximum total XOS obtained by xylanase hydrolysis was 21.11 mg after 4 h (45.11%
recovery from initial xylan). SCW hydrolysis produced 334.02 mg XOS (78.4% recovery), which
was higher than that for the enzymatic hydrolysis. Therefore, the results obtained suggest SCW as
a green technology to produce xylo-oligosaccharides with a range of DP 2-6 with prebiotic effect
in a short time from hemicellulosic fraction derived from biomass. It is possible to improve the
hydrolysis and obtain more XOS content by manipulating the reaction temperature and time.
Moreover, SCW was more effective to break down and form XOS compared to the enzymatic
hydrolysis at the investigated processing conditions.

126
Chapter 4. Xylo-oligosaccharides purification of SCW-treated barley bran using membrane
separation followed by activated carbon adsorption
4.1. Introduction
Xylo-oligosaccharides (XOS) have different applications in food, medical, and pharmaceutical
industries (Vazquez et al., 2000; 2005). As food ingredients, XOS are stable under acidic
conditions, and have resistance to heat (Moure et al., 2006). Since they behave as non-digestible
oligosaccharides (NDO), XOS might be used as soluble dietary fiber that has low calorie, helping
to maintain a healthy weight and reducing the risk of diabetes and heart disease (Crittenden and
Playne, 1996). Moreover, XOS with the desired DP range of 2-6 have been reported to have
prebiotic effect (Okazaki et al., 1990; Fooks and Gibson, 2002). A prebiotic is a food component
that: i) resists gastric acidity hydrolysis by digestive enzymes, and gastrointestinal absorption; ii)
is fermented by intestinal microbiota; and iii) enables a selective stimulation of the growth of
intestinal bacteria that has health effects, such as bifidobacteria and lactic acid bacteria. Therefore,
XOS are considered as a healthy food ingredient in functional foods. Okazaki et al. (1990) showed
the effect of a mixture of xylose (22%), xylobiose (58%), xylotriose (13%), and other saccharides
(7%) for the growth and in vitro fermentation by B. adolescentis, B. longum, and B. infantis. In
that study, B. adolescentis, which is available in most adults' intestines showed a strong ability to
use both xylobiose and xylotriose as energy sources and its percentage of total bacterial counts

127
increased from 10 to 32% after addition of XOS mixture to the culture medium. In another study,
rice husk was autohydrolyzed at 205°C with a ratio of 8 kg water/kg of oven-dried rice husk. XOS
was produced with a DP range of 2-6 (39.93 wt% non-volatile compounds) in the final hydrolysate.
Further, the obtained XOS mixture was used to stimulate the growth of bifidobacteria. The XOS
was consumed at the end of the fermentation and the highest utilization corresponded to xylotriose
(90%), followed by xylobiose (84%), xylotetraose (83%), and xylopentaose (71%). These results
confirmed that XOS with DP 2 and 3 were desirable substrates for bacteria compared to the XOS
with higher DP (≥4) (Gullon et al., 2008).
When XOS were produced using hydrothermal treatments, including SCW, autohydrolysis and
steam explosion, a variety of compounds such as monosaccharides, organic acids, furfural and
hydroxymethylfurfural from dehydration of pentose and hexose sugars, protein and lignin-derived
products were found in the final hydrolysates (Aachary and Prapulla, 2011). Also, after enzymatic
hydrolysis, the obtained hydrolysates had impurities of high molecular weight components, such
as xylanase enzyme, starch, pectin, protein and tannin (Zhao and Dong, 2016).
To obtain XOS with high purity (75-95%) for food applications, with effective prebiotic properties,
multistage treatments are needed. Several techniques such as vacuum evaporation, solvent
extraction like ethyl acetate, solvent precipitation, physical adsorption and membrane separation
have been used to purify hydrolysates containing a mixture of produced XOS plus other impurities

128
(Moure et al., 2006). Solvent extraction has been employed for the refining of liquors obtained
from barley hull autohydrolysis containing 19.56 kg XOS, using ethyl acetate with a liquor to
solvent mass ratio of 1:1 kg/kg to remove non-saccharide components such as phenolics, waxes,
alcohols and extractive derived materials. XOS was recovered (16.80 kg) in the aqueous phase
after evaporation of the solvent and dissolved volatile compounds. Then, solvent precipitation with
ethanol, acetone and 2-propanol at a solvent to liquor mass ratio of 5:1 kg/kg, has been used.
Further, the solid fraction that precipitated was collected by filtration and 15.94 kg (94% recovery)
was the maximum amount of XOS recovered in the dried precipitate obtained with the addition of
acetone (Vegas et al., 2005).
The use of activated carbon adsorption is another approach for the purification of XOS due to the
stronger adsorption of higher DP oligosaccharides and less adsorption of xylose (DP1) to the
activated carbon, which could be effective to remove monomers from oligomers in the mixture.
Zhu et al. (2006) used activated carbon adsorption followed by ethanol elution of XOS in the
xylanase enzymatic hydrolysates obtained from corn cob and corn stover. They added activated
carbon to the hydrolysates in the range of 1-10% of the liquid weight, while shaking at room
temperature at 200 rpm for 30 min. Then, activated carbon was separated from the solution and
eluted twice with 100 mL of ethanol 15% and 30% v/v. The maximum recovery of XOS was
34.5% with 10% activated carbon and elution with ethanol 15% (100 mL).
129
Membrane separation, mainly ultrafiltration and nanofiltration, has been used as a promising
technology for the refining and concentrating of different oligosaccharides, such as fructo-
oligosaccharides (Li et al., 2004), soybean oligosaccharides (Kim et al., 2003), pectic
oligosaccharides (Iwasaki and Matsubara, 2000), and chito-oligosaccharides (Jeon and Kim,
1998). Membrane separation driven by a pressure gradient works based on the size of compounds,
which leads to the concentration of molecules with different molecular weights and degree of
polymerization. This technique has advantages, including low energy usage (Goulas et al., 2003),
no need for chemical solvents, easy modification of the processing parameters, such as pressure,
temperature, feed flow rate, agitation and ease of scale-up (Drioli, 2004; Cano and Palet, 2007;
Czemark et al., 2004). Some operational parameters, which affect the efficiency of the process
are: i) the type of organic membranes, mainly derivatives of propylene, ethylene, cellulose and
polyamide, ii) inorganic membranes such as ceramic membranes, and iii) operating parameters
such as temperature, pressure, pH and the concentration of the feed solution (Pinelo et al., 2009).
Polysulfone is one of the main materials in polymeric membranes due to its mechanical, thermal
and chemical stability. It is used as flat sheets or hollow fibers, for microfiltration and ultrafiltration
processes. However, these membranes are hydrophobic and have strong protein adsorption
capacity, which lead to the fouling of the membrane and pore plugging, resulting in a reduction of
water flux and separation efficiency (Wavhal and Fisher, 2005). Different methods have been
applied for polysulfone membrane surface modification, which increase their hydrophilic

130
properties such as bonding the monomers like acrylic or gallic acid (Wavhal and Fisher, 2005),
and blending with a hydrophilic polymer like poly (vinylpyrrolidone) (Lu et al., 2007) or cellulose
acetate (Mahendran et al., 2004).
Membrane separation was carried out successfully for XOS purification produced by enzymatic
and hydrothermal hydrolysis with the recovery in a range of 50-90% (Gullon et al., 2010; Akpinar
et al., 2007; Vegas et al., 2006). Swennen et al. (2005) compared ultrafiltration and ethanol
precipitation for the purification of arabinoxylo-oligosaccharides produced by endoxylanase
hydrolysis of destarched and deproteinized wheat bran. Ethanol precipitation was carried out by
the addition of pure ethanol to arabinoxylo-oligosaccharides hydrolysates in three steps. First,
ethanol was added to the hydrolysate to a concentration of 60% (v/v) and materials were
precipitated overnight. Obtained precipitate was separated from the supernatant, dried and made
up the first fraction. Then, ethanol was added to the supernatant to obtain the concentration of 60-
90%, and the final dried precipitate from this step made up the second fraction. In the last step,
ethanol was added to the second supernatant to reach the concentration of 90%. The precipitate
was recovered as described above and the supernatant made up the third fraction. They also tested
membranes with a molecular weight cut-off of 5, 10 and 30 kDa at a constant pressure of 4 bar,
using a stainless-steel dead-end ultrafiltration cell in a batch mode, in which the feed flows to the
membrane perpendicularly. The cell, equipped with a magnetic stir bar to minimize the deposition
of the particles on the membrane surface, was filled with 300 mL of enzymatically hydrolyzed

131
wheat bran and left for 5–8 h at room temperature, where 200 mL of permeate was collected. They
reported the presence of arabinoxylo-oligosaccharides with DP 3, 5 and 6 in the permeate and DP
11, 12 and 15 in the retentate of membranes with 5, 10 and 30 kDa. Also, they concluded that more
substituted components such as arabinose chains, which were less accessible for enzymatic
hydrolysis and thus have higher molecular mass were concentrated in the retentate fractions, while
less substituted components were found in the permeate fractions. The ultrafiltered fractions
containing XOS with DP 3, 5 and 6 were more heterogeneous, polydisperse and less strictly
compared to the fractions obtained with ethanol precipitation. Moreover, they reported higher
recovery of arabinoxylo-oligosaccharides in the fractions obtained from ultrafiltration, where 86%
was recovered in the retentate of 5 kDa membrane, while the highest recovery by ethanol
precipitation was achieved in the third fraction with 47.2%.
The objective of this study was to evaluate ultrafiltration using membranes with two different
molecular weight cut off of 3 kDa and 1 kDa to fractionate XOS obtained from barley bran because
xylobiose, xylotriose and xylotetraose have molecular weight lower than 1 kDa. Then, they can
pass through these two ultrafiltration membranes. For this purpose, defatted-destarched barley bran
SCW hydrolysate was passed through both membranes to remove high molecular weight
compounds, and recover maximum XOS, mainly xylobiose, xylotriose and xylotetraose in the
permeate. Then, the membrane with the higher XOS mass recovery (1 kDa) was used for the
purification of the SCW hydrolysate obtained from the deproteinized bran. Mass of oligomers in

132
the obtained permeates and retentates were quantified to calculate the recovery of xylobiose,
xylotriose and xylotetraose.
Further, a model system using a solution (PreticXTM XOS + xylose) was used to evaluate the effect
of nanofiltration and activated carbon adsorption to remove xylose as a monomer from the XOS
mixture, including xylobiose, xylotriose and xylotetraose. Nanofiltration was performed using two
different membranes with 150 and 150-300 Da molecular weight cut off because xylose with the
molecular weight of 150 Da can pass through the membrane and be collected in the permeate.
Mass of oligomers and xylose in the obtained permeate and retentate fractions were quantified.
The permeate obtained from 1 kDa ultrafiltration membrane after passing SCW treated
deproteinized bran, had monomers, including xylose and arabinose, plus XOS. Activated carbon
adsorption was studied to remove monomers from this permeate.
4.2. Materials and methods
The Minimate™ tangential flow filtration (TFF) system was kindly provided by Pall Corporation
(Mississauga, ON, Canada). The setup, shown in Fig 4.1 included a peristaltic pump, tubings,
valves or clamps, pressure gauge, sample reservoir and a capsule membrane. Minimate TFF
capsule membranes with a molecular weight cut off (MWCO) of 3 kDa and 1 kDa with modified
polyethersulfone material, dimensions of 20 cm x 3.8 cm x 1.8 cm, pH range of 1-14 and the
maximum operating pressure of 4 bar were purchased from Pall Corporation (Mississauga, ON,

133
Canada). Nanofiltration flat sheet membranes Trisep TS80 with a pore size of 150 Da, thin film
polyamide material, size of 1016×305 mm, thickness of 130-170 µm, pH range of 1-12, maximum
operating pressure of 41 bar and Cynder NFX with a pore size of 150-300 Da, pH range of 3-10.5,
size of 1000×1000 mm were purchased from Sterlitech (Kent, WA, USA). PreticXTM XOS
obtained from corn was provided by AIDP Inc. (Los Angeles, CA, USA). Sodium hydroxide
(NaOH) was purchased from Sigma Aldrich (St. Louis, MO, USA). Xylo-oligosaccharide
standards, xylobiose (X2), xylotriose (X3), xylotetraose (X4) and xylohexaose (X6) were
purchased from Megazyme (Wicklow, Ireland). D (+) Xylose, D (+) and L (+) arabinose, with a
purity of ≥ 96% were purchased from Sigma Aldrich (St. Louis, MO, USA). HPLC grade water
was purchased from Fisher Scientific (Ottawa, ON, Canada). Granular activated carbon with the
mesh size of 20-60 was purchased from Sigma Aldrich (St. Louis, MO, USA).

134
4.2.1. Purification by ultrafiltration
The cross-flow ultrafiltration was carried out using the Minimate™ TFF System at a constant
pressure of 1 bar and room temperature (22°C) for 2 h. The images of the ultrafiltration system,
membranes and overall diagram of the system is shown in Fig. 4.1.
Fig. 4.1. Minimate TFF Capsule System: (a) ultrafiltration system, (b) membrane, and (C) overall
diagram.
Permeate
Membrane TFF Capsule
Feed Permeate
Retentate Vent
Permeate flow
Retentate flow
Permeate Sample
Peristaltic pump
Feed flow
Pressure gauge
Screw
Clamp
(c)
(a) (b)
Pump Sample
reservoir
TFF capsule
membrane
Pressure gauge Retentate

135
First, the TFF reservoir was connected with plastic tubings to the pump and a pressure gauge.
Then, the capsule membrane was assembled in the system connecting to the pressure gauge and
the sample reservoir. Tubing was connected to the permeate port of the membrane to collect the
permeate fraction and another plastic tubing was used for passing the retentate stream to the
reservoir. A screw clamp was used for controlling the pressure up to 4 bar.
After setting up the TFF system, flushing was performed with distilled water to remove the storage
solution of the TFF capsule membrane system before use and prevent contamination of the sample
with the storage solution (0.5 N NaOH). For this purpose, the retentate tubing was directed into
the waste collection vessel and the screw clamp on the retentate line was fully opened. The sample
reservoir was filled with 500 mL of distilled water, the pump was turned on and the speed increased
until the feed gauge pressure showed approximately 1.38 bar. The retentate side of the membrane
was flushed with water until a total of 250 mL was collected inside the waste collection vessel.
Then, the pump speed was reduced to 0 and the pump was turned off.
For water flushing of the permeate side, screw clamp on the retentate line was closed and the pump
was turned on until the feed gauge pressure read approximately 1.38 bar to flush the permeate and
the rest of water (250 mL) has been removed from the permeate port and collected.

136
4.2.1.1. Ultrafiltration of the defatted-destarched bran SCW hydrolysate
The hydrolysate of defatted-destarched bran obtained from the SCW treatment at 180°C, 50 bar
and 30 min was selected for use as feed for the ultrafiltration with 1 and 3 kDa membranes. This
hydrolysate sample was obtained at the best condition of SCW processing as described in Chapter
3 and had the highest amount of total XOS (112 mg) compared to the other hydrolysates collected
from SCW treatment of defatted-destarched bran.
The hydrolysate of defatted-destarched bran obtained from the SCW treatment at 180°C, 50 bar
and 30 min was passed through the 0.22 µm filter to remove particulate materials. The TFF system
was rinsed with water before using it to remove trapped air and clean it. Then, 52 mL of the filtered
hydrolysate was passed through the 1 kDa membrane for 2 h at pressure of 1 bar. After 2 h, 40 mL
of the permeate was collected and 10 mL of the retentate was kept in the reservoir. Another 52 mL
of the same filtered hydrolysate was passed through the 3 kDa membrane at the same condition
described above, 40 mL of the permeate and 10 mL of the retentate were obtained. The fractions
obtained from 1 kDa membrane were recorded as permeate and retentate A, and fractions obtained
from 3 kDa membrane were recorded as permeate and retentate B.
Distilled water (42 mL) was added into the retentate liquid obtained from 1 kDa membrane and
passed through the same 1 kDa membrane again to obtain an additional permeate (40 mL) recorded
as permeate C. Retentate C was diluted by distilled water and ultrafiltrated with the same procedure
as described for permeate A. Finally, permeate and retentate D were collected. All the retentates

137
and permeates obtained were analyzed for XOS content by HPLC using the Aminex 42-A column
described in Chapter 3 (Section 3.2.6.5). First, the mass (mg) of obtained XOS was determined in
all fractions. Then, the recoveries of individual and total XOS were calculated according to
equation (4.1).
𝑋𝑦𝑙𝑜𝑜𝑙𝑖𝑔𝑜𝑠𝑎𝑐𝑐ℎ𝑎𝑟𝑖𝑑𝑒𝑠 𝑟𝑒𝑐𝑜𝑣𝑒𝑟𝑦 (%) = [𝑀𝑎𝑠𝑠 (𝑚𝑔) 𝑜𝑓 𝑋𝑂𝑆 𝑖𝑛 𝑡ℎ𝑒 𝑝𝑒𝑟𝑚𝑒𝑎𝑡𝑒 𝑜𝑟 𝑟𝑒𝑡𝑒𝑛𝑡𝑎𝑡𝑒 𝑓𝑟𝑎𝑐𝑡𝑖𝑜𝑛
𝑀𝑎𝑠𝑠 (𝑚𝑔) 𝑜𝑓 𝑖𝑛𝑖𝑡𝑖𝑎𝑙 𝑡𝑜𝑡𝑎𝑙 𝑋𝑂𝑆 𝑖𝑛 𝑡ℎ𝑒 𝑓𝑒𝑒𝑑 ] × 100 (4.1)
4.2.1.2. Ultrafiltration of the deproteinized bran SCW hydrolysate
The SCW hydrolysate obtained from deproteinized bran at 180°C, 50 bar and 30 min as described
in Chapter 3, that had the highest amount of total XOS (334 mg) was ultrafiltrated using 1 kDa
membrane at the same condition used for the hydrolysate from defatted-destarched bran as
described above. The first permeate (40 mL) and retentate (10 mL) obtained were recorded as
permeate and retentate E. The fractions collected after the second ultrafiltration step were recorded
as permeate and retentate F. The third fractions obtained were recoded as permeate and retentate
G. The recovery of XOS was quantified using equation (4.1) based on HPLC analysis results.
4.2.1.3. Cleaning of the ultrafiltration system
Cleaning of the Minimate filtration system was performed to remove the fouling and residual
materials from the membrane after each experiment. The reservoir was filled with 500 mL NaOH
(0.3 N). Then, the retentate valve was closed and the permeate tubing was placed into the waste
collection vessel. The pump was turned on, the cleaning solution was pumped to reach the pressure
of 1.38 bar until collecting 200 mL in the waste collection vessel. Then, the pump was turned off.

138
The retentate valve was opened and the screw clamp was closed. The pump was turned on and the
cleaning solution was recirculated for 30 min. After draining the retentate, the reservoir was filled
with distilled water and it was recirculated for 1 h to remove the remaining NaOH solution and
completely clean the system.
4.2.2. Purification of the model system of PreticXTM XOS + xylose solution by nanofiltration
A model system composed of XOS without impurities was used to study the effect of nanofiltration
for xylose removal. A semi-continuous flow type nanofiltration system was used as shown in Fig.
4.2 a, employing a high performance liquid chromatograph (HPLC) pump (Model REAXUS
6010R, Teledyne Isco, NE, USA), a stainless steel reactor of 2 cm diameter × 11.6 cm length and
a controlling valve.
Two nanofiltration membranes with the MWCO of 150 Da (TS-80) and 150-300 Da (Cynder) were
used in the outlet of the reactor to remove monosaccharides and increase the XOS proportion
compared to the total content of monomers in the solution.
A solution was prepared from PreticXTM XOS (1.36 g) and xylose (0.54 g) in 500 mL distilled
water. An aliquot of the solution (43 mL) was used, which was composed of 77.1±0.3, 69.6±0.84,
33.8±0.06, 80.9±0.3 and 180.6±1.07 mg of xylobiose, xylotriose, xylotetraose, xylose and total
XOS, respectively.

139
Pure water flux and conditioning were performed for each membrane. Membranes were cut from
flat sheet rolls according to the internal size of the reactor and allowed to soak in water at room
temperature for at least 30 min, then loaded into the stirred cell reactor (Fig. 4.2b). Deionized water
was pumped through the reactor and membrane for 45 min with a starting pressure of 10 bar, at a
flow rate of 0.5 mL/min, at room temperature until flux was relatively constant. Then, the reactor
was opened and deionized water was discarded. The feed reservoir was filled with 43 mL of XOS
+ xylose solution and pumped at the same flow rate, temperature and pressure. After running for
45 min, 10 mL of permeate was collected and 30 mL remained inside the reactor as the retentate.
Both permeate and retentate fractions were analyzed by HPLC to determine the amounts of
xylobiose, xylotriose, xylotetraose and xylose. Recoveries of total XOS were calculated according
to equation (4.1).
Fig. 4.2. (a) Semi-continuous nanofiltration system and (b) membrane loading inside the reactor.
Pump
Feed reservoir
Valve
Reactor
Nano filtration membrane
Permeate
(a) (b)
Filter Nano filtration
membrane Reactor
lid Reactor
Retentate

140
4.2.3. Purification of PreticXTM XOS + xylose solution by activated carbon adsorption
method
This adsorption method was performed according to Zhu et al. (2006) to remove monosaccharides
from the solution by adsorption of XOS on to the activated carbon. Activated carbon powder was
mixed with the PreticXTM XOS + xylose solution (43 mL) at 10 and 15% of the liquid weight
corresponding to 4.11 and 6.16 g, respectively, inside 50 mL Falcon tubes. Then, the mixture was
shaken at room temperature at 200 rpm for 30 min to stabilize the carbohydrate adsorption on
activated carbon. The activated carbon was separated from the solution by vacuum filtration using
a 50-mL Pyrex crucible filter and washed with distilled water 4 times (4×21 mL). The obtained
washed liquid was taken and recorded as water fraction A (15% activated carbon) and water
fraction B (10% activated carbon). Then, the carbon cake was washed twice with ethanol 15%
(2×20 mL) followed by ethanol 30% (2×20 mL). The obtained washed liquid was taken and
ethanol was evaporated using liquid nitrogen and the rest of the sample was recorded as ethanol
fraction A (15% activated carbon) and ethanol fraction B (10% activated carbon). The water and
ethanol fractions were analyzed by HPLC to determine the amounts of xylobiose, xylotriose,
xylotetraose and xylose.

141
4.2.4. Purification and decolorization of permeates E and F by activated carbon adsorption
method
Permeates E and F obtained after ultrafiltration using 1 kDa membrane of deproteinized bran SCW
hydrolysate were treated by activated carbon adsorption with 10 mL starting feed solution mixed
with 1.2 g of activated carbon powder (10% of the liquid weight) as described above. The activated
carbon was washed with distilled water (24 mL) after separation, and collected fraction was
recorded as water fraction. Then, ethanol washing was performed using ethanol 15% (2×5 mL)
followed by ethanol 30% (2×5 mL). After ethanol evaporation, the obtained fraction was recorded
as ethanol fraction. Fractions obtained from permeate E were recorded as ethanol and water
fraction C and fractions obtained from permeate F were recorded as water and ethanol fraction D.
Xylose, arabinose and total XOS recoveries were calculated in the water and ethanol fractions
according to equations (4.2). (4.3) and (4.1), respectively.
𝑋𝑦𝑙𝑜𝑠𝑒 𝑟𝑒𝑐𝑜𝑣𝑒𝑟𝑦 (%) = [𝑀𝑎𝑠𝑠 (𝑚𝑔) 𝑜𝑓 𝑥𝑦𝑙𝑜𝑠𝑒 𝑖𝑛 𝑡ℎ𝑒 𝑒𝑡ℎ𝑎𝑛𝑜𝑙 𝑜𝑟 𝑤𝑎𝑡𝑒𝑟 𝑓𝑟𝑎𝑐𝑡𝑖𝑜𝑛
𝑀𝑎𝑠𝑠 (𝑚𝑔) 𝑜𝑓 𝑖𝑛𝑖𝑡𝑖𝑎𝑙 𝑥𝑦𝑙𝑜𝑠𝑒 𝑖𝑛 𝑡ℎ𝑒 𝑓𝑒𝑒𝑑 ] × 100 (4.2)
𝐴𝑟𝑎𝑏𝑖𝑛𝑜𝑠𝑒 𝑟𝑒𝑐𝑜𝑣𝑒𝑟𝑦 (%) = [𝑀𝑎𝑠𝑠 (𝑚𝑔) 𝑜𝑓 𝑎𝑟𝑎𝑏𝑖𝑛𝑜𝑠𝑒 𝑖𝑛 𝑡ℎ𝑒 𝑒𝑡ℎ𝑎𝑛𝑜𝑙 𝑜𝑟 𝑤𝑎𝑡𝑒𝑟 𝑓𝑟𝑎𝑐𝑡𝑖𝑜𝑛
𝑀𝑎𝑠𝑠 (𝑚𝑔)𝑜𝑓 𝑖𝑛𝑖𝑡𝑖𝑎𝑙 𝑎𝑟𝑎𝑏𝑖𝑛𝑜𝑠𝑒 𝑖𝑛 𝑡ℎ𝑒 𝑓𝑒𝑒𝑑] × 100 (4.3)

142
4.2.5. Xylooligosaccharides and monosaccharides determination by HPLC
Xylo–oligosaccharides and monosaccharides were quantified using a HPLC system described in
Chapter 3 Section (3.2.6.5) with an Aminex HPX 42-A column at 85°C and a flow rate of 0.3
mL/min for 45 min.
4.2.6. Statistical analysis
Data are shown as mean ± standard deviation according to the results obtained from at least
duplicate experiments and analysis. One-way analysis of ANOVA and the significance difference
of data at p < 0.05 was performed using Minitab version 18.0 (Minitab Inc., State College, PA,
USA) at 95% confidence interval.
4.3. Results and discussion
4.3.1. Xylooligosaccharides content after ultrafiltration of defatted-destarched bran SCW
hydrolysate
The SCW hydrolysate (52 mL) obtained from defatted-destarched bran at 180°C, 50 bar and 30
min was ultrafiltrated using membranes of 3 kDa and 1 kDa MWCO. This sample had 8.96, 14.52
and 13.01 and 36.51 mg of X4, X3, X2 and total XOS, respectively. Also, it had a peak area of
243156 for the compounds with high molecular weight with DP > 12.

143
After the first filtration process, the large peak of high molecular weight compounds (DP>12)
almost disappeared in the permeates obtained. Its area reduced to 8254 and 5584 in the permeates
B and A after passing through the 3 and 1 kDa membranes, respectively. This peak indicated the
presence of high molecular weight compounds with molecular weight more than 1 and 3 kDa that
might be soluble lignin, or unhydrolyzed polysaccharides.
In other studies, ultrafiltration was used for the removal of high molecular weight compounds from
hydrothermal hydrolysate obtained from corn cob at 200-205°C, 30 bar and 9-12 min using a
continuous SCW process (Makishima et al., 2009) and enzymatic hydrolysate obtained from wheat
bran extracted xylan using endoxylanase with 0.8, 1.6 and 5 U on 720 mg xylan suspended in 232
mL sodium acetate buffer at 30°C (Swennen et al., 2005).
Fig. 4.3 shows the mass balance after ultrafiltration of the SCW defatted-destarched bran
hydrolysate with 1 and 3 kDa MWCO membranes. Xylobiose, xylotriose and xylotetraose were
recovered in the permeate B obtained from 3 kDa with amounts of 5.44, 6.70, 4.51 mg,
respectively, with 16.66 mg for total XOS. After passing the SCW hydrolysate by 1 kDa
membrane, 6.87, 8.37, 4.02 and 19.27 mg X2, X3, X4, and total XOS were obtained in the
permeate A.
Fig. 4.4 a,b shows the total recovery of xylobiose, xylotriose, xylotetraose and total XOS obtained
after ultrafiltration of SCW defatted-destarched bran hydrolysate using 1 and 3 kDa membranes.

144
According to the One-way ANOVA analysis, total XOS recovered was significantly different
between membranes with 1 kDa (19.27 mg/52.79% recovery) and 3 kDa (16.66 mg/45.63%
recovery) cutoff, which was higher in the permeate A obtained by 1 kDa. This phenomenon can
be related to the accumulation of high molecular weight compounds layer on the surface of the
membrane with high molecular weight cutoff of 3 kDa due to the high flux of permeate, leading
to the flow reduction and increasing the retention of low molar mass XOS in the retentate fraction
(Nabarlatz et al., 2007). Total XOS recovered (52.79%) in the permeate A obtained after passing
1 kDa membrane and 6.90 mg remained in the retentate A, which corresponded to 18.92%
recovery. Therefore, retentate A (10 mL) was diluted by the addition of deionized water (42 mL)
and passed through the same membrane again to recover the rest of XOS in the second liquor
permeate noted as permeate C (Fig. 4.3).
In permeate C, 1.15, 1.83, 0.94 and 3.93 mg of X4, X3, X2 and total XOS were quantified that
corresponded to the recovery of 3.15, 5.01, 2.60 and 10.77%, respectively. Retentate C was
ultrafiltrated one more time by the addition of deionized water (42 mL). However, trace amounts
of XOS was recovered in the permeate D.
Zhao and Dong (2016) also purified XOS solution containing X2 and X3 obtained from endo-
xylanase enzymatic hydrolysis of wheat bran xylan using 1 kDa membrane. They recovered
57.55% of XOS (X2 and X3) in the permeate after 3 times 1 kDa membrane filtration. In another
145
study, Akpinar et al. (2007) purified XOS obtained by endo-xylanase enzymatic hydrolysis of
xylan from cotton stalks, which was composed of X6, X5, X2 and X3. They used 10 kDa disc
membrane for the separation of enzymes and other high molecular weight polysaccharides. Then,
the obtained permeate was passed through the 3 and 1 kDa disc membranes separately to remove
long chain XOS>X5 from the rest and collect permeates with purified XOS with DP < 5. In the
final permeate, the recovery of X2 was 89% with both membranes and the recovery of X3 was 93
and 96% by 1 and 3 kDa, respectively. Therefore, they concluded that the use of both membranes
could be an appropriate choice to refine XOS, because there was no significant difference in the
recovery of X2 and X3. However, the retention of X5 and >X5 were higher with 3 kDa membrane
and recoveries of >X5 oligomers in permeate of 3 and 1 kDa were 62 and 57%, respectively. They
did not observe any reduction in the recovery of X2 and X3 in the permeate with the use of higher
molecular weight cut off membrane of 3 kDa. This might be because of the separation of endo-
xylanase enzyme and high molecular weight molecules with 10 kDa membrane before passing by
the low molecular weight cutoff membranes (3 and 1 kDa). But, in this study, there was a
significant difference in the recovery of total XOS (X4+X3+X2) in the permeate obtained by 1
kDa membrane. Probably, because the hydrolysate was passed through the 1 and 3 kDa membranes
directly and no previous filtration was performed to remove high molecular weight compounds.

146
Fig. 4.3. Mass balance after ultrafiltration of defatted-destarched bran SCW hydrolysate with 1 and 3 kDa membranes.
Defatted-destarched bran SCW
hydrolysate (180°C, 50 bar, 30 min)
X4: 8.96, X3: 14.52 and X2: 13.01
Total XOS: 36.51 mg
Filtration by 3 kDa membrane
Filtration by 1 kDa membrane
Retentate B
X4: 3.26, X3: 3.21, X2: 1.20
Total XOS: 7.68 mg
Permeate B
X4: 4.51, X3: 6.70, X2: 5.44
Total XOS: 16.66 mg
Retentate A
X4: 2.74, X3: 2.92, X2: 1.23
Total XOS: 6.90 mg
Permeate A
X4: 4.02, X3: 8.37, X2: 6.87
Total XOS: 19.27 mg
Permeate C
X4: 1.15, X3: 1.83, X2: 0.94
Total XOS: 3.93 mg
Retentate C
X4: 0.37, X3: 0.94, X2: 0.19
Total XOS: 1.52 mg
Filtration by 1 kDa membrane
Filtration by 1 kDa membrane
Permeate
XOS: Trace amount Retentate D
XOS: Trace amount

147
Fig. 4.4. Ultrafiltration of defatted-destarched bran SCW hydrolysate using: (a) 1 kDa and (b) 3 kDa
membranes. Means within the same group of XOS with different letters are significantly different at
p<0.05 (A-B) for Fig 4.4a between permeate C and retentate C, (a-b) for Fig. 4.4a-b between permeate A
and permeate B, retentate A and retentate B.
0
10
20
30
40
50
60
Permeate A Retentate A Permeate C Retentate C
Rec
over
y
(% i
nit
ial
tota
l X
OS
in
th
e fe
ed)
Xylotetraose (X4)
Xylotriose (X3)
Xylobiose (X2)
Total XOS (X2+X3+X4)
0
10
20
30
40
50
60
Permeate B Retentate B
Rec
over
y
(% i
nit
ial
tota
l X
OS
in t
he
feed
) Xylotetraose (X4)
Xylotriose (X3)
Xylobiose (X2)
Total XOS (X2+X3+X4)
(b)
(a)
a
a
a
a
a a
a
a
a a a
b
a a a
b
A B
A B B
B
A A

148
4.3.2. Xylooligosaccharides content after ultrafiltration of deproteinized bran SCW
hydrolysate
Membrane with the molecular weight cut off 1 kDa was used for the filtration of deproteinized
bran SCW hydrolysate to recover XOS in the obtained permeate, because 1 kDa membrane was
tested for the filtration of defatted-destarched bran SCW hydrolysate and total XOS recovery was
higher in the permeate A compared to the permeate B obtained after ultrafiltration with 3 kDa
membrane (Fig. 4.4).
The starting deproteinized bran SCW hydrolysate had 47.13, 49.14 and 34.74 mg of X4, X3 and
X2, respectively. Also, the big peak related to the molecules with DP ˃ 12 had an area of 655080.
Fig. 4.5a shows the filtration process of deproteinized bran SCW hydrolysate. Retentate remained
in the feed reservoir and permeate was collected in the cylinder. Two permeates E and F were
collected after the two-step ultrafiltration process and they were more clear and lighter in color
compared to the feed (Fig. 4.5b).
Fig. 4.6 illustrates the chromatograms (with 0.3 mL/min HPLC flow rate) related to the
deproteinized bran SCW hydrolysate and obtained fractions after the ultrafiltration process
including permeate and retentate E, permeate and retentate F. Ultrafiltration by 1 kDa membrane
was effective to separate high molecular weight compounds (DP>12) by reduction of the peak area
from 327540.8 to 35952.8 in the permeate E. The contents of XOS in the permeate E were reported
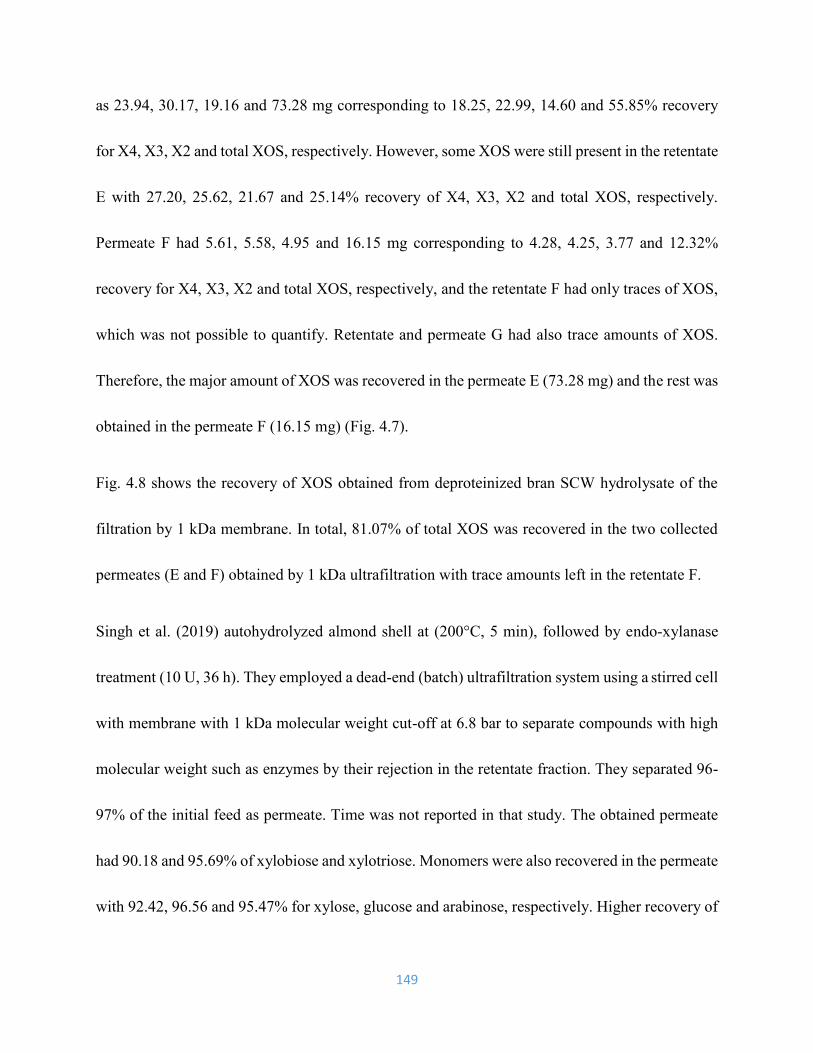
149
as 23.94, 30.17, 19.16 and 73.28 mg corresponding to 18.25, 22.99, 14.60 and 55.85% recovery
for X4, X3, X2 and total XOS, respectively. However, some XOS were still present in the retentate
E with 27.20, 25.62, 21.67 and 25.14% recovery of X4, X3, X2 and total XOS, respectively.
Permeate F had 5.61, 5.58, 4.95 and 16.15 mg corresponding to 4.28, 4.25, 3.77 and 12.32%
recovery for X4, X3, X2 and total XOS, respectively, and the retentate F had only traces of XOS,
which was not possible to quantify. Retentate and permeate G had also trace amounts of XOS.
Therefore, the major amount of XOS was recovered in the permeate E (73.28 mg) and the rest was
obtained in the permeate F (16.15 mg) (Fig. 4.7).
Fig. 4.8 shows the recovery of XOS obtained from deproteinized bran SCW hydrolysate of the
filtration by 1 kDa membrane. In total, 81.07% of total XOS was recovered in the two collected
permeates (E and F) obtained by 1 kDa ultrafiltration with trace amounts left in the retentate F.
Singh et al. (2019) autohydrolyzed almond shell at (200°C, 5 min), followed by endo-xylanase
treatment (10 U, 36 h). They employed a dead-end (batch) ultrafiltration system using a stirred cell
with membrane with 1 kDa molecular weight cut-off at 6.8 bar to separate compounds with high
molecular weight such as enzymes by their rejection in the retentate fraction. They separated 96-
97% of the initial feed as permeate. Time was not reported in that study. The obtained permeate
had 90.18 and 95.69% of xylobiose and xylotriose. Monomers were also recovered in the permeate
with 92.42, 96.56 and 95.47% for xylose, glucose and arabinose, respectively. Higher recovery of

150
oligomers including xylobiose and xylotriose in the permeate in their study compared to this study
(55.85% recovery of total XOS in first permeate E) might have some reasons: i) they used higher
pressure (6.8 bar) compared to this study (1 bar), and ii) they separated 96-97% of the initial feed
as a permeate, in this study only 76% was removed in the first ultrafiltration process. Therefore,
higher pressure and higher permeate volume with respect to the initial feed volume, could be
effective and help to recover higher amount of XOS in the permeate obtained by ultrafiltration.
Fig. 4.5. (a) Ultrafiltration of XOS from deproteinized bran SCW hydrolysate and obtained
retentate and (b) permeates (E and F) obtained by 1 kDa membrane.
SCW hydrolysate (feed) Permeate E Permeate F
(a) (b)
Permeate
Retentate

151
(b)
(a)
(c)
6 8 10 14 16 18 20 40
6 8 10 14 16 18 20
6 8 10 16 18 20
X4 X3 X2 Xylose
Arabinose
X4 X3 X2
Xylose
Arabinose
X4 X3 X2
Xylose
Arabinose
Time (min)
Time (min)
Time (min)

152
Fig. 4.6. HPLC chromatograms showing xylobiose (X2), xylotriose (X3), xylotetraose (X4) and
arabinose obtained after the ultrafiltration process through 1 kDa membrane: (a) deproteinized bran SCW
hydrolysate; (b) permeate E; (c) retentate E; (d) permeate F; and (e) retentate F.
(d)
(e)
X4 X3 X2 Xylose Arabinose
Arabinose
6 8 10 16 18 20
6 8 10 14 16 18 20
Time (min)
Time (min)
153
Fig. 4.7. Mass balance after ultrafiltration of deproteinized bran SCW hydrolysate with 1 kDa
membrane.
Filtration by 1 kDa membrane
Retentate E
X4: 12.28, X3: 12.59, X2: 7.53
Total XOS: 32.94 mg
Permeate E
X4: 23.94, X3: 30.17, X2: 19.16
Total XOS: 73.28 mg
Permeate F
X4: 5.61, X3: 5.58, X2: 4.95
Total XOS: 16.15 mg
Retentate F
XOS: Trace
amount
Filtration by 1 kDa membrane
Deproteinized bran SCW hydrolysate
(180°C, 50 bar, 30 min)
X4: 47.13, X3: 49.14, X2: 34.74
Total XOS: 131.21 mg
Permeate G
XOS: Trace
amount
Retentate G
XOS: Trace
amount

154
Fig. 4.8. Recovery of XOS from deproteinized bran SCW hydrolysate using 1 kDa membrane.
Means within the same group of XOS with different letters are significantly different at p<0.05.
4.3.3. Xylooligosaccharides content after nanofiltration and activated carbon treatment of a
model system PreticXTM XOS + xylose solution
Nanofiltration and activated carbon adsorption were compared to remove xylose from the XOS in
the PreticXTM + xylose solution. Table 4.1 summarizes the XOS, and xylose contents, and the
XOS/xylose ratio. It presents the data for the starting 43 mL PreticXTM + xylose solution, permeate
and retentate HC, HT obtained after nanofiltration and the water and ethanol fractions A, B
obtained after activated carbon adsorption. After nanofiltration of the starting solution using TS-
80 (150 Da) and Cynder (150-300 Da) membranes, 10 mL permeate and 30 mL retentate were
obtained.
0
10
20
30
40
50
60
Permeate E Retentate E Permeate F Retentate F
Rec
over
y
(% i
nit
ial
tota
l X
OS
in
th
e fe
ed) Xylotetraose (X4)
Xylotriose (X3)
Xylobiose (X2)
Total XOS (X2+X3+X4)
a
c c a
b
c
a
a
b
b
c b
155
Fig. 4.9 shows the mass balance after nanofiltration and activated carbon adsorption of PreticXTM
XOS + xylose solution. After nanofiltration using TS-80 membrane total XOS and xylose contents
were obtained in the permeate HT (14.58 and 17.77 mg, respectively) and retentate HT (138.85
and 47.09 mg, respectively). The XOS/xylose ratio, which was determined as 2.23 for the feed
solution increased 1.31 times in the retentate to 2.94 and decreased to 0.82 in the permeate,
showing partial separation of xylose from XOS after filtration through the TS-80 membrane.
After nanofiltration using the Cynder membrane, 27.20 mg of total XOS and 18.20 mg xylose
were recovered in the permeate HC while 114.21 mg of total XOS and 37.68 mg xylose were
obtained in the retentate HC. Less recovery of XOS and xylose in the retentate fraction of Cynder
membrane was probably due to its larger pore size (150-300 Da) compared to the TS-80 membrane
(150 Da), which led to the higher flux of the solution passing through the Cynder membrane and
higher recovery of XOS and xylose in the permeate. The XOS/xylose ratio was determined as 3.03
in the retentate of Cynder membrane, which was not significantly different from the ratio in the
retentate of the TS80 membrane.
As a result of membrane processing with two different types of nanofilters, 63.21 and 76.85% of
total XOS were recovered in the retentate of Cynder and TS80 filters, respectively, with a similar
ratio of XOS/xylose.

156
Using the semi-continuous nanofiltration system with two different membranes was not effective
to separate xylose selectively from the total XOS in the retentate fraction. The ratio of XOS/xylose
increased from 2.23 only to 2.94 and 3.03 in the retentate of both membranes.
XOS was recovered with higher amounts in the retentate HT (138.85 mg) obtained after
nanofiltration through the TS-80 membrane, which had a smaller pore size (150 Da).
Another portion (43 mL) of the PreticXTM + xylose solution was treated with activated carbon
adsorption by the addition of 10 and 15 wt% activated carbon to the liquid. After ethanol (15%
and 30%) washing and distilled water washing (80 and 85 mL), ethanol and water fractions were
obtained, respectively.
As shown in Table 4.1, using 10% activated carbon, higher mass of total XOS (95.93 mg) was
eluted with 80 mL ethanol compared to 85 mL water elution that had only 19.87 mg of total XOS.
Xylose was more concentrated in the water fraction B (42.24 mg) compared to only 11.63 mg in
the ethanol fraction B. Because xylose had little interaction with activated carbon, showing less
adsorption on it, which was removed from the XOS-activated carbon complex by water washing.
However, XOS with DP 2-4 had stronger adsorption to activated carbon that were recovered by
ethanol elution (Pellerin et al., 1991; Zhu et al., 2006). Total XOS content with respect to the
xylose content in the ethanol fraction was 8.24, which was higher than this ratio in the two
retentates obtained by nanofiltration (2.94 for TS-80 membrane and 3.03 for Cynder membrane).

157
After addition of 15% activated carbon, the ethanol fraction had 76.72 and 11.81 mg total XOS
and xylose, respectively. However, 6.79 and 25.9 mg were determined in the water fraction A. The
ratio of XOS/xylose in the ethanol fraction increased to 6.49. Lower recovery of XOS in the
ethanol fraction A after treatment with 15% activated carbon was related to the loading of excess
carbon that provided more affinity for XOS, and therefore delayed their elution. A similar
behaviour was also reported in the literature by Chen et al. (2014), who obtained less amounts of
XOS using 20% activated carbon (28.2% recovery of initial XOS) compared to the 10% activated
carbon addition, where 40.2% was obtained by ethanol washing in three steps. They used 5, 30
and 50% ethanol to recover the adsorbed XOS on the activated carbon and collected separate
fractions.
In the retentates collected after the nanofiltration process, 63.21 and 76.85% of total XOS were
recovered by Cynder and TS-80 membranes, respectively, which were higher compared to the
recovery in the ethanol fraction B after 10% activated carbon adsorption (53.1%). This data
showed that higher amounts of XOS was lost after activated carbon adsorption treatment, because
19.87 mg XOS was separated during water washing. Moreover, the rest of XOS might be captured
inside the activated carbon powder and ethanol concentrations (15 and 30%) were not enough for
washing and liberate all the XOS adsorbed on the activated carbon.

158
These results showed that, the use of activated carbon adsorption method with 10% carbon loading
was better than the semi-continuous nanofiltration system, due to the higher ratio of XOS/xylose
in the obtained ethanol fraction B (8.24). Therefore, activated carbon adsorption with 10%
activated carbon loading was used in further experiments for the purification of the obtained
permeates (E and F) from ultrafiltration with 1 kDa membrane of deproteinized bran SCW
hydrolysate.

159
Fig. 4.9. Mass balance after: (a) nanofiltration, and (b) activated carbon adsorption of PreticXTM XOS + xylose solution
PreticXTM XOS + Xylose solution
X4: 33.85, X3: 69.61 and X2: 77.18 mg
Total XOS: 180.65 mg
Nanofiltration
Cynder membrane (150-300 Da) TS-80 membrane (150 Da)
Permeate HT
X4: 1.88, X3: 4.87, X2: 7.82
Total XOS: 17.77 mg
Retentate HT
X4: 24.07, X3: 49.87, X2: 64.89
Total XOS: 138.85 mg
Permeate HC
X4: 3.70, X3: 8.91, X2: 14.59
Total XOS: 27.20 mg
Retentate HC
X4: 21.03, X3: 43.94, X2: 49.23
Total XOS: 114.21 mg
(a)
(b)
Activated carbon adsorption
10% Activated carbon 15% Activated carbon
PreticXTM XOS + Xylose solution
X4: 33.85, X3: 69.61 and X2: 77.18 mg
Total XOS: 180.65mg
Ethanol fraction A
X4: 13.58, X3: 27.25, X2: 35.88
Total XOS: 76.72 mg
Water fraction A
X4: trace, X3: 3.85, X2: 2.9
Total XOS: 6.79 mg
Ethanol fraction B
X4: 18.90, X3: 36.31, X2: 40.71
Total XOS: 95.93 mg
Water fraction B
X4: trace, X3: 7.85, X2: 12.33
Total XOS: 19.87 mg

160
Mo
del sy
stem: P
reticXT
M X
OS
+ x
ylo
se solu
tion, p
ermeate an
d reten
tate HT
obtain
ed fro
m T
S-8
0 m
embran
e, perm
eate and
retentate H
C o
btain
ed fro
m C
yn
der m
embran
e, ethan
ol an
d w
ater fraction B
obtain
ed fro
m 1
0%
activated
carbo
n, eth
anol an
d
water fractio
n A
ob
tained
from
15%
activate
d carb
on.
Reten
tate H
C
Perm
eate H
C
Reten
tate H
T
Perm
eate H
T
Meth
od 2
: Nan
ofiltratio
n
Eth
an
ol A
Wa
ter A
Eth
an
ol B
Wa
ter B
Meth
od 1
: activated
carbon ad
sorp
tion
Feed
solu
tion
(Mo
del sy
stem
)
P
reticXT
M +
xylo
se
solu
tion
a
Fra
ction
Tab
le 4.1
. XO
S an
d x
ylo
se conten
ts of P
reticXT
M +
xylo
se solu
tion, th
e retentate an
d p
ermeate o
btain
ed after
mem
bran
e filtration, w
ater and eth
anol fractio
ns o
btain
ed after activ
ated carb
on ad
sorp
tion.
Tab
le 3. X
OS
and x
ylo
se conten
ts after nan
ofiltratio
n an
d activ
ated carb
on treatm
ent o
f XO
S an
d x
ylo
se solu
tion.
49.2
3±
2.7
3
14.5
9±
0.5
7
64.8
9±
0.9
8
7.8
2±
0.4
2
35.8
8±
0.3
2
2.9
3±
0.2
0
40.7
1±
2.1
7
12.3
3±
0.2
7
77.1
8±
0.3
0
Xy
lob
iose
(mg)
43.9
4±
0.5
3
8.9
1±
0.2
4
49.8
7±
0.6
4
4.8
7±
0.4
0
27.2
5±
0.7
6
3.8
5±
0.2
8
36.3
1±
1.2
4
7.8
5±
0.2
8
69.6
1±
0.8
4
Xylo
triose
(mg)
21.0
3±
0.7
7
3.7
0±
0.2
7
24.0
7±
1.2
7
1.8
8±
0.1
8
13.5
8±
0.4
8
Trace
18.9
0±
0.9
1
Trace
33.8
5±
0.0
6
Xylo
tetraose
(mg)
37.6
8±
0.5
7
18.2
0±
0.4
0
47.0
9±
1.1
3
17.7
7±
0.6
9
11.8
1±
0.1
6
25.9
4±
0.9
7
11.6
3±
0.9
4
42.2
4±
0.8
80.9
9±
0.3
0
Xylo
se
(mg)
114.2
1±
4.0
5
27.2
0±
1.0
8
138.8
5±
2.9
14.5
8±
1.0
76.7
2±
1.5
7
6.7
9±
0.0
8
95.9
3±
1.8
4
19.8
7±
0.4
8
180.6
5±
1.0
7
To
tal X
OS
(mg)
3.0
3
1.4
9
2.9
4
0.8
2
6.4
9
0.2
6
8.2
4
0.4
7
2.2
3
Ra
tio
(To
tal
XO
S/X
ylo
se)

161
4.3.4. Xylooligosaccharide and monomer contents after activated carbon treatment of
ultrafiltration permeates E and F obtained from deproteinized bran SCW hydrolysate
Table 4.2 shows the contents of xylobiose (X2), xylotriose (X3), xylotetraose (X4), total XOS,
arabinose and xylose of the starting permeate E and F (10 mL out of the total of 40 mL) (Fig. 4.7)
used for the activated carbon adsorption. After this process, XOS content, xylose and arabinose
were quantified in the water (20 mL) and ethanol fractions (12 mL) obtained and results are
presented on Table 4.2.
Fig. 4.11 illustrates the chromatograms related to the permeate E from ultrafiltration by 1 kDa
membrane obtained from deproteinized bran SCW hydrolysate, ethanol and water fractions C from
activated carbon adsorption (10%). After activated carbon treatment X2, X3, X4, xylose and
arabinose were detected in the ethanol fraction obtained. However, the intensity of the peaks
related to the monomers were reduced in this fraction.
Fig. 4.12 shows the mass balance after activated carbon adsorption of the ultrafiltration permeates
E and F obtained from deproteinized bran SCW hydrolysate. The starting feed permeate E had
4.14, 6.18, 4.38, 14.71, 8.69 and 4.28 mg of xylobiose, xylotriose, xylotetraose, total XOS,
arabinose and xylose, respectively. After separation of activated carbon, water washing was
performed to remove monomers (arabinose and xylose) and 20 mL water fraction C was obtained.
162
In this water fraction, trace amounts of X2 and X3 were found and X4 was not detected. Also, 2.36
and 4.44 mg xylose and arabinose were recovered.
After water washing, activated carbon was washed with ethanol 15 and 30% and ethanol fraction
was obtained. This step was used for the separation of XOS captured by activated carbon and
collection in the ethanol fraction C. This fraction had 2.15, 3.55, 1.95 and 7.66 mg X2, X3, X4 and
total XOS, respectively. Total XOS content with respect to the sum of xylose and arabinose
contents were 1.13 in the feed permeate E, which increased to 2.94 in the ethanol fraction C,
indicating the removal of monomers such as arabinose and xylose from the XOS solution. In the
ethanol fraction C, total XOS recovered was 52.10% (of initial XOS), which was higher than the
recovery of monomers (30.42 and 16.46% for xylose and arabinose, respectively). Most monomers
were present in the water fraction C with xylose (55.11±1.61%) and arabinose (51.15±1.99%)
recovery. Because monomers had less interaction with the activated carbon, they were removed
by 20 mL water elution before washing with ethanol. Also, decolorization of the permeate E
containing XOS occurred after activated carbon adsorption where the ethanol fraction C was
completely clear, without any color or precipitate (Fig 4.10). The permeate F obtained after
ultrafiltration of retentate E of deproteinized SCW hydrolysate, had 1.23, 1.51, 1.26, 2.62, 3.22
mg of X2, X3, X4, xylose and arabinose, respectively. This permeate was also treated by activated
carbon adsorption using the same methodology described for permeate E. In the ethanol fraction,
0.61, 1.37, 0.88 and 0.57 mg X2, X3, X4 and arabinose were detected. The ratio of total XOS to

163
the sum of arabinose and xylose also increased from 0.68 in the feed to 5.05 in the ethanol fraction
D, which was similar to the ethanol fraction obtained for permeate E.
Fig. 4.13 shows the overall scheme of sequential purification of deproteinized bran SCW
hydrolysate using ultrafiltration with 1 kDa membrane followed by 10% activated carbon
adsorption.
Chen et al. (2014) investigated the purification of xylooligosaccharides produced from Miscanthus
x giganteus after autohydrolysis at 180°C/20 min and 200°C/5 min using activated carbon
adsorption with 1%, 5%, 10% and 20% (w/v) of the hydrolysate volume, shaking at 100 rpm for
60 min. Ethanol elution was performed with concentrations of solutions of 5%, 30%, 50%, 70%
and 95% (v/v). They reported the highest XOS recovery of 47.9% (w/w) of initial XOS using 10%
(w/v) activated carbon, followed by 35.7% (w/w) of initial XOS using 20% (w/v) activated carbon,
which were close to the total XOS recovery in this study (52.10%) with 10% activated carbon use.
Chen et al. (2014) used ethanol washing in five steps with ethanol 5%, 30%, 50%, 70% and 95%
(v/v). In total, fractions obtained from 5 and 30% ethanol washing had most of X2, X3 and X4
with 8.2, 49.2 and 41.7% recovery, respectively. After washing with 50% ethanol, 8.1, 22.6 and
17% of the rest captured X2, X3 and X4 in the activated carbon, were eluted in the 50% ethanol
fraction.

164
Zhu et al. (2006) used activated carbon to recover xylooligosaccharides from corn stover and
corncob enzymatic hydrolysates, followed by ethanol elution with different concentrations of 15,
30 and 50%. They obtained the highest XOS recovery using 10% activated carbon loading with
34.5, 15.9 and 4.4% recovery by 15, 30 and 50% ethanol elution, respectively. In total 54.8% of
total XOS was recovered in all ethanol fractions obtained.
Activated carbon adsorption was also used for the purification of other oligosaccharides like
fructooligosaccharides (FOS) produced from enzymatic synthesis of sucrose 50% (w/v) at 50°C
for 41 h. The obtained hydrolysate (100 mL), composed of FOS, glucose, fructose and sucrose,
was mixed with 5 g of activated carbon, followed by elution with 15% (v/v) ethanol at 50°C. They
recovered 80% of the initial FOS, with separation of both fructose and glucose (95%) that led to
obtaining a final FOS solution with 92% purity that had only 5-7% sucrose (Kuhn and Filho, 2010).
(a) (b)
Activated carbon
adsorption
Fig. 4.10. (a) Color of the permeate E from deproteinized bran SCW hydrolysate
after ultrafiltration using 1 kDa membrane and (b) ethanol fraction C from
permeate E after activated carbon adsorption (10%).

165
Fig. 4.11. HPLC chromatograms of xylobiose (X2), xylotriose (X3), xylotetraose (X4), xylose
and arabinose obtained after activated carbon adsorption treatment. (a) permeate E from
ultrafiltration with1 kDa membrane; (b) ethanol fraction C from 10% activated carbon
adsorption; and (c) water fraction C from 10% activated carbon adsorption for 30 min.
(a)
X4 X3 X2 Xylose
Arabinose
(b) X4 X3 X2 Xylose
Arabinose
(c)
Arabinose Xylose
6 8 10 12 14 16 18 20 25 27 29 31 33 35 37 39 41
Time (min)
Time (min)
Time (min)
6 8 10 12 14 16 18 20 25 27 29 31 33 35 37 39 41
6 8 10 12 14 16 18 20 25 27 29 31 33 35 37 39 41

166
Fig. 4.12. Mass balance after activated carbon adsorption: (a) permeate E and (b) permeate F
obtained from ultrafiltration of deproteinized bran SCW hydrolysate.
Table 4.2. XOS, xylose and arabinose contents after activated carbon treatment (10%) of
permeates (E and F) obtained from deproteinized bran SCW hydrolysate.
ND: Not detected, A+X: Arabinose + xylose.
Fraction Xylobiose
(mg)
Xylotriose
(mg)
Xylotetraose
(mg)
Total XOS
(mg)
Arabinos
e
(mg)
Xylose
(mg)
Ratio
(XOS/
X+A)
Permeate
E 4.14±0.37 6.18±0.02 4.38±0.34 14.71±0.74 8.69±0.07 4.28±0.01 1.13
Water C Trace Trace ND Trace 4.44±0.17 2.36±0.06 -
Ethanol C 2.15±0.24 3.55±0.23 1.95±0.02 7.66± 0.01 1.30±0.15 1.30±0.04 2.94
Permeate
F 1.23± 0.03 1.51± 0.01 1.26± 0.04 4.01± 0.02 3.22±0.05 2.62± 0.02 0.68
Water D Trace ND ND Trace 0.78±0.01 ND -
Ethanol D 0.61±0.06 1.37±0.1 0.88± 0.00 2.88±0.04 0.57±0.02 ND 5.05
Permeate E
X4: 4.38, X3:6.18 and X2: 4.14
Total XOS: 14.71 mg
Ethanol fraction C
X4: 1.95, X3: 3.55, X2: 2.15
Total XOS: 7.66 mg
Water fraction C
XOS: Trace amount
Activated carbon adsorption (10%) Activated carbon adsorption (10%)
Permeate F
X4:1.26, X3:1.51 and X2: 1.23
Total XOS: 4.01 mg
Ethanol fraction D
X4: 0.88, X3: 1.37, X2: 0.61
Total XOS: 2.88 mg
Water fraction D
XOS: Trace amount
(a) (b)
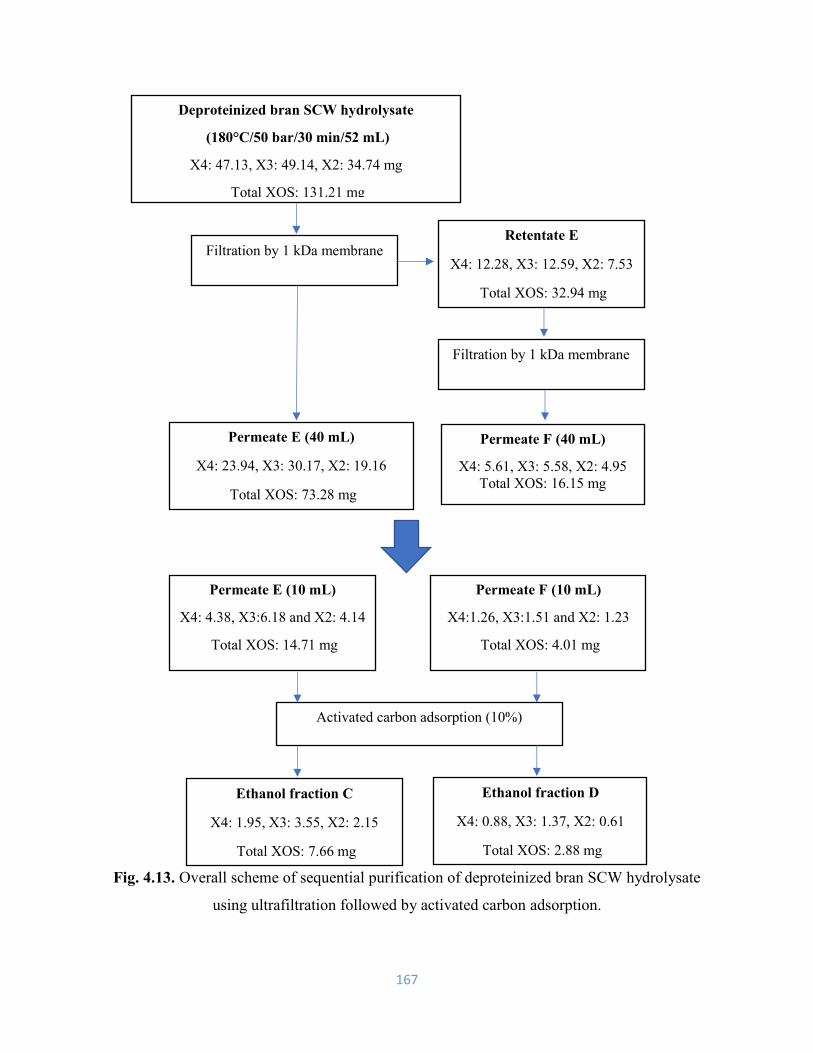
167
Fig. 4.13. Overall scheme of sequential purification of deproteinized bran SCW hydrolysate
using ultrafiltration followed by activated carbon adsorption.
Deproteinized bran SCW hydrolysate
(180°C/50 bar/30 min/52 mL)
X4: 47.13, X3: 49.14, X2: 34.74 mg
Total XOS: 131.21 mg
Filtration by 1 kDa membrane
Retentate E
X4: 12.28, X3: 12.59, X2: 7.53
Total XOS: 32.94 mg
Permeate E (40 mL)
X4: 23.94, X3: 30.17, X2: 19.16
Total XOS: 73.28 mg
Permeate F (40 mL)
X4: 5.61, X3: 5.58, X2: 4.95
Total XOS: 16.15 mg
Filtration by 1 kDa membrane
Activated carbon adsorption (10%)
Ethanol fraction C
X4: 1.95, X3: 3.55, X2: 2.15
Total XOS: 7.66 mg
Ethanol fraction D
X4: 0.88, X3: 1.37, X2: 0.61
Total XOS: 2.88 mg
Permeate E (10 mL)
X4: 4.38, X3:6.18 and X2: 4.14
Total XOS: 14.71 mg
Permeate F (10 mL)
X4:1.26, X3:1.51 and X2: 1.23
Total XOS: 4.01 mg

168
4.4. Conclusions
The SCW hydrolysates obtained at 180°C, 50 bar and 30 min from defatted-destarched bran and
deproteinized bran had the highest amount of XOS with a range of DP 2-6, which can have prebiotic
activity. However, impurities, such as compounds with high molecular weight derived from other
unhydrolyzed polysaccharides such as hemicellulose and lignin were also present in the mixture. Therefore,
further processing was needed to purify the XOS mixture and obtain a fraction with the desired molecular
weight.
First, ultrafiltration using membranes of 3 and 1 kDa at room temperature and 1 bar were used for the
purification of SCW hydrolysate obtained from defatted-destarched bran. Using the 3 kDa membrane,
45.63% of total XOS was recovered in the permeate B, while 52.80% was obtained in permeate A from 1
kDa membrane. Filtration was continued to recover the rest of XOS in retentate A of 1 kDa membrane for
two more times where 10.77% of XOS was collected in permeate C. After the third ultrafiltration step, trace
amounts of XOS were found in the permeate D and retentate D.
Ultrafiltration using the 1 kDa membrane was performed three times for the SCW hydrolysate of
deproteinized bran obtained at 180°C/15 bar/30 min, leading to 131.21 mg of total XOS. Separation of high
molecular weight compounds allowed to obtain 73.28 mg of total XOS in the permeate E, corresponding
to 55.85% recovery. In the second permeate F, 16.15 mg of total XOS, (12.32% recovery) was recovered.
In total, 68% of initial total XOS was recovered from permeates E and F.
PreticXTM XOS + xylose model solution was purified using nanofiltration and activated carbon adsorption.
Total XOS was recovered in the retentate of Cynder (63.21%) and TS80 filters (76.85%). In the final ethanol
169
fraction obtained after 10% activated carbon adsorption (ethanol fraction B), 53.1% of total XOS was
obtained. Ratio of XOS/xylose in the final ethanol fraction obtained after activated carbon adsorption (8.24)
was higher compared to the retentates after nanofiltration (2.94 for TS-80 and 3.03 for Cynder).
The permeates E and F, obtained after ultrafiltration with 1 kDa membrane of deproteinized bran SCW
hydrolysate, were treated by 10% activated carbon adsorption. Total XOS of 52.10%, including X2, X3
and X4 were recovered by 15 and 30% ethanol elution. In this fraction, arabinose and xylose were not
completely removed, but the proportion of XOS content with respect to the monomers content increased to
2.94 compared to the 1.13 for the feed.
In conclusion, ultrafiltration using membranes with molecular weight cutoffs of 3 and 1 kDa was evaluated
and results showed that it is feasible to design a purification sequence using 1 kDa membrane to purify
XOS with desired DP of 2-4 in the permeate fractions with the high molecular weight impurities remaining
in the retentate fractions. Further processing of permeate obtained after ultrafiltration using activated carbon
adsorption was effective to remove monomers (55% xylose and 51% arabinose) after 20 mL water elution.
XOS content with respect to the monomers content increased in the ethanol fraction obtained (2.94), which
showed higher recovery of XOS compared to monomers.

170
Chapter 5: Conclusions and recommendations
5.1. Conclusions
Barley bran is rich in lipid, protein and non-starch polysaccharides, mainly arabinoxylan and beta-
glucan. Barley bran is a suitable abundant by-product for the production of high value added
xylooligosaccharides (XOS) with prebiotic potential in high demand as a functional food
ingredient. Removal of lipid, starch and protein leads to the enrichment of arabinoxylan for further
hydrolysis to obtain XOS rich extracts with less impurities. Lipid extraction using supercritical
CO2 as an environmentally friendly process avoids the use of chemical solvents.
The use of enzymatic hydrolysis mainly endo-xylanase is a conventional technique to obtain XOS.
But it is time consuming and needs different pre-treatments such as alkaline extraction or steam
explosion to obtain a pure xylan, which makes it more accessible for the enzyme activity. As an
alternative, subcritical water (SCW) treatment is a quick technique, using water at high
temperatures of 100-374°C and pressure to maintain it in the liquid state.
In this thesis research, barley bran with 9.4% lipid content was investigated for the possibility of
XOS production using a sequential SC-CO2, and SCW processing followed by further purification
using ultrafiltration and activated carbon adsorption. For this purpose, lipid extraction using SC-
CO2 was performed at different conditions of 200 bar/40°C, 300 bar/40°C and 300 bar/70°C for
30, 60, 90 and 120 min within a 10 mL vessel. Both temperature and pressure had significant effect
171
on the yield of lipid extracted and the optimum condition was 300 bar/70°C, at which 94.27% of
the initial lipid was extracted in 30 min. Using a bigger scale (300 mL) extraction vessel, scale up
was studied and after 4 h extraction at the same solvent-to-feed ratio of 15.7, the lipid recovery
was 92%. Using higher flowrates, the same lipid recovery can be obtained at shorter time. For
example, with a flow rate of 2.4 L/min at ambient condition, (CO2 density at ambient condition is
0.00178 g/mL, NIST Chemistry WebBook), 640.8 g of CO2 is used after 2.5 h extraction and the
same lipid recovery (92%) could be obtained if lipid has the same solubility.
After lipid extraction, defatted bran with 0.35% lipid, 12% starch and 17.9% arabinoxylan was
used for starch removal using an enzymatic approach with a combination of heat stable alpha-
amylase and amyloglucosidase, targeting starch hydrolysis and further precipitation of non-starch
polysaccharides with ethanol. This process was effective to reduce the starch content in the final
destarched bran to 1%, meanwhile enrichment of arabinoxylan to 26.3% was obtained. SCW was
then used to study the process parameters such as temperature (120-200ºC) and time (15-60 min)
with constant pressure of 50 bar and flow rate of 5 mL/min for the hydrolysis of destarched bran
to obtain XOS in the liquid extracts. Reducing sugar yield increased with elevated temperature
from 120 (1%) to 180ºC (10%), indicating the hydrolysis of polysaccharides and formation of
smaller compounds with reducing ends due to water auto-ionization and releasing of hydronium
ions. The maximum reducing sugar yield of 10% g xylose equivalent/g bran was achieved at
180ºC/30 min.
172
Temperature had a significant effect on the production of XOS. At lower temperatures of 120 and
140ºC XOS (DP 2-4) was not detected and liquid extracts had high molecular weight polymers.
Generation of XOS started at 160ºC within 30 min residence time, where 12.5 mg of xylotetraose
(DP4) was obtained. At the optimal condition of 180ºC xylobiose (DP2), xylotriose (DP3) and
xylotetraose (DP4) were identified. Extraction time was also effective, so that xylobiose content
obtained increased from 8 to 40 and 11.2 mg after 15, 30 and 60 min. Xylotriose content increased
from 14.9 to 46.1 and 55.4 mg after 15, 30 and 60 min. For xylotetraose, 7.7, 26.2 and 46.7 mg
were obtained after 15, 30 and 60 min. It was demonstrated that by increasing time from 15 to 30
min production of all three types of XOS improved. After 60 min extraction, the contents of X4
and X3 increased, while X2 content reduced due to the possibility of shorter oligomers production
such as xylobiose at the beginning of the semi-continuous hydrolysis by liberation of acetic acid
from acetylated hemicellulose, followed by breaking of non-acetylated hemicelluloses and
production of longer oligomers by further hydrolysis in longer reaction time (30-60 min).
For the extracts obtained at 200ºC, reduction of XOS was observed by detecting only trace amounts
of X4, X3 and X2, that was confirmed by decreasing the yield of reducing sugars to 4.11, 8.39 and
9.7% for 15, 30 and 60 min, respectively. Within 15 min, generation of degradation products,
including acetic acid (10.83 mg) and lactic acid (70.32 mg) probably was responsible for the
reduction of reducing sugars and XOS at 200ºC.

173
Destarched bran with 31.2% protein was treated using NaOH solution, that led to the reduction of
protein to 4.62% and increased arabinoxylan concentration to 42.24% db in the final dried
deproteinized bran.
Enzymatic hydrolysis of deproteinized bran was performed using endo beta-xylanase with two
enzyme concentrations of 2.5 and 10 U and four reaction times (1, 4, 8 and 16 h) at a constant
temperature of 40ºC and pH of 4.5. Maximum amount of total XOS (21.11 mg) was produced
using 10 U of enzyme after 4 h hydrolysis, and no significant change was observed after 8 and 16
h incubation.
To compare SCW and enzymatic hydrolysis, deproteinized bran was also used for the SCW
hydrolysis at 180ºC, 30 min, 5 mL/min and 50 bar, which was the best condition to obtain the
highest amount of XOS from destarched bran. As a result, 100.9, 120.6, 112.4 and 334 mg of X2,
X3, X4 and total XOS were obtained, respectively, which were higher than the maximum amount
of XOS (21.11 mg) produced by the enzymatic hydrolysis. The reason why SCW produced more
XOS was related to its ability to break down the side chains of xylan like arabinose with release
of 102.8 ± 6.55 mg of this monomer in the liquid extract, while in the enzymatic hydrolysates,
arabinose was not detected. Separation of theses side groups makes the xylan backbone more
accessible for SCW hydrolysis leading to more XOS.

174
Purification of the SCW hydrolysates obtained at 180ºC/50 bar/30 min was necessary to remove
high molecular weight compounds and monomers, targeting recovery of X2, X3 and X4. For this
purpose, ultrafiltration with 3 and 1 kDa molecular weight cutoff membranes were used to remove
high molecular weight compounds such as unhydrolyzed polysaccharides from SCW hydrolysate
(180/30 min/50 bar/5 mL/min) from destarched bran. The peak related to the high molecular
weight compounds disappeared in the final permeates (A and B) obtained using both membranes,
but the recovery of total XOS was more in the permeate A obtained after passing through the 1
kDa membrane. SCW hydrolysate obtained from deproteinized bran, which had the highest
amount of XOS was filtered using 1 kDa membrane, led to the recovery of 55.85 and 12.32% of
total XOS in the permeate E and F, respectively. Permeates E and F were treated with activated
carbon for the adsorption of XOS and elution with ethanol. Monomers (arabinose and xylose) that
had less adsorption on the activated carbon were removed using elution with water. After activated
carbon treatment of permeate E, ethanol fraction C had 52.1% of XOS (of initial XOS), 30.42%
of xylose and 16.46% of arabinose. Also, the ratio of XOS with respect to the amount of monomers
(arabinose + xylose) increased to 2.94 in the ethanol fraction C compared to the ratio in the initial
feed permeate E of 1.13, indicating partial separation of monomers from XOS.
Overall, throughout the research presented in this thesis, the findings are promising for the
utilization of barley bran to obtain high value-added products, including lipids, protein and fiber
rich fractions. Extracted lipid, rich in tocols and phytosterols, is a suitable ingredient for the

175
functional foods. Isolated protein is an important ingredient in the food industry with emulsifying
and foaming properties. XOS as a low calorie sweetener with prebiotic effect can be obtained from
fiber rich fraction by SCW processing, which is an effective green technology. Membrane filtration
is a promising technique to purify XOS with a desirable DP range for utilization as a prebiotic in
the food industry.
5.2 Recommendations and future work
Some recommendations to advance this research are:
• Identification of XOS substituents attached to the sugar chains, such as acetyl groups,
arabinose and glucose can be performed using electrospray tandem mass spectrometry
(ESI-MS) or proton nuclear magnetic resonance (1H-NMR).
• Quantification of solubilized lignin in the SCW extracts is recommended to better
understand hydrolysate composition.
• Ultrafiltration was performed only at a pressure of 1 bar, which was not sufficient to
recover more than 50% of XOS in the first permeate. Therefore, increasing pressure up to
4 bar might be effective to obtain a higher content of XOS in the first permeate, avoiding
the use of one more ultrafiltration process to recover more XOS in the second permeate.
Because permeate flux increases with elevating pressure, this might help to recover more
XOS in the first permeate.

176
• Nanofiltration using a dead-end system with a continuous stirring could be more effective
to purify the XOS mixture from monomers because accumulation of the materials on the
surface of the membrane decreases the permeate flux due to clogging. Continuous stirring
prevents clogging and might improve the filtration efficiency.
• To use XOS in various applications, the final XOS should be dried by spray and freeze
drying.
• The final purified XOS mixture should be investigated in terms of its prebiotic effect in
vitro and in vivo. An in vitro study can be performed using gastrointestinal microbiota
inoculation with a XOS solution and production of metabolites such as acetic, butyric and
propionic acids could indicate its prebiotic efficacy. In vivo studies could be first carried
out with rodents, and finally based on these results used for human consumption.

177
References
Aachary, A.A and Prapulla, S.G. (2011). Xylooligosaccharides (XOS) as an emerging prebiotic: microbial
synthesis, utilization, structural characterization, bioactive properties, and applications. Comprehensive
Reviews in Food Science and Food Safety, 10: 2-16.
Abaide, E.R., Ugalde, G., Luccio, M.D., Moreira, R.D. F.P.M., Tres, M.V., Zabot, G.L., Mazutti, M.A.
(2019). Obtaining fermentable sugars and bioproducts from rice husks by subcritical water hydrolysis in a
semi-continuous mode. Bioresource Technology, 272: 510-520.
Abdelmoez, W., Nage, S.M., Bastawess, A., Ihab, A., Yoshida, H. (2014). Subcritical water technology for
wheat straw hydrolysis to produce value added products. Journal of Cleaner Production, 70: 68-77.
Aguedo, M., Vanderghem, C., Goffin, D., Richel, A., Paquot, M. (2013). Fast and high yield recovery of
arabinose from destarched wheat bran, Industrial Crops and Products, 43: 318-325.
Akpinar, O., Ak, O., Kavas, A., Bakir, U., Yilma, L. (2007). Enzymatic production of xylooligosaccharides
from cotton stalks. Journal of Agricultural and Food Chemistry, 55: 5544–5551.
Akpinar, O., Erdogan, K. and Bostanci, S. (2009). Enzymatic production of Xylooligosaccharide from
selected agricultural wastes. Food and Bioproducts Processing, 87: 145-151.
Alonso, E. (2018). The role of supercritical fluids in the fractionation pretreatments of a wheat bran-based
biorefinery. The Journal of Supercritical Fluids, 133: 603–614.
Alonso, J. L., Dominguez, H., Garrote, G., Parajo, J. C., Vazquez, M.J. (2003). Xylooligosaccharides:
properties and production technologies. Journal of Agricultural and Food Chemistry, 2. 230-232.
Alvarez, V.H., Cahyadi, J., Xu, D., Saldana, M.D.A. (2014). Optimization of phytochemicals production
from potato peel using subcritical water: Experimental and dynamic modeling. The Journal of Supercritical
Fluids, 90: 8-17.
Andersson, A., Lampi, M., Nystrom, L., Piironen, V., Li, L., Ward, J., (2008). Phytochemical and dietary
fibre components in barley varieties in the health grain diversity screen. Journal of Agricultural and Food
Chemistry, 56: 9767–9776.
Anwar, Z., Gulfraz, M., Irshad, M. (2014). Agro-industrial lignocellulosic biomass a key to unlock the
future bio-energy: a brief review. Journal of Radiation Research and Applied Sciences, 7: 163–173.
Baik, B.K. and Ullrich, S.E. (2008). Barley for food: characteristics, improvement, and renewed interest.
Journal of Cereal Science, 48: 233–242.
Bajpai, P. (2016). Structure of lignocellulosic biomass, Pretreatment of Lignocellulosic Biomass for Biofuel
Production. Springer, Singapore,7–12.
Bansal, R. C. and Goyal, M. (2005). Activated carbon adsorption. CRC press. 1-58.
Barreteau, H., Delattre, C., Michaud, P. (2006). Production of oligosaccharides as promising new food
additive generation, Food Technology and Biotechnology, 44: 323–333.

178
Benito-Román, O., Alonso, E., Gairola, K., Cocero, M.J. (2013). Fixed-bed extraction of β-glucan from
cereals by means of pressurized hot water. The Journal of Supercritical Fluids, 82: 122-128.
Bhatty, R.S. (1993). Nonmalting uses of barley. In: MacGregor, A.W., Bhatty, R.S. (Eds.), Barley:
Chemistry and Technology. American Association of Cereal Chemists, St. Paul, MN, 355–417.
Bhatty, R.S. (1997). Milling of regular and waxy starch hull-less barleys for the production of bran and
flour. Cereal Chemistry, 74: 693–699.
Bhatty, R.S. and Rossnagel, B.G. (1998). Comparison of pearled and unpearled Canadian and Japanese
barleys. Cereal Chemistry, 75: 15-21.
Bozan, B. and Temelli, F. (2002). Supercritical CO2 Extraction of Flaxseed. Journal of the American Oil
Chemists' Society, 79: 231–235.
Brienzo, M., Carvalho, W., Milagres, A.M.F. (2010). Xylooligosaccharides Production from Alkali-
Pretreated Sugarcane Bagasse Using Xylanases from Thermoascus aurantiacus. Applied Biochemistry and
Biotechnology, 162:1195–1205.
Broekaert, W.F., Courtin, C.M., Verbeke, K., Wiele, T.V.D., Verstraete, W., Delcour, J.A. (2011). Prebiotic
and other health-related effects of cereal-derived arabinoxylans, arabinoxylan-oligosaccharides, and
xylooligosaccharides. Critical Reviews in Food Science and Nutrition, 51: 178–94.
Brooks, S.P.J., Ratnayake, W.M.N., Lampi, B.J., Hollywood, R. (1998). Measuring total lipid content in
rat carcasses: a comparison of commonly employed extraction methods. Journal of Agricultural and Food
Chemistry, 46: 4214–4217.
Brunner, G. (2014). Properties of Pure Water. Hydrothermal and supercritical water processes, 9-93.
Cabeza, A., Piqueras, C.M. Sobrón, F., García-Serna, J. (2016). Modeling of biomass fractionation in a lab-
scale biorefinery: solubilization of hemicellulose and cellulose from holm oak wood using subcritical water,
Bioresoure Technology. 200: 90–102.
Calabro, V. and Basile, A. (2011). Fundamental membrane processes science and engineering. In advanced
membrane science and technology for sustainable energy and environmental applications. Basile, A. and
Nunes, S.P. (eds), Woodhead Publishing: Cambridge, UK and Italy, 3–18.
Cano, A., and Palet, C. (2007). Xylooligosaccharide recovery from agricultural biomass waste treatment
with enzymatic polymeric membranes and characterization of products with MALDI-TOF-MS. Journal of
Membrane Science, 29: 96–105.
Cantero, D.A., Martínez, C., Bermejo, M.D., Cocero, M.J. (2015). Simultaneous and selective recovery of
cellulose and hemicellulose fractions from wheat bran by supercritical water hydrolysis. Green Chemistry,
17: 610–618.
Cara, C., Ruiz, E., Carvalheiro, F., Moura, P., Ballesteros, I., Castro, E., Gírio, F. (2012). Production,
purification and characterisation of oligosaccharides from olive tree pruning autohydrolysis. Industrial
Crops and Products, 40: 225-231.

179
Carvalheiro, F., Duarte, L.C. and Gírio, F.M. (2008). Hemicellulose biorefineries:
A review on biomass pretreatments. Journal of Scientific and Industrial Research,
67:849-864.
Carvalheiro, F., Esteves, M.P. Parajo, J.C., Pereira, H., Girio, F.M. (2004). Production of oligosaccharides
by autohydrolysis of brewery’s spent grain. Bioresource Technology, 91: 93-100.
Cazetta, M.L., Martins, P.M.M., Monti, R., Contiero, J. (2005) Yacon (Polymnia sanchifolia) extract as a
substrate to produce inulinase by Kluyveromyces marxianus var. bulgaricus, Journal of Food Engineering,
66: 301-305.
Chapla, D., Pandit, P., Shah, A. (2012). Production of xylooligosaccharides from corncob xylan by fungal
xylanase and their utilization by probiotics. Bioresource Technology, 115: 215–221.
Charalampopoulos, D., Wang, R., Pandiella, S.S., Webb, C. (2002). Application of cereals and cereal
components in functional foods: A review. International Journal of Food Microbiology, 79: 131–141.
Chatterjee, S.R. and Abrol, Y.P. (1977). Protein quality evaluation of popped barley grains (Sattu). Journal
of Food Science and Technology, 14: 247–250.
Chen, M.H., Bowman, M.J., Cotta, M.A., Dien, B.S., Iten, L.B., Whitehead, T.R., Rausch, K.D.,
Tumbleson, M.E., Singh, V. (2016). Miscanthus×giganteus xylooligosaccharides: Purification and
fermentation. Carbohydrate Polymers, 140: 96-103.
Chen, M.H., Bowman, M.J. Dien, B.S. Rausch, K.D. Tumbleson, M.E. Singh, V. (2014). Autohydrolysis
of Miscanthus x giganteus for the production of xylooligosaccharides (XOS): Kinetics, characterization and
recovery. Bioresource Technology, 155: 359-365.
Chen, X., Li, H., Sun, S., Cao, X., Sun, R. (2017). Co-production of oligosaccharides and fermentable sugar
from wheat straw by hydrothermal pretreatment combined with alkaline ethanol extraction. Industrial
Crops & Products, 111: 78-85.
Ciftci, D. and Saldaña, M.D.A. (2015). Hydrolysis of sweet blue lupin hull using subcritical water
technology. Bioresource Technology, 194: 75-82.
Cocero, M.J., Cabeza, A., Abad, N., Adamovic, T., Vaquerizo, L., Martínez, C.M., Pazo-Cepeda, M.V.
(2018). Understanding biomass fractionation in subcritical and supercritical water, The Journal of
Supercritical Fluids, 133: 550-565.
Courtin, C.M., Roelants, A., Delcour, J.A. (1999). Fractionation– reconstitution experiments provide
insight into the role of endoxylanases in bread-making. Journal of Agricultural and Food Chemistry, 47:
1870-1877.
Crittenden, R.G., and Playne, M.J. (1996). Production, properties and applications of food-grade
oligosaccharides. Trends in Food Science & Technology, 7: 353–361.
Cruz, J.M., Dominguez, J.M., Dominguez, H., Parajo, J.C. (1999). Solvent extraction of hemicellulosic
wood hydrolysates: a procedure useful for obtaining both detoxified fermentation media and polyphenols
with antioxidant activity. Food Chemistry. 67: 147–153.

180
Cruz, J.M., Dominguez, J.M., Dominguez, H., Parajo, J.C. (2001). Antioxidant and antimicrobial effects of
extracts from hydrolyzates of lignocellulosic materials. Journal of Agricultural and Food Chemistry, 49:
2459–2464.
Curren, M.S.S. and King, J.W. (2001). Solubility of triazine pesticides in pure and modified subcritical
water. Analytical Chemistry, 73:740-745.
Czermak, P., Ebrahimi, M., Grau, K., Netz, S., Sawatzki, G., Pfromm, P.H. (2004). Membrane-assisted
enzymatic production of galactosyl-oligosaccharides from lactose in a continuous process, Journal of
membrane science, 232: 85–91.
Czuchajowska, Z., Klamczynski, A., Paszczynska, B., Baik, B.K. (1998). Structure and functionality of
barley starches. Cereal Chemistry, 75: 747–754.
Devittori, C., Gumy, D., Kusy, A., Colarow, L., Bertoli, C., Lambelet, P. (2000). Supercritical fluid
extraction of oil from millet bran. Journal of the American Oil Chemists' Society, 77: 573–579.
Drioli, E. (2004). Membrane reactors. Chemical Engineering and Processing, 43: 1101–1102.
Dron, A., Guyer, D.E., Gage, D.A., Lira, C.T. (1997). Yield and quality of onion flavor oil obtained by
supercritical fluid extraction and other methods. Journal of Food Process Engineering, 20: 107–123
Dunford, N.T. and Temelli, F. (1997). Extraction conditions and moisture content of canola flakes as related
to lipid composition of supercritical CO2 Extracts. Journal of food Science, 62: 155-159.
Dunford, N.T., Teel, J.A., King, J.W. (2003). A continuous counter current supercritical fluid
deacidification process for phytosterol ester fortification in rice bran oil. Food Research International, 36:
175–181.
Ebringerova, A. (2005). Structural diversity and application potential of hemicelluloses. Macromolecular
Symposium, 232: 1-12.
Ebringerová, A., Hromádková, Z., Alfödi, J., Hríbalová, V. (1998). The immunologically active xylan from
ultrasound-treated corn cobs: extractability, structure and properties. Carbohydrate Polymers., 37: 231–
239.
Ebringerova, A. and Heinze, T. (2000). Xylan and xylan derivatives–biopolymers with valuable properties,
1. Naturally occurring xylans structures, isolation procedures and properties. Macromolecular Rapid
Communications, 21: 542–556.
Ebringerova, A., Hromadkova, Z., Heinze, T. (2005). Hemicellulose. In: Heinze, T. (ed) Polysaccharides I:
structure, characterization and use. Springer, Heidelberg, 1–67.
Eden, J., Kasica, J., Walsh, L., Rutenberg, M.W., Lacourse, N., Solarek, D. and Koubek, T.G. (1998).
Purification of polysaccharides, USA patent US 5756721.
Egüés, I., Stepan, A.M., Eceiza, A., Toriz, G., Gatenholm, P., Labidi, J. (2014). Corncob arabinoxylan for
new materials. Carbohydrate Polymers, 102: 12–20.
Evers, T. and Millar S. (2002). Cereal grain structure and development: some implications for quality.
Journal of Cereal Science, 36: 261–284.

181
Falck, P., Aronsson, A., Grey, C., Stålbrand, H., Nordberg, K.E., Adlercreutz, P. (2014). Production of
arabinoxylan-oligosaccharide mixtures of varying composition from rye bran by a combination of process
conditions and type of xylanase. Bioresource Technology, 174: 118–125.
Faryar, R., Linares-Pastén, J.A., Immerzeel, P., Mamo, G., Andersson, M., Stalbrand, H., Mattiassona, B.,
Karlsson, E.N. (2015). Production of prebiotic xylo-oligosaccharides from alkaline extracted wheat straw
using the K80R-variant of a thermostable alkali-tolerantxylanase. Food and Bioproducts Processing, 93:
1–10.
Fastnaught, C.E. (2001). Barley fibre. In: Cho, S., Dreher, M. (Eds.), Handbook of Dietary Fibre. Marcel
Dekker, New York, 519–542.
Fattori, M., Bulley, N.R., and Meisen, A. (1988). Carbon dioxide extraction of canola seed: oil solubility
and effect of seed treatment. Journal of the American Oil Chemists' Society, 65: 968–974.
Fincher, G.B. (1976). Ferulic acid in barley cell walls, a fluorescence study. Journal of the institute of
brewing, 82: 347-349.
Fincher, G.B. and Stone, B.A. (1986). Cell walls and their components in cereal grain technology. Advances
in Cereal Science and Technology, 8: 207–295.
Fooks, L.J. and Gibson, G.R. (2002). In vitro investigations of the effect of probiotics and prebiotics on
selected human intestinal pathogens. FEMS Microbiology Ecology, 39: 67–75.
Gallina, G., Cabeza, A., Biasi, P., García-Serna, J. (2016). Optimal conditions for hemicelluloses extraction
from Eucalyptus globulus wood: hydrothermal treatment in a semi-continuous reactor, Fuel Processing
Technology. 148: 350–360.
Gallina, G., Biasi, P., Piqueras, C.M. Garcia-Serna, J. (2017). Processing of lignocellulosic biomass derived
monomers using high-pressure CO2 and CO2-H2O mixtures, in: high pressure technologies in biomass
conversion. The Royal Society of Chemistry, 115–136.
Gallina, G., Cabeza, A., Grénman, H., Biasi, P., García-Serna, J., Salmi., T. (2018). Hemicellulose
extraction by hot pressurized water pretreatment at 160 ºC for 10 different woods: Yield and molecular
weight, The Journal of Supercritical Fluids, 133: 716 -725.
Garrote, G., Dominguez, H., Parajo, J.C. (1999). Hydrothermal processing of lignocellulosic materials.
Holz als Roh- und Werkstoff, 57:191–202.
Garrote, G., Falque, E., Dominguez, H., Parajo, J.C. (2007). Autohydrolysis of agricultural residues: study
of reaction byproducts. Bioresoure Technolology, 98: 1951–1957.
Garrote, G., Dominguez, H., J.C. Parajó, J.C. (2001). Generation of xylose solutions from Eucalyptus
globulus wood by autohydrolysis–posthydrolysis processes: posthydrolysis kinetics. Bioresource
Technology, 79: 155–164.
Gomez, J., Pazos, M., Couto, S.R., Sanromán, M.A. (2005). Chestnut shell and barley bran as potential
substrates for laccase production by Coriolopsis rigida under solid-state conditions. Journal of Food
Engineering, 68: 315–319.

182
Gong, L., Jin, C., Wu, X., Zhang, Y. (2012). Determination of arabinoxylans in Tibetan Hull-less barley
bran. Procedia Engineering, 37: 218 – 222.
Goulas, A.K., Grandison, A.S., Rastall, R.A. (2003). Fractionation of oligosaccharides by nanofiltration.
Journal of the Science of Food and Agriculture, 83:675–680.
Grootaert, C., Delcour, J.A., Courtin, C.M., Broekaert, W. F., Verstraete, W., de Wiele, T.V. (2007).
Microbial metabolism and prebiotic potency of arabinoxylan oligosaccharides in the human intestine.
Trends in Food Science and Technology, 18: 64–71.
Gullon, P., Gullon, B., Gonzalez-Munoz, M.J., Alonso, J.L. Parajo, J.C. (2014). Production and bioactivity
of oligosaccharides from biomass hemicelluloses. In: Moreno, F.J., Sanz, M.L. Food Oligosaccharides:
production, analysis and bioactivity, 1st ed. Wiley, Philadelphia, 88–106.
Gullon, P., Pereiro, G., Alonso, J.L. and Parajo, J.C. (2009). Aqueous pretreatment of agricultural wastes:
characterization of soluble reaction products. Bioresource Technology, 100: 5840–5845.
Gullon, P., Moura, P., Esteves, M.P., Girio, F.M. Dominguez, H., Parajo, J.C. (2011). Assessment on the
fermentability of xylooligosaccharides from rice husks by probiotic bacteria. Journal of Agricultural and
Food Chemistry, 56:7482–7487.
Gullon, P., Gonzalez-Munoz, M.J., Gool, M.P.V., Henk, Schols, H.A., Hirsch, J., Ebringerová, A., Parajo,
J.C. (2010). Production, refining, structural characterization and fermentability of rice husk
xylooligosaccharides. Journal of Agricultural and Food Chemistry: 58: 3632-3641.
Guo, R., Xu, Z., Wu, S., Li, X., Li, J., Hu, H., Wu, Y., Ai, L. (2019). Molecular properties and structural
characterization of an alkaline extractable arabinoxylan from hull-less barley bran. Carbohydrate Polymers,
218: 250–260.
Wu, Y., Ai., L. R., Xu, Z., Wu, S., Li, X., Li, J., Hu, H., (2019). Molecular properties and structural
characterization of an alkaline extractable arabinoxylan from hull-less barley bran. Carbohydrate Polymers.
218: 250–260.
Hao, X., Wen, P., Wang, J., Wang, J., You, J., Zhang, J. (2019). Production of xylooligosaccharides and
monosaccharides from hydrogen peroxide-acetic acid-pretreated poplar by two-step enzymatic hydrolysis.
Bioresource Technology, 1-6.
Henning, J.A., Core, R.J., Gardea-Torresdey, J.L. (1994). Extracting volatile compounds from single plants
using supercritical fluid extraction. Crop Science, 34: 1120–1122.
Hoije, A., Gröndahl, M., Tommeraas, K., Gatenholm, P. (2005). Isolation and characterization of
physicochemical and material properties of arabinoxylans from barley husks. Carbohydrate Polymers, 61:
266–275.
Holck, J., Hjerno, K., Lorentzen, A., Vigsnæs, L.K., Hemmingsen, L., Licht, T.R., Mikkelsen, J.D. Meyer,
A.S. (2011). Tailored enzymatic production of oligosaccharides from sugar beet pectin and evidence of
differential effects of a single DP chain length difference on human faecal microbiota composition after in
vitro fermentation. Process Biochemistry, 46: 1039-1049.

183
Iwasaki, K., Matsubara, Y. (2000). Purification of pectic oligosaccharides showing root-growth-promoting
activity in lettuce using ultrafiltration and nanofiltration membranes. Journal of Bioscience and
Bioengineering, 89:495–497.
Izydorczyk, M.S. and Biliaderis, C.G. (1995). Cereal arabinoxylans: advances in structure and
physicochemical properties. Carbohydrate Polymers, 28: 33–48.
Izydorczyk, M. S. and Dexter, J. E. (2008). Barley β-glucans and Arabinoxylans: Molecular Structure,
Physicochemical Properties, and Uses in Food Products–A Review. Food Research International, 41: 850–
868.
Izydorczyk, M.S., Jacobs, M., Dexter, J.E. (2003). Distribution and Structural Variation of Nonstarch
Polysaccharides in Milling Fractions of Hull-less Barley with Variable Amylose Content. Cereal
Chemistry, 80: 645–653.
Izydorczyk, M.S., Macri, L.J., MacGregor, A.W. (1998). Structure and physicochemical properties of
barley non-starch polysaccharides I. Water-extractable β-glucans and arabinoxylans. Carbohydrate
Polymers, 35: 249-258.
Izydorczyk, M.S., Storsley, J., Labossiere, D., MacGregor, A.W., Rossnagel, B.G. (2000). Variation in total
and soluble b-glucan content in hulless barley: effects of thermal, physical, and enzymic treatments. Journal
of Agricultural and Food Chemistry, 48: 982–989.
Jacobsen, S.E. and Wyman, C.E. (2002). Xylose monomer and oligomer yields for uncatalyzed hydrolysis
of sugarcane bagasse hemicellulose at varying solids concentration. Industrial & Engineering Chemistry
Research, 41: 1454-1461.
Jadhav, S., Lutz, S., Ghorpade, V., Salunkhe, D. (1998). Barley: chemistry and value- added processing.
Critical Reviews in Food Science and Nutrition, 38: 123-171.
Jankowska, H., Swiątkowski, A., Choma, J. (1991). Active carbon. Ellis Horwood Ltd.
Jayapal, N., Samanta, A.K., Kolte, A.P., Senani, S., Sridhar, M., Suresh, K.P., Sampath, K.T. (2013). Value
addition to sugarcane bagasse: Xylan extraction and its process optimization for xylooligosaccharides
production. Industrial Crops and Products, 42: 14– 24.
Jeon, Y., Kim, S. (1998). Production of chitooligosaccharides using an ultrafiltration membrane reactor and
their antibacterial activity. Carbohydrate Polymers, 41:133–41.
Jung, G.W., Kang, H.M., Chun, B.S. (2012). Characterization of wheat bran oil obtained by supercritical
carbon dioxide and hexane extraction, Journal of Industrial and Engineering Chemistry, 18: 360–363.
Kanlins, R. (2017). Production of prebiotic rich extracts from lignocellulosic biomass using subcritical
water within the context of biorefining. Ph.D. dissertation at the University of Birmingham,106-111.
Kanatani, H., Kimura, Y., Asanoma, M., Nakamura, A., Hirotsuka, M., Adachi, S. (2012). Absorption of
the Indigestible Disaccharide, β-1,4-Mannobiose, from Coconut by the Rat Portal Vein. Bioscience,
Biotechnology, and Biochemistry, 76: 575–577.

184
Kandler, O, Hope, H. (1980). Occurrence, metabolism, and function of oligosaccharides. Carbohydrates:
Structure and Function, 221-270.
Kang, K.E., Jeong, G.T., Park, D.H. (2012). Pretreatment of rapeseed straw by sodium hydroxide.
Bioprocess and Biosystems Engineering, 35: 705–713.
Karimi, R., Azizi, M.H., Xu, Q., Sahari, M.A., Hamidi, Z. (2018). Enzymatic removal of starch and protein
during the extraction of dietary fiber from barley bran. Journal of Cereal Science, 83: 259-265.
Kent, N.L. (1983). Barley. Technology of Cereals, 3rd ed., Pergamon Press, Oxford, U.K., 154.
Khuwijitjaru, P., Pokpong, A., Klinchongkon, K., Adachi, S. (2014). Production of oligosaccharides from
coconut meal by subcritical water treatment. International Journal of Food Science and Technology, 49:
1946–1952.
Khuwijitjaru, P., Watsanit, K., Adachi, S. (2012). Carbohydrate content and composition of product from
subcritical water treatment of coconut meal. Journal of Industrial and Engineering Chemistry,18: 225–229.
Kim, S., Kim, W., Hwang, I.K. (2003). Optimization of the extraction and purification of oligosaccharides
from defatted soybean meal. International Journal of Food Science and Technology, 38:337–42.
King, J.W., and Grabiel, R.D. (2007). Isolation of phenolic compounds from fruits or vegetables utilizing
sub-critical water extraction. U.S. Patent, 7: 208-181
Kiran, U.K., Akpinar, O. Bakir, U. (2013). Improvement of enzymatic xylooligosaccharides production by
the co-utilization of xylans from different origins. Food and Bioproducts Processing, 91: 565–574.
Klamczynski, A., Baik, B. K., Czuchajowska, Z. (1998). Composition, microstructure, water imbibition,
and thermal properties of abraded barley. Cereal Chemistry, 75: 677-685.
Klinchongkon, k., Khuwijitjaru, P., Wiboonsirikul, J., Adachi, S. (2015). Extraction of oligosaccharides
from passion fruit peel by subcritical water treatment. Journal of Food Process Engineering, 40: 1-8.
Knuckles, B.E. and Chiu, M.M. (1995). β-Glucan enrichment of barley fractions by air classification and
sieving. Journal of Food Science, 60: 1070–1074.
Komesu, A., Oliveira, J.A.R.D., Martins, L.H.D.S., Maciel, M.R.W., Filho, R.M. (2017). Lactic Acid
Production to Purification: A Review. BioResources, 12: 4364-4383.
Krogell, J., Korotkova, E., Eränen, K., Pranovich, A., Salmi, T., Murzin, D., Willför, S. (2013).
Intensification of hemicellulose hot-water extraction from spruce wood in a batch reactor- Effects of wood
particle size. Bioresource Technology, 143: 212-220.
Kruse, A., Dinjus, E. (2007). Hot compressed water as reaction medium and reactant I. properties and
synthesis reaction. Journal of Supercritical Fluids, 39: 363–380.
Kuhn, R.C. and Filho, F.M. (2010). Purification of fructooligosaccharides in an activated charcoal fixed
bed column. New Biotechnology, 27: 862-869.
185
Kunze, W. (2010). Technology Brewing & Malting, fourth ed. VLB Berlin, Berlin. Lampi, A.-M., Moreau,
R., Piironen, V., Hicks, K., 2004. Pearling barley and rye to produce phytosterol-rich fractions. Lipids 39:
783–787.
Kwon, K.T., Uddin, M.D.S., Jung, G.W., Sim, J.E., and Chun, B.S. (2010). Supercritical carbon dioxide
extraction of phenolics and tocopherols enriched oil from wheat bran. International Journal of Nutrition
and Food Engineering, 4: 188-193.
Laine, C. (2005). Structures of hemicelluloses and pectins in wood and pulp. Ph.D dissertation at the
Helsinki University of Technology, 15-20.
Lâsztity, R. (1984). Barley protein. Chemistry of Cereal Proteins. CRC Press: Boca Raton, FL.159-183.
Li, K., Azadi, P., Collins, R., Tolan, J., Kim, J.S., Eriksson K.E.L. (2000). Relationships between
Activities of Xylanases and Xylan Structures. Enzyme and Microbial Technology, 27: 89-94.
Li, W., Li, J., Chen, T., Chen, C. (2004). Study on nanofiltration for purifying froctooligosaccharides.
Journal of Membrane Science, 245:123–9.
Liu, Yu, Liu., Jiang, Z., Liu, H., Yang, H., Ya, Q. (2018). Biochemical characterization of a novel xylanase
from Paenibacillus barengoltzii and its application in xylooligosaccharides production from corncobs. Food
Chemistry, 264: 310-318.
Lu, S., Zhuang, L., Lu, J. (2007). Homogeneous blend membrane made from poly (ether sulphone) and
poly (vinylpyrrolidone) and its application to water electrolysis, Journal of Membrane Science, 300: 205-
210.
Lu, X., Yamauchi, K., Phaiboonsilpa, N., Saka, S. (2009). Two-step hydrolysis of Japanese beech as treated
by semi flow hot compressed water. Journal of Wood Science, 55: 367–375.
MacGregor, A.W., and Fincher, G. B. (1993). Carbohydrates of the barley grain. Barley: Chemistry and
Technology.73-130.
Maes, C. and Delcour, J. (2002). Structural characterisation of water-extractable and water-unextractable
arabinoxylans in wheat bran, Journal of Cereal Science, 35: 315–326.
Mafei, T.D.T., Neto, F.S.P.P., Peixoto, G., Neto, A.D.B., Monti, r., Masarin, f. (2019). Extraction and
characterization of hemicellulose from eucalyptus by-product: assessment of enzymatic hydrolysis to
produce xylooligosaccharides. Applied Biochemistry and Biotechnology, 189: 1-21.
Maurya, D.P., Singla, A., Negi, S. (2015). An overview of key pretreatment processes for biological
conversion of lignocellulosic biomass to bioethanol. 3 Biotech, 5: 597–609.
Mahendran, R., Malaisamy, R., Moha, D.R. (2004). Cellulose acetate and polyethersulfone blend
ultrafiltration membranes. Part I: Preparation and characterizations. Polymers for Advanced Technologies,
15: 149-157.
Makishima, S., Mizuno, M., Sato, N., Shinji, K., Suzuki, M., Nozaki, K., Takahashi, F., Kanda, T.
and Amano, Y. (2009). Development of continuous flow type hydrothermal reactor for hemicellulose
fraction recovery from corncob. Bioresource Technology ,100: 2842-2848.

186
Marconi, E., Graziano, M., Cubadda, R. (2000). Composition and utilization of barley pearling by-products
for making functional pastas rich in dietary fiber and b- glucan. Cereal Chemistry, 77: 133–139.
Martinez, M., Yáñez, R., Alonsó, J.L., Parajó, J.C. (2010). Chemical production of pectic oligosaccharides
from orange peel wastes. Industrial and Engineering Chemistry Research, 49: 8470-8476.
Mathew, S., Aronsson, A., Karlsson, E.N. Adlercreutz, P. (2018). Xylo and arabino-xylooligosaccharides
from wheat bran by endoxylanases, utilisation by probiotic bacteria, and structural studies of the enzymes.
Applied Microbiology and Biotechnology, 102:3105–3120.
Mayanga, P.C.T., Azambuja, S.P.H., Tyufekchiev, M., Tompsett, G.A., Timkob, M.T., Goldbeck, R.,
Rostagno, M.A., Carneiro, T.F. (2018). Subcritical water hydrolysis of brewer’s spent grains: Selective
production of hemicellulosic sugars (C-5 sugars). The Journal of Supercritical Fluids, 145: 19-30.
Miller, G. L. (1959). Use of dinitrosalicylic acid reagent for determination of reducing sugar. Analytical
Chemistry, 31: 426–428.
Mokhothu, T.H., John, M.J. (2015). Review on hygroscopic aging of cellulose fibres and their
biocomposites. Carbohydrate Polymers, 131: 337-354.
Moller, M., Nilges, P., Harnisch, F. and Schroder, U. (2011). Subcritical water as reaction environment:
Fundamentals of hydrothermal biomass transformation. ChemSusChem, 4: 566-579.
Moniz, P., Ho, A.L., Duarte, L.C. Kolida, S., Rastall, R.A., Pereira, H., Carvalheiro, F. (2016). Assessment
of the bifidogenic effect of substituted xylooligosaccharides obtained from corn straw. Carbohydrate
Polymers, 136: 466–473.
Moran, J. and Shapiro, H.N. (2006). Fundamentals of engineering thermodynamics. (5th ed). England: West
Sussex: John Wiley & Sons Ltd.
Moura, P., Cabanas, S., Lourenço, P., Gírio, F., Loureiro-Dias, M.C., Esteves, M.P. (2008). In vitro
fermentation of selected xylo-oligosaccharides by piglet intestinal microbiota. LWT – Food Science and
Technology, 41: 1952-1961.
Moure, A., Gullon, P., Domınguez, H., Parajo, J.C. (2006). Advances in the manufacture, purification and
applications of xylo-oligosaccharides as food additives and nutraceuticals. Process Biochemistry, 41: 1913–
1923.
Murphy, D.M. and Koop, Q. (2005). Review of the vapour pressures of ice and supercooled water for
atmospheric applications. Royal Meteorological Society, 131: 1539-1565.
Mussatto, S.I. and Mancilha, I.M. (2007). Non-digestible oligosaccharides: A review. Carbohydrate
Polymers, 68: 587–597.
Muzzarelli, R.A.A. (2009). Chitins and chitosans for the repair of wounded skin, nerve, cartilage and bone.
Carbohydrate Polymers, 76: 167–182.
Moniz, P., Ho, A.L. and Duarte, L.C. (2016). Assessment of the bifidogenic effect of substitute
xylooligosaccharides obtained from corn straw. Carbohydrate Polymers, 136: 466–473.
187
Nabarlatz, D., Ebringerova, A., Montane, D. (2007). Autohydrolysis of agricultural by-products for the
production of xylo-oligosaccharides. Carbohydrate Polymers, 69: 20–28.
Nabarlatz, D., Torras, C., Valls, R.G., Montan, D. (2007). Purification of xylo-oligosaccharides from
almond shells by ultrafiltration. Separation and Purification Technology, 53: 235–243.
Newman, C.W. and Newman, R.K. (2006). A brief history of barley foods. Cereal Foods World, 5: 4–7.
Newman, R.K. and Newman, C.W. (1991). Barley as a food grain. Cereal Foods World, 36: 800–805.
Okazaki, M. Fujikawa, S.H. Matsumoto, N. (1990). Effect of Xylo-oligosaccharide on the Growth of
Bifidobacteria. Bifidobacteria Microflora, 9: 77-86.
Olkku, J., Marttila, M.S., Swiens, H., Home, S. (2005). Co nnection between structure and quality of barley
husk. Journal of the American Society of Brewing Chemists, 63: 17–22.
Panfili, G., Cinquanta, L., Fratianni, A., Cubadda, R. (2003). Extraction of wheat germ oil by supercritical
CO2: oil and defatted cake characterization. Journal of the American Oil Chemists' Society, 80: 157–161.
Pellerin, P., Gosselin, M., Lepoutre, J.P., Samain, E., Debeire, P. (1991). Enzymatic production of
oligosaccharides from corncob xylan. Enzyme and Microbial Technology, 13: 617–22.
Peng, F., Peng, P., Xu, F., Sun, R.C. (2012). Fractional purification and bioconversion of hemicelluloses.
Biotechnology Advances, 30: 879-903.
Peng, F., Ren, J.L., Xu, F., Bian, J., Peng, P., Sun, R.C. (2009). Comparative study of hemicelluloses
obtained by graded ethanol precipitation from sugarcane bagasse. Journal of Agricultural and Food
Chemistry, 57: 6305–6317.
Persson, T., Dinh, E., Jonsson, A.S. (2009). Improvement of arabinoxylan isolation from barley husks.
Food and Bioproducts Processing, 87: 228-233.
Phaiboonsilpa, N. and Saka, S. (2011). Effect of acetic acid addition on chemical conversion of woods as
treated by semi-flow hot-compressed water. Holzforschung, 65: 667-672.
Pinelo, M., Jonsson, G., Meyer, A.S. (2009) Membrane technology for purification of enzymatically
produced oligosaccharides: Molecular and operational features affecting performance. Separation and
Purification Technology, 70: 1–11.
Pinkowska, H., Wolak, P. and Zocinska, A. (2011). Hydrothermal decomposition of xylan as a model
substance for plant biomass waste–hydrothermolysis in subcritical water. Biomass Bioenergy, 35: 3902–
3912.
Playne, M.J. and Crittenden, R. (1996). Commercially available oligosaccharides. Bulletin of IDF, 313:
10–22.
Polizeli, M.L.T.M., Rizzatti, A.C.S., Monti, R., Terenzi, H.F., Jorge, J.A., Amorim, D.S. (2005). Xylanases
from fungi: properties and industrial applications. Applied Microbiology and Biotechnology, 67: 577–591.
Pomeranz, Y. (1973). Structue and mineral composition of cereal aleurone cells as shown by scanning
electron microscopy. Cereal Chemistry, 50: 504-511.

188
Pomeranz, Y., and Shands, H. L. (1974). Food uses of barley. critical review. Food Science and Nutrition,
4:377-394.
Pourali, O., Asghari, F.S. and Yoshida, H. (2010). Production of phenolic compounds from rice bran
biomass under subcritical water conditions. Chemical Engineering Journal, 160: 259-266.
Pradhan, R.C., Meda, V., Rout, P.K., Naik, S., Dalai, A.K. (2010). Supercritical CO2 extraction of fatty oil
from flaxseed and comparison with screw press expression and solvent extraction. Journal of Food
Engineering, 98: 393-397.
Pronyk, C. and Mazza, G. (2012). Fractionation of triticale, wheat, barley, oats, canola, and mustard straws
for the production of carbohydrates and lignins. Bioresource Technology, 106: 117-124.
Qiang, X., YongLie, C., QianBing, W. (2009). Health benefit application of functional oligosaccharides.
Carbohydrate Polymers, 77: 35–441.
Qiu, S., Yadav, M.P., Yin, L. (2017). Characterization and functionalities study of hemicellulose and
cellulose components isolated from sorghum bran, bagasse and biomass. Food Chemistry, 230: 225-233.
Quigley, E.M.M. (2010) Prebiotics and probiotics; modifying and mining the microbiota. Pharmacological
Research, 61: 213-218.
Quinde, Z., Ullrich, S.E., Baik, B.K. (2004). Genotypic variation in colour and discolouration potential of
barley-based food products. Cereal Chemistry, 81: 752–758.
Rattan, O., Izydorczyk, M.S. Biliaderis, C.G. (1994). Structure and rheological behaviour of arabinoxylans
from Canadian bread wheat flours. Lebensmittel- Wissenschaft und Technologie, 27: 550–555.
Reilly, P.J. (1981). Xylanases, structure and function. In: Hollaender, A. (ed) Trends in the biology of
fermentation for fuels and chemicals. Plenum, New York, 111–129.
Rezaei, K.A. and Temelli, F. (2000). Using supercritical fluid chromatography to determine the binary
diffusion coefficient of lipids in supercritical CO2. Journal of Supercritical Fluids, 17: 35–44.
Rico, X., Gullon, B., Alonso, J.L., Parajo, J.C. Yanez, R. (2018). Valorization of peanut shells: Manufacture
of bioactive oligosaccharides. Carbohydrate Polymers, 183: 21–28.
Rivas, S., Santos, V., Parajo, J.C. (2016). Aqueous fractionation of hardwood: selective glucuronoxylan
solubilisation and purification of the reaction products. Journal of Chemical Technology and
Biotechnology, 92: 367–374.
Roberfroid, M. and Slavin, J. (2000). Nondigestible oligosaccharides. Critical Reviews in Food Science
and Nutrition, 40: 461–480.
Rodríguez, F., Sanchez, A., Amaya-Delgado, L. (2019). Xylooligosaccharides production from
lignocellulosic biomass using a pilot-scale pretreatment continuous tubular reactor. Modelling and
experimental validation. Industrial Crops and Products,134: 62-70.
Rohrer, J.S. (2002). High-performance anion-exchange chromatography with pulsed amperometric
detection (HPAE-PAD) for the determination of oligosaccharides in foods and agricultural products.
Abstracts of Papers of the American Chemical Society, 223: 103-104.

189
Rolando, A.F., Kevin, B., Hicks, D.W. (2005). High-starch and high-β-glucan barley fractions milled with
experimental mills. Cereal Chemistry, 82: 727–733.
Román, O.B., Alvarez, V.H., Alonso, E., Cocero, M.J. and Saldaña, M.D.A. (2015). Pressurized aqueous
ethanol extraction of β-glucans and phenolic compounds from waxy barley. Food Research International,
75: 252-259.
Rose, D.J. and Inglett, G.E. (2010). Two-stage hydrothermal processing of wheat (Triticum aestivum) bran
for the production of feruloylated arabino-xylooligosaccharides. Journal of Agricultural and Food
Chemistry, 58: 6427–6432.
Rose, D.J. and Inglett, G.E. (2010). Production of feruloylated arabinoxylo-oligosaccharides from maize
(Zea mays) bran by microwave-assisted autohydrolysis. Food Chemistry, 119: 1613–1618.
Ruiz, H.A., Ruzene, D.S., Silva, D.P. (2011). Development and characterization of an environmentally
friendly process sequence (Autohydrolysis and Organosolv) for wheat straw delignification. Applied
Biochemistry and Biotechnology, 164: 629-641.
Ruiz, H.A., Trajano, H.L., Thomsen, M.H. (2017). Effect of hydrothermal processing on hemicellulose
strcaucture (Chapter 3). Hydrothermal Processing in Biorefineries, Springer, 45-95.
Ruthes, A.C. Martínez, A.A., Tan, H.T., Bulonea, V. and Vilaplana, F. (2017). Sequential fractionation of
feruloylated hemicelluloses and oligosaccharides from wheat bran using subcritical water and xylanolytic
enzymes. Green Chemistry, 19: 1919-1931.
Saha, B.C. (2003). Hemicellulose bioconversion. Journal of Industrial Microbiology and Biotechnology,
30: 279-291.
Saldaña, M.D.A., Mohamed, R.S., Mazzafera, P. (2002). Extraction of cocoa butter from Brazilian cocoa
beans using supercritical CO2 and ethane. Fluid Phase Equilibria, 194–197: 885–894.
Sangeetha, P.T., Ramesh, M.N., Prapulla, S.G. (2005). Recent trends in the microbial production, analysis
and application of fructooligosaccharides. Trends in food science and technology, 16: 442–457.
Sarkar, S. (2013). Extraction of carbohydrates and phenolics from barley hull using pressurized/subcritical
fluids. MS.C. dissertation at the University of Alberta, 93-97.
Shi, Z.J., Xiao, L.P., Deng, J., Xu, F., Sun, R.C. (2011). Isolation and characterization of soluble
polysaccharides of Dendrocalamus brandisii: a high-yielding bamboo species. Bioresources, 6: 5151–5166.
Singh, R.D. Nadar, C.G., Muir, J., Arora, A. (2019). Green and clean process to obtain low degree of
polymerisation xylooligosaccharides from almond shell. Journal of Cleaner Production, 241: 118-237.
Singh, P.P. and Saldaña, M.D.A. (2011). Subcritical water extraction of phenolic compounds from potato
peel. Food Research International, 44: 2452-2458.
Sjostrom, E. (1993). Wood chemistry: fundamentals and applications, 2nd ed. Academic Press, New York.
Sluiter, A., Hames, B., Ruiz, R., Scarlata, C., Sluiter, J. and Templeton, D. (2006). Determination of sugars,
byproducts, and degradation products in liquid fraction process samples; Laboratory Analytical Procedure
(LAP). NREL/TP-510-42623. National Renewable Laboratory, Golden, CO.

190
Sluiter, A., Hames, B., Ruiz, R., Scarlata, C., Sluiter, J., Templeton, D. and Crocker, D. (2008).
Determination of structural carbohydrates and lignin in biomass; Laboratory Analytical Procedure (LAP).
NREL/TP-510-42618. National Renewable Laboratory, Golden, CO.
Smith, R.M. (2002). Extractions with superheated water, Journal of Chromatography A. 975: 31-46.
Soares, J.F, Pra, V.D. Souza, M.D. Lunelli, F.C. Abaide, E., Silva, J.R.F.D., Kuhn, R.C. Martínez, J.,
Mazutti, M.A. (2016). Extraction of rice bran oil using supercritical CO2 and compressed liquefied
petroleum gas. Journal of Food Engineering, 170: 58-63.
Song, H.Y., Shin, Y.J., Song, K.B. (2012). Preparation of a barley bran protein–gelatin composite film
containing grapefruit seed extract and its application in salmon packaging. Journal of Food Engineering,
113: 541-547.
Sparks, D., Hernandez, R., Zappi, M., Blackwell, D., Fleming., T. (2006). Extraction of rice bran oil using
supercritical carbon dioxide and propane. Journal of the American Oil Chemists' Society, 83: 885–891.
Spencer, R.R. and Akin, D. E. (1980). Rumen microbial degradation of potassium hydroxide-treated coastal
Bermuda-grass leaf blades examined by electron microscopy. Journal of Animal Science, 51: 1189–1196.
Spiridon, I. and Popa, V.I. (2008). Hemicelluloses: major sources, properties and applications. In: Belgacem
MN, Gandini A (eds) Monomers, Polymers and Composites from Renewable Resources, Elsevier,
Amsterdam, 1: 289–304.
Sukhbaatar, B., Hassan, E.B., Kim, M., Steele, P., Ingram, L. (2014). Optimization of hot-compressed water
pretreatment of bagasse andcharacterization of extracted hemicelluloses. Carbohydrate Polymers,101: 196-
202.
Sun, Y.E. and Cheng, J.J. (2002). Hydrolysis of lignocellulosic materials for ethanol production: A review.
Bioresource Technology, 83:1-11.
Sun, R., Lawther, J.M., Banks, W.B. (1995). Influence of alkaline pre-treatments on the cell wall
components of wheat straw. Industrial Crops and Products, 4: 127-145.
Sun, H.J., Yoshida, S., Park, N.H., Kusakabe, I. (2002). Preparation of (1→4)-β- D xylooligosaccharides
from an acid hydrolysate of cotton-seed xylan: suitability of cotton-seed xylan as a starting material for the
preparation of (1→4)-β-D-xylooligosaccharides. Carbohydrate Research, 337: 657–661.
Sun, R.C., and Tomkinson, J. (2002). Characterization of hemicelluloses obtained by classical and
ultrasonically assisted extractions from wheat straw. Carbohydrate Polymers, 50: 263–271.
Sun, R.C., Tomkinson, J., Liang, S.F. (2000). Comparative study of hemicelluloses from rice straw by alkali
and hydrogen peroxide treatments. Carbohydrate Polymers, 42: 111-122.
Sunphorka, S., Chavasiri, W., Oshima, Y., Ngamprasertsith, S. (2012). Protein and Sugar Extraction from
Rice Bran and De-Oiled Rice Bran using Subcritical Water in a Semi-Continuous Reactor: Optimization
by Response Surface Methodology. International Journal of Food Engineering, 8: 1-22.
Surek, E. and Buyukkileci, A.O. (2017). Production of xylooligosaccharides by autohydrolysis of hazelnut
(Corylus avellana L.) shell. Carbohydrate Polymers, 174: 565–571.

191
Swennen, K., Courtin, C.M., Van der Bruggen, B. et al. (2005). Ultrafiltration and ethanol precipitation for
isolation of arabinoxylooligosaccharides with different structures. Carbohydrate Polymers, 62 (3), 283–
292.
Teleman, A., Nordstrom, M., Tenkanen, M., Jacobs, A., Dahlman, O. (2003). Isolation and characterization
of O-acetylated glucomannans from aspen and birch wood. Carbohydrate Research, 338: 525–534.
Temelli, F., Saldana, M.D.A., Comin, L. (2012). Application of supercritical fluid extraction in food
processing. Comprehensive Sampling and Sample Preparation, 4: 415-440.
Temelli, F., Stobbe, K., Rezaei, K. and Vasanthan, T. (2013). Tocol composition and supercritical carbon
dioxide extraction of lipids from barley pearling flour. Journal of Food Science, 78: 1643-1650.
Teng, C., Yan, Q., Jiang, Z., Fan, G., Shi, B. (2010). Production of xylooligosaccharides from the steam
explosion liquor of corncobs coupled with enzymatic hydrolysis using a thermostable xylanase.
Bioresource Technology, 101: 7679-7682.
Uffen, R.L. (1997). Xylan degradation: a glimpse at microbial diversity. Journal of Industrial Microbiology
and Biotechnology, 19: 1–6.
van Donkelaar, L.H.G., Noordman, T.R.b., Boom, R.M., Goot, V.D.A.J. (2015). Pearling barley to alter the
composition of the raw material before brewing. Journal of Food Engineering, 150: 44–49.
Vázquez, M.J., Alonso, J.L., Dominguez, H., Parajó, J.C. (2000). Xylooligosaccharides: manufacture and
applications. Trends in Food Science & Technology, 11: 387–393.
Vazquez, M.J., Garrote, G., Alonso, J.L., Dominguez, H., Parajo, J.C. (2005). Refining of autohydrolysis
liquors for manufacturing xylooligosaccharides: evaluation of operational strategies. Bioresource
Technology, 96: 889–896.
Vegas, R., Alonso, J.L., Domınguez, H. and Parajo, J.C. (2005). Manufacture and refining of
oligosaccharides from industrial solid wastes. Industrial & Engineering Chemistry Research, 44: 614-620.
Vegas, R., Alonso, J.L., Dominguez, H. Parajo, J.C. (2004). Processing of rice husk autohydrolysis liquors
for obtaining food ingredients. Journal of Agricultural and Food Chemistry, 52: 7311–7317.
Vegas, R., Luque, S., Alvarez, J.A., Alonso, J.L., Dominguez, H., Parajo, J.C. (2006). Membrane-assisted
processing of xylooligosaccharide-containing liquors. Journal of Agricultural and Food Chemistry, 54:
5430–5436.
Verbruggen, M.A., Beldman, G., Voragen, A.G.J. (1995). The Selective Extraction of
Glucuronoarabinoxylans from Sorghum Endosperm Cell Walls using Barium and Potassium Hydroxide
Solutions. Journal of Cereal Science, 21: 271-282.
Voragen, A.G.J. (1998). Technological aspects of functional food-related carbohydrates. Trends in Food
Science & Technology, 9: 328–335.
Wavhal, D.S. and Fisher, E.R. (2005) Modification of polysulfone ultrafiltration membranes by CO2 plasma
treatment. Desalination, 172: 189-205.

192
Wang, L. (1992). Influence of oil and soluble fiber of barley grain on plasma cholesterol concentrations in
chickens and hamsters, Thesis, Montana State University, Bozeman, Montana, U.S.A.
Wang, J., Cao, Y., Wang, C., Sun, B. (2011). Wheat bran xylooligosaccharides improve blood lipid
metabolism and antioxidant status in rats fed a high-fat diet. Carbohydrate Polymers, 86: 1192– 1197.
Wang, X., Chen, Q., LÜ, X. (2014). Pectin extracted from apple pomace and citrus peel by subcritical
water. Food Hydrocolloids, 38: 129–137.
Wang, J., Sun., B., Cao, Y., Tian, Y., Wang, C. (2009). Enzymatic preparation of wheat bran
xylooligosaccharides and their stability during pasteurization and autoclave sterilization at low pH.
Carbohydrate Polymers, 77: 816-821.
Wang, S., Sosulski, K., Sosulski, F., Ingledew, M. (1997). Effect of sequential abrasion on starch
composition of five cereals for ethanol fermentation. Food Research International, 30: 603–609.
Wang, C., Tian, Z., Chen, L., Temelli, F., Liu, H., Wang, Y. (2010). Functionality of barley proteins
extracted and fractionated by alkaline and alcohol methods. Cereal Chemistry, 87: 597-606.
Wheeler, J.R., McNally, M.E. (1989). Supercritical fluid extraction and chromatography of representative
agriculture products with capillary and microbore column. Journal of Chromatography Science, 27: 534–
539.
Yan, J.K., Wu, L.X., Cai, W.D., Xiao, G.S., Duan, Y., Zhang, H. (2019). Subcritical water extraction-based
methods affect the physicochemical and functional properties of soluble dietary fibers from wheat bran.
Food Chemistry, 298: 1-9.
Yedro, F.M., Cantero, D.M., Pascual, M., García-Serna, J., Cocero, M.J. (2015). Hydrothermal
fractionation of woody biomass: Lignin effect on sugars recovery. Bioresource Technology, 191: 124-132.
Yedro, F.M., Grénman, H., Rissanen, J.V., Salmi, T., García-Sernaa, J., Cocero M.J. (2017). Chemical
composition and extraction kinetics of Holm oak (Quercusilex) hemicelluloses using subcritical water.
Journal of Supercritical Fluids, 129: 56–62.
Yeung, J. and Vasanthan, T. (2001). Pearling of hull-less barley: product composition and gel color of
pearled barley flours as affected by the degree of pearling. Journal of Agriculture and Food Chemistry, 49:
331-335.
Yu, Q., Zhuang, X., Yuan, Z., Qi, W., Wang, W., Wang, Q., Tan, X. (2013). Pretreatment of sugarcane
bagasse with liquid hot water and aqueous ammonia. Bioresource Technology, 144:210-215.
Yu, W., Zou, W., Dhital, S., Wu, P., Gidley, M.J., Fox, G.P. Gilbert, R.G. (2018). The adsorption of α-
amylase on barley proteins affects the in vitro digestion of starch in barley flour. Food Chemistry, 241: 493-
501.
Zhang, W., You, Y., Lei, F., Li, P., Jian, J. (2018). Acetyl-assisted autohydrolysis of sugarcane bagasse for
the production of xylo-oligosaccharides without additional chemicals. Bioresource Technology, 265: 387-
393.

193
Zhao, X., Dong, C. (2016). Extracting xylooligosaccharides in wheat bran by screening and cellulase
assisted enzymatic hydrolysis. International Journal of Biological Macromolecules, 92: 748–752.
Zhao, Y. and Saldaña, M.D.A. (2019). Hydrolysis of cassava starch, chitosan and their mixtures in
pressurized hot water media. The Journal of Supercritical Fluids,147: 293-301.
Zheng, Y., Pan, Z., Zhang, R. (2009). Overview of biomass pretreatment for cellulosic ethanol production.
International Journal of Agricultural and Biological Engineering, 2: 51–68.
Zheng, X., Li, L., Wang, Q. (2011). Distribution and Molecular Characterization of β-Glucans from Hull-
Less Barley Bran, Shorts and Flour. International Journal of Molecular Sciences, 12: 1563-1574.
Zhu, K.X., Sun, X.H., Chen, Z.C., Peng, W., Qian, H.F., Zhou, H.M. (2010). Comparison of functional
properties and secondary structures of defatted wheat germ proteins separated by reverse micelles and
alkaline extraction and isoelectric precipitation. Food Chemistry, 123: 1163-1169.
Zhu, Y., Kim, T.H. Lee, Y.Y. Chen, R. Elander, R.T. (2006). Enzymatic production of xylooligosaccharides
from corn stover and corn cobs treated with aqueous ammonia. Applied Biochemistry and Biotechnology,
6: 129–132.
Zhu, G., Zhu, X., Fan, Q., Wan, X. (2011). Production of reducing sugars from bean dregs waste by
hydrolysis in subcritical water. Journal of Analytical and Applied Pyrolysis, 90: 182-186.

194
Appendix A
Calibration curves
Figure A1. HPLC calibration curves of sugars: (a) glucose, (b) xylose, (c) galactose, (d) arabinose.
y = 31488x - 4072.1R² = 0.9993
0
50000
100000
150000
200000
250000
0 2 4 6 8
Are
a
mg glucose /mL
(a) y = 30569x - 1402.3
R² = 0.9999
0
10000
20000
30000
40000
50000
60000
70000
80000
0 0.5 1 1.5 2 2.5 3
Area
mg xylose/ mL
(b)
y = 26378x - 1354.1R² = 0.9996
0
10000
20000
30000
40000
50000
60000
70000
0 0.5 1 1.5 2 2.5 3
Are
a
mg galactose / mL
(C) y = 32474x - 2164.4
R² = 0.9998
0
10000
20000
30000
40000
50000
60000
70000
80000
90000
0 0.5 1 1.5 2 2.5 3
Are
a
mg arabinose/ mL
(d)

195
Figure A2. HPLC calibration curves of (a) molecular weight, (b) degree of polymerization of XOS.
y = -0.0006x3 + 0.0773x2 - 2.6378x + 27.996R² = 1
0
1
2
3
4
5
6
7
0.00 5.00 10.00 15.00 20.00 25.00 30.00
Deg
ree
of
poly
mer
izati
on
(D
P)
Retention time (min)
(b)
y = -0.0794x3 + 10.206x2 - 348.42x + 3716.2R² = 1
0
100
200
300
400
500
600
700
800
900
0.00 5.00 10.00 15.00 20.00 25.00 30.00
Mo
lecu
lar w
eig
ht
(Da
)
Retention time (min)
(a)
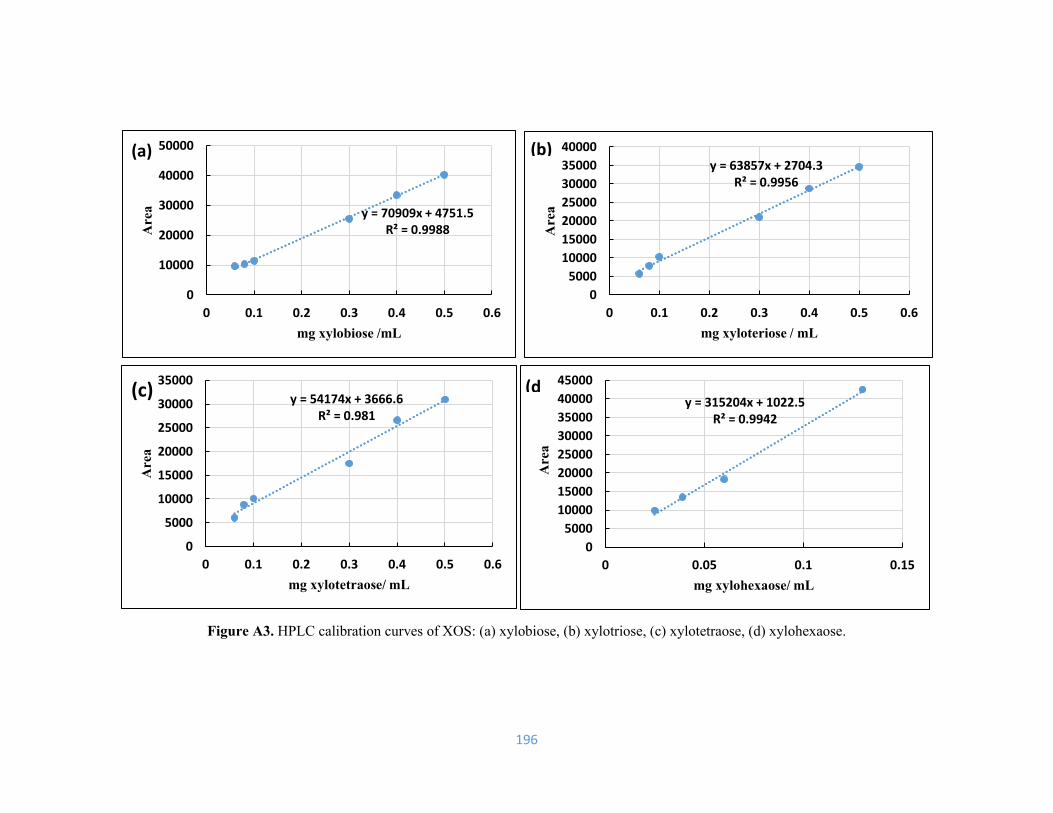
196
Figure A3. HPLC calibration curves of XOS: (a) xylobiose, (b) xylotriose, (c) xylotetraose, (d) xylohexaose.
y = 70909x + 4751.5R² = 0.9988
0
10000
20000
30000
40000
50000
0 0.1 0.2 0.3 0.4 0.5 0.6
Area
mg xylobiose /mL
(a) y = 63857x + 2704.3
R² = 0.9956
0
5000
10000
15000
20000
25000
30000
35000
40000
0 0.1 0.2 0.3 0.4 0.5 0.6
Are
a
mg xyloteriose / mL
(b)
y = 54174x + 3666.6R² = 0.981
0
5000
10000
15000
20000
25000
30000
35000
0 0.1 0.2 0.3 0.4 0.5 0.6
Area
mg xylotetraose/ mL
(c) y = 315204x + 1022.5
R² = 0.9942
0
5000
10000
15000
20000
25000
30000
35000
40000
45000
0 0.05 0.1 0.15
Area
mg xylohexaose/ mL
(d
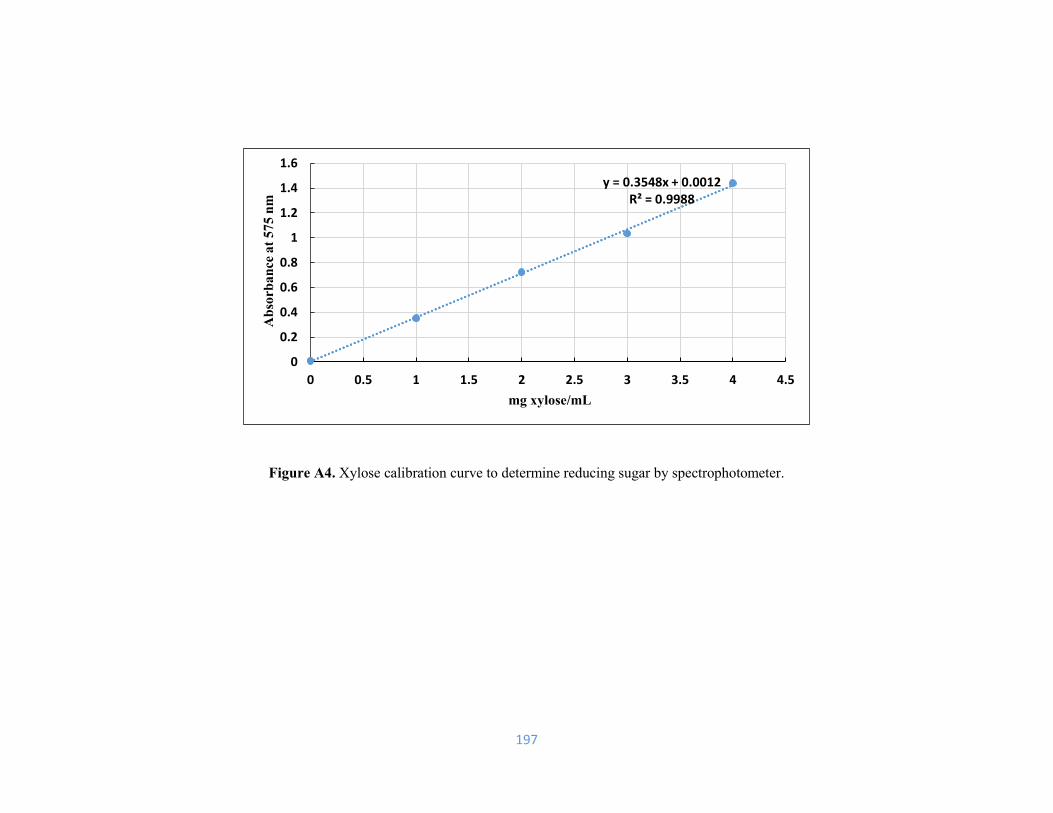
197
Figure A4. Xylose calibration curve to determine reducing sugar by spectrophotometer.
y = 0.3548x + 0.0012R² = 0.9988
0
0.2
0.4
0.6
0.8
1
1.2
1.4
1.6
0 0.5 1 1.5 2 2.5 3 3.5 4 4.5
Ab
sorb
an
ce a
t 5
75
nm
mg xylose/mL

198
Figure A5. HPLC calibration curves of acids: (a) acetic acid, (b) lactic acid.
y = 215921x - 6564.3R² = 0.9957
0
50000
100000
150000
200000
0 0.2 0.4 0.6 0.8 1
Are
a
mg lactic acid/ mL
(b)
y = 201547x - 518.78R² = 0.992
0
5000
10000
15000
20000
0.02 0.04 0.06 0.08 0.1
Are
amg acetic acid/ mL
(a)

199
Figure A6. HPLC calibration curve of α-tocopherol.
y = 4850.1x - 5225R² = 0.9936
0
100000
200000
300000
400000
500000
600000
700000
800000
900000
1000000
0 50 100 150 200
Are
a
µg α-tocopherol/g lipid
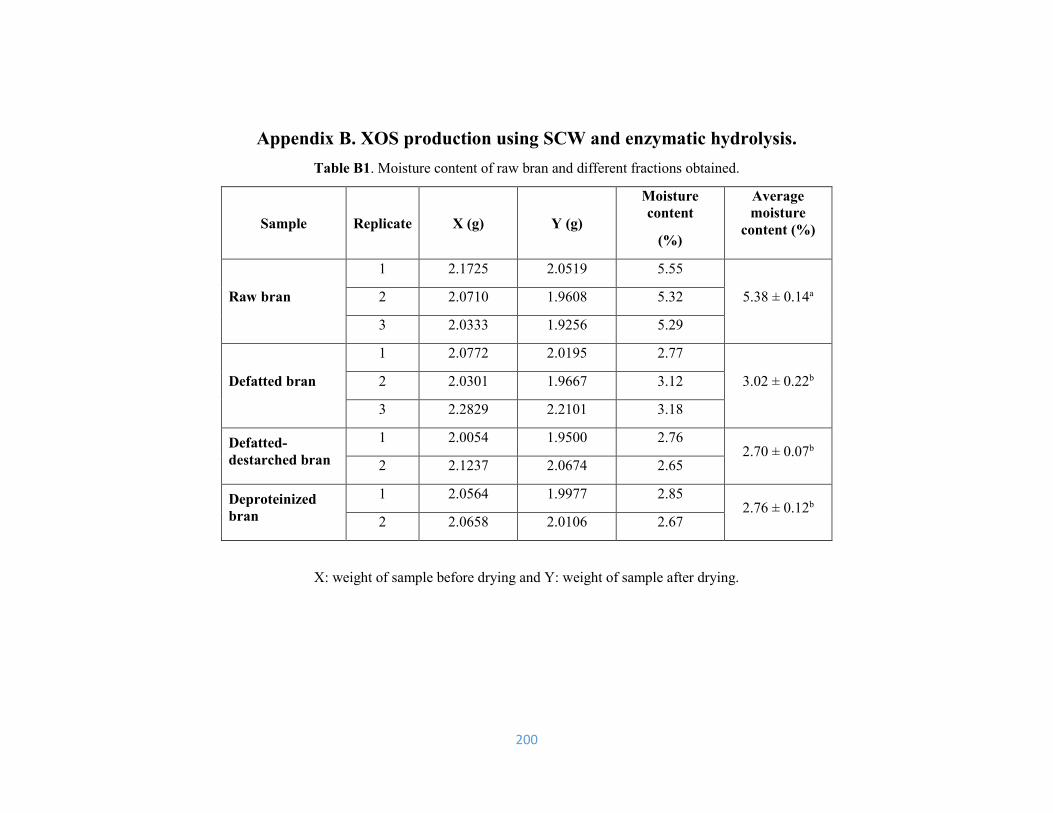
200
Appendix B. XOS production using SCW and enzymatic hydrolysis.
Table B1. Moisture content of raw bran and different fractions obtained.
Sample
Replicate
X (g)
Y (g)
Moisture
content
(%)
Average
moisture
content (%)
Raw bran
1 2.1725 2.0519 5.55
5.38 ± 0.14a 2 2.0710 1.9608 5.32
3 2.0333 1.9256 5.29
Defatted bran
1 2.0772 2.0195 2.77
3.02 ± 0.22b 2 2.0301 1.9667 3.12
3 2.2829 2.2101 3.18
Defatted-
destarched bran
1 2.0054 1.9500 2.76 2.70 ± 0.07b
2 2.1237 2.0674 2.65
Deproteinized
bran
1 2.0564 1.9977 2.85 2.76 ± 0.12b
2 2.0658 2.0106 2.67
X: weight of sample before drying and Y: weight of sample after drying.

201
Table B2. Protein content of raw bran and different fractions obtained.
Sample Replicate
Sample
weight
(g)
Nitrogen
(%)
Protein
factor
Protein
content
(%)
Average
protein content
(%)
Raw bran
1 0.106 4.0832 6.25 25.52
25.71 ± 0.3c 2 0.105 4.0726 6.25 25.45
3 0.108 4.1824 6.25 26.14
Defatted bran 1 0.110 4.6032 6.25 28.77
28.60 ± 0.11b 2 0.103 4.5776 6.25 28.61
Defatted-destarched
bran
1 0.0045 4.9801 6.25 31.12 31.28 ± 0.67a
2 0.0052 5.0300 6.25 31.43
Deproteinized bran
1 0.0085 0.7816 6.25 4.88
4.51 ± 0.59d 2 0.0078 0.7977 6.25 4.98
3 0.0058 0.6525 6.25 4.07
4 0.0072 0.6580 6.25 4.11
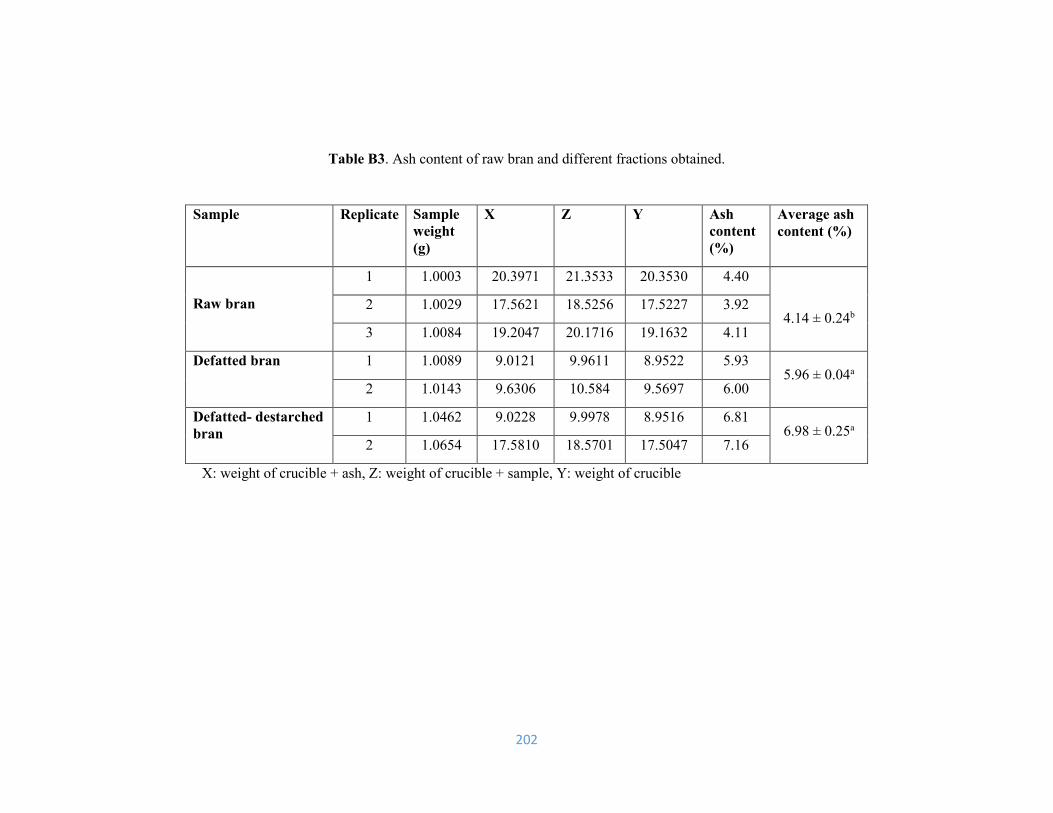
202
Table B3. Ash content of raw bran and different fractions obtained.
Sample Replicate Sample
weight
(g)
X Z Y Ash
content
(%)
Average ash
content (%)
Raw bran
1 1.0003 20.3971 21.3533 20.3530 4.40
4.14 ± 0.24b 2 1.0029 17.5621 18.5256 17.5227 3.92
3 1.0084 19.2047 20.1716 19.1632 4.11
Defatted bran 1 1.0089 9.0121 9.9611 8.9522 5.93 5.96 ± 0.04a
2 1.0143 9.6306 10.584 9.5697 6.00
Defatted- destarched
bran
1 1.0462 9.0228 9.9978 8.9516 6.81 6.98 ± 0.25a
2 1.0654 17.5810 18.5701 17.5047 7.16
X: weight of crucible + ash, Z: weight of crucible + sample, Y: weight of crucible

203
Table B4. Lipid content of raw bran and different fractions obtained.
Sample Replicate Sample
weight (g)
Y X Lipid
content
(%)
Average
lipid content
(%)
Raw bran 1 2.0092 61.3232 61.5132 9.45
9.46 ± 0.27a 2 2.0015 61.0877 61.2829 9.75
3 2.0630 57.5708 57.7606 9.20
Defatted bran 1 2.1310 61.2820 61.2887 0.31
0.35 ± 0.05b 2 2.2100 58.3459 58.3531 0.35
3 2.1210 61.2312 61.2401 0.41
X: weight of beaker + lipid and Y: weight of beaker
Table B5. Starch content of raw bran and different fractions obtained.
Sample Replicate Sample
weight
(g)
ABS 1 ABS 2 ABS
(D-
glucose
standard)
Average
ABS
(D-glucose
standard)
F Starch
content
(%)
Average starch
content (%)
Raw bran 1 0.115 0.150 0.135
1.065
1.136
1.127
0.01093
90.144
10.0095 10.50 ± 0.68a
2 0.112 0.157 0.147 10.9811
Defatted bran 1 0.116 0.169 0.169 11.7489
12.07 ± 0.45a 2 0.107 0.164 0.165 12.3917
Defatted-
destarched bran
1 0.100 0.012 0.011 0.9333
1.04 ± 0.14b 2 0.100 0.014 0.014 1.1387
F:100 (µ𝑔 𝑜𝑓 𝐷−𝑔𝑙𝑢𝑐𝑜𝑠𝑒)
𝐴𝑏𝑠𝑜𝑟𝑏𝑎𝑛𝑐𝑒 𝑓𝑜𝑟 100 µ𝑔 𝑜𝑓 𝐷−𝑔𝑙𝑢𝑐𝑜𝑠𝑒 𝑠𝑡𝑎𝑛𝑑𝑎𝑟𝑑 and ABS: Absorbance at 510 nm.
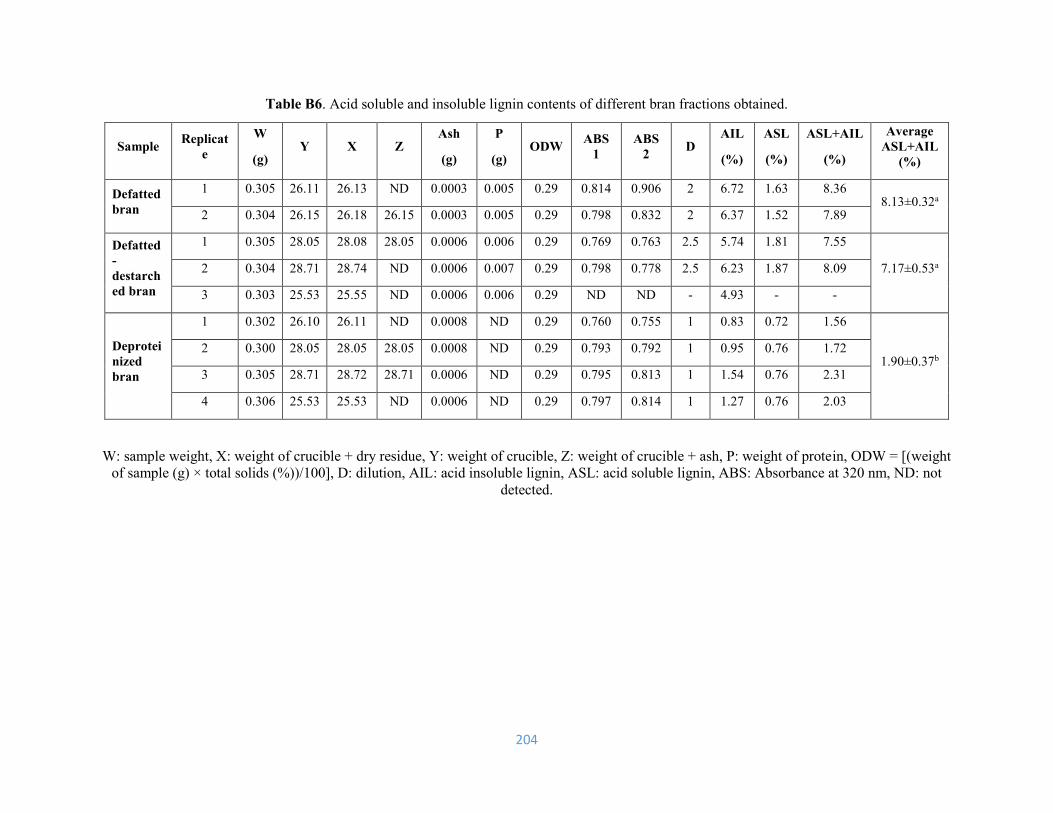
204
Table B6. Acid soluble and insoluble lignin contents of different bran fractions obtained.
Sample Replicat
e
W
(g) Y X Z
Ash
(g)
P
(g) ODW
ABS
1
ABS
2 D
AIL
(%)
ASL
(%)
ASL+AIL
(%)
Average
ASL+AIL
(%)
Defatted
bran
1 0.305 26.11 26.13 ND 0.0003 0.005 0.29 0.814 0.906 2 6.72 1.63 8.36 8.13±0.32a
2 0.304 26.15 26.18 26.15 0.0003 0.005 0.29 0.798 0.832 2 6.37 1.52 7.89
Defatted
-
destarch
ed bran
1 0.305 28.05 28.08 28.05 0.0006 0.006 0.29 0.769 0.763 2.5 5.74 1.81 7.55
7.17±0.53a 2 0.304 28.71 28.74 ND 0.0006 0.007 0.29 0.798 0.778 2.5 6.23 1.87 8.09
3 0.303 25.53 25.55 ND 0.0006 0.006 0.29 ND ND - 4.93 - -
Deprotei
nized
bran
1 0.302 26.10 26.11 ND 0.0008 ND 0.29 0.760 0.755 1 0.83 0.72 1.56
1.90±0.37b 2 0.300 28.05 28.05 28.05 0.0008 ND 0.29 0.793 0.792 1 0.95 0.76 1.72
3 0.305 28.71 28.72 28.71 0.0006 ND 0.29 0.795 0.813 1 1.54 0.76 2.31
4 0.306 25.53 25.53 ND 0.0006 ND 0.29 0.797 0.814 1 1.27 0.76 2.03
W: sample weight, X: weight of crucible + dry residue, Y: weight of crucible, Z: weight of crucible + ash, P: weight of protein, ODW = [(weight
of sample (g) × total solids (%))/100], D: dilution, AIL: acid insoluble lignin, ASL: acid soluble lignin, ABS: Absorbance at 320 nm, ND: not
detected.

205
Table B7. Glucan content of different bran fractions obtained.
Table B8. Xylan content of different bran fractions obtained.
Sample Replicate Sample
weight
Glucose
(mg/mL)
Glucose
(mg/mL)
ODW Anhydro
correction
Average
glucan (%)
Defatted bran 1 0.305 1.138 1.098 0.2966 0.9
29.40± 0.61 2 0.304 1.090 1.130 0.2950 0.9
Defatted -destarched
bran
1 0.305 0.728 0.729 0.2966 0.9
19.17± 0.90 2 0.304 0.666 0.693 0.2950 0.9
Deproteinized bran
1 0.302 0.057 0.052 0.2937 0.9
16.35± 1.18
2 0.300 0.062 0.060 0.2923 0.9
3 0.305 0.060 0.066 0.2965 0.9
4 0.306 0.069 0.064 0.2975 0.9
Sample Replicate Sample
weight
Xylose
(mg/mL)
Xylose
(mg/mL)
ODW Anhydro
correction
Average
xylan (%)
Defatted bran 1 0.305 0.317 0.323 0.2966 0.8
8.36± 0.17 2 0.304 0.322 0.332 0.2950 0.8
Defatted -
destarched bran
1 0.305 0.519 0.494 0.2966 0.8 12.83± 0.35
2 0.304 0.483 0.495 0.2950 0.8
Deproteinized bran
1 0.302 0.782 0.742 0.2937 0.8
20.14± 1.61 2 0.300 0.670 0.723 0.2923 0.8
3 0.305 0.854 0.827 0.2965 0.8
4 0.306 0.804 0.817 0.2975 0.8
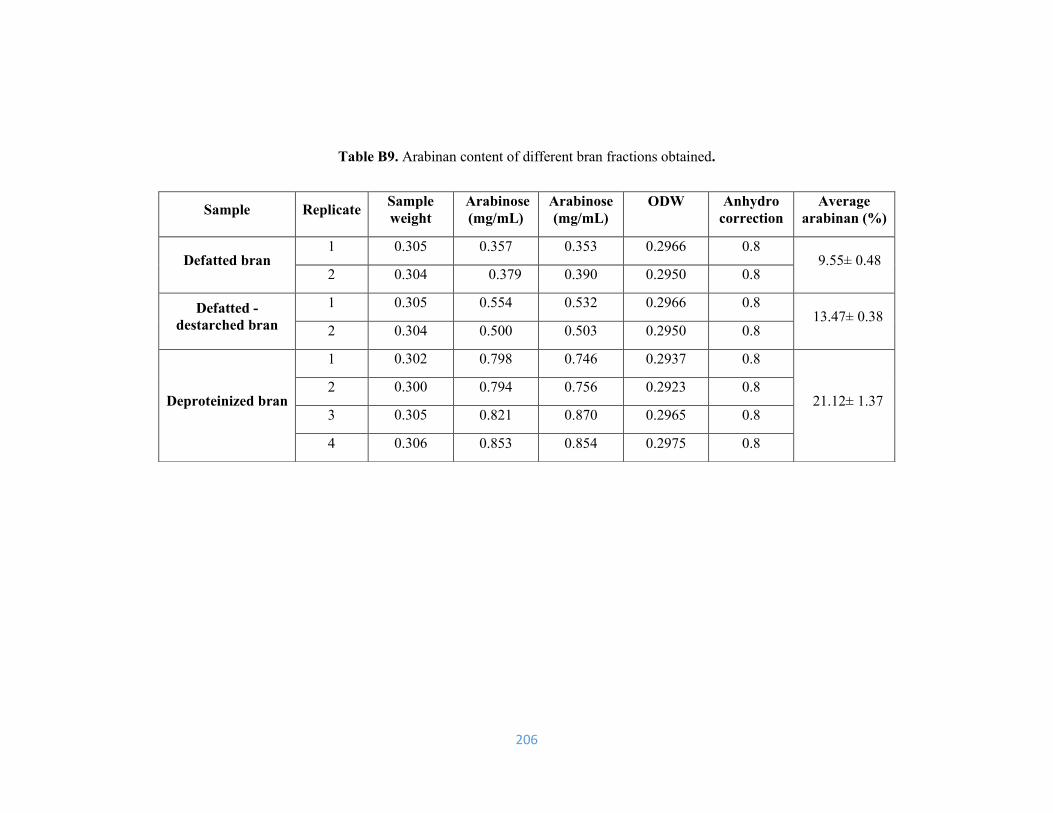
206
Table B9. Arabinan content of different bran fractions obtained.
Sample Replicate Sample
weight
Arabinose
(mg/mL)
Arabinose
(mg/mL)
ODW Anhydro
correction
Average
arabinan (%)
Defatted bran 1 0.305 0.357 0.353 0.2966 0.8
9.55± 0.48 2 0.304 0.379 0.390 0.2950 0.8
Defatted -
destarched bran
1 0.305 0.554 0.532 0.2966 0.8 13.47± 0.38
2 0.304 0.500 0.503 0.2950 0.8
Deproteinized bran
1 0.302 0.798 0.746 0.2937 0.8
21.12± 1.37 2 0.300 0.794 0.756 0.2923 0.8
3 0.305 0.821 0.870 0.2965 0.8
4 0.306 0.853 0.854 0.2975 0.8

207
Table B10. Reducing sugar of SCW hydrolysates collected at 50 bar and 0.5 mL/min.
Temperature
(°C)
Time
(min)
ABS
1
ABS
2
mg
xylose/mL
mg
xylose/mL
mg xylose mg
xylose
Average yield
(g/g bran wt%)
Average yield
(g/g bran wt%)
120
15 0.109 0.104 0.303 0.289 22.78 21.73 1.11 1.16 ± 0.07g
15 0.116 0.117 0.323 0.326 24.26 24.47 1.21
30 0.046 0.040 0.126 0.109 18.94 16.40 0.88 0.96 ± 0.11g
30 0.049 0.052 0.134 0.143 20.20 21.47 1.04
60 0.050 0.054 0.137 0.148 41.26 44.64 2.14 2.05 ± 0.13efg
60 0.052 0.043 0.143 0.117 42.95 35.34 1.95
140
15 0.201 0.195 0.563 0.546 42.23 40.96 2.08 2.06 ± 0.01fg
15 0.185 0.207 0.518 0.580 38.85 43.50 2.05
30 0.092 0.106 0.255 0.295 38.38 44.30 2.06 2.03 ± 0.05efg
30 0.088 0.103 0.244 0.286 36.69 43.03 1.99
60 0.096 0.102 0.267 0.284 80.15 85.23 4.13 3.85 ± 0.38def
60 0.088 0.084 0.233 0.244 73.39 70.01 3.58
160
15 0.206 0.212 0.577 0.594 43.29 44.56 2.19 2.63 ± 0.60defg
15 0.285 0.299 0.799 0.839 59.99 62.95 3.07
30 0.194 0.182 0.543 0.509 81.51 76.43 3.94 4.43 ± 0.68d
30 0.225 0.243 0.630 0.681 94.61 102.2 4.92
60 0.174 0.176 0.487 0.492 146.1 147.8 7.34 6.99 ± 0.49c
60 0.162 0.155 0.453 0.433 135.9 130.0 6.65
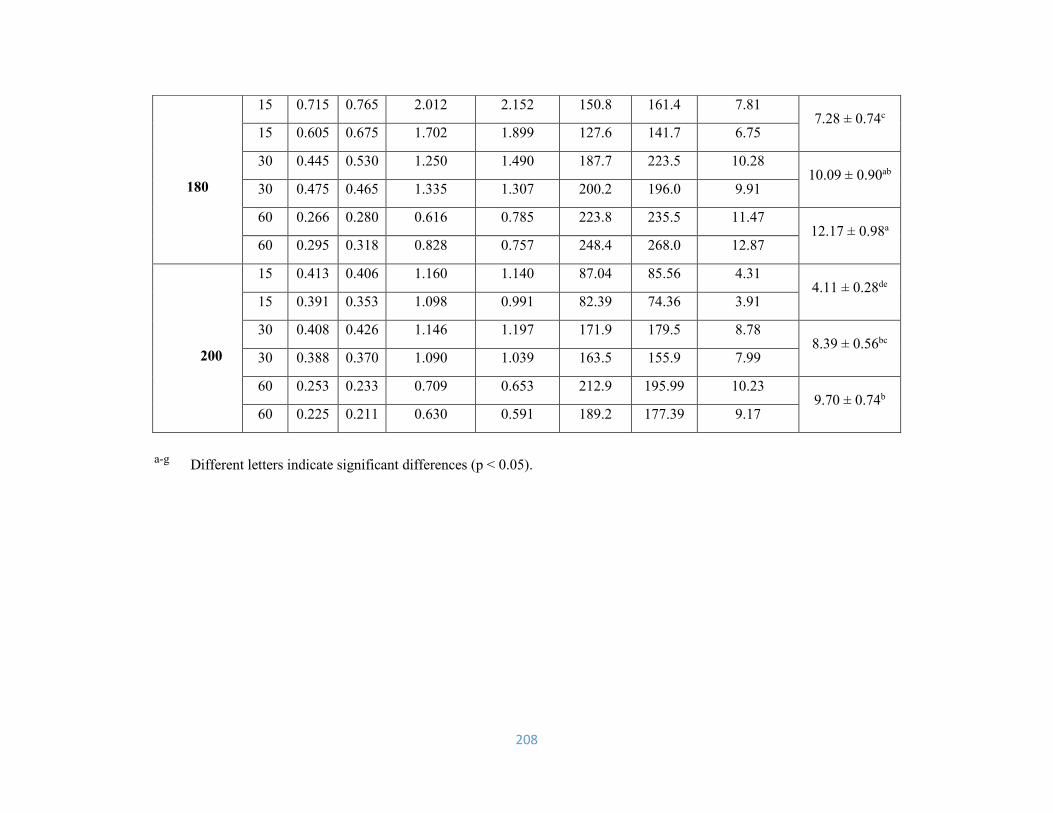
208
a-g Different letters indicate significant differences (p < 0.05).
180
15 0.715 0.765 2.012 2.152 150.8 161.4 7.81 7.28 ± 0.74c
15 0.605 0.675 1.702 1.899 127.6 141.7 6.75
30 0.445 0.530 1.250 1.490 187.7 223.5 10.28 10.09 ± 0.90ab
30 0.475 0.465 1.335 1.307 200.2 196.0 9.91
60 0.266 0.280 0.616 0.785 223.8 235.5 11.47 12.17 ± 0.98a
60 0.295 0.318 0.828 0.757 248.4 268.0 12.87
200
15 0.413 0.406 1.160 1.140 87.04 85.56 4.31 4.11 ± 0.28de
15 0.391 0.353 1.098 0.991 82.39 74.36 3.91
30 0.408 0.426 1.146 1.197 171.9 179.5 8.78 8.39 ± 0.56bc
30 0.388 0.370 1.090 1.039 163.5 155.9 7.99
60 0.253 0.233 0.709 0.653 212.9 195.99 10.23 9.70 ± 0.74b
60 0.225 0.211 0.630 0.591 189.2 177.39 9.17

209
Table B11. Reducing sugar of enzymatic hydrolysates using 2.5 U and 10 U xylanase.
ABS:Absorbance at 575 nm, a-c Different letters indicate significant differences (p < 0.05).
Enzyme unit
(U)
Time
(h)
ABS
1
ABS
2
mg
xylose/mL
mg
xylose/mL
mg
xylose
mg
xylose
Average yield
(g/g bran wt %)
Average yield
(g/g bran wt %)
Control - 0.018 0.023 0.047 0.061 0.47 0.61 - 0.24 ± 0.04
2.5
1 0.382 0.393 1.07 1.10 10.73 11.04 4.94 4.78 ± 0.23c
1 0.359 0.365 1.00 1.02 10.08 10.25 4.62
4 0.432 0.458 1.21 1.28 12.14 12.87 5.68 5.82 ± 0.19b
4 0.463 0.471 1.30 1.32 13.01 13.24 5.96
8 0.468 0.453 1.31 1.27 13.15 12.73 5.88 5.82 ± 0.08b
8 0.447 0.456 1.25 1.28 12.56 12.81 5.76
16 0.452 0.461 1.27 1.29 12.70 12.95 5.83 5.94 ± 0.16b
16 0.471 0.478 1.32 1.34 13.24 13.43 6.06
10
1 0.392 0.398 1.10 1.11 11.01 11.18 5.04 4.99 ± 0.07c
1 0.385 0.389 1.08 1.09 10.81 10.93 4.94
4 0.519 0.519 1.45 1.45 14.59 14.59 6.63 6.61 ± 0.03a
4 0.506 0.525 1.42 1.47 14.22 14.76 6.58
8 0.495 0.530 1.39 1.49 13.91 14.90 6.55 6.58 ± 0.05a
8 0.517 0.520 1.45 1.46 14.53 14.62 6.62
16 0.520 0.522 1.46 1.46 14.62 14.67 6.65 6.66 ± 0.00a
16 0.521 0.523 1.46 1.47 14.67 14.70 6.67

210
Table B12. Lipid extraction using SC-CO2 within a 10 mL vessel.
Temperature
(°C)
Pressure
(bar)
Time
(min)
Sample
weight
(g)
X
(g)
Y
(g)
Z
(g)
W
(g)
Average
cumulative
amount of lipid
(g)
40
200
30 3.0118 34.4624 34.6564 0.194 0.194 0.19 ± 00c
30 3.0415 34.4567 34.6427 0.186 0.186
60 3.0118 35.8721 35.9081 0.036 0.230 0.228 ± 002b
60 3.0415 34.4648 34.5048 0.04 0.226
90 3.0118 34.4264 34.4301 0.003 0.233 0.232 ± 002b
90 3.0415 35.7737 35.7782 0.004 0.230
120 3.0118 34.6228 34.6245 0.001 0.235 0.233 ± 002ab
120 3.0415 34.4442 34.4456 0.001 0.231
40
300
30 3.0196 35.888 36.1366 0.248 0.248 0.243 ± 007ab
30 3.0118 34.4116 34.6500 0.238 0.238
60 3.0196 34.8711 34.8721 0.001 0.249 0.245 ± 006ab
60 3.0118 35.888 35.8900 0.002 0.240
90 3.0196 34.4301 34.4301 0.000 0.249 0.248 ± 000a
90 3.0118 36.2221 36.2300 0.007 0.248
120 3.0196 35.7775 35.7775 0.000 0.249 0.250 ± 000a
120 3.0118 34.4575 34.4600 0.002 0.250
a-c, Different letters indicate significant differences (p < 0.05).

211
Table B12. Continued
Temperature
(°C)
Pressure
(bar)
Time
(min)
Sample
weight
(g)
X
(g)
Y
(g)
Z
(g)
W
(g)
Average
cumulative
amount of lipid
(g)
40
300
30 3.0196 35.8880 36.1366 0.248 0.248 0.243 ± 007B
30 3.0118 34.4116 34.6500 0.238 0.238
60 3.0196 34.8711 34.8721 0.001 0.249 0.245 ± 006B
60 3.0118 35.888 35.8900 0.002 0.240
90 3.0196 34.4301 34.4301 0.000 0.249 0.248 ± 000B
90 3.0118 36.2221 36.2300 0.007 0.248
120 3.0196 35.7775 35.7775 0.000 0.249 0.250 ± 000B
120 3.0118 34.4575 34.4600 0.002 0.250
70
300
30 3.0229 34.8700 35.135 0.265 0.265 0.267 ± 003A
30 3.0300 35.7752 36.0453 0.270 0.270
60 3.0229 34.6248 34.6316 0.006 0.271 0.275 ± 004A
60 3.0300 34.8710 34.8794 0.008 0.278
90 3.0229 35.8884 35.8904 0.002 0.273 0.276 ± 003A
90 3.0300 34.4617 34.4626 0.000 0.279
120 3.0229 34.3945 34.4010 0.006 0.280 0.279 ± 0.00A
120 3.0300 35.8897 35.8897 0.000 0.279
X: weight of empty tube, Y: weight of tube + lipid, Z: weight of lipid extracted, W: weight of cumulative amount of lipid.
A-B Different letters indicate significant differences (p < 0.05).

212
DP
: Deg
ree of p
oly
merizatio
n, an
d X
OS
: Xylo
-olig
osacch
arides.
1
3
Mo
lecula
r
weig
ht cu
t
off
(kD
a)
Mem
bra
ne
AP
PE
ND
IX C
. XO
S p
urifica
tion
usin
g filtra
tion
an
d a
dso
rp
tion
.
Ta
ble
C.1
. XO
S co
nten
t and
recov
ery after u
ltrafiltration o
f SC
W d
efatted-d
estarched
bran
hydro
lysate b
y 3
and
1 k
Da m
emb
ranes.
Reten
tate C
Perm
eate C
Reten
tate A
Perm
eate A
Reten
tate B
Perm
eate B
Fra
ction
43
08
6
60
44
18
45
22
55
84
19
09
36
82
54
.5
DP
˃ 1
2
(area
)
0.3
7±
0.0
0
1.1
5±
0.0
0
2.7
4±
0.0
2
4.0
2±
0.1
1a
3.2
6±
0.3
8
4.5
1±
0.2
5a
Xy
lotetra
ose
XO
S co
nten
t
(mg)
0.9
4±
0.0
6
1.8
3±
0.0
9
2.9
2±
0.5
1
8.3
7±
0.4
1a
3.2
1±
0.1
0
6.7
0±
0.5
7a
Xylo
triose
0.1
9±
0.0
2
0.9
4±
0.0
3
1.2
3±
0.1
2
6.8
7±
0.1
0a
1.2
0±
0.2
4
5.4
4±
0.5
7a
Xylo
bio
se
1.5
2±
0.0
3
3.9
3±
0.0
4
6.9
0±
0.6
6
19.2
7±
0.9
b
7.6
8±
0.2
4
16.6
6±
0.2
5a
Tota
l XO
S
1.7
4±
0.0
2
3.1
5±
0.0
1
7.5
1±
0.0
3
11.0
2±
0.3
0
8.9
4±
1.0
4
12.3
6±
0.6
9
Xylo
tetraose
XO
S reco
very
(% to
tal in
itial X
OS
)
2.5
9±
0.1
8
5.0
1±
0.2
4
8.0
1±
0.7
1
22
.93
±1
.13
8.8
1±
0.2
9
18
.35
±1
.57
Xy
lotrio
se
0.5
4±
0.0
6
2.6
0±
0.1
0
3.9
3±
0.1
7
18.8
3±
0.2
9
3.3
0±
0.6
6
14.9
±1.5
6
Xy
lob
iose
4.1
7±
0.0
9
10
.77
±0
.12
18
.92
±0
.91
52
.79
±0
.54
21
.05
±0
.66
45
.63
±1
.33
To
tal X
OS
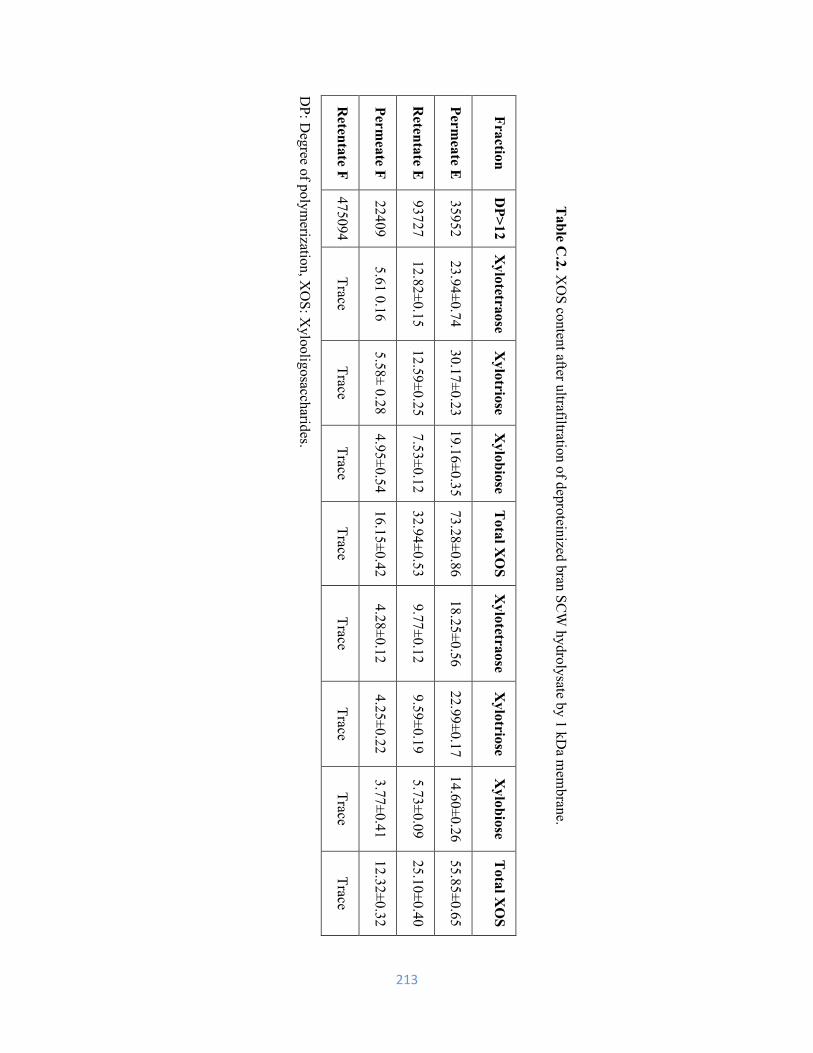
213
DP
: Deg
ree of p
oly
merizatio
n, X
OS
: Xy
loo
ligosacch
arides.
Reten
tate F
Perm
eate F
Reten
tate E
Perm
eate E
Fra
ction
Ta
ble
C.2
. XO
S co
nten
t after ultrafiltratio
n o
f dep
rotein
ized b
ran S
CW
hydro
lysate b
y 1
kD
a mem
bran
e.
47
50
94
22
40
9
93
72
7
35
95
2
DP
>1
2
Trace
5.6
1 0
.16
12
.82
±0
.15
23
.94
±0
.74
Xy
lotetra
ose
(mg)
Trace
5.5
8±
0.2
8
12
.59±
0.2
5
30
.17±
0.2
3
Xy
lotrio
se
(mg)
Trace
4.9
5±
0.5
4
7.5
3±
0.1
2
19.1
6±
0.3
5
Xylo
bio
se
(mg)
Trace
16.1
5±
0.4
2
32.9
4±
0.5
3
73.2
8±
0.8
6
Tota
l XO
S
(mg)
Trace
4.2
8±
0.1
2
9.7
7±
0.1
2
18.2
5±
0.5
6
Xylo
tetraose
(%)
Trace
4.2
5±
0.2
2
9.5
9±
0.1
9
22
.99
±0
.17
Xy
lotrio
se
(%)
Trace
3.7
7±
0.4
1
5.7
3±
0.0
9
14.6
0±
0.2
6
Xy
lob
iose
(%)
Trace
12
.32
±0.3
2
25
.10
±0.4
0
55
.85
±0.6
5
To
tal X
OS
(%)
Related Documents