Oleogelation as a strategy to prevent migration-induced fat bloom Inês Sofia Tomé Martins Thesis to obtain the Master of Science Degree in Biological Engineering Supervisors: Claudia Delbaere Professor Marília Clemente Velez Mateus Examination Committee Chairperson: Professor Cláudia Alexandra Martins Lobato da Silva Supervisor: Professor Marília Clemente Velez Mateus Member of the Committee: Professor Carla da Conceição Caramujo Rocha de Carvalho October 2017

Welcome message from author
This document is posted to help you gain knowledge. Please leave a comment to let me know what you think about it! Share it to your friends and learn new things together.
Transcript

Oleogelation as a strategy to prevent migration-induced fat
bloom
Inês Sofia Tomé Martins
Thesis to obtain the Master of Science Degree in
Biological Engineering
Supervisors: Claudia Delbaere
Professor Marília Clemente Velez Mateus
Examination Committee
Chairperson: Professor Cláudia Alexandra Martins Lobato da Silva
Supervisor: Professor Marília Clemente Velez Mateus
Member of the Committee: Professor Carla da Conceição Caramujo Rocha de
Carvalho
October 2017

ii

iii
Acknowledgements
I would like to express my sincere gratitude to my supervisor in Gent, Claudia Delbaere, for all the
precious information, help and valuable answers to all the questions. I also wanted to thank Catherine
Standaert for always having valuable insights to give. To Beatrijs Vermeule, a major thank you for the
tremendous help in the laboratory and for always keeping a smile and an amazing spirit while working.
To all the people from the FTE lab a very big thank you for the help and participation in my project!
I am forever thankful to my Erasmus family for helping to turn this period in an adventure of a lifetime
and turning Gent into home.
A big thank you to Professor Marília Mateus who was always concerned about my work progress and
always ready to answer all my questions, despite far away.
A major thank you to Adriana, Catarina, Danylo, Gonçalo, Joana, Tiago, Tomás and Susana for being
a constant presence in these past five years and turning them into the best ones of my life.
To Catarina, Diogo, Francisco, Gonçalo, Mahomed, Margarida, Rodrigo and Teresa I am truly grateful
for growing with me and being there for me in every moment of my life. To Mateus, I cannot thank
enough for always being a rock-solid support and making me a better person.
Finally, I am truly grateful to my family for all the support and affection! Nothing would have been possible
without the unconditional love from my parents, who always believed in me and supported me in every
moment. To my brother, thank you for turning me into a more kind and understandable person, I am
proud of you.

iv

v
Resumo O principal problema a afetar chocolates recheados é o aparecimento de fat bloom, cristalização
incorreta de manteiga de cacau à superfície do chocolate. A técnica de oleogelação apresenta cada
vez mais sucesso na estruturação de misturas lipídicas.
No presente trabalho, a técnica de oleogelação para retardar o aparecimento de fat bloom foi
primeiramente avaliada em misturas de manteiga de cacau, óleo de avelã e diferentes concentrações
de ceras. As amostras com cera levaram à formação de maior número de cristais e nas amostras com
cera 1, uma rede de cristais de cera foi visualizada. A adição das ceras levou ao aumento da resistência
à deformação e das gamas de temperatura de cristalização e fusão. A adição destes compostos não
afetou significativamente o teor em gordura.
Nos recheios de avelã a adição de ceras inibiu o fenómeno de pós-cristalização. Em geral, as amostras
com cera mostraram um comportamento viscoso mais acentuado que o controlo e as amostras com
cera 2 revelaram também diferente perfil de fusão dos recheios.
Das análises aos sistemas modelo concluiu-se que as amostras com cera mostraram quantidades de
migração de óleo menores até à semana 4 de testes de degradação acelerada. Na semana 8, as
amostras controlo e de cera 1 mostraram desempenhos semelhantes enquanto que as de cera 2
revelaram maior de migração de óleo. Através dos painéis de avaliação visual de fat bloom todas as
amostras mostraram desempenho semelhante até à semana 4, sendo que após a mesma as amostras
de cera devolveram piores resultados.
Palavras-chave: Ceras, fat bloom, migração de óleo, misturas lipídicas, oleogelação, recheios de
avelã.

vi

vii
Abstract Fat bloom, incorrect crystallization of cocoa butter on chocolates surface, has been reported by
manufacturers as the number one problem affecting filled chocolates and the use of oleogelation to
structure lipid blends has shown successful results.
In this study, the potential of oleogelation to retard fat bloom formation was evaluated first through the
analysis of cocoa butter and hazelnut oil blends with different concentrations of waxes. The addition of
waxes led to higher amount of crystals formed and, in the case of wax 1, a wax network was formed. It
was also visualized that the addition of waxes led to a higher resistance to deformation and to an
increase in the melting and crystallization temperatures ranges. It was concluded that the solid fat
content of the samples was not affected significantly by the addition of waxes.
In the hazelnut based fillings, the addition of waxes prevented the phenomena of post-crystallization. In
general, wax containing samples showed higher viscosity behavior than control samples and the wax 2
samples also revealed an altered melting behavior of the fillings.
From the analysis on the model systems, the wax samples showed lower amounts of oil migration until
week 4 of the accelerated storage tests, after which the wax 1 and control samples revealed similar
levels of this parameter, and the wax 2 samples presented higher oil migration levels. Through the fat
bloom assessments in the filled chocolates all samples showed similar fat bloom score until week 4,
after which wax samples showed worse performance.
Keywords: Lipid blends, fat bloom, hazelnut fillings, oil migration, oleogelation, wax.

viii

ix
Table of Contents
Acknowledgements ............................................................................................................... iii
Resumo .................................................................................................................................. v
Abstract ................................................................................................................................ vii
Table of Contents .................................................................................................................. ix
List of Tables ....................................................................................................................... xiii
List of Figures ....................................................................................................................... xv
List of Abbreviations ........................................................................................................... xvii
1. Introduction ................................................................................................................... 1
1.1. Chocolate ................................................................................................................ 1
1.2. Filled chocolates ...................................................................................................... 2
1.3. Fat bloom ................................................................................................................ 3
1.4. Oil migration ............................................................................................................ 3
1.5. Microstructure, polymorphic transitions, oil migration and fat bloom ........................ 5
1.6. Strategies to inhibit fat bloom formation ................................................................... 5
1.6.1. Anti-blooming agents ........................................................................................ 7
1.6.1.1. Emulsifiers .................................................................................................. 7
1.6.1.1.1. Lecithin ................................................................................................ 7
1.6.1.1.2. Polyglycerol polyricinoleate (PGPR) ..................................................... 8
1.6.1.1.3. Specific DAG’s from vegetable fats ...................................................... 9
1.6.1.1.4. Sorbitan esters ..................................................................................... 9
1.6.1.1.5. Sucrose esters of fatty acids ...............................................................10
1.6.1.2. Milk fat .......................................................................................................11
1.6.1.3. Vegetable fats ...........................................................................................11
1.6.1.3.1. Legislation ...........................................................................................12
1.6.1.3.2. Specific TAG’s from vegetable fats .....................................................12
1.6.1.3.3. Commercially available anti-bloom fats ...............................................13
1.6.1.4. Silicon dioxide ...........................................................................................14
1.6.2. Oleogelation .....................................................................................................14
1.7. Conclusion and goals of the project ........................................................................16
2. Materials and methods ...............................................................................................17
2.1. Materials .................................................................................................................17
2.2. Methods .................................................................................................................17
x
2.2.1. Preparation of hazelnut oil and cocoa butter based oleogels............................17
2.2.2. Preparation of the hazelnut based fillings (HF) .................................................17
2.2.3. Hardness measurements .................................................................................18
2.2.4. Rheological measurements ..............................................................................18
2.2.5. Thermal behavior .............................................................................................19
2.2.6. Crystal morphology ..........................................................................................19
2.2.7. Solid fat content ...............................................................................................19
2.2.8. Production of filled chocolates ..........................................................................20
2.2.9. Accelerated shelf life tests ...............................................................................20
2.2.9.1. Fat bloom assessment ..............................................................................20
2.2.9.2. Color measurement ...................................................................................20
2.2.9.3. Pictures .....................................................................................................20
2.2.10. Production of model systems .........................................................................21
2.2.11. Oil migration ...................................................................................................21
2.2.12. Statistical Analysis .........................................................................................22
3. Results and discussion .......................................................................................23
3.1.Initial studies and decision of conditions ..................................................................23
3.1.1. Hardness measurements and initial studies in the lipid blends .........................23
3.1.2. Hardness measurements and initial studies in the hazelnut based fillings ........25
3.1.3. Evaluation of cooling conditions of 80:20 (HP:DC) ...........................................26
3.2. Lipid blends analysis ..............................................................................................27
3.2.1. Microstructure ..................................................................................................27
3.2.2. Rheology behavior ...........................................................................................30
3.2.3. Crystallization and melting profile .....................................................................33
3.2.3.1. Crystallization profile .................................................................................33
3.2.3.2. Melting profile ............................................................................................37
3.2.4. Solid fat content ...............................................................................................39
3.2.5. Visual assessment ...........................................................................................42
3.3. Hazelnut based fillings ............................................................................................43
3.3.1. Hardness measurements .................................................................................43
3.3.2. Determination of the flow behavior at 40°C ......................................................44
3.3.3. Melting behavior ...............................................................................................46
3.4. Filled chocolates .....................................................................................................48
3.4.1. Color ................................................................................................................48
3.4.1.1. Qualitative Analysis ...................................................................................48

xi
3.4.1.2. Quantitative Analysis .................................................................................49
3.4.2. Visual fat bloom assessment ...............................................................................50
3.5. Model systems .......................................................................................................53
3.5.1. Oil migration .....................................................................................................53
4. Conclusions and Future Work ............................................................................56
5. Bibliography ...........................................................................................................59
Annex A...............................................................................................................................65
A.1. Considerations regarding calculations of fat content ..................................................65
Annex B...............................................................................................................................66
B.1. Significant differences in the rheological parameters of the lipid blends ......................66
B.2. Significant differences in the crystallization behavior parameters of the lipid blends .....67
Annex C...............................................................................................................................68
C.1. Color measurements of the filled chocolates for week 4 for analysis ..........................68

xii

xiii
List of Tables
Table 1.1. Commercially available anti-bloom fats and known detail .................................................. 13
Table 2.1. Base composition of the control fat blends .......................................................................... 17
Table 2.2. Base composition of the control hazelnut paste .................................................................. 18
Table 3.1. Maximum force, in Newton, after cooling for 1h30 at 15°C for the hazelnut fillings ............ 26
Table 3.2. Maximum force, in Newton, after cooling for 1h30 at 5°C for the hazelnut fillings .............. 26
Table 3.3. Complex modulus, |G*|, and tan(δ): rheology experiments parameters of the lipid blend .. 33
Table 3.4. Maximum temperature of crystallization and melting peaks, melting enthalpies and onset
and offset temperature of crystallization and melting respectively, of the wax-based lipid blends ....... 39
Table 3.5. Casson model parameters for the viscosity behavior of the hazelnut based fillings ........... 46
Table 3.6. Characterizing parameters of the melting behavior of the hazelnut based fillings .............. 47
Table 3.7. Color measurements parameters for the filled chocolates after week 1 .............................. 50
Table 3.8. Color measurements parameters for the filled chocolates after week 8 .............................. 50
Table 3.9. Total fat bloom score for all the samples by week 4 and 8, based on the surface glossiness
of the chocolates, the decrease in intensity of the gloss regarding reference samples and the fat bloom
appearance in the surface ..................................................................................................................... 52
Table 3.10. Oil migration characterizing ratios for week 3 .................................................................... 53
Table 3.11. Oil migration characterizing ratios for week 8 ................................................................... 54
Table 3.12. Oil migration characterizing ratios for week 13 .................................................................. 55
Table B.1. Significant differences of tan (δ) of all the lipid blend samples, after 1h at 20°C ................ 66
Table B.2. Significant differences of |G*| of all the lipid blend samples, after cooling down to 5°C. .... 66
Table B.3. Significant differences of the crystallization enthalpy of the lipid blends............................. 67
Table C.1. Color measurements parameters for the filled chocolates after week 4. ........................... 68

xiv

xv
List of Figures
Figure 1.1. General structure formula of a TAG and chain length crystal structures ..............................2
Figure 1.2. Cocoa butter polymorphs organized according to their stability ..........................................2
Figure 1.3. Bloomed and unbloomed filled chocolates ............................................................................3
Figure 1.4. Oil migration in confectionary with an oily center and cocoa butter ......................................4
Figure 1.5. Chemical structure of soybean lecithin..................................................................................8
Figure 1.6. Chemical structure of PGPR .................................................................................................8
Figure 1.7. Chemical structure of sorbitan monostereate and sorbitan tristereate .............................. 10
Figure 1.8. General structure of sucrose monoester of fatty acids ....................................................... 10
Figure 1.9. Shellac wax and rapeseed oil oleogel, with varying concentrations of wax ....................... 15
Figure 1.10. Minimum concentration of different natural waxes in rice bran oil to create an oleogel-like
structure ................................................................................................................................................. 15
Figure 3.1. Samples of wax 1 c% in a proportion of 60:40 of (HP:DC) after storage at 20°C for 24 hours
and 11°C for 1h30min. ........................................................................................................................... 23
Figure 3.2. Direct comparison between the measurements obtained for wax 1 g% and wax 2 h% cooled
for 1h30 at 11°C and afterwards kept for 24h at 20°C. ......................................................................... 24
Figure 3.3. Direct comparison between the measurements obtained for wax 1 g% and wax 2 h% cooled
for 1h30 at 5°C. ..................................................................................................................................... 25
Figure 3.4. Variation of sample hardness with the variation of content in hazelnut filling and
concentration of wax. The samples were cooled for 1h30 at 11°C and kept for 24h at 20°C ............... 25
Figure 3.5. Crystal morphology, under polarized light microscopy, of the control sample. Picture taken
after the cooling of the sample until 5°C, 1-hour isothermal period; increase in temperature to 20°C and
1-hour isothermal period. ....................................................................................................................... 27
Figure 3.6. Morphology of the crystals for samples with increasing concentration of wax 1 evaluated
under polarized light microscopy ........................................................................................................... 28
Figure 3.7. Crystallization pattern for samples with increasing concentration of wax 2 evaluated under
polarized light microscopy ..................................................................................................................... 29
Figure 3.8. Crystal morphology of the mixture of the lipid blends wax 1 3% with 15% sugar. ............. 30
Figure 3.9. Exemplificative graph of complex modulus, |G*|, variation with temperature .................... 31
Figure 3.10. Crystallization profile, obtained by differential scanning colorimetry, of hazelnut oil and
cocoa butter lipid blends with different concentrations of wax 1 ........................................................... 34
Figure 3.11. Crystallization profile, obtained by differential scanning colorimetry, of hazelnut oil and
cocoa butter lipid blends with different concentrations of wax 2. .......................................................... 35
Figure 3.12. Melting profile, obtained by differential scanning colorimetry, of lipid blends with different
concentrations of wax 1. ........................................................................................................................ 37
Figure 3.13. Melting profile, obtained by differential scanning colorimetry, of lipid blends with different
concentrations of wax 2. ........................................................................................................................ 38

xvi
Figure 3.14. Solid fat content (SFC) profile of the lipid blends containing wax 1. ................................ 40
Figure 3.15. Solid fat content (SFC) profile of the lipid blends containing wax 2. ................................ 41
Figure 3.16. Wax 1 samples after NMR measurements, increasing concentration of wax from left to
right (a% to e%) ..................................................................................................................................... 41
Figure 3.17. Visual aspect of wax 1 samples and control .................................................................... 42
Figure 3.18. Visual aspect of wax 2 samples and control .................................................................... 42
Figure 3.19. Hardness of the hazelnut based fillings, 24h and 7 days after production, as a function of
wax concentration. ................................................................................................................................. 43
Figure 3.20a. Shear stress (Pa) variation with shear rate (s-1) for the hazelnut based fillings ............ 45
Figure 3.20b. Viscosity (Pa.s) variation with shear rate (s-1) for the hazelnut based fillings ............... 45
Figure 3.21. Melting behavior of the hazelnut based fillings ................................................................ 47
Figure 3.22. Evolution of the filled chocolates appearance with time of storage at 23°C, for all the
concentrations in study .......................................................................................................................... 48
Figure 3.23a. Fat bloom assessment results regarding the percentage of surface of the filled chocolates
of each sample with no gloss ................................................................................................................ 51
Figure 3.23b. Fat bloom assessment results regarding the decrease of intensity of gloss in the filled
chocolates of each sample, when compared to the reference .............................................................. 51
Figure 3.23c. Fat bloom assessment results on the percentage of surface of the filled chocolates of
each sample with fat bloom ................................................................................................................... 51

xvii
List of Abbreviations
ΔE* - Total change of color compared to control sample
a* – Red/green index
AMF – Anhydrous milk fat
b* – Yellow/blue index
BOB - 1-behenyl-2-oleoyl-behenyl
CB – Cocoa butter
CBE – Cocoa butter equivalent
CBR – Cocoa butter replacers
CBS – Cocoa butter substitutes
DAG - Diacylglycerol
DC – Dark chocolate
DSC – Differential scanning calorimetry
Fmax – Maximum strength
|G*| - Complex modulus
HCSO - Hydrogenated cottonseed oil
HF – Hazelnut based fillings
HP – Hazelnut paste
HPLC – High performance liquid chromatography
L* – Lightness index
LOO - Linoleoyldioleoylglycerol
MF – Milk fat
NMR – Nuclear Magnetic Resonance
OOO – Triolein
PGPR - Polyglycerol polyricinoleate
PLM – Polarized light microscopy

xviii
POP - 1,3-dipalmitoyl-2-oleoyl-glycerol
POSt - rac-palmitoylstearoyl-2-oleoyl-glycerol
SCE – Specular component excluded
SCI – Specular component included
SEFA - Sucrose ester of fatty acids
SFC – Solid fat content
SME – Small or medium companies
SMS - Sorbitan monostereate
StOSt - 1,3-stearoyl-2-oleoyl-glycerol
STS - Sorbitan tristearate
StStSt – Tristearin
TAG – Triacylglycerol
tan(δ) – Rheological parameter
wt% - Weight percentage

1
1. Introduction
1.1. Chocolate
Chocolate, or more in specific the cocoa bean, started to be prized by the Mayans and Aztecs for the drink
that it produced, called chocolatl. According to legends, Montezuma II, the emperor of the Aztecs,
consumed 50 cups of this drink every day. Besides being the basis for this drink, cocoa beans were also
used as a form of currency amongst the Aztecs. These beans were first brought to Europe by Columbus
but largely ignored until a Spanish explorer, Cortez, arrived in Mexico in 1519 and was given cups of
chocolatl to taste. Cortez then introduced the drink to the Spanish aristocracy, after adding sugar to adapt
it more to the European taste, leading to the creation of chocolate drinking houses throughout Europe1.
It was only in 1828, when Van Houten in The Netherlands found a way of extracting the fat (cocoa butter)
from the beans and joining it to a mixture of powdered bean and sugar, that the first solid chocolate bars
were produced. In 1847, Fry in Bristol included the introduction of steam presses to separate the fat more
easily and thereby produce the first bars of plain chocolate. Milk chocolate was only developed 30 years
later1.
Nowadays, the production of chocolate is a significant industry in Europe. In 2010 over 200 000 people in
Europe were involved in the chocolate manufacture industry in over 2000 companies, 90% being small or
medium companies (SME’s). In the chocolate market the annual production exceeds 3.5 million metric tons
and exports chocolate for a value of more than €3.3 billion2. Chocolate is known as a suspension mainly
composed of sugar - usually crystalline sucrose - cocoa solids and fat: cocoa butter (CB) and milk fat (MF)3.
Cocoa solids correspond to the non-fat part of the cocoa beans and these can be introduced as cocoa
powder or as cocoa liquor, the latter being the most common way4. Cocoa liquor consists of the roasted,
dehulled, ground substance obtained from fermented, dried cocoa beans, the seeds of the Theobroma
cacao tree5.
Cocoa butter is extracted from de-shelled cocoa beans. It is the main fat used in chocolate, forms the
continuous fat phase that supports the nonfat ingredients and gives chocolate the quality attributes that
consumers are used to: glossy surface, characteristic snap, heat stability, mouthfeel, flavor release and
shelf-life6. CB has a relatively simple triacylglycerol (TAG) composition compared to other fats. The general
composition of TAGs can be consulted in Figure 1.1. The most abundant TAGs in cocoa butter are: 1,3-
dipalmitoyl-2-oleoyl-glycerol (POP), rac-palmitoylstearoyl-2-oleoyl-glycerol (POSt) and 1,3-stearoyl-2-
oleoyl-glycerol (StOSt). The amount can vary depending on the origin of the seeds but a general percentage
can be defined as 35, 23 and 15 % of POSt, StOSt and POP, respectively7.

2
Figure 1.1. Adapted figure of general structure formula of a TAG (left). In the case of cocoa butter, the position 1 and
3 are occupied by palmitic and stearic acid and the position 2 by oleic acid. Double of triple chain length crystal
structures (right)8.
Triacylglycerols can then be packed into double or triple chain length crystal structures (Figure 1.1). Cocoa
butter TAGs, due to the positioned regularity of oleic acid in the 2-position, have the tendency to form triple
chain length crystal structures, which gives the most favorable thermodynamic structure in this case.
Fats can exist in more than one crystalline form, polymorphism, and each form, despite of having the same
chemical composition differs in the melting properties. Due to its TAG composition, cocoa butter has six
different polymorphic forms. The usual classification of polymorphs of cocoa butter is based on the Roman
nomenclature, from I to VI, the former being the least stable and the latter being the most stable form.
However, it is possible to find the Greek nomenclature: α, γ, β’,βV and βVI (the latter being the most stable
form)8 (Figure 1.2). Since βVI is the most stable polyform, this form will eventually develop during storage,
even though the transformation of the polyform βV to βVI can only happen through a solid to solid transition
and not from liquid cocoa butter. Since the most adequate polyform for storage of processed chocolates is
form V, during the production of chocolate there is the necessity to precrystallize or temper chocolate8.
Figure 1.2. Cocoa butter polymorphs organized according to their stability, adapted from Marangoni & Wesdorp
(2013)10.
1.2. Filled Chocolates
In a market dominated by multinational companies, SME’s can compete through the creation and
production of exclusive and specific products like filled chocolates, a niche-oriented part of the market.

3
These products have a more complex way of production than simple chocolates like chocolate tablets or
block molded chocolates11.
The number one quality problem in filled chocolates is fat bloom. Due to the high complexity of the filled
chocolates, and due to the interaction between the chocolate coating and the filling fats, these chocolates
are more prone to this problem. The appearance of fat bloom leads to consequences such as softening of
the coating, hardening of the filling and deterioration in sensory quality11.
1.3. Fat Bloom
Fat bloom can be encountered in the chocolate industry in two different types: oil migration induced fat
bloom or polymorphic transition induced fat bloom. The former relates to the migration of liquid oil from nut-
oil filled centers to the chocolate shell, leading to the dissolution of solid cocoa butter crystals and inducing
them to recrystallize into the βVI form. The latter relates to the polymorphic transition of cocoa butter, in the
solid state, from βV to βVI. Given that this polyform, βVI, is characterized by the formation of needle-like
crystals which protrude above the chocolate surface, this will lead to the scattering of the incident light and
the perception of a white-grayish haze12 (Figure 1.3).
Figure 1.3. Unbloomed and fresh chocolate praline (left); a heavily fat bloomed chocolate praline (right), adapted
from Dahlenborg (2014)8.
1.4. Oil migration
Considering that in products like filled chocolates there is a high contrast between the composition of the
chocolate coating and the filling, the phenomenon of oil migration is very common.
Since biologic systems always tend to a chemical and thermodynamic balance, the oil in the filling phase
migrates to the chocolate shell to equalize both the compositions (Figure 1.4). Liquid fat from the chocolate
shell also migrates into the filling, but to a lesser extent13.
Fat bloom

4
Figure 1.4. a) Schematic representation of oil migration in confectionary with an oily center and cocoa butter. b)
Evolution of the oil migration in both sides until the equilibrium is reached, adapted from Smith et al. (2007)13.
The mechanisms through which this movement happens are not completely understood but the most
accepted theories are the migration through capillary movement and through diffusion.
Diffusion has been the most suggested theory to explain oil migration. This is the process through which
the TAG molecules diffuse, in a random way, from a region with a high concentration to another with lower
concentration of TAGs, and in that way achieve a thermodynamic balance between the filling and the
chocolate shell13. Diffusion only based models are often used to represent this movement3,14,15,16,17,18,19,20.
McCarthy and McCarthy (2008) studied oil migration in model systems composed of a two-layer peanut
butter and chocolate model system and evaluated mechanisms of movement, having compared them
posteriorly to a Fickian-based mathematical model. They concluded that the fickian model was not enough
to predict the migration of the peanut butter oil into chocolate16. Due to this some other researchers have
suggested that a mechanism other than diffusion, e.g. capillary pressure, is responsible for oil migration.
Capillary forces might also have an influence on oil migration since the liquid fractions of the fat are likely
to move through defect structures such as interparticle pores, crevices or cracks1. Aguilera, Michel and
Mayor (2004) demonstrated that the capillary forces might have an important role in oil migration21. Van
Der Weeën, De Clercq, Dewettinck and De Baets (2012) developed a cellular automaton based model
considering both capillary and diffusion movement to represent oil migration and were able to represent
successfully the migration of fat quantitatively22.
Another existing theory is based on the fact that when cocoa butter melts, since the density of the liquid
cocoa butter is lower than the density of the solid phase, there will be an increase in volume. This increase
will push the liquid through cracks and pores towards the surface, which might lead to the appearance of
fat bloom8. This theory is then based on the principle of pressure driven convective flow.
oily center

5
1.5. Microstructure, polymorphic transitions, oil migration and fat
bloom
When considering fat bloom formation another important parameter to take into account is the
microstructure of the chocolate and filling. Dahlenborg (2014) performed studies on the influence of
chocolate microstructure on oil migration and fat bloom. Non-fat particles (powdered sugar; cocoa particles
and defatted cocoa particles) were added to the cocoa butter shells, where the shells were stored against
a reference filling. The results of oil migration in the systems were compared against a reference model
system with shells composed only of cocoa butter and it was verified that the addition of non-fat particles
led to a noticeably higher migration rate compared to the reference samples. These results were correlated
to surface microstructure results where the samples with non-fat particles showed a higher frequency of fat
bloom crystals and a higher rate of surface roughness8. Equivalent results were presented by Motwani et
al. (2011), who performed oil migration tests in model systems of cocoa butter, with or without cocoa
powder, suspended in peanut oil23.
The particle size of the non-fat particles can also have an influence on the oil migration in filled chocolates,
as proven by Altimiras et al. (2007)24 and Dahlenborg et al. (2015)25. Altimiras et al. (2007) performed
studies on fat migration in cocoa butter model bars, made of sand particles of three different sizes and
cocoa butter. The results showed that the bars with lower particle size of sand had the higher fat migration24.
Dahlenborg et al. (2015) investigated the effect of the particle size by preparing chocolate samples with
varied particle size (15, 22 and 40 µm) and concluded that the samples with smaller particles showed a
higher migration rate25.
Smith et al. (2007) reported that even small additions of nut oil have a significant impact on the rate of
transformation of cocoa butter crystals from βv to βVI. In this paper the appearance of bloom formation and,
therefore, its relationship with the polymorphic transformation and oil migration was not evaluated13.
Ziegleder & Schwingshandl (1998) established a clear correlation between oil migration and the trigger of
fat bloom, but not with the growth and development26. Sonwai and Rousseau (2006) verified that the
polymorphic transition of βv to βVI in CB tempered samples happened 1 week after storage at 25ºC while
the surface structure only changed after week 3, confirming the possibility that fat bloom is not only
dependent on the polymorphic transition but also on crystal development and growth27.
1.6. Strategies to inhibit fat bloom formation
The quality problem number one in filled chocolates is fat bloom. Due to the high complexity of filled
chocolates and due to the interaction between the chocolate coating and the filling fats, these chocolates
are more prone to this problem. The appearance of fat bloom leads to consequences such as softening of
the coating, hardening of the filling and deterioration in sensory quality28.

6
There are different approaches that can be considered to inhibit bloom formation by retarding oil migration
or by inhibiting polymorphic transitions. These approaches can be implemented by optimization or alteration
of chocolate processing conditions, through the optimization of storage conditions or through the addition
of anti-bloom agents to the filling, thereby through the alteration of the composition of the same29,30.
In general, the production of chocolate can be divided in different steps: mixing of the ingredients, refining,
conching and pre-crystallization (by tempering) of the chocolate1. In the refining step the chocolate is
processed in order to reduce the size of its particles and, in that way, obtain the creamy texture that
consumers are used to, justifying the importance of this process4.
Pre-crystallization of the chocolate is crucial to obtain a product that is more resistant to the formation of fat
bloom and it can be achieved through the tempering of the chocolate, which can be performed in two
different ways: the conventional way or through the addition of seed crystals. The tempering step consists
of the mechanic and thermal treatment during which crystals are formed and posteriorly act as seeds, from
which the remaining cocoa butter solidifies. Through pre-crystallization by seeding, pre-made seeds are
used to induce formation of crystals in the form βv8,31,32. The pre-crystallized product is then converted into
a confectionery product by moulding, enrobing or panning7. Before the demoulding step and storage the
product has to be cooled under controlled conditions, since a too fast or too slow step can cause fat bloom4.
After the cooling step the process of crystallization proceeds, including in this phase nucleation of new
crystals and crystal growth, Ostwald ripening, and continuing of polymorphic transformation7. Due to the
importance of this phase, several studies have already been conducted in order to find out the optimal
temperature of storage1,33,34,35,36.
More recently some authors have investigated the effect of the application of sub-zero or chilling treatment
prior to the conventional storage, as well as the application of a warm treatment, revealing that both short
high temperature treatments and low temperature treatments improved the resistance to fat bloom and oil
migration7,11 ,37,38,39 ,.
Another factor that can influence oil migration is the thickness of the chocolate shell in a filled chocolate.
The thinner the shell, the easier for the oil to migrate to the surface and promote fat bloom formation.
Despite the fact that a manufacturer would prefer a thin shell due to cost constraints and sensory
considerations, a thicker chocolate shell provides better stability34.
Finally, the alteration of the filling or coating compositions is also of major importance. In summary, the
higher the solid fat content and the lower the liquid fraction of a chocolate, the more resistant it is to
bloom4,34, and there are several agents that can be added in order to improve the anti-bloom performance
such as milk fat, vegetables fats and emulsifiers, as described in section 1.6.1.

7
1.6.1. Anti-blooming agents
Many studies have already been performed on anti-bloom agents (fat or nonfat), that can be added to filled
chocolates and retard or inhibit the appearance of fat bloom9,12 ,28,30,40,41.
1.6.1.1. Emulsifiers
Emulsifiers have as main goal to decrease the interactions between hydrophilic particles, mainly sugar, and
the surrounding fat. Through the addition of these components it is possible to reduce the amount of fat
necessary to maintain the flow properties of the chocolate. Since emulsifiers have an amphiphilic nature,
they have the ability to adsorb to the surface of sugar crystals with their hydrophilic head, while the lipophilic
tails orient towards the fat phase42.
Emulsifiers can affect the dynamics of crystallization and polymorphic transitions both by accelerating or
slowing them down. These compounds have also been reported as anti-bloom agents, since they promote
changes in the surface properties of lipids, resulting in changes related to the size and morphology of
crystals and crystalline density9.
A mechanism has been proposed to interpret the effects of emulsifiers on the crystallization of fats:
emulsifiers could undergo co-crystallization with the fat in case of similarity between the fatty acid chains.
According to this mechanism, the emulsifiers are associated with the TAG molecules by their hydrophobic
groups, specially through acyl-acyl interactions and, therefore, the acyl group of emulsifiers determines its
functionality in relation to TAGs. On the contrary, a structural dissimilarity would delay fat nucleation and
inhibit crystal growth43. The literature also shows that, in the solid-solid transformation, the effect of the
emulsifiers on the β → β’ is highly dependent on the chemical structure of both compounds. This can be
especially relevant when considering the prevention of the βV → βVI transition in cocoa butter. This
prevention requires emulsifiers with a high melting point, whose carbon chains must be packed with great
proximity to produce a rigid structure that limits the molecular mobility of TAG44.
According to Ribeiro et al. (2015), the emulsifiers with the greatest potential for anti-bloom effects include
natural lecithin and chemically modified lecithin, polyglycerol polyricinoleate, sorbitan esters of fatty acids
and sucrose esters9. Consequently, those are the ones that will be approached with more detail in the next
sections. Some specific DAG’s have also been studied as anti-bloom agents and therefore these will also
be included45,46.
1.6.1.1.1. Lecithin
One of the most common emulsifiers in the confectionery and chocolate industry is lecithin derived from
soybean oil (Figure 1.5). Despite the fact that soy lecithin is a common agent in these industries, there has

8
not been much research done on the influence of lecithin on the crystallization properties of fats and
chocolates4.
Figure 1.5. Chemical structure of soybean lecithin47
Afoakwa et al. (2008) introduced different concentrations of soy lecithin in chocolate48. The incorporation
of lecithin influenced the degree of crystallinity and the melting events of the chocolate mass. It was also
reported that the increased level of lecithin reduced the size of the crystals and decreased the values of the
final temperature of melting, the temperature at which the melting peak happened and melting enthalpy.
The authors stressed that since the mechanical and rheological behavior are dictated by the polymorphic
stability and dimensions of crystals in chocolate, it would be important to further study the variation of these
parameters with the addition of different concentrations of lecithin.
1.6.1.1.2. Polyglycerol polyricinoleate (PGPR)
Polyglycerol polyricinoleate consists of polyglycerol esters of interesterified fatty acids present in castor oil
(Figure 1.6). The functionality of PGPR in chocolate has been attributed mainly to the reduction of
consistency (or yield value), with limited effect on viscosity and it is usually combined with lecithin9,49.
Figure 1.6. Adapted image of the chemical structure of PGPR50
Rousseau et al. (2005) studied the influence of PGPR on the crystallization profile and polymorphic
transformations of hydrogenated cottonseed oil (HCSO), a β’ stable fat used in margarines and
shortenings51. It was concluded that within a specific set of conditions, at 5°C and with agitation, the
emulsifier altered significantly the process of crystallization by increasing the proportion of the β’ polyform,
and therefore the results suggested that PGPR retarded the polymorphic transformations of α to β’ and
from this to β. The authors hypothesized that this effect could be due to the inclusion of PGPR molecules
in spaces between the crystals, through the agitation of the sample, causing a limitation on the TAG mobility

9
and retarding the polymorphic transformations.
Luís et al. (2011) investigated the effect of soy lecithin and PGPR on chocolate bars and stressed that the
use of PGPR could introduce beneficial alterations in the crystallization process and polymorphic transitions
of chocolate and possibly delay bloom formation52.
1.6.1.1.3. Specific DAGs from vegetable fats
Diacylglycerols (DAGs) represent a great interest to the studies of crystallization of lipids as they occur in
higher concentrations in virtually all vegetable or animal fats. These compounds can be of great interest to
the chocolate industry since these have been reported to slow down or inhibit the crystallization process of
different fats and oils. In general, the polymorphic stability of fats increases significantly with the addition of
DAGs, even at low concentrations. This stabilizing effect is influenced mainly by the chain length of the fatty
acids and position on the glycerol molecule9.
Oh & Swanson (2006) suggested that the structural complementarity between the DAG and the TAG
molecules would allow the co-crystallization of these compounds, stabilizing polymorphs and avoiding
undesirable transitions45. In the same article it is suggested that 1,2-diacyl-glycerols slow down polymorphic
transitions more effectively than their 1,3-diacyl-glycerols isomers, a difference attributed to the fact that
the former preferably exhibit orthorhombic packing, while the later exhibit triclinic arrangement.
Martini & Herrera (2008) investigated the incorporation of saturated and unsaturated DAG’s in blends of
palm oil/palm kernel oil/soybean oil/sunflower oil. It was seen that the DAG molecules modified the shape
and number of crystals and that DAGs with similar chemical composition as the fats slowed down or
inhibited crystallization more efficiently46. Tiez and Hartel (2000) tested the incorporation of DAGs in cocoa
butter and verified that the presence of DAGs was effective in retarding the βV to βVI transition53.
De Clercq et al. (2014) also studied the effect of CB DAGs in composite dark chocolates but concluded that
within the set-up of that study, the CB DAG didn’t prevent nor promote oil migration or fat bloom
development28.
1.6.1.1.4. Sorbitan esters
Sorbitan esters are produced through the reaction between fatty acids and the free hydroxyl groups from
the alcohol sorbitol. Sorbitan esters such as sorbitan monostereate (SMS) and the sorbitan tristearate (STS)
are known for their ability to modify the crystalline morphology and consistency of fats, with effectiveness
as anti-bloom agents in confectionary products containing cocoa butter and cocoa butter substitutes9
(Figure 1.7).

10
Figure 1.7. Adapted figures regarding chemical structure of sorbitan monostereate54 and sorbitan tristereate55
Garti, Schlichter & Sarig (1986) studied the effects of sorbitan esters (1–10 % w/w) on the polymorphism
of cocoa butter and reported a significant delay in the βV to βVI transition56. Lonchampt & Hartel (2004)
highlighted that sorbitan esters from palmitic and stearic acids show a stabilizing effect on the intermediate
form βV of cocoa butter4.
Hasenhuettl & Hartel (2008)48 and Berger (1990)57 showed that STS has a great potential as a
crystallization modifier and anti-blooming agent especially in the inhibition of the βV → βVI due to its high
melting point (55°C) and chemical structure similar to TAGs from cocoa butter, allowing it to co-crystallize
and form solid solutions with CB.
1.6.1.1.5. Sucrose esters of fatty acids
Sucrose esters of fatty acids (SEFAs) (Figure 1.8) are mono-, di- and triesters of sucrose with food fatty
acids, prepared from sucrose and methyl and ethyl esters of food fatty acids or by extraction from
sucroglycerides49.
Figure 1.8. General structure of sucrose monoester of fatty acids58
Oh and Swanson (2006) ran a study on the addition of SEFAs from lauric, mystiric, palmitic, stearic and
oleic acids to cocoa butter melts, at a concentration of 5% (w/w). The addition of these emulsifiers to cocoa
butter changed the rate of the βV to βVI transition and this effect depended on the effect of the fatty acid. The
SEFAs containing fatty acids of similar size to the fatty acids predominant in cocoa butter fully inhibited this
transition45.

11
1.6.1.2. Milk fat
Milk fat is the second most common fat to be introduced in chocolates and other confectionery products
and, therefore, there are already some studies on its effect on chocolate fat bloom appearance has been
reported. Studies have been conducted both with anhydrous milk fat and with different milk fat fractions.
Lohman and Hartel (1994) investigated the influence of milk fractions, produced from the fractionation of
the milk, in dark chocolate59. The best results for its stability were obtained for the higher melting fractions
of the milk, given that these inhibited fat bloom. They also showed that the lowest melting fractions induced
bloom, compared to the control chocolate samples, to which was added cocoa butter instead of milk fat.
Similar results were found by Bricknell and Hartel (1998) who compared the appearance of fat bloom and
polymorphic transition in chocolates with addition of anhydrous milk fat (AMF) and high and low/medium
melting fractions of milk fat60. These authors concluded that the high melting fractions of milk fat inhibited
bloom and that chocolates with AMF did not show bloom despite the polymorphic transition of cocoa butter.
The influence of the addition of high-melting fractions of milk fat was also confirmed by Pajin and Jovanovic
(2005), who noticed that with the addition of 1-3% of high melting fractions of milk fat the chocolate showed
an improved bloom stability61.
Sonwai and Rousseau (2008) studied the incorporation of milk fat and a cocoa butter equivalent (CBE) and
the influence on fat bloom appearance and concluded that the chocolates less prone to fat bloom were the
ones that had 5% of CBE in composition and a maximum quantity of milk fat62. In later studies, Sonwai &
Rousseau (2010) confirmed the inhibition of bloom formation by the introduction of milk fat above 2.5%63.
Contrary to what would be expected, based on newer results, a patent was filled in 2013 for a chocolate
composition which included softer milk fat fractions. The patent belongs to the company Friesland Brands
B.V., and claims that the introduction of milk fat fractions that have a solid fat content at 30˚C of less than
30% provides a chocolate composition with less fat bloom 64.
1.6.1.3. Vegetable fats
The use of vegetable fats in anti-bloom fats has been thoroughly studied in the last few years since these
are cheap raw materials and most of them exist in abundance. Chocolate is a regimented product and
therefore it can only have specific types and amounts of vegetable fats in its composition. On the other
hand, since confectionery coatings and fillings compositions are not legislated, vegetable fats can be
included in a greater extent. Vegetable fats used in both confectionery coatings and fillings fall into three
major types: lauric; non-lauric polymorphic fats and non-polymorphic, non-lauric fats65. The former are
based on palm kernel oil or coconut oil, are usually fractionated or hydrogenated and are generally called
cocoa butter substitutes (CBS). Non-lauric polymorphic fats are based on non-lauric oils and present a
complex polymorphism behavior. Cocoa butter is the most common of this group which also includes cocoa

12
butter equivalents (CBE), fats that present a similar composition and are highly compatible with cocoa
butter. The latter fats have been traditionally based on partially hydrogenated and often fractionated oils
such as palm oil and rapeseed oil, these fats are usually referred as cocoa butter replacers (CBR)1.
1.6.1.3.1. Legislation
Regarding the fat phase of chocolate, the main component is cocoa butter which can sometimes contain
milk fat4. In Europe it is also possible to add a maximum of 5% of specific CBEs: illipe, borneo tallow or
tengkawang; palm-oil, sal, shea, kokum gorgi and mango kernel (EU Directive 2000/36/EC). This directive
also establishes rules for the composition of filled chocolates as a product which outer part consists of one
of the products defined as chocolate, milk chocolate, family milk chocolate and white chocolate. It is also
stated that this outer part “shall constitute not less than 25% of the total weight of the product”. The definition
of a chocolate or a praline is also described: “a filled chocolate or a single chocolate or a combination or a
mixture of” the products refered above, “provided that chocolate constitutes not less than 25% of the total
weight of the product”. There is no regulamentation imposing restrictions regarding the composition of the
fillings of filled chocolates being these able to comprise the vegetable fats mentioned in this chapter.
1.6.1.3.2. Specific TAGs from vegetable fats
Some specific triacylglycerols have also been studied regarding their effect on delaying fat bloom. Some
TAGs have the potential to inhibit fat bloom formation since they can act as nucleating agents. The
incorporation of these crystallization seeds may promote two effects associated with the control of
crystallization: availability of numerous additional nuclei and/or surfaces for crystal growth. An extra, and
very beneficial advantage, is the fact that these compounds may induce crystallization of fats in the
desirable polymorphic forms, as the information for the crystalline packing is provided by the seeds that
control this process9. The use of TAGs as nucleating agents is then associated with anti-bloom effect, by
avoiding the βV to βVI transition30.
For the success of this technique, specific interactions must be established between the seeding agent
and the material to be crystallized and for that to happen the seed material must have the same polymorphic
form as the material to be crystallized. Regarding the structure, former investigations suggest that the chain
length should not differ by more than four carbon atoms in relation to the predominant fatty acid in the
mother phase. Regarding specifically the degree of saturation, the mother phase and the seeding material
should have a similar degree of saturation. Particularly for the crystallization of cocoa butter, the use of
symmetrical disaturated TAGs, that lead to the formation and permanence of the polymorph βV, is
recommended9.
Hachiya et al. (1989)66 and Koyano et al. (1990)31 conducted a study where the influence of the addition of
three different TAGs to cocoa butter was compared: StOSt, 1-behenyl-2-oleoyl-behenyl (BOB) and
tristearin (StStSt) The best results were obtained for BOB concluding that this component had the biggest
13
potential as a crystallization seeder and provided a significant improvement of chocolate stability to the fat
bloom. This TAG was further investigated by Walter & Cornillon (2001) who confirmed the effect of BOB as
a seeding agent and fat bloom inhibitor in dark chocolate41. Verstringe et al. (2012) reported that StOSt
increases the solid fat content and as such the melting point and hardness of chocolate. Chocolates with
fats (or mixtures thereof) with high content in these TAGs have better resistance to softness and fat bloom
at higher ambient temperatures67.
Recently, Tran et al. (2015) studied the influence of incorporation of soft and hard StOSt-rich fats in
chocolates bloom stability12. They achieved this through the blending of cocoa butter with different
vegetable fats and concluded and confirmed that the introduction of the vegetable fat could contribute to
the maintenance of the structure and fat bloom stability of the chocolate, specially the blends of cocoa
butter and vietnamese mango fat in a proportion of 70/30 and cocoa butter and stearin of Indian mango fat
in the proportion of 70/30. Three different hypotheses were suggested to explain this phenomenon,
including the possibility that these StOSt triacylglycerols might act as seeding agents and in that way inhibit
fat bloom, as explained before.
As cited by Jahurul et al. (2013), a group of investigators have concluded that the addition of small quantities
of StOSt triacylglycerols or StOSt rich fats can increase the hardness of chocolate, inhibit fat bloom and
decrease tempering time68. Since vegetable fats, e.g. kokum butter, are rich in these types of TAGs, they
can be valuable materials in the industry69,70,71,72,73,74.
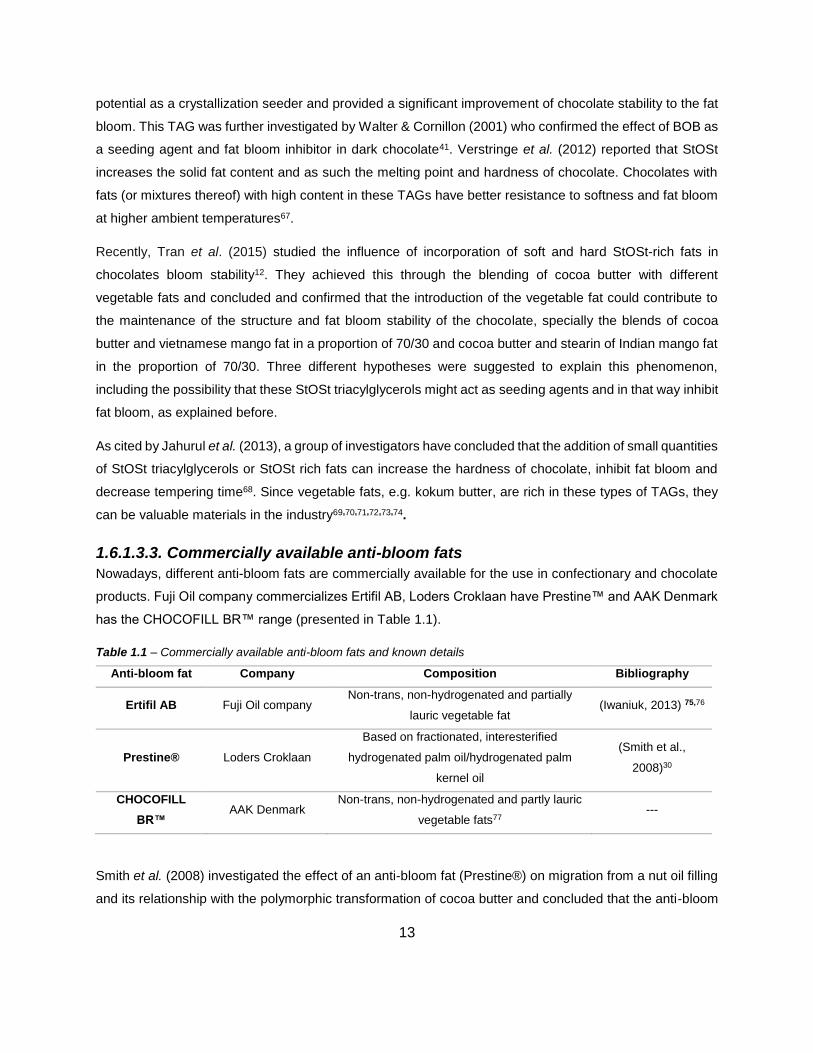
1.6.1.3.3. Commercially available anti-bloom fats
Nowadays, different anti-bloom fats are commercially available for the use in confectionary and chocolate
products. Fuji Oil company commercializes Ertifil AB, Loders Croklaan have Prestine™ and AAK Denmark
has the CHOCOFILL BR™ range (presented in Table 1.1).
Table 1.1 – Commercially available anti-bloom fats and known details
Anti-bloom fat Company Composition Bibliography
Ertifil AB Fuji Oil company Non-trans, non-hydrogenated and partially
lauric vegetable fat (Iwaniuk, 2013) 75,76
Prestine® Loders Croklaan
Based on fractionated, interesterified
hydrogenated palm oil/hydrogenated palm
kernel oil
(Smith et al.,
2008)30
CHOCOFILL
BR™ AAK Denmark
Non-trans, non-hydrogenated and partly lauric
vegetable fats77 ---
Smith et al. (2008) investigated the effect of an anti-bloom fat (Prestine®) on migration from a nut oil filling
and its relationship with the polymorphic transformation of cocoa butter and concluded that the anti-bloom

14
fat migrated with the nut oil into the cocoa butter and there slowed the polymorphic transformation of this
compound30.
Along with these already trademark products other companies also filed patents on anti-bloom compositions
for chocolate products, and performed research on the same field 78,79,80,81,82.
Cain, Hargreaves & Hughes (1995), from Loders Croklaan, filed a patent for bloom inhibiting fat blends that
consisted of three different triglycerides compositions79. All the blends had as raw materials vegetable fats
and in specific one of the blends should be an interesterified mixture of vegetable oils. The following year,
Cain, Hughes and Pierce (1996) patented an anti-bloom triglyceride composition, produced through an
enzymatic conversion, through the catalysis of an 1,3-specific enzyme80. Hokuyo et al. (1997), from Fuji Oil
Company, filed a patent for an anti-blooming composition for a laurin fat and chocolate containing this
mixture81. The anti-blooming composition would comprise a mixture of two distinct monoglycerides.
Momura, Nakano and Nakamura (1988) protected a mixed acid triacylglycerol composition that would inhibit
fat bloom in hard butter products such as chocolates78. This composition was focused on the proportion
between unsaturated and saturated fatty acids. More recently, AAK Denmark filed a patent for a mixture
with SatOSat TAGs in the proportion of 60% (w/w) and a mixture of saturated fatty acids in the proportion
of 30% (w/w), both from vegetable origin82.
1.6.1.4. Silicon dioxide
A patent about the use of silicon dioxide as an anti-blooming agent was filed by Nestec S.A. in 1989. The
authors claimed that a more bloom resistant chocolate or a fat containing confectionary material is obtained
by incorporating this compound in a percentage between 0.01% and 0.5% by weight of product83.
1.6.2. Oleogelation
Usually, for guarantying chocolate fillings have the properties that consumers are used to, smoothness,
creaminess and easy melting in the mouth, a high content of saturated fats must be added to the
formulation of the product84. Due to the fact that these kind of fats present a danger for human health and
also with the goal of increasing the bloom stability of certain products, different types of waxes have been
investigated to replace the saturated fat85,86,87,88,89,90,91,92.
The waxes, when added above a certain concentration, can create a well-structured and oil retaining matrix
– an oleogel (Figure 1.9) that, besides having anti-bloom potential, also contribute to the creation of
healthier products, since they substitute some of the saturated fats in the formulation93.

15
Figure 1.9. Image of shellac wax and rapeseed oil oleogel, with varying concentrations of wax, adapted from Patel &
Dewettinck (2015)91.
In the specific case of chocolate products there are only a few studies demonstrating the use of oil
structuring approaches, which include: development of heat resistant chocolates, complete replacement of
oil binder in chocolate paste, partial replacement of palm oil in praline fillings and controlling the oil migration
induced fat bloom 93. Patel et al. (2014) reported the use of shellac wax as a new structuring agent capable
of structuring oil at low concentrations and its possible applications in chocolate pastes84. Doan et al. (2016)
combined food-grade oleogels with palm oil to form a continuous fat phase with reduced content in
saturated fatty acids94. The authors had as the main goal to include the product in low-saturated fat
confectionary fillings. Doan (2017) studied the relationship between the structure and function of wax-based
oleogels prepared in rice bran oil, having analyzed the minimal concentration needed of the different waxes
in order to create an oleogel (Figure 1.10)95.
Figure 1.10. Minimum concentration of different natural waxes in rice bran oil to create an oleogel-like structure,
adapted from Doan (2017)95.

16
Öʇütcü & Yılmaz (2014) also investigated the formation of oleogels of hazelnut oil by adding carnauba and
sunflower wax, in the concentrations of 3, 7 and 10% weight ratio, concluding that the latter could be
successfully used in the productions of shortenings or similar products with success90. The same authors
also reported the creation of emulsions based on virgin olive oil-beeswax able to be used as alternative
materials to prepare margarine/spread type products96,.
The use of oil structuring agents has also been reported and secured in patents, confirming its commercial
interest and value97. This author developed a chocolate product composition with an ethylcellulose oleogel
claiming that the same will reflect remarkable resistance to higher temperatures and that it reduces oil
migration from the center into the coating.
1.7. Goals of the project
Due to the already promising results obtained in studies regarding the creation of oleogel-like structures
and the lack of research on the use of oleogelation as a strategy to retard oil migration in filled chocolates,
this topic is further explored in this study. The components used in this study, wax 1 and 2 are both
registered permitted food additives, being acceptable for inclusion in food products.
This project was developed under a partnership between the Food Technology and Engineering laboratory,
included in the Bioscience Engineering faculty, from Ghent University and Cacaolab, a spin-off of the
university. The main goal of the project is to evaluate the use of oleogelation as strategy to prevent
migration-induced fat bloom formation. The work was organized in three work packages:
• Production and characterization of hazelnut oil and cocoa butter oleogels: evaluation of crystal
microstructure, crystallization and melting behavior, rheological behavior and solid fat content;
• Production of hazelnut-based fillings with wax and study of its properties: hardness measurements,
viscosity profile and melting behavior;
• Production of hazelnut filling and chocolate disks model systems and filled chocolates with hazelnut
based fillings with wax, quantification of oil migration and visual evaluation of fat bloom appearance,
respectively.

17
2. Materials and methods
2.1. Materials
The hazelnut oil was bought in a local supermarket. Cocoa butter was supplied by Belcolade
(Erembodegem, Belgium) and wax 1 and 2 were kindly provided by Kahlwax (Schoonhoven, Netherlands).
The pre-broken sugar and 811NV dark chocolate were supplied by Barry-Callebaut (Lebbeke-Wieze,
Belgium) and the soy lecithin by Puratos-Belcolade (Erembodegem, Belgium). The hazelnut mass was
produced from a blend of Italian and Turkish hazelnuts.
For the fat extractions the petroleum ether and dichloromethane were purchased from Fischer Scientific
(Merelbeke, Belgium) and the acetonitrile from VWR Chemicals (Leuven, Belgium).
2.2. Methods
2.2.1. Preparation of hazelnut oil and cocoa butter based oleogels
Cocoa butter was completely melted and then mixed with hazelnut oil in the same proportion as these
components would be present in 80:20, 70:30 and 60:40 (HP:DC) hazelnut paste to dark chocolate,
compositions presented in table 2.1.
Table 2.1. Base composition of the control fat blends
Cocoa butter (wt%) Hazelnut oil (wt%)
60:40 39.06 60.94
70:30 29.18 70.82
80:20 19.38 80.62
After mixing the cocoa butter and hazelnut oil, wax 1 and 2 were added as partial replacers of the hazelnut
oil, meaning that for wax to be added, less hazelnut oil was in the mixture; and the temperature was elevated
until 85°C to melt the wax. The waxes were added in a concentration of a% to h%, the former representing
the lowest concentration and the latter representing the highest concentration of wax added to the mixtures.
The mixture was stirred until homogeneous and then weighed into different recipients.
2.2.2. Preparation of the hazelnut based fillings (HF)
Part of the hazelnut mass and the total amount of sugar, reaching a fat content of 24%, were mixed for 10
min in the velocity position 1 in a Vema mixer, type Sigma BW 30/20 (NV Machinery Verhoest, Izegem,
Belgium). The mixture was then refined on an EXAKT refiner type 80S, with the rollers at the positions of 2

18
and 1 and a speed of 400 rpm, connected to a Julabo 300F waterbath placed at 35°C. Afterwards the rest
of the ingredients were added the missing amount of hazelnut mass, all the hazelnut oil and lecithin and
mixed for 30 min in the same mixer. The base composition of the control hazelnut paste is present in Table
2.2.
Table 2.2. Base composition of the control hazelnut paste
Ingredient Composition (wt%)
Hazelnut mass 40.59
Hazelnut oil 9.16
Sugar 49.75
Lecithin 0.50
The hazelnut base paste was mixed with tempered dark chocolate in the proportions of 60:40 and 80:20
(HP:DC) and the waxes were added to the fillings in different concentrations, as a hazelnut oil replacement
percentage, for the first filling tests.
The wax was first added to the hazelnut base paste and the temperature of this mixture was elevated until
85°C. The mixtures were cooled down until 32°C through the use of a Julabo 300F water bath, placed at
30°C. Afterwards the tempered dark chocolate, tempered by a temper unit Chocolate World type CW24,
was added and the samples were mixed.
2.2.3. Hardness measurements
The hardness measurements were carried out with a 5942 Instron TA 500 Texture Analyzer and the
analysis was accomplished using an acrylic conical probe with an inclination of 45°, which penetrated the
sample at 2mm/s for 10mm of depth, starting with a trigger of 0.1N. All the samples were analyzed at room
temperature, 20°C.
2.2.4. Rheological measurements
The rheological measurements were carried out using a AR2000ex rheometer from TA Instruments along
with a Peltier system and Julabo 300F water bath. The gelling point of the samples was recorded during
cooling from 85°C to 5°C at a cooling rate of 1.0°C/min. The following parameters were used for the
measurement starch pasting cell: shear rate factor=4.5Hz, shear stress factor=48 600/m3, gap=5500µm.
Afterwards the samples were kept at 5°C for 60 min and posteriorly at 20°C for 60 min (a frequency of
1.0Hz and a strain value of 0.005 were applied). The experimental conditions were chosen according to

19
Doan et. al (2016)95 and the values of |G*| and tan(δ) were devolved by the software. The measurements
were performed in triplicate.
For the determination of the flow behavior of the hazelnut, the official ICA 46 method for chocolate was
applied. In this procedure, the sample is pre-sheared and brought to equilibrium temperature. The
measurements of flow behavior were carried out at 40°C applying shear rates over the range of 2 to 50s -1
in steps of 5s-1 (except for the transition of 2s-1 to 5s-1) and the flow behavior is measured throughout the
shear rate range. The equipment used was the same as in the rheological measurements for the lipid
blends.
2.2.5. Thermal behavior
The crystallization and melting profile of the lipid blends were measured in triplicate by a Q1000 DSC
(differential scanning calorimetry) from TA Instruments, equipped with a refrigerated cooling system. For
crystallization, the samples were first equilibrated at 85°C and then kept isothermally for 10 min after which
they were cooled to 5°C, at a cooling rate of 1°C/min, and again kept isothermally during 60 min. Posteriorly
they were heated until 20°C at a heating rate of 5°C/min and maintained at the same temperature for 60min.
Finally, the temperature of the sample was further increased until 85°C at the same rate. For the evaluation
of the melting profile of the hazelnut based fillings they were equilibrated for 10min at 20°C and then the
temperature was increased to 85°C at a heating rate of 5°C/min.
2.2.6. Crystal morphology
The morphology of the crystals was analyzed through polarized light microscopy (PLM). A microscope
Leica DM 2500 (Wetzlar, Germany) with a magnification objective of 20x was used, along with a Linkam
water bath for temperature control and a nitrogen purge (EHEIM professionel 3). The electronic images
were provided by the LAS V4.3 software. The samples were first heated until 85°C through a heating step
of 20°C/min and kept isothermally for 10 minutes. Posteriorly through a cooling rate of 1°C/min the
samples were cooled until 5°C and kept for 1 hour at this temperature. As the last step, the samples were
heated until 20°C at a rate of 1°C/min and kept isothermally for one hour.
2.2.7. Solid fat content
For the evaluation of the solid fat content of the samples, a Maran Ultra 23MHz pulsed Nuclear Magnetic
Resonance (pNMR) equipment (Oxford Instruments, Abingdon, UK) was used. The NMR tubes were first
filled with 4ml of the different lipid samples, left 1 hour at 85°C to melt the wax, and afterwards at 0°C for
90 min. Next, the samples were placed at 26°C for 40h, before the analysis. The samples were then cooled
in a water bath at 0°C for 90 min and further analyzed every hour after which the temperature was increased
20
in 5°C, having been measured until the temperature of 40°C. Using calibration standards (29.4% and 70.6%
SFC), SFC values were derived.
2.2.8. Production of filled chocolates
Chocolate shells were produced through the tempering of dark chocolate (the same as added to the filling)
and filling of the molds with this chocolate. The molds were filled and then turned upside down to drain the
excess of chocolate inside. Afterwards the chocolate shells cooled at 11°C for 30 minutes and stabilized at
20°C for an extra hour. After the stabilization of the shells they were filled with the different fillings (around
7g per cup) produced in 2.2.2. and left to cool down to 5°C for 1h30. Afterwards the filled shells were
covered with tempered dark chocolate, the excess was scrapped off, and the filled chocolates were let to
stabilize at 11°C for 1h.
2.2.9. Accelerated shelf life tests
The filled chocolates were stored at 23°C for 8 weeks. Five replicates of each filling were taken out during
the first 4 weeks and at week 8 for fat bloom assessment and color measurement. Pictures were also taken
to the filled chocolates in the same weeks.
2.2.9.1. Fat bloom assessment
The fat bloom assessment was performed in the first 3 weeks by two trained persons, through the visual
analysis of the shells of the filled chocolates. On week 4 and 8, the panel was constituted by 8 trained
persons. For this, three different questions were asked to the panel:
Question 1: How much (percentage) of the surface shows no gloss?
Question 2: How much did the intensity of the gloss decrease compared to a reference sample?
Question 3: How much (percentage) of the surface shows fat bloom?
2.2.9.2. Color measurement
The color of the shells of the filled chocolates was evaluated by the collection of the parameters L, a and b
through a spectrophotometer CM 2500d from Minolta. For each concentration of fillings 3 replicates were
considered.
2.2.9.3. Pictures
Pictures of the filled chocolates and model systems were taken after weeks 1, 2, 3, 4 and 8. For the filled
chocolates, individual pictures to all the 5 replicates of each concentration were taken. Afterwards, group
pictures were taken, showing 2 filled chocolates of each concentration aligned side by side. Regarding the

21
model systems, group pictures of one model system and one filled chocolate of each concentration side by
side were also taken.
2.2.10. Production of model systems
Small cups were filled with around 9g of hazelnut filling each, enough to cover a height of 1 cm in the
recipient and inserted into a cooling cabinet at 5°C for 1h30. Meanwhile, chocolate disks of around 3mm of
thickness were produced from tempered dark chocolate and left to set at 11°C for 30 min. After the
stabilization of the two parts, the disk was placed on top of the filling, for posterior oil migration analysis.
2.2.11. Oil migration
The model systems were also placed at 23°C for a 12 weeks period. After 3, 4, 8 and 12 weeks the
chocolate disks were removed and scraped of into sampling tubes, dissolved with 10mL of petroleum ether
and centrifuged for 10min at 2500rpm in a Centrifuge Rotina 380R, from Hettich Zentrifugen. The
supernatant was then kept and inserted in a water bath at 65°C to evaporate the solvent. The evaporation
tubes had been previously weighed and were weighed again after this operation, so as to calculate the
amount of fat in each sample.
Right before the HPLC analysis, 10 or 20mL of acetonitrile (if the amount of fat was lower or higher than
130mg, respectively) was added to the samples and these were vortexed. In the vials for analysis, 700µL
of solvent 70/30 Acetonitrile/Dichloromethane (v/v) were added along with 300µL of the fat sample. In case
of a very concentrated solution a lower concentration of the fat sample was needed. The vials were then
placed in an AutoSampler Surveyor, connected to the HPLC Detector, ELSD 2000 ES from Alltech and
connected to a computer through which the results were devolved. The calibration curve had been
previously developed. Experimental design was performed with Design Expert 5 (Stat-Ease Corporation,
Minneapolis, USA).
Oil migration evaluation was based on the HPLC method for detection of triglycerides in the samples of
chocolate disks. These analyses were performed for weeks 3, 4 and 8, weeks after which fat bloom started
to be noticed in the chocolates. In the HPLC chromatograms, different TAGs and, consequently, peaks,
were identified. From cocoa butter, StOSt, POSt and POP and minority TAGs were visualized, and from
the hazelnut oil migration triolein (OOO) and LOO TAGs were also expected to be seen. For each sample
chromatogram, the computer software devolved the peak area, in percentage regarding the total area, and
the [OOO/StOSt] and [LOO/StOSt] ratios were calculated.

22
2.2.12. Statistical analysis
The experimental data are expressed as means ± standard deviation of three repetitions and were analyzed
through one factor analysis of variance (ANOVA). The homogeneity of the variances was verified using
Levene’s test prior to usage of Tukey’s test to compare the mean values at p < 0.05 significance level.
Dunnet T’3 post-hoc test was used to find the significant difference in the ANOVA test when no homogeneity
of variances was found. The statistical tests were performed using IBM SPSS 22.0 (statistical package for
the social sciences).

23
3. Results and discussion
3.1. Initial studies and decision of conditions
3.1.1. Hardness measurements and initial studies in the lipid blends
The hazelnut based fillings are composed of a mixture of hazelnut paste (HP) and dark chocolate (DC) and
for this study three different proportions HP:DC were considered: 60:40, 70:30, 80:20.
As a way to evaluate the influence of the addition of the different waxes to the hazelnut based fillings, the
first step was to produce wax-based lipid blends only with hazelnut oil and cocoa butter, based on the
selected ratios. The minimal amount of wax to add to the hazelnut based fillings and lipid based mixtures
was decided through the work of Doan (2017)95. This author studied the minimum concentration needed of
different natural waxes in rice bran oil in order to create an oleogel-like structure.
In case of wax 1 and 2, the minimal concentrations needed were a% and b%, respectively. For the upper
limit of the amount of wax to add it was decided to use as a maximum g% and h%, respectively, so that it
would be possible to secure the formation of a strong network but at the same time to try not to compromise
too much the sensory aspects of the hazelnut based filling.
In that way, the wax 2 b%, c% and d% lipid blends and wax 1 a%, b% and c% lipid blends were produced
for the three considered ratios to perform hardness measurements on the samples. These were cooled for
1h30 at 11°C and then changed to 20°C for 24h more, after which the samples were analyzed. After this
period clear differences between the samples from different ratios were already noticeable: the ones from
60:40 (HP:DC) were able to set, while the ones with 70:30 (HP:DC) and 80:20 (HP:DC) composition were
viscous and too soft to be measured.
A difference in the textural properties of the samples was already possible to notice after the storage at
11°C and after the storage at 20°C, as can be seen in Figure 3.1.
Figure 3.1. Samples of wax 1 c% in a proportion of 60:40 (HP:DC). On the left, the sample after the 1:30h storage at
11°C and on the right, after the 24 hour storage at 20°C.

24
Despite after the first cooling step the blends showed a uniform and dense structure, after 1 day at 20°C,
this structure had been lost and it was possible to distinguish separate granules in the oleogel. Even though
the 60:40 samples were measurable, the hardness data obtained were not reproducible, leading therefore
to the optimization of the measurement method. Five different probes were tested: cylinder probe with a
diameter of 1.5cm, cylinder probe with a diameter of 0.5 cm, a spherical probe with a radius of 1.8cm and
a conical probe with a diameter of 3 cm and a height of 4 cm, the latter being the only one which lead to
reproducible results. Four different velocities of penetration were also tested: 0.2mm/s, 0.5mm/s and 1
mm/s, the latter reporting the best results for the present samples.
After the optimization step, new lipid blends were prepared, in this case wax 2 h% and wax 1 g%, and
analyzed through the new set of parameters. After production, the samples were cooled for 1h30 at 11°C
and then stabilized for 24h at 20°C, after which their hardness was measured. It was concluded that the
hardness of the samples was reproducible and the differences in hardness between the two samples were
significative after these steps. The samples were then re-melted and cooled for 1h30 at 5°C and these
results did not allow to verify significant difference between the two concentrations, from which it was
concluded that the cooling in these conditions could lead to non-reproducible and inconclusive results. The
direct comparison of the hardness measurements after the two cooling steps is presented in Figures 3.2
and 3.3.
Figure 3.2. Direct comparison between the measurements obtained for wax 1 g%(●) and wax 2 h%(●) cooled for 1h30
at 11°C and afterwards kept for 24h at 20°C. The measurements were performed at 20°C.

25
Figure 3.3. Direct comparison between the measurements obtained for wax 1 g%(●) and wax 2 h%(●) cooled for 1h30
at 5°C. The measurements were performed at 20°C.
3.1.2. Hardness measurements and initial studies in the hazelnut based fillings
In order to test the influence of the non-fat particles on the hardness of the fillings, hazelnut based fillings
were produced in the three different ratios for the concentrations a% and b% of wax 1. The cooling step
consisted again in 1h30 at 11°C and measurements were made after 24h at 20°C. As expected, the
decrease of dark chocolate content in the filling and therefore increase in percentage of hazelnut oil, led to
a concomitant decrease in the hardness also (Figure 3.4).
Figure 3.4. Variation of sample hardness with the hazelnut paste content and wax concentration for the wax 1 a%(●)
and wax 1 b%(●) samples. The samples were cooled for 1h30 at 11°C and kept for 24h at 20°C, temperature at
which the analysis was performed.
0,0
1,0
2,0
3,0
4,0
5,0
6,0
7,0
8,0
55% 60% 65% 70% 75% 80% 85%
Fm
ax
(N)
% of hazelnut paste
CW 1%
CW 1.5%

26
The inclusion of the non-fat particles resulted in an increase in hardness of the samples, leading to the fact
that even the ones with the softer formulation, higher content in hazelnut oil, were still measurable. It was
then decided to continue the experiments with only one of the ratios, the 80:20 (HP:DC).
This ratio, by having a higher content of hazelnut filling, had a higher content of hazelnut oil, and therefore
can be more challenging in terms of oil structuring.
3.1.3. Evaluation of cooling conditions of 80:20 (HP:DC)
Two temperatures for the cooling step were tested: 5°C and 15°C. Hazelnut based fillings were produced,
namely the control sample and wax 1 e%, wax 1 g%, wax 2 f% and wax 2 h% cooled at both temperatures
for 1h30 and afterwards left at 20°C for 24h. Through the hardness measurements applied, it was possible
to verify that, for the samples with the cooling step at 15°C, the lipid blends with wax were softer than the
samples without, as presented in Table 3.1, which was not the case at 5°C, data in Table 3.2. From the
hardness analysis it was concluded that cooling for 1h30 at 15°C was not sufficient to promote the
crystallization and formation of the wax network. Therefore, for the rest of the experiments the cooling step
applied was always of 1h30 at 5°C.
Table 3.1. Maximum force after 10 mm of sample penetration, in Newton, after cooling for 1h30 at 15°C for the control
and wax 1 e% and wax 1 g% and wax 2 f% and wax 2 h%.
a, b, c, d: Different letters, within the same column indicate significant differences at p<0.05.
Table 3.2. Maximum force after 10 mm of sample penetration, in Newton, after cooling for 1h30 at 5°C for the control
and wax 1 e%
a, b, c, d: Different letters, within the same column indicate significant differences at p<0.05.
Wax concentration Fmax(N)
Control 5.17±0.70a
Wax 1 e% 1.60±0.20b
Wax 1 g% 0.62±0.05cd
Wax 2 f% 0.33±0.08d
Wax 2 h% 0.94±0.16c
Wax concentration Fmax(N)
Control 4.03±0.61a
Wax 1 e% 8.29±0.64b

27
3.2. Lipid blends analysis
To further understand the interactions between the lipids and waxes, cocoa butter and hazelnut oil oleogels
were produced and different methods were used to evaluate the lipid blends.
3.2.1. Microstructure
In order to evaluate the microstructure of the different samples, analysis through polarized light microscopy
were performed. Figure 3.5 shows a representative image of the crystal morphology of the control sample
and Figures 3.6 and 3.7 represent the crystal morphology of wax 1 and 2 samples, respectively.
As a first conclusion, it is visible that, comparing the control sample with the wax samples, there is a clear
increase in the amount of crystals present in the latter ones. Through the control sample image (Figure 3.5)
one can conclude that the big crystal clusters that are formed and are visible in every picture are due to the
cocoa butter present in the formulation and therefore, the smaller crystals visible in the wax samples owe
their appearance to the presence of wax.
From the different pictures, it is possible to verify that the crystals originated from wax 1 and 2 have different
morphologies. The wax 1 crystals (Figure 3.6) seem to have a more needle like shape and tend to form
smaller and more separated crystals. In the wax 2 samples (Figure 3.7) small and round nuclei of aligned
crystals are formed and in general smaller amount of crystals seems to be formed.
In the wax 1 samples there was an increase in the amount of crystals formed with an increase in the
concentration of wax and, at the highest wax concentration, the formation of a network between the crystals
could be identified. In the wax 2 samples, an increase in the amount of crystals with concentration was also
visible but the formation of a network was not detected, even in the highest wax concentration tested.
Figure 3.5. Crystal morphology, under polarized light microscopy, of the control sample. Picture taken after the cooling
of the sample until 5°C, 1-hour isothermal period; increase in temperature to 20°C and 1-hour isothermal period.

28
Figure 3.6. Morphology of the crystals for samples with increasing concentration of wax 1 evaluated under polarizd
light microscopy: a) wax 1 a%, b) wax 1 b%, c) wax 1 c%, d) wax 1 d%, e) wax 1 e% and f) wax 1 g%. Pictures taken
after the cooling of the sample until 5°C, 1-hour isothermal period; increase in temperature to 20°C and 1-hour
isothermal period.

29
Figure 3.7. Crystallization pattern for samples with increasing concentration of wax 2 evaluated under polarized light
microscopy: a) wax 2 b%, b) wax 2 c%, c) wax 2 d%, d) wax 2 e%, e) wax 2 f% and f) wax 2 h%. Pictures taken after
the cooling of the sample until 5°C, 1-hour isothermal period; increase in temperature to 20°C and 1-hour isothermal
period.
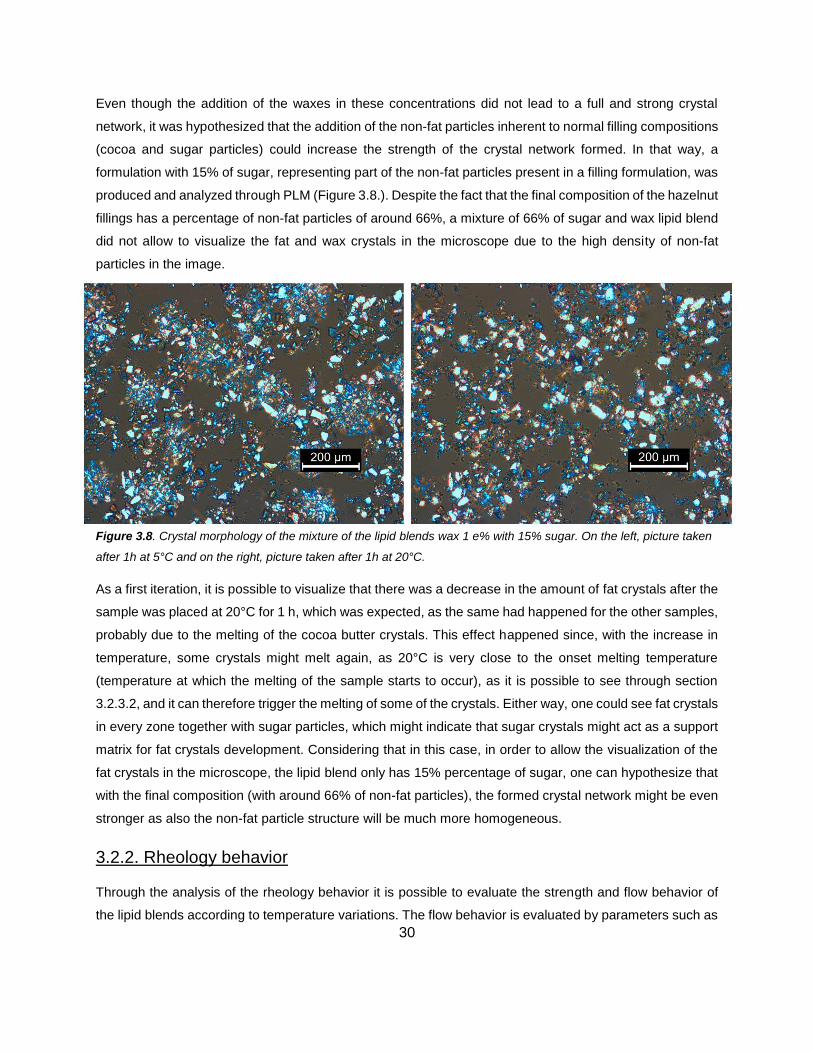
30
Even though the addition of the waxes in these concentrations did not lead to a full and strong crystal
network, it was hypothesized that the addition of the non-fat particles inherent to normal filling compositions
(cocoa and sugar particles) could increase the strength of the crystal network formed. In that way, a
formulation with 15% of sugar, representing part of the non-fat particles present in a filling formulation, was
produced and analyzed through PLM (Figure 3.8.). Despite the fact that the final composition of the hazelnut
fillings has a percentage of non-fat particles of around 66%, a mixture of 66% of sugar and wax lipid blend
did not allow to visualize the fat and wax crystals in the microscope due to the high density of non-fat
particles in the image.
Figure 3.8. Crystal morphology of the mixture of the lipid blends wax 1 e% with 15% sugar. On the left, picture taken
after 1h at 5°C and on the right, picture taken after 1h at 20°C.
As a first iteration, it is possible to visualize that there was a decrease in the amount of fat crystals after the
sample was placed at 20°C for 1 h, which was expected, as the same had happened for the other samples,
probably due to the melting of the cocoa butter crystals. This effect happened since, with the increase in
temperature, some crystals might melt again, as 20°C is very close to the onset melting temperature
(temperature at which the melting of the sample starts to occur), as it is possible to see through section
3.2.3.2, and it can therefore trigger the melting of some of the crystals. Either way, one could see fat crystals
in every zone together with sugar particles, which might indicate that sugar crystals might act as a support
matrix for fat crystals development. Considering that in this case, in order to allow the visualization of the
fat crystals in the microscope, the lipid blend only has 15% percentage of sugar, one can hypothesize that
with the final composition (with around 66% of non-fat particles), the formed crystal network might be even
stronger as also the non-fat particle structure will be much more homogeneous.
3.2.2. Rheology behavior
Through the analysis of the rheology behavior it is possible to evaluate the strength and flow behavior of
the lipid blends according to temperature variations. The flow behavior is evaluated by parameters such as
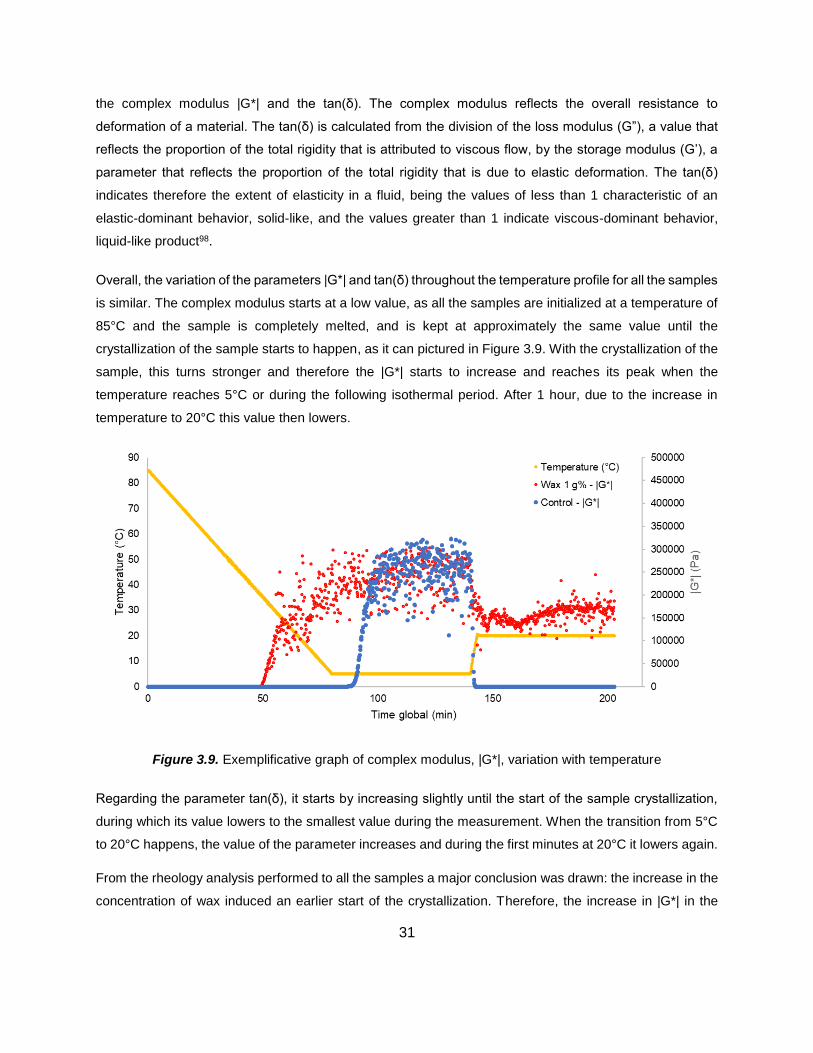
31
the complex modulus |G*| and the tan(δ). The complex modulus reflects the overall resistance to
deformation of a material. The tan(δ) is calculated from the division of the loss modulus (G”), a value that
reflects the proportion of the total rigidity that is attributed to viscous flow, by the storage modulus (G’), a
parameter that reflects the proportion of the total rigidity that is due to elastic deformation. The tan(δ)
indicates therefore the extent of elasticity in a fluid, being the values of less than 1 characteristic of an
elastic-dominant behavior, solid-like, and the values greater than 1 indicate viscous-dominant behavior,
liquid-like product98.
Overall, the variation of the parameters |G*| and tan(δ) throughout the temperature profile for all the samples
is similar. The complex modulus starts at a low value, as all the samples are initialized at a temperature of
85°C and the sample is completely melted, and is kept at approximately the same value until the
crystallization of the sample starts to happen, as it can pictured in Figure 3.9. With the crystallization of the
sample, this turns stronger and therefore the |G*| starts to increase and reaches its peak when the
temperature reaches 5°C or during the following isothermal period. After 1 hour, due to the increase in
temperature to 20°C this value then lowers.
Figure 3.9. Exemplificative graph of complex modulus, |G*|, variation with temperature
Regarding the parameter tan(δ), it starts by increasing slightly until the start of the sample crystallization,
during which its value lowers to the smallest value during the measurement. When the transition from 5°C
to 20°C happens, the value of the parameter increases and during the first minutes at 20°C it lowers again.
From the rheology analysis performed to all the samples a major conclusion was drawn: the increase in the
concentration of wax induced an earlier start of the crystallization. Therefore, the increase in |G*| in the

32
samples with higher concentrations of wax happened first. In fact, through the statistical analysis it was
visible that the |G*| of the control sample, after the cooling step, was significantly different from all the other
samples. The control sample presented a value of 2.88±0.08 Pa, while the closest sample, wax 1 b%,
presented a |G*| of 104.61 ± 6.00 Pa. The sample with highest value of complex modulus was wax 1 g%
with a value of (2.57±0.44)x105 Pa, which was statistically similar to wax 1 e% and wax 2 h% with values
of (1.55±0.32)x105 Pa and (4.63±0.68)x104 Pa, respectively.
The value of |G*| after the isothermal period at 5°C did not vary significantly between any of the samples,
not being a characterizing factor of the samples in this part of the process. Instead, it was verified that the
biggest difference in |G*| parameter happened during the transition from 5°C to 20°C, where the samples
with lower content of wax showed a higher decrease in |G*| than the others, which values can be consulted
in Table 3.2. This effect is due to the existence of crystals of cocoa butter and waxes that partially melt in
this transition, lowering therefore the resistance to deformation. The fact that some samples have more
content of wax leads the co-crystals to have a higher percentage of the high-melting crystals and therefore
to be more resistant to deformation (in this case temperature deformation). This decrease in |G*| reflects a
decrease in the resistance of the sample to the deformation and the resistance is directedly related to the
microstructure of the sample which, as seen in section 3.2.1., was stronger for higher concentrations of
wax. From these values it was also noticed that, for the same concentration of wax, the wax 1 samples
were more resistant to deformation than the wax 2, a fact also concordant with the results seen in section
3.2.
Regarding the parameter tan(δ), it started by increasing slightly until the start of the sample crystallization,
during which its value lowered to the smallest value during the measurement. After the cooling step, the
control sample had the highest value of tan(δ), data in Table 3.2., revealing the most viscous-like behavior.
This fact makes sense, since the control sample starts to crystallize later than the other samples and
therefore the tan(δ) only starts to lower to the minimum value later as well. Similarly, there were no
significant differences in tan(δ) among all the samples after 1h at 5°C. In the case of the value of tan(δ)
after 1h at 20°C, too many similarities between the values were found and therefore the significant
differences will not be presented in Table 3.2 but instead in Annex 3, in Table I.3. It was verified that the
Control sample was significantly different and therefore higher than all the samples, except for the case of
wax 1 g%, confirming therefore that the wax samples presented a less viscous like behavior than the
control.

33
Table 3.3. Complex modulus, |G*|, and tan(δ) after the initial cooling step and after the full temperature profile of the
rheological measurement.
a, b, c, d, e, f, g, h, i: Different letters, within the same column indicate significant differences at p<0.05
The parameters tan(δ) after 1h at 20°C and |G*| after initial cooling step don’t have their significant differences since there were too
many similarities to allow the samples to be represented in the table. These can be consulted in Annex B, table B.1, B.2, respectively.
The symbol * indicates that these samples were not significantly different from any other.
From the manufacturers’ point of view, the fact that the wax samples are less viscous could give an
indication of an easier product to deal with, but could also imply a different mouthfeel for the consumer,
which could be a negative aspect. The fact of that the wax samples showed higher resistance to
deformation, on the other hand, indicates that these products would be more stable, which is a positive
aspect.
3.2.3. Crystallization and melting profile
The crystallization and melting profile of the lipid blends were analyzed to evaluate the differences caused
by the addition of the waxes to the different blends.
3.2.3.1. Crystallization profile
The crystallization behavior of the samples depends on their TAG composition, of the cocoa butter and
hazelnut oil. Cocoa butter is composed mainly by StOSt, POP and StOSt. In the composition of hazelnut
oil, TAGs such as OOO and LOO are the most abundant99. Pure tempered cocoa butter has the melting
Sample |G*| after 1h at 20°C (Pa) tan(δ) after 1h at 20°C tan(δ) after initial
cooling step
|G*| after initial
cooling step (Pa)
Control (5.87±0.06)x100,a 1.031±0.010 5.282±0.176a (2.88±0.08)x100
Wax 1 a% (1.51±0.05)x103,b 0.141±0.001 0.161±0.001b (1.13±0.09)x103
Wax 1 b% (3.56±0.04)x103,c 0.117±0.002 0.158±0.008b (3.39±0.09)x103
Wax 1 c% (1.18±0.20)x104,abcfgh 0.104±0.008 0.125±0.036b (1.55±0.36)x104
Wax 1 d% (2.95±0.16) x104,d 0.090±0.018 0.129±0.062bc (4.27±0.88)x104
Wax 1 e% (9.77±0.45)x104,e 0.055±0.028 0.179±0.072bc (1.55±0.32)x105
Wax 1 f% (1.57±0.23)x105,* 0.737±0.500 0.213±0.020b (2.57±0.44)x105
Wax 2 b% (3.34±0.13)x102,f 0.242±0.002 0.498±0.031c (1.04±0.06)x102
Wax 2 c% (1.05±0.03)x103,g 0.187±0.003 0.255±0.045bc (4.31±1.31)x102
Wax 2 d% (3.27±0.08)x103,c 0.161±0.006 0.189±0.011b (1.53±0.08)x103
Wax 2 e% (6.40±0.43)x103,c 0.171±0.003 0.177±0.014b (4.85±0.42)x103
Wax 2 f% (1.36±0.02)x104,h 0.113±0.025 0.219±0.009b (1.46±0.03)x104
Wax 2 h% (4.83±0.02)x104,i 0.123±0.042 0.199±0.042bc (4.63±0.68)x104

34
interval around 35°C100. Hazelnut oils can have a range of cloud points from -12.4 to -14.9°C101, meaning
that the lowest melting material becomes hazy (starts to crystallize) at this temperature102. The hazelnut oil
is therefore in a pure liquid state during the whole experiment. The crystallization behavior of a wax based
fat mixture is said to be the crystallization of a mixed fat system where both the low and high melting
fractions are partially crystalized103.
The crystallization phase of the samples can be seen through Figures 3.10 and 3.11.
Figure 3.10. Crystallization profile, obtained by differential scanning colorimetry, of hazelnut oil and cocoa butter lipid
blends with different concentrations of wax 1. The samples were first heated until 85°C, kept for 10 min at this
temperature, cooled until 5°C and kept at this temperature for 1 hour.

35
Figure 3.11. Crystallization profile, obtained by differential scanning colorimetry, of hazelnut oil and cocoa butter lipid
blends with different concentrations of wax 2. The samples were first heated until 85°C, kept for 10 min at this
temperature, cooled until 5°C and kept at this temperature for 1 hour.
By comparing the two graphs a first difference can be pointed out: waxes 1 and 2 have different
crystallization curves. In the case of wax 1, in Figure 3.5., it can be noticed that the crystallization behavior
is characterized by two close peaks, the second (from right to left) being the highest in the curve. In the
case of wax 2 fat mixtures, a high peak can be noticed at first (when reading the graph from right to the left)
and a second one is visualized afterwards with a much smaller area. This difference in the crystallization
behavior is due to the fact that these waxes have different chemical compositions. In specific the content
and type of lipids will influence the lipid crystal network formation, size and shape of the lipid crystals, which
in turn determine the functional and physical properties of the produced fat mixtures92.
It seems that the addition of the wax pushes the crystallization step to a higher temperature. This can be
confirmed by the calculations of the onset temperatures (Tonset), temperatures at which the mixtures start to
crystallize, and maximum temperatures (Tmax), temperature at which the peak of crystallization happens,
Table 3.4. Observed Tonset values show that a higher wax content in the sample leads the crystallization to
start earlier, at a higher temperature, and consequently the peak of crystallization also happens earlier.
This can be explained since pure waxes are high melting point materials and have low solubility in vegetable
oils. Therefore, when used to develop a structure with lower melting point ingredients like cocoa butter they
“push” the crystallization step to start at higher temperatures, when compared to mixtures with only cocoa
butter and hazelnut oil.

36
Analyzing the control crystallization curve, it is possible to realize that no crystallization is happening, which
could be justified by the fact that due to the high amount of hazelnut oil, and therefore high content of liquid
fat, most of the possible cocoa butter crystals to be formed were dissolved in the fat mixture. In fact, through
the PLM pictures, section 3.2.1., could be verified that big cocoa butter crystals are formed in the lipid blend
mixtures but not in great quantity, and therefore not enough to be detected by the DSC.
Even though in the intermediary concentrations, significant differences were not always observed, by
comparing the extremes of concentrations in both waxes, there was an increase in the melting enthalpy
from the lowest to highest concentration. The same happened for the onset temperature of crystallization
and the temperature for the maximum crystallization peak. In the case of the latter it was also possible to
identify higher maximum temperatures in the wax 2 samples.

37
3.2.3.2. Melting profile
As for the crystallization profile, the melting profile of a mixture also results from a combination of the melting
behavior of each component of said mixture.
Regarding the melting profile, visible in Figures 3.12 and 3.13, through the results it can be concluded that
the addition of an increasing concentration of wax also shifts the temperature of the melting peak to a higher
temperature, which complies with the results seen for the crystallization profile. With the addition of the
different waxes, and due to their high melting point, the offset melting temperature (temperature at which
the intersection of the tangent of the shoulder with the extrapolated horizontal baseline occurs) of the
mixture will be pushed to a higher temperature, when compared to the reference mixture of CB and HO,
indicating as well that this factor can lead to a higher capacity of temperature stability for the final product.
For most of the samples, it is possible to identify two distinct melting peaks in the wax samples, the former
from 20°C to 30°C and the latter from around 45°C onwards, characterizing the concentration of wax, while
in the control sample only the former was identified.
Figure 3.12. Melting profile, obtained by differential scanning colorimetry, of lipid blends with different concentrations
of wax 1. After the crystallization step, the temperature was rised until 20°C, kept for 1 hour at this temperature, and
finally the temperature was increased until 85°C.

38
Figure 3.13. Melting profile, obtained by differential scanning colorimetry, of lipid blends with different concentrations
of wax 2. After the crystallization step, the temperature was raised until 20°C, kept for 1 hour at this temperature, and
finally the temperature was increased until 85°C.
Specifically for the wax 1 g% sample the effect of the addition of the wax was so significant that the most
significant melting peak was moved into the zone of the 45-50°C and not in the zone of the 25-30°C, where
it is placed for the rest of the samples.
Wax 2 f% and wax 2 h% showed significantly higher melting enthalpies than the control one. The highest
offset temperature was observed for the wax 1 g%, wax 1 e%, wax 1 b% and wax 1 a% samples, again
very distant from the control sample.

39
Table 3.4. Maximum temperature of crystallization and melting peaks, melting enthalpies and onset and offset
temperature of crystallization and melting respectively.
Crystallization behavior Melting behavior
Sample Tonset (°C) Tmax (°C) Enthalpy (J/g) Tmax (°C) Toffset (°C) Enthalpy (J/g)
Control 0.0 ± 0.0 28.9 ± 0.1c 31.9 ± 0.4a 4.3 ± 0.5a
Wax 1 a% 39.4 ± 4.0a 34.0 ± 9.2d 1.2 ± 0.1 28.4 ± 0.0e 66.7 ± 0.5b 4.4 ± 0.4a
Wax 1 b% 37.8 ± 0.2a 27.6 ± 0.3e 1.4 ± 0.2 28.7 ± 0.7b 62.3 ± 2.9bc 4.9 ± 0.7ab
Wax 1 c% 39.4 ± 0.3c 29.7 ± 0.1f 3.1 ± 0.1 29.3 ± 0.5a 70.4 ± 0.2bc 5.8 ± 0.5bcd
Wax 1 d% 40.8 ± 0.7b 32.1 ± 0.3g 3.4 ± 0.3 29.2 ± 0.4a 70.2 ± 0.0bc 4.8 ± 0.4ab
Wax 1 e% 41.4 ± 0.2bd 33.3 ± 0.1g 4.7 ± 0.4 29.7 ± 0.6d 70.4 ± 3.9bc 6.5 ± 0.6cde
Wax 1 g% 43.7 ± 0.5e 37.5 ± 0.5b 6.9 ± 0.4 44.8 ± 0.5f 73.4 ± 0.3c 6.0 ± 0.5bcd
Wax 2 b% 37.5 ± 0.2a 31.1 ± 3.5a 1.7 ± 0.3 28.7 ± 0.4b 52.7 ± 1.5e 4.7 ± 0.4ab
Wax 2 c% 39.7 ± 0.1c 37.6 ± 4.8b 2.0 ± 0.4 28.9 ± 0.4c 54.6 ± 0.5d 5.2 ± 0.4bc
Wax 2 d% 41.7 ± 0.3bd 39.3 ± 4.9c 2.8 ± 0.1 29.0 ± 0.1c 55.7 ± 0.9d 5.1 ± 0.1abc
Wax 2 e% 41.9 ± 0.1d 40.3 ± 0.2c 2.5 ± 0.2 29.1 ± 0.1c 55.7 ± 0.4d 5.9 ± 0.1cd
Wax 2 f% 43.5 ± 0.1e 41.8 ± 0.8h 3.8 ± 0.5 29.3 ± 0.6a 57.8 ± 0.8d 7.2 ± 0.6de
Wax 2 h% 45.4 ± 0.1f 44.2 ± 0.8i 5.3 ± 0.2 29.7 ± 0.9d 57.8 ± 1.2d 8.3 ± 0.9e
a, b, c, d, e, f, g, h, i, j: Different letters, within the same column indicate significant differences at p<0.05
The crystallization enthalpy does not show indication of significative difference since there were too many similarities between
the samples and therefore they are present in Annex B.2, table B.3.
3.2.4. Solid fat content
The knowledge of solid fat content (SFC) is an important parameter of quality control since it has been
indicated that the SFC values of lipids or lipid mixtures at specific temperatures can indicate essential
attributes of a product such as mastication quality and hardness. For instance, cocoa butter SFC values at
temperatures below 25°C characterize hardness, and the values between 25 and 30°C reflect the
resistance of the sample to heating. In the range of 27-33°C the SFC characterizes the flavor release and
cooling sensation in the mouth and after 35°C a high value of SFC indicates the presence of a fat fraction
responsible for a waxy taste10.
All the samples had an almost linear decrease in solid fat content from 0°C to 25°C, after which temperature
it is assumed that the big majority of the fat crystals were melted, and the SFC of each sample was close
to 0. As it can be perceived from the Figures 3.14 and 3.15, even though the concentration of waxes varies
in 4%, in both types, from the lower to the higher value, no specific trend can be established between wax
concentration and SFC from it. The SFC profile of these samples indicates therefore that the control and

40
wax lipid blends might present a similar behavior in terms of hardness, resistance of the sample to heating
and mouthfeel.
It is relevant to mention that the samples with lower concentrations (until 2.5% addition of wax) were
completely melted and had a clear aspect at 35°C but the samples with a higher concentration, wax 2
f%/wax 1 e% and wax 2 h%/wax 1 g%, only became melted at 40°C and 45°C, respectively. Despite this
fact, none of the samples presented a high value of SFC after 35°C giving the prediction that the samples
might not present a waxy taste. It can be speculated that the inclusion of this component affects lightly this
parameter, in the way that the solid fat content values don’t differ significantly between the samples. It is as
well relevant to refer that, after the experiment, the samples with wax maintained a stronger structure than
the reference, and the higher the concentration of wax, the stronger the structure of the same.
Figure 3.14. Solid fat content (SFC) profile of the lipid blends containing wax 1.

41
Figure 3.15. Solid fat content (SFC) profile of the lipid blends containing wax 2.
In Figure 3.16, an exemplificative picture of some of the wax 1 samples after the NMR measurements is
presented, confirming the increase in strength of structure with the concentration of wax. As it is possible
to verify, with the increase in concentration of wax (increasing form left to right, from 1% to 3%), the mixtures
evolve from more translucid to opaquer, indicating a denser structure of the last ones. It is also possibly to
verify from the inclination of solution in the tubes that the first sample is more liquid than the last one.
Figure 3.16. Wax 1 samples after NMR measurements, increasing concentration of wax from left to right (a% to e%).

42
3.2.5. Visual assessment
To verify if there was any difference between the samples regarding visual appearance, 10gr of each were
placed into translucid containers and then placed into a cooling cabinet at 5°C for 1h30 to set. After this the
samples were placed at 20°C for 24h after which pictures were taken (Figures 3.17 and 3.18).
Figure 3.17. Visual aspect of wax 1 samples and control from left to right, up row: Control, wax 1 a%, wax 1 b%, wax
1 c%. Down row: wax 1 d%, wax 1 e% and wax 1 g%.
Figure 3.18. Visual aspect of wax 2 samples and control from left to right, up row: Control, wax 2 b%, wax 2 c%, wax
2 c%. Down row: wax 2 e%, wax 2 f% and wax 2 h%.
As can be seen from the pictures, differences between the samples with lower and higher concentrations
can be distinguished. While the samples with lower concentrations showed a very glossy effect on the
surface, the ones with higher concentrations showed a more waxy and non-glossy aspect, being this a
reflection of the consistency of the sample. It is even possible to verify that the wax 1 g% and wax 2 h%
samples broke, showing a high hardness. Regarding the color, there was not a significant difference in this
aspect.
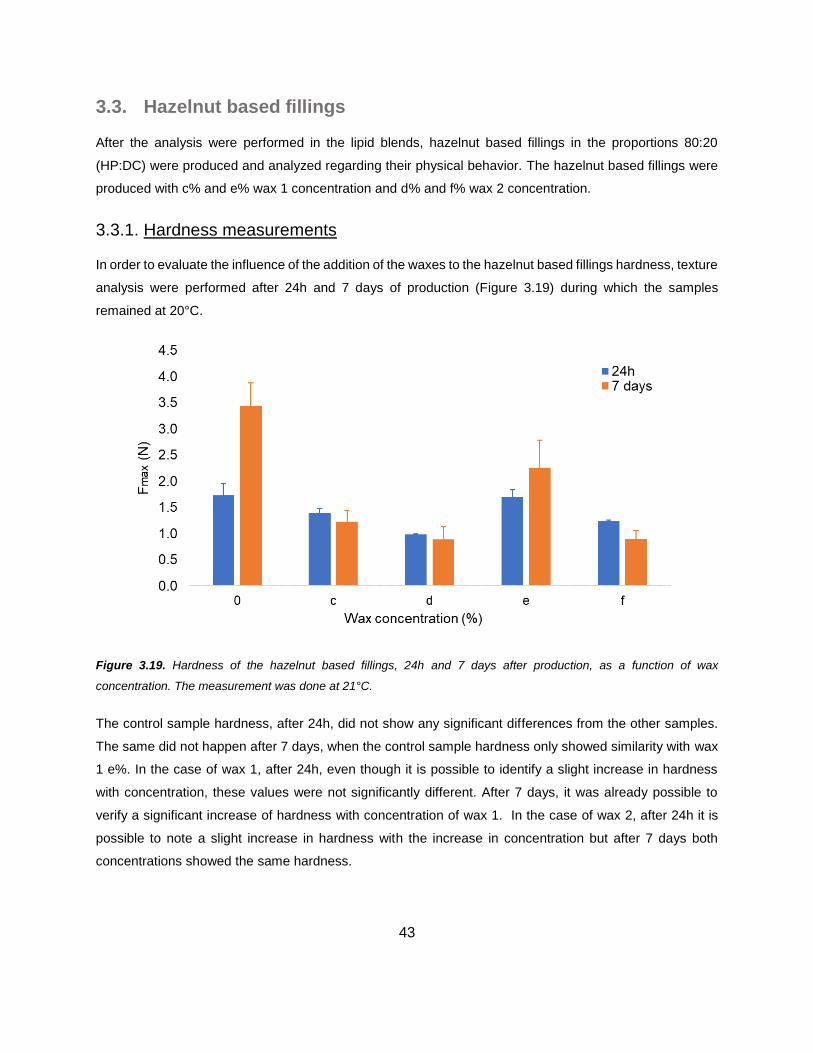
43
3.3. Hazelnut based fillings
After the analysis were performed in the lipid blends, hazelnut based fillings in the proportions 80:20
(HP:DC) were produced and analyzed regarding their physical behavior. The hazelnut based fillings were
produced with c% and e% wax 1 concentration and d% and f% wax 2 concentration.
3.3.1. Hardness measurements
In order to evaluate the influence of the addition of the waxes to the hazelnut based fillings hardness, texture
analysis were performed after 24h and 7 days of production (Figure 3.19) during which the samples
remained at 20°C.
Figure 3.19. Hardness of the hazelnut based fillings, 24h and 7 days after production, as a function of wax
concentration. The measurement was done at 21°C.
The control sample hardness, after 24h, did not show any significant differences from the other samples.
The same did not happen after 7 days, when the control sample hardness only showed similarity with wax
1 e%. In the case of wax 1, after 24h, even though it is possible to identify a slight increase in hardness
with concentration, these values were not significantly different. After 7 days, it was already possible to
verify a significant increase of hardness with concentration of wax 1. In the case of wax 2, after 24h it is
possible to note a slight increase in hardness with the increase in concentration but after 7 days both
concentrations showed the same hardness.
44
Through the comparison of both graphs it is possible to verify that the control sample showed an increase
in hardness from 24h to 7 days after production. This fact is likely to be due to the phenomena of post-
crystallization. Post-crystallization includes phenomena such as agglutination of adjacent surfaces,
sintering or spontaneous dissolution of smaller particles into bigger ones, also known as Ostwald ripening.
The process of sintering relates to the formation of solid bonds between the crystals of fat, leading to the
formation of a cohesive network having consequently an undesirable increase in the hardness of the
sample8.
This effect did not happen with the wax samples, as from 24h to 7 days after production, for the same
concentration, the hardness measured was the same or lower. It is then hypothesized that the waxes, after
setting during the cooling step might create a barrier between the fat crystals, not allowing them to establish
bonds between each other. The samples wax 1 c%, wax 1 e% and wax 2 d% did not show significant
difference between the two periods considered.
3.3.2. Determination of the flow behavior at 40°C
The flow behavior of the fillings was evaluated through the variation of the shear rate applied to the filling.
It is important to evaluate this parameter since it can give an idea on how the product behaves during
manufacturing and therefore influence the processes and conditions for the manufacturing of the product.
The viscosity of the chocolate, or in this case, filling, can also influence the flavor of the chocolate in the
mouth and consequently have a negative impact in the consumer mouthfeel105. This measurement
consisted in a pre-shear of the sample, consequent variation of the shear rate from 2s-1 to 50s-1 and
evaluation of shear stress (Figure 3.20a), from which the viscosity values were also drawn (Figure 3.20b).

45
Figure 3.20a. Shear stress (Pa) variation with shear rate (s-1) for the hazelnut based fillings
Figure 3.20b. Viscosity (Pa.s) variation with shear rate (s-1) for the hazelnut based fillings
As expected, the fillings present a non-Newtonian fluid behavior, the viscosity is dependent on the shear
rate applied, and in this case a decrease in the viscosity and an increase in shear stress happens with the
increase in shear rate, being the filling a pseudoplastic fluid.
0
50
100
150
200
250
300
350
0 5 10 15 20 25 30 35 40 45 50
Shear
str
ess (
Pa)
Shear rate (s-1)
0
5
10
15
20
25
30
35
40
0 10 20 30 40 50
Vis
cosity (
Pa.s
)
Shear rate (s-1)

46
As it is possible to see through Figure 3.19b. the control and wax 1 c% samples show quite similar viscosity
values leading to the idea that the addition of this concentration of wax does not lead to a significant
difference in the product. With the increase to wax 1 e% it is already possible to notice a slight increase in
the viscosity values of the filling. Both wax 2 fillings samples show to be more viscous than the
corresponding wax 1 samples, and both waxy fillings show an increase in viscosity with the increase in wax
concentration. The shear stress of the samples increases with the shear rate applied, the wax 2 f% being
the one which presents the highest values of shear stress (Figure 3.20b). The control sample, on the other
side, presents the lowest values.
According with the Casson Model two parameters were extrapolated: the Casson yield value and Casson
viscosity, present in Table 3.5. The Casson yield value is usually defined as the minimum energy necessary
to start the chocolate flow. The Casson viscosity value is related with the maintenance of the chocolate flow
once it started105. The wax 2 samples, in specific wax 2 f%, showed both the highest values of Casson
Yield and Casson Viscosity. A higher Casson yield value could be an advantage in the manufacturing of
this filling since the tendency for the filling to run out through the sides of the chocolate cup, once filled,
would be lower, avoiding leaking106. On the other hand, a too high value of Casson yield value could also
mean a higher hardness in the mouth leading to an unpleasant mouthfeel for the consumer, but more
assessments would have to be performed in order to reach a conclusion. Regarding the Casson viscosity,
a too high value could also lead to a higher difficulty in the manufacturing and processing of the
confectionery products and a higher energy consumption from the manufacturing side.
Table 3.5. Casson model parameters for the viscosity behavior of the hazelnut based fillings
Casson yield (Pa) Casson Viscosity (Pa.s)
Control 26.2±0.4a 2.27±0.02a
Wax 1 c% 25.4±1.2a 2.47±0.01b
Wax 1 e% 27.4±0.6b 2.77±0.05c
Wax 2 d% 32.3±2.7bc 2.66±0.08c
Wax 2 f% 39.0±6.9c 3.16±0.11d
a, b, c, d: Different letters, within the same column indicate significant differences at p<0.05
3.3.3. Melting behavior
Through the visualization of the melting behavior curves of the different samples (Figure 3.21) it is possible
to say that the difference between the shape of all of them is not very significant except for the case of the
sample wax 2 d%. Other difference can be pointed: the fact that the wax 2 samples showed a small peak
at a high temperature, showing the late melting phenomena of the wax happening. This peak had already
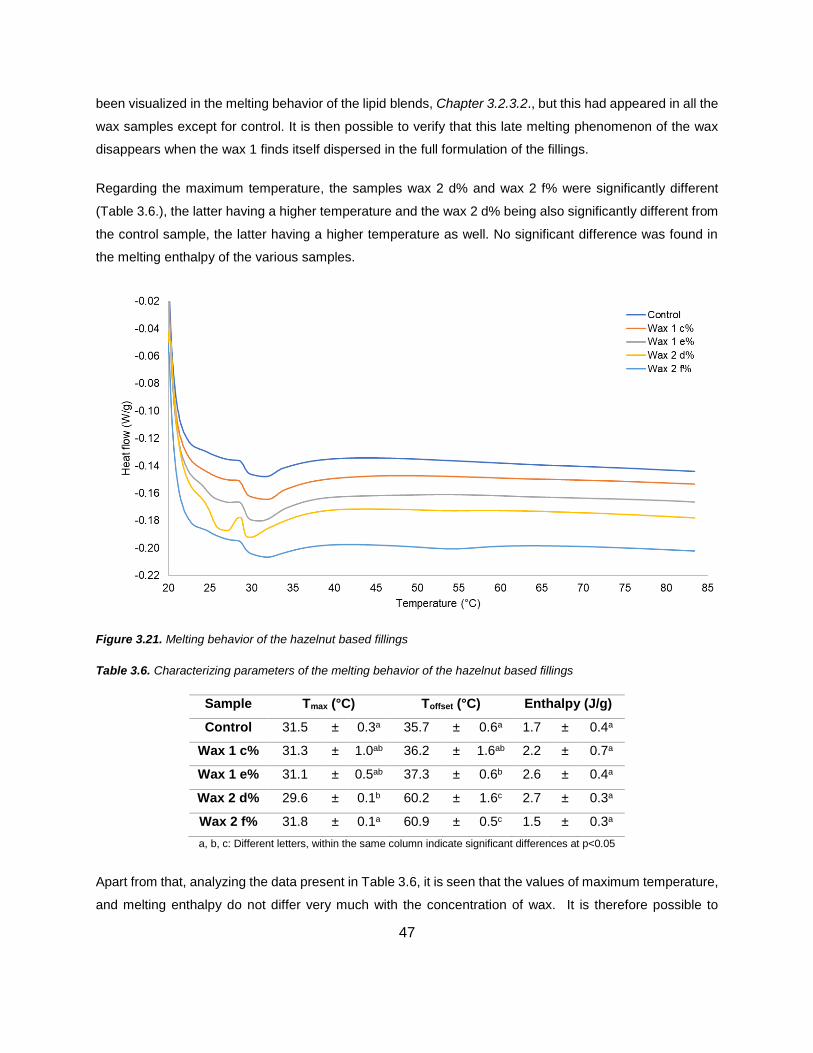
47
been visualized in the melting behavior of the lipid blends, Chapter 3.2.3.2., but this had appeared in all the
wax samples except for control. It is then possible to verify that this late melting phenomenon of the wax
disappears when the wax 1 finds itself dispersed in the full formulation of the fillings.
Regarding the maximum temperature, the samples wax 2 d% and wax 2 f% were significantly different
(Table 3.6.), the latter having a higher temperature and the wax 2 d% being also significantly different from
the control sample, the latter having a higher temperature as well. No significant difference was found in
the melting enthalpy of the various samples.
Figure 3.21. Melting behavior of the hazelnut based fillings
Table 3.6. Characterizing parameters of the melting behavior of the hazelnut based fillings
Sample Tmax (°C) Toffset (°C) Enthalpy (J/g)
Control 31.5 ± 0.3a 35.7 ± 0.6a 1.7 ± 0.4a
Wax 1 c% 31.3 ± 1.0ab 36.2 ± 1.6ab 2.2 ± 0.7a
Wax 1 e% 31.1 ± 0.5ab 37.3 ± 0.6b 2.6 ± 0.4a
Wax 2 d% 29.6 ± 0.1b 60.2 ± 1.6c 2.7 ± 0.3a
Wax 2 f% 31.8 ± 0.1a 60.9 ± 0.5c 1.5 ± 0.3a
a, b, c: Different letters, within the same column indicate significant differences at p<0.05
Apart from that, analyzing the data present in Table 3.6, it is seen that the values of maximum temperature,
and melting enthalpy do not differ very much with the concentration of wax. It is therefore possible to
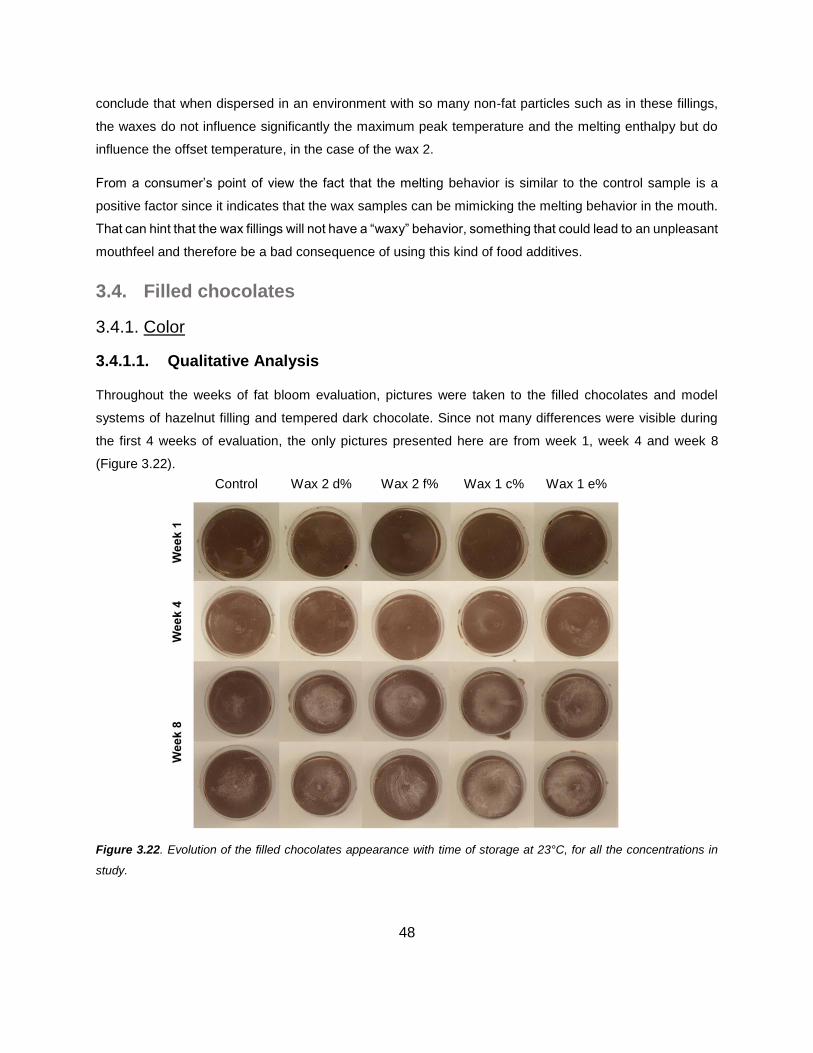
48
conclude that when dispersed in an environment with so many non-fat particles such as in these fillings,
the waxes do not influence significantly the maximum peak temperature and the melting enthalpy but do
influence the offset temperature, in the case of the wax 2.
From a consumer’s point of view the fact that the melting behavior is similar to the control sample is a
positive factor since it indicates that the wax samples can be mimicking the melting behavior in the mouth.
That can hint that the wax fillings will not have a “waxy” behavior, something that could lead to an unpleasant
mouthfeel and therefore be a bad consequence of using this kind of food additives.
3.4. Filled chocolates
3.4.1. Color
3.4.1.1. Qualitative Analysis
Throughout the weeks of fat bloom evaluation, pictures were taken to the filled chocolates and model
systems of hazelnut filling and tempered dark chocolate. Since not many differences were visible during
the first 4 weeks of evaluation, the only pictures presented here are from week 1, week 4 and week 8
(Figure 3.22).
Figure 3.22. Evolution of the filled chocolates appearance with time of storage at 23°C, for all the concentrations in
study.
Control Wax 2 d% Wax 2 f% Wax 1 c% Wax 1 e%

49
As a first remark it should be noted that in the first week, there was no fat bloom yet, the whitish marks
visible in the filled chocolates are defects due to production (so-called cooling spots), due to the contact of
the chocolate with the filled chocolate molds. In week 4 the first traces of fat bloom became visible, and
despite the variation of wax concentration in the samples, no differences in the amount of fat bloom were
detected. In week 8 the quantity of fat bloom was already considerable, and it was visible that the control
samples, in general, presented less fat bloom development than the wax samples. This decrease in gloss
and increase in fat bloom of the samples was visualized, as expected, since with time the amount of oil
migrating to the surface increased, leading to the re-melting of fat crystals on the outside shell and posterior
recrystallization in the βVI form.
3.4.1.2. Quantitative analysis
The evaluation of the color of the filled chocolates was also performed in a quantitative manner, by the use
of a spectrophotometer that returned the values of L, the lightness index; a, the red/green index; and b, the
yellow/blue index; in SCI and SCE mode. Since chocolate is usually glossy, if there is incident light on the
product, that will be reflected which can cause the perception of the color to be different if it looked upon
different angles. Due to that fact, it is then better to use the SCI mode that already takes the specular
component into account and therefore normalizes the results according to this factor.
Through the values of L, a and b, the value of dE*, characterizing the total change of color compared to the
control, was calculated by Equation 1:
(𝑑𝐸∗)2 = (𝑑𝑎∗)2 + (𝑑𝑏∗)2 + (𝑑𝐿∗)2 (1)
The results of this factor are characterized through what is obvious or not for the human eye107:
ΔE* < 1 Color differences are not obvious for the human eye
1<ΔE*<3 Minor color differences could be appreciated by the human eye depending of the color
ΔE*>3 Color differences are obvious for the human eye
These analyses were performed after 1, 2, 3, 4 and 8 weeks storage. Since until 4 weeks of studies there
were no significant differences between the different concentrations, only the values collected in week 1
are presented here (Table 3.7) but the ones from week 4 can be consulted in Annex C, table C.1.
After week 1 there was no visible difference in color between the control and the wax samples, which
complies with the pictures taken and presented in section 3.4.1.1 for the same period, that did not present
differences in fat bloom appearance.

50
Table 3.7. Color measurements parameters for the filled chocolates after 1 week. No significant differences were
detected between the values.
L* a* b* ΔE*
Control 27.63 ± 0.22 5.79 ± 0.09 4.6 ± 0.08 -
Wax 1 c% 27.97 ± 0.25 5.79 ± 0.14 4.53 ± 0.11 0.34
Wax 1 e% 27.69 ± 0.15 5.82 ± 0.13 4.57 ± 0.20 0.07
Wax 2 d% 27.33 ± 0.21 6.00 ± 0.09 4.83 ± 0.08 0.43
Wax 2 f% 27.06 ± 0.64 6.04 ± 0.02 4.86 ± 0.11 0.67
After week 8, visible appearances were verified, and therefore these results are presented in Table 3.8.
Table 3.8. Color measurements parameters for the filled chocolates after week 8.
L* a* b* ΔE*
Control 26.47 ± 0.23a 4.67 ± 0.91a 4.19 ± 0.22a -
Wax 1 c% 31.65 ± 1.92b 5.16 ± 0.29a 4.16 ± 0.17a 5.20
Wax 1 e% 34.16 ± 1.70b 4.90 ± 0.48a 3.91 ± 0.68ab 7.70
Wax 2 d% 33.81 ± 3.71b 4.93 ± 0.43a 3.92 ± 0.29ab 7.35
Wax 2 f% 32.46 ± 1.72b 4.86 ± 0.27a 3.65 ± 0.26b 6.02
a, b: Different letters, within the same column indicate significant differences at p<0.05
Comparing week 1 with week 8 it was visible that the lightness index, L*, showed the highest difference, by
increasing its value. With the increase in storage time the samples developed more fat bloom, and therefore
a whitish layer started to appear in the chocolate surface, justifying the lighter index of the chocolate. Only
in week 8 the wax samples showed differences in color, ΔE*, visible to the human eye.
3.4.2. Visual fat bloom assessment
To evaluate the appearance of fat bloom in the filled chocolates produced, a fat bloom assessment test
was organized.
The reference sample of the test were empty dark chocolate shells stored at 15°C for the same time as the
normal samples. The results of the assessment during the different weeks are then presented in the Figures
3.23.

51
Figure 3.23a. Fat bloom assessment results regarding the percentage of surface of the filled chocolates of each sample
with no gloss
Figure 3.23b. Fat bloom assessment results regarding the decrease of intensity of gloss in the filled chocolates of each
sample, when compared to the reference
Figure 3.23c. Fat bloom assessment results on the percentage of surface of the filled chocolates of each sample with
fat bloom

52
The score of each parameter is evaluated from 0 to 5, the former representing 0% of fat bloom, surface
with no gloss or decrease in intensity and the latter 100% of the same parameters. From week 1 to week 3
the evaluation panel was only composed by 2 participants, opposed to week 4 and 8 in which 8 participants
evaluated the filled chocolates. Due to this factor, the fact that the results in week 3 might show higher
values than in week 4 might be explained, since the amount of evaluations might not have been enough to
return a significative answer. In week 8, a decrease in gloss and increase in fat bloom of the samples was
visualized, as expected, since with time the amount of oil migrating to the surface increases, in order to
reach equilibrium, leading to the re-melting of fat crystals on the outside and posterior recrystallization in
the βVI form. The higher the amount of oil migration the more recrystallization happens increasing therefore
the tendency for fat bloom formation.
For the case of week 4 onwards, since a more significative panel was already built, the fat bloom score was
also calculated, Equation 2, as a dependent factor from the result of the three questions (Q1, Q2 and Q3).
𝑇𝑜𝑡𝑎𝑙 𝐹𝐵 𝑠𝑐𝑜𝑟𝑒 = 0.5𝑆𝑐𝑜𝑟𝑒(𝑄1) + 0.5𝑆𝑐𝑜𝑟𝑒(𝑄2) + 𝑆𝑐𝑜𝑟𝑒 (𝑄3) (2)
For the case of week 4, even though the global value of fat bloom between the samples seems to be
different, through the statistical analysis it was visible that the values were not significantly different (Table
3.9.). In fact, this was partially expected since the panel members agreed that all the chocolates were still
quite young and had an overall similar aspect.
Table 3.9. Total fat bloom score for all the samples by week 4 and 8, based on the surface glossiness of the chocolates,
the decrease in intensity of the gloss regarding reference samples and the fat bloom appearance in the surface.
a, b: Different letters, within the same column indicate significant differences at p<0.05
The overall fat bloom score for week 8 (Table 3.9.) demonstrated a very large difference between the control
and the wax samples, indicating that all the latter samples had a higher development of fat bloom. The
hypothesis stating that the addition of the wax would difficult the formation of bonds between the fat crystals
Sample FB score W4 FB score W8 FB score W13
Control 1.56±0.63a 1.83±0.24a 7.30±0.51a
Wax 1 c% 1.50±0.71a 4.70±0.68b 6.60±0.86a
Wax 1 e% 2.13±0.70a 5.10±0.73b 7.20±0.51a
Wax 2 d% 2.50±1.06a 5.60±0.97b 7.20±0.51a
Wax 2 f% 2.19±0.83a 4.00±0.95b 6.10±0.80a

53
(as seen in the hardness measurements, where the control was the only sample having the post-
crystallization effect) and contribute to the disruption of a structure between these crystals and the non-fat
particles might be supported. In that way, the quantity of wax added seems not to be enough to create a
network formed by the wax crystals and still disrupts the structure that could be created between the fat
crystals and non-fat particles in the formulation, leading to the increase in oil leakage.
During week 13 it was again visualized that the all the samples were showing similar behavior, therefore
confirming that the amount of wax added was not able to create a structure that would retard the
appearance of fat bloom.
3.5. Model systems
3.5.1. Oil migration
The OOO and LOO TAGs, being characteristic from hazelnut oil, represent the oil migration to the outside
surface of the dark chocolate. These can be analyzed through the calculation of the already mentioned
ratios, which present a relation between the oil migration and cocoa butter percentage, being therefore a
normalized value that can be correlated directly with oil migration. In week 3, for both the [OOO]/[StOSt]
and [LOO]/[StOSt] ratios, the control sample was the one with the higher percentage measured, values
present in Table 3.10., being this an indicator that the control was the least efficient sample in entrapping
the oil in the filling.
Tables 3.10. Peak area of the different characterizing peaks of the oil migration and cocoa butter for week 3
[OOO]/[StOSt] [LOO]/[StOSt]
Control 0.210 ± 0.023a 0.038 ± 0.004a
Wax 1 c% 0.083 ± 0.003b 0.013 ± 0.001b
Wax 1 e% 0.068 ± 0.004c 0.010 ± 0.001bc
Wax 2 d% 0.050 ± 0.019d 0.006 ± 0.003c
Wax 2 f% 0.069 ± 0.006c 0.011 ± 0.002bc
a, b, c, d: Different letters, within the same column indicate significant differences at p<0.05
After week 4, Table 3.11, the same tendency was maintained, the control sample being the one having the
highest percentages of OOO and LOO ratios, agreeing therefore with the results from the previous week.
The samples wax 1 c% and wax 2 f% are the ones, after the control, that show higher migrations of oil to
the outside surface, being therefore the ones which seem to have a lower capacity of entrapping the oil in
the filling.

54
Between the two weeks of analysis, it was also visible an increase in the percentage of the hazelnut oil
TAGs in all the samples indicating that the oil migration into the dark chocolate disk is continuing,
culminating in a higher accumulation of hazelnut oil in the dark chocolate.
In the case of week 8 (Table 3.12.) regarding the [LOO]/[StOSt] ratios, the control, wax 1 c% and wax 1 e%
samples show significantly similar values, while the wax 2 samples already present higher values. This is
an indicator that the wax 2 in this sample not only was not able to develop a denser network in the filling,
as it might have interfered with the formation of the network between the cocoa butter crystals and the non-
fat particles, leading to a higher oil migration from the filling to the dark chocolate disk. Possibly, if the
addition of the waxes happens in a very low amount, it disrupts the structure that would be formed without
this compound, and it is not enough to create bonds between the wax crystals and develop a wax network.
Potentially by adding a higher amount, the threshold of wax network formation is achieved, allowing the
filling to have a similar behavior as the control one, something that seems to have happened with the rest
of the samples. These samples did not fit the purpose to retard the oil migration into the chocolate surface
either, as they presented similar or worse migration levels than the ones of the control sample. In that way,
possibly a higher amount of the wax tested could already be enough to allow a stronger wax network to be
formed and be effective against oil migration.
Table 3.11. Peak area of the different characterizing peaks of the oil migration and cocoa butter for week 8.
[OOO]/[StOSt] [LOO]/[StOSt]
Control 0.244 ± 0.040a 0.047 ± 0.009a
Wax 1 c% 0.289 ± 0.097abc 0.053 ± 0.016a
Wax 1 e% 0.298 ± 0.023a 0.058 ± 0.007ab
Wax 2 d% 0.421 ± 0.041b 0.088 ± 0.011c
Wax 2 f% 0.341 ± 0.022bc 0.070 ± 0.005bc
a, b, c, d: Different letters, within the same column indicate significant differences at p<0.05
It is worth mentioning that both in week 3 and week 4, the wax samples had shown a better performance
against oil migration than the control sample, indicating that to prevent smaller amounts of oil migration, in
a smaller time span, this structure could be effective. In order to retard larger amounts of oil migration
possibly a larger amount of wax would be needed to add than the ones tested in these trials.
From the results obtained from week 13, table 3.12., it was visible that the control sample showed a much
worse behavior than the wax samples, showing more than the double levels of oil migration.

55
Table 3.12. Peak area of the different characterizing peaks of the oil migration and cocoa butter for week 13.
[OOO]/[StOSt] [LOO]/[StOSt]
Control 0.914 ± 0.043a 0.298 ± 0.015a
Wax 1 c% 0.323 ± 0.019b 0.062 ± 0.005b
Wax 1 e% 0.381 ± 0.009b 0.075 ± 0.004c
Wax 2 d% 0.319 ± 0.017b 0.059 ± 0.003b
Wax 2 f% 0.473 ± 0.026c 0.095 ± 0.008d
a, b, c, d: Different letters, within the same column indicate significant differences at p<0.05
Comparing these results to the ones obtained in section 3.4.2., it is visible that the oil migration and fat
bloom appearance did not show similar sample behavior. Through the HPLC analysis the oil migration of
the control and most of the samples did not show significant differences, while in the fat bloom assessment
tests after eight weeks of storage at 23°C the final scores showed worst results to wax samples, by far,
than to the reference one. After 13 weeks of storage, despite the fat bloom assessment panel showing
similar levels of fat bloom for all the samples, the oil migration evaluation showed much higher levels for
the control sample.
To note that for fat bloom to be visible both oil migration and crystal growth and development of these at
the chocolate surface must happen. In that way, despite oil migration being a strong indicator and a
precedent of fat bloom, these two parameters might not always be linearly related, as there are other factors
involved. As Smith et al. (2007) concluded, even small amounts of oil migration can lead to big differences
in the transformation rate of βV to βVI 18. In fact, as mentioned before, Ziegleder and Schwingshand (1998)
reported a clear correlation of oil migration and the onset of fat bloom but not with the development of fat
bloom. The same author reported that the development of fat bloom was dependent on the composition of
the fat phase, which consists of filling fats, liquid CB and dissolved CB26. In that way, waxes could possibly
be partially migrating with the oil onto the surface and induce the re-crystallization of the crystals in the βVI
polyform, despite unlikely, as waxes are high melting compounds.

56
4. Conclusions and Future Work
The main aim of this thesis was to investigate the oleogelation of hazelnut fillings, through the addition of
waxes, as a method to retard oil migration from the center to the chocolate surface and therefore retard fat
bloom appearance.
From the study of the blends of cocoa butter, hazelnut oil and wax it was concluded that the addition of
waxes allowed the formation of a higher amount of crystals and, in the case of wax 1, a crystal network was
formed for the highest concentration tested. Through the same type of analysis of the lipid blend mixture
with wax and 15 wt% sugar it was verified that, at this concentration the sugar particles could act as a
support matrix for the fat crystals to grow on. From the rheological behavior of the lipid blends it was
concluded that the wax samples had a more elastic-like behavior, against the more viscous-like behavior
of the control sample. The insertion of the wax in the sample led the crystallization step to start earlier and
allowed for the final product to maintain a higher resistance to deformation. The wax 1 samples showed a
higher resistance to deformation than the wax 2 samples. Through the analysis of the crystallization
behavior it was confirmed that the wax pushed the crystallization step to start earlier, due to the existence
of higher content of high melting crystals. Despite showing similar onset temperatures for the same
concentrations, the wax 2 samples showed higher maximum temperatures for this step. The control sample
did not show any crystallization. The melting behavior was also influenced by the wax addition, leading to
a higher melting point. In this case, the wax 1 samples showed a much higher offset temperature than the
wax 2 samples. The highest concentration of the wax 1 sample showed the highest maximum temperature
and was the only sample that had a maximum peak that coincided with the second melting peak. Regarding
the solid fat content, all the samples showed similar values for this parameter and a decrease with
increasing temperature. The addition of waxes did not seem to influence the solid fat content of the samples
significantly but still influenced their microstructure, as the samples with a higher content of wax had a more
solid-like structure. To summarize, the wax-based lipid blends showed higher number of crystals formed
and a higher resistance to deformation. The melting and crystallization behavior also confirmed that the
existence of more high melting crystals, from the wax, led to a more stable product, due to the higher
crystallization and melting temperature ranges. It was also concluded that the solid fat content of the
samples was not affected by the addition of wax.
Studies were also performed on hazelnut based fillings, starting by hardness measurements after 24h, at
which time the hardness between the different concentrations was similar, and 7 days, after which the
control and wax 1 e% showed significantly different values compared to the rest of the samples. The control
sample showed an increase in hardness during storage, attributed to the phenomena of post-crystallization,

57
while the rest of the wax samples showed no variation or a decrease of this parameter. Therefore, it is
suggested that the presence of wax inhibited the fat crystals from establishing connections between
themselves and create a denser structure after the cooling step. Flow behavior measurements were also
done on the hazelnut fillings. The wax 2 f% sample presented the highest values for both Casson yield
value and Casson viscosity. The control sample, on the other hand, showed the lowest values for these
parameters. It is worth mentioning that in the lipid blends, the cocoa butter and the waxes had the possibility
to co-crystallize before each measurement. The same did not happen with the fillings, as when the
tempered dark chocolate was added to the hazelnut paste, the latter had already been cooled to 32°C. On
the other hand, the non-fat particles in the hazelnut fillings, as was indicated, could act as a support matrix
for the wax and fat crystals in a percentage of 15 wt%, but could also possibly act as a barrier for the wax
to establish a stronger crystal network, when at higher percentages such as 66 wt%, the percentage of non-
solid like particles in the fillings. The melting behavior in the hazelnut based fillings with wax 1 was not
significantly altered by the addition of the wax, as it could be seen from Tmax and enthalpy. In the case of
the wax 2 samples, the addition of the waxes influenced the offset melting temperature, showing the late
melting of the wax, as in the lipid blends analysis. The wax 1 samples did not show this behavior leading
to the conclusion that this type of wax might lose its crystallization capacity at a greater extent than the wax
2, when dispersed in the high density non-fat particle formulation.
Finally, accelerated shelf life tests were done on filled chocolates and model systems. Until the 4th week,
no significant difference in fat bloom development between the different concentrations of waxes and the
control sample was detected. In the 8th week, significant higher values of fat bloom were found for the wax
samples. On the other hand, through the HPLC analysis, both in 3rd and 4th weeks the sample where the
oil had migrated the most into the chocolate shell was the control, indicating that this was the sample with
the least power to entrap oil. Despite this, in the 8th week, the HPLC analysis showed similar oil migration
values except for the wax 2 samples which showed the highest oil migration values. This fact might have
happened since not enough wax was added to the fillings and therefore no effective network to entrap the
oil in the sample was formed. Furthermore, it is possible that besides not forming a stable network, and
despite the unlikelihood, the partially melted waxes could also migrate with the oil to the surface and induce
the re-crystallization of the fat in the undesired polyform, βVI, leading to a faster appearance of fat bloom.
The addition of the waxes clearly altered the microstructure and behavior of the lipid blend samples, turning
them into more heat- and deformation- resistant ones. In the hazelnut fillings the waxes showed a different
behavior, namely in the viscosity/rheology field and in the melting behavior. From the fat bloom assessment
and oil migration tests, interesting results were obtained, still indicating that addition of both waxes into
chocolate filling formulations should undergo further investigation.

58
For future experiments, higher concentrations of these waxes should be tested in order to evaluate the
influence of a higher amount of wax on oil migration and fat bloom appearance. If these tests would be
successful, a very important parameter to evaluate would also be the sensory perception of the filled
chocolates containing waxes when compared to the control sample. Since these are products which final
goal is to be applied in the industry and therefore to be sold to regular consumers, it would also be important
to perform a sensory analysis experiment, possibly a triangle test to evaluate if there is a difference between
the control and wax containing samples, or a descriptive test in order to distinguish differences in
parameters such as mouthfeel, creaminess, hazelnut and waxy flavor of the chocolates.
The ultimate goal of the project is to use oleogelation as a fat bloom retarding technique for general hazelnut
fillings and not only for the one analyzed in this project so further investigations should also focus on the
application of this technique in other types of formulations. Furthermore, wax 1 and 2 were the oleogelators
used in this case but other authors have already recommended the importance of using other types of
waxes, mainly in experimental lipid blends, with also successful results, that could be further explored.

59
5. Bibliography
1. Ziegler, G. Product design and shelf-life issues: oil migration and fat bloom. in Science and Technology of Enrobed and Filled Chocolate, Confectionery and Bakery Products (ed. Talbot, G.) 185–210 (Woodhead Publishing Limited, 2009).
2. Caobisco. Statistical Bulletin 2015. (2015).
3. Galdámez, J. R., Szlachetka, K., Duda, J. L. & Ziegler, G. R. Oil migration in chocolate: A case of non-Fickian diffusion. J. Food Eng. 92, 261–268 (2009).
4. Lonchampt, P. & Hartel, R. W. Fat bloom in chocolate and compound coatings. Eur. J. Lipid Sci. Technol. 106, 241–274 (2004).
5. Talbot, G. Fats for chocolate and sugar confectionery. in Fats in Food Technology: Second Edition 169–211 (2014).
6. Rios, R. V. et al. Application of fats in some food products. Food Sci. Technol. 34, 3–15 (2014).
7. De Clercq, N. et al. Functionality of cocoa butter equivalents in chocolate products. Eur. Food Res. Technol. 443–474 (2016).
8. Dahlenborg, H. Fat bloom on chocolate confectionery systems - From core to surface. (Lund University, 2014).
9. Ribeiro, A. P. B. et al. Crystallization modifiers in lipid systems. J. Food Sci. Technol. 52, 3925–3946 (2015).
10. Marangoni, A. & Wesdorp, L. Structure and mechanical properties of fat crystal networks. (University of Guelph, 2013).
11. Depypere, F., De Clercq, N., Segers, M., Lewille, B. & Dewettinck, K. Triacylglycerol migration and bloom in filled chocolates: Effects of low-temperature storage. Eur. J. Lipid Sci. Technol. 111, 280–289 (2009).
12. Tran, P. D. et al. Controlling the stability of chocolates through the incorporation of soft and hard StOSt-rich fats. Eur. J. Lipid Sci. Technol. 117, 1700–1713 (2015).
13. Smith, K. W., Cain, F. W. & Talbot, G. Effect of nut oil migration on polymorphic transformation in a model system. Food Chem. 102, 656–663 (2007).
14. Ghosh, V., Ziegler, G. R. & Anantheswaran, R. C. Fat, moisture, and ethanol migration through chocolates and confectionary coatings. Crit. Rev. Food Sci. Nutr. 42, 583–626 (2002).
15. Choi, Y. J., McCarthy, K. L., McCarthy, M. J. & Kim, M. H. Oil migration in chocolate. Appl. Magn. Reson. 32, 205–220 (2007).
16. McCarthy, K. L. & McCarthy, M. J. Oil migration in chocolate-peanut butter paste confectionery as a function of chocolate formulation. J. Food Sci. 73, 266–273 (2008).
17. Altan, A., Lavenson, D. M., Mccarthy, M. J. & Mccarthy, K. L. Oil migration in chocolate and almond product confectionery systems. J. Food Sci. 76, 0–3 (2011).
18. Maleky, F. & Marangoni, A. Nanoscale effects on oil migration through triacylglycerol polycrystalline colloidal networks. Soft Matter 7, 6012 (2011).
19. Rumsey, T. R. & McCarthy, K. L. Modeling oil migration in two-layer chocolate-almond confectionery

60
products. J. Food Eng. 111, 149–155 (2012).
20. Maleky, F., Mccarthy, K. L., Mccarthy, M. J. & Marangoni, A. G. Effect of Cocoa Butter Structure on Oil Migration. J. Food Sci. 77, 74–79 (2012).
21. Aguilera, J. M., Michel, M. & Mayor, G. Fat migration in chocolate: diffusion or capillary flow in a particulate solid? A hypothesis paper. J. Food Sci. 69, 167–174 (2004).
22. Van Der Weeën, P., De Clercq, N., Dewettinck, K. & De Baets, B. A CA-based model describing fat bloom in chocolate. in International Conference on Cellular Automata - Lecture notes in Computer Science 7495, 504–513 (2012).
23. Motwani, T., Hanselmann, W. & Anantheswaran, R. C. Diffusion, counter-diffusion and lipid phase changes occurring during oil migration in model confectionery systems. J. Food Eng. 104, 186–195 (2011).
24. Altimiras, P., Pyle, L. & Bouchon, P. Structure-fat migration relationships during storage of cocoa butter model bars: Bloom development and possible mechanisms. J. Food Eng. 80, 600–610 (2007).
25. Dahlenborg, H., Millqvist-Fureby, A. & Bergenstahl, B. Effect of particle size in chocolate shell on oil migration and fat bloom development. J. Food Eng. 146, 172–181 (2015).
26. Ziegleder, G. & Schwingshandl, I. Kinetik der Fettmigration in Schokoladenprodukten . Teil III : Fettreif. Eur. J. Lipid Sci. Technol. 100, 411–415 (1998).
27. Sonwai, S. & Rousseau, D. Structure evolution and bloom formation in tempered cocoa butter during long-term storage. Eur. J. Lipid Sci. Technol. 108, 735–745 (2006).
28. De Clercq, N. et al. Influence of cocoa butter diacylglycerols on migration induced fat bloom in filled chocolates. Eur. J. Lipid Sci. Technol. 116, 1388–1399 (2014).
29. Wang, H. Oil diffusion in different cocoa butters using magnetic resonance imaging. (The Ohio State University, 2016).
30. Smith, K. W., Zand, I. & Talbot, G. Effect of antibloom fat migration from a nut oil filling on the polymorphic transformation of cocoa butter. J. Agric. Food Chem. 56, 1602–1605 (2008).
31. Koyano, T., Hachiya, I. & Sato, K. Fat polymorphism and crystal seeding effects on fat bloom stability of dark chocolate. Food Struct. 9, 231–240 (1990).
32. Kinta, Y. & Hartel, R. W. Bloom formation on poorly-tempered chocolate and effects of seed addition. JAOCS, J. Am. Oil Chem. Soc. 87, 19–27 (2010).
33. Ali, A., Selamat, J., Che Man, Y. B. & Suria, A. M. Effect of storage temperature on texture, polymorphic structure, bloom formation and sensory attributes of filled dark chocolate. Food Chem. 72, 491–497 (2001).
34. Ziegleder, G. Fat Migration. (Fraunhofer Institute for Processing and Packaging, 2004).
35. Machalkova, L., Hrivna, L., Nedomova, S. & Juzl, M. The effect of storage temperature and production method of chocolate confectionery on changes in its quality. in MendelNet 2014 417–422 (2014).
36. Machálková, L., Hrivna, L., Nedomová, S. & Juzl, M. The effect of storage temperature on the quality and formation of blooming defects in chocolate confectionery. Potravinarstvo 9, 39–47 (2015).
37. Kleinert, J. Studies on the formation of fat bloom and methods of delaying. Proc. 15th PMCA Conf. (1961).

61
38. Minifie, B. W. Bloom, microbiological and other spoilage problems. in Chocolate, Cocoa and Confectionery: Science and Technology 494–518 (Aspen Publishers, Inc., 1999).
39. Delbaere, C., Depypere, F., Clercq, N. De & Pelsmaeker, S. De. Retarding oil migration and fat bloom development in filled chocolate products by low- and high-temperature treatments. Eur. Fed. Sci. Technol. (2016).
40. Ransom-Painter, K. L., Williams, S. D. & Hartel, R. W. Incorporation of milk fat and milk fat fractions into compound coatings made from palm kernel oil. J Dairy Sci 80, 2237–2248 (1997).
41. Walter, P. & Cornillon, P. Influence of thermal conditions and presence of additives on fat bloom in chocolate. J. Am. Oil Chem. Soc. 78, (2001).
42. Marty, S., Baker, K. W. & Marangoni, A. G. Optimization of a scanner imaging technique to accurately study oil migration kinetics. Food Res. Int. 42, 368–373 (2009).
43. Cerdeira, M., Martini, S., Hartel, R. W. & Herrera, M. L. Effect of sucrose ester addition on nucleation and growth behavior of milk fat − sunflower oil blends. J. Agric. Food Chem. 51, 6550–6557 (2003).
44. Aronhime, J. S., Sarig, S. & Garti, N. Dynamic control of polymorphic transformation in triglycerides by surfactants: The button syndrome. J. Am. Oil Chem. Soc. 65, 1144–1150 (1988).
45. Oh, J.-H. & Swanson, B. G. Polymorphic transitions of cocoa butter affected by high hydrostatic pressure and sucrose polyesters. J. Am. Oil Chem. Soc. 83, 1007–1014 (2006).
46. Martini, S. & Herrera, M. L. Physical properties of shortenings with low-trans fatty acids as affected by emulsifiers and storage conditions. Eur. J. Lipid Sci. Technol. 110, 172–182 (2008).
47. Chemical Book. Lecithin. (2017). Available at: http://www.chemicalbook.com/ChemicalProductProperty_EN_CB1242041.htm. (Accessed: 3rd September 2017)
48. Afoakwa, E. O., Paterson, A., Fowler, M. & Vieira, J. Characterization of melting properties in dark chocolates from varying particle size distribution and composition using differential scanning calorimetry. Food Res. Int. 41, 751–757 (2008).
49. Hasenhuettl, G. L. & Hartel, R. W. Food Emulsifiers and Their Applications. (Springer Science+Business Media, LLC, 2008).
50. PubChem. Polyglycerol Polyricinoleate. Available at: https://pubchem.ncbi.nlm.nih.gov/compound/92041135#section=Top. (Accessed: 3rd September 2017)
51. Rousseau, D., Hodge, S. M., Nickerson, M. T. & Paulson, A. T. Regulating the β′→β polymorphic transition in food fats. J. Am. Oil Chem. Soc. 82, 7–12 (2005).
52. Luís, V. et al. Influence of soy lecithin and PGPR levels in chocolate crystallization behavior. in 11th International Congress on Engineering and Food (2011).
53. Tietz, R. A. & Hartel, R. W. Effects of minor lipids on crystallization of milk fat-cocoa butter blends and bloom formation in chocolate. J. Am. Oil Chem. Soc. 77, 763–771 (2000).
54. PubChem. Sorbitan Monostereate. Available at: https://pubchem.ncbi.nlm.nih.gov/compound/14928#section=2D-Structure. (Accessed: 11th September 2017)
55. PubChem. Sorbitan Triesterate. Available at: https://pubchem.ncbi.nlm.nih.gov/compound/520280#section=2D-Structure. (Accessed: 11th September 2017)

62
56. Garti, N., Schlichter, J. & Sarig, S. Effect of food emulsifiers on polymorphic transitions of cocoa butter. JAOCS, J. Am. Oil Chem. Soc. 63, 230–236 (1986).
57. Berger, K. World Conference on Oleochemirals into the 21st century. AOCS pp 288–91 (1990).
58. Food and Drug Administration. The generally recognized as safe (GRAS) status of Sucrose Monoesters of Lauric Acid, Palmitic acid and Stearic Acid as emulsifying agents for flavor sused in fruit flavored beverages. (2008).
59. Lohman, M. H. & Hartel, R. W. Effect of milk fat fractions on fat bloom in dark chocolate. J. Am. Oil Chem. Soc. 71, 267–276 (1994).
60. Bricknell, J. & Hartel, R. W. Relation of fat bloom in chocolate to polymorphic transition of cocoa butter. J. Am. Oil Chem. Soc. 75, 1609–1615 (1998).
61. Pajin, B. & Jovanovic, O. Influence of high-melting milk fat fraction on quality and fat bloom stability of chocolate. Eur. Food Res. Technol. 220, 389–394 (2005).
62. Sonwai, S. & Rousseau, D. Fat crystal growth and microstructural evolution in industrial milk chocolate. Cryst. Growth Des. 8, 3165–3174 (2008).
63. Sonwai, S. & Rousseau, D. Controlling fat bloom formation in chocolate - Impact of milk fat on microstructure and fat phase crystallisation. Food Chem. 119, 286–297 (2010).
64. Gerardus, F. J. & Fischer, S. Chocolate with milk fat fractions. (2013). Patent WO2013151423 (A1).
65. Talbot, G. Formulation and Production of Confectionery Fats. in OFI Middle East 2007 Conference and Exhibition (2007).
66. Hachiya, I., Koyano, T. & Sato, K. Seeding effects on crystallization behavior of cocoa butter. Agric. Biol. Chem. 53, 327–332 (1989).
67. Verstringe, S., De Clercq, N., Nguyen, T. M., Kadivar, S. & Dewettinck, K. Enzymatic and other modification techniques to produce cocoa butter alternatives. in Cocoa Butter and related compounds 443–474 (American Oil Chemists’ Society, 2012).
68. Jahurul, M. H. A. et al. Cocoa butter fats and possibilities of substitution in food products concerning cocoa varieties, alternative sources, extraction methods, composition, and characteristics. J. Food Eng. 117, 467–476 (2013).
69. Padley, F. B., Paulussen, C. N., Soeters, C. J. & Tresser, D. The improvement of chocolate using the mono-unsaturated triglycerides SOS and POS. Rev. Int. la Choc. 27, (1972).
70. Tonnesmann, B. O. M. Tonnesmann, B.O.M., 1977. The Manufacturing Confectioner 57 (5), 35. Manuf. Confect. 57, 35 (1977).
71. Jewell, G. & Bradford, L. Considerations in chocolate formulation. Manuf. Confect. 61, 26–30 (1981).
72. Reddy, S. Y. & Prabhakar, J. V. Cocoa butter extenders from Kokum (Garcinia indica) and Phulwara (Madhuca butyracea) butter. JAOCS, J. Am. Oil Chem. Soc. 7, 217–219 (1994).
73. Jeyarani, T. & Reddy, Y. Heat-resistant cocoa butter extenders from Mahua (Madhuca latifolia) and Kokum (Garcinia indica) fats. JAOCS, J. Am. Oil Chem. Soc. 76, 1431–1436 (1999).
74. Maheshwari, B. & Yella Reddy, S. Application of kokum (Garcinia indica) fat as cocoa butter improver in chocolate. J. Sci. Food Agric. 85, 135–140 (2005).
75. Europe, F. O. Ertifil AB range. (2016). Available at: http://www.fujioileurope.com/Portals/0/Eloket/16/FUJI-LEAFLET edited Ertifil AB.pdf. (Accessed:

63
29th March 2017)
76. Iwaniuk, M., Clercq, N. De & Dewettinck, K. Migration fat bloom in filled chocolate products as influenced by anti-bloom fats. (Ghent University, 2013).
77. AAK Denmark. Filling Fats for Confectionery CHOCOFILL TM – Premium functionality for your fillings. (2017). Available at: http://aak.com/Global/CCF/CCF_broch_GB.pdf. (Accessed: 29th March 2017)
78. Momura, M., Nakano, A. & Nakamura, M. Fat blooming inhibitor. (1988). Patent US4726959 (A).
79. Cain, F. W., Hargreaves, N. G. & Hughes, A. D. Bloom-inhibiting fat blends. (1995). Patent US5431948 (A).
80. Cain, F. W., Hughes, A. D. & Pierce, J. H. Anti-bloom triglyceride compositions. (1996). Patent US5576045 (A).
81. Hokuyo, K., Hayashi, M., Yamaguchi, S. & Izumi, T. Anti-blooming composition, and laurin fat and chocolate containing the same. (1997). Patent US5609906 (A).
82. Juul, B. & Anderson, M. D. Bloom retarding fat. (2015). Patent US9113644 (B2).
83. Cheng, P.-S. & Destephen, S. J. Reduction of Chocolate Bloom. (1999). Patent US5925399 (A).
84. Patel, A. R. et al. Edible applications of shellac oleogels: spreads, chocolate paste and cakes. Food Funct. 5, 645–652 (2014).
85. Toro-Vazquez, J. F. et al. Thermal and textural properties of organogels developed by candelilla wax in safflower oil. JAOCS, J. Am. Oil Chem. Soc. 84, 989–1000 (2007).
86. Dassanayake, L. S. K., Kodali, D. R., Ueno, S. & Sato, K. Physical properties of rice bran wax in bulk and organogels. JAOCS, J. Am. Oil Chem. Soc. 86, 1163–1173 (2009).
87. Hwang, H. S., Kim, S., Singh, M., Winkler-Moser, J. K. & Liu, S. X. Organogel formation of soybean oil with waxes. JAOCS, J. Am. Oil Chem. Soc. 89, 639–647 (2012).
88. Zulim Botega, D. C., Marangoni, A. G., Smith, A. K. & Goff, H. D. The potential application of rice bran wax oleogel to replace solid fat and enhance unsaturated fat content in ice cream. J. Food Sci. 78, 1334–1339 (2013).
89. Patel, A. R., Schatteman, D., Vos, W. H. De & Dewettinck, K. Shellac as a natural material to structure a liquid oil-based thermo reversible soft matter system. RSC Adv. 3, 5324 (2013).
90. Öğütcü, M. & Yılmaz, E. Characterization of hazelnut oil oleogels prepared with sunflower and carnauba waxes. Int. J. Food Prop. 18, 1741–1755 (2014).
91. Patel, A. R. & Dewettinck, K. Comparative evaluation of structured oil systems: Shellac oleogel, HPMC oleogel, and HIPE gel. Eur. J. Lipid Sci. Technol. 117, 1772–1781 (2015).
92. Jana, S. Crystallization Behavior of Waxes. All Graduate Theses and Dissertations Paper 5088, (2016).
93. Patel, A. R. & Dewettinck, K. Edible oil structuring: an overview and recent updates. Food Funct. 7, 20–29 (2016).
94. Doan, C. D. et al. The feasibility of wax-based oleogel as a potential co-structurant with palm oil in low-saturated fat confectionery fillings. Eur. J. Lipid Sci. Technol. 118, 1903–1914 (2016).
95. Doan, D. C. Structure-function relationships of wax-based oleogels prepared in rice bran oil. (Ghent University, 2017).

64
96. Öʇütcü, M., Arifoʇlu, N. & Yilmaz, E. Preparation and characterization of virgin olive oil-beeswax oleogel emulsion products. JAOCS, J. Am. Oil Chem. Soc. 92, 459–471 (2015).
97. Marangoni, A. G. Chocolate compositions containing ethylcellulose oleogel and methods for preparing. (2010). Patent EP2440067 (B1).
98. Centre for Industrial Rheology. The A-Z of rheology & viscosity - from angles to zero shear viscosity. (2013). Available at: http://www.rheologyschool.com/advice/rheology-glossary#. (Accessed: 10th September 2017)
99. Ayorinde, F. O., Eribo, B. E., Balan, K. V., Johnson, J. H. & Wan, L. W. Determination of major triacylglycerol components of polyunsaturated specialty oils using matrix-assisted laser desorption/ ionization time-of-flight mass spectrometry. Rapid Commun. Mass Spectrom. 13, 937–942 (1999).
100. Salas, J. J., Bootello, M. A., Martínez-Force, E. & Garcés, R. Tropical vegetable fats and butters: Properties and new alternatives. OCL - Ol. Corps Gras Lipides 16, 254–258 (2009).
101. Xu, Y. X., Hanna, M. A. & Josiah, S. J. Hybrid hazelnut oil characteristics and its potential oleochemical application. Ind. Crops Prod. 26, 69–76 (2007).
102. Edmundo Gomes de Azevedo. Termodinâmica Aplicada. (Escolar Editora, 2011).
103. Pernetti, M., van Malssen, K. F., Flöter, E. & Bot, A. Structuring of edible oils by alternatives to crystalline fat. Curr. Opin. Colloid Interface Sci. 12, 221–231 (2007).
104. Torbica, A., Jovanovic, O. & Pajin, B. The advantages of solid fat content determination in cocoa butter and cocoa butter equivalents by the Karlshamns method. Eur. Food Res. Technol. 222, 385–391 (2006).
105. Beckett.T.Stephen. The Science of Chocolate. The Royal Society of Chemistry (2008).
106. Seguine, E. S. Casson plastic viscosity and yield value. Manuf. Confect. November, 57–63 (1988).
107. Bodart, M., de Peñaranda, R., Deneyer, A. & Flamant, G. Photometry and colorimetry characterisation of materials in daylighting evaluation tools. Build. Environ. 43, 2046–2058 (2008).
108. Verbeek, K. Phase behavior, crystallization and oil migration in cocoa butter and hazelnut oil containing systems. Ghent University (2010).

65
Annex A
A.1. Considerations regarding calculations of fat content and waxes
percentages
It was assumed that the dark chocolate had a percentage of cocoa butter of 33%. The hazelnut paste had
a fat content (hazelnut oil content) of 62% and therefore the mixture of the base filling of hazelnut paste
and hazelnut oil had a combined fat content of 69%. The fat content of the hazelnut based filling for the
80/20 (HF/DC) was 34.06%.
The values of solid fat content for the blends with 60/40, 70/30 and 80/20 (HF/DC) were 20%, 13% and
7%108, respectively.

66
Annex B
B.1. Significant differences in the rheological parameters of the lipid
blends
Table B.1. Significant differences signaled with a * between the parameter tan (δ) of all the lipid blends samples, after
1h at 20°C
Control Wax 1 a%
Wax 1 b%
Wax 1 c%
Wax 1 d%
Wax 1 e%
Wax 1 g%
Wax 2 b%
Wax 2 c%
Wax 2 d%
Wax 2 e%
Wax 2 f%
Wax 2 g%
Control * * * * * * * * * * *
Wax 1 a% * * * * *
Wax 1 b% * * * * * *
Wax 1 c% * * * * *
Wax 1 d% * *
Wax 1 e% *
Wax 1 g%
Wax 2 b% * * * * * * * *
Wax 2 c% * * * * *
Wax 2 d% * * * *
Wax 2 e% * * * * *
Wax 2 f% *
Wax 2 h% *
Table B.2. Significant differences signaled with a * between the |G*| of all the lipid blends samples, after cooling down
to 5°C.
Control Wax 1 a%
Wax 1 b%
Wax 1 c%
Wax 1 d%
Wax 1 e%
Wax g%
Wax 2 b%
Wax 2 c%
Wax 2 d%
Wax 2 e%
Wax 2 f%
Wax 2 h%
Control * * * * * * * * * * * *
Wax 1 a% * * * * * * * * *
Wax 1 b% * * * * * * * *
Wax 1 c% * * * * * * *
Wax 1 d% * * * * * * * *
Wax 1 e% * * * * * * * * *
Wax 1 g% * * * * * * * * * *
Wax 2 b% * * * * * * * * * * *
Wax 2 c% * * * * * * * *
Wax 2 d% * * * * * * * * *
Wax 2 e% * * * * * * * * *
Wax 2 f% * * * * * * * * *
Wax 2 h% * * *

67
B.2. Significant differences in the crystallization behavior parameters
of the lipid blends
Table B.3. Significant differences signaled with a * between the crystallization enthalpy of the lipid blends to 5°C.
Control Wax 1 a%
Wax 1 b%
Wax 1 c%
Wax 1 d%
Wax 1 e%
Wax 1 g%
Wax 2 b%
Wax 2 c%
Wax 2 d%
Wax 2 e%
Wax 2 f%
Wax 2 h%
Control
Wax 1 a% * * * * * * * *
Wax 1 b% * * *
Wax 1 c% * * * *
Wax 1 d% * * *
Wax 1 e% * * * * * *
Wax 1 g% * * * * * * * * *
Wax 2 b% * * *
Wax 2 c% * *
Wax 2 d% * * * * *
Wax 2 e% * * * * *
Wax 2 f% * * * * * *
Wax 2 h% * * * * * * * *
In this case, the control was not considered to calculate the significant difference of all the samples since
it did not show any crystallization step.

68
Annex C
C.1. Color measurements of the filled chocolates for week 4 for
analysis
Table C.1 Color measurements parameters for the filled chocolates after week 4. There were no significant
differences between the same parameters in different concentrations.
L* a* b* dE*
Control 27.57 ± 0.63 5.84 ± 0.11 4.63 ± 0.11 0
Wax 1 c% 27.44 ± 0.42 5.73 ± 0.04 4.55 ± 0.08 0.19
Wax 1 e% 27.60 ± 0.66 5.56 ± 0.21 4.47 ± 0.18 0.32
Wax 2 d% 27.42 ± 0.92 5.60 ± 0.24 4.43 ± 0.23 0.34
Wax 2 f% 27.44 ± 0.19 5.76 ± 0.12 4.52 ± 0.21 0.19
Related Documents