RESEARCH ARTICLE Open Access Old divergences in a boreal bird supports long-term survival through the Ice Ages Takema Saitoh 1,7* , Per Alström 2,3 , Isao Nishiumi 4 , Yoshimitsu Shigeta 5 , Dawn Williams 3 , Urban Olsson 6 , Keisuke Ueda 1 Abstract Background: Unlike northern Europe and most of northern North America, the Eastern Palearctic and the northwesternmost tip of North America are believed to have been almost unglaciated during the Quarternary glacial periods. This could have facilitated long-term survival of many organisms in that area. To evaluate this, we studied the phylogeography in east Asia and Alaska of a boreal migratory passerine bird, the Arctic Warbler Phylloscopus borealis, and compared our results with published data on especially North American species. Results: In a sample of 113 individuals from 18 populations we identified 42 haplotypes of the mitochondrial cytochrome b gene, which separated into three clades: A - Alaska and mainland Eurasia (except Kamchatka); B - Kamchatka, Sakhalin and Hokkaido; and C - Honshu, Shikoku and Kyushu (i.e. Japan except Hokkaido). The oldest split among these clades, between A/B and C, is estimated to have taken place sometime between the mid Pliocene and early Pleistocene, and the second divergence, between clades A and B, in the early to mid Pleistocene. Within all of the three main clades, there are signs of population expansion. Conclusions: The Arctic Warbler separated into three main clades in close succession around the Pliocene/ Pleistocene border, with the two northern clades diverging last. All three clades probably experienced population bottlenecks during the Pleistocene as a result of range shifts and contractions, but nevertheless survived and maintained their integrities. Several other clades of Northeastern Palearctic birds are noted to have diversified during the Pliocene. In contrast, avian species or phylogroups presently occupying formerly glaciated North American ground are generally younger. The differences between these regions could be due to slower speciation rates in the Eastern Palearctic due to less fragmentation of forest habitats during glacial periods, or to longer survival of Eastern Palearctic clades as a result of less severe conditions in that region compared to northern North America. Several other Palearctic organisms show concordant biogeographical patterns to that of the Arctic Warbler, indicating common causes of their diversifications. Background In recent years, substantial knowledge accumulated on the genetic consequences of the climatic oscillations in the Quaternary for European and North American spe- cies [e.g. [1-4]]. Since the ice sheets repeatedly spread considerably southward on both continents during gla- cial periods (to 52°N in Europe and 40°N in North America at the last glacial maximum, 23-18 kya; [3]), boreal and temperate biota were repeatedly pushed southward into isolated refugia and subsequently recolo- nized northward again. As a result, shallow genetic divergence [5-8] and low genetic diversity [1,9,10] are typical of various taxa in northern regions. In contrast, relatively deep DNA divergences [7,11] and higher genetic diversity [1] occur in many taxa inhabiting tem- perate refugial areas in Europe and North America, sug- gesting survival of these populations over several glacial periods. Since the Eastern Palearctic and northwestern- most tip of North America are considered to have remained largely ice-free throughout the Quaternary [12-14] (but see [15] for a different opinion), deep DNA divergences and high genetic diversity would also be expected in that region. However, even in the absence of ice sheets, the habitats in that region are believed to have been much affected by the climatic oscillations, * Correspondence: [email protected] 1 Department of Life Science, Rikkyo University, 3-34-1 Nishi-ikebukuro, Toshima-ku, Tokyo 171-8501, Japan Saitoh et al. BMC Evolutionary Biology 2010, 10:35 http://www.biomedcentral.com/1471-2148/10/35 © 2010 Saitoh et al; licensee BioMed Central Ltd. This is an Open Access article distributed under the terms of the Creative Commons Attribution License (http://creativecommons.org/licenses/by/2.0), which permits unrestricted use, distribution, and reproduction in any medium, provided the original work is properly cited.

Welcome message from author
This document is posted to help you gain knowledge. Please leave a comment to let me know what you think about it! Share it to your friends and learn new things together.
Transcript

RESEARCH ARTICLE Open Access
Old divergences in a boreal bird supportslong-term survival through the Ice AgesTakema Saitoh1,7*, Per Alström2,3, Isao Nishiumi4, Yoshimitsu Shigeta5, Dawn Williams3, Urban Olsson6,Keisuke Ueda1
Abstract
Background: Unlike northern Europe and most of northern North America, the Eastern Palearctic and thenorthwesternmost tip of North America are believed to have been almost unglaciated during the Quarternaryglacial periods. This could have facilitated long-term survival of many organisms in that area. To evaluate this, westudied the phylogeography in east Asia and Alaska of a boreal migratory passerine bird, the Arctic WarblerPhylloscopus borealis, and compared our results with published data on especially North American species.
Results: In a sample of 113 individuals from 18 populations we identified 42 haplotypes of the mitochondrialcytochrome b gene, which separated into three clades: A - Alaska and mainland Eurasia (except Kamchatka); B -Kamchatka, Sakhalin and Hokkaido; and C - Honshu, Shikoku and Kyushu (i.e. Japan except Hokkaido). The oldestsplit among these clades, between A/B and C, is estimated to have taken place sometime between the midPliocene and early Pleistocene, and the second divergence, between clades A and B, in the early to midPleistocene. Within all of the three main clades, there are signs of population expansion.
Conclusions: The Arctic Warbler separated into three main clades in close succession around the Pliocene/Pleistocene border, with the two northern clades diverging last. All three clades probably experienced populationbottlenecks during the Pleistocene as a result of range shifts and contractions, but nevertheless survived andmaintained their integrities. Several other clades of Northeastern Palearctic birds are noted to have diversifiedduring the Pliocene. In contrast, avian species or phylogroups presently occupying formerly glaciated NorthAmerican ground are generally younger. The differences between these regions could be due to slower speciationrates in the Eastern Palearctic due to less fragmentation of forest habitats during glacial periods, or to longersurvival of Eastern Palearctic clades as a result of less severe conditions in that region compared to northern NorthAmerica. Several other Palearctic organisms show concordant biogeographical patterns to that of the ArcticWarbler, indicating common causes of their diversifications.
BackgroundIn recent years, substantial knowledge accumulated onthe genetic consequences of the climatic oscillations inthe Quaternary for European and North American spe-cies [e.g. [1-4]]. Since the ice sheets repeatedly spreadconsiderably southward on both continents during gla-cial periods (to 52°N in Europe and 40°N in NorthAmerica at the last glacial maximum, 23-18 kya; [3]),boreal and temperate biota were repeatedly pushedsouthward into isolated refugia and subsequently recolo-nized northward again. As a result, shallow genetic
divergence [5-8] and low genetic diversity [1,9,10] aretypical of various taxa in northern regions. In contrast,relatively deep DNA divergences [7,11] and highergenetic diversity [1] occur in many taxa inhabiting tem-perate refugial areas in Europe and North America, sug-gesting survival of these populations over several glacialperiods. Since the Eastern Palearctic and northwestern-most tip of North America are considered to haveremained largely ice-free throughout the Quaternary[12-14] (but see [15] for a different opinion), deep DNAdivergences and high genetic diversity would also beexpected in that region. However, even in the absenceof ice sheets, the habitats in that region are believed tohave been much affected by the climatic oscillations,
* Correspondence: [email protected] of Life Science, Rikkyo University, 3-34-1 Nishi-ikebukuro,Toshima-ku, Tokyo 171-8501, Japan
Saitoh et al. BMC Evolutionary Biology 2010, 10:35http://www.biomedcentral.com/1471-2148/10/35
© 2010 Saitoh et al; licensee BioMed Central Ltd. This is an Open Access article distributed under the terms of the Creative CommonsAttribution License (http://creativecommons.org/licenses/by/2.0), which permits unrestricted use, distribution, and reproduction inany medium, provided the original work is properly cited.

and this is likely to have affected the distributions andconsequently also the population dynamics of manyanimals.Several studies have dealt with the phylogeography of
widespread northern Palearctic animals, including mam-mals such as badger Meles meles [16], hares Lepus spp.[17], and various rodents [18-23], as well as birdsincluding ducks [24], shorebirds[25,26], woodpeckers[27,28], and several species of passerines [26,29-41].Most of these studies have reported little or no diver-gence over large areas of the northern Palearctic,although some divergent clades, mostly dated to thePleistocene, have been found in some species. For exam-ple, a southeastern Palearctic clade has been noted inseveral birds and mammals and also in an amphibianand two ants, suggesting common causes of their diver-gences (reviewed in [22]). Hewitt et al [3] concludedthat some Arctic species have shallow genetic cladeswith coinciding geographical boundaries. Some phylo-geographical studies of birds have dealt with groups ofclosely related species with extensive north-south distri-butions from the taiga to temperate forests in centralChina and the Himalayas, and some of these have foundrelatively deep divergences between boreal and moresouthern taxa, which date back to the Pliocene or earlyPleistocene [42-44].The Arctic Warbler Phylloscopus borealis is a small
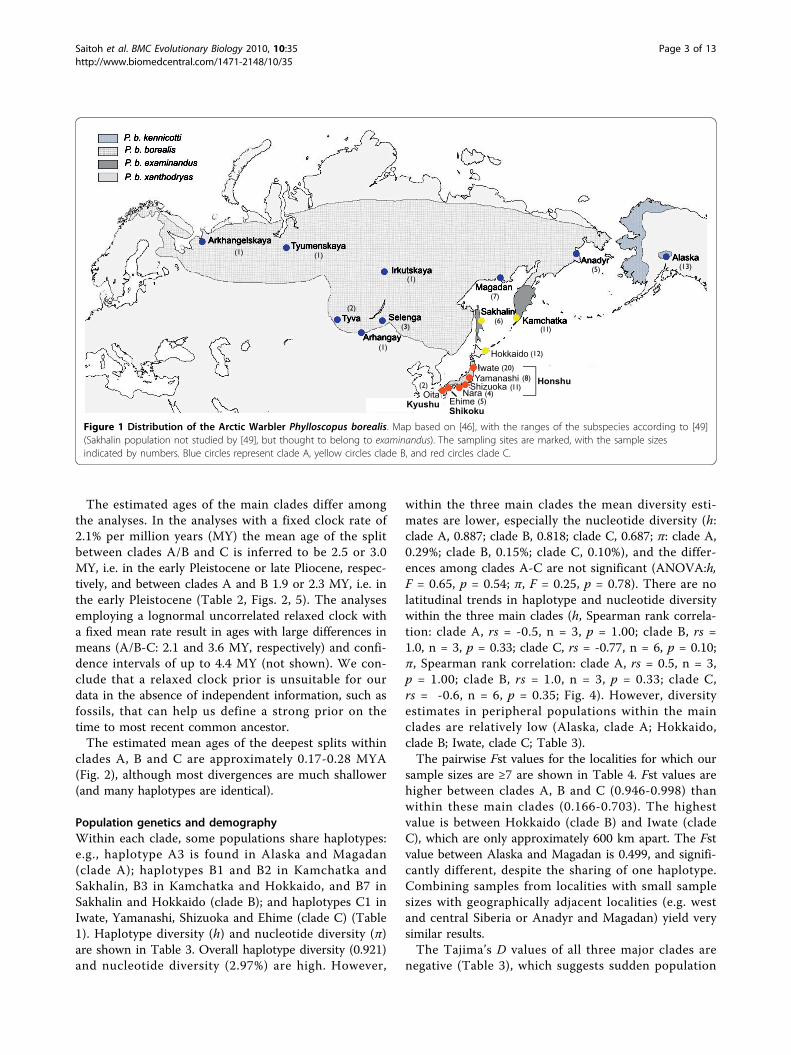
insectivorous passerine, which breeds in the boreal for-ests from northern Scandinavia through Siberia toAlaska, south to northern Mongolia, Russian Far East,northeasternmost China and Japan [45,46] (Fig. 1). Allpopulations winter in Southeast Asia, Indonesia and thePhilippines [45,46]. This is the only species in the largegenus Phylloscopus that breeds in North America [45].Three to six morphologically subtly different subspeciesare generally recognised, with much disagreementamong authors [45-51] (Fig. 1). In the breeding season,it inhabits both coniferous, mixed and broad-leaved for-est, and also bushes (e.g. Salix) on the tundra and abovethe tree limit; in Japan it breeds in mountains up to2500 m [45-47,52]. A recent paper [53] analysed mito-chondrial ND2 sequence variation across a large part ofthe species’ continental range (but not including Japan),and found little divergence, except between Kamchatka/Sakhalin and the rest of the range, concordant withresults from several other studies on other species asnoted above [22]. The same study [53] also found thehaplotypes from northeast Siberia and Alaska to form aclade separated from the haplotypes from south Siberiato northeast Europe. Moreover, the nucleotide diversitywas highest in south Siberia/northeast Europe and low-est in Alaska, with northeast Siberia having intermediatevalues. It was concluded that the direction of postglacialcolonization was likely from south Siberia towards the
northwest and northeast, with Alaska being colonized ina stepping-stone pattern.In this paper, we conduct a more extensive analysis of
variation in mitochondrial DNA (1-3.2 kbp) from 18populations of the Arctic Warbler from across the spe-cies’ range, including denser sampling from the pre-viously poorly sampled Kamchatka and Sakhalin and theformerly unsampled Japan, in order to examine: (1) thephylogeographic structure compared with other borealspecies, with the specific hypothesis that the EasternPalearctic/Northwesternmost Nearctic populationsmight show deep divergences as a result of long-timesurvival in a region which has been less affected by iceduring the Pleistocene than other parts of the Holarctic;(2) whether the genetic diversity is high throughout thispart of the range, as in many species inhabiting ungla-ciated temperate refugial regions in Europe and NorthAmerica; and (3) whether latitudinal trends in geneticdiversity and signs of population expansions are lacking,unlike in European and North American species inhabit-ing formerly glaciated areas.
ResultsPhylogeny and divergence timesForty-two cytochrome b haplotypes were identifiedamong the 113 individuals from 18 populations (Table1, Additional file 1) based on 99 polymorphic sites (91transitions, 8 transversions). According to the AMOVA,3.2% of the variance is attributable to within-populationvariation and 96.8% to among-population variation.In the cytochrome b tree comprising all samples (Fig. 2)the Arctic Warbler is divided into three main, stronglysupported clades (A, B and C). These represent separategeographical locations: clade A - Alaska and mainlandEurasia (except Kamchatka); clade B - Kamchatka,Sakhalin and Hokkaido; and clade C - Honshu, Shikokuand Kyushu (cf. Fig. 1). In the BEAST and bootstrapanalyses, clades A and B are inferred to be sisters,although with low support (Fig. 2), whereas in theMrBayes analysis (not shown) clades A and C areinferred to be sisters, although with effectively no sup-port (0.55). Within clades A, B and C there is no corre-lation between the inferred relationships of thesequences and their geographical locations, except thatthe sequences from northeast Siberia and Alaska form awell supported clade both in the BEAST (Fig. 2) andMrBayes analyses (0.93; not shown) (but with insignifi-cant support in the bootstrap analyses).In the tree estimated from the concatenated ND5-
cytochrome b-control region-ND6-12S-tRNA sequences(Fig. 3) the samples representing clades A and B arerecovered as sisters, with 100% parsimony and maxi-mum likelihood bootstrap support and somewhat lowerposterior probability.
Saitoh et al. BMC Evolutionary Biology 2010, 10:35http://www.biomedcentral.com/1471-2148/10/35
Page 2 of 13
The estimated ages of the main clades differ amongthe analyses. In the analyses with a fixed clock rate of2.1% per million years (MY) the mean age of the splitbetween clades A/B and C is inferred to be 2.5 or 3.0MY, i.e. in the early Pleistocene or late Pliocene, respec-tively, and between clades A and B 1.9 or 2.3 MY, i.e. inthe early Pleistocene (Table 2, Figs. 2, 5). The analysesemploying a lognormal uncorrelated relaxed clock witha fixed mean rate result in ages with large differences inmeans (A/B-C: 2.1 and 3.6 MY, respectively) and confi-dence intervals of up to 4.4 MY (not shown). We con-clude that a relaxed clock prior is unsuitable for ourdata in the absence of independent information, such asfossils, that can help us define a strong prior on thetime to most recent common ancestor.The estimated mean ages of the deepest splits within
clades A, B and C are approximately 0.17-0.28 MYA(Fig. 2), although most divergences are much shallower(and many haplotypes are identical).
Population genetics and demographyWithin each clade, some populations share haplotypes:e.g., haplotype A3 is found in Alaska and Magadan(clade A); haplotypes B1 and B2 in Kamchatka andSakhalin, B3 in Kamchatka and Hokkaido, and B7 inSakhalin and Hokkaido (clade B); and haplotypes C1 inIwate, Yamanashi, Shizuoka and Ehime (clade C) (Table1). Haplotype diversity (h) and nucleotide diversity (π)are shown in Table 3. Overall haplotype diversity (0.921)and nucleotide diversity (2.97%) are high. However,
within the three main clades the mean diversity esti-mates are lower, especially the nucleotide diversity (h:clade A, 0.887; clade B, 0.818; clade C, 0.687; π: clade A,0.29%; clade B, 0.15%; clade C, 0.10%), and the differ-ences among clades A-C are not significant (ANOVA:h,F = 0.65, p = 0.54; π, F = 0.25, p = 0.78). There are nolatitudinal trends in haplotype and nucleotide diversitywithin the three main clades (h, Spearman rank correla-tion: clade A, rs = -0.5, n = 3, p = 1.00; clade B, rs =1.0, n = 3, p = 0.33; clade C, rs = -0.77, n = 6, p = 0.10;π, Spearman rank correlation: clade A, rs = 0.5, n = 3,p = 1.00; clade B, rs = 1.0, n = 3, p = 0.33; clade C,rs = -0.6, n = 6, p = 0.35; Fig. 4). However, diversityestimates in peripheral populations within the mainclades are relatively low (Alaska, clade A; Hokkaido,clade B; Iwate, clade C; Table 3).The pairwise Fst values for the localities for which our
sample sizes are ≥7 are shown in Table 4. Fst values arehigher between clades A, B and C (0.946-0.998) thanwithin these main clades (0.166-0.703). The highestvalue is between Hokkaido (clade B) and Iwate (cladeC), which are only approximately 600 km apart. The Fstvalue between Alaska and Magadan is 0.499, and signifi-cantly different, despite the sharing of one haplotype.Combining samples from localities with small samplesizes with geographically adjacent localities (e.g. westand central Siberia or Anadyr and Magadan) yield verysimilar results.The Tajima’s D values of all three major clades are
negative (Table 3), which suggests sudden population
Figure 1 Distribution of the Arctic Warbler Phylloscopus borealis. Map based on [46], with the ranges of the subspecies according to [49](Sakhalin population not studied by [49], but thought to belong to examinandus). The sampling sites are marked, with the sample sizesindicated by numbers. Blue circles represent clade A, yellow circles clade B, and red circles clade C.
Saitoh et al. BMC Evolutionary Biology 2010, 10:35http://www.biomedcentral.com/1471-2148/10/35
Page 3 of 13

Table 1 Frequency of cytochrome b haplotypes in all Arctic Warblers sampled
Population
Haplotype ALA ANA MAG CSH WSH KAM SAK HOK IWA YAM SHI NAR EHI OIT N
A1 7 7
A2 5 5
A3 1 1 2
A4 1 1
A5 2 2
A6 1 1
A7 1 1
A8 1 1
A9 2 2
A10 1 1
A11 1 1
A12 1 1
A13 1 1
A14 1 1
A15 3 3
A16 1 1
A17 1 1
A18 1 1
A19 1 1
B1 2 1 3
B2 5 1 6
B3 1 10 11
B4 1 1
B5 1 1
B6 1 1
B7 1 1 2
B8 1 1
B9 1 1
B10 1 1
B11 1 1
C1 19 4 2 2 27
C2 1 1
C3 5 5
C4 1 1
C5 1 1
C6 1 1
C7 2 2
C8 1 1
C9 2 2
C10 1 1
C11 1 3 2 1 7
C12 1 1
N 13 5 7 7 2 11 6 12 20 8 11 4 5 2 113
N = total sample size. ALA = Alaska; ANA = Anadyr; MAG = Magadan; CSH = central Siberia (Irkutskaya, Selenga, Arhangay, Tyva); WSH = western Siberia(Arkhangelskaya, Tyumenskaya); KAM = Kamchatka; SAK = Sakhalin; HOK = Hokkaido; IWA = Iwate; YAM = Yamanashi; SHI = Shizuoka; NAR = Nara; EHI = Ehime;OIT = Oita. See Figure 1.
Saitoh et al. BMC Evolutionary Biology 2010, 10:35http://www.biomedcentral.com/1471-2148/10/35
Page 4 of 13
expansions, although only that of Clade C is significant.In addition, Fu’s Fs are negative, with significant p-values for all three main clades (Table 3), again suggest-ing past population expansions.
DiscussionPhylogeny, divergence times and comparison with NorthAmericaThe three main clades are highly divergent and wellsupported, and are estimated to have diverged aroundthe Pliocene/Pleistocene border. The combinedsequence data provide reasonably strong support for asister relationship between the two northerly distributedclades (A and B).
Figure 2 Mitochondrial cytochrome b gene tree. Dated gene tree for all cytochrome b sequences (including identical haplotypes), estimatedby Bayesian inference using the GTR + Γ model, a fixed clock rate of 0.0105 per lineage/million years and a coalescent expansion growthmodel. Values in square brackets are 95% highest posterior density intervals for the node ages. Support values are given above the nodes (>0.5/50%) in the order, from left to right, posterior probability, maximum likelihood bootstrap (1000 replicates) and parsimony bootstrap (1000replicates); support for minor clades within the three main clades are not indicated, except for a clade comprising samples from northeastSiberia and Alaska (marked by an asterisk). Clades discussed in the text are indicated by A, B and C.
Figure 3 Relationships among the three main clades .Relationships of representatives from each of the three main cladesin Figure 2, estimated by Bayesian inference of concatenatedmitochondrial ND5, cytochrome b, control region, tRNA-Pro, ND6,tRNA-Glu, tRNA-Phe and 12S sequences (3.2 kbp), under the HKY + Imodel. Support values at the nodes are, from left to right, posteriorprobability, maximum likelihood bootstrap and parsimony bootstrap.Clade names (A, B, C) same as in Figure 2.
Table 2 Estimated ages of the main Arctic Warbler clades
Clades All samples Major clades
A–B 1.9[1.3–2.6]
2.3[1.5–3.0]
A/B–C 2.5[1.8–3.3]
3.0[2.1–3.8]
Estimated by Bayesian inference using the GTR + Γ model and a fixed clockrate of 0.0105 per lineage/million years, and a coalescent expansion growthmodel (All samples) or birth-death model (Major clades). Values in squarebrackets are 95% highest posterior density intervals.
Saitoh et al. BMC Evolutionary Biology 2010, 10:35http://www.biomedcentral.com/1471-2148/10/35
Page 5 of 13

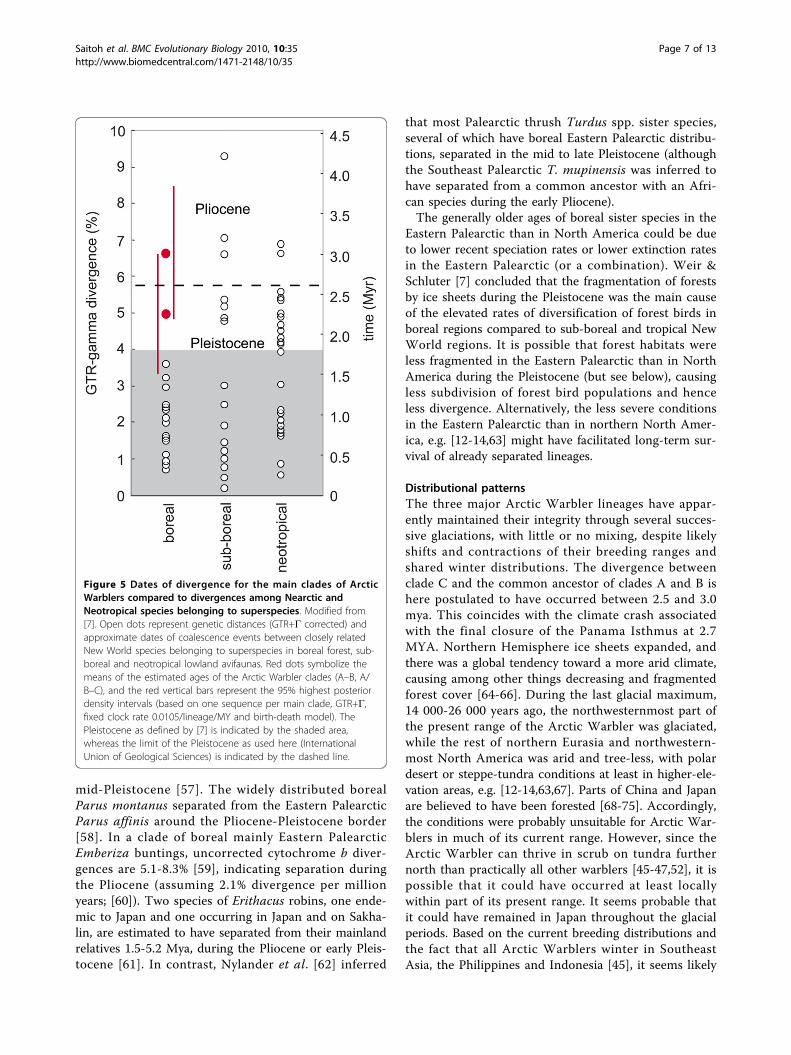
Weir & Schluter [7] found, based on an extensive sur-vey of New World species, that 100% of boreal NorthAmerican members of superspecies coalesced during thePleistocene, in contrast to 56% of sub-boreal and 46% oftropical superspecies. A similar latitudinal trend ofdivergence times has been found in North Americanfishes: clades occupying formerly glaciated areas aregenerally of Pleistocene origin [54,55], whereas more
southerly distributed clades usually predate the Pleisto-cene [56]. The separation of the three main Arctic War-bler clades in the Pliocene or early Pleistocene is olderthan the divergences of closely related species from for-merly ice-covered boreal regions of North America, butin agreement with species pairs from temperate NorthAmerican and Neotropical regions [7] (Fig. 5) (note that[7] used different limits of the Pleistocene than donehere, see Fig. 5).Several other studies suggest that sister species of bor-
eal Eastern Palearctic forest birds might be on averageolder than their New World counterparts. Boreal East-ern Palearctic sister species of Phylloscopus warblers areestimated to have diverged between mid-Pliocene and
Table 3 Sample size (N), diversity estimates and statistics for evidence of population expansion
Clade/population N No. of haplotypes Haplotype diversity (h) Nucleotide diversity (π) (%) Tajima’s D Fu’s F S
clade A 25 19 0.887 ± 0.04 0.290 ± 0.178 -1.435(p = 0.07)
-11.983(p = 0.0000**)
Alaska 13 3 0.603 0.066
Anadyr 5 4 0.9 0.217
Magadan 7 5 0.952 0.169
C Siberia 7 5 0.857 0.273
W Siberia 2 2 1 0.099
clade B 29 15 0.818 ± 0.0564 0.146 ± 0.101 -1.345(p = 0.075)
-6.180(p = 0.0000**)
Kamchatka 11 6 0.8 0.176
Sakhalin 6 6 1 0.264
Hokkaido 12 3 0.318 0.017
clade C 50 18 0.687 ± 0.067 0.104 ± 0.078 -1.799(p = 0.016*)
-7.993(p = 0.0000**)
Iwate 20 2 0,1 0,01
Yamanashi 8 5 0.786 0.117
Shizuoka 11 4 0,746 0,115
Nara 4 2 0,667 0,066
Ehime 5 3 0,8 0,138
Oita 2 2 1 0,3
See Table 1 for localities included in Central Siberia and West Siberia, respectively, and Figure 1 for geographical locations.
Figure 4 Nucleotide diversities (π) as a function of latitude.Triangles denote populations belonging to Clade A, rhomboidsClade B, and circles Clade C.
Table 4 Pairwise Fst values among different populationsof the Arctic Warbler.
Population 1 2 3 4 5 6 7 8
1 Alaska –
2 Magadan 0.499 –
3 Central Siberia 0.703 0.495 –
4 Kamchatka 0.973 0.959 0.946 –
5 Hokkaido 0.990 0.983 0.973 0.293 –
6 Iwate 0.993 0.989 0.984 0.987 0.998 –
7 Yamanashi 0.982 0.969 0.959 0.971 0.989 0.166 –
8 Shizuoka 0.981 0.971 0.962 0.972 0.988 0.332 0.189 –
Only populations with sample sizes of ≥7 are included. The different styles(bold; italic; bold italic) represent pairwise Fst values among the three mainclades (A, B and C) in Figures 2 and 3. All comparisons are significant(p < 0.05).
Saitoh et al. BMC Evolutionary Biology 2010, 10:35http://www.biomedcentral.com/1471-2148/10/35
Page 6 of 13
mid-Pleistocene [57]. The widely distributed borealParus montanus separated from the Eastern PalearcticParus affinis around the Pliocene-Pleistocene border[58]. In a clade of boreal mainly Eastern PalearcticEmberiza buntings, uncorrected cytochrome b diver-gences are 5.1-8.3% [59], indicating separation duringthe Pliocene (assuming 2.1% divergence per millionyears; [60]). Two species of Erithacus robins, one ende-mic to Japan and one occurring in Japan and on Sakha-lin, are estimated to have separated from their mainlandrelatives 1.5-5.2 Mya, during the Pliocene or early Pleis-tocene [61]. In contrast, Nylander et al. [62] inferred
that most Palearctic thrush Turdus spp. sister species,several of which have boreal Eastern Palearctic distribu-tions, separated in the mid to late Pleistocene (althoughthe Southeast Palearctic T. mupinensis was inferred tohave separated from a common ancestor with an Afri-can species during the early Pliocene).The generally older ages of boreal sister species in the
Eastern Palearctic than in North America could be dueto lower recent speciation rates or lower extinction ratesin the Eastern Palearctic (or a combination). Weir &Schluter [7] concluded that the fragmentation of forestsby ice sheets during the Pleistocene was the main causeof the elevated rates of diversification of forest birds inboreal regions compared to sub-boreal and tropical NewWorld regions. It is possible that forest habitats wereless fragmented in the Eastern Palearctic than in NorthAmerica during the Pleistocene (but see below), causingless subdivision of forest bird populations and henceless divergence. Alternatively, the less severe conditionsin the Eastern Palearctic than in northern North Amer-ica, e.g. [12-14,63] might have facilitated long-term sur-vival of already separated lineages.
Distributional patternsThe three major Arctic Warbler lineages have appar-ently maintained their integrity through several succes-sive glaciations, with little or no mixing, despite likelyshifts and contractions of their breeding ranges andshared winter distributions. The divergence betweenclade C and the common ancestor of clades A and B ishere postulated to have occurred between 2.5 and 3.0mya. This coincides with the climate crash associatedwith the final closure of the Panama Isthmus at 2.7MYA. Northern Hemisphere ice sheets expanded, andthere was a global tendency toward a more arid climate,causing among other things decreasing and fragmentedforest cover [64-66]. During the last glacial maximum,14 000-26 000 years ago, the northwesternmost part ofthe present range of the Arctic Warbler was glaciated,while the rest of northern Eurasia and northwestern-most North America was arid and tree-less, with polardesert or steppe-tundra conditions at least in higher-ele-vation areas, e.g. [12-14,63,67]. Parts of China and Japanare believed to have been forested [68-75]. Accordingly,the conditions were probably unsuitable for Arctic War-blers in much of its current range. However, since theArctic Warbler can thrive in scrub on tundra furthernorth than practically all other warblers [45-47,52], it ispossible that it could have occurred at least locallywithin part of its present range. It seems probable thatit could have remained in Japan throughout the glacialperiods. Based on the current breeding distributions andthe fact that all Arctic Warblers winter in SoutheastAsia, the Philippines and Indonesia [45], it seems likely
Figure 5 Dates of divergence for the main clades of ArcticWarblers compared to divergences among Nearctic andNeotropical species belonging to superspecies. Modified from[7]. Open dots represent genetic distances (GTR+Γ corrected) andapproximate dates of coalescence events between closely relatedNew World species belonging to superspecies in boreal forest, sub-boreal and neotropical lowland avifaunas. Red dots symbolize themeans of the estimated ages of the Arctic Warbler clades (A–B, A/B–C), and the red vertical bars represent the 95% highest posteriordensity intervals (based on one sequence per main clade, GTR+Γ,fixed clock rate 0.0105/lineage/MY and birth-death model). ThePleistocene as defined by [7] is indicated by the shaded area,whereas the limit of the Pleistocene as used here (InternationalUnion of Geological Sciences) is indicated by the dashed line.
Saitoh et al. BMC Evolutionary Biology 2010, 10:35http://www.biomedcentral.com/1471-2148/10/35
Page 7 of 13

that all three major lineages have survived the glacia-tions in eastern Asia. Reeves et al. [53] found evidenceof gene flow in continental Eurasian/Alaskan popula-tions of Arctic Warblers (corresponding to clade A ofthe present study) from south Siberia towards the north-west and northeast, and concluded that this patternprobably indicates the routes of postglacial expansion.Although we do not know for sure in which areas the
three Arctic Warbler clades diverged, the combinedsequence data strongly suggest that first a lineage com-prising the two northern clades (A and B) separatedfrom a common ancestor with the southern clade (C),whose distribution probably included Japan, and laterthe two northern clades separated from each other. Thisscenario makes sense also from a geographical point ofview, since the ancestry of the clade including the ArcticWarbler is inferred to have been somewhat furthersouth [57]. The very short internode leading up to theclade comprising A and B indicates that all threelineages separated close in time. A similar “simulta-neous” burst of lineage splittings has been suggested fora clade of mainly Eastern Palearctic boreal Emberizabuntings [59].Several species groups and phylogroups of birds and
mammals have distributional patterns that agree fairlywell with that of the Arctic Warbler, suggesting thatgeographical barriers leading to vicariant divergence ofpopulations have existed in the past between, on theone hand, much of the northern Palearctic and, on theother hand, Russian Far East (including Sakhalin andsouthern Kamchatka) and Japan, and on a finer scalewithin the latter area, between Sakhalin/southern Kam-chatka/Hokkaido and the rest of Japan. Some of thesedivergences may have been caused by Pleistocene cli-matic oscillations, while others are apparently older andmust have other causes. The importance of the Tsugarustrait, “Blakiston’s line”, between Hokkaido and Honshuas a biogeographic division line in various taxa of ani-mals and plants has been stressed by [76-78]. Several ofthe birds breeding in Japan and, in some cases, also onSakhalin and southern Kamchatka have their closestrelatives in the boreal forests on the mainland[29,57,59,61,62,79]. Three of these (Emberiza variabilis,Locustella amnicola and Phylloscopus borealoides) differfrom their respective sister species by c. 3.4-4.4% incytochrome b (uncorrected p; P. Alström & U. Olsson,unpublished). This is similar to the differences amongthe three main Arctic Warbler clades (3.8-5.1%, uncor-rected p), suggesting common causes of their diver-gences. In addition, several bird and mammal speciesshow relatively deep divergences between a clade cover-ing much of the northern Palearctic and a clade fromthe Russian Far East (sometimes including Sakhalin andsouthern Kamchatka) and in some cases Japan
[22,23,28,33,34]. However, these divergences are of morerecent origin than the Arctic Warbler clades, and prob-ably all date to the Pleistocene.Despite apparent historical range shifs, it is possible
that the three main Arctic Warbler clades have divergedin complete geographical isolation. There is presently noknown geographical overlap between them, although theparts of Kamchatka and continental Russian Far Eastwhere this might occur are unsampled. The presentstudy indicates significant divergence between somegeographically closely situated localities within the mainclades, even in the absence of apparent geographicalbarriers. Reeves et al. [53] also reported significant isola-tion-by-distance in Arctic Warblers in continental Eura-sia/Alaska. Presumably, the natal philopatry is strongand the innate migration routes strictly adhered to,which has been suggested to be at least part of theexplanation for the maintenance of geographicallyneighbouring clades in the boreal migratory WillowWarbler Phylloscopus trochilus [80], Greenish WarblerPhylloscous trochiloides complex [81] and Dunlin Cali-dris alpina [25].
Population expansionsWithin each of the three main clades, the nucleotidediversity is low (mean π = 0.10-0.29%), especially in themarginal populations from Iwate (clade C), Hokkaido(clade B) and Alaska (clade A) (π = 0.010-0.066), andneutrality tests indicate sudden population expansion ineach of these clades. These results suggest that eachclade has suffered from past bottlenecks, and that therange of each of them has expanded in more recenttimes. There is observational data supporting recentexpansion in at least one area: the Arctic Warbler wasonly recently confirmed to breed in Hokkaido, on theShiretoko peninsula [82]. Reeves et al. [53] also foundevidence of population expansion in Arctic Warblers innortheast Siberia/Alaska, while they inferred more stablepopulations in south and west Siberia and north Europe.Although they did not find any signature of populationexpansion in the west Siberian and European popula-tions, these populations must have expanded theirranges considerably during the Holocene, since theirpresent breeding areas were coverd by ice during thelatest glaciation. Reeves et al. [53] further deduced thatBeringia was likely colonized in two steps, first fromsouth Siberia to northeast Russia and then, after a delay,across the Bering Strait to Alaska.A similar pattern of post-Pleistocene population
expansion has been found in another forest bird, theGreat Tit Parus major complex. The northern major(Europe to northern Russian Far East) and easternminor (China, Japan, Korean pensinsula, southern Rus-sian Far East) groups show signs of population
Saitoh et al. BMC Evolutionary Biology 2010, 10:35http://www.biomedcentral.com/1471-2148/10/35
Page 8 of 13

expansion, unlike the Central Asian bokharensis andSouth Asian cinereus groups [32]. It is most likely thatthe northern major group was forced to retreat south toescape from the advancing ice during the glacial periods,and that at the same time the east Asian minor groupprobably also had to reduce its range due to habitatchanges resulting from the colder and drier climate. Evi-dence of population expansion has been found in severalother widely distributed boreal forest taxa, includingseven more birds, two rodents, a flying squirrel, a newtand two ants (reviewed in [22,26]).The results suggest that although the Eastern Palearc-
tic may have been almost free of ice during the Pleisto-cene, population bottlenecks and subsequent expansionshave nevertheless occurred in that region because of for-est dynamics.
ConclusionsThe three Arctic Warbler clades are estimated to havediverged in close succession during the latter part of thePliocene to early part of the Pleistocene, and althoughall of them experienced population bottlenecks duringthe Pleistocene, they nevertheless survived and main-tained their respective integrity. Suitable breeding habi-tats likely existed in east Asia, probably at least partlywithin the present breeding ranges of these lineages, e.g.Japan. Several other clades of Northeastern Palearcticforest birds are noted to have diversified in the late Plio-cene. This pattern differs from that of North Americanboreal forest clades that occur on formerly glaciatedground, and which are generally of Pleistocene origin.The differences between these regions could be due toslower speciation rates in the Eastern Palearctic due toless fragmentation of forest habitats during glacial peri-ods, or to longer survival of Eastern Palearctic clades asa result of less severe conditions in that region com-pared to northern North America. Several other Palearc-tic organisms show concordant biogeographical patternsto that of the Arctic Warbler, indicating common causesof their diversifications.
MethodsSampling and laboratory methodsA total of 113 Arctic Warbler samples were obtainedduring the breeding season from 18 localities across theentire breeding range (Fig. 1, Additional file 1). Sampleswere also obtained from two of the closest relatives ofArctic Warbler, Large-billed Leaf Warbler P. magniros-tris and Sakhalin Leaf Warbler P. borealoides, as well astwo more distantly related Phylloscopus species, Two-barred Warbler P. plumbeitarsus and Eastern CrownedWarbler P. coronatus [57,79].Total DNA from blood or pectoral muscle were
extracted using the standard phenol-chloroform
procedure. For each individual, partial mitochondrialcytochrome b (1012 bp) was amplified with primers mt-F (H16065) [83] and mt-A (L14970) [84]. The PCR reac-tions were performed in a total volume of 35 μl using10 ng of total DNA, 1.5 mM MgCl2, 0.2 mM of eachdNTP, 0.4 μM of each primer, 0.5 units Ex-Taq poly-merase (Takara). The amplification profile was 94°C for3 min followed by 35 cycles of 94°C for 30 sec, 56°C for30 sec, and 72°C for 1 min and a final extension in 72°Cfor 5 min, using Takara PCR Thermal Cycler MP(Takara).For one or two individuals from each of the three
main cytochrome b clades (see Results) and the twooutgroup taxa we also amplified part of the mitochon-drial ND5 gene (964 bp), and a sequence comprisingpart of the mitochondrial control region, tRNA-progene, NADH dehydrogenase subunit 6 (ND6) gene,tRNA-Glu and tRNA-Phe genes, and part of the 12SrRNA gene (hereafter CR-ND6-12S-tRNA; 1232 bpexcluding gaps in the alignment). For ND5, we used pri-mers mt-F [83] and L14080ND5P, 5’-TCAACY-CAYGCMTTCTTCAAAGC-3’ (modified from [85]),which amplifies approximately 2 kbp (ND5 and cyto-chrome b), and the amplification profile was 94°C for 3min followed by 35 cycles of 94°C for 30 sec, 53°C for30 sec, and 72°C for 1.5 min and a final extension in72°C for 5 min. The CR-ND6-12S-tRNA region wasamplified using primers, DLL3, 5’-TGATGCACTTT-GACCCCATTCATGG-3’ and 12SH2, 5’-AGCAACAACCAACGGTAAG-3’ and amplification profile [86]. ThePCR cycling parameters were 2.5 min at 95°C; 40 cyclesof 30 s at 95°C, 30 s at 50°C, and 2 min at 72°C; termi-nated by 7 min at 72°C, and a 4°C soak. PCR productswere purified using ExoSAP-IT (Amersham Bioscience).Sequencing reactions were performed with the primers
L14080ND5P, mt-A and mt-F with BigDye TerminatorCycle Sequencing FS Kit v.3.1 and run with ABI 3100-Avant sequencer (Applied Biosystems). For some sam-ples, products were purified using EZNA cycle pure kit(Omega bio-tek), and sequencing performed by Macro-gen Inc., Seoul, South Korea, using the primers DLL3,12SH2 and DLLF2. The sequences were checked tomake sure that coding regions contained no stopcodons.
Data analysesThe sequences were aligned by eye with ATGC v. 4.0.8and GENETYX-MAC v.10.1 (GENETYX).Phylogenetic trees were inferred using BEAST version
1.5.2 [87,88]. Xml files for analysis in BEAST were gen-erated in BEAUti version 1.5.2 [89] using a GTR+Γmodel and fixed clock rate of 0.0105 (corresponding to1.05%/MY/lineage: [60]). A coalescent expansion growthmodel was used in analyses comprising all sequences of
Saitoh et al. BMC Evolutionary Biology 2010, 10:35http://www.biomedcentral.com/1471-2148/10/35
Page 9 of 13

Arctic Warblers, including identical haplotypes (as sug-gested at http://beast.bio.ed.ac.uk/FAQ#Should_I_remo-ve_identical_sequences.3F), but no outgroups. A birth-death model was used for datasets including onesequence per main clade in the Arctic Warbler complex(as revealed by other analyses) and outgroups. The datawere also analysed employing a lognormal uncorrelatedrelaxed clock [90] with a fixed mean rate of 0.0105 perlineage/MY [60]. Default priors were used. 40 × 106
generations were run, sampled every 1000 generation.The MCMC output was analysed in Tracer version 1.4.1[91] to evaluate whether valid estimates of the posteriordistribution of the parameters had been obtained. Thefirst 25% of the generations were discarded as “burn-in”,well after stationarity of chain likelihood values hadbeen established. Trees were summarized using TreeAn-notator version 1.5.2 [92], choosing “Maximum cladecredibility tree” and “Mean heights”, and displayed inFigTree version 1.2.3 [93]. Only the cytochrome b data-set was analysed in BEAST.Phylogenetic trees were also constructed by Bayesian
inference using the program MrBayes 3.1.2 [94]. Appro-priate substitution models were determined based onthe Akaike Information Criterion [95] and a hierarchicallikelihood ratio test [96], both calculated using MrMo-deltest2 [97] in conjunction with PAUP* [98]. Theselected model for cytochrome b was a general time-reversible (GTR) model [99-101] with an estimated pro-portion of invariant sites (I; [102]) (GTR+I), and for theconcatenated ND5, cytochrome b, CR-ND6-12S-tRNAsequences the HKY model [103] with an estimated pro-portion of invariant sites (I; [102] (HKY + I). Defaultpriors were used. Four Metropolis-coupled MCMCchains were run for 20 × 106 generations, and sampledevery 1000 generations; the heating temperature was setto 0.1. Two independent analyses were run simulta-neously, starting from random trees (per default). Thefirst 25% of the generations were discarded as “burn-in”,well after stationarity of chain likelihood values hadbeen established by inspection in Tracer 1.4.1 [91] aswell as in the MrBayes summary of parameters, and theposterior probability was estimated for the remaininggenerations. The samples from the stationary phases ofthe independent runs were pooled to obtain the finalresults.Parsimony (MP) bootstrapping was performed in
PAUP* [98]: heuristic search strategy, 1000 replicates,starting trees obtained by stepwise addition (randomaddition sequence, 10 replicates), TBR branch swapping.Maximum likelihood (ML) bootstrapping (1000 repli-cates) was performed in Treefinder [104,105] usingdefault settings and the same models as in MrBayes.For the cytochrome b data, haplotype diversity (h;
[106], nucleotide diversity (π; [106], number of
segregating (polymorphic) sites per nucleotide (θ; [107]),pairwise Fst [108], and analyses of molecular variance(AMOVA; [109]) were calculated with Arlequin version3.0 [110] for all individuals.
Additional file 1: Appendix - Taxon, sampling locality, field andmuseum voucher number, sequenced region(s), cytochrome bhaplotype and GenBank accession number of all samplesClick here for file[ http://www.biomedcentral.com/content/supplementary/1471-2148-10-35-S1.DOC ]
AcknowledgementsWe thank the following persons/institutions for providing us with samples:the Swedish Museum of Natural History, Stockholm; Peter Mortensen/theSwedish Polar Research Secretariat and the Beringia 2005 Expedition; PavelTomkovich/Zoological Museum of Moscow University, Moscow; KevinWinker/University of Alaska Museum, Fairbanks; Sharon Birks/Burke Museum,University of Washington; Mark Robbins and Townsend Peterson/Universityof Kansas Museum of Natural History; Bo Peterson, Trevor Price, and LarsSvensson. Assistance in the field in Russia was provided by Vladimir B.Masterov and Vladimir B. Zykov (Moscow State University, Moscow), Yuri N.Gerasimov (Kamchatka Institute for Ecology and Nature Management, Far-East Branch Russian Academy of Science, Kamchatka) and Mutsuyuki Ueta(Japan Bird Research Association, Tokyo), in Mongolia by SundevGombobaatar/National University of Mongolia, and in Japan by HaruoKuroda, Shiro Murahama (Wildlife Conservation Laboratory, Osaka), HajimeNakagawa (Shiretoko Museum, Hokkaido), Yoshihiro Fukuda and TokuhikoMonma. Manabu Kajita, Micho Matsuda and Yoshiki Watabe assisted us inother ways. We are grateful to Staffan Bensch, Keith D. Bennett, Trevor Priceand three anonymous referees for valuable comments on the manuscript, toGeorge Sangster and Tommy Tyrberg for various useful information, and toSebastian Höhna, Johan Nylander, Trevor Price and Mikael Thollesson foradvice on the BEAST analyses. This study was funded by the FujiwaraNatural History Foundation and the Swedish Research Council. PA alsogratefully acknowledges Riksmusei Vänners Linnaeus Award, which hasallowed him to devote time to this study.
Author details1Department of Life Science, Rikkyo University, 3-34-1 Nishi-ikebukuro,Toshima-ku, Tokyo 171-8501, Japan. 2Swedish Species Information Centre,Swedish University of Agricultural Sciences, Box 7007, SE-750 07 Uppsala,Sweden. 3Swedish Museum of Natural History, Box 50007, SE-104 05Stockholm, Sweden. 4Department of Zoology, National Museum of Natureand Science, 3-23-1 Hyakunin-cho, Shinjuku-ku, Tokyo 169-0073, Japan.5Yamashina Institute for Ornithology, 115 Konoyama, Abiko, Chiba 270-1145,Japan. 6Department of Zoology, University of Göteborg, Box 463, 405 30Göteborg, Sweden. 7Current address: Yamashina Institute for Ornithology, 115Konoyama, Abiko, Chiba 270-1145, Japan.
Authors’ contributionsTS and PA participated in all parts of this study. IN and KU conceived of thestudy, and participated in its design and coordination and helped with afirst draft of the manuscript. YS participated in design of field work and insampling. UO carried out part of the lab work and contributed to themanuscript. DW carried out part of the lab work. All authors read andapproved the final manuscript.
Received: 4 March 2009Accepted: 4 February 2010 Published: 4 February 2010
References1. Hewitt GM: Some genetic consequences of ice ages, and their role in
divergence and speciation. Biol J Linn Soc 1996, 58:247-276.2. Hewitt GM: Postglacial recolonization of European Biota. Biol J Linn Soc
1999, 68:87-112.
Saitoh et al. BMC Evolutionary Biology 2010, 10:35http://www.biomedcentral.com/1471-2148/10/35
Page 10 of 13

3. Hewitt GM: Genetic consequences of climatic oscillations in theQuaternary. Phil Trans R Soc Lond B Biol Sci 2004, 359:183-195.
4. Taberlet P, Fumagalli L, Wist-saucy AG, Cossons JF: Comparaticephylogeography and postglacial colonization routes in Europe. Mol Ecol1998, 7:453-464.
5. Ball RM, Avise JC: Mitochondrial DNA phylogeographic differentiationamong avian populations and the evolutionary significance ofsubspecies. Auk 1992, 109:626-636.
6. Seutin G, Ratcliffe LM, Boag PT: Mitochondrial DNA homogeneity in thephenotypically diverse redpoll finch complex (Aves: Carduelinae:Carduelis flammea-hornemanni). Evolution 1995, 49:962-973.
7. Weir JT, Schluter D: Ice sheets promote speciation in boreal birds. Proc RSoc Lond B Biol Sci 2004, 271:1881-1887.
8. Zink RM: Comparative phylogeography in North American birds.Evolution 1996, 50:308-317.
9. Conroy CJ, Cook JA: Phylogeography of a post-glacial colonizer: Microtuslongicaudus (Rodentia: Muridae). Mol Ecol 2000, 9:165-175.
10. Soltis DE, Gitzendanner MA, Strenge DD, Soltis PS: Chloroplast DNAintraspecific phylogeography of plants from the Pacific Northwest ofNorth America. Plant Syst Evol 1997, 206:353-373.
11. Weir JT, Schluter D: The latitudinal gradient in recent speciation andextinction rates of birds and mammals. Science 2007, 315:1574-1576.
12. Clark PU, Mix AC: Ice sheets and sea level of the Last Glacial Maximum.Quat Sci Rev 2002, 21:1-7.
13. Dyke AS, Andrews JT, Clark PU, England JH, Miller GH, Shaw J, Veillette JJ:The Laurentide and Innuitian ice sheets during the Last GlacialMaximum. Quat Sci Rev 2002, 21:9-31.
14. Svendsen JI, Alexanderson H, Astakhov VI, Demidov I, Dowdeswell JA,Funder S, Gataullin V, Henriksen M, Hjort C, Houmark-Nielsen M,Hubberten HW, Ingólfsson Ó, Jakobsson M, Kjær KH, Larsen E, Lokrantz H,Lunkkap JP, Lysån A, Mangeruda J, Matiouchkovq A, Murrayr A, Mölleri P,Niessens F, Nikolskayat O, Polyakh L, Saarnistou M, Siegertk C, Siegertv MJ,Spielhagenw RF, Steins R: Late Quaternary ice sheet history of northernEurasia. Quat Sci Rev 2004, 23:1229-1271.
15. Grosswald MG, Hughes TJ: The Russian component of an Arctic Ice Sheetduring the Last Glacial Maximum. Quat Sci Rev 2002, 21:121-146.
16. Marmi J, López-Giráldez F, Macdonald DW, Calafell F, Zholnerovskaya E,Domingo-Roura X: Mitochondrial DNA reveals a strong phylogeographicstructure in the badger across Eurasia. Mol Ecol 2006, 15:1007-1020.
17. Waltari E, Cook JA: Hares on ice: phylogeography and historicaldemographics of Lepus arcticus, L. othus, and L. timidus (Mammalia:Lagomorpha). Mol Ecol 2005, 14:3005-3016.
18. Brunhoff C, Galbreath KE, Fedorov VB, Cook JA, Jaarola M: Holarcticphylogeography of the root vole (Microtus oeconomus): implications forlate Quaternary biogeography of high latitudes. Mol Ecol 2003, 12:957-968.
19. Fedorov VB, Goropashnaya AV: The importance of ice ages indiversifications of Arctic collared lemmings (Dicrostonyx): evidence fromthe mitochondrial cytochrome b region. Hereditas 1999, 130:301-307.
20. Fedorov V, Fredga K, Jarrell GH: Mitochondrial DNA variation and theevolutionary history of chromosome races of collared lemmings(Dicrostonyx) in the Eurasian Arctic. J Evol Biol 1999, 12:134-145.
21. Fedorov VB, Goropashnaya AV, Jaarola M, Cook JA: Phylogeography oflemmings (Lemmus): no evidence for postglacial colonization of Arcticfrom the Beringia refugium. Mol Ecol 2003, 12:725-731.
22. Fedorov VB, Goropashnaya AV, Boeskorov GG, Cook JA: Comparativephylogeography and demographic history of the wood lemming(Myopus schisticolor): implications for late Quaternary history of the taigaspecies in Eurasia. Mol Ecol 2008, 17:598-610.
23. Oshida T, Abramov A, Yanagawa H, Masuda R: Phylogeography of theRussian flying squirrel (Pteromys volans): implication of refugia theory inarboreal small mammal of Eurasia. Mol Ecol 2005, 14:1191-1196.
24. Peters JL, Gretes W, Omland W: Late Pleistocene divergence betweeneastern and western populations of wood ducks (Aix sponsa) inferred bythe ‘isolation with migration’ coalescent method. Mol Ecol 2005,14:3407-3418.
25. Wenink PW, Baker AJ, Rösner HU, Tilanus MGJ: Global mitochondrial DNAphylogeography of Holarctic breeding dunlins (Calidris alpina). Evolution1996, 50:318-330.
26. Zink RM, Pavlova A, Drovetski SV, Rohwer S: Mitochondrialphylogeographies of five widespread Eurasian bird species. J Ornithol2008, 149:399-413.
27. Zink RM, Drovetski SV, Rohwer S: Phylogeographic patterns in the greatspotted woodpecker Dendrocopos major across Eurasia. J Avian Biol 2002,33:175-178.
28. Zink RM, Rohwer S, Drovetski SV, Rachelle C, Blackwell-Rago , Farrell SL:Holarctic phylgeography and species limits of Three-toed Woodpeckers.Condor 2002, 104:167-170.
29. Drovetski SV, Zink RM, Fadeev IV, Nesterov EV, Koblik EA, Red’kin YA,Rohwer S: Mitochondrial phylogeny of Locustella and related genera. JAvian Biol 2004, 35:105-110.
30. Drovetski SV, Zink RM, Rohwer S, Fadeev IV, Nesterov EV, Karagodin I,Koblik EA, Red’kin YA: Complex biogeographic history of a Holarcticpasserine. Proc R Soc Lond B 2004, 271:545-551.
31. Kvist L, Martens J, Ahola A, Orell M: Phylogeography of a Palaearcticsedentary passerine, the willow tit (Parus montanus). J Evol Biol 2001,14:930-941.
32. Kvist L, Martens J, Higuchi H, Nazarenko AA, Valchuk OP, Orell M: Evolutionand genetic structure of the great tit (Parus major) complex. Proc R SocLond B 2003, 270:1447-1454.
33. Haring E, Gamauf A, Kryukov A: Phylogeographic patterns in widespreadcorvid birds. Mol Phylogenet Evol 2007, 45:840-862.
34. Lee S, Parr CS, Hwang Y, Mindell DP, Choe JC: Phylogeny of magpies(genus Pica) inferred from mtDNA data. Mol Phylogenet Evol 2003,29:250-257.
35. Ödeen A, Björklund M: Dynamics in the evolution of sexual traits: lossesand gains, radiation and convergence in yellow wagtails (Motacillaflava). Mol Ecol 2003, 12:2113-2130.
36. Omland KE, Baker JM, Peters JL: Genetic signatures of intermediatedivergence: population history of Old and New World Holarctic ravens(Corvus corax). Mol Ecol 2006, 15:795-808.
37. Pavlova A, Zink RM, Drovetski SV, Red’kin Y, Rohwer S: Phylogeographicpatterns in Motacilla flava and Motacilla citreola: species limits andpopulation history. Auk 2003, 120:744-758.
38. Pavlova A, Zink RM, Rohwer S, Koblik EA, Red’kin YA, Fadeev IV,Nesterov EV: Mitochondrial DNA and plumage evolution in the whitewagtail Motacilla alba. J Avian Biol 2005, 36:322-336.
39. Pavlova A, Zink RM, Rohwer S: Evolutionary history, population genetics,and gene flow in the common rosefinch (Carpodacus erythrinus). MolPhylogenet Evol 2005, 36:669-681.
40. Salzburger W, Martens J, Sturmbauer C: Paraphyly of the Blue Tit (Paruscaeruleus) suggested from cytochrome b sequences. Mol Phylogenet Evol2002, 24:19-25.
41. Zink RM, Drovetski SV, Rohwer S: Selective neutrality of mitochondrialND2 sequences, phylogeography and species limits in Sitta europaea.Mol Phylogenet Evol 2006, 40:679-686.
42. Irwin DE, Alström P, Olsson U, Benowitz-Fredericks ZM: Cryptic species inthe genus Phylloscopus (Old World leaf warblers). Ibis 2001,143:233-247.
43. Martens J, Tietze DT, Eck S, Veith M: Radiation and species limits in theAsian Pallas’s warbler complex (Phylloscopus proregulus s.l.). J Ornithol2004, 145:206-222.
44. Nishiumi I, Yao C, Saito DS, Lin R: Influence of the last two glacialperiods and late Pliocene on the latitudinal population structure ofresident songbirds in the Far East. Mem Natn Sci Mus Tokyo 2006,44:11-20.
45. Bairlein F, Alström P, Aymí R, Clement P, Dyrcz A, Gargallo G, Hawkins F,Madge S, Pearson D, Svensson L: Family Sylviidae (Warblers). Handbook ofthe Birds of the World Barcelona: Lynx Edicionsdel Hoyo J, Elliott A, ChristieDA 2006, 12:492-709.
46. Cramp S, Brooks J, (Eds): The birds of the Western Palearctic London: OxfordUniversity Press 1992, 6:536-548.
47. Dement’ev GP, Gladkov NA, (Eds): Birds of the Soviet Union Jerusalem: IsraelProgram for Scientific Translations 1968, 6.
48. Dickinson EC, (Ed): The Howard and Moore Complete checklist of the birds ofthe World Princeton, New Jersey: Princetion University Press, 3 2003.
49. Ticehurst CB: A systematic review of the genus Phylloscopus London: BritishMuseum 1938.
50. Watson GE, Traylor MA Jr, Mayr E: Checklist of Birds of the World Cambridge,Mass: Museum of Comparative Zoology, Harvard University PressMayr E,Cottrell GW 1986, 11.
51. Williamson K: Identification for Ringers 2. The Genus Phylloscopus Tring: BritishTrust for Ornithology, 2 1967.
Saitoh et al. BMC Evolutionary Biology 2010, 10:35http://www.biomedcentral.com/1471-2148/10/35
Page 11 of 13

52. Lowther PE: Arctic Warbler (Phylloscopus borealis). The Birds of NorthAmerica, Number 590 Philadelphia PA: The Birds of North America, IncPooleA, Gill F 2001.
53. Reeves AB, Drovetski SV, Fadeev V: Mitochondrial DNA data imply astepping-stone colonizaiton of Beringia by arctic warbler Phylloscopusborealis. J Avian Biol 2008, 39:567-575.
54. Bernatchez L, Wilson CC: Comparative phylogeography of nearctic andpalearctic finches. Mol Ecol 1998, 7:431-452.
55. Taylor EB, McPhail JD: Evolutionary history of an adaptive radiation inspeciese pairs of threespine sticklebacks (Gasterosteus aculeatus):insights from mitochondrial DNA. Biol J Linn Soc 1999, 66:271-291.
56. Near TJ, Kassler TW, Koppelman JB, Dillmam CB, Philipp DP: Speciation inNorth American black basses, Micropterus. Evolution 2003, 57:1610-1621.
57. Johansson U, Alström P, Olsson U, Ericson PGP, Sundberg P, Price TD: Build-up of the Himalayan avifauna through immigration: a biogeographicalanalysis of the Phylloscopus and Seicercus warblers. Evolution 2007,61:324-333.
58. Päckert M, Martens J, Tietze DT, Dietzen C, Wink M, Kvist L: Calibration of amolecular clock in tits (Paridae)–Do nucleotide substitution rates ofmitochondrial genes deviate from the 2% rule?. Mol Ecol 2007, 44:1-14.
59. Alström P, Olsson U, Lei F, Wang H-T, Gao W, Sundberg P: Phylogeny andclassification of the Old World Emberizini (Aves, Passeriformes). MolPhylogenet Evol 2008, 47:960-973.
60. Weir JT, Schluter D: Calibrating the avian molecular clock. Mol Ecol 2008,17:2321-2328.
61. Seki S: The origin of the East Asian Erithacus robin, Erithacus komadori,inferred from cytochrome b sequence data. Mol Phylogenet Evol 2006,39:899-905.
62. Nylander JAA, Olsson U, Alström P, Sanmartín I: Accounting forphylogenetic uncertainty in biogeography: a Bayesian approach todispersal-vicariance analysis of the thrushes (Aves: Turdus). Syst Biol 2008,57:257-268.
63. Adams JM: Global land environments since the last interglacial. OakRidge National Laboratory, TN, USA 1997http://www.esd.ornl.gov/ern/qen/nerc.html.
64. Lisiecki LE, Raymo ME: A Pliocene-Pleistocene stack of 57 globallydistributed benthic δ18O records. Paleoceanography 2005, 20:1-17.
65. deMenocal PB: African climate change and faunal evolution during thePliocene-Pleistocene. Earth and Planetary Science Letters 2004, 220:3-24.
66. Head MJ, Gibbard P, Salvador A: The Quaternary: its character anddefinition. Episodes 2008, 31:234-238.
67. Pielou EC: After the Ice Age: The Return of Life to Glaciated North AmericaChicago: University of Chicago Press 1991.
68. Frenzel B: The Pleistocene Vegetation of Northern Eurasia. Science 1968,161:637-649.
69. Frenzel B, Pecsi M, Velichko AA: Atlas of palaeoclimates andpalaeoenvironments of the northern hemisphere Budapest: GeographicalResearch Institute, Hungarian Academy of Sciences 1992.
70. Kurtén B: The ice age London: Rupert Hart-Davis 1972.71. Moreau RE: Ecological changes in the Palaearctic region since the
Pliocene. Proc R Soc Lond B Biol Sci 1955, 125:253-295.72. Ooi N: Pollen spectra from around 20,000 years ago during the Last
Glacial from the Nara Basin, Japan. Quat Res (Japan) 1992, 31:203-212.73. Ooi N, Minaki M, Noshiro S: Vegetation changes around the Last Glacial
Maximum and effects of the Aira-Tn Ash, at the Itai-Teragatani Site,Central Japan. Ecol Res 1990, 5:81-91.
74. Svendsen JI, Astakhov VI, Bolshiyanov DY, Demidov I, Dowdeswell JA,Gataullin V, Hjort C, Hubberten HW, Larsen E, Mangerud J, Melles M,Möller P, Saarnisto M, Siegert MJ: Maximum extent of the Eurasian icesheets in the Barents and Kara Sea region during the Weichselian.Boreas 1999, 28:234-242.
75. Yu G, Chen X, Ni J, Cheddadi R, Guiot J, Han H, Harrison SP, Huang C, Ke M,Kong Z, Li S, Li W, Liew P, Liu G, Liu J, Liu Q, Liu K-B, Prentice IC, Qui W,Ren G, Song C, Sugita S, Sun X, Tang L, Van Campo E, Xia Y, Xu Q, Yan S,Yang X, Zhao J, Zheng Z: Palaeovegetation of China: a pollen data-basedsynthesis for the mid-Holocene and last glacial maximum. J Biogeography2000, 27:635-664.
76. Tokuda M: Biogeography of Japan. Geological History of the Japaneseislands and Biogeographical History of Japanese Fauna and Flora, Inferredfrom Evolutionary Studies of Eastern Asiatic Rodents Tokyo: Kokon Syoin 1941.
77. Dobson M, Kawamura Y: Origin of the Japanese land mammal fauna:allocation of extant species historically-based categories. Quat Res 1998,37:385-395.
78. Masuda R: Blakiston’s line and genetic investigation on biogeography ofmammals in Japan. Honyurui Kagaku (Mammalian Science) 1999,39:323-328.
79. Olsson U, Alström P, Ericson PGP, Sundberg P: Non-monophyletic taxa andcryptic species - evidence from a molecular phylogeny of leaf-warblers(Phylloscopus, Aves). Mol Phylogenet Evol 2005, 36:261-276.
80. Bensch S, Åkesson S, Irwin DE: The use of AFLP to find an informativeSNP: genetic differences across a migratory divide in willow warblers.Mol Ecol 2002, 11:2359-2366.
81. Irwin DE, Irwin JH: Siberian migratory divides: The role of seasonalmigration in speciation. Birds of Two Worlds Baltimore, MD: John HopkinsUniversity PressGreenberg R, Marra P 2004, 27-40.
82. Nakagawa H, Fujimaki Y: Birds of the Onnebetsudake Wilderness Area Ministryof the Environment Government of Japan 1985, 379-404.
83. Helbig AJ, Seibold I: Molecular phylogeny of Palearctic-AfricanAcrocephalus and Hippolais warblers (Aves: Sylviidae). Mol Phylogenet Evol1999, 11:246-260.
84. Leisler B, Heidrich P, Schulze-Hagen K, Wink M: Taxonomy and phylogenyof reed warblers (genus Acrocephalus) based on mtDNA sequences andmorphology. J Ornithol 1997, 138:469-495.
85. Sorenson MD, Ast JC, Dimcheff DE, Yuri T, Mindell DP: Primers for a PCR-baced approach to mitochondrial genome sequencing in birds andother vertebrates. Mol Phylogenet Evol 1999, 12:105-114.
86. Bensch S, Härlid A: Mitochondrial genomic rearrangements in songbirds.Mol Biol Evol 2000, 17:107-113.
87. Drummond AJ, Rambaut A: BEAST: Bayesian evolutionary analysis bysampling trees. BMC Evol Biol 2007, 7:214.
88. Drummond AJ, Rambaut A: BEAST. Version 1.5.2. 2009http://beast.bio.ed.ac.uk.
89. Rambaut A, Drummond AJ, Xie W: BEAUti. Version 1.5.2. 2009http://beast.bio.ed.ac.uk.
90. Drummond AJ, Ho SYW, Phillips MJ, Rambaut A: Relaxed Phylogeneticsand Dating with Confidence. PLoS Biol 2006, 4:e88.
91. Rambaut A, Drummond AJ: Tracer. Version 1.4.1. 2009http://beast.bio.ed.ac.uk.
92. Rambaut A, Drummond AJ: TreeAnnotator. Version 1.5.2. 2009http://beast.bio.ed.ac.uk.
93. Rambaut A: FigTree. Version 1.2.3. 2009http://tree.bio.ed.ac.uk/software/figtree.
94. Ronquist FR, Huelsenbeck JP: MrBayes 3: Bayesian phylogenetic inferenceunder mixed models. Bioinformatics 2003, 19:1572-1574.
95. Akaike H: A new look at the statistical model identification. IEEE TransAuto Control 1974, 19:716-723.
96. Posada D, Crandall KA: MODELTEST: testing the model of DNAsubstitution. Bioinformatics 1998, 14:817-818.
97. Nylander JAA: MrModeltest2, version 2.2 [Computer program]. 2004http://www.abc.se/~nylander.
98. Swofford DL: PAUP Version 4.0: Phylogenetic Analysis Using Parsimony(and Other Methods). Sunderland, Massachusetts: Sinauer Associates 2003.
99. Lanave C, Preparata C, Saccone C, Serio G: A new method for calculatingevolutionary substitution rates. J Mol Evol 1984, 20:86-93.
100. Rodríguez J, Oliver L, Marín A, Medina R: The general stochastic model ofnucleotide substitution. J Theoret Biol 1990, 142:485-501.
101. Tavaré S: Some probabilistic and statistical problems on the analysis ofDNA sequences. Lec Mat Life Sci 1986, 17:57-86.
102. Gu X, Fu YX, Li WH: Maximum likelihood estimation of the heterogeneityof substitution rate among nucleotide sites. Mol Biol Evol 1995,12:546-557.
103. Hasegawa M, Kishino H, Yano T: Dating of the human-ape splitting by amolecular clock of mitochondrial DNA. J Mol Evol 1985, 22:160-174.
104. Jobb G: TREEFINDER: version of October 2008 [Computer program].Munich, Germany 2008http://www.treefinder.de.
105. Jobb G, von Haeseler A, Strimmer K: TREEFINDER: a powerful graphicalanalysis environment for molecular phylogenetics. BMC Evol Biol 2004,4:18, doi:10.1186/1471-2148-4-18.
106. Nei M: Molecular evolutionary genetics New York: Columbia University Press1987.
Saitoh et al. BMC Evolutionary Biology 2010, 10:35http://www.biomedcentral.com/1471-2148/10/35
Page 12 of 13

107. Tajima F: The amount of DNA polymorphism maintained in a finitepopulation when the neutral mutation rate varies among sites. Genetics1996, 143:1457-1465.
108. Slatkin M: A measure of population Subdivision based on microsatelliteallele frequencies. Genetics 1995, 139:457-462.
109. Excoffier L, Smouse PE, Quattro JM: Analysis of molecular varianceinferred from metric distances among DNA haplotypes: application tohuman mitochondrial DNA restriction data. Genetics 1992, 131:479-491.
110. Excoffier L, Laval G, Schneider S: Arlequin ver. 3.0: An integrated softwarepackage for population genetics data analysis. Evol Bioinform Online 2005,1:47-50.
doi:10.1186/1471-2148-10-35Cite this article as: Saitoh et al.: Old divergences in a boreal birdsupports long-term survival through the Ice Ages. BMC EvolutionaryBiology 2010 10:35.
Submit your next manuscript to BioMed Centraland take full advantage of:
• Convenient online submission
• Thorough peer review
• No space constraints or color figure charges
• Immediate publication on acceptance
• Inclusion in PubMed, CAS, Scopus and Google Scholar
• Research which is freely available for redistribution
Submit your manuscript at www.biomedcentral.com/submit
Saitoh et al. BMC Evolutionary Biology 2010, 10:35http://www.biomedcentral.com/1471-2148/10/35
Page 13 of 13
Related Documents


