Olanzapine, but not aripiprazole, weight-independently elevates serum triglycerides and activates lipogenic gene expression in female rats Silje Skrede 1,2 , Johan Fernø 1,2 ,Marı´a Jesu ´ s Va ´zquez 3,4 , Sveinung Fjær 5 , Tina Pavlin 6 , Niclas Lunder 7 , Antonio Vidal-Puig 8 , Carlos Die ´guez 3,4 , Rolf Kristian Berge 9 , Miguel Lo ´pez 3,4 and Vidar Martin Steen 1,2 1 Dr. Einar Martens’ Research Group for Biological Psychiatry, Department of Clinical Medicine, University of Bergen, Norway 2 Center for Medical Genetics and Molecular Medicine, Haukeland University Hospital, Bergen, Norway 3 Department of Physiology, School of Medicine, University of Santiago de Compostela-Instituto de Investigacio ´n Sanitaria (IDIS), Santiago de Compostela, Spain 4 CIBER Fisiopatologı ´a de la Obesidad y Nutricio ´n (CIBERobn), Santiago de Compostela, Spain 5 The Norwegian Multiple Sclerosis Competence Centre, Department of Neurology, Haukeland University Hospital, Bergen, Norway 6 Molecular Imaging Center, Department of Biomedicine, University of Bergen, Bergen, Norway 7 Department of Psychopharmacology, Diakonhjemmet Hospital, Oslo, Norway 8 Institute of Metabolic Science, Metabolic Research Laboratories, University of Cambridge, Addenbrooke’s Hospital, Cambridge, UK 9 The Lipid Research Group, Section of Medical Biochemistry, Institute of Medicine, University of Bergen, Norway Abstract Metabolic adverse effects such as weight gain and dyslipidaemia represent a major concern in treatment with several antipsychotic drugs, including olanzapine. It remains unclear whether such metabolic side-effects fully depend on appetite-stimulating actions, or whether some dysmetabolic features induced by antipsychotics may arise through direct perturbation of metabolic pathways in relevant peripheral tissues. Recent clinical and preclinical studies indicate that dyslipidaemia could occur independently of weight gain. Using a rat model, we showed that subchronic treatment with olanzapine induces weight gain and increases adipose tissue mass in rats with free access to food. This effect was also observed for aripiprazole, considered metabolically neutral in the clinical setting. In pair-fed rats with limited food access, neither olanzapine nor aripiprazole induced weight gain. Interestingly, olanzapine, but not aripiprazole, induced weight-independent elevation of serum triglycerides, accompanied by up- regulation of several genes involved in lipid biosynthesis, both in liver and in adipose tissues. Our findings support the existence of tissue-specific, weight-independent direct effects of olanzapine on lipid metabolism. Received 13 December 2010 ; Reviewed 10 February 2011 ; Revised 9 July 2011 ; Accepted 11 July 2011 ; First published online 19 August 2011 Key words : Antipsychotics, gene expression, rat, SREBP, triglycerides, weight gain. Introduction Life expectancy for schizophrenia patients is greatly reduced compared to that of the general population (Tiihonen et al. 2009), with increased risk of somatic conditions such as cardiovascular disease (CVD) largely accounting for the mortality gap (Colton & Manderscheid, 2006). Treatment with certain atypical antipsychotic drugs, most notably clozapine and olanzapine, has consistently been shown to increase the risk of obesity, dyslipidaemia, and type 2 diabetes (Allison et al. 1999 ; American Diabetes Association, 2004 ; Henderson, 2001), all established CVD risk fac- tors (Despres et al. 2008). Some newly introduced atypical antipsychotics, such as aripiprazole, are Address for correspondence : Professor V. M. Steen, Center for Medical Genetics and Molecular Medicine, Laboratory Building, Haukeland University Hospital, 5021 Bergen, Norway. Tel. : +4755975425 Fax : +4754977878 Email : [email protected] International Journal of Neuropsychopharmacology (2012), 15, 163–179. f CINP 2011 doi:10.1017/S1461145711001271 ARTICLE THEMATIC SECTION Eating Disorders and Obesity

Welcome message from author
This document is posted to help you gain knowledge. Please leave a comment to let me know what you think about it! Share it to your friends and learn new things together.
Transcript
Olanzapine, but not aripiprazole,weight-independently elevates serumtriglycerides and activates lipogenic geneexpression in female rats
Silje Skrede1,2, Johan Fernø1,2, Marıa Jesus Vazquez3,4, Sveinung Fjær5, Tina Pavlin6,
Niclas Lunder7, Antonio Vidal-Puig8, Carlos Dieguez3,4, Rolf Kristian Berge9,
Miguel Lopez3,4 and Vidar Martin Steen1,2
1 Dr. Einar Martens’ Research Group for Biological Psychiatry, Department of Clinical Medicine, University of Bergen, Norway2 Center for Medical Genetics and Molecular Medicine, Haukeland University Hospital, Bergen, Norway3 Department of Physiology, School of Medicine, University of Santiago de Compostela-Instituto de Investigacion Sanitaria (IDIS),
Santiago de Compostela, Spain4 CIBER Fisiopatologıa de la Obesidad y Nutricion (CIBERobn), Santiago de Compostela, Spain5 The Norwegian Multiple Sclerosis Competence Centre, Department of Neurology, Haukeland University Hospital, Bergen,
Norway6 Molecular Imaging Center, Department of Biomedicine, University of Bergen, Bergen, Norway7 Department of Psychopharmacology, Diakonhjemmet Hospital, Oslo, Norway8 Institute of Metabolic Science, Metabolic Research Laboratories, University of Cambridge, Addenbrooke’s Hospital, Cambridge, UK9 The Lipid Research Group, Section of Medical Biochemistry, Institute of Medicine, University of Bergen, Norway
Abstract
Metabolic adverse effects such as weight gain and dyslipidaemia represent a major concern in treatment
with several antipsychotic drugs, including olanzapine. It remains unclear whether such metabolic
side-effects fully depend on appetite-stimulating actions, or whether some dysmetabolic features induced
by antipsychotics may arise through direct perturbation of metabolic pathways in relevant peripheral
tissues. Recent clinical and preclinical studies indicate that dyslipidaemia could occur independently of
weight gain. Using a rat model, we showed that subchronic treatment with olanzapine induces weight
gain and increases adipose tissue mass in rats with free access to food. This effect was also observed
for aripiprazole, considered metabolically neutral in the clinical setting. In pair-fed rats with limited
food access, neither olanzapine nor aripiprazole induced weight gain. Interestingly, olanzapine, but
not aripiprazole, induced weight-independent elevation of serum triglycerides, accompanied by up-
regulation of several genes involved in lipid biosynthesis, both in liver and in adipose tissues. Our
findings support the existence of tissue-specific, weight-independent direct effects of olanzapine on lipid
metabolism.
Received 13 December 2010 ; Reviewed 10 February 2011 ; Revised 9 July 2011 ; Accepted 11 July 2011 ;
First published online 19 August 2011
Key words : Antipsychotics, gene expression, rat, SREBP, triglycerides, weight gain.
Introduction
Life expectancy for schizophrenia patients is greatly
reduced compared to that of the general population
(Tiihonen et al. 2009), with increased risk of somatic
conditions such as cardiovascular disease (CVD)
largely accounting for the mortality gap (Colton &
Manderscheid, 2006). Treatment with certain atypical
antipsychotic drugs, most notably clozapine and
olanzapine, has consistently been shown to increase
the risk of obesity, dyslipidaemia, and type 2 diabetes
(Allison et al. 1999; American Diabetes Association,
2004 ; Henderson, 2001), all established CVD risk fac-
tors (Despres et al. 2008). Some newly introduced
atypical antipsychotics, such as aripiprazole, are
Address for correspondence : Professor V. M. Steen, Center for
Medical Genetics and Molecular Medicine, Laboratory Building,
Haukeland University Hospital, 5021 Bergen, Norway.
Tel. : +4755975425 Fax : +4754977878
Email : [email protected]
International Journal of Neuropsychopharmacology (2012), 15, 163–179. f CINP 2011doi:10.1017/S1461145711001271
ARTICLE
THEMATIC SECTIONEating Disorders andObesity
associated with much lower risk of metabolic adverse
effects than olanzapine and clozapine (Leucht et al.
2009; Newcomer et al. 2008; Stip & Tourjman, 2010).
In fact, add-on treatment of aripiprazole in patients
treated with olanzapine reduced body weight and
improved serum lipid profiles (Henderson et al. 2009).
The widespread use of metabolically unfavourable
antipsychotics in clinical practice may be explained
by superior symptom-relieving effects (Essali et al.
2009; Komossa et al. 2010; Lieberman et al. 2005).
Interestingly, the occurrence of weight gain and
hypertriglyceridaemia has been suggested to predict
superior clinical improvement of schizophrenia symp-
toms in some studies (Ascher-Svanum et al. 2005;
Bai et al. 2006; Procyshyn et al. 2007). Insight into
the molecular basis of the complex balance between
therapeutic efficacy and adverse effects may pave the
way for improved drug therapy in schizophrenia.
Antipsychotic-induced weight gain probably rep-
resents a major risk factor for dyslipidaemia in
patients. However, increased serum triglycerides
and other metabolic derangements have been dem-
onstrated to occur independently of weight gain for
both clozapine and olanzapine (Birkenaes et al. 2008;
Meyer, 2002 ; Procyshyn et al. 2007), suggesting that
molecular mechanisms distinct from those causing
hyperphagia and weight gain may underlie some of
the metabolic disturbances associated with atypical
antipsychotic agents. The nature of these mechanisms
remains to be established. We have previously dem-
onstrated that in cultured cells, several antipsychotic
drugs, among them clozapine and olanzapine, activate
lipogenic gene expression controlled by sterol regu-
latory element-binding protein (SREBP) transcription
factors (Ferno et al. 2005, 2006). These lipid-stimulating
effects, suggested as being relevant for some of the
metabolic disturbances associated with antipsychotic
drug treatment (Ferno et al. 2005; Raeder et al. 2006),
have later been confirmed by others (Lauressergues
et al. 2010; Yang et al. 2007). Two SREBP isoforms exist,
with SREBP1 mainly regulating fatty-acid synthesis,
and SREBP2 controlling genes involved in cholesterol
biosynthesis and transport (Shimano, 2001).
Molecular studies in psychotic patients spur ethical
and practical challenges, and reliable preclinical
models are therefore essential in psychopharmacolo-
gical research (Boyda et al. 2010). In rats, olanzapine
frequently mimics the metabolic disturbances ob-
served in humans, with increased adiposity consist-
ently reported in both female and male rats (Albaugh
et al. 2006; Minet-Ringuet et al. 2006a). However,
olanzapine-induced hyperphagia and weight gain are
extensively documented only in female rodents, with
less robust effects observed in male rats (Cooper et al.
2005, 2007 ; Minet-Ringuet et al. 2006a, b). Olanzapine-
induced effects on serum lipids in rats are equivocal
(Albaugh et al. 2006; Boyda et al. 2010; Kalinichev et al.
2005). With respect to aripiprazole, data on metabolic
disturbances in rats are so far ambiguous (Han et al.
2008; Kalinichev et al. 2005).
In the present study, two subsequent, partially
overlapping experiments were performed. In expt I,
we investigated the effect of olanzapine and
aripiprazole on body-weight gain and serum lipids
in rats. In order to investigate potential weight-
independent dyslipidaemic effects of the obesogenic
drug olanzapine, a group of rats with food restricted
to the level of vehicle-treated rats (pair-fed) was in-
cluded. Expt II was a follow-up study, focusing on
weight-independent effects of both olanzapine and
aripiprazole. We compared the effects of olanzapine
and aripiprazole on a number of lipid parameters
and on lipogenic gene transcription across several
metabolically active tissues.
Materials and methods
Drugs
Olanzapine and aripiprazole were suspended in 4%
carboxymethyl cellulose (CMC). Care was taken to
protect the drugs from light exposure. Plasma levels
of antipsychotic drugs were determined by means of
liquid chromatography/mass spectrometry [see Sup-
plementary materials and methods (available online)
for a detailed description].
Animals and treatment schemes
All experiments were performed in accordance with
the guidelines of the Norwegian Committee for
Experiments on Animals. Rats were kept under stan-
dard conditions with an artificial 12-h light/dark cycle
(lights on 07:00 hours) under constant 48% humidity.
Ad libitum-fed rats were allowed free access to stan-
dard laboratory chow during the experimental period,
while pair-fed rats received an amount of food cor-
responding to that consumed by the control group
during the previous 24 h. Rats were allowed free
access to tap water. This study consists of two sub-
sequent independent biological experiments. In the
inital experiment (expt I), we investigated the effect of
olanzapine and aripiprazole on body-weight gain and
serum lipids in female Sprague–Dawley rats weighing
(mean¡S.D.) 261¡12 g on the first day of treatment
and housed n=3 per cage. We chose to house rats
164 S. Skrede et al.
together in order to reduce stress, which could poten-
tially influence food intake. The following treatment
groups were included (n=9) : vehicle, olanzapine
ad libitum-fed, olanzapine pair-fed, aripiprazole ad
libitum-fed. Each animal, and chow in each cage, was
weighed daily, and average daily food intake for each
animal was calculated. Vehicle or antipsychotic drug
was administered by gavage twice daily (08:00–09:00
and 14:00–15:00 hours), with total daily dosage
of 6 mg/kg olanzapine or aripiprazole split into
two separate administrations (administration volume
2 ml/kg). A second experiment (expt II)was performed
in order to follow-up on the weight-independent
effects in expt I, focusing both on olanzapine and
aripiprazole. In expt II we also aimed to investigate the
effect of antipsychotic drug treatment on white adi-
pose tissue (WAT) mass, using both dissection ofWAT
depots and MRI. Expt II was identical to expt I, with a
few important exceptions : rats (n=10) were housed
individually, and an aripiprazole pair-fed treatment
group was included.
The duration of drug exposure was 13 d, and ani-
mals were sacrificed on day 14. The last drug dose
prior to sacrifice was administered 18–23 h prior to
decapitation. All animals were fasted from 21:00 hours
on the day prior to sacrifice, with dissection starting
at 09:00 hours the following day. Animals were
anaesthetized using isoflurane prior to decapitation.
Trunk blood was collected in pre-cooled tubes, left at
4 xC for 25–30 min and centrifuged at 4 xC for 10 min
(3000 g) to extract serum. Samples from other tissues
were frozen in liquid nitrogen immediately after
dissection. Tissue samples were stored at x80 xC
until analysis, whereas serum samples were kept at
x20 xC.
Ethics statement
The animal experiments described in this article were
approved by Norwegian Committee for Experiments
on Animals (Forsøksdyrutvalget, FDU), and were
performed in accordance with the Norwegian Animal
Welfare Act and international guidelines. Care was
taken to minimize the suffering of animals at all stages
of the experiments.
Behavioural analysis
Possible sedative effects of olanzapine and
aripiprazole were assessed in expt I. The number of
seconds spent on grooming, rearing, sitting/standing
or smaller movements was manually quantified dur-
ing 180 s of recorded film by an experienced animal
technician.
Serum glucose and lipid measurements and
fatty-acid composition analysis
The levels of glucose, triglycerides, phospholipids,
and cholesterol in serum and liver were measured
enzymatically on the Hitachi 917 system (Roche
Diagnostics, Germany) using glucose (Gluco-quant),
triglyceride (GPO-PAP) and cholesterol (CHOD-PAP)
kits (Roche Diagnostics) and a phospholipid kit
(DiaSys Diagnostic Systems, Germany). Serum and
liver lipids were extracted according to the method of
Bligh and Dyer (Bligh & Dyer, 1959), evaporated
under N2 and re-dissolved in isopropanol before
analysis. Serum lipid composition was analysed
by gas–liquid chromatography (see Supplementary
materials and methods for detailed description).
Serum insulin, leptin and adiponectin measurements
Truncal vein blood was collected in precooled
tubes, left on ice for 30 min and centrifuged at
3000 g for 10 min. Serumwas transferred to pre-cooled
Eppendorf tubes immediately after centrifugation
and stored atx20 xC. Serum insulin, leptin and adipo-
nectin levels were assessed as previously described
(Caminos et al. 2005).
Sample preparation, RNA extraction cDNA
synthesis and real-time PCR
Tissue samples (y20 mg of liver tissue or y100 mg of
adipose tissue) were homogenized using a TissueLyser
(Qiagen, USA). RNA extraction and cDNA synthesis
were performed as previously described (Ferno
et al. 2009). Primers (Table 1) were designed using
PrimerExpress (Applied Biosystems, USA) or Primer3
(Rozen& Skaletsky, 2000). The relative gene expression
levels were determined by means of the comparative
DCt method. In liver samples, the expression of target
genes was normalized relative to the endogenous
control ribosomal protein, large, P0 (Rplp0), while
genes run inWATwere normalized against both Rplp0
and b-actin (Actb) ; results are presented as fold changes
normalized against P0.
Immunoblotting
Tissue samples (100 mg liver tissue, 250 mg adipose
tissue) were homogenized in lysis buffer and cen-
trifuged at 12 000 g for 10 min at 4 xC (Lopez et al.
2010). Thirty mg total protein from each sample was
separated on NuPAGE 4–12% Bis-Tris Gels using
SDS buffer and blotted onto InvitrolonTM PVDF
membranes. PVDF membranes were blocked with
5% BSA in TBST prior to incubation with primary
Olanzapine-induced lipogenic activation in rat 165
antibody at 4 xC overnight or at room temperature
(RT) for 1 h, followed by incubation with secondary
antibody at RT for 1 h. The primary antibodies used
were : ACC1: 04-322 (Millipore, USA) ; a-tubulin :
T5168 (Sigma Aldrich, USA); FAS: SC20140 (Santa
Cruz, USA) ; SREBP1 (recognizing both SREBP1a and
x1c isoforms) : SC8984 (Santa Cruz). Signal intensity
measurements were performed using the ImageJ soft-
ware (National Institutes of Health, USA).
Quantification of adipose tissue
In order to investigate whether weight gain correlates
with increased WAT mass, we ran a separate exper-
iment (expt II) using two alternative methods to com-
pare the weights of dissected adipose tissue depots by
the end of the treatment period with semi-quantitative
MRI measurements of the changes in pararenal adi-
pose tissue volumes during treatment. Following 13 d
of drug treatment, animals were sacrificed on day 14
after overnight fasting, with immediate dissection of
mesenteric, retroperitoneal, pararenal, and para-
metrial (periovarian) adipose tissue depots, which
were weighed separately. Animals were subject toMRI
scans on treatment daysx1 (the day prior to initiation
of treatment) and day 13 (the day prior to sacrifice).
MRI images were acquired using a 7-T horizontal
bore magnet (Pharmascan 70/16, Bruker BioSpin,
Germany) operating at 300 MHz, using protocols de-
scribed in detail in the Supplementary materials and
methods section. An estimate of the relative change in
pararenal fat volume was made using a robust
thresholding scheme on the MR images, as described
in Supplementary materials and methods. In short, an
estimated change in adipose tissue volume during
the treatment period was calculated by summing up
voxels containing fat signals in selected slices with
visible kidney tissue, as the kidneys represent reliable
anatomical landmarks, and substracting the number
of fat-containing voxels on the day prior to treatment
initiation from the number of fat-containing voxels on
the day prior to sacrifice.
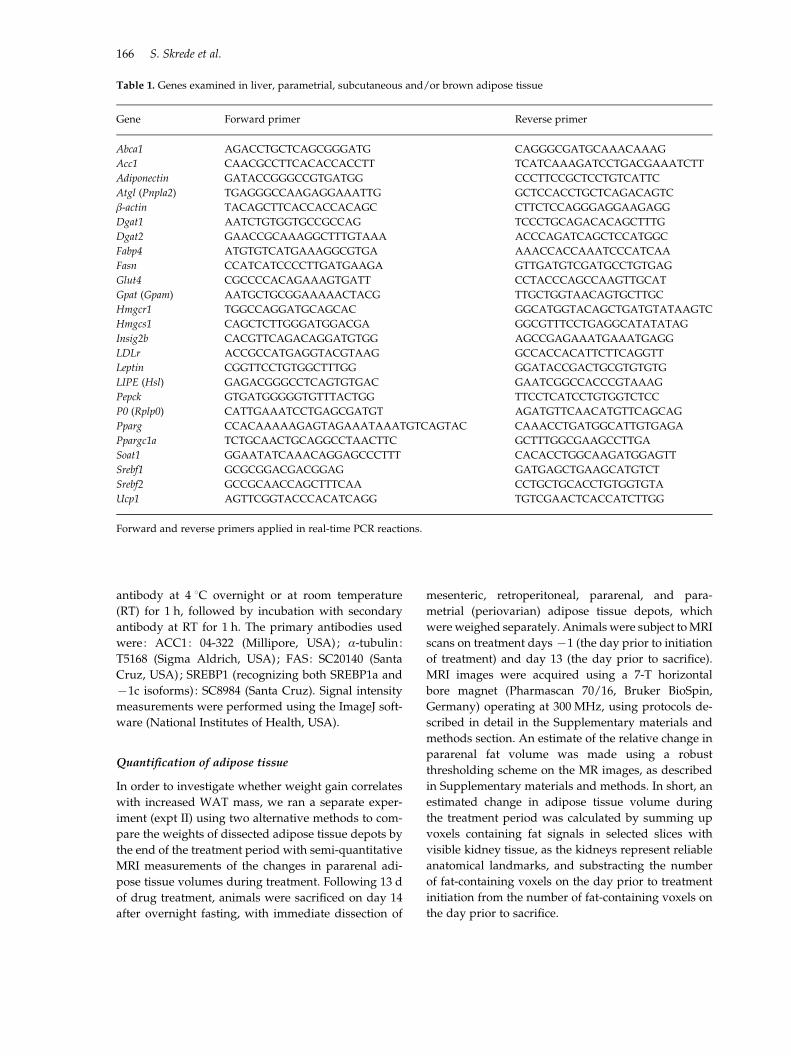
Table 1. Genes examined in liver, parametrial, subcutaneous and/or brown adipose tissue
Gene Forward primer Reverse primer
Abca1 AGACCTGCTCAGCGGGATG CAGGGCGATGCAAACAAAG
Acc1 CAACGCCTTCACACCACCTT TCATCAAAGATCCTGACGAAATCTT
Adiponectin GATACCGGGCCGTGATGG CCCTTCCGCTCCTGTCATTC
Atgl (Pnpla2) TGAGGGCCAAGAGGAAATTG GCTCCACCTGCTCAGACAGTC
b-actin TACAGCTTCACCACCACAGC CTTCTCCAGGGAGGAAGAGG
Dgat1 AATCTGTGGTGCCGCCAG TCCCTGCAGACACAGCTTTG
Dgat2 GAACCGCAAAGGCTTTGTAAA ACCCAGATCAGCTCCATGGC
Fabp4 ATGTGTCATGAAAGGCGTGA AAACCACCAAATCCCATCAA
Fasn CCATCATCCCCTTGATGAAGA GTTGATGTCGATGCCTGTGAG
Glut4 CGCCCCACAGAAAGTGATT CCTACCCAGCCAAGTTGCAT
Gpat (Gpam) AATGCTGCGGAAAAACTACG TTGCTGGTAACAGTGCTTGC
Hmgcr1 TGGCCAGGATGCAGCAC GGCATGGTACAGCTGATGTATAAGTC
Hmgcs1 CAGCTCTTGGGATGGACGA GGCGTTTCCTGAGGCATATATAG
Insig2b CACGTTCAGACAGGATGTGG AGCCGAGAAATGAAATGAGG
LDLr ACCGCCATGAGGTACGTAAG GCCACCACATTCTTCAGGTT
Leptin CGGTTCCTGTGGCTTTGG GGATACCGACTGCGTGTGTG
LIPE (Hsl) GAGACGGGCCTCAGTGTGAC GAATCGGCCACCCGTAAAG
Pepck GTGATGGGGGTGTTTACTGG TTCCTCATCCTGTGGTCTCC
P0 (Rplp0) CATTGAAATCCTGAGCGATGT AGATGTTCAACATGTTCAGCAG
Pparg CCACAAAAAGAGTAGAAATAAATGTCAGTAC CAAACCTGATGGCATTGTGAGA
Ppargc1a TCTGCAACTGCAGGCCTAACTTC GCTTTGGCGAAGCCTTGA
Soat1 GGAATATCAAACAGGAGCCCTTT CACACCTGGCAAGATGGAGTT
Srebf1 GCGCGGACGACGGAG GATGAGCTGAAGCATGTCT
Srebf2 GCCGCAACCAGCTTTCAA CCTGCTGCACCTGTGGTGTA
Ucp1 AGTTCGGTACCCACATCAGG TGTCGAACTCACCATCTTGG
Forward and reverse primers applied in real-time PCR reactions.
166 S. Skrede et al.
Statistical analysis
Data are expressed as mean¡S.E.M. Food intake was
analysed by repeated-measures two-way ANOVAs,
with treatment as between-subject variable and time
as within-subject variable in both experiments. Body
weight changes were analysed using the same
method. In expt I, four treatment groups were in-
cluded (control, olanzapine ad libitum-fed, olanzapine
pair-fed, aripiprazole ad libitum-fed), whereas expt II
contained five treatment groups, as an aripiprazole
pair-fed group was added. One-way ANOVA fol-
lowed by Tukey’s post-hoc test or Student’s t test was
used to analyse statistical significance for each time-
point. Pearson’s bivariate correlation analysis was
used in order to examine correlations between various
metabolic parameters as described below. For all other
comparisons, we used two-sided Student’s t test.
p values <0.05 were considered statistically sig-
nificant. All tests were conducted with PASW
Statistics version 18 (PASW Statistics ; SPSS Inc., USA)
software.
Results
Serum levels of antipsychotics correspond
with a short half-life
The average serum concentration of olanzapine
(mean¡S.D.) at the time of sacrifice (18–23 h after
last dose) was very low both in the olanzapine ad
libitum-fed group (average+S.D.) (0.27¡0.10 nM) and
in the olanzapine pair-fed group (0.80¡0.57 nM).
Serum aripiprazole levels were also negligible (0.23¡
0.17 nM).
Olanzapine and aripiprazole induce hyperphagia
and body-weight gain
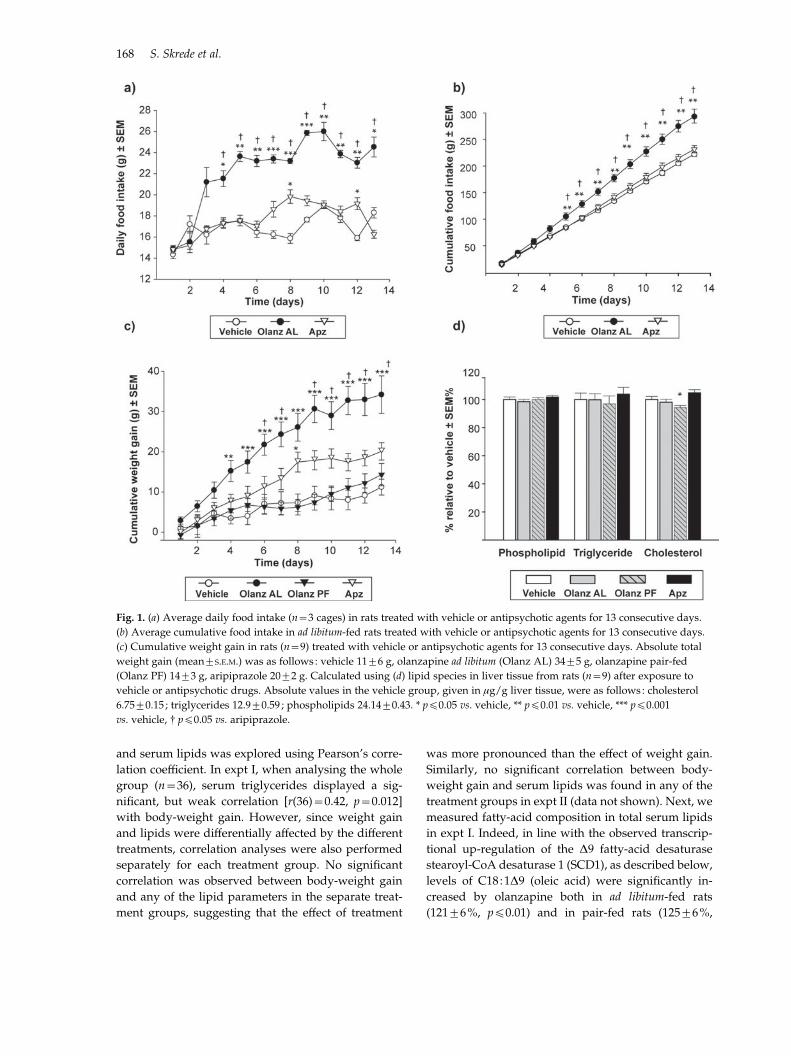
Initially (expt I), we investigated how 13 d treatment
with olanzapine or aripirazole affected daily food
intake (Fig. 1a), cumulative food intake (Fig. 1b) and
weight gain (Fig. 1c) in female rats. In order to inves-
tigate any potential hyperphagia-independent effects
of the well established obesogenic drug olanzapine,
we included an olanzapine pair-fed group, with
food intake identical to the level consumed by vehicle-
treated rats. Repeated-measures two-way ANOVA
was performed for average daily food intake (from
n=3 rats per cage) with treatment and time as factors.
A statistically significant main effect on food intake
for treatment was evident [F(2, 6)=21.91, p<0.01].
A Tukey’s HSD post-hoc test revealed that both
olanzapine and aripiprazole induced significantly
different food intake from vehicle-treated controls.
Similarly, cumulative body-weight gain was analysed
using a repeated-measures two-way ANOVA with
time and treatment as factors. Significant main effects
[F(3, 32)=12.01, p<0.001] and significant treatmentrtime interaction effects [F(48, 133)=2.37, p<0.001]
were observed. Statistically significant differences be-
tween the drugs for each time-point was determined
by one-way ANOVA analysis followed by Tukey’s
post-hoc test, as indicated in Fig. 1c. In expt II, we
focused on weight-independent effects of both olan-
zapine and aripiprazole. With respect to food intake
(measured for each rat individually), a significant
main effect was observed for treatment [F(2, 27)=16.31, p<0.001] and a trend towards significance was
observed for the timertreatment interaction effect
[F(24, 32)=1.645, p=0.1] (Supplementary Fig. S1a).
In line with elevated food intake, cumulative body-
weight gain was increased, with a significant main
effect of treatment [F(4, 45)=20.03, p<0.001] and sig-
nificant treatmentrtime interaction effect [F(36, 62)=3.59, p<0.001]. In expt II, weight gain in the
aripiprazole ad libitum-fed group was more pro-
nounced than in expt I (Supplementary Fig. S1b),
whereas no weight gain was observed in the aripi-
prazole pair-fed group. Of note, one-way ANOVA
followed by Tukey’s post-hoc test revealed significantly
reduced body weight in the olanzapine pair-fed group
relative to the control (pf0.05) and aripiprazole pair-
fed (pf0.01) groups.
Olanzapine, but not aripiprazole, induces weight-
independent elevation in serum triglyceride levels
Interestingly, olanzapine significantly elevated fasting
serum triglyceride levels both in ad libitum-fed rats
that gained weight (mean¡S.E.M., relative to vehicle,
129¡10%, pf0.05) and in pair-fed rats that did not
(126¡7%, pf0.05), while no such changes were in-
duced by aripiprazole, despite the increased weight
gain (Fig. 2a). Other serum lipids were unaffected by
olanzapine exposure, whereas aripiprazole slightly
reduced serum cholesterol and phospholipid levels
relative to controls (Fig. 2a and Table 2). Similarly, in
expt II olanzapine induced significantly elevated
serum triglyceride levels in the ad libitum-fed group
(166¡9%, pf0.001) and a trend towards increased
serum triglyceride levels (126¡12%, p=0.09) in pair-
fed rats, despite marked weight loss in this treatment
group. In contrast, no significant change in serum tri-
glycerides was evident following aripiprazole treat-
ment, neither in ad libitum-fed (114¡13%, p=0.37) nor
in pair-fed (101¡8%, p=0.91) rats (Supplementary
Fig. S2). The relationship between body-weight gain
Olanzapine-induced lipogenic activation in rat 167
and serum lipids was explored using Pearson’s corre-
lation coefficient. In expt I, when analysing the whole
group (n=36), serum triglycerides displayed a sig-
nificant, but weak correlation [r(36)=0.42, p=0.012]
with body-weight gain. However, since weight gain
and lipids were differentially affected by the different
treatments, correlation analyses were also performed
separately for each treatment group. No significant
correlation was observed between body-weight gain
and any of the lipid parameters in the separate treat-
ment groups, suggesting that the effect of treatment
was more pronounced than the effect of weight gain.
Similarly, no significant correlation between body-
weight gain and serum lipids was found in any of the
treatment groups in expt II (data not shown). Next, we
measured fatty-acid composition in total serum lipids
in expt I. Indeed, in line with the observed transcrip-
tional up-regulation of the D9 fatty-acid desaturase
stearoyl-CoA desaturase 1 (SCD1), as described below,
levels of C18:1D9 (oleic acid) were significantly in-
creased by olanzapine both in ad libitum-fed rats
(121¡6%, pf0.01) and in pair-fed rats (125¡6%,
Fig. 1. (a) Average daily food intake (n=3 cages) in rats treated with vehicle or antipsychotic agents for 13 consecutive days.
(b) Average cumulative food intake in ad libitum-fed rats treated with vehicle or antipsychotic agents for 13 consecutive days.
(c) Cumulative weight gain in rats (n=9) treated with vehicle or antipsychotic agents for 13 consecutive days. Absolute total
weight gain (mean¡S.E.M.) was as follows : vehicle 11¡6 g, olanzapine ad libitum (Olanz AL) 34¡5 g, olanzapine pair-fed
(Olanz PF) 14¡3 g, aripiprazole 20¡2 g. Calculated using (d) lipid species in liver tissue from rats (n=9) after exposure to
vehicle or antipsychotic drugs. Absolute values in the vehicle group, given in mg/g liver tissue, were as follows : cholesterol
6.75¡0.15 ; triglycerides 12.9¡0.59 ; phospholipids 24.14¡0.43. * pf0.05 vs. vehicle, ** pf0.01 vs. vehicle, *** pf0.001
vs. vehicle, # pf0.05 vs. aripiprazole.
168 S. Skrede et al.
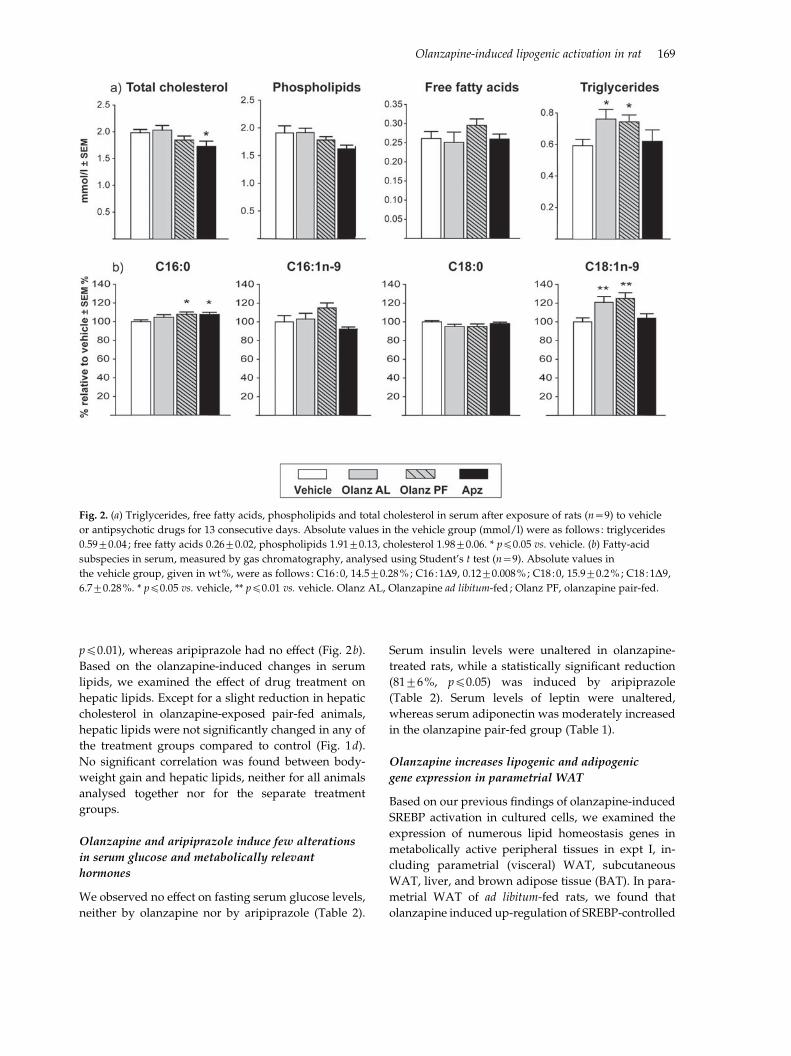
pf0.01), whereas aripiprazole had no effect (Fig. 2b).
Based on the olanzapine-induced changes in serum
lipids, we examined the effect of drug treatment on
hepatic lipids. Except for a slight reduction in hepatic
cholesterol in olanzapine-exposed pair-fed animals,
hepatic lipids were not significantly changed in any of
the treatment groups compared to control (Fig. 1d).
No significant correlation was found between body-
weight gain and hepatic lipids, neither for all animals
analysed together nor for the separate treatment
groups.
Olanzapine and aripiprazole induce few alterations
in serum glucose and metabolically relevant
hormones
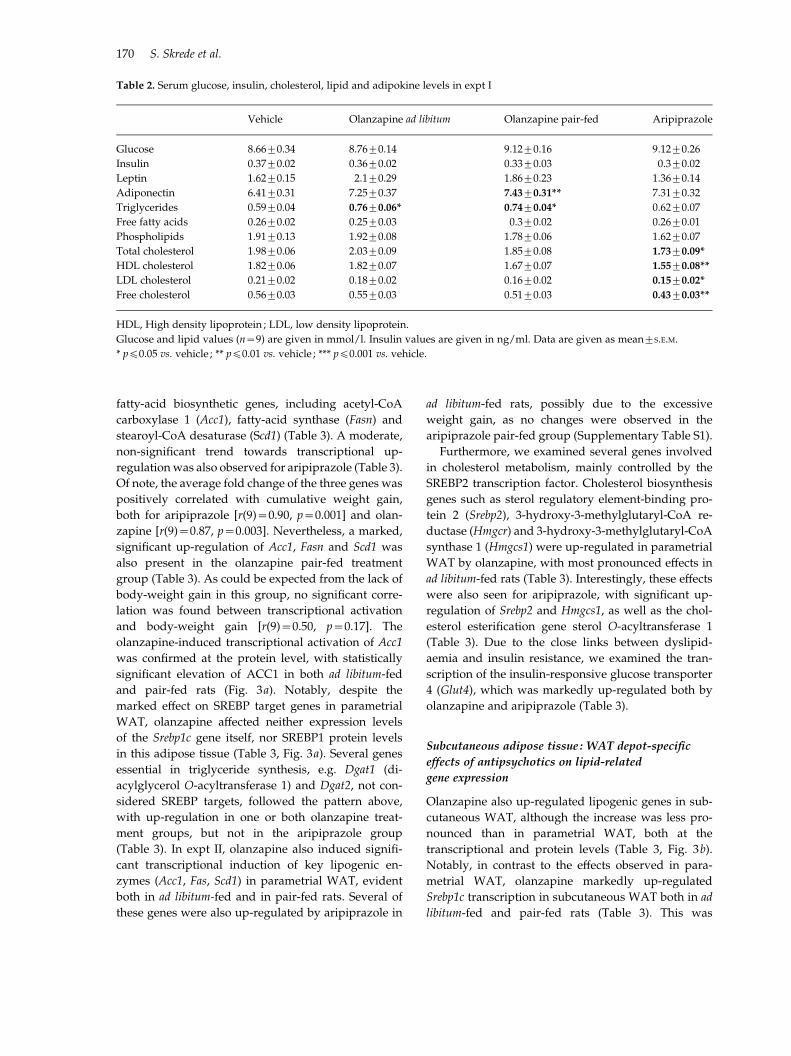
We observed no effect on fasting serum glucose levels,
neither by olanzapine nor by aripiprazole (Table 2).
Serum insulin levels were unaltered in olanzapine-
treated rats, while a statistically significant reduction
(81¡6%, pf0.05) was induced by aripiprazole
(Table 2). Serum levels of leptin were unaltered,
whereas serum adiponectin was moderately increased
in the olanzapine pair-fed group (Table 1).
Olanzapine increases lipogenic and adipogenic
gene expression in parametrial WAT
Based on our previous findings of olanzapine-induced
SREBP activation in cultured cells, we examined the
expression of numerous lipid homeostasis genes in
metabolically active peripheral tissues in expt I, in-
cluding parametrial (visceral) WAT, subcutaneous
WAT, liver, and brown adipose tissue (BAT). In para-
metrial WAT of ad libitum-fed rats, we found that
olanzapine induced up-regulation of SREBP-controlled
Fig. 2. (a) Triglycerides, free fatty acids, phospholipids and total cholesterol in serum after exposure of rats (n=9) to vehicle
or antipsychotic drugs for 13 consecutive days. Absolute values in the vehicle group (mmol/l) were as follows: triglycerides
0.59¡0.04 ; free fatty acids 0.26¡0.02, phospholipids 1.91¡0.13, cholesterol 1.98¡0.06. * pf0.05 vs. vehicle. (b) Fatty-acid
subspecies in serum, measured by gas chromatography, analysed using Student’s t test (n=9). Absolute values in
the vehicle group, given in wt%, were as follows : C16 :0, 14.5¡0.28%; C16 :1D9, 0.12¡0.008%; C18 :0, 15.9¡0.2%; C18 :1D9,
6.7¡0.28%. * pf0.05 vs. vehicle, ** pf0.01 vs. vehicle. Olanz AL, Olanzapine ad libitum-fed ; Olanz PF, olanzapine pair-fed.
Olanzapine-induced lipogenic activation in rat 169
fatty-acid biosynthetic genes, including acetyl-CoA
carboxylase 1 (Acc1), fatty-acid synthase (Fasn) and
stearoyl-CoA desaturase (Scd1) (Table 3). A moderate,
non-significant trend towards transcriptional up-
regulationwas also observed for aripiprazole (Table 3).
Of note, the average fold change of the three genes was
positively correlated with cumulative weight gain,
both for aripiprazole [r(9)=0.90, p=0.001] and olan-
zapine [r(9)=0.87, p=0.003]. Nevertheless, a marked,
significant up-regulation of Acc1, Fasn and Scd1 was
also present in the olanzapine pair-fed treatment
group (Table 3). As could be expected from the lack of
body-weight gain in this group, no significant corre-
lation was found between transcriptional activation
and body-weight gain [r(9)=0.50, p=0.17]. The
olanzapine-induced transcriptional activation of Acc1
was confirmed at the protein level, with statistically
significant elevation of ACC1 in both ad libitum-fed
and pair-fed rats (Fig. 3a). Notably, despite the
marked effect on SREBP target genes in parametrial
WAT, olanzapine affected neither expression levels
of the Srebp1c gene itself, nor SREBP1 protein levels
in this adipose tissue (Table 3, Fig. 3a). Several genes
essential in triglyceride synthesis, e.g. Dgat1 (di-
acylglycerol O-acyltransferase 1) and Dgat2, not con-
sidered SREBP targets, followed the pattern above,
with up-regulation in one or both olanzapine treat-
ment groups, but not in the aripiprazole group
(Table 3). In expt II, olanzapine also induced signifi-
cant transcriptional induction of key lipogenic en-
zymes (Acc1, Fas, Scd1) in parametrial WAT, evident
both in ad libitum-fed and in pair-fed rats. Several of
these genes were also up-regulated by aripiprazole in
ad libitum-fed rats, possibly due to the excessive
weight gain, as no changes were observed in the
aripiprazole pair-fed group (Supplementary Table S1).
Furthermore, we examined several genes involved
in cholesterol metabolism, mainly controlled by the
SREBP2 transcription factor. Cholesterol biosynthesis
genes such as sterol regulatory element-binding pro-
tein 2 (Srebp2), 3-hydroxy-3-methylglutaryl-CoA re-
ductase (Hmgcr) and 3-hydroxy-3-methylglutaryl-CoA
synthase 1 (Hmgcs1) were up-regulated in parametrial
WAT by olanzapine, with most pronounced effects in
ad libitum-fed rats (Table 3). Interestingly, these effects
were also seen for aripiprazole, with significant up-
regulation of Srebp2 and Hmgcs1, as well as the chol-
esterol esterification gene sterol O-acyltransferase 1
(Table 3). Due to the close links between dyslipid-
aemia and insulin resistance, we examined the tran-
scription of the insulin-responsive glucose transporter
4 (Glut4), which was markedly up-regulated both by
olanzapine and aripiprazole (Table 3).
Subcutaneous adipose tissue : WAT depot-specific
effects of antipsychotics on lipid-related
gene expression
Olanzapine also up-regulated lipogenic genes in sub-
cutaneous WAT, although the increase was less pro-
nounced than in parametrial WAT, both at the
transcriptional and protein levels (Table 3, Fig. 3b).
Notably, in contrast to the effects observed in para-
metrial WAT, olanzapine markedly up-regulated
Srebp1c transcription in subcutaneous WAT both in ad
libitum-fed and pair-fed rats (Table 3). This was
Table 2. Serum glucose, insulin, cholesterol, lipid and adipokine levels in expt I
Vehicle Olanzapine ad libitum Olanzapine pair-fed Aripiprazole
Glucose 8.66¡0.34 8.76¡0.14 9.12¡0.16 9.12¡0.26
Insulin 0.37¡0.02 0.36¡0.02 0.33¡0.03 0.3¡0.02
Leptin 1.62¡0.15 2.1¡0.29 1.86¡0.23 1.36¡0.14
Adiponectin 6.41¡0.31 7.25¡0.37 7.43¡0.31** 7.31¡0.32
Triglycerides 0.59¡0.04 0.76¡0.06* 0.74¡0.04* 0.62¡0.07
Free fatty acids 0.26¡0.02 0.25¡0.03 0.3¡0.02 0.26¡0.01
Phospholipids 1.91¡0.13 1.92¡0.08 1.78¡0.06 1.62¡0.07
Total cholesterol 1.98¡0.06 2.03¡0.09 1.85¡0.08 1.73¡0.09*
HDL cholesterol 1.82¡0.06 1.82¡0.07 1.67¡0.07 1.55¡0.08**
LDL cholesterol 0.21¡0.02 0.18¡0.02 0.16¡0.02 0.15¡0.02*
Free cholesterol 0.56¡0.03 0.55¡0.03 0.51¡0.03 0.43¡0.03**
HDL, High density lipoprotein ; LDL, low density lipoprotein.
Glucose and lipid values (n=9) are given in mmol/l. Insulin values are given in ng/ml. Data are given as mean¡S.E.M.
* pf0.05 vs. vehicle ; ** pf0.01 vs. vehicle ; *** pf0.001 vs. vehicle.
170 S. Skrede et al.
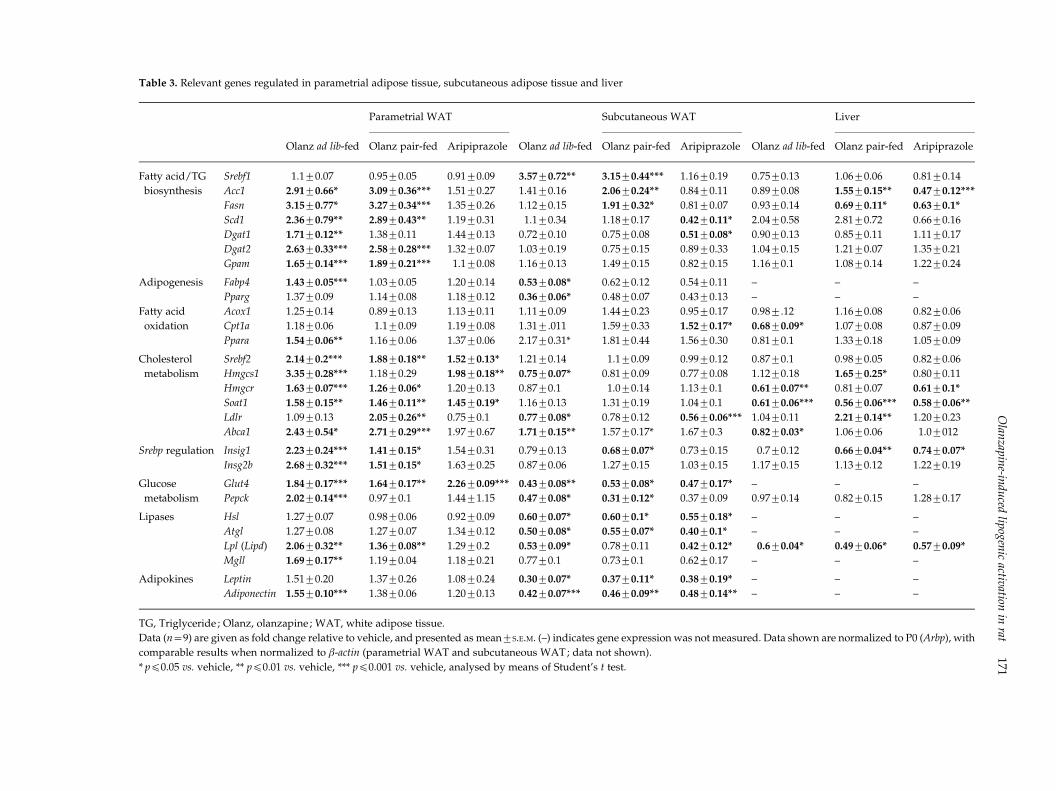
Table 3. Relevant genes regulated in parametrial adipose tissue, subcutaneous adipose tissue and liver
Olanz ad lib-fed
Parametrial WAT
Olanz ad lib-fed
Subcutaneous WAT
Olanz ad lib-fed
Liver
Olanz pair-fed Aripiprazole Olanz pair-fed Aripiprazole Olanz pair-fed Aripiprazole
Fatty acid/TG
biosynthesis
Srebf1 1.1¡0.07 0.95¡0.05 0.91¡0.09 3.57¡0.72** 3.15¡0.44*** 1.16¡0.19 0.75¡0.13 1.06¡0.06 0.81¡0.14
Acc1 2.91¡0.66* 3.09¡0.36*** 1.51¡0.27 1.41¡0.16 2.06¡0.24** 0.84¡0.11 0.89¡0.08 1.55¡0.15** 0.47¡0.12***
Fasn 3.15¡0.77* 3.27¡0.34*** 1.35¡0.26 1.12¡0.15 1.91¡0.32* 0.81¡0.07 0.93¡0.14 0.69¡0.11* 0.63¡0.1*
Scd1 2.36¡0.79** 2.89¡0.43** 1.19¡0.31 1.1¡0.34 1.18¡0.17 0.42¡0.11* 2.04¡0.58 2.81¡0.72 0.66¡0.16
Dgat1 1.71¡0.12** 1.38¡0.11 1.44¡0.13 0.72¡0.10 0.75¡0.08 0.51¡0.08* 0.90¡0.13 0.85¡0.11 1.11¡0.17
Dgat2 2.63¡0.33*** 2.58¡0.28*** 1.32¡0.07 1.03¡0.19 0.75¡0.15 0.89¡0.33 1.04¡0.15 1.21¡0.07 1.35¡0.21
Gpam 1.65¡0.14*** 1.89¡0.21*** 1.1¡0.08 1.16¡0.13 1.49¡0.15 0.82¡0.15 1.16¡0.1 1.08¡0.14 1.22¡0.24
Adipogenesis Fabp4 1.43¡0.05*** 1.03¡0.05 1.20¡0.14 0.53¡0.08* 0.62¡0.12 0.54¡0.11 – – –
Pparg 1.37¡0.09 1.14¡0.08 1.18¡0.12 0.36¡0.06* 0.48¡0.07 0.43¡0.13 – – –
Fatty acid
oxidation
Acox1 1.25¡0.14 0.89¡0.13 1.13¡0.11 1.11¡0.09 1.44¡0.23 0.95¡0.17 0.98¡.12 1.16¡0.08 0.82¡0.06
Cpt1a 1.18¡0.06 1.1¡0.09 1.19¡0.08 1.31¡.011 1.59¡0.33 1.52¡0.17* 0.68¡0.09* 1.07¡0.08 0.87¡0.09
Ppara 1.54¡0.06** 1.16¡0.06 1.37¡0.06 2.17¡0.31* 1.81¡0.44 1.56¡0.30 0.81¡0.1 1.33¡0.18 1.05¡0.09
Cholesterol
metabolism
Srebf2 2.14¡0.2*** 1.88¡0.18** 1.52¡0.13* 1.21¡0.14 1.1¡0.09 0.99¡0.12 0.87¡0.1 0.98¡0.05 0.82¡0.06
Hmgcs1 3.35¡0.28*** 1.18¡0.29 1.98¡0.18** 0.75¡0.07* 0.81¡0.09 0.77¡0.08 1.12¡0.18 1.65¡0.25* 0.80¡0.11
Hmgcr 1.63¡0.07*** 1.26¡0.06* 1.20¡0.13 0.87¡0.1 1.0¡0.14 1.13¡0.1 0.61¡0.07** 0.81¡0.07 0.61¡0.1*
Soat1 1.58¡0.15** 1.46¡0.11** 1.45¡0.19* 1.16¡0.13 1.31¡0.19 1.04¡0.1 0.61¡0.06*** 0.56¡0.06*** 0.58¡0.06**
Ldlr 1.09¡0.13 2.05¡0.26** 0.75¡0.1 0.77¡0.08* 0.78¡0.12 0.56¡0.06*** 1.04¡0.11 2.21¡0.14** 1.20¡0.23
Abca1 2.43¡0.54* 2.71¡0.29*** 1.97¡0.67 1.71¡0.15** 1.57¡0.17* 1.67¡0.3 0.82¡0.03* 1.06¡0.06 1.0¡012
Srebp regulation Insig1 2.23¡0.24*** 1.41¡0.15* 1.54¡0.31 0.79¡0.13 0.68¡0.07* 0.73¡0.15 0.7¡0.12 0.66¡0.04** 0.74¡0.07*
Insg2b 2.68¡0.32*** 1.51¡0.15* 1.63¡0.25 0.87¡0.06 1.27¡0.15 1.03¡0.15 1.17¡0.15 1.13¡0.12 1.22¡0.19
Glucose
metabolism
Glut4 1.84¡0.17*** 1.64¡0.17** 2.26¡0.09*** 0.43¡0.08** 0.53¡0.08* 0.47¡0.17* – – –
Pepck 2.02¡0.14*** 0.97¡0.1 1.44¡1.15 0.47¡0.08* 0.31¡0.12* 0.37¡0.09 0.97¡0.14 0.82¡0.15 1.28¡0.17
Lipases Hsl 1.27¡0.07 0.98¡0.06 0.92¡0.09 0.60¡0.07* 0.60¡0.1* 0.55¡0.18* – – –
Atgl 1.27¡0.08 1.27¡0.07 1.34¡0.12 0.50¡0.08* 0.55¡0.07* 0.40¡0.1* – – –
Lpl (Lipd) 2.06¡0.32** 1.36¡0.08** 1.29¡0.2 0.53¡0.09* 0.78¡0.11 0.42¡0.12* 0.6¡0.04* 0.49¡0.06* 0.57¡0.09*
Mgll 1.69¡0.17** 1.19¡0.04 1.18¡0.21 0.77¡0.1 0.73¡0.1 0.62¡0.17 – – –
Adipokines Leptin 1.51¡0.20 1.37¡0.26 1.08¡0.24 0.30¡0.07* 0.37¡0.11* 0.38¡0.19* – – –
Adiponectin 1.55¡0.10*** 1.38¡0.06 1.20¡0.13 0.42¡0.07*** 0.46¡0.09** 0.48¡0.14** – – –
TG, Triglyceride ; Olanz, olanzapine ; WAT, white adipose tissue.
Data (n=9) are given as fold change relative to vehicle, and presented as mean¡S.E.M. (–) indicates gene expression was not measured. Data shown are normalized to P0 (Arbp), with
comparable results when normalized to b-actin (parametrial WAT and subcutaneous WAT; data not shown).
* pf0.05 vs. vehicle, ** pf0.01 vs. vehicle, *** pf0.001 vs. vehicle, analysed by means of Student’s t test.
Olan
zapine-in
duced
lipogenicactivation
inrat
171
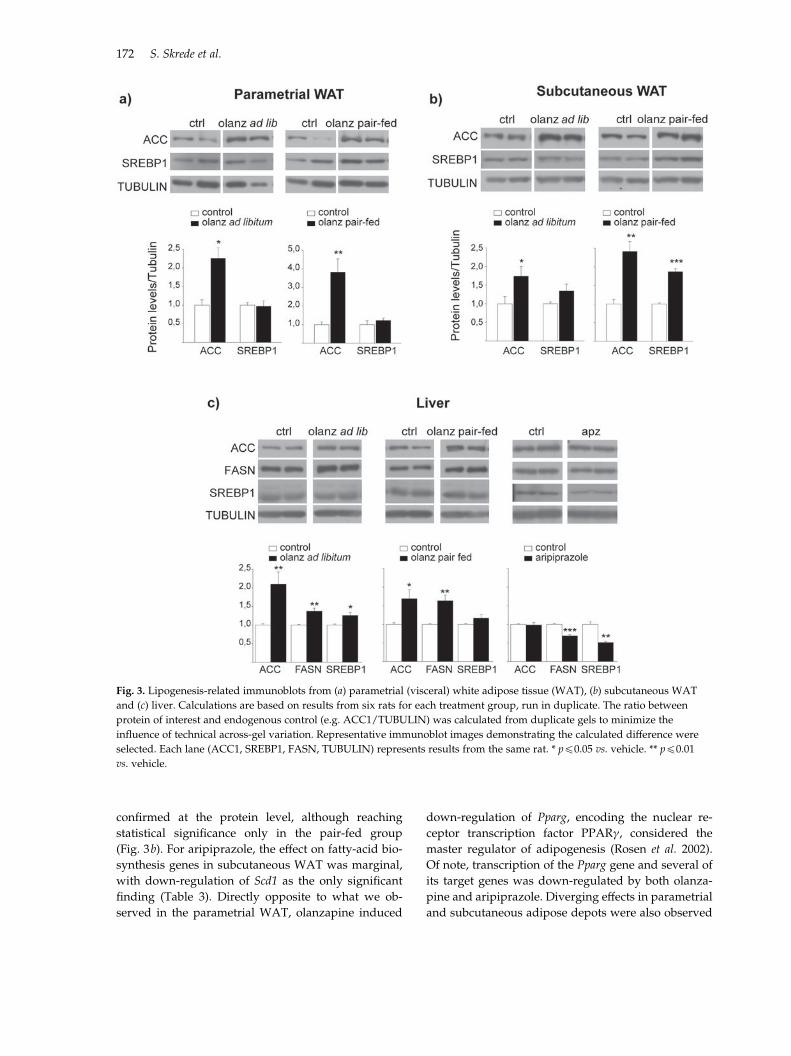
confirmed at the protein level, although reaching
statistical significance only in the pair-fed group
(Fig. 3b). For aripiprazole, the effect on fatty-acid bio-
synthesis genes in subcutaneous WAT was marginal,
with down-regulation of Scd1 as the only significant
finding (Table 3). Directly opposite to what we ob-
served in the parametrial WAT, olanzapine induced
down-regulation of Pparg, encoding the nuclear re-
ceptor transcription factor PPARc, considered the
master regulator of adipogenesis (Rosen et al. 2002).
Of note, transcription of the Pparg gene and several of
its target genes was down-regulated by both olanza-
pine and aripiprazole. Diverging effects in parametrial
and subcutaneous adipose depots were also observed
Fig. 3. Lipogenesis-related immunoblots from (a) parametrial (visceral) white adipose tissue (WAT), (b) subcutaneous WAT
and (c) liver. Calculations are based on results from six rats for each treatment group, run in duplicate. The ratio between
protein of interest and endogenous control (e.g. ACC1/TUBULIN) was calculated from duplicate gels to minimize the
influence of technical across-gel variation. Representative immunoblot images demonstrating the calculated difference were
selected. Each lane (ACC1, SREBP1, FASN, TUBULIN) represents results from the same rat. * pf0.05 vs. vehicle. ** pf0.01
vs. vehicle.
172 S. Skrede et al.
for Glut4, as well as for genes encoding lipases
and adipokines, which were down-regulated in sub-
cutaneous WAT both by olanzapine and aripiprazole
(Table 3).
Antipsychotic drugs induce minor effects on hepatic
lipid-related gene expression
In the liver, normally representing the primary site of
lipogenesis, the effects of olanzapine on the expression
of fatty-acid and cholesterol metabolism genes were
subtle (Table 3). Still, Western blots demonstrated
that ACC1 and FASN protein levels were significantly
elevated by olanzapine both in ad libitum-fed and
in pair-fed rats, with a similar trend for the SREBP1
protein (Fig. 3c). Aripiprazole, on the other hand, sig-
nificantly reduced FASN and SREBP1 protein levels
(Fig. 3c, Table 3).
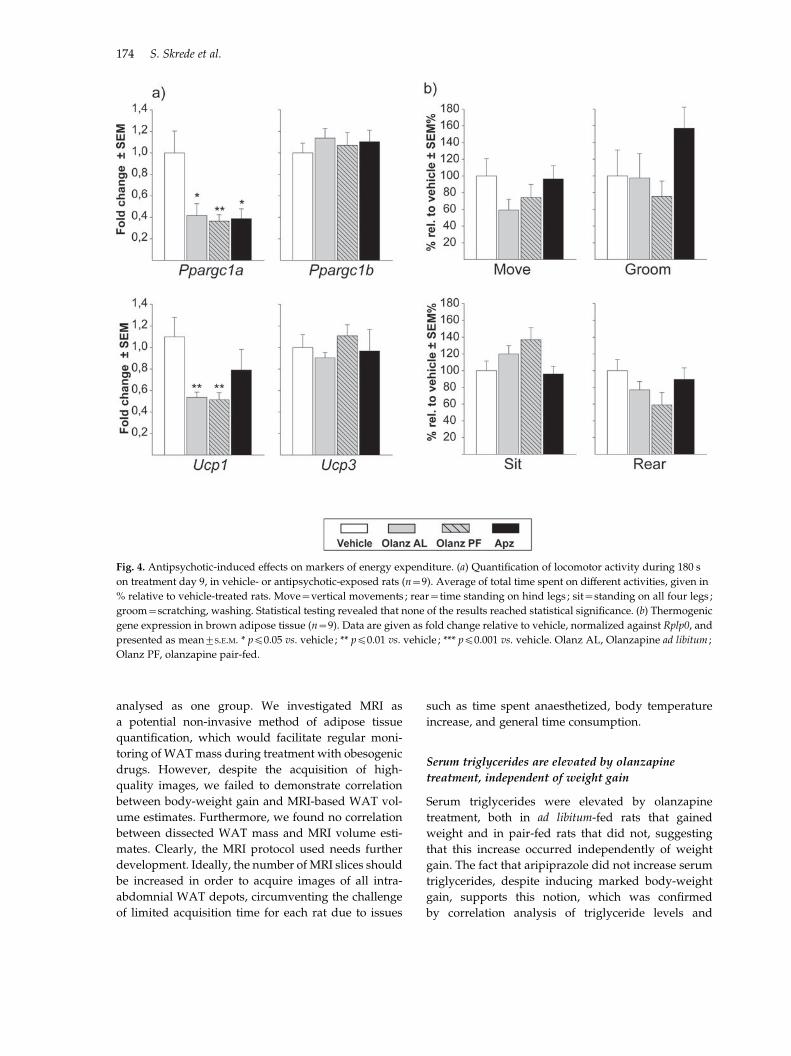
The effect of antipsychotic drugs on thermogenic
markers in BAT
In our study we found that antipsychotic-induced
weight gain was related to increased food intake.
However, reduced energy expenditure in BAT has
also been suggested to be involved in antipsychotic-
induced weight gain, and we therefore examined
the expression levels of thermogenic markers in BAT.
We found that olanzapine markedly decreased the
expression of genes encoding the thermogenic
markers uncoupling protein 1 (Ucp1) and peroxisome
proliferator-activated receptor gamma, co-activator 1
alpha (Ppargc1a) in BAT, evident both in ad libitum-fed
and in pair-fed rats (Fig. 4a). Aripiprazole did not
significantly alter the expression of Ucp1, whereas
reduced expression levels of Pparg1a were observed
(0.41¡0.09, pf0.05) (Fig. 4a). Sedation, a recognized
adverse effect of antipsychotic agents, could also de-
crease energy output. However, evaluating four dif-
ferent measures of locomotor activity, no statistically
significant changes were found relative to vehicle-
exposed rats (Fig. 4b).
Weight gain is related to increased adipose
tissue mass
In order to investigate whether antipsychotic-induced
weight gain is constituted by increased adipose tissue
mass and whether the lipogenic effects of olanzapine
could increase adipose mass independently of weight
gain, a separate experiment (expt II) was set up,
in which both a non-invasive MRI technique and
weighing of fat after dissection were employed (Fig. 5,
Table 4). Correlation analysis yielded a positive
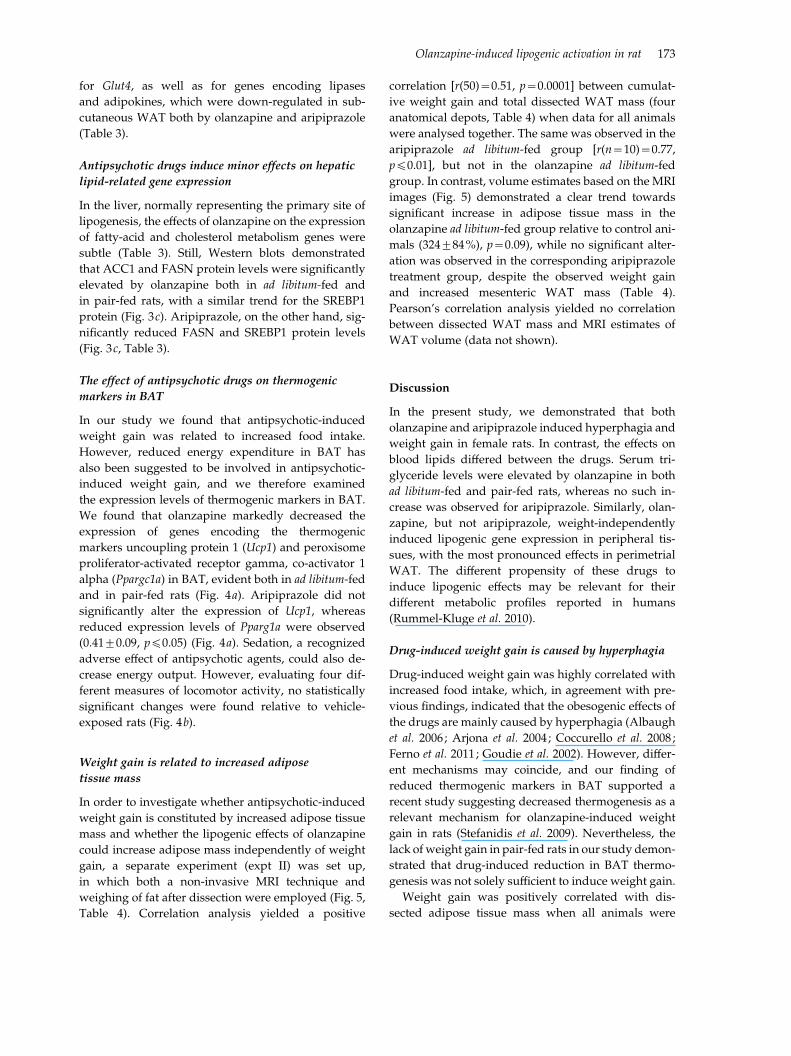
correlation [r(50)=0.51, p=0.0001] between cumulat-
ive weight gain and total dissected WAT mass (four
anatomical depots, Table 4) when data for all animals
were analysed together. The same was observed in the
aripiprazole ad libitum-fed group [r(n=10)=0.77,
pf0.01], but not in the olanzapine ad libitum-fed
group. In contrast, volume estimates based on the MRI
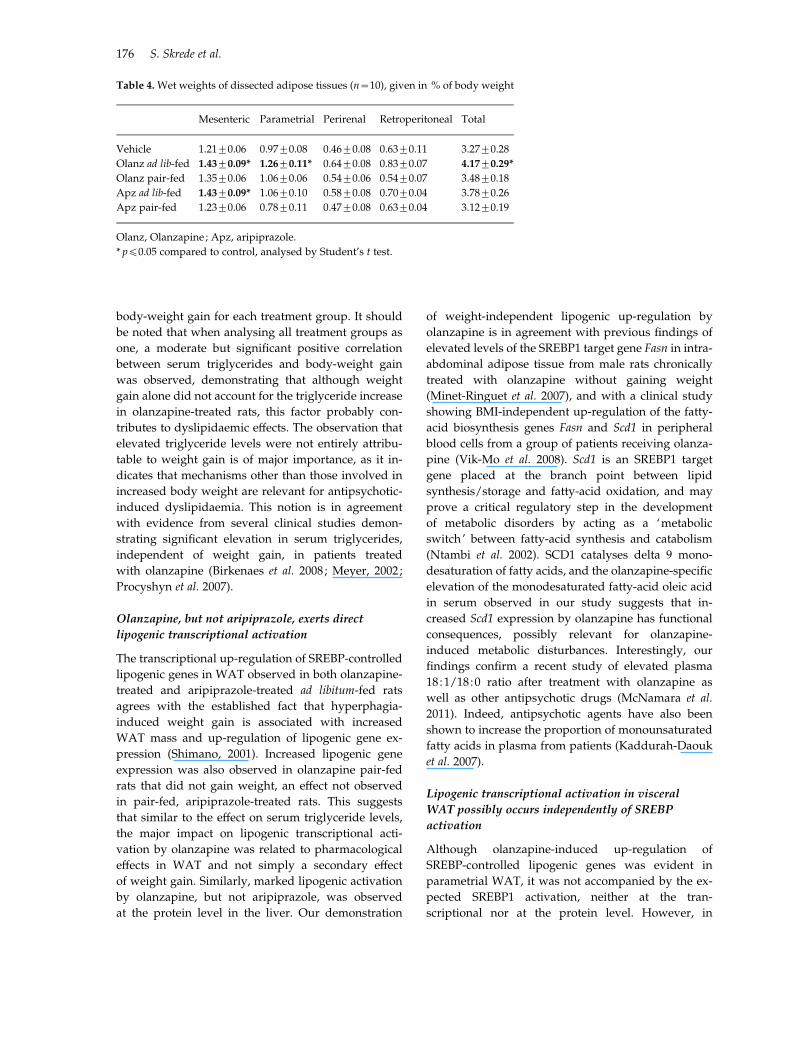
images (Fig. 5) demonstrated a clear trend towards
significant increase in adipose tissue mass in the
olanzapine ad libitum-fed group relative to control ani-
mals (324¡84%), p=0.09), while no significant alter-
ation was observed in the corresponding aripiprazole
treatment group, despite the observed weight gain
and increased mesenteric WAT mass (Table 4).
Pearson’s correlation analysis yielded no correlation
between dissected WAT mass and MRI estimates of
WAT volume (data not shown).
Discussion
In the present study, we demonstrated that both
olanzapine and aripiprazole induced hyperphagia and
weight gain in female rats. In contrast, the effects on
blood lipids differed between the drugs. Serum tri-
glyceride levels were elevated by olanzapine in both
ad libitum-fed and pair-fed rats, whereas no such in-
crease was observed for aripiprazole. Similarly, olan-
zapine, but not aripiprazole, weight-independently
induced lipogenic gene expression in peripheral tis-
sues, with the most pronounced effects in perimetrial
WAT. The different propensity of these drugs to
induce lipogenic effects may be relevant for their
different metabolic profiles reported in humans
(Rummel-Kluge et al. 2010).
Drug-induced weight gain is caused by hyperphagia
Drug-induced weight gain was highly correlated with
increased food intake, which, in agreement with pre-
vious findings, indicated that the obesogenic effects of
the drugs are mainly caused by hyperphagia (Albaugh
et al. 2006; Arjona et al. 2004; Coccurello et al. 2008;
Ferno et al. 2011; Goudie et al. 2002). However, differ-
ent mechanisms may coincide, and our finding of
reduced thermogenic markers in BAT supported a
recent study suggesting decreased thermogenesis as a
relevant mechanism for olanzapine-induced weight
gain in rats (Stefanidis et al. 2009). Nevertheless, the
lack of weight gain in pair-fed rats in our study demon-
strated that drug-induced reduction in BAT thermo-
genesis was not solely sufficient to induce weight gain.
Weight gain was positively correlated with dis-
sected adipose tissue mass when all animals were
Olanzapine-induced lipogenic activation in rat 173
analysed as one group. We investigated MRI as
a potential non-invasive method of adipose tissue
quantification, which would facilitate regular moni-
toring of WATmass during treatment with obesogenic
drugs. However, despite the acquisition of high-
quality images, we failed to demonstrate correlation
between body-weight gain and MRI-based WAT vol-
ume estimates. Furthermore, we found no correlation
between dissected WAT mass and MRI volume esti-
mates. Clearly, the MRI protocol used needs further
development. Ideally, the number of MRI slices should
be increased in order to acquire images of all intra-
abdomnial WAT depots, circumventing the challenge
of limited acquisition time for each rat due to issues
such as time spent anaesthetized, body temperature
increase, and general time consumption.
Serum triglycerides are elevated by olanzapine
treatment, independent of weight gain
Serum triglycerides were elevated by olanzapine
treatment, both in ad libitum-fed rats that gained
weight and in pair-fed rats that did not, suggesting
that this increase occurred independently of weight
gain. The fact that aripiprazole did not increase serum
triglycerides, despite inducing marked body-weight
gain, supports this notion, which was confirmed
by correlation analysis of triglyceride levels and
Fig. 4. Antipsychotic-induced effects on markers of energy expenditure. (a) Quantification of locomotor activity during 180 s
on treatment day 9, in vehicle- or antipsychotic-exposed rats (n=9). Average of total time spent on different activities, given in
% relative to vehicle-treated rats. Move=vertical movements ; rear=time standing on hind legs ; sit=standing on all four legs ;
groom=scratching, washing. Statistical testing revealed that none of the results reached statistical significance. (b) Thermogenic
gene expression in brown adipose tissue (n=9). Data are given as fold change relative to vehicle, normalized against Rplp0, and
presented as mean¡S.E.M. * pf0.05 vs. vehicle ; ** pf0.01 vs. vehicle ; *** pf0.001 vs. vehicle. Olanz AL, Olanzapine ad libitum ;
Olanz PF, olanzapine pair-fed.
174 S. Skrede et al.
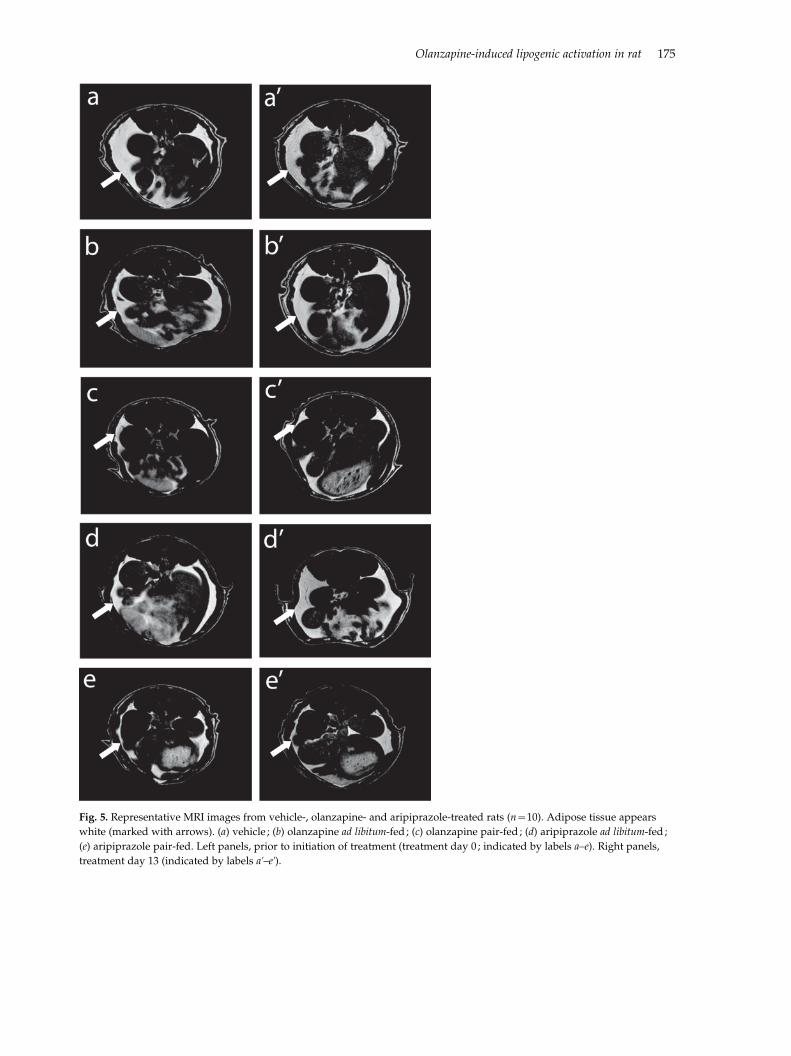
Fig. 5. Representative MRI images from vehicle-, olanzapine- and aripiprazole-treated rats (n=10). Adipose tissue appears
white (marked with arrows). (a) vehicle ; (b) olanzapine ad libitum-fed ; (c) olanzapine pair-fed ; (d) aripiprazole ad libitum-fed ;
(e) aripiprazole pair-fed. Left panels, prior to initiation of treatment (treatment day 0 ; indicated by labels a–e). Right panels,
treatment day 13 (indicated by labels ak–ek).
Olanzapine-induced lipogenic activation in rat 175
body-weight gain for each treatment group. It should
be noted that when analysing all treatment groups as
one, a moderate but significant positive correlation
between serum triglycerides and body-weight gain
was observed, demonstrating that although weight
gain alone did not account for the triglyceride increase
in olanzapine-treated rats, this factor probably con-
tributes to dyslipidaemic effects. The observation that
elevated triglyceride levels were not entirely attribu-
table to weight gain is of major importance, as it in-
dicates that mechanisms other than those involved in
increased body weight are relevant for antipsychotic-
induced dyslipidaemia. This notion is in agreement
with evidence from several clinical studies demon-
strating significant elevation in serum triglycerides,
independent of weight gain, in patients treated
with olanzapine (Birkenaes et al. 2008; Meyer, 2002;
Procyshyn et al. 2007).
Olanzapine, but not aripiprazole, exerts direct
lipogenic transcriptional activation
The transcriptional up-regulation of SREBP-controlled
lipogenic genes in WAT observed in both olanzapine-
treated and aripiprazole-treated ad libitum-fed rats
agrees with the established fact that hyperphagia-
induced weight gain is associated with increased
WAT mass and up-regulation of lipogenic gene ex-
pression (Shimano, 2001). Increased lipogenic gene
expression was also observed in olanzapine pair-fed
rats that did not gain weight, an effect not observed
in pair-fed, aripiprazole-treated rats. This suggests
that similar to the effect on serum triglyceride levels,
the major impact on lipogenic transcriptional acti-
vation by olanzapine was related to pharmacological
effects in WAT and not simply a secondary effect
of weight gain. Similarly, marked lipogenic activation
by olanzapine, but not aripiprazole, was observed
at the protein level in the liver. Our demonstration
of weight-independent lipogenic up-regulation by
olanzapine is in agreement with previous findings of
elevated levels of the SREBP1 target gene Fasn in intra-
abdominal adipose tissue from male rats chronically
treated with olanzapine without gaining weight
(Minet-Ringuet et al. 2007), and with a clinical study
showing BMI-independent up-regulation of the fatty-
acid biosynthesis genes Fasn and Scd1 in peripheral
blood cells from a group of patients receiving olanza-
pine (Vik-Mo et al. 2008). Scd1 is an SREBP1 target
gene placed at the branch point between lipid
synthesis/storage and fatty-acid oxidation, and may
prove a critical regulatory step in the development
of metabolic disorders by acting as a ‘metabolic
switch’ between fatty-acid synthesis and catabolism
(Ntambi et al. 2002). SCD1 catalyses delta 9 mono-
desaturation of fatty acids, and the olanzapine-specific
elevation of the monodesaturated fatty-acid oleic acid
in serum observed in our study suggests that in-
creased Scd1 expression by olanzapine has functional
consequences, possibly relevant for olanzapine-
induced metabolic disturbances. Interestingly, our
findings confirm a recent study of elevated plasma
18:1/18:0 ratio after treatment with olanzapine as
well as other antipsychotic drugs (McNamara et al.
2011). Indeed, antipsychotic agents have also been
shown to increase the proportion of monounsaturated
fatty acids in plasma from patients (Kaddurah-Daouk
et al. 2007).
Lipogenic transcriptional activation in visceral
WAT possibly occurs independently of SREBP
activation
Although olanzapine-induced up-regulation of
SREBP-controlled lipogenic genes was evident in
parametrial WAT, it was not accompanied by the ex-
pected SREBP1 activation, neither at the tran-
scriptional nor at the protein level. However, in
Table 4. Wet weights of dissected adipose tissues (n=10), given in % of body weight
Mesenteric Parametrial Perirenal Retroperitoneal Total
Vehicle 1.21¡0.06 0.97¡0.08 0.46¡0.08 0.63¡0.11 3.27¡0.28
Olanz ad lib-fed 1.43¡0.09* 1.26¡0.11* 0.64¡0.08 0.83¡0.07 4.17¡0.29*
Olanz pair-fed 1.35¡0.06 1.06¡0.06 0.54¡0.06 0.54¡0.07 3.48¡0.18
Apz ad lib-fed 1.43¡0.09* 1.06¡0.10 0.58¡0.08 0.70¡0.04 3.78¡0.26
Apz pair-fed 1.23¡0.06 0.78¡0.11 0.47¡0.08 0.63¡0.04 3.12¡0.19
Olanz, Olanzapine; Apz, aripiprazole.
* pf0.05 compared to control, analysed by Student’s t test.
176 S. Skrede et al.
subcutaneous WAT, with only moderate elevation of
lipogenic SREBP1-controlled gene expression, we ob-
served a striking elevation of Srebp1c expression and
SREBP1 protein levels. These seemingly paradoxical
findings may be explained by the fact that fatty-acid
biosynthesis in adipose tissue is not exclusively con-
trolled by SREBP1 (Sekiya et al. 2007). In fact, it has
been demonstrated that WAT-specific transgenic
overexpression of Srebp1c reduced fat accumulation in
mice, with concomitant down-regulation of PPARc-
controlled genes involved in adipocyte differentiation
(Shimomura et al. 1998), a state resembling the anti-
psychotic-induced effects observed in subcutaneous
WAT in our study. PPARc agonists, such as thioglita-
zones, have been used to treat metabolic disturbances
in patients (Festuccia et al. 2009). Thus it is tempting
to speculate that PPARc antagonistic effect of
antipsychotic drugs could represent a molecular
mechanism involved in their associated metabolic
dysfunction, including glucose dysregulation. We
found few alterations in fasting glucose and insulin
levels, but studies employing clamping techniques
have demonstrated antipsychotic-induced glucose
dysregulation (Albaugh et al. 2010; Chintoh et al. 2009).
It should be noted that marked down-regulation of
PPARc target genes was observed both in rats treated
with olanzapine and in rats treated with aripiprazole,
and thus the apparent PPARc antagonistic effect does
not offer a straightforward explanation for the anti-
psychotic-induced metabolic disturbances observed in
the clinical setting.
In summary, we have demonstrated that both
olanzapine and aripiprazole induce significant weight
gain in female rats, attributable mainly to hyper-
phagia. Interestingly, olanzapine elevated serum tri-
glycerides independently of weight gain, an effect that
was not observed for aripiprazole. The concurrent
olanzapine-induced up-regulation of lipogenic gene
expression in adipose tissues implied a potential
mechanism of antipsychotic-induced dyslipidaemia,
possibly involving the SREBP transcription system.
We also showed that olanzapine appears to exert
PPARc antagonistic effects in subcutaneous WAT, a
property shared by aripiprazole. Further studies are
required in order to elucidate the role of these effects
in the development of metabolic dysfunction in
patients.
Note
Supplementary material accompanies this paper on
the Journal’s website (http://journals.cambridge.org/
pnp).
Acknowledgements
We greatly appreciate the excellent technical assist-
ance from Marianne S. Nævdal, Liv Kristine Øysæd,
Kari Williams, Pavol Bohov, Kari H. Mortensen, and
Cecilie Brekke Rygh. We acknowledge the research
infrastructure provided by the Norwegian Microarray
Consortium (NMC; www.microarray.no), a national
FUGE technology platform (Functional Genomics in
Norway; www.fuge.no), by the Molecular Imaging
Center (MIC), Department of Biomedicine, University
of Bergen, and by the laboratory animal facility
(Vivarium), University of Bergen. This study has been
supported by grants from the Research Council of
Norway (including the FUGE programme and
‘PSYKISK HELSE’ program), Norwegian Council for
Mental Health, ExtraStiftelsen Helse og Rehabilitering,
Helse Vest RHF, and Dr Einar Martens Fund (J.F.), the
Medical Research Council, UK (A.V.-P. : G0802051),
Wellcome Trust (A.V.-P. : 065326/Z/01/Z), Xunta de
Galicia (M.L. : 10PXIB208164PR), and Fondo Investi-
gationes Sanitarias (M.L. : PS09/01880), Ministerio
de Ciencia e Innovacion (M.L. : RyC-2007-00211), the
European Community’s Seventh Framework Pro-
gramme (FP7/2007-2013) under grant agreement
no. 245009 and by Ministerio de Educacion y Ciencia
(CD: BFU2008-02001). CIBER de Fisiopatologıa de la
Obesidad y Nutricion is an initiative of ISCIII.
Statement of Interest
None.
References
Albaugh VL, Henry CR, Bello NT, Hajnal A, et al. (2006).
Hormonal and metabolic effects of olanzapine and
clozapine related to body weight in rodents. Obesity
(Silver Spring) 14, 36–51.
Albaugh VL, Judson JG, She P, Lang CH, et al. (2010).
Olanzapine promotes fat accumulation in male rats by
decreasing physical activity, repartitioning energy and
increasing adipose tissue lipogenesis while impairing
lipolysis. Molecular Psychiatry 16, 569–581.
Allison DB, Mentore JL, Heo M, Chandler LP, et al. (1999).
Antipsychotic-induced weight gain : a comprehensive
research synthesis. American Journal of Psychiatry 156,
1686–1696.
American Diabetes Association, APA, American
Association of Clinical Endocrinologists, North
American Association for the Study of Obesity (2004).
Consensus development conference on antipsychotic
drugs and obesity and diabetes. Journal of Clinical
Psychiatry 65, 267–272.
Arjona AA, Zhang SX, Adamson B, Wurtman RJ
(2004). An animal model of antipsychotic-induced
Olanzapine-induced lipogenic activation in rat 177
weight gain. Behavioural Brain Research 152,
121–127.
Ascher-Svanum H, Stensland MD, Kinon BJ, Tollefson GD
(2005). Weight gain as a prognostic indicator of therapeutic
improvement during acute treatment of schizophrenia
with placebo or active antipsychotic. Journal of
Psychopharmacology 19(6 Suppl.), 110–117.
Bai YM, Lin CC, Chen JY, Lin CY, et al. (2006). Association of
initial antipsychotic response to clozapine and long-term
weight gain. American Journal of Psychiatry 163, 1276–1279.
Birkenaes AB, Birkeland KI, Engh JA, Faerden A, et al.
(2008). Dyslipidemia independent of body mass in
antipsychotic-treated patients under real-life conditions.
Journal of Clinical Psychopharmacology 28, 132–137.
Bligh EG, Dyer WJ (1959). A rapid method of total lipid
extraction and purification. Canadian Journal of
Biochemistry and Physiology 37, 911–917.
Boyda HN, Tse L, Procyshyn RM, Honer WG, et al. (2010).
Preclinical models of antipsychotic drug-induced
metabolic side effects. Trends in Pharmacological Sciences
31, 484–497.
Caminos JE, Nogueiras R, Gallego R, Bravo S, et al. (2005).
Expression and regulation of adiponectin and receptor in
human and rat placenta. Journal of Clinical Endocrinology
and Metabolism 90, 4276–4286.
Chintoh AF, Mann SW, Lam L, Giacca A, et al. (2009).
Insulin resistance and secretion in vivo : effects of different
antipsychotics in an animal model. Schizophrenia Research
108, 127–133.
Coccurello R, Caprioli A, Conti R, Ghirardi O, et al. (2008).
Olanzapine (LY170053, 2-methyl-4-(4-methyl-1-
piperazinyl)-10H-thieno[2,3-b][1,5] benzodiazepine),
but not the novel atypical antipsychotic ST2472
(9-piperazin-1-ylpyrrolo[2,1-b][1,3]benzothiazepine),
chronic administration induces weight gain,
hyperphagia, and metabolic dysregulation in mice.
Journal of Pharmacology and Experimental Therapeutics
326, 905–911.
Colton CW, Manderscheid RW (2006). Congruencies in
increased mortality rates, years of potential life lost, and
causes of death among public mental health clients in
eight states. Preventing Chronic Disease 3, A42.
Cooper GD, Pickavance LC, Wilding JP, Halford JC, et al.
(2005). A parametric analysis of olanzapine-induced
weight gain in female rats. Psychopharmacology (Berlin)
181, 80–89.
Cooper GD, Pickavance LC, Wilding JP, Harrold JA, et al.
(2007). Effects of olanzapine in male rats : enhanced
adiposity in the absence of hyperphagia, weight gain or
metabolic abnormalities. Journal of Psychopharmacology
21, 405–413.
Despres JP, Arsenault BJ, Cote M, Cartier A, et al. (2008).
Abdominal obesity : the cholesterol of the 21st century?
Canadian Journal of Cardiology 24(Suppl. D), 7D–12D.
Essali A, Al-Haj Haasan N, Li C, Rathbone J (2009).
Clozapine vs. typical neuroleptic medication for
schizophrenia. Cochrane Database of Systemic Reviews.
Issue No. 1. Art. No. CD000059.
Ferno J, Raeder MB, Vik-Mo AO, Skrede S, et al. (2005).
Antipsychotic drugs activate SREBP-regulated expression
of lipid biosynthetic genes in cultured human glioma cells :
a novel mechanism of action? Pharmacogenomics Journal
5, 298–304.
Ferno J, Skrede S, Vik-Mo AO, Havik B, et al. (2006).
Drug-induced activation of SREBP-controlled lipogenic
gene expression in CNS-related cell lines : marked
differences between various antipsychotic drugs. BMC
Neuroscience 7, 69.
Ferno J, Varela L, Skrede S, Vazquez MJ, et al. (2011).
Olanzapine-induced hyperphagia and weight gain
associate with orexigenic hypothalamic neuropeptide
signaling without concomitant AMPK phosphorylation.
PLoS One 6, e20571.
Ferno J, Vik-Mo AO, Jassim G, Havik B, et al. (2009).
Acute clozapine exposure in vivo induces lipid
accumulation and marked sequential changes in the
expression of SREBP, PPAR, and LXR target genes in
rat liver. Psychopharmacology (Berlin) 203, 73–84.
Festuccia WT, Blanchard PG, Turcotte V, Laplante M, et al.
(2009). Depot-specific effects of the PPAR{gamma} agonist
rosiglitazone on adipose tissue glucose uptake and
metabolism. Journal of Lipid Research 50, 1185–1194.
Goudie AJ, Smith JA, Halford JC (2002). Characterization
of olanzapine-induced weight gain in rats. Journal of
Psychopharmacology 16, 291–296.
Han M, Deng C, Burne TH, Newell KA, et al. (2008).
Short- and long-term effects of antipsychotic drug
treatment on weight gain and H1 receptor expression.
Psychoneuroendocrinology 33, 569–580.
Henderson DC (2001). Clozapine : diabetes mellitus, weight
gain, and lipid abnormalities. Journal of Clinical Psychiatry
62(Suppl. 23), 39–44.
Henderson DC, Fan X, Copeland PM, Sharma B, et al.
(2009). Aripiprazole added to overweight and obese
olanzapine-treated schizophrenia patients. Journal of
Clinical Psychopharmacology 29, 165–169.
Kaddurah-Daouk R, McEvoy J, Baillie RA, Lee D, et al.
(2007). Metabolomic mapping of atypical antipsychotic
effects in schizophrenia. Molecular Psychiatry 12, 934–945.
Kalinichev M, Rourke C, Daniels AJ, Grizzle MK, et al.
(2005). Characterisation of olanzapine-induced weight
gain and effect of aripiprazole vs. olanzapine on body
weight and prolactin secretion in female rats.
Psychopharmacology (Berlin) 182, 220–231.
Komossa K, Rummel-Kluge C, Hunger H, Schmid F, et al.
(2010). Olanzapine vs. other atypical antipsychotics for
schizophrenia. Cochrane Database of Systemic Reviews.
Issue No. 3. Art. No. CD006654.
Lauressergues E, Staels B, Valeille K, Majd Z, et al.
(2010). Antipsychotic drug action on SREBPs-related
lipogenesis and cholesterogenesis in primary rat
hepatocytes. Naunyn Schmiedeberg’s Archives of
Pharmacology 381, 427–439.
Leucht S, Corves C, Arbter D, Engel RR, et al. (2009).
Second-generation vs. first-generation antipsychotic drugs
for schizophrenia : a meta-analysis. Lancet 373, 31–41.
178 S. Skrede et al.
Lieberman JA, Stroup TS, McEvoy JP, Swartz MS, et al.
(2005). Effectiveness of antipsychotic drugs in patients
with chronic schizophrenia. New England Journal of
Medicine 353, 1209–1223.
Lopez M, Varela L, Vazquez MJ, Rodriguez-Cuenca S, et al.
(2010). Hypothalamic AMPK and fatty acid metabolism
mediate thyroid regulation of energy balance. Nature
Medicine 16, 1001–1008.
McNamara RK, Jandacek R, Rider T, Tso P, et al. (2011).
Atypical antipsychotic medications increase postprandial
triglyceride and glucose levels in male rats : relationship
with stearoyl-CoA desaturase activity. Schizophrenia
Research 129, 66–73.
Meyer JM (2002). A retrospective comparison of weight,
lipid, and glucose changes between risperidone- and
olanzapine-treated inpatients : metabolic outcomes after
1 year. Journal of Clinical Psychiatry 63, 425–433.
Minet-Ringuet J, Even PC, Goubern M, Tome D, et al.
(2006a). Long term treatment with olanzapine mixed
with the food in male rats induces body fat deposition
with no increase in body weight and no thermogenic
alteration. Appetite 46, 254–262.
Minet-Ringuet J, Even PC, Lacroix M, Tome D, et al.
(2006b). A model for antipsychotic-induced obesity in
the male rat. Psychopharmacology (Berlin) 187, 447–454.
Minet-Ringuet J, Even PC, Valet P, Carpene C, et al. (2007).
Alterations of lipid metabolism and gene expression in rat
adipocytes during chronic olanzapine treatment. Molecular
Psychiatry 12, 562–571.
Newcomer JW, Meyer JM, Baker RA, Eudicone JM, et al.
(2008). Changes in non-high-density lipoprotein
cholesterol levels and triglyceride/high-density
lipoprotein cholesterol ratios among patients randomized
to aripiprazole vs. olanzapine. Schizophrenia Research 106,
300–307.
Ntambi JM, Miyazaki M, Stoehr JP, Lan H, et al. (2002).
Loss of stearoyl-CoA desaturase-1 function protects mice
against adiposity. Proceedings of the National Academy of
Sciences USA 99, 11482–11486.
Procyshyn RM, Wasan KM, Thornton AE, Barr AM, et al.
(2007). Changes in serum lipids, independent of
weight, are associated with changes in symptoms during
long-term clozapine treatment. Journal of Psychiatry and
Neuroscience 32, 331–338.
Raeder MB, Ferno J, Vik-Mo AO, Steen VM (2006). SREBP
activation by antipsychotic- and antidepressant-drugs
in cultured human liver cells : relevance for metabolic
side-effects? Molecular and Cellular Biochemistry 289,
167–173.
Rosen ED, Hsu CH, Wang X, Sakai S, et al. (2002).
C/EBPalpha induces adipogenesis through
PPARgamma: a unified pathway. Genes and Development
16, 22–26.
Rozen S, Skaletsky H (2000). Primer3 on the WWW for
general users and for biologist programmers. Methods in
Molecular Biology 132, 365–386.
Rummel-Kluge C, Komossa K, Schwarz S, Hunger H,
et al. (2010). Head-to-head comparisons of metabolic side
effects of second generation antipsychotics in the treatment
of schizophrenia : a systematic review and meta-analysis.
Schizophrenia Research 123, 225–233.
Sekiya M, Yahagi N, Matsuzaka T, Takeuchi Y, et al. (2007).
SREBP-1-independent regulation of lipogenic gene
expression in adipocytes. Journal of Lipid Research
48, 1581–1591.
Shimano H (2001). Sterol regulatory element-binding
proteins (SREBPs) : transcriptional regulators of
lipid synthetic genes. Progress in Lipid Research 40,
439–452.
Shimomura I, Hammer RE, Richardson JA, Ikemoto S, et al.
(1998). Insulin resistance and diabetes mellitus in
transgenic mice expressing nuclear SREBP-1c in adipose
tissue : model for congenital generalized lipodystrophy.
Genes and Development 12, 3182–3194.
Stefanidis A, Verty AN, Allen AM, Owens NC, et al. (2009).
The role of thermogenesis in antipsychotic drug-induced
weight gain. Obesity (Silver Spring) 17, 16–24.
Stip E, Tourjman V (2010). Aripiprazole in schizophrenia
and schizoaffective disorder : a review. Clinical Therapeutics
32 (Suppl. 1), S3–20.
Tiihonen J, Lonnqvist J, Wahlbeck K, Klaukka T, et al.
(2009). 11-year follow-up of mortality in patients with
schizophrenia : a population-based cohort study
(FIN11 study). Lancet 374, 620–627.
Vik-Mo AO, Birkenaes AB, Ferno J, Jonsdottir H, et al.
(2008). Increased expression of lipid biosynthesis genes
in peripheral blood cells of olanzapine-treated patients.
International Journal of Neuropsychopharmacology 11,
679–684.
Yang LH, Chen TM, Yu ST, Chen YH (2007). Olanzapine
induces SREBP-1-related adipogenesis in 3T3-L1 cells.
Pharmacological Research 56, 202–208.
Olanzapine-induced lipogenic activation in rat 179
Related Documents