create / innovate / educate / GO STATE Oklahoma State University Committee for the Assessment of General Education And The Office of University Assessment General Education Assessment Annual Report, 2010 Committee for the Assessment of General Education Jon Comer Cheryl Farr John Gelder Frances Griffin Ed Walkiewicz Greg Wilber Office of University Assessment and Testing Jeremy Penn, Ph.D., Director Mark Nicholas, M.S., Assistant Director John D. Hathcoat, M.S., Statistical Analyst Sungah Kim, M.A., Graduate Research Associate [email protected] (405) 744-6687

Welcome message from author
This document is posted to help you gain knowledge. Please leave a comment to let me know what you think about it! Share it to your friends and learn new things together.
Transcript
create / innovate / educate / GO STATE
Oklahoma State University
Committee for the Assessment of General Education And
The Office of University Assessment
General Education Assessment Annual Report, 2010
Committee for the Assessment of General Education Jon Comer Cheryl Farr John Gelder
Frances Griffin Ed Walkiewicz
Greg Wilber
Office of University Assessment and Testing Jeremy Penn, Ph.D., Director
Mark Nicholas, M.S., Assistant Director John D. Hathcoat, M.S., Statistical Analyst
Sungah Kim, M.A., Graduate Research Associate [email protected] (405) 744-6687

i
Table of Contents Executive Summary ....................................................................................................................... iv
Introduction ................................................................................................................................ iv
Critical Thinking Results ........................................................................................................... iv
Table 1. Comparison of transfer students with and without ACT scores ................................... v
Diversity Results ...................................................................................................................... viii
Written Communication Results ................................................................................................. x
Table 2. The writing comprehension score for the average senior by year ............................... xi
Use of Results .......................................................................................................................... xiv
Implementation of Improvement Initiatives. ....................................................................... xiv
Monitor Recent Curricular Changes .................................................................................... xiv
Consider Modifications to the General Education Program. ............................................... xiv
Future Plans .............................................................................................................................. xv
Committee for the Assessment of General Education Annual Report, 2010 ................................. 1
2010 Committee for the Assessment of General Education Committee Membership ............... 1
Committee History ...................................................................................................................... 1
Institutional Portfolios ............................................................................................................ 2
General Education Course Database ....................................................................................... 2
College-, Department-, and Program-level Approaches ......................................................... 2
Assessment of Critical Thinking Skills ........................................................................................... 3
2010 Collection of Critical Thinking Samples ........................................................................... 3
2010 Critical Thinking Portfolio Reviews .................................................................................. 3
Critical Thinking Skills Scores from Each Review Group ......................................................... 4
Critical Thinking Rubric ............................................................................................................. 5
Student demographics associated with critical thinking skills artifacts, 2005-2010 .................. 6
Critical thinking scores, 2010 ..................................................................................................... 7
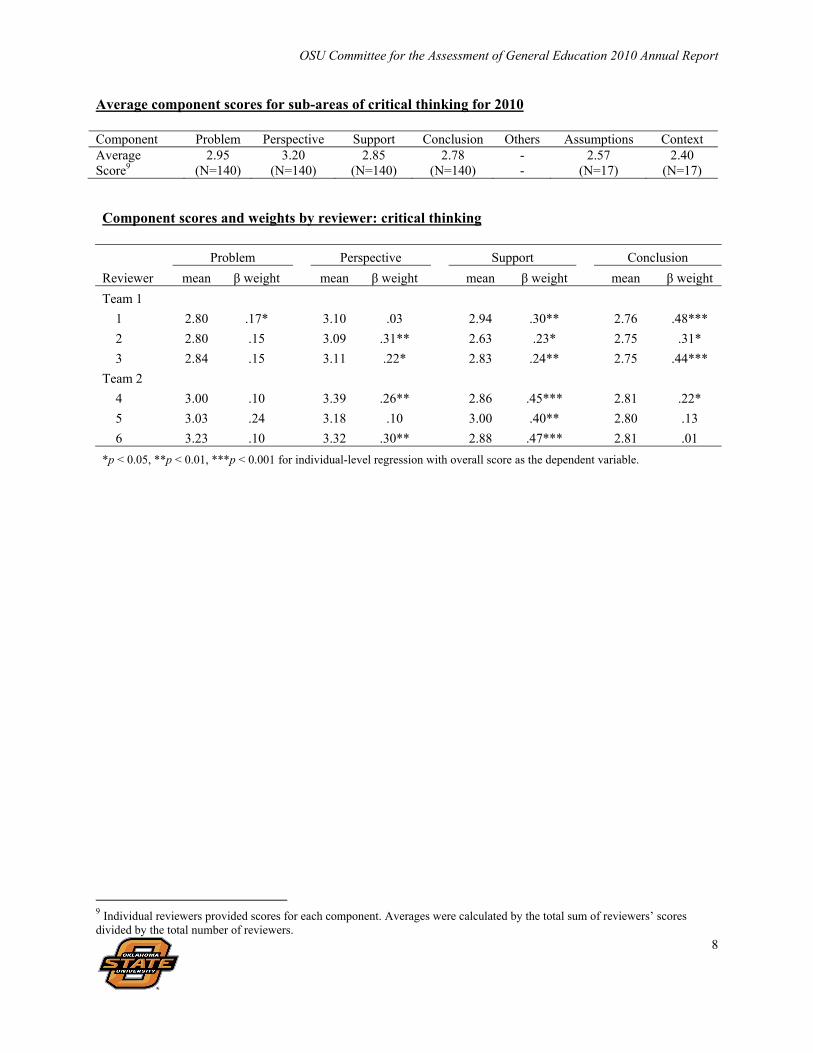
Average component scores for sub-areas of critical thinking for 2010 ...................................... 8
Component scores and weights by reviewer: critical thinking ................................................... 8
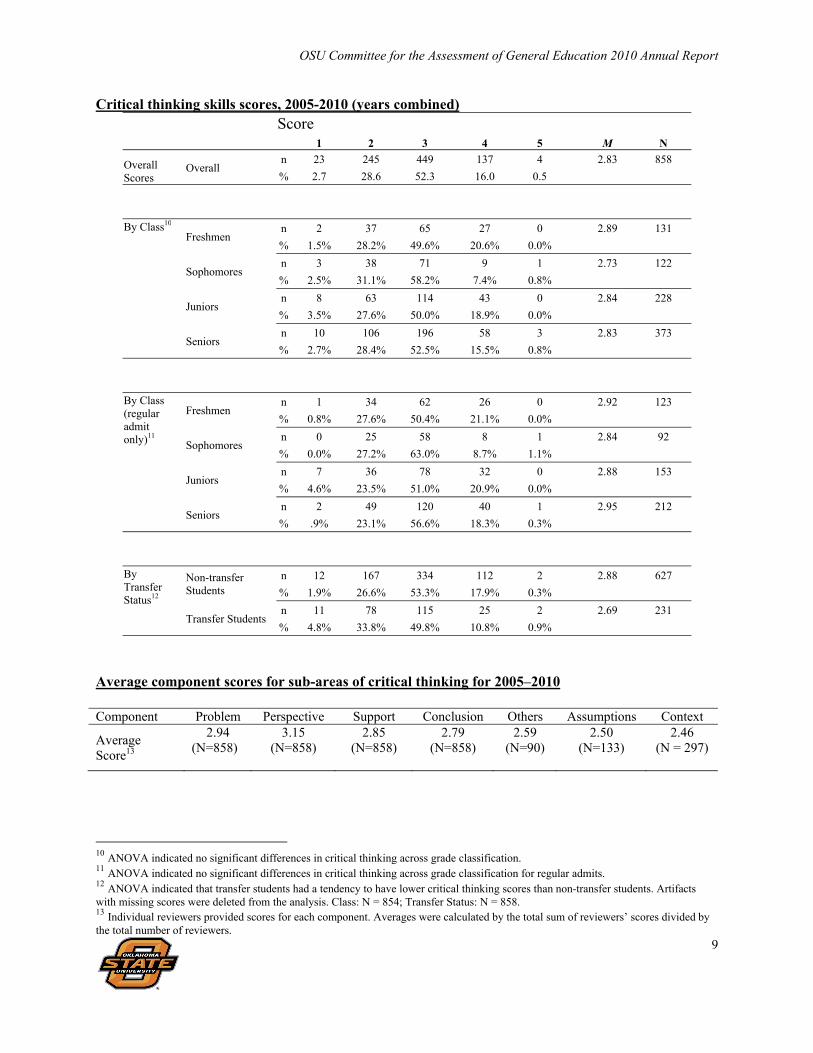
Critical thinking skills scores, 2005-2010 (years combined)...................................................... 9
Average component scores for sub-areas of critical thinking for 2005–2010 ............................ 9
Comparison of overall average critical thinking scores by year ............................................... 10
Comparison of overall average critical thinking scores by classification and by year ............. 10
Key Findings ............................................................................................................................. 10
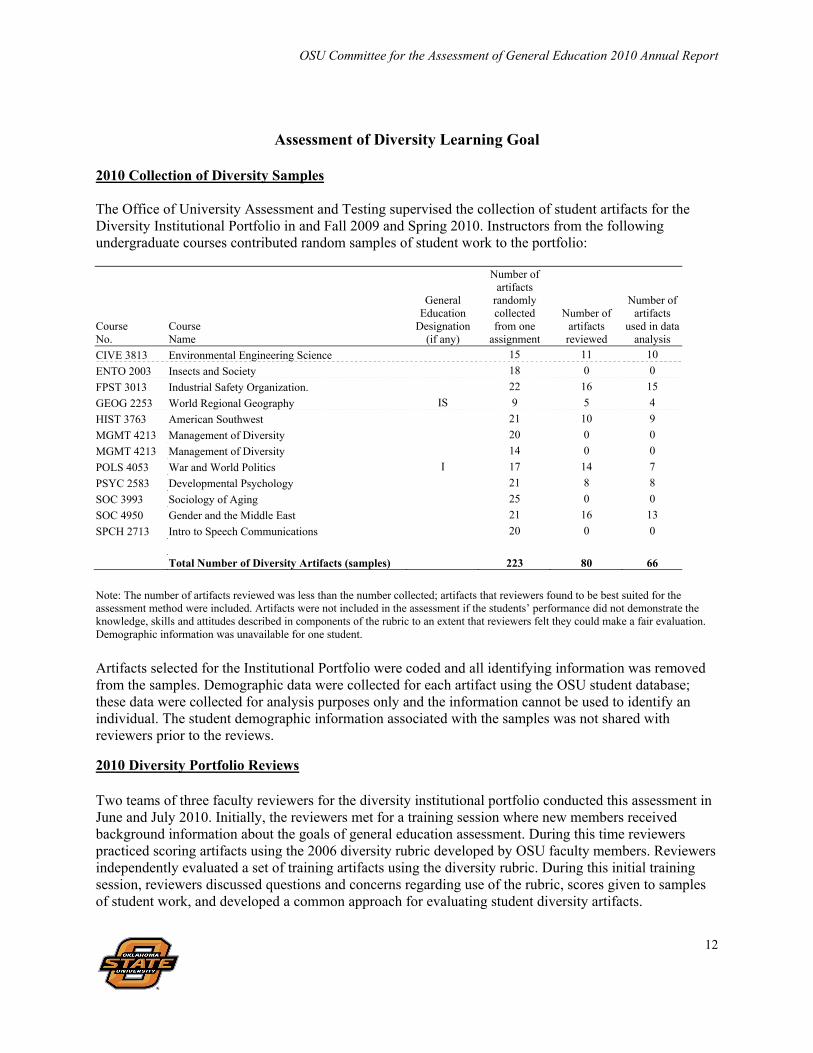
Assessment of Diversity Learning Goal ....................................................................................... 12
2010 Collection of Diversity Samples ...................................................................................... 12
ii
2010 Diversity Portfolio Reviews ............................................................................................. 12
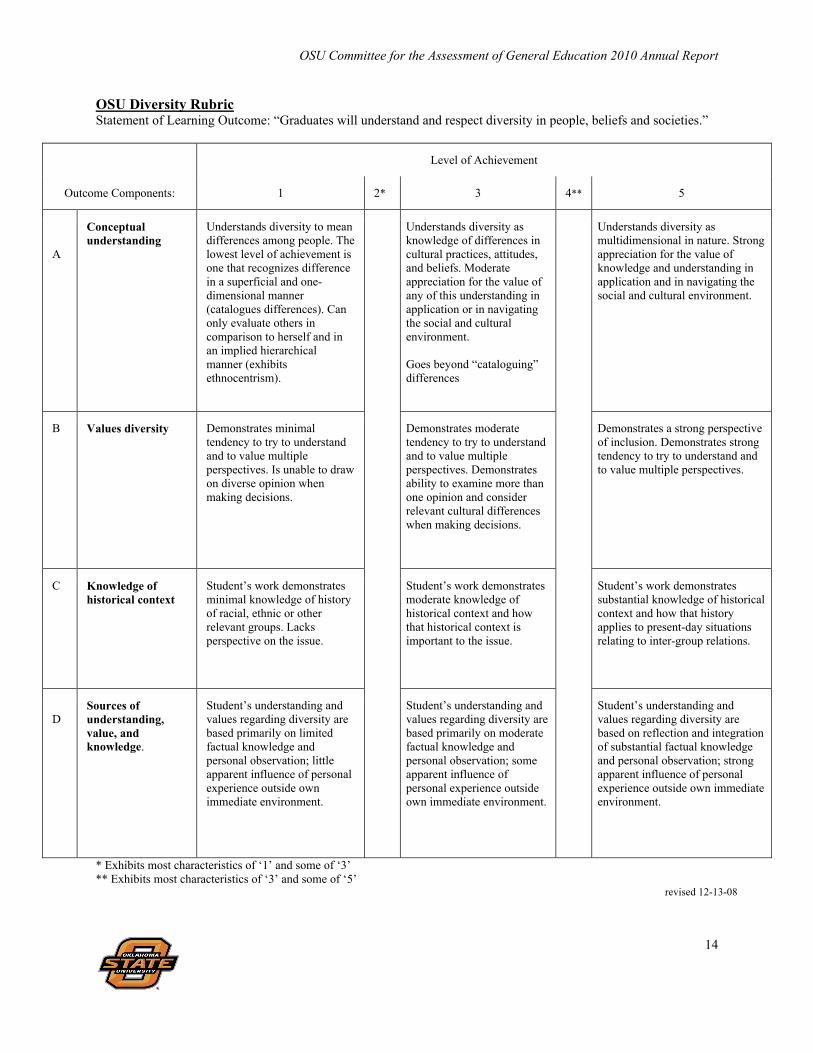
OSU Diversity Rubric ............................................................................................................... 14
Intercultural Knowledge and Competence VALUE Rubric ..................................................... 15
Student demographics associated with diversity artifacts, 2007-2010 ..................................... 17
Diversity scores, 2010 ............................................................................................................... 18
Average component scores for sub-areas of diversity for 2010 ............................................... 19
Component scores and weights by reviewer: Diversity ............................................................ 19
Diversity scores, 2007-2010 (years combined) ........................................................................ 20
Average component scores for sub-areas of diversity for 2007–2010 ..................................... 20
Comparison of overall average diversity scores by year .......................................................... 21
Comparison of overall average diversity scores by classification and by year ........................ 21
Key Findings ............................................................................................................................. 21
Analysis of the VALUE Rubric Results ................................................................................... 22
Table 3. Overall VALUE rubric scores .................................................................................... 22
Table 4. Average component scores for the VALUE rubric .................................................... 22
Table 5. Association among overall score from OSU’s diversity rubric and VALUE components ............................................................................................................................... 22
VALUE Rubric Key Findings .................................................................................................. 23
Assessment of Written Communication Skills ............................................................................. 24
2010 Collection of Writing Samples......................................................................................... 24
2010 Written Communication Skills Portfolio Reviews .......................................................... 25
2010 Standard Setting Procedures for Written Communication Portfolios .............................. 25
Written communication skills scores from each review group ................................................. 34
OSU Written Communication Rubric ....................................................................................... 35
Student demographics associated with written communication artifacts, 2001- 2006, 2008-2010........................................................................................................................................... 36
Written communication scores, 2010 ....................................................................................... 37
Average component scores for sub-areas of written communication for 2010 ........................ 38
Component scores and weights by reviewer: Written communication .................................... 38
Written communication skills scores, 2001-2006, 2008-2010 (years combined) .................... 39
Average component scores for sub-areas of written communication for 2006, 2008–2010 .... 39
Comparison of overall average written communication scores by year ................................... 40
Comparison of overall average written communication scores by classification and by year . 40
Key Findings ............................................................................................................................. 41
Assessment of Minimum Writing Requirements for GE Designated Courses ............................. 42

iii
Descriptive Statistics for GE Designated Writing Artifacts from 2001 to 2010 ...................... 42
Average Writing Score for GE Designation Before and After 2005 ........................................ 43
Key Findings ............................................................................................................................. 44
General Education Institutional Portfolios Summary ................................................................... 45
Number of samples in each portfolio, 2001-2010 .................................................................... 45
Overall portfolio scores for subject-area portfolios, years combined ....................................... 46

iv
Executive Summary Introduction General education at Oklahoma State University (OSU) is intended to: A. Construct a broad foundation for the student’s specialized course of study, B. Develop the student’s ability to read, observe, and listen with comprehension, C. Enhance the student’s skills in communicating effectively, D. Expand the student’s capacity for critical analysis and problem solving, E. Assist the student in understanding and respecting diversity in people, beliefs, and societies, and F. Develop the student’s ability to appreciate and function in the human and natural environment.1 OSU has been involved in assessment of general education for more than ten years. Three approaches are used to evaluate the general education program: institutional portfolios, review of general education course database, and college-, department-, and program-level approaches. This report focuses on OSU’s use of institutional portfolios to assess the general education program. Institutional portfolios provide direct evidence of student achievement of the overall goals of general education. Institutional portfolios have been developed in five areas that represent the overall goals of the general education program (letters in parentheses map portfolios to the goals above):
1. Written communication (B and C) 2. Critical thinking (D) 3. Math problem solving (D) 4. Science problem solving (D) 5. Diversity (E and F)
Recognizing that these goals cannot be achieved only through completion of courses with general education designations, student artifacts are collected from courses across campus that reveal students’ achievement in each institutional portfolio area. These student artifacts are then assessed by a panel of faculty members using rubrics created by faculty members at OSU. Each rubric has a different number of categories used in the scoring process. All rubrics use a 1 to 5 scale where a 1 is low and a 5 is high. In 2010 three portfolios were developed in the areas of written communication, critical thinking, and diversity. Critical Thinking Results In 2010, 140 artifacts (17 from freshmen, 35 from sophomores, 38 from juniors, and 46 from seniors2) were assessed by six faculty members working in two teams using the critical thinking rubric developed by OSU faculty members. Of the 140 artifacts, 2 (1.5%) were given an overall score of 1, 36 (25.7%) were given an overall score of 2, 70(52.1%) were given an overall score of 3, 28 (20.0%) were given an overall score of 4, and 1 (0.7%) artifact was given an overall score of 5. The average score in 2010 was 2.93 (2.94 for problem, 3.17 for perspective, 2.84 for support, 2.79 for conclusion, 2.58 for assumption, and 2.46 for context). A one-way ANOVA indicated that critical thinking scores significantly varied from 2005 to 2010 F(5, 852) = 5.321, p < .001. Follow-up tests indicated that that the average critical thinking score in 2007 (M = 2.58, SD = .78) was significantly lower than the average critical thinking score in 2005 (M = 2.89, SD = .62) (p < .01), 2006 (M = 2.83, SD = .61)
1 http://osu.okstate.edu/acadaffr/aa/gened-CriteriaGoals.htm 2 Classification status available for 136 artifacts.
v
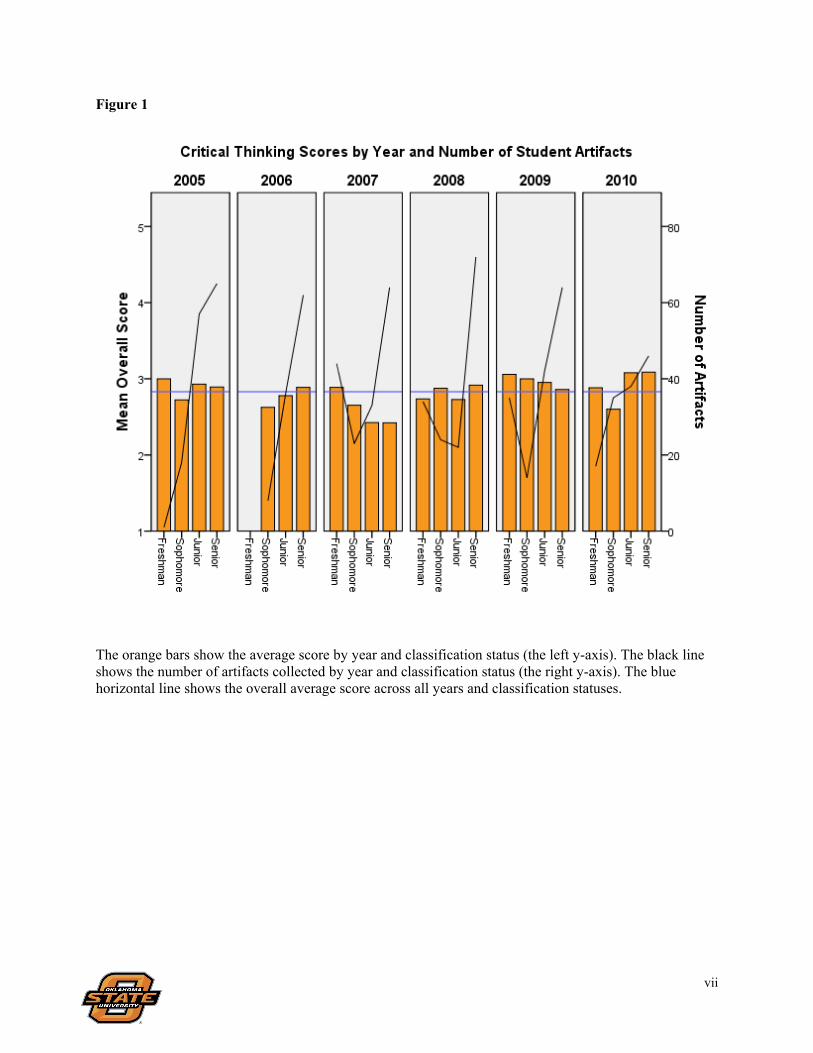
2008 (M = 2.84, SD = .68) (p < .05), 2009 (M = 2.94, SD = .77) (p < .001), and 2010 (M = 2.93, SD = .74) (p < . 01). In 2010 significant differences were found in critical thinking scores across grade classification F(3, 100) = 3.157, p < .05. Follow-up tests indicated that seniors (M = 3.09, SD = .78) and juniors (M = 3.08, SD = .67) had, on average, higher critical thinking scores than sophomores (M = 2.56, SD = .70) (p < .05). In 2010 no significant differences were found in critical thinking scores across transfer status3 F(1, 138) = 1.167, p > .05. Analysis of combined scores indicated that on average non-transfer students4 (M = 2.88, SD = .72) had a tendency to have higher critical thinking scores than transfer students (M = 2.69, SD = .76) F(1, 817) = 11.09, p < .01. For critical thinking artifacts the average ACT score was 24.83. Non-transfer students with an average ACT score had a mean critical thinking score of 2.87. For OSU students with average ACT composite scores the mean difference in critical thinking scores across non-transfer and transfer students failed to be statistically significant (b = -.096, t = -1.314, p > .05). The failure to find a significant difference in critical thinking scores among transfer and non-transfer students critical thinking scores when controlling for ACT should be interpreted with caution. It is possible that a selection effect was introduced into the analysis wherein transfer students with ACT scores measured by OSU are systematically different from transfer students without ACT scores. This possibility was investigated by comparing these students on measured variables (see Table 1). For 2010 critical thinking artifacts, transfer students without ACT scores had an average OSU GPA of 3.29, while transfer students with ACT scores had an average OSU GPA of 2.63. These differences were statistically significant F(1, 37) = 13.144, p = .001. The average critical thinking score for transfer students without ACT scores was 2.82, and this same average was obtained for transfer students with ACT scores. Transfer students without ACT scores also had a tendency to have greater cumulative credit hours (M = 119.82, SD = 24.94) than transfer students with ACT scores (M = 99.47, SD = 34.17) F (1, 37) = 4.69, p < .05. No differences in credit hours accumulated at OSU were detected (p > .05). This pattern of results suggests that these artifacts collected in 2010 do indeed vary in interesting ways. It must be remembered however, that in 2010 only 39 critical thinking artifacts were collected on transfer students, which is hardly representative of all transfer students at OSU. Table 1. Comparison of transfer students with and without ACT scores
M OSU GPA M Critical Thinking Score Cumulative Credit Hours
Transfer students (N = 39)
Without ACT score 3.29*** 2.82 119.82*
With ACT score 2.63*** 2.82 99.47*
*p < 0.05
***p < 0.01 Analysis of all years combined indicated that there were 98 critical thinking artifacts categorized as transfer students without ACT scores and 133 critical thinking artifacts classified as transfer students with ACT scores. No differences were detected in OSU GPA (p > .05) or cumulative credit hours (p > .05) for all years combined. Transfer students without ACT scores had an average critical thinking score of 2.71, and transfer students with ACT scores also had an average critical thinking score of 2.68. These differences were not statistically significant F(1, 229) = .137, p > .05. Average OSU cumulative hours for transfer students without ACT scores (M = 52.49, SD = 25.75) were significantly lower than for transfer students with ACT scores (M = 62.48, SD = 30.96) F (1, 229) = 6.67, p = .01. Once again, transfer 3 “Transfer students” are students that did not begin at OSU. 4 “Non-transfer students” are first-time students that started at OSU.
vi
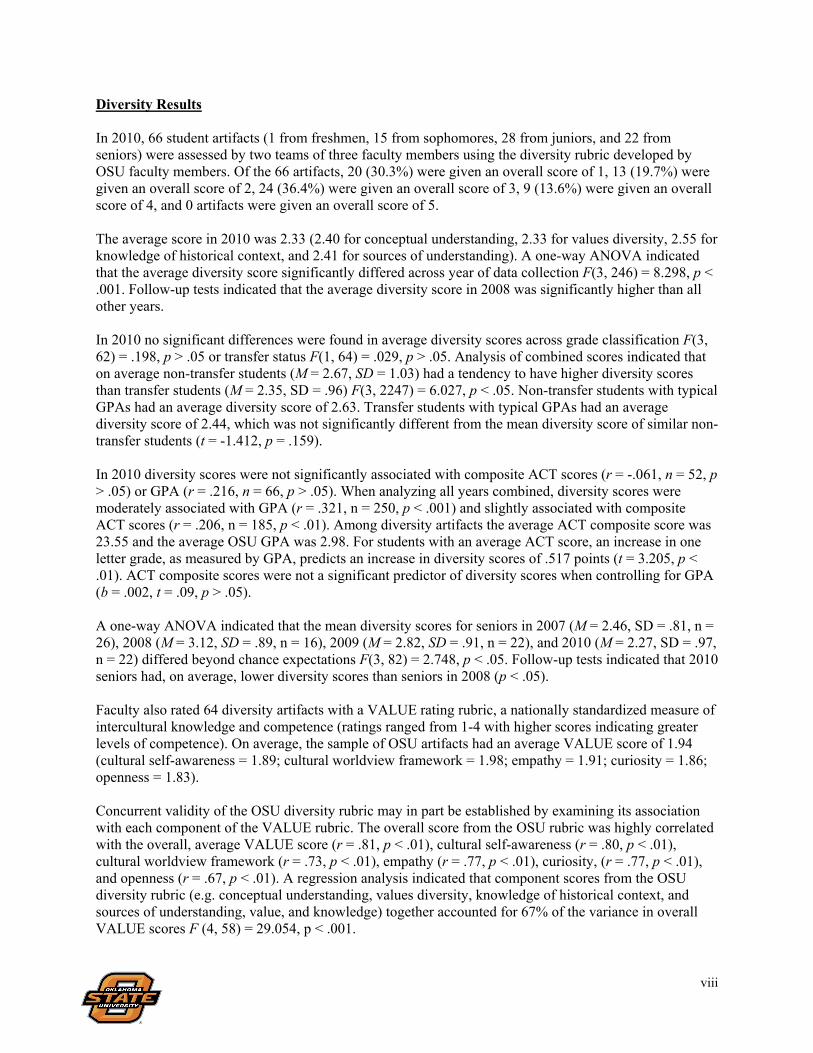
students with and without ACT scores do indeed vary in interesting ways, thus suggesting the need to exhibit caution when controlling for the effect of ACT in critical thinking scores among these artifacts. In 2010 critical thinking scores were not significantly associated with ACT composite scores (r = .114, n = 109, p > .05) or GPA (r = .102, n = 138, p > .05). Critical thinking scores were slightly associated with composite ACT (r = .199, n = 707, p < .001) and GPA (r = .225, n = 855, p < .001) across all years combined. Analysis of combined scores indicates that ACT composite scores and GPA account for approximately 7% of the variance in critical thinking scores F(2, 704) = 24.417, p < .001. Among critical thinking artifacts the average ACT composite score was 24.83 and the average OSU GPA was 3.09. The mean critical thinking scores for a student with a typical ACT composite score and typical OSU GPA is 2.849. For a student with an average ACT composite score an increase in one letter grade, as indicated by GPA, predicts a gain of .20 points in critical thinking t = 4.358, p < .001. For a student with an average GPA, an increase in one ACT point predicts an increase in critical thinking scores of .02 points t = 2.819, p < .01. A one-way ANOVA was used to examine differences in mean critical thinking scores among seniors across 2005 (M = 2.89, SD = .73), 2006 (M = 2.89, SD = .75), 2007 (M = 2.42, SD = .73), 2008 (M = 2.92, SD = .73), 2009 (M = 2.85, SD = .61) and 2010 (M = 3.09, SD = .74). Results indicated significant differences in average senior critical thinking scores across year of data collection F(5, 367) = 5.427, p < .001. Follow-up tests indicated that the average senior critical thinking score in 2007 was significantly lower than the average critical thinking scores in 2005 (p < .01), 2006 (p < .01), 2008 (p < .01) 2009 (p < .01), and 2010 (p < .01). The average critical thinking score for freshmen did not significantly vary across year of data collection F(4, 118) = 1.16, p > .05.
vii
Figure 1
The orange bars show the average score by year and classification status (the left y-axis). The black line shows the number of artifacts collected by year and classification status (the right y-axis). The blue horizontal line shows the overall average score across all years and classification statuses.
viii
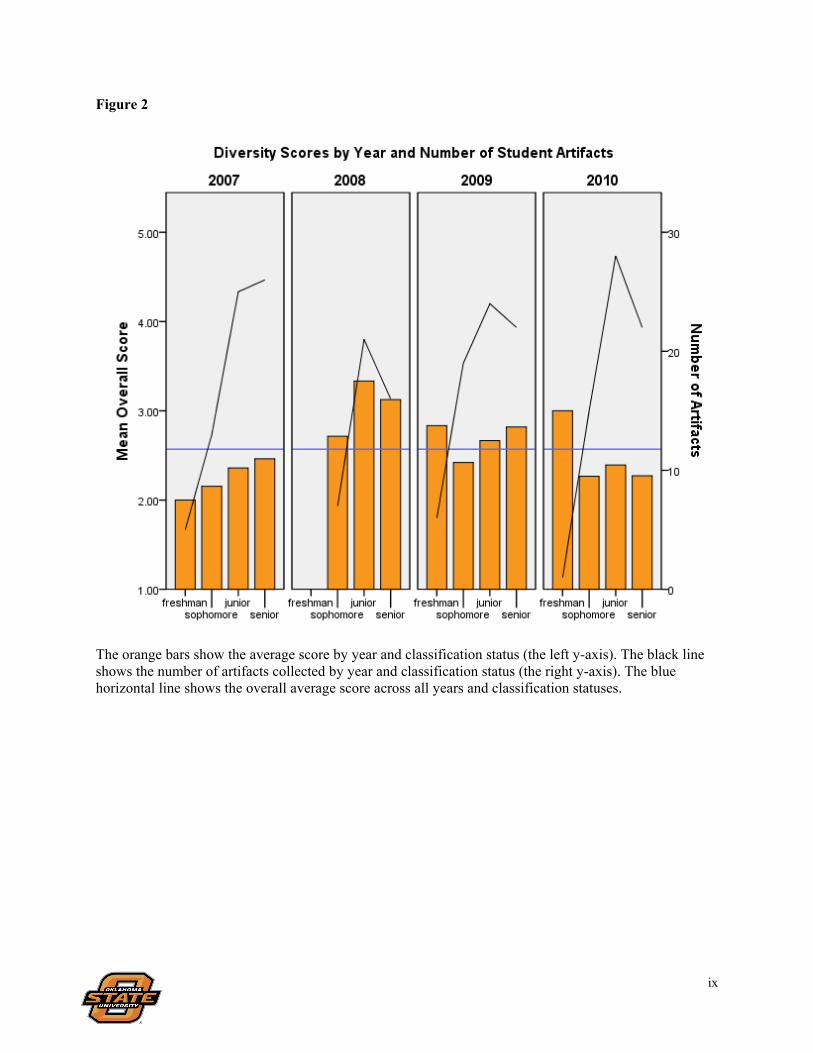
Diversity Results In 2010, 66 student artifacts (1 from freshmen, 15 from sophomores, 28 from juniors, and 22 from seniors) were assessed by two teams of three faculty members using the diversity rubric developed by OSU faculty members. Of the 66 artifacts, 20 (30.3%) were given an overall score of 1, 13 (19.7%) were given an overall score of 2, 24 (36.4%) were given an overall score of 3, 9 (13.6%) were given an overall score of 4, and 0 artifacts were given an overall score of 5. The average score in 2010 was 2.33 (2.40 for conceptual understanding, 2.33 for values diversity, 2.55 for knowledge of historical context, and 2.41 for sources of understanding). A one-way ANOVA indicated that the average diversity score significantly differed across year of data collection F(3, 246) = 8.298, p < .001. Follow-up tests indicated that the average diversity score in 2008 was significantly higher than all other years. In 2010 no significant differences were found in average diversity scores across grade classification F(3, 62) = .198, p > .05 or transfer status F(1, 64) = .029, p > .05. Analysis of combined scores indicated that on average non-transfer students (M = 2.67, SD = 1.03) had a tendency to have higher diversity scores than transfer students (M = 2.35, SD = .96) F(3, 2247) = 6.027, p < .05. Non-transfer students with typical GPAs had an average diversity score of 2.63. Transfer students with typical GPAs had an average diversity score of 2.44, which was not significantly different from the mean diversity score of similar non-transfer students (t = -1.412, p = .159). In 2010 diversity scores were not significantly associated with composite ACT scores (r = -.061, n = 52, p > .05) or GPA (r = .216, n = 66, p > .05). When analyzing all years combined, diversity scores were moderately associated with GPA (r = .321, n = 250, p < .001) and slightly associated with composite ACT scores (r = .206, n = 185, p < .01). Among diversity artifacts the average ACT composite score was 23.55 and the average OSU GPA was 2.98. For students with an average ACT score, an increase in one letter grade, as measured by GPA, predicts an increase in diversity scores of .517 points (t = 3.205, p < .01). ACT composite scores were not a significant predictor of diversity scores when controlling for GPA (b = .002, t = .09, p > .05). A one-way ANOVA indicated that the mean diversity scores for seniors in 2007 (M = 2.46, SD = .81, n = 26), 2008 (M = 3.12, SD = .89, n = 16), 2009 (M = 2.82, SD = .91, n = 22), and 2010 (M = 2.27, SD = .97, n = 22) differed beyond chance expectations F(3, 82) = 2.748, p < .05. Follow-up tests indicated that 2010 seniors had, on average, lower diversity scores than seniors in 2008 (p < .05). Faculty also rated 64 diversity artifacts with a VALUE rating rubric, a nationally standardized measure of intercultural knowledge and competence (ratings ranged from 1-4 with higher scores indicating greater levels of competence). On average, the sample of OSU artifacts had an average VALUE score of 1.94 (cultural self-awareness = 1.89; cultural worldview framework = 1.98; empathy = 1.91; curiosity = 1.86; openness = 1.83). Concurrent validity of the OSU diversity rubric may in part be established by examining its association with each component of the VALUE rubric. The overall score from the OSU rubric was highly correlated with the overall, average VALUE score (r = .81, p < .01), cultural self-awareness (r = .80, p < .01), cultural worldview framework (r = .73, p < .01), empathy (r = .77, p < .01), curiosity, (r = .77, p < .01), and openness (r = .67, p < .01). A regression analysis indicated that component scores from the OSU diversity rubric (e.g. conceptual understanding, values diversity, knowledge of historical context, and sources of understanding, value, and knowledge) together accounted for 67% of the variance in overall VALUE scores F (4, 58) = 29.054, p < .001.
ix
Figure 2
The orange bars show the average score by year and classification status (the left y-axis). The black line shows the number of artifacts collected by year and classification status (the right y-axis). The blue horizontal line shows the overall average score across all years and classification statuses.
x
Written Communication Results In 2010, 147 student artifacts were assessed by six faculty members working in two teams using the writing rubric developed by faculty members at OSU. Of the 147 artifacts, 4 (2.7%) were assigned an overall score of 1, 34 (23.1%) were assigned an overall score of 2, 67 (45.6%) were assigned a score of 3, 32 (21.8%) were assigned an overall score of 4, and 10 (6.8%) were assigned an overall score of 5. The average writing score in 2010 was 3.07 (Content = 3.27, Organization = 3.10, Style/Mechanics = 3.03, and Documentation = 2.93). Analysis of average writing scores across 2001 to 2010 indicated significant differences in writing scores across time F(2, 1277) = 8.51, p < .001. Follow-up tests indicated that writing scores in 2008 (M = 2.43, SD = .71) were significantly lower than all other years. In 2010 writing scores did not significantly vary across grade classification F(1, 136) = .196, p > .05 or transfer status F(1, 139) = .696, p > .05. Analysis of combined scores however, did indicate significant differences in average writing scores across grade classification F(3, 1275) = 6.259, p < .001. Follow-up tests indicated that, on average, seniors (M = 2.96, SD = .88) tended to have higher writing scores than freshmen (M = 2.64, SD = .84) (p < .001) for all years combined. Across all years combined moderate associations were found among English ACT sub scores and writing scores (r = .341, n = 1050, p < .001) and OSU GPA and writing scores (r = .307, n = 1284, p < .001). English ACT sub scores and GPA combined account for approximately 15% of the variance in writing scores F(2, 1046) = 93.26, p < .001. Among writing artifacts the average ACT composite scores was 24.20, the average English ACT component score was 24.37, and the average OSU GPA was 3.07. Students with typical ACT scores and typical OSU GPA scores have an average writing score of 2.852. For students with average ACT scores, an increase in one letter grade, as measured by GPA, predicts an increase in writing scores to 3.117 (b = .292, t = 6.638, p < .001). ACT English sub scores were also found to be a significant predictor of writing scores when controlling for OSU GPA (b = .044, t = 7.95, p < .001). Transfer status and English ACT sub scores account for approximately 12% of the variance in writing scores F(2, 1034) = 69.033, p < .001. Non-transfer students with average English ACT scores have a mean writing score of 2.828. Transfer students with an average English ACT score have a mean writing score of 2.694, which is significantly lower than the mean writing score of non-transfer students with average English ACT sub scores (b = .134, t = 2.087, p < .05. When not controlling for English ACT sub scores, average differences in writing scores among non-transfer (M = 2.86, SD = .88) and transfer students (M = 2.81, SD = .88) were not significantly different across all years combined F(1, 1261) = .933, p > .05. Given that transfer students with ACT scores measured by OSU may be different than transfer students without ACT scores it is important to investigate whether a possible selection effect was introduced into the analysis. In 2010, 33 writing artifacts were designated as transfer students. Of these, 20 had ACT scores and 13 did not have ACT scores. No differences were detected in total cumulative hours (p > .05), OSU GPA (p > .05), or in writing consensus scores (p > .05). Analysis of combined scores also detected no differences in these two groups on the same variables. Though no differences were detected among these groups, thus suggesting that there may not be systematic differences in these two groups, two points of caution must be stated. First, the limited sample size makes it unlikely that writing artifacts collected on transfer students are representative of all transfer students at OSU. Secondly, it is possible that these artifacts differ in important ways that are currently not measured by UAT.
xi
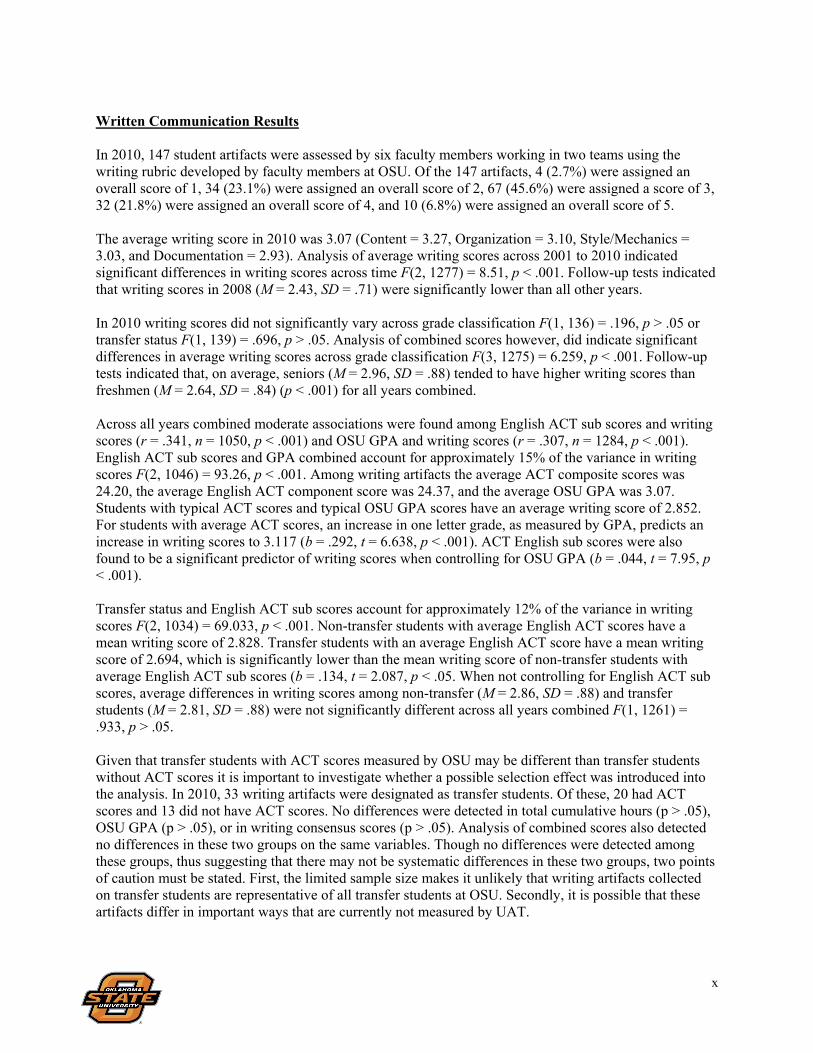
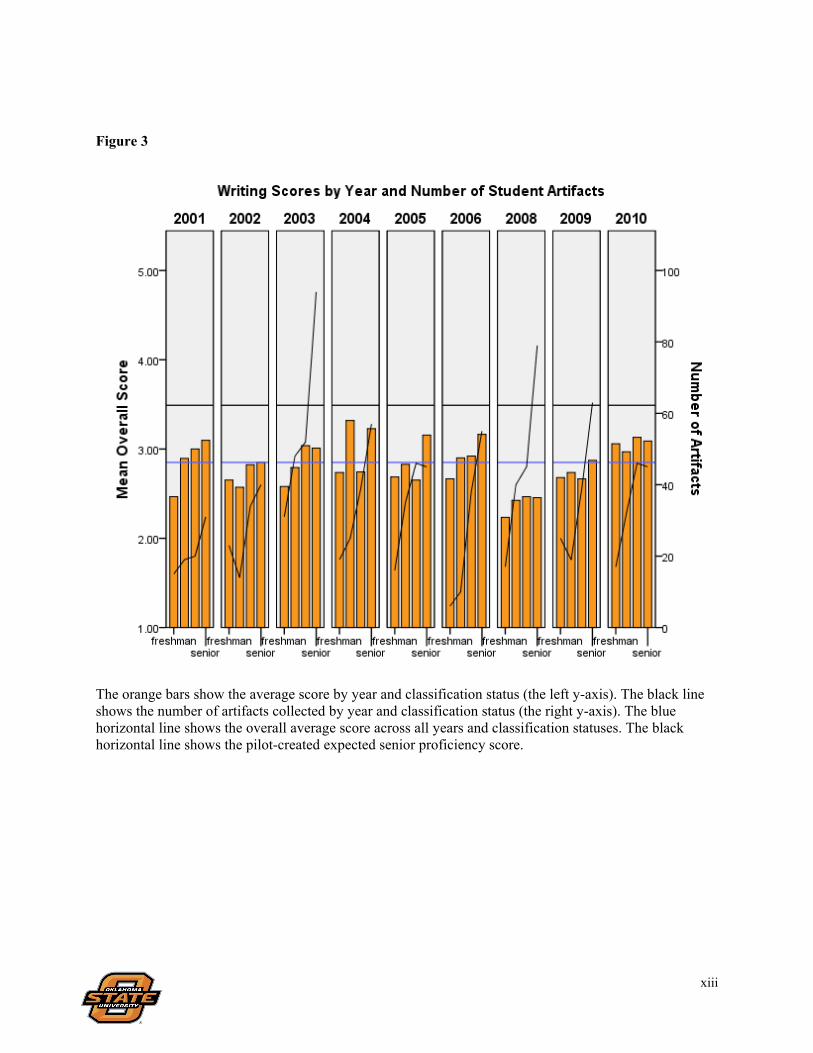
A one-way ANOVA indicated that the average senior writing comprehension score across year of data collection differed beyond chance expectations F(8, 500) = 5.046, p < .001 (see Table 2). Follow-up tests indicated that seniors in 2008, on average, had lower writing comprehension scores than seniors in 2001 (p < .05), 2003 (p < .01), 2004 (p < .01), 2005 (p < .01), 2006 (p < .01), and 2010 (p < .01). A one-way ANOVA indicated no significant differences in average writing comprehension scores for freshmen across all years of data collection F(8, 160) = 1.172, p > .05. Table 2. The writing comprehension score for the average senior by year
Two methods were used in order create a score from the OSU rubric which would meet minimally acceptable writing proficiency expectations for a graduating senior. Under method 1 faculty members were asked to estimate the expected number of artifacts which would fall within each possible score of the OSU rubric when taking a random sample of artifacts from 100 students with minimally proficient writing ability. Weighted scores were then calculated across faculty members. Results from this procedure indicated that an overall writing score of 3.49, when using the OSU rubric, would meet faculty expectations for a minimally proficient graduating senior.
Under Method 2 faculty judges rated 30 artifacts as proficient or not proficient when proficiency is defined as a minimally acceptable writing ability for a graduating senior. When comparing judge ratings to the original scores, or scores obtained in previous years using the OSU rubric, a standard score of 3 and 4 was suggested depending on the statistical analysis method used. When using these standard scores to classify student papers as masters or non-masters it appears that utilizing a standard score of 3 decreases the probability of misclassification errors. With a standard score of 4.0 a master will be correctly classified approximately 71% of the time and a non-master will be correctly classified approximately 88% of the time. Utilizing a standard score of 3.0 a master would be correctly classified 93% of the time and a non-master would be correctly classified 81% of the time.
A visual examination of writing scores across all years of data collection for GE and non-GE designated courses suggests that before 2005, or the year in which GE writing requirements were fully phased into OSU standards, no obvious patterns in writing scores emerged across the two groups (see Figure 6 on p. 43). After 2005 however, a clear pattern appears to emerge wherein average writing scores for GE designated courses are consistently higher than averages for non-GE designated courses. In other words, after 2005 writing artifacts sampled from GE designated courses have an average consensus score that his consistently higher than writing artifacts sampled from courses without GE designations. This pattern may be thought of as reflecting a potential interaction among GE designation and year of data collection. In other words, the effect GE designation on writing scores may change across time, or year of data collection. Changes in this effect are anticipated due to the increased writing requirements on GE designated courses that began the phase-in process in 2005. A true longitudinal investigation of this
Year n Mean SD 2001 31 3.10 .91 2002 40 2.85 .80 2003 94 3.01 .82 2004 57 3.23 1.07 2005 45 3.16 .90 2006 55 3.16 .79 2008 79 2.46 .75 2009 63 2.87 .85 2010 45 3.09 .90
xii
effect is hindered by the fact that different artifacts are collected across different students each year of data collection. Though a longitudinal analysis is complicated by having different student artifacts measured across each year of data collection, an examination of whether the effect of GE designation on writing scores changes across time can be approximated. Given that 2005 is the year of interest four groups were created: 1 = GE designated course for 2005 or before; 2 = Non GE designated course for 2005 or before; GE designated course after 2005, and non-GE designated course after 2005. A 2 X 2 factorial ANOVA indicated a significant interaction among GE designation and time of data collection F (1, 1283) = 6.58, p < .01 (see Figure 7). Follow-up tests indicated GE designated courses had on average higher scores than courses with no GE designation after 2005 t (581) = 4.31, p < .01, but no differences were found in writing scores before 2005 t (702) = .255, p > .05.
xiii
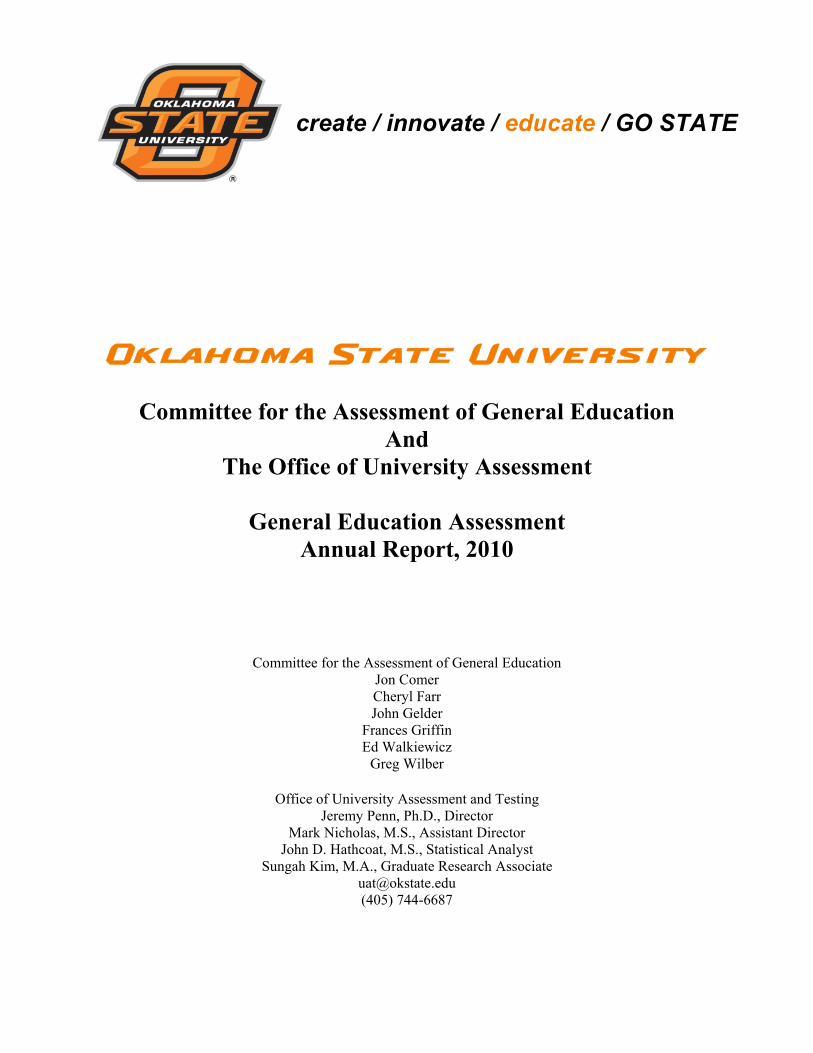
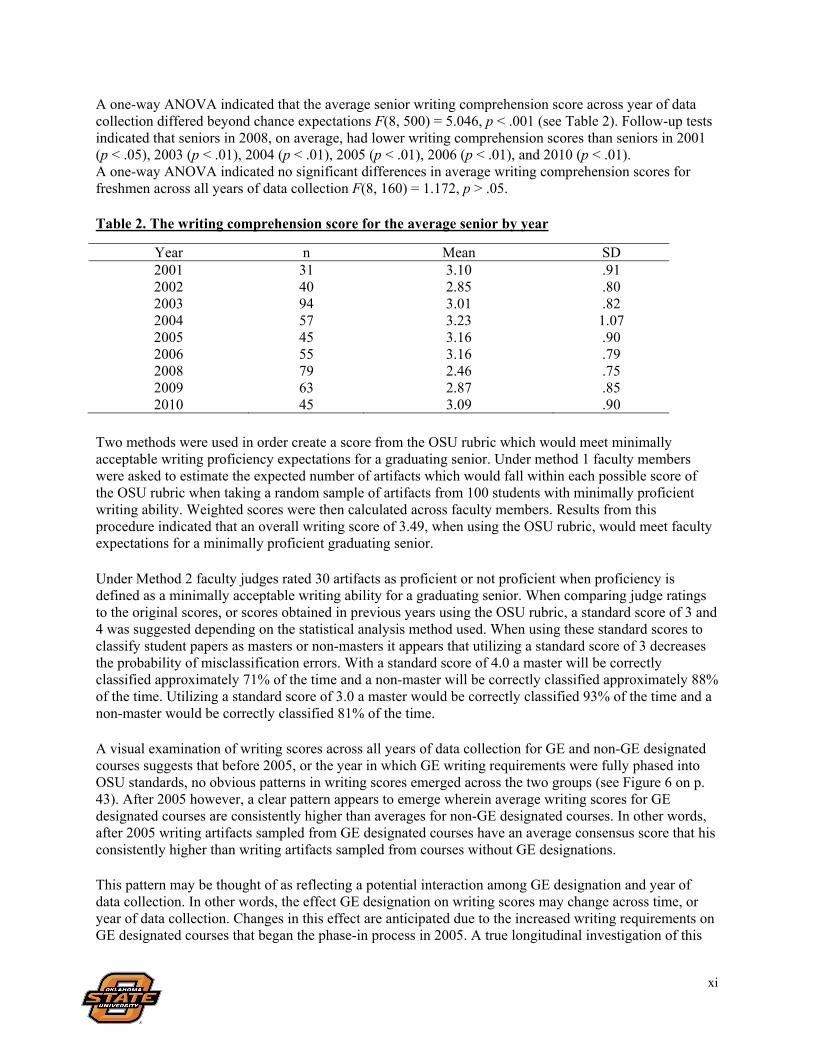
Figure 3
The orange bars show the average score by year and classification status (the left y-axis). The black line shows the number of artifacts collected by year and classification status (the right y-axis). The blue horizontal line shows the overall average score across all years and classification statuses. The black horizontal line shows the pilot-created expected senior proficiency score.
xiv
Use of Results Assessment data from the general education assessment process are used primarily in three ways:
To implement improvement initiatives To monitor recent curricular changes To consider and discuss additional modifications to the general education program
Implementation of Improvement Initiatives. In response to data from the general education assessment process, in 2008-2009 the Provost’s Office, the Office of University Assessment, the General Education Assessment Committee, and the Institute for Teaching and Learning Excellence collaborated to implement the Provost’s Faculty Development Initiative: Focus on General Education. The purpose of this initiative is to develop faculty members’ expertise in teaching and assessing the general education learning goal, in integrating the general education learning goal into existing courses, and in creating high quality assignments that demonstrate students’ achievement of the general education goal. This initiative was continued in 2010-2011 and will be implemented again in 2011-2012. In addition, new strategies for engaging additional faculty members through department-level workshops are being piloted in the spring of 2011. Members of CAGE and AAIC are developing a proposal that will be presented to Faculty Council that will require all courses at OSU to have a syllabus and recommend some elements to be included. While not directly related to general education assessment, this proposal grew out of discussions between AAIC, CAGE, and GEAC regarding improvements that would be beneficial to the campus. The critical thinking study group implemented a pilot project in the spring of 2011 where faculty members would use journaling techniques in their courses as new approach for documenting students’ critical thinking process. It is hoped this experience will both enhance students’ development of critical thinking and faculty members’ ability to assess and understand students’ critical thinking processes. Finally, a survey of OSU faculty members is underway to better understand how they approach teaching critical thinking in their courses, some of the barriers to teaching critical thinking, and additional resources that are needed to support the teaching of critical thinking. Results should be available in the summer of 2011 for discussion. Monitor Recent Curricular Changes. At the joint meeting of AAIC, CAGE, and GEAC in February of 2011, the group discussed the importance of carefully evaluating the changes to the writing requirements for general education and the resultant change (if any) in students’ writing scores. The group acknowledged some limitations of these data and discussed examining writing in more detail with some modifications to the general education assessment process in the summer of 2011. Consider Modifications to the General Education Program. The results from the 2010 general education assessment process will be shared on the OSU website, will be discussed by a newly formed student assessment advisory group, and were shared at the joint meeting between AAIC, GEAC, and CAGE. A task force to explore updates or modifications to the general education program is also being considered.
xv
Future Plans Future plans were discussed at the CAGE meeting in January of 2011 and at the joint meeting between AAIC, CAGE, and GEAC in February of 2011. All future plans are pending approval of AAIC. First, several updates were made to the structure for CAGE to better represent all colleges and to allow for more flexibility for the summer review process. Second, due to the continued success of the Provost’s Faculty Development Initiative: Focus on General Education, the initiative will be continued in 2011-2012. Depending on the success of the pilot department-level approach, there may be expansion of this element of the initiative. Third, it was recommended that CAGE and AAIC review the policy of encouraging faculty members to submit “first drafts,” that is, ungraded samples of student work for inclusion in the general education assessment process. Fourth, it was recommended that CAGE explore the relationship between students’ writing scores and their scores in other areas (such as diversity). There is some concern that writing ability greatly impacts students’ ability to demonstrate their skills in other areas. Fifth, CAGE proposed implementing a modified sampling strategy with a rotation between the different general education outcomes as shown below: Year 1: Writing Year 2: Critical thinking Year 3: Science and Diversity Year 4: Writing (repeats – the freshmen in year 1 are now presumably seniors) Math problem solving can be added into this rotation as desired. In each year the goal will be to sample freshmen and seniors to try to estimate the growth over time. Sixth, CAGE recommended continuing to pilot the VALUE rubrics and explore different methods for establishing external benchmarks. Seventh, CAGE recommended exploring options for providing feedback to participating general education faculty members who ask for feedback on the attributes of their submitted assignment. Eighth, CAGE recommended continuing to explore the standard-setting process to provide context for interpreting results. Ninth, CAGE recommended pilot testing an alternative structure for the scoring process, utilizing teams of five (two teams of two reviewers plus a fifth ‘tie-breaker’ team leader) to increase the number of artifacts scored for the same number of reviewers. Finally, CAGE recommended continuing to explore ways to improve student achievement of the general education outcomes, through enhancing OSU’s participation in High-Impact Practices (http://www.aacu.org/leap/hip.cfm) or other strategies.
OSU Committee for the Assessment of General Education 2010 Annual Report
1
Committee for the Assessment of General Education Annual Report, 2010
2010 Committee for the Assessment of General Education Committee Membership Jon Comer (Geography), Chair; John Gelder (Chemistry); Frances Griffin (Business Management); Ed Walkiewicz (English); Greg Wilber (Civil and Environmental Engineering); Cheryl Farr (Design, Housing, and Merchandising); Jeremy Penn (ex officio, University Assessment and Testing). Committee History Assessment of OSU’s general education program is required by the Higher Learning Commission of the North Central Association (HLC, OSU’s accrediting body) and by the Oklahoma State Regents for Higher Education. The Assessment Council (now Assessment and Academic Improvement Council) and the Office of University Assessment and Testing formed a faculty General Education Assessment Task Force in May 2000 for the purpose of developing and implementing a new plan to assess the effectiveness of OSU’s general education program. Although general education and “mid-level” assessment methods such as standardized tests and surveys had been conducted intermittently at OSU since 1993, no sustainable approach to evaluating the general education curriculum had been established. The task force formed in 2000 was the first group of OSU faculty members who were paid to work on this university-wide assessment project and marked a renewed commitment to general education assessment at OSU. Following the assessment standard of articulating desired student outcomes first, the Task Force started in 2000 by revising OSU’s Criteria and Goals for General Education Courses document and identifying “assessable” outcomes for the general education program. After studying general education assessment practices at other institutions, the task group developed the following guidelines for effective and sustainable general education assessment for OSU:
the process must not be aimed at individual faculty members or departments, the process should be led by faculty members, and faculty participation should be voluntary, the process should use student work already produced in courses, and the process should assess all undergraduates, including transfer students, because general
education outcomes describe qualities expected for all OSU graduates.
After summer-long study and discussion, the 2000 task group agreed to initiate two assessment methods to evaluate general education that were consistent with these guidelines: institutional portfolios and a course-content database. Institutional portfolios directly assess student achievement of the expected learning outcomes for the general education program, and the course database evaluates how each general education course contributes to student achievement of those articulated outcomes. These methods were implemented in 2001. In 2003, the Assessment Council and General Education Advisory Council approved the task force’s name change to the General Education Assessment Committee. The name was changed again in 2010 to the Committee for the Assessment of General Education (CAGE) to avoid confusion with the General Education Advisory Committee. CAGE is charged with continuing to develop and implement general education assessment and reports to the Assessment and Academic Improvement Council and the General Education Advisory Council; membership in these committees is intentionally overlapped. Committee members are extensively involved in undergraduate teaching at OSU, represent a range of disciplines, and are paid summer stipends for their work on general education assessment.
OSU Committee for the Assessment of General Education 2010 Annual Report
2
Institutional Portfolios. The Committee has developed institutional portfolios to assess students’ written communication skills (data collection in 2001, 2002, 2003, 2004, 2005, 2006, 2008, 2009, and 2010), math problem solving skills (data collection in 2002, 2003 and 2005), science problem solving skills (data collection in 2003, 2004, 2005, 2007, and 2009), critical thinking (data collection in 2005, 2006, 2007, 2008, 2009, and 2010), and diversity (data collection in 2007, 2008, 2009, and 2010). Separate portfolios are developed to evaluate each general education learner goal, and each portfolio includes students’ work from course assignments collected across the undergraduate curriculum. Faculty members (including Committee members and additional faculty members involved in undergraduate teaching) work in groups to evaluate the work in each portfolio and assess student achievement relative to the learner goal that is being assessed by using standardized scoring rubrics. The results provide a measure of the extent to which students are achieving OSU’s general education learning goals. The Committee plans to continue to develop institutional portfolios to assess the learner goals for general education as described in the Criteria and Goals for General Education Courses (http://osu.okstate.edu/acadaffr/aa/gened-CriteriaGoals.htm). General Education Course Database. The General Education Course Database is a tool for evaluating how each general education course is aligned with the overall expected learning outcomes for the general education program as a whole. Instructors are asked to submit their course information online via a web-based form, and the General Education Advisory Council reviews the submitted information during regular course reviews. The database form requests information about what general education learning goals are associated with the course and how the course provides students with opportunities to achieve those learning goals. Instructors are also asked to describe how student achievement of those goals is assessed within the course. The database provides a useful tool for holistically evaluating general education course offerings and the extent to which the overall general education goals are targeted across the curriculum. College-, Department-, and Program-level Approaches. Many colleges, departments, and programs include elements from the general education goals in their own assessment efforts. For example, a program may assess students’ ability to write a research paper relevant to the discipline. This integrates elements from the general education program (e.g., written communication) with elements from the discipline and provides additional information on student achievement of this important goal. Colleges and departments may also incorporate elements of the general education goals into their ongoing assessment processes. In addition to these three primary assessment tools, student surveys such as the National Survey of Student Engagement and OSU Survey of Alumni from Undergraduate Programs contribute to the general education assessment process and are considered in reviewing general education assessment results.

OSU Committee for the Assessment of General Education 2010 Annual Report
3
Assessment of Critical Thinking Skills 2010 Collection of Critical Thinking Samples The Office of University Assessment and Testing supervised the collection of student artifacts for the Critical Thinking Institutional Portfolio in Fall 2009 and Spring 2010. Instructors from the following undergraduate courses contributed random samples of student work to the portfolio:
Course No.
Course Name
General Education Designation (if any)
Number of artifacts randomly collected from one assignment
Number of artifacts reviewed
Number of artifacts used in data analysis
AGCM 3113 Agriculture Publishing Writing 13 11 11 ANSC 3903 Agriculture Animals of the World 21 0 0 ARCH 2003 Architecture and Society 25 12 12 CIVE 3813 Environmental Eng. Science 15 13 12 ENGR 1111 Introduction to Engineering 12 11 10 GEOG 2253 World Regional Geography IS 19 11 11 GEOG 2253 World Regional Geography IS 9 9 9 HDFS 4533 Social Policy and Human Services 13 11 11 HHP 3723 Epidemiology 12 11 11 HHP 4233 Health and Human Sexuality 20 13 13 HRAD 3213 Hospitality Management and Organizations 16 13 13 NSCI 3543 Food and the Human Environment IS 19 0 0 PHIL 1213 Philosophies of Life 20 13 12 ZOOL 3104 Invertabrate Zoology 20 15 15
Total Number of Critical Thinking Artifacts (samples)
312 143 140
Note: The number of artifacts reviewed in 2010 was less than the number collected. More artifacts were collected than could be evaluated by the reviewers, so those artifacts were selected that reviewers found to be best suited for the assessment (n=140). Three artifacts were not used in the analysis because CWIDs were unavailable or the artifacts were incomplete.
Artifacts selected for the Institutional Portfolio were coded and all identifying information was removed from the samples. Demographic data were collected for each artifact using the OSU student database; these data were collected for analysis purposes only and the information cannot be used to identify an individual. The student demographic information associated with the samples was not shared with reviewers prior to the reviews.
2010 Critical Thinking Portfolio Reviews Six faculty reviewers for the critical thinking skills institutional portfolio conducted this assessment in June and July 2010. Initially, the reviewers met for two training sessions where they received background information on the goals of general education assessment and practiced scoring critical thinking artifacts with the OSU rubric developed in 2004 (later revised in 2008). Then, reviewers independently evaluated a set of training artifacts using the critical thinking rubric. During these two initial sessions, reviewers discussed questions and concerns regarding the use of the rubric, discussed scores given to samples of student work, and developed a common approach for evaluating student critical thinking samples.

OSU Committee for the Assessment of General Education 2010 Annual Report
4
As with past groups of reviewers, by the end of the training sessions with all reviewers present, the reviewers were scoring fairly consistently with little variation among individual members. The scoring committee then divided into two sub-groups, which scored a total of 107 critical thinking artifacts. Scoring was done individually, and each sub-group then met to reach consensus scores in cases where there was variation across individual scores for the same artifact. The final scores were then submitted to the office of University Assessment and Testing for initial interpretation. Critical Thinking Skills Scores from Each Review Group
Review Group
Artifact Score
Number of Artifacts
Percent of Artifacts
#1 (69 artifacts scored)
1 2 2.9%
2 21 30.4%
3 33 47.8%
4 12 17.4%
5 1 1.4%
#2 (71 artifacts scored)
1 0 0.0%
2 17 23.9%
3 37 52.1%
4 17 23.9%
5 0 0.0%
Reviewers scored each artifact from the 2010 portfolio independently and then met to develop a consensus overall score for each artifact. Each artifact received an overall, whole-number score from 1 to 5, as well as a sub-score for each rubric component that was determined to be appropriate for the assignment. All artifacts were scored on rubric components A- D; other components were only scored if the group agreed they were relevant for the assignment. Reviewers discussed sub-scores and came to agreement (within one point) on each component score.
OSU Committee for the Assessment of General Education 2010 Annual Report
5
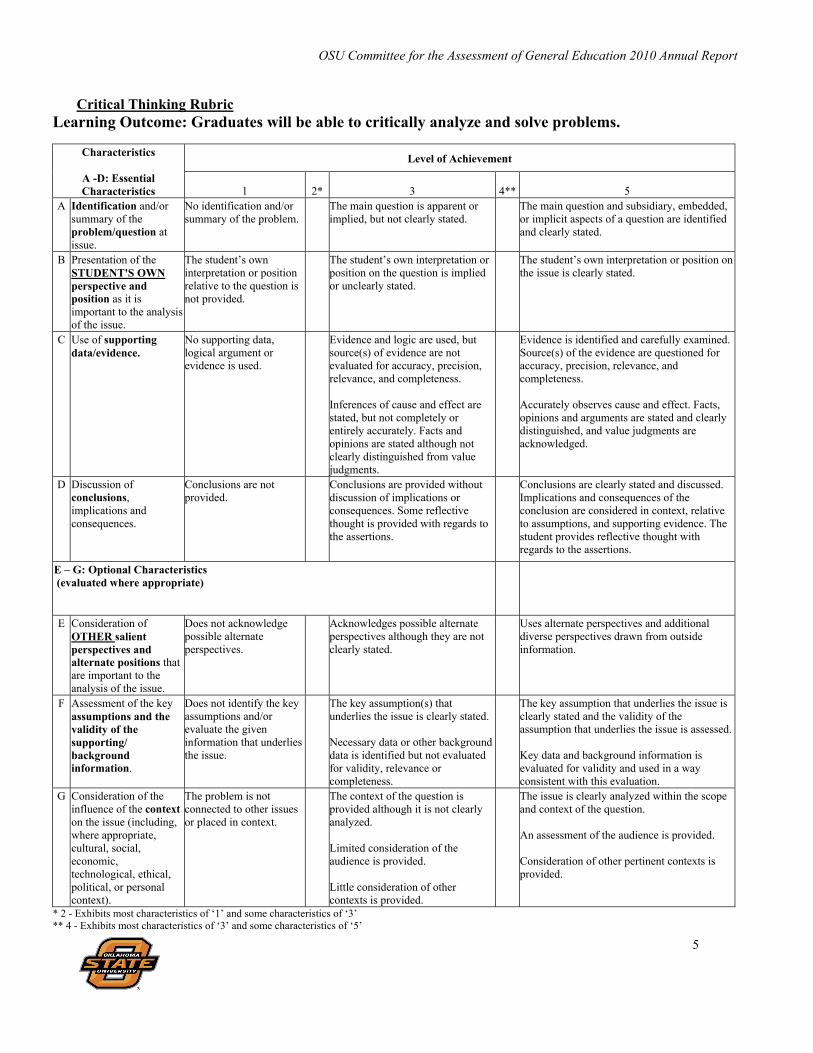
Critical Thinking Rubric Learning Outcome: Graduates will be able to critically analyze and solve problems.
Characteristics
A -D: Essential Characteristics
Level of Achievement
1 2* 3 4** 5 A Identification and/or
summary of the problem/question at issue.
No identification and/or summary of the problem.
The main question is apparent or implied, but not clearly stated.
The main question and subsidiary, embedded, or implicit aspects of a question are identified and clearly stated.
B Presentation of the STUDENT'S OWN perspective and position as it is important to the analysis of the issue.
The student’s own interpretation or position relative to the question is not provided.
The student’s own interpretation or position on the question is implied or unclearly stated.
The student’s own interpretation or position on the issue is clearly stated.
C Use of supporting data/evidence.
No supporting data, logical argument or evidence is used.
Evidence and logic are used, but source(s) of evidence are not evaluated for accuracy, precision, relevance, and completeness. Inferences of cause and effect are stated, but not completely or entirely accurately. Facts and opinions are stated although not clearly distinguished from value judgments.
Evidence is identified and carefully examined. Source(s) of the evidence are questioned for accuracy, precision, relevance, and completeness. Accurately observes cause and effect. Facts, opinions and arguments are stated and clearly distinguished, and value judgments are acknowledged.
D Discussion of conclusions, implications and consequences.
Conclusions are not provided.
Conclusions are provided without discussion of implications or consequences. Some reflective thought is provided with regards to the assertions.
Conclusions are clearly stated and discussed. Implications and consequences of the conclusion are considered in context, relative to assumptions, and supporting evidence. The student provides reflective thought with regards to the assertions.
E – G: Optional Characteristics (evaluated where appropriate)
E Consideration of OTHER salient perspectives and alternate positions that are important to the analysis of the issue.
Does not acknowledge possible alternate perspectives.
Acknowledges possible alternate perspectives although they are not clearly stated.
Uses alternate perspectives and additional diverse perspectives drawn from outside information.
F Assessment of the key assumptions and the validity of the supporting/ background information.
Does not identify the key assumptions and/or evaluate the given information that underlies the issue.
The key assumption(s) that underlies the issue is clearly stated. Necessary data or other background data is identified but not evaluated for validity, relevance or completeness.
The key assumption that underlies the issue is clearly stated and the validity of the assumption that underlies the issue is assessed. Key data and background information is evaluated for validity and used in a way consistent with this evaluation.
G Consideration of the influence of the context on the issue (including, where appropriate, cultural, social, economic, technological, ethical, political, or personal context).
The problem is not connected to other issues or placed in context.
The context of the question is provided although it is not clearly analyzed. Limited consideration of the audience is provided. Little consideration of other contexts is provided.
The issue is clearly analyzed within the scope and context of the question. An assessment of the audience is provided. Consideration of other pertinent contexts is provided.
* 2 - Exhibits most characteristics of ‘1’ and some characteristics of ‘3’ ** 4 - Exhibits most characteristics of ‘3’ and some characteristics of ‘5’
OSU Committee for the Assessment of General Education 2010 Annual Report
6
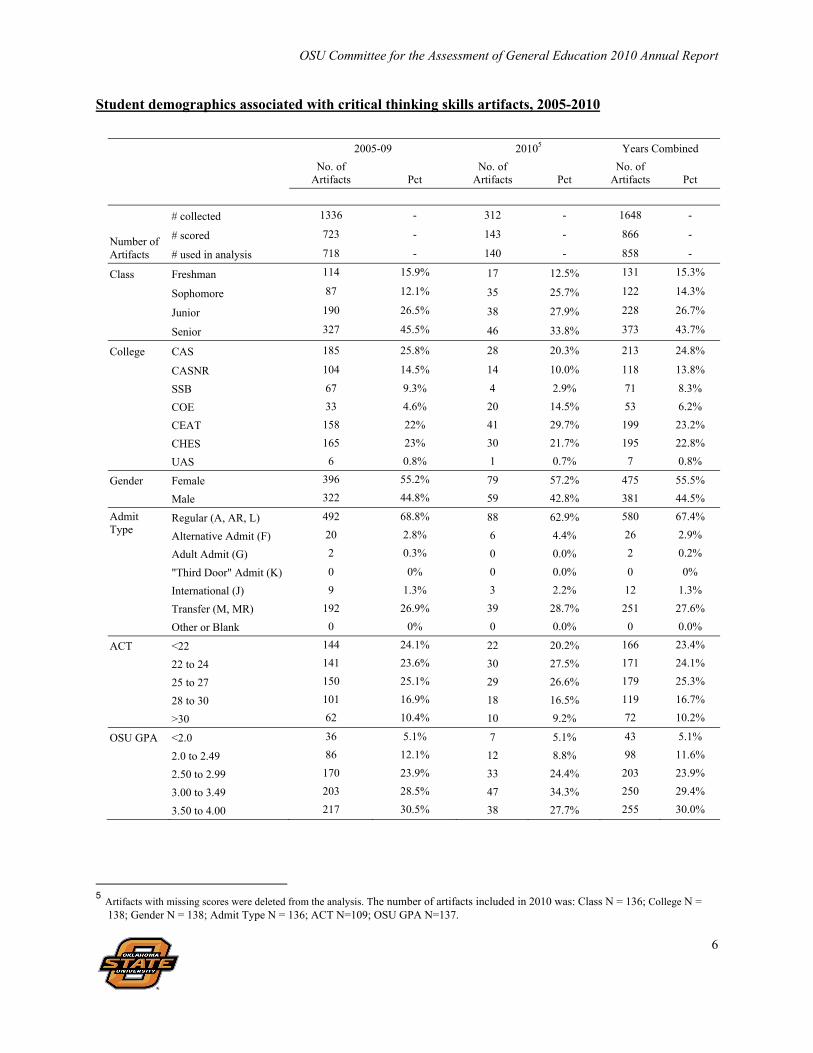
Student demographics associated with critical thinking skills artifacts, 2005-2010
2005-09 20105 Years Combined
No. of
Artifacts
Pct No. of
Artifacts
Pct No. of
Artifacts Pct
Number of Artifacts
# collected 1336 - 312 - 1648 -
# scored 723 - 143 - 866 -
# used in analysis 718 - 140 - 858 -
Class Freshman 114 15.9% 17 12.5% 131 15.3%
Sophomore 87 12.1% 35 25.7% 122 14.3%
Junior 190 26.5% 38 27.9% 228 26.7%
Senior 327 45.5% 46 33.8% 373 43.7%
College CAS 185 25.8% 28 20.3% 213 24.8%
CASNR 104 14.5% 14 10.0% 118 13.8%
SSB 67 9.3% 4 2.9% 71 8.3%
COE 33 4.6% 20 14.5% 53 6.2%
CEAT 158 22% 41 29.7% 199 23.2%
CHES 165 23% 30 21.7% 195 22.8%
UAS 6 0.8% 1 0.7% 7 0.8%
Gender Female 396 55.2% 79 57.2% 475 55.5%
Male 322 44.8% 59 42.8% 381 44.5%
Admit Type
Regular (A, AR, L) 492 68.8% 88 62.9% 580 67.4%
Alternative Admit (F) 20 2.8% 6 4.4% 26 2.9%
Adult Admit (G) 2 0.3% 0 0.0% 2 0.2%
"Third Door" Admit (K) 0 0% 0 0.0% 0 0%
International (J) 9 1.3% 3 2.2% 12 1.3%
Transfer (M, MR) 192 26.9% 39 28.7% 251 27.6%
Other or Blank 0 0% 0 0.0% 0 0.0%
ACT <22 144 24.1% 22 20.2% 166 23.4%
22 to 24 141 23.6% 30 27.5% 171 24.1%
25 to 27 150 25.1% 29 26.6% 179 25.3%
28 to 30 101 16.9% 18 16.5% 119 16.7%
>30 62 10.4% 10 9.2% 72 10.2%
OSU GPA <2.0 36 5.1% 7 5.1% 43 5.1%
2.0 to 2.49 86 12.1% 12 8.8% 98 11.6%
2.50 to 2.99 170 23.9% 33 24.4% 203 23.9%
3.00 to 3.49 203 28.5% 47 34.3% 250 29.4%
3.50 to 4.00 217 30.5% 38 27.7% 255 30.0%
5 Artifacts with missing scores were deleted from the analysis. The number of artifacts included in 2010 was: Class N = 136; College N =
138; Gender N = 138; Admit Type N = 136; ACT N=109; OSU GPA N=137.

OSU Committee for the Assessment of General Education 2010 Annual Report
7
Critical thinking scores, 2010
Score
1 2 3 4 5 M N6
Overall Scores
Overall n 2 36 70 28 1 2.93 140
% 1.5% 25.7% 52.1% 20.0% 0.7%
By Class7 Freshmen
n 0 5 9 3 0 2.88 17
% 0.0% 29.4% 52.9% 17.6% 0.0%
Sophomores n 2 12 19 2 0 2.60 35
% 7.4% 34.3% 54.3% 5.7% 0.0%
Juniors n 0 7 21 10 0 3.08 38
% 0.0% 18.4% 55.3% 26.3% 0.0%
Seniors n 0 11 21 13 1 3.09 46
% 0.0% 23.9% 45.7% 28.3% 2.2%
By Class (regular admit only)8
Freshmen n 0 2 9 3 0 3.07 14
% 0.0% 14.3% 64.3% 21.4% 0.0%
Sophomores n 0 10 16 2 0 2.71 28
% 0.0% 35.7% 57.1% 7.1% 0.0%
Juniors n 0 5 11 5 0 3.00 21
% 0.0% 23.8% 52.4% 23.8% 0.0%
Seniors n 0 2 11 11 1 3.44 25
% 0.0% 8% 44% 44% 4%
By Transfer Status
Non-transfer Students
n 1 24 49 22 1 2.97 97
% 1% 24.7% 50.5% 22.7% 1%
Transfer Students n 1 11 21 6 0 2.82 39
% 2.6% 28.2% 53.8% 15.4% 0.0%
6 Artifacts with missing scores were deleted from the analysis. Class N = 136; Class (regular admit only) N = 63; Transfer Status N = 104. 7 ANOVA indicated significant differences across class (p < .05). Follow-up tests indicated that seniors and juniors had on average higher critical thinking scores than sophomores. 8 ANOVA indicated significant differences across Class (p < .05). Follow-up tests indicated that seniors had on average higher critical thinking scores than sophomores.
OSU Committee for the Assessment of General Education 2010 Annual Report
8
Average component scores for sub-areas of critical thinking for 2010 Component Problem Perspective Support Conclusion Others Assumptions Context Average Score9
2.95 (N=140)
3.20 (N=140)
2.85 (N=140)
2.78 (N=140)
- -
2.57 (N=17)
2.40 (N=17)
Component scores and weights by reviewer: critical thinking Problem Perspective Support Conclusion
Reviewer mean β weight mean β weight mean β weight mean β weight
Team 1
1 2.80 .17* 3.10 .03 2.94 .30** 2.76 .48***
2 2.80 .15 3.09 .31** 2.63 .23* 2.75 .31*
3 2.84 .15 3.11 .22* 2.83 .24** 2.75 .44***
Team 2
4 3.00 .10 3.39 .26** 2.86 .45*** 2.81 .22*
5 3.03 .24 3.18 .10 3.00 .40** 2.80 .13
6 3.23 .10 3.32 .30** 2.88 .47*** 2.81 .01
*p < 0.05, **p < 0.01, ***p < 0.001 for individual-level regression with overall score as the dependent variable.
9 Individual reviewers provided scores for each component. Averages were calculated by the total sum of reviewers’ scores divided by the total number of reviewers.
OSU Committee for the Assessment of General Education 2010 Annual Report
9
Critical thinking skills scores, 2005-2010 (years combined)
Score
1 2 3 4 5 M N
Overall Scores
Overall n 23 245 449 137 4 2.83 858
% 2.7 28.6 52.3 16.0 0.5
By Class10 Freshmen
n 2 37 65 27 0 2.89 131
% 1.5% 28.2% 49.6% 20.6% 0.0%
Sophomores n 3 38 71 9 1 2.73 122
% 2.5% 31.1% 58.2% 7.4% 0.8%
Juniors n 8 63 114 43 0 2.84 228
% 3.5% 27.6% 50.0% 18.9% 0.0%
Seniors n 10 106 196 58 3 2.83 373
% 2.7% 28.4% 52.5% 15.5% 0.8%
By Class (regular admit only)11
Freshmen n 1 34 62 26 0 2.92 123
% 0.8% 27.6% 50.4% 21.1% 0.0%
Sophomores n 0 25 58 8 1 2.84 92
% 0.0% 27.2% 63.0% 8.7% 1.1%
Juniors n 7 36 78 32 0 2.88 153
% 4.6% 23.5% 51.0% 20.9% 0.0%
Seniors n 2 49 120 40 1 2.95 212
% .9% 23.1% 56.6% 18.3% 0.3%
By Transfer Status12
Non-transfer Students
n 12 167 334 112 2 2.88 627
% 1.9% 26.6% 53.3% 17.9% 0.3%
Transfer Students n 11 78 115 25 2 2.69 231
% 4.8% 33.8% 49.8% 10.8% 0.9%
Average component scores for sub-areas of critical thinking for 2005–2010 Component Problem Perspective Support Conclusion Others Assumptions Context
Average Score13
2.94 (N=858)
3.15 (N=858)
2.85 (N=858)
2.79 (N=858)
2.59 (N=90)
2.50 (N=133)
2.46 (N = 297)
10 ANOVA indicated no significant differences in critical thinking across grade classification. 11 ANOVA indicated no significant differences in critical thinking across grade classification for regular admits. 12 ANOVA indicated that transfer students had a tendency to have lower critical thinking scores than non-transfer students. Artifacts with missing scores were deleted from the analysis. Class: N = 854; Transfer Status: N = 858. 13 Individual reviewers provided scores for each component. Averages were calculated by the total sum of reviewers’ scores divided by the total number of reviewers.

OSU Committee for the Assessment of General Education 2010 Annual Report
10
Comparison of overall average critical thinking scores by year
Score
1 2 3 4 5 M N
Overall Scores
Overall n 23 245 449 137 4 2.82 858
% 2.7% 28.6% 52.3% 16.0% 0.4%
By Year
2005 n 2 40 72 26 1 2.89 141 % 1.4% 28.4% 51.1% 18.4% 0.7%
2006 n 4 29 54 19 0 2.83 106
% 3.8% 27.4% 50.9% 17.9% 0.0%
2007 n 13 59 76 16 0 2.58 164
% 7.9% 36% 46.3% 9.8% 0.0%
2008 n 1 46 81 24 0 2.84 152
% 0.7% 30.3% 53.3% 15.8% 0.0%
2009 n 1 35 93 24 2 2.94 155
% 0.6% 22.6% 60% 15.5% 1.3%
2010 n 2 36 73 28 1 2.93 140
% 1.4% 25.7% 52.2% 20.0% 0.1%
Comparison of overall average critical thinking scores by classification and by year Year
2005 2006 2007 2008 2009 2010 N
Freshmen n 1 0 44 34 35 17 131 M 3.00 - 2.89 2.74 3.06 2.88
Sophomores n 18 8 23 24 14 35 122 M 2.72 2.63 2.65 2.88 3.00 2.60
Juniors n 57 36 33 22 42 38 228 M 2.93 2.78 2.42 2.73 2.95 3.07
Seniors n 65 62 64 72 64 46 373 M 2.89 2.89 2.42 2.92 2.86 3.09
Key Findings Average critical thinking (CT) scores in 2010 significantly varied across grade classification F(3,
132) = 3.737, p < .05. Follow-up tests indicated that seniors (M = 3.08) and juniors (M = 3.08) had, on average, higher critical thinking scores than sophomores (M = 2.60) (p < .05).
In 2010 no significant differences were found in critical thinking scores across transfer status F(1, 138) = 1.161, p > .05.
A one-way ANOVA indicated that critical thinking scores significantly varied across time F(5, 852) = 5.321, p < .001. Follow-up tests indicated that critical thinking scores in 2007 were significantly lower than scores in 2005 (p < .05), 2008 (p < .05) 2009 (p < .001), and 2010 (p < .01).

OSU Committee for the Assessment of General Education 2010 Annual Report
11
Analysis of combined scores indicated that on average, non-transfer students (M = 2.88) had a tendency to have higher critical thinking scores than transfer students (M = 2.69) F(1, 856) = 11.09, p < .01. For all critical thinking artifacts the average ACT score was 24.83. Non-transfer students with an average ACT score had a mean critical thinking score of 2.87. For students with average ACT scores the mean difference in CT scores across transfer and non-transfer students was not statistically significant (b = -.096, t = -1.314, p > .05).
Analysis of combined scores indicated that OSU GPA and composite ACT scores combined account for approximately 7% of the variance in critical thinking scores F(2, 704) = 24.417, p < .001. Among critical thinking artifacts the average ACT composite score was 24.83 and the average OSU GPA was 3.09. The mean critical thinking score for a student with average OSU GPA and average composite ACT scores is 2.849. For a student with an average ACT score, an increase in one letter grade, as measured by OSU GPA, predicts an increase in critical thinking scores of .20 points (t = 4.358, p < .001).
A one-way ANOVA was used to examine differences in mean critical thinking scores among seniors across 2005 (M = 2.89, SD = .73), 2006 (M = 2.89, SD = .75), 2007 (M = 2.42, SD = .73), 2008 (M = 2.92, SD = .73), 2009 (M = 2.85, SD = .61) and 2010 (M = 3.09, SD = .74). Results indicated significant differences in average, senior critical thinking scores across year of data collection F(5, 367) = 5.427, p < .001. Follow-up tests indicated that the average senior critical thinking score in 2007 was significantly lower than the average critical thinking scores in 2005 (p < .01), 2006 (p < .01), 2008 (p < .01), 2009 (p < .01), and 2010 (p < .01).
The average critical thinking score for freshman did not vary across year of data collection beyond what would be considered from chance expectations F(3, 118) = 1.16, p > .05.
OSU Committee for the Assessment of General Education 2010 Annual Report
12
Assessment of Diversity Learning Goal 2010 Collection of Diversity Samples The Office of University Assessment and Testing supervised the collection of student artifacts for the Diversity Institutional Portfolio in and Fall 2009 and Spring 2010. Instructors from the following undergraduate courses contributed random samples of student work to the portfolio:
Course No.
Course Name
General
Education Designation
(if any)
Number of artifacts
randomly collected from one
assignment
Number of artifacts reviewed
Number of artifacts
used in data analysis
CIVE 3813 Environmental Engineering Science 15 11 10
ENTO 2003 Insects and Society 18 0 0
FPST 3013 Industrial Safety Organization. 22 16 15
GEOG 2253 World Regional Geography IS 9 5 4
HIST 3763 American Southwest 21 10 9
MGMT 4213 Management of Diversity 20 0 0
MGMT 4213 Management of Diversity 14 0 0
POLS 4053 War and World Politics I 17 14 7
PSYC 2583 Developmental Psychology 21 8 8
SOC 3993 Sociology of Aging 25 0 0
SOC 4950 Gender and the Middle East 21 16 13
SPCH 2713 Intro to Speech Communications 20 0 0
Total Number of Diversity Artifacts (samples) 223 80 66
Note: The number of artifacts reviewed was less than the number collected; artifacts that reviewers found to be best suited for the assessment method were included. Artifacts were not included in the assessment if the students’ performance did not demonstrate the knowledge, skills and attitudes described in components of the rubric to an extent that reviewers felt they could make a fair evaluation. Demographic information was unavailable for one student.
Artifacts selected for the Institutional Portfolio were coded and all identifying information was removed from the samples. Demographic data were collected for each artifact using the OSU student database; these data were collected for analysis purposes only and the information cannot be used to identify an individual. The student demographic information associated with the samples was not shared with reviewers prior to the reviews.
2010 Diversity Portfolio Reviews Two teams of three faculty reviewers for the diversity institutional portfolio conducted this assessment in June and July 2010. Initially, the reviewers met for a training session where new members received background information about the goals of general education assessment. During this time reviewers practiced scoring artifacts using the 2006 diversity rubric developed by OSU faculty members. Reviewers independently evaluated a set of training artifacts using the diversity rubric. During this initial training session, reviewers discussed questions and concerns regarding use of the rubric, scores given to samples of student work, and developed a common approach for evaluating student diversity artifacts.

OSU Committee for the Assessment of General Education 2010 Annual Report
13
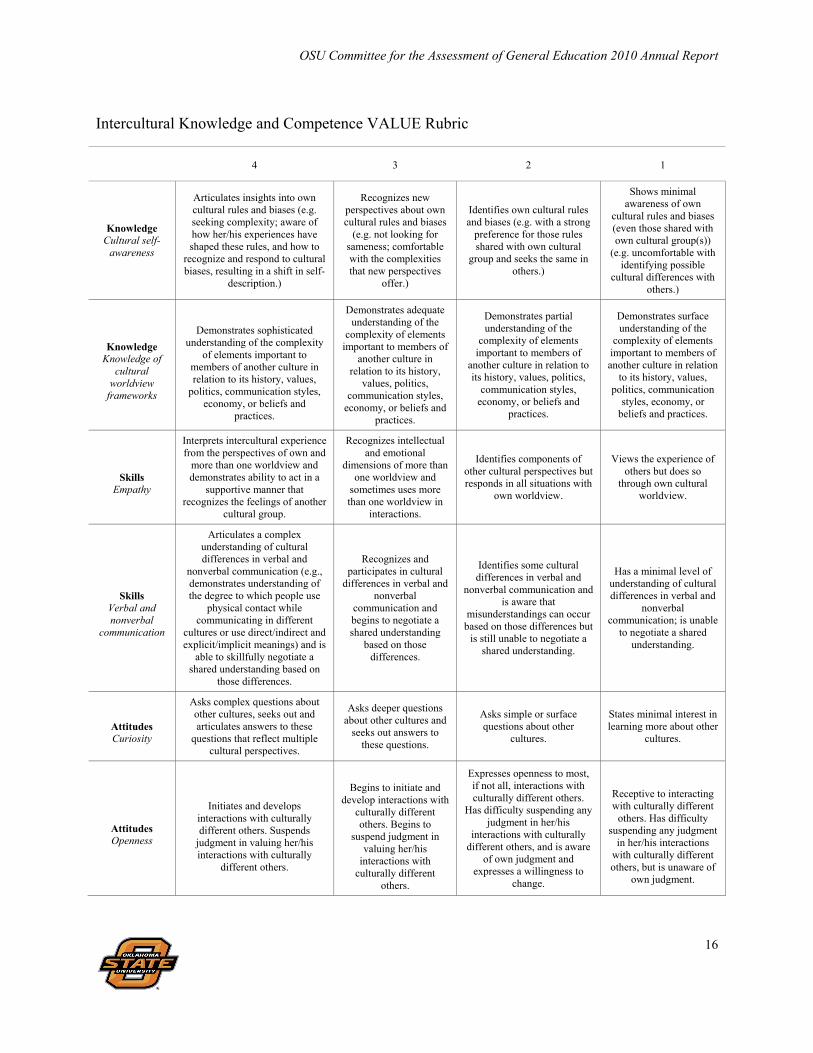
The adoption of a nationally standardized rubric would allow OSU to assess the diversity scores of OSU students, relative to comparable institutions. Moreover, the validity of the OSU diversity rubric scores may in part be determined by their association with scores from a nationally standardized diversity rubric. Thus, in addition to utilizing the OSU diversity rubric, the Intercultural Knowledge and Competence VALUE Rubric, a nationally standardized rubric developed by the Association of American Colleges and Universities, was pilot tested. The VALUE rubric aims to assess intercultural knowledge and competence, which is defined as “a set of cognitive, affective, and behavioral skills and characteristics that support effective and appropriate interaction in a variety of cultural contexts.”14 Intercultural knowledge and competence is operationalized as a set of scores from the following 6 dimensions: 1) Cultural self-awareness, 2) cultural worldview framework, 3) empathy, 4) verbal and nonverbal communication, 5) curiosity, and 6) openness. Two teams of three reviewers received 40 diversity artifacts which were to be scored with both the OSU and VALUE diversity rubric. One team was instructed to score assigned artifacts using the OSU rubric first, and the second team was instructed to score each artifact using the VALUE rubric first. All faculty members were instructed to provide “independent” scores for an artifact rated on both the OSU and VALUE rubrics. In other words, faculty raters were asked to allow for a sufficient amount of time to have passed before using the second scoring rubric so that assigned scores would be affected by the previous rubric.
Some artifacts were excluded from the assessment. The decision to include or exclude an assignment was not intended as a judgment about the quality of the assignment itself, but was a judgment about the “fit” or “match” of the content of the papers to the components of the rubric. Faculty reviewers described papers that work well for the assessment as having some critical analysis of a cultural or diversity-related issue; describing some reflection on the issue or related personal experience; and often including comparison of two or more cultures or diverse groups.
The criteria and goals for General Education state that the curriculum is intended to “assist students in understanding and respecting diversity in people, beliefs and societies.” A new general education designation for courses with this focus was created in Fall 2007. In Fall 2008, a policy was implemented that requires all incoming students to take at least one course with this designation as part of the general education curriculum. However, assessment of students’ achievement of the learning goal regarding diversity will not be limited to these designated courses. It is expected that many courses provide experiences to help students achieve this goal, and that students’ activities outside of class, such as interacting with others in student organizations, living environments, and participating in other extra-curricular activities also contribute to their achievement (see http://diversity.okstate.edu).
14 Bennett, J. M. 2008. Transformative training: Designing programs for culture learning. In Contemporary leadership and intercultural competence: Understanding and utilizing cultural diversity to build successful organizations, ed. M. A. Moodian, 95-110. Thousand Oaks, CA: Sage.
OSU Committee for the Assessment of General Education 2010 Annual Report
14
OSU Diversity Rubric Statement of Learning Outcome: “Graduates will understand and respect diversity in people, beliefs and societies.”
Level of Achievement
Outcome Components: 1 2* 3 4** 5
A
Conceptual understanding
Understands diversity to mean differences among people. The lowest level of achievement is one that recognizes difference in a superficial and one-dimensional manner (catalogues differences). Can only evaluate others in comparison to herself and in an implied hierarchical manner (exhibits ethnocentrism).
Understands diversity as knowledge of differences in cultural practices, attitudes, and beliefs. Moderate appreciation for the value of any of this understanding in application or in navigating the social and cultural environment. Goes beyond “cataloguing” differences
Understands diversity as multidimensional in nature. Strong appreciation for the value of knowledge and understanding in application and in navigating the social and cultural environment.
B Values diversity
Demonstrates minimal tendency to try to understand and to value multiple perspectives. Is unable to draw on diverse opinion when making decisions.
Demonstrates moderate tendency to try to understand and to value multiple perspectives. Demonstrates ability to examine more than one opinion and consider relevant cultural differences when making decisions.
Demonstrates a strong perspective of inclusion. Demonstrates strong tendency to try to understand and to value multiple perspectives.
C Knowledge of historical context
Student’s work demonstrates minimal knowledge of history of racial, ethnic or other relevant groups. Lacks perspective on the issue.
Student’s work demonstrates moderate knowledge of historical context and how that historical context is important to the issue.
Student’s work demonstrates substantial knowledge of historical context and how that history applies to present-day situations relating to inter-group relations.
D
Sources of understanding, value, and knowledge.
Student’s understanding and values regarding diversity are based primarily on limited factual knowledge and personal observation; little apparent influence of personal experience outside own immediate environment.
Student’s understanding and values regarding diversity are based primarily on moderate factual knowledge and personal observation; some apparent influence of personal experience outside own immediate environment.
Student’s understanding and values regarding diversity are based on reflection and integration of substantial factual knowledge and personal observation; strong apparent influence of personal experience outside own immediate environment.
* Exhibits most characteristics of ‘1’ and some of ‘3’ ** Exhibits most characteristics of ‘3’ and some of ‘5’
revised 12-13-08

OSU Committee for the Assessment of General Education 2010 Annual Report
15
Intercultural Knowledge and Competence VALUE Rubric For more information, contact [email protected] The VALUE rubrics were developed by teams of faculty experts representing colleges and universities across the United States through a process that examined many existing campus rubrics and related documents for each learning outcome and incorporated additional feedback from faculty. The rubrics articulate fundamental criteria for each learning outcome, with performance descriptors demonstrating progressively more sophisticated levels of attainment. The rubrics are intended for institutional-level use in evaluating and discussing student learning, not for grading. The core expectations articulated in all 15 of the VALUE rubrics can and should be translated into the language of individual campuses, disciplines, and even courses. The utility of the VALUE rubrics is to position learning at all undergraduate levels within a basic framework of expectations such that evidence of learning can by shared nationally through a common dialog and understanding of student success.
Definition Intercultural Knowledge and Competence is "a set of cognitive, affective, and behavioral skills and characteristics that support effective and appropriate interaction in a variety of cultural contexts.”15 The definitions that follow were developed to clarify terms and concepts used in this rubric only.
• Culture: All knowledge and values shared by a group. • Cultural rules and biases: Boundaries within which an individual operates in order to feel a sense
of belonging to a society or group, based on the values shared by that society or group. • Empathy: “Empathy is the imaginary participation in another person’s experience, including
emotional and intellectual dimensions, by imagining his or her perspective (not by assuming the person’s position).”16
• Intercultural experience: The experience of an interaction with an individual or groups of people
whose culture is different from your own. • Intercultural/cultural differences: The differences in rules, behaviors, communication and biases,
based on cultural values that are different from one's own culture. • Suspends judgment in valuing their interactions with culturally different others: Postpones
assessment or evaluation (positive or negative) of interactions with people culturally different from one self. Disconnecting from the process of automatic judgment and taking time to reflect on possibly multiple meanings.
• Worldview: Worldview is the cognitive and affective lens through which people construe their
experiences and make sense of the world around them.
15 Bennett, J. M. 2008. Transformative training: Designing programs for culture learning. In Contemporary leadership and intercultural competence: Understanding and utilizing cultural diversity to build successful organizations, ed. M. A. Moodian, 95-110. Thousand Oaks, CA: Sage. 16 Bennett, J. 1998. Transition shock: Putting culture shock in perspective. In Basic concepts of intercultural communication, ed. M. Bennett, 215-224. Yarmouth, ME: Intercultural Press.
OSU Committee for the Assessment of General Education 2010 Annual Report
16
Intercultural Knowledge and Competence VALUE Rubric
4 3
2
1
Knowledge Cultural self-
awareness
Articulates insights into own cultural rules and biases (e.g. seeking complexity; aware of how her/his experiences have shaped these rules, and how to
recognize and respond to cultural biases, resulting in a shift in self-
description.)
Recognizes new perspectives about own cultural rules and biases
(e.g. not looking for sameness; comfortable with the complexities that new perspectives
offer.)
Identifies own cultural rules and biases (e.g. with a strong
preference for those rules shared with own cultural
group and seeks the same in others.)
Shows minimal awareness of own
cultural rules and biases (even those shared with own cultural group(s))
(e.g. uncomfortable with identifying possible
cultural differences with others.)
Knowledge
Knowledge of cultural
worldview frameworks
Demonstrates sophisticated understanding of the complexity
of elements important to members of another culture in relation to its history, values,
politics, communication styles, economy, or beliefs and
practices.
Demonstrates adequate understanding of the
complexity of elements important to members of
another culture in relation to its history,
values, politics, communication styles,
economy, or beliefs and practices.
Demonstrates partial understanding of the
complexity of elements important to members of
another culture in relation to its history, values, politics,
communication styles, economy, or beliefs and
practices.
Demonstrates surface understanding of the
complexity of elements important to members of another culture in relation
to its history, values, politics, communication
styles, economy, or beliefs and practices.
Skills
Empathy
Interprets intercultural experience from the perspectives of own and
more than one worldview and demonstrates ability to act in a
supportive manner that recognizes the feelings of another
cultural group.
Recognizes intellectual and emotional
dimensions of more than one worldview and
sometimes uses more than one worldview in
interactions.
Identifies components of other cultural perspectives but responds in all situations with
own worldview.
Views the experience of others but does so
through own cultural worldview.
Skills
Verbal and nonverbal
communication
Articulates a complex understanding of cultural differences in verbal and
nonverbal communication (e.g., demonstrates understanding of the degree to which people use
physical contact while communicating in different
cultures or use direct/indirect and explicit/implicit meanings) and is
able to skillfully negotiate a shared understanding based on
those differences.
Recognizes and participates in cultural
differences in verbal and nonverbal
communication and begins to negotiate a shared understanding
based on those differences.
Identifies some cultural differences in verbal and
nonverbal communication and is aware that
misunderstandings can occur based on those differences but
is still unable to negotiate a shared understanding.
Has a minimal level of understanding of cultural differences in verbal and
nonverbal communication; is unable
to negotiate a shared understanding.
Attitudes Curiosity
Asks complex questions about other cultures, seeks out and articulates answers to these
questions that reflect multiple cultural perspectives.
Asks deeper questions about other cultures and
seeks out answers to these questions.
Asks simple or surface questions about other
cultures.
States minimal interest in learning more about other
cultures.
Attitudes Openness
Initiates and develops interactions with culturally different others. Suspends
judgment in valuing her/his interactions with culturally
different others.
Begins to initiate and develop interactions with
culturally different others. Begins to
suspend judgment in valuing her/his
interactions with culturally different
others.
Expresses openness to most, if not all, interactions with culturally different others.
Has difficulty suspending any judgment in her/his
interactions with culturally different others, and is aware
of own judgment and expresses a willingness to
change.
Receptive to interacting with culturally different
others. Has difficulty suspending any judgment
in her/his interactions with culturally different others, but is unaware of
own judgment.
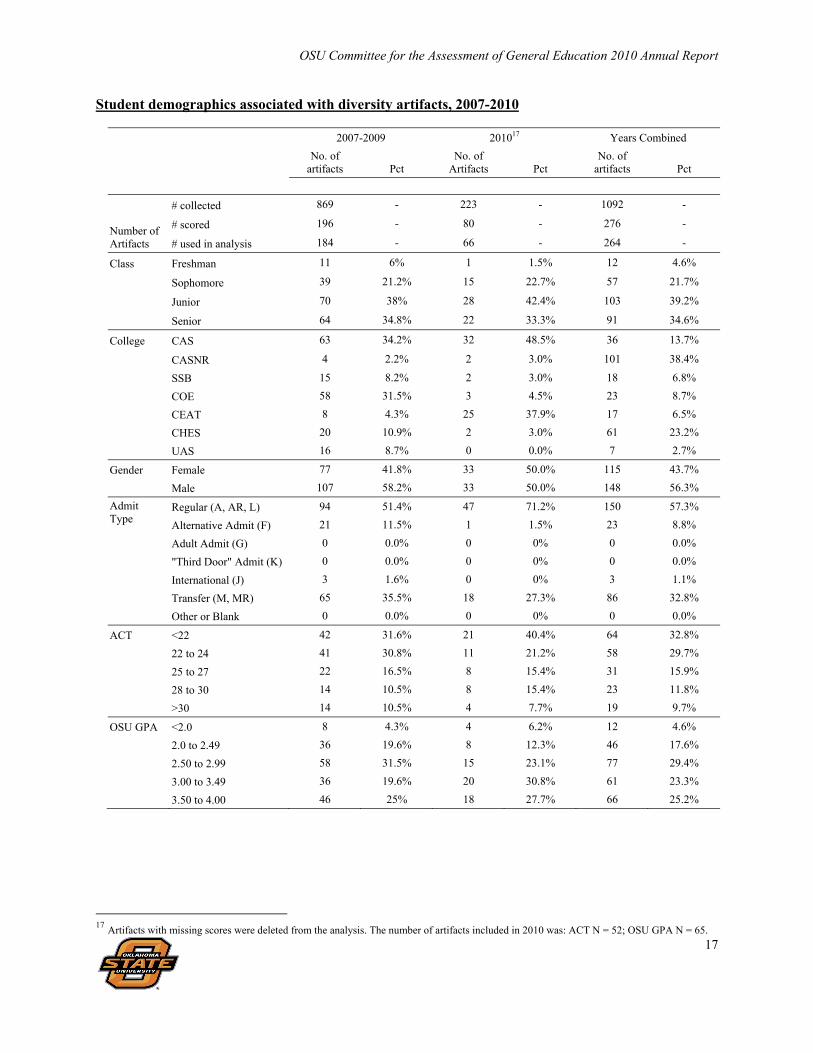
OSU Committee for the Assessment of General Education 2010 Annual Report
17
Student demographics associated with diversity artifacts, 2007-2010
2007-2009 201017 Years Combined
No. of
artifacts
Pct No. of
Artifacts
Pct No. of
artifacts Pct
Number of Artifacts
# collected 869 - 223 - 1092 -
# scored 196 - 80 - 276 -
# used in analysis 184 - 66 - 264 -
Class Freshman 11 6% 1 1.5% 12 4.6%
Sophomore 39 21.2% 15 22.7% 57 21.7%
Junior 70 38% 28 42.4% 103 39.2%
Senior 64 34.8% 22 33.3% 91 34.6%
College CAS 63 34.2% 32 48.5% 36 13.7%
CASNR 4 2.2% 2 3.0% 101 38.4%
SSB 15 8.2% 2 3.0% 18 6.8%
COE 58 31.5% 3 4.5% 23 8.7%
CEAT 8 4.3% 25 37.9% 17 6.5%
CHES 20 10.9% 2 3.0% 61 23.2%
UAS 16 8.7% 0 0.0% 7 2.7%
Gender Female 77 41.8% 33 50.0% 115 43.7%
Male 107 58.2% 33 50.0% 148 56.3%
Admit Type
Regular (A, AR, L) 94 51.4% 47 71.2% 150 57.3%
Alternative Admit (F) 21 11.5% 1 1.5% 23 8.8%
Adult Admit (G) 0 0.0% 0 0% 0 0.0%
"Third Door" Admit (K) 0 0.0% 0 0% 0 0.0%
International (J) 3 1.6% 0 0% 3 1.1%
Transfer (M, MR) 65 35.5% 18 27.3% 86 32.8%
Other or Blank 0 0.0% 0 0% 0 0.0%
ACT <22 42 31.6% 21 40.4% 64 32.8%
22 to 24 41 30.8% 11 21.2% 58 29.7%
25 to 27 22 16.5% 8 15.4% 31 15.9%
28 to 30 14 10.5% 8 15.4% 23 11.8%
>30 14 10.5% 4 7.7% 19 9.7%
OSU GPA <2.0 8 4.3% 4 6.2% 12 4.6%
2.0 to 2.49 36 19.6% 8 12.3% 46 17.6%
2.50 to 2.99 58 31.5% 15 23.1% 77 29.4%
3.00 to 3.49 36 19.6% 20 30.8% 61 23.3%
3.50 to 4.00 46 25% 18 27.7% 66 25.2%
17 Artifacts with missing scores were deleted from the analysis. The number of artifacts included in 2010 was: ACT N = 52; OSU GPA N = 65.
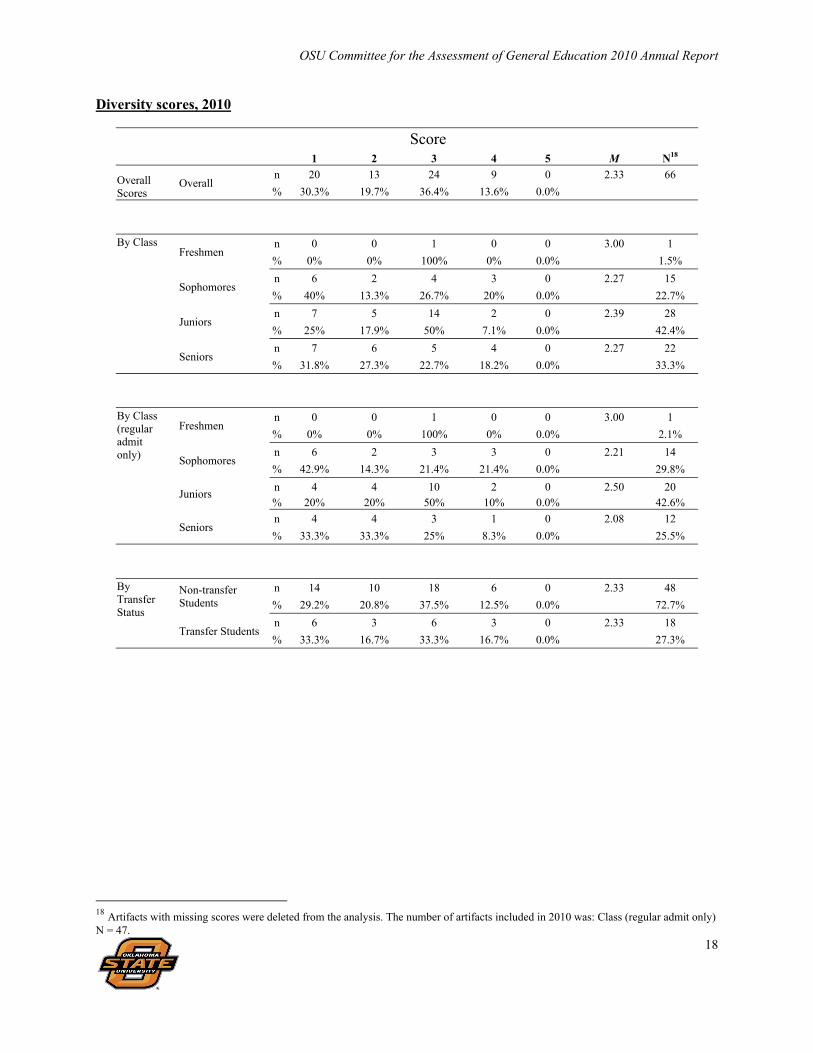
OSU Committee for the Assessment of General Education 2010 Annual Report
18
Diversity scores, 2010
Score
1 2 3 4 5 M N18
Overall Scores
Overall n 20 13 24 9 0 2.33 66
% 30.3% 19.7% 36.4% 13.6% 0.0%
By Class Freshmen
n 0 0 1 0 0 3.00 1
% 0% 0% 100% 0% 0.0% 1.5%
Sophomores n 6 2 4 3 0 2.27 15
% 40% 13.3% 26.7% 20% 0.0% 22.7%
Juniors n 7 5 14 2 0 2.39 28
% 25% 17.9% 50% 7.1% 0.0% 42.4%
Seniors n 7 6 5 4 0 2.27 22
% 31.8% 27.3% 22.7% 18.2% 0.0% 33.3%
By Class (regular admit only)
Freshmen n 0 0 1 0 0 3.00 1
% 0% 0% 100% 0% 0.0% 2.1%
Sophomores n 6 2 3 3 0 2.21 14
% 42.9% 14.3% 21.4% 21.4% 0.0% 29.8%
Juniors n 4 4 10 2 0 2.50 20 % 20% 20% 50% 10% 0.0% 42.6%
Seniors n 4 4 3 1 0 2.08 12
% 33.3% 33.3% 25% 8.3% 0.0% 25.5%
By Transfer Status
Non-transfer Students
n 14 10 18 6 0 2.33 48
% 29.2% 20.8% 37.5% 12.5% 0.0% 72.7%
Transfer Students n 6 3 6 3 0 2.33 18
% 33.3% 16.7% 33.3% 16.7% 0.0% 27.3%
18 Artifacts with missing scores were deleted from the analysis. The number of artifacts included in 2010 was: Class (regular admit only) N = 47.
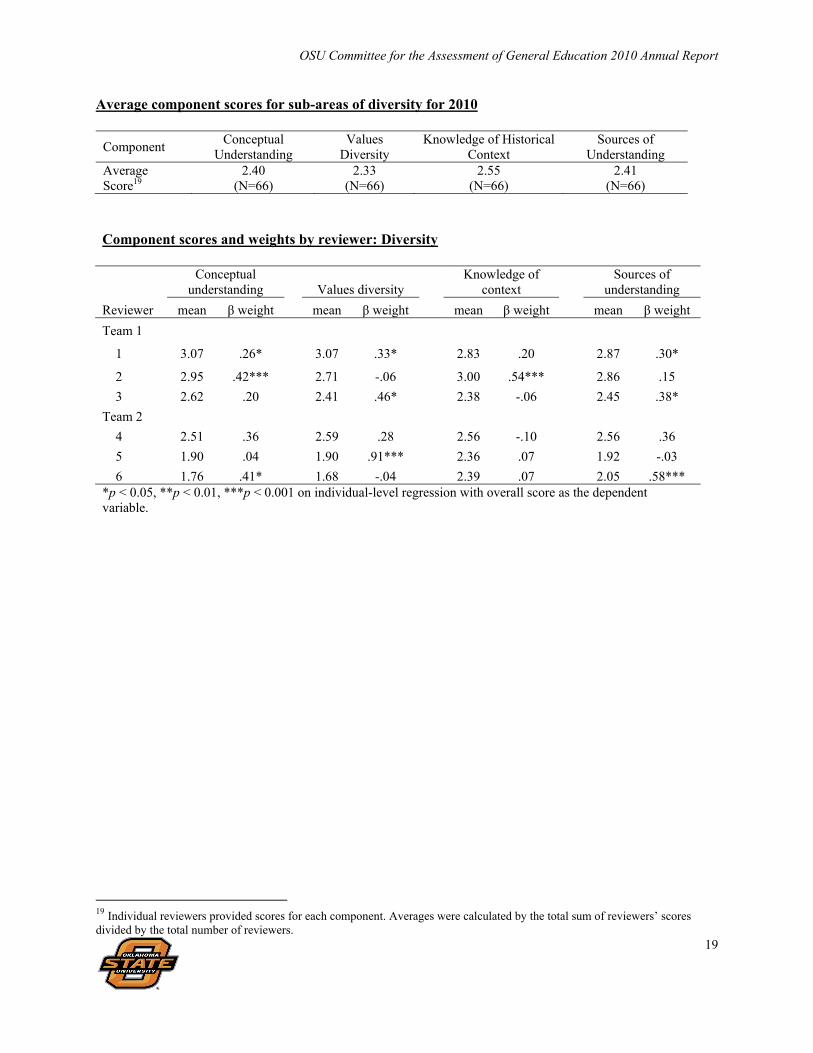
OSU Committee for the Assessment of General Education 2010 Annual Report
19
Average component scores for sub-areas of diversity for 2010
Component Conceptual
Understanding Values
Diversity Knowledge of Historical
Context Sources of
Understanding Average Score19
2.40 (N=66)
2.33 (N=66)
2.55 (N=66)
2.41 (N=66)
Component scores and weights by reviewer: Diversity
Conceptual
understanding Values diversity Knowledge of
context Sources of
understanding
Reviewer mean β weight mean β weight mean β weight mean β weight
Team 1
1 3.07 .26* 3.07 .33* 2.83 .20 2.87 .30*
2 2.95 .42*** 2.71 -.06 3.00 .54*** 2.86 .15
3 2.62 .20 2.41 .46* 2.38 -.06 2.45 .38*
Team 2
4 2.51 .36 2.59 .28 2.56 -.10 2.56 .36
5 1.90 .04 1.90 .91*** 2.36 .07 1.92 -.03
6 1.76 .41* 1.68 -.04 2.39 .07 2.05 .58*** *p < 0.05, **p < 0.01, ***p < 0.001 on individual-level regression with overall score as the dependent variable.
19 Individual reviewers provided scores for each component. Averages were calculated by the total sum of reviewers’ scores divided by the total number of reviewers.
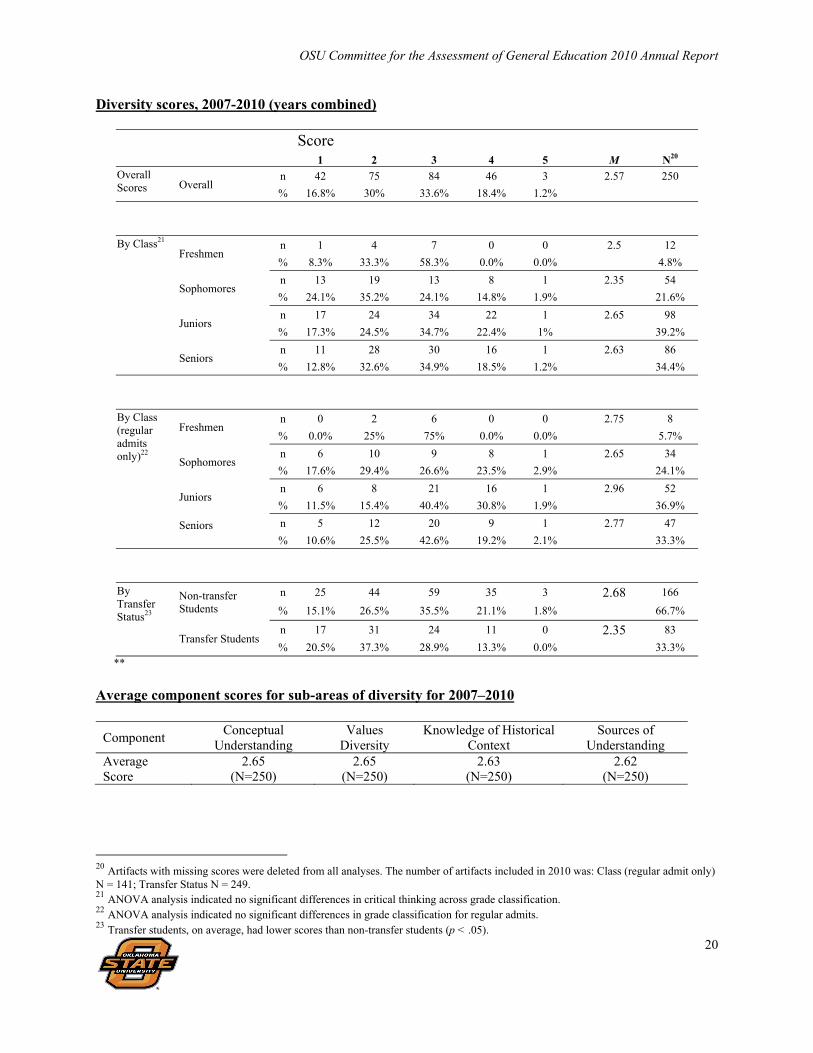
OSU Committee for the Assessment of General Education 2010 Annual Report
20
Diversity scores, 2007-2010 (years combined)
Score
1 2 3 4 5 M N20 Overall Scores Overall
n 42 75 84 46 3 2.57 250
% 16.8% 30% 33.6% 18.4% 1.2%
By Class21 Freshmen
n 1 4 7 0 0 2.5 12
% 8.3% 33.3% 58.3% 0.0% 0.0% 4.8%
Sophomores n 13 19 13 8 1 2.35 54
% 24.1% 35.2% 24.1% 14.8% 1.9% 21.6%
Juniors n 17 24 34 22 1 2.65 98
% 17.3% 24.5% 34.7% 22.4% 1% 39.2%
Seniors n 11 28 30 16 1 2.63 86
% 12.8% 32.6% 34.9% 18.5% 1.2% 34.4%
By Class (regular admits only)22
Freshmen n 0 2 6 0 0 2.75 8
% 0.0% 25% 75% 0.0% 0.0% 5.7%
Sophomores n 6 10 9 8 1 2.65 34
% 17.6% 29.4% 26.6% 23.5% 2.9% 24.1%
Juniors n 6 8 21 16 1 2.96 52
% 11.5% 15.4% 40.4% 30.8% 1.9% 36.9%
Seniors
n 5 12 20 9 1 2.77 47
% 10.6% 25.5% 42.6% 19.2% 2.1% 33.3%
By Transfer Status23
Non-transfer Students
n 25 44 59 35 3 2.68 166
% 15.1% 26.5% 35.5% 21.1% 1.8% 66.7%
Transfer Students n 17 31 24 11 0 2.35 83
% 20.5% 37.3% 28.9% 13.3% 0.0% 33.3% **
Average component scores for sub-areas of diversity for 2007–2010
Component Conceptual
Understanding Values
Diversity Knowledge of Historical
Context Sources of
Understanding Average Score
2.65 (N=250)
2.65 (N=250)
2.63 (N=250)
2.62 (N=250)
20 Artifacts with missing scores were deleted from all analyses. The number of artifacts included in 2010 was: Class (regular admit only) N = 141; Transfer Status N = 249. 21 ANOVA analysis indicated no significant differences in critical thinking across grade classification. 22 ANOVA analysis indicated no significant differences in grade classification for regular admits. 23 Transfer students, on average, had lower scores than non-transfer students (p < .05).
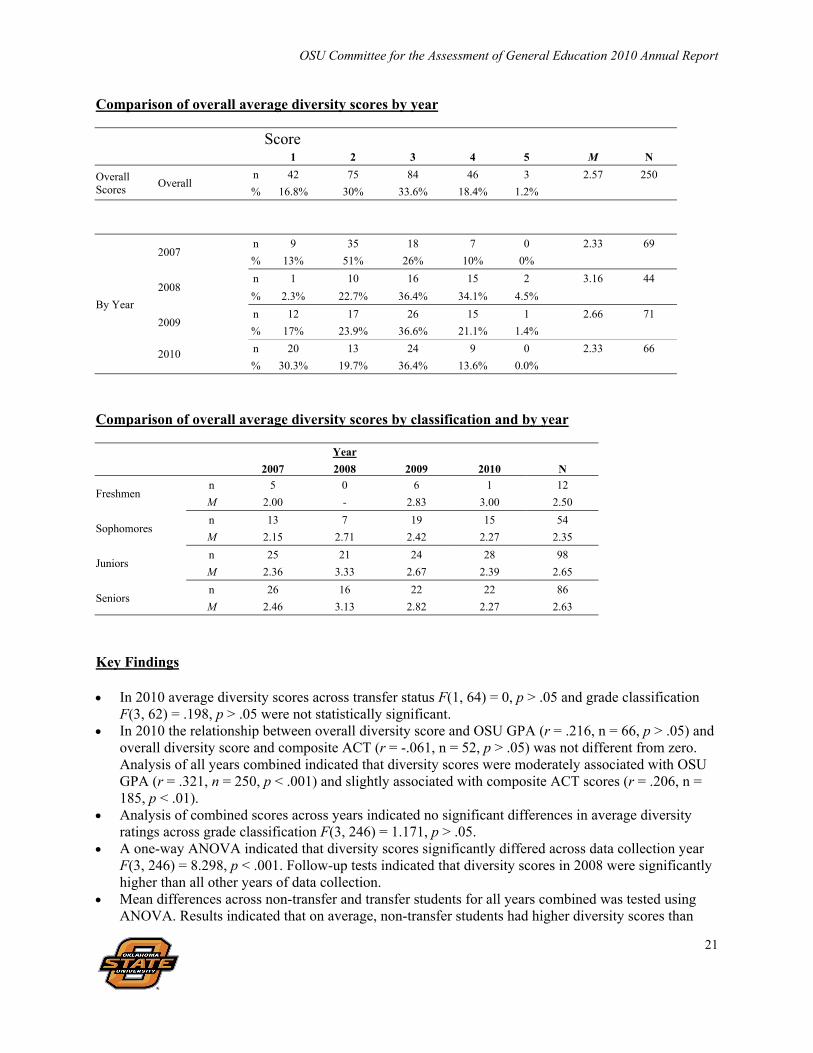
OSU Committee for the Assessment of General Education 2010 Annual Report
21
Comparison of overall average diversity scores by year
Score
1 2 3 4 5 M N
Overall Scores
Overall n 42 75 84 46 3 2.57 250
% 16.8% 30% 33.6% 18.4% 1.2%
By Year
2007 n 9 35 18 7 0 2.33 69
% 13% 51% 26% 10% 0%
2008 n 1 10 16 15 2 3.16 44
% 2.3% 22.7% 36.4% 34.1% 4.5%
2009 n 12 17 26 15 1 2.66 71
% 17% 23.9% 36.6% 21.1% 1.4%
2010
n 20 13 24 9 0 2.33 66
% 30.3% 19.7% 36.4% 13.6% 0.0%
Comparison of overall average diversity scores by classification and by year Year
2007 2008 2009 2010 N
Freshmen n 5 0 6 1 12
M 2.00 - 2.83 3.00 2.50
Sophomores n 13 7 19 15 54
M 2.15 2.71 2.42 2.27 2.35
Juniors n 25 21 24 28 98
M 2.36 3.33 2.67 2.39 2.65
Seniors n 26 16 22 22 86
M 2.46 3.13 2.82 2.27 2.63
Key Findings In 2010 average diversity scores across transfer status F(1, 64) = 0, p > .05 and grade classification
F(3, 62) = .198, p > .05 were not statistically significant. In 2010 the relationship between overall diversity score and OSU GPA (r = .216, n = 66, p > .05) and
overall diversity score and composite ACT (r = -.061, n = 52, p > .05) was not different from zero. Analysis of all years combined indicated that diversity scores were moderately associated with OSU GPA (r = .321, n = 250, p < .001) and slightly associated with composite ACT scores (r = .206, n = 185, p < .01).
Analysis of combined scores across years indicated no significant differences in average diversity ratings across grade classification F(3, 246) = 1.171, p > .05.
A one-way ANOVA indicated that diversity scores significantly differed across data collection year F(3, 246) = 8.298, p < .001. Follow-up tests indicated that diversity scores in 2008 were significantly higher than all other years of data collection.
Mean differences across non-transfer and transfer students for all years combined was tested using ANOVA. Results indicated that on average, non-transfer students had higher diversity scores than

OSU Committee for the Assessment of General Education 2010 Annual Report
22
transfer students F(1, 247) = 6.027, p < .05. Moreover, non-transfer students (M = 3.08, SD = .65) had, on average, higher GPA’s than transfer students (M = 2.79, SD = .54) (p < .01). When controlling for OSU GPA differences in diversity scores across transfer and non-transfer students failed to be statistically significant (b = -.19, t = -1.412, p > .05).
A one-way ANOVA indicated that the mean diversity scores for seniors in 2007 (M = 2.46, SD = .81, n = 26), 2008 (M = 3.12, SD = .89, n = 16), 2009 (M = 2.82, SD = .91, n = 22), and 2010 (M = 2.27, SD = .97, n = 22) differed beyond chance expectations F(3, 82) = 2.748, p < .05. Follow-up tests indicated that 2010 seniors had, on average, lower diversity scores than seniors in 2008 (p < .05).
Analysis of the VALUE Rubric Results Table 3. Overall VALUE rubric scores Score 1 2 3 4 Average n %
25 39.1%
19 29.7%
18 28.1%
2 3.2%
1.94
Table 4. Average component scores for the VALUE rubric Component CSA CWF VNC EMP CUR OPN Average Score
1.89 (N=64)
1.98 (N=64)
N/A (N=0)
1.91 (N=64)
1.86 (N =64)
1.83 (N=64)
Note: CSA = cultural self-awareness; CWF = cultural worldview framework; VNC = verbal and nonverbal communication; EMP = empathy; CUR = curiosity; OPN = openness; N/A = nonapplicable due to no faculty raters providing VNC scores.
Table 5. Association among overall score from OSU’s diversity rubric and VALUE components
Variable 1 2 3 4 5 6 7 8 9 10 11 1. DIV
(OSU) 1.0 .88**
n = 66 .92** n = 66
.71** n = 66
.91** n = 66
.81** n = 60
.80** n = 60
.73** n = 60
.77** n = 60
.77** n = 60
.67** n = 60
2. CON (OSU)
--- 1.0 .88** n = 66
.67** n = 66
.88** n = 66
.77** n = 63
.78** n = 63
.71** n = 63
.75** n = 63
.65** n = 63
.68 n = 63
3. VD (OSU)
--- --- 1.0 .75** n = 66
.89** n = 66
.80** n = 63
.82** n = 63
.74** n = 63
.76** n = 63
.71** n = 63
.71** n = 63
4. KHC (OSU)
--- --- --- 1.0 .77** n = 66
.65** n = 63
.63** n = 63
.67** n = 63
.59** n = 63
.54** n = 63
.52** n = 63
5. UVK (OSU)
--- --- --- --- 1.0 .80** n = 63
.82** n = 63
.78** n = 63
.81** n = 63
.74** n = 63
.73** n = 63
6. VAL (VALUE)
--- --- --- --- --- 1.0 .87** n = 63
.87** n = 64
.90** n = 64
.88** n = 64
.79** n = 64
7. CSA (VALUE)
--- --- --- --- --- --- 1.0 .88** n = 64
.88** n = 64
.84** n = 64
.68** n = 64
8. CWF (VALUE)
--- --- --- --- --- --- --- 1.0 .88** n = 64
.83** n = 64
.71** n = 64
9. EMP (VALUE)
--- --- --- --- --- --- --- --- 1.0 .84** n = 64
.79** n = 64
10. CUR (VALUE)
--- --- --- --- --- --- --- --- --- 1.0 .71** n = 64
11. OPN (VALUE)
--- --- --- --- --- --- --- --- --- --- 1.0
Note: * = p < .05; ** = p < .01; DIV = OSU Diversity Consensus Scores, CON = conceptual understanding, VD = values diversity, KHC = knowledge of historical context; UVK = source of understanding, value, and knowledge; VAL =overall value score; CSA = cultural self-awareness; CWF = cultural worldview; EMP = empathy; CUR = curiosity; OPN = openness. Values in lower left diagonal are the same as values reported in the upper right diagonal.
OSU Committee for the Assessment of General Education 2010 Annual Report
23
VALUE Rubric Key Findings On average, the sample of OSU artifacts had an average VALUE score of 1.94 (cultural self-
awareness = 1.89; cultural worldview framework = 1.98; empathy = 1.91; curiosity = 1.86; openness = 1.83).
Concurrent validity of the OSU diversity rubric may in part be established by examining its association with each component of the VALUE rubric. The overall score from the OSU rubric was highly correlated with the overall VALUE score (r = .81, p < .01), cultural self-awareness (r = .80, p < .01), cultural worldview framework (r = .73, p < .01), empathy (r = .77, p < .01), curiosity, (r = .77, p < .01), and openness (r = .67, p < .01).
A regression analysis indicated that component scores from the OSU diversity rubric (e.g. conceptual understanding, values diversity, knowledge of historical context, and sources of understanding, value, and knowledge) together accounted for 67% of the variance in overall VALUE scores F (4, 58) = 29.054, p < .001.

OSU Committee for the Assessment of General Education 2010 Annual Report
24
Assessment of Written Communication Skills
2010 Collection of Writing Samples The Office of University Assessment and Testing supervised the collection of student writing artifacts in the spring for the Written Communication Skills Institutional Portfolio. Instructors from the following undergraduate courses contributed random samples of student work to the portfolio:
Course No.
Course Name
General
Education Designation
(if any)
Number of artifacts
randomly collected from
one assignment
Number of artifacts reviewed
Number of artifacts
used in data analysis24
ANSI 3903 Agriculture Animals of the World I 21 10 10
BAE 2012 Intro to Eng. Biol. Systems 21 10 10
BIOC 2200 Medicine and Molecules 12 10 10
ENG 2413 Introduction to Literature 21 10 10
ENSC 3213 Computer Based Systems 25 9 9
ENTO 2003 Insects and Society 18 0 0
GEOG 1113 Introduction to Cultural Geography IS 20 5 5
GEOG 2253 World Regional Geography IS 19 9 9
GEOG 2253 World Regional Geography IS 9 0 0
HIST 3633 Early National Period 15 10 10
HIST 4353 American Military History 15 9 9
JB 3013 Advertising Media and Markets 20 0 0
LA 3673 History and Theory Land Arch. 8 0 0
MICR 3103 Microbes: Friend or Foe 3 0 0
NCSI 4643 Capstone for Nutr. Sciences 23 9 9
NSCI 2114 Principles of Human Nutrition 23 0 0
NSCI 2211 Careers in Dietetics 20 9 9
NSCI 3543 Food and Human Environment IS 20 10 10
PSYC 4213 Conflict Resolution 17 0 0
PSYC 4813 Psychological Testing 15 10 10
RUSS 4113 Russian Literature 4 0 0
SOC 1113 Introduction to Sociology 15 8 8
SOC 4950 Gender and The Middle East 21 10 10
SOIL 4483 Soil Microbiology 11 0 0
SPCH 2713 Introduction to Speech 19 10 9
Total Number of Writing Artifacts (samples) 415 148 147
24 The number of artifacts reviewed was less than the number collected. The number of artifacts used in data analysis is less than the number reviewed because one artifact was not scored by the reviewers.
OSU Committee for the Assessment of General Education 2010 Annual Report
25
Artifacts were collected as in previous years. Artifacts selected for the Institutional Portfolio were coded and all identifying information was removed from the samples. Demographic data were collected for each artifact using the OSU student database; these data were collected for analysis purposes only and the information cannot be used to identify an individual. The student demographic information associated with the samples was not shared with reviewers prior to the reviews. 2010 Written Communication Skills Portfolio Reviews Six faculty reviewers for the written communication skills institutional portfolio conducted this assessment in June and July of 2010. All portfolio reviewers met for two training sessions where they received an overview of general education program and the portfolio review process. Upon reviewing the written communication rubric developed by OSU faculty member in 2001, which was later revised in 2008, faculty reviewers examined student writing artifacts from previous data collection years. Faculty reviewers then rated ‘new’ student artifacts during the training session so that reviewers may discuss any questions or concerns regarding the use of the rubric. As with past groups of reviewers, reviewers were rating artifacts fairly consistently by the end of the training session and showed little variation in assigned scores. On the second day of training faculty members were instructed on standard setting procedures, which are discussed below. Faculty members were then divided into two subgroups: review group 1 rated 74 artifacts, and review group 2 rated 73 artifacts. All scoring was done individually and then each subgroup met in order to reach consensus on scores in which there was disagreement. The final scores were then submitted to the Office of University Assessment and Testing for compilation and analysis. 2010 Standard Setting Procedures for Written Communication Portfolios25 Overview Oklahoma State University relies heavily on rubrics for assessment of our general education program (see Bowers & Wilber, 2008). Initiatives like Association of American Colleges and Universities’ VALUE project emphasized the value of rubrics in assessing general education goals and it is clear the use of rubrics is widespread (Moskal, 2000) and continues to grow in higher education assessment. Although rubrics have many positive attributes such as flexibility and transparency and generally have wide acceptance from faculty members, we found ourselves challenged to address three of the Commission’s six fundamental questions on assessment. What evidence do you have that students achieve your stated learning goals? In what ways do you analyze and use evidence of student learning? In what ways do you inform the public and other stakeholders about what and how well your students are learning? Since we began the process of assessing our general education program using rubrics almost ten years ago, panels of faculty members have scored nearly 3,000 samples of student work. We performed numerous statistical analyses on these data, looking for differences by classification year (freshman, sophomore, junior, senior), by transfer status, and by gender and minority status. We examined the relationship between these scores and students’ grade point averages and ACT scores. We searched for trends over time, looking to see if scores went up or down from the previous year. We summarized these findings into detailed reports and shared them with faculty committees, at open forum workshops, and publicly on our website. Yet, amongst all of these analyses, too often we felt we were not adequately addressing these three fundamental questions on assessment because our results lacked clear context that
25 A version of this paper will be presented at the Higher Learning Commission’s Annual Conference in April, 2011.
OSU Committee for the Assessment of General Education 2010 Annual Report
26
our stakeholders could use to frame our assessment results. For example, we know that in 2009 our average on the writing general education outcome was 2.77, which was significantly higher than the results in 2008 but was not significantly different from the results in 2001-2006. But is 2.77 good enough? To address these questions we developed a process for setting performance expectations to provide context for our results and to ultimately help us better address these three fundamental questions. Two methods of setting performance standards were pilot tested using student writing artifacts. Method 1 On the second day of the faculty training session faculty reviewers were given an introduction to the purpose of standard setting procedures. Reviewers were informed that a stated goal of standard setting was to help OSU determine what level of writing proficiency was minimally acceptable for a student graduating with any bachelor degree. This information would allow one to determine whether OSU writing scores are meeting desired goals and outcomes. In other words, if a writing score of ‘4’ was judged as minimally acceptable writing score for a graduating senior then this score could serve as a benchmark for evaluating student writing artifacts and subsequently allow OSU to assess whether writing objectives are being achieved. Upon being informed about the stated goals of standard setting procedures each reviewer was asked to think about a student with minimally acceptable writing proficiency which was about to receive a bachelor’s degree from a university. Reviewers were then asked to write a brief description of what that student’s writing ability might be. Reviewers were informed that their thoughts were not to focus upon on the “average OSU student,” but on an idealized student with minimally acceptable writing proficiency who was preparing to receive a bachelor’s degree. Faculty members were then asked to imagine that they were creating a new university, and that they will be responsible for setting standards for what we expect the writing scores of a minimally proficient student to be at this university. The faculty members were asked to further imagine that we had 100 students who are minimally proficient within a room and to assume that we were going to take a random sample of artifacts from these students. They were then asked to identify the number of student artifacts they would expect to see within each of the five scoring categories used in the OSU writing rubric (i.e. scores range from 1 – 5 with higher scores indicating greater writing ability). Given that they were imagining a random sample of artifacts collected from 100 students, the only requirement placed upon faculty ratings was that the total number of artifacts they assigned was equal to 100. For example, a panelist might estimate 100 students would have a ‘1,’ 20 a ‘2,’ 40 a ‘3,’ 20 a ‘4,’ and 10 a ‘5.’ The score for this panelist is calculated using a weighted mean to give a standard score of ‘3.’ After these discussions each panelist estimated the number of senior writers that would score at each of the five level of performances for each component of the rubric.
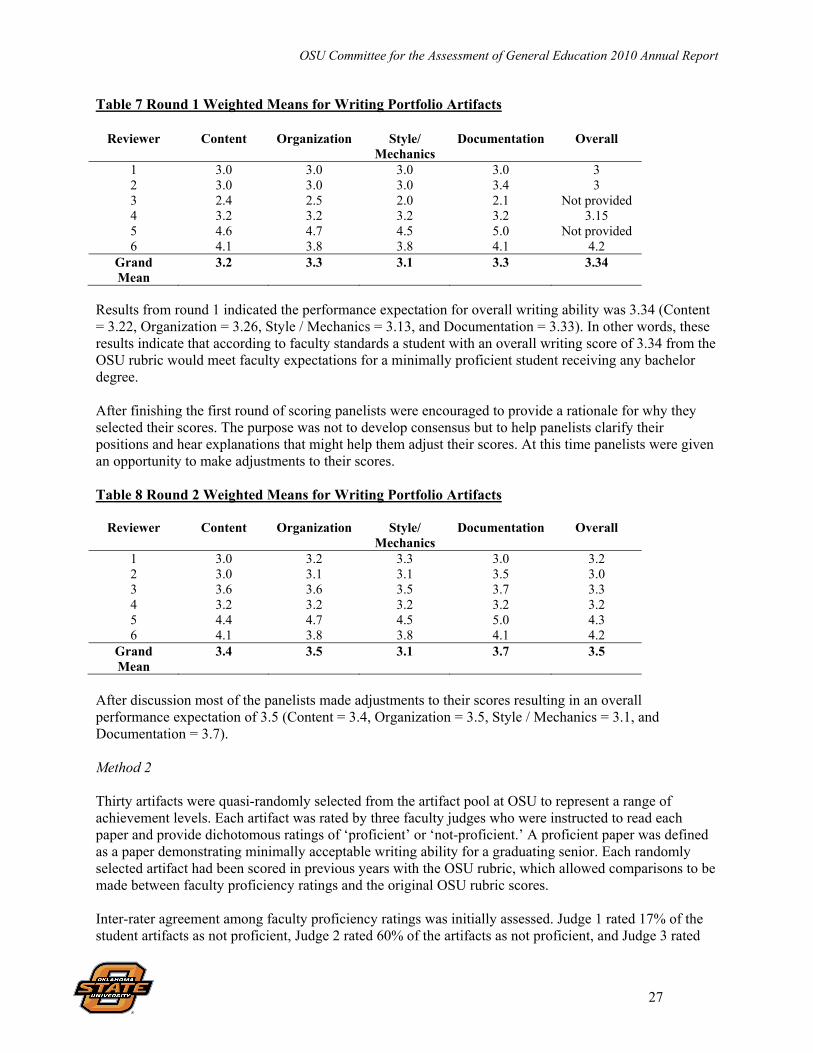
OSU Committee for the Assessment of General Education 2010 Annual Report
27
Table 7 Round 1 Weighted Means for Writing Portfolio Artifacts
Reviewer Content Organization Style/ Mechanics
Documentation Overall
1 3.0 3.0 3.0 3.0 3 2 3.0 3.0 3.0 3.4 3 3 2.4 2.5 2.0 2.1 Not provided 4 3.2 3.2 3.2 3.2 3.15 5 4.6 4.7 4.5 5.0 Not provided 6 4.1 3.8 3.8 4.1 4.2
Grand Mean
3.2 3.3 3.1 3.3 3.34
Results from round 1 indicated the performance expectation for overall writing ability was 3.34 (Content = 3.22, Organization = 3.26, Style / Mechanics = 3.13, and Documentation = 3.33). In other words, these results indicate that according to faculty standards a student with an overall writing score of 3.34 from the OSU rubric would meet faculty expectations for a minimally proficient student receiving any bachelor degree. After finishing the first round of scoring panelists were encouraged to provide a rationale for why they selected their scores. The purpose was not to develop consensus but to help panelists clarify their positions and hear explanations that might help them adjust their scores. At this time panelists were given an opportunity to make adjustments to their scores. Table 8 Round 2 Weighted Means for Writing Portfolio Artifacts
Reviewer Content Organization Style/ Mechanics
Documentation Overall
1 3.0 3.2 3.3 3.0 3.2 2 3.0 3.1 3.1 3.5 3.0 3 3.6 3.6 3.5 3.7 3.3 4 3.2 3.2 3.2 3.2 3.2 5 4.4 4.7 4.5 5.0 4.3 6 4.1 3.8 3.8 4.1 4.2
Grand Mean
3.4 3.5 3.1 3.7 3.5
After discussion most of the panelists made adjustments to their scores resulting in an overall performance expectation of 3.5 (Content = 3.4, Organization = 3.5, Style / Mechanics = 3.1, and Documentation = 3.7). Method 2 Thirty artifacts were quasi-randomly selected from the artifact pool at OSU to represent a range of achievement levels. Each artifact was rated by three faculty judges who were instructed to read each paper and provide dichotomous ratings of ‘proficient’ or ‘not-proficient.’ A proficient paper was defined as a paper demonstrating minimally acceptable writing ability for a graduating senior. Each randomly selected artifact had been scored in previous years with the OSU rubric, which allowed comparisons to be made between faculty proficiency ratings and the original OSU rubric scores. Inter-rater agreement among faculty proficiency ratings was initially assessed. Judge 1 rated 17% of the student artifacts as not proficient, Judge 2 rated 60% of the artifacts as not proficient, and Judge 3 rated
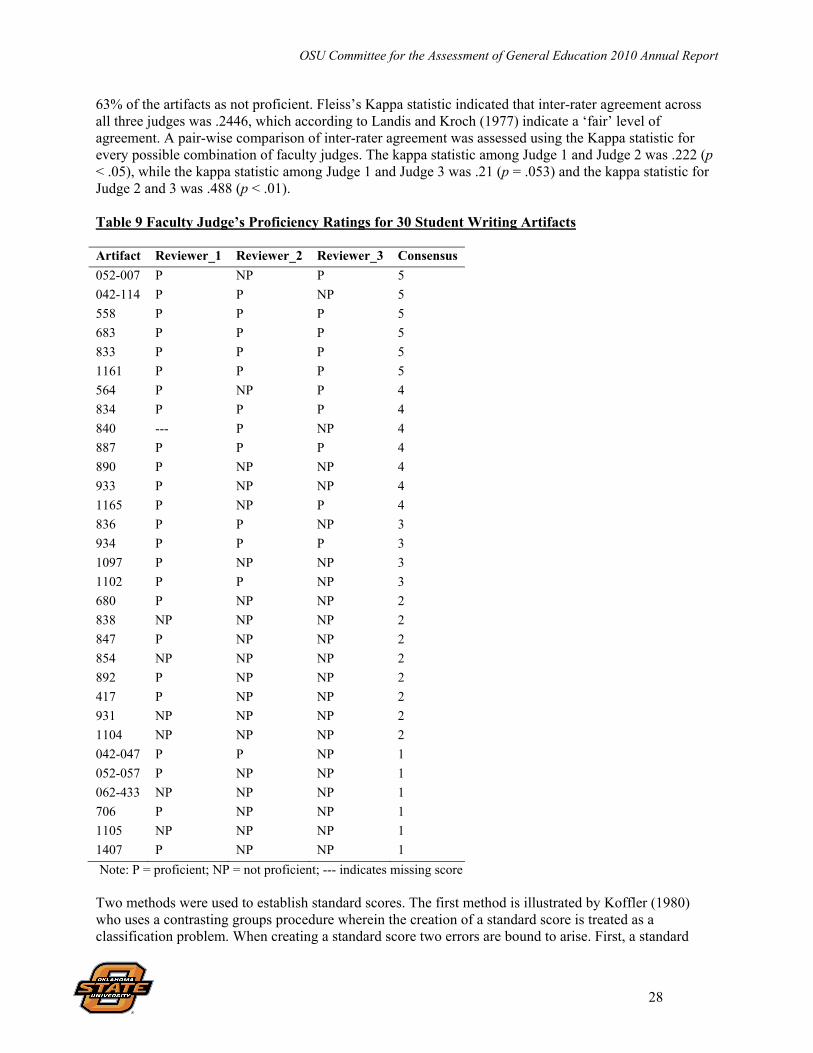
OSU Committee for the Assessment of General Education 2010 Annual Report
28
63% of the artifacts as not proficient. Fleiss’s Kappa statistic indicated that inter-rater agreement across all three judges was .2446, which according to Landis and Kroch (1977) indicate a ‘fair’ level of agreement. A pair-wise comparison of inter-rater agreement was assessed using the Kappa statistic for every possible combination of faculty judges. The kappa statistic among Judge 1 and Judge 2 was .222 (p < .05), while the kappa statistic among Judge 1 and Judge 3 was .21 (p = .053) and the kappa statistic for Judge 2 and 3 was .488 (p < .01). Table 9 Faculty Judge’s Proficiency Ratings for 30 Student Writing Artifacts Artifact Reviewer_1 Reviewer_2 Reviewer_3 Consensus
052-007 P NP P 5
042-114 P P NP 5
558 P P P 5
683 P P P 5
833 P P P 5
1161 P P P 5
564 P NP P 4
834 P P P 4
840 --- P NP 4
887 P P P 4
890 P NP NP 4
933 P NP NP 4
1165 P NP P 4
836 P P NP 3
934 P P P 3
1097 P NP NP 3
1102 P P NP 3
680 P NP NP 2
838 NP NP NP 2
847 P NP NP 2
854 NP NP NP 2
892 P NP NP 2
417 P NP NP 2
931 NP NP NP 2
1104 NP NP NP 2
042-047 P P NP 1
052-057 P NP NP 1
062-433 NP NP NP 1
706 P NP NP 1
1105 NP NP NP 1
1407 P NP NP 1
Note: P = proficient; NP = not proficient; --- indicates missing score Two methods were used to establish standard scores. The first method is illustrated by Koffler (1980) who uses a contrasting groups procedure wherein the creation of a standard score is treated as a classification problem. When creating a standard score two errors are bound to arise. First, a standard
OSU Committee for the Assessment of General Education 2010 Annual Report
29
score may classify a student as a non-master when in fact they have proficient skills. Secondly, a proficiency score may designate a student as a master when in fact they lack proficient skills. According to Koffler a discriminant function statistic can be employed to minimize these errors. Basically, this procedure requires one to calculate a discriminant function which is then compared to a constant. If the value which results from the discriminant function is greater than the constant the artifact score is classified as a master. If the value resultant from the discriminant function is less than the constant the score is classified as a non-master. For the purposes of this analysis, the cost of each misclassification error is assumed to be equal, thus allowing our constant to be defined as follows:
1
2logq
q (1)
where 2q = the number of artifacts judged to be non-masters and 1q is the number of artifacts judged to masters. If scores are ranked and each group has equal variances (in our sample Levene’s test = p > .05) the following discriminant function may be used to compare to the constant derived from equation (1):
2
__
2
__
1
2
__
2
__
1 XX
ZS
XX
(2)
where __
1X is the ranked mean for the master group and __
2X is the ranked mean for the non-master group. 2S is the pooled variance across groups and Z is equal to the consensus score for an individual artifact.
Each consensus rating (i.e. 1-5) can then be inserted into equation (2) in order to examine whether the consensus score would be classified as a master or non-master. Values derived from equation (2) which are greater than the constant from equation (1) are classified as a master whereas values deriving from equation (2) which are less than the constant from equation (1) are classified as a non-master. According to Koffler, under this technique a standard score would be defined by the lowest consensus score classified as a master.
In order to create a standard score mastery and non-mastery groups were created from the Judge’s ratings. An artifact was deemed to be a master if two or more judges rated the artifact as proficient. An artifact was considered to be a non-master if less than two judges rated the artifact as proficient. From this procedure 14 of the artifacts were categorized as a master, and 16 artifacts were classified as non-master. Consensus scores were then ranked in ascending order. The mastery group had a mean rank consensus score of 5.0 (SD = 1.17) and the non-mastery group had a mean rank consensus score of 2.88 (SD = 1.08). Estimation with the discriminant function procedure began with estimating the constant from (1). This estimation is provided below:
06.14
16loglog
1
2
q
q (3)
Results from equation (3) thus provide the constant with which we can compare results from (2). The first consensus score examined in equation (2) was 1. These calculations are given below:
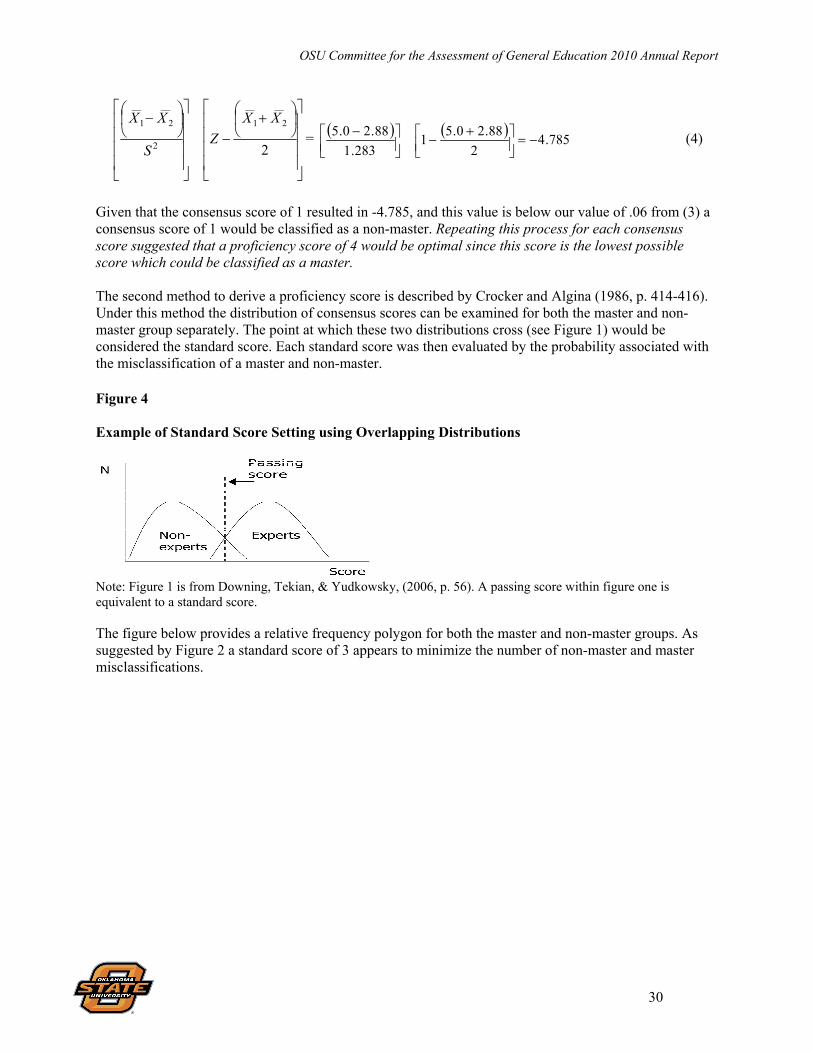
OSU Committee for the Assessment of General Education 2010 Annual Report
30
2
__
2
__
1
2
__
2
__
1 XX
ZS
XX
= 785.4
2
88.20.51
283.1
88.20.5
(4)
Given that the consensus score of 1 resulted in -4.785, and this value is below our value of .06 from (3) a consensus score of 1 would be classified as a non-master. Repeating this process for each consensus score suggested that a proficiency score of 4 would be optimal since this score is the lowest possible score which could be classified as a master. The second method to derive a proficiency score is described by Crocker and Algina (1986, p. 414-416). Under this method the distribution of consensus scores can be examined for both the master and non-master group separately. The point at which these two distributions cross (see Figure 1) would be considered the standard score. Each standard score was then evaluated by the probability associated with the misclassification of a master and non-master. Figure 4 Example of Standard Score Setting using Overlapping Distributions
Note: Figure 1 is from Downing, Tekian, & Yudkowsky, (2006, p. 56). A passing score within figure one is equivalent to a standard score. The figure below provides a relative frequency polygon for both the master and non-master groups. As suggested by Figure 2 a standard score of 3 appears to minimize the number of non-master and master misclassifications.
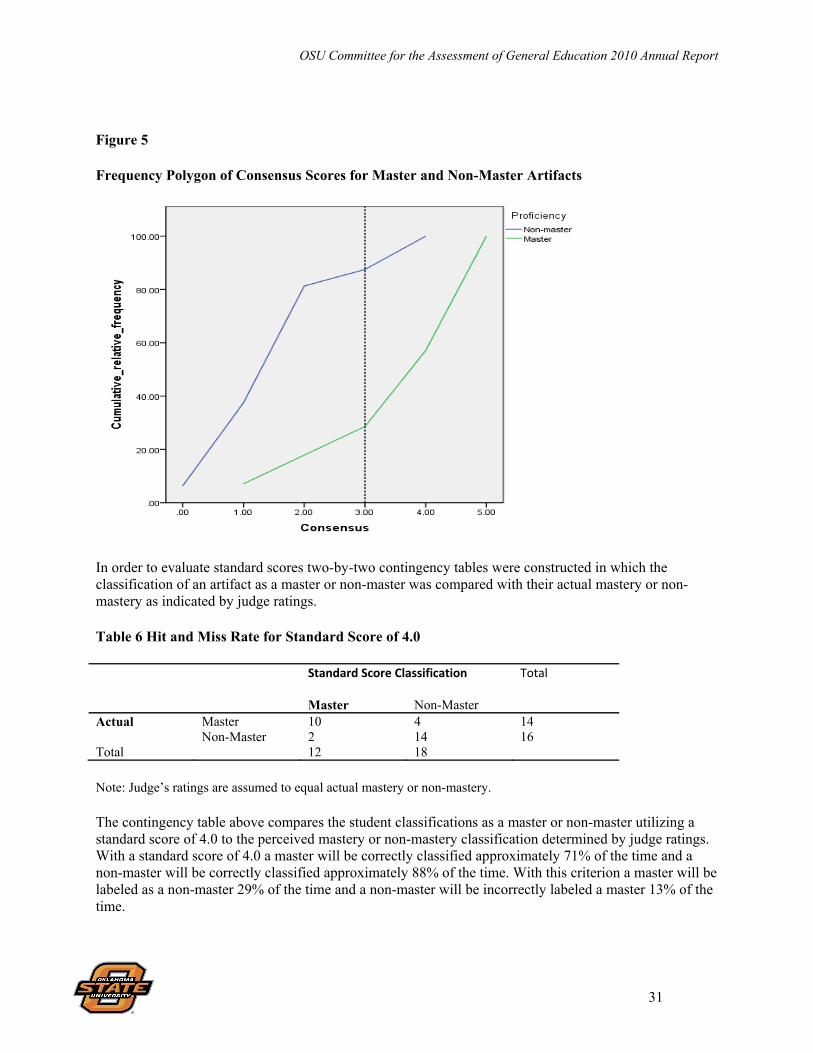
OSU Committee for the Assessment of General Education 2010 Annual Report
31
Figure 5
Frequency Polygon of Consensus Scores for Master and Non-Master Artifacts
In order to evaluate standard scores two-by-two contingency tables were constructed in which the classification of an artifact as a master or non-master was compared with their actual mastery or non-mastery as indicated by judge ratings.
Table 6 Hit and Miss Rate for Standard Score of 4.0
Standard Score Classification
Total
Master Non-Master Actual Master 10 4 14
Non-Master 2 14 16 Total 12 18
Note: Judge’s ratings are assumed to equal actual mastery or non-mastery.
The contingency table above compares the student classifications as a master or non-master utilizing a standard score of 4.0 to the perceived mastery or non-mastery classification determined by judge ratings. With a standard score of 4.0 a master will be correctly classified approximately 71% of the time and a non-master will be correctly classified approximately 88% of the time. With this criterion a master will be labeled as a non-master 29% of the time and a non-master will be incorrectly labeled a master 13% of the time.
OSU Committee for the Assessment of General Education 2010 Annual Report
32
The contingency table below compares the student classifications as a master or non-master when utilizing a standard score of 3.0 to the perceived mastery or non-mastery classification determined by judge ratings.
Table 7 Hit and Miss Rate for a Standard Score of 3.0
Standard Score Classification
Total
Master Non-Master Actual Master 13 1 14
Non-Master 3 13 16 Total 16 14
Note: Classification used by Judge’s ratings are assumed to equal actual mastery or non-mastery.
From this table it can be seen that with this criterion a master would be correctly classified 93% of time and misclassified 7% of the time. A non-master will be correctly classified nearly 81% of the time and incorrectly classified about 19% of the time.
Key Findings
Under Method 1 faculty members were asked to provide the expected number of artifacts to fall within each score of the OSU rubric when taking a random sample of artifacts from 100 students with minimally proficient writing ability. The results from this procedure indicated that an overall writing score of 3.49, when using the OSU rubric, would meet minimally acceptable writing standards for a graduating senior. Under Method 2 faculty judges rated 30 artifacts as proficient or not proficient when proficiency is defined as a minimally acceptable writing ability for a graduating senior. When comparing judge ratings to the original scores, or scores obtained in previous years using the OSU rubric, a standard score of 3 or 4, depending on the selected statistical method, was suggested. When using these standard scores to classify student papers as masters or non-masters it appears that utilizing a standard score of 3 decreases the probability of misclassification errors.
Conclusions/Recommendations
Assessing student outcomes in writing ability is a fundamental component of evaluating GE goals at OSU. Currently OSU has no criterion by which to evaluate writing goals. Creating a standard score, or a score which is judged to reflect minimally acceptable writing standards for a graduating senior, would provide a needed benchmark that can be used to determine whether student performance in writing ability is acceptable. Using a benchmark to evaluate student learning outcomes would also allow OSU to efficiently target interventions in areas in which student outcomes are below acceptable standards.
Any standard score will have potential advantages and disadvantages. Utilizing a standard score of 3.49 for overall writing ability would allow a more precise evaluation for assessing whether the average student writing ability at OSU is acceptable. If the goal was to assess whether one particular artifact was written at an acceptable standard, it is necessary to consider that it is currently not possible under the OSU rubric to obtain an overall score with decimals. Since only whole numbers are assigned as scores for any particular artifact classifying individual artifacts as proficient or not proficient with a standard score of 3.49 would be equivalent to using a standard score of 4. When examining the creation of a standard score as a classification problem it appears that a standard score of 3 minimized the number of misclassification

OSU Committee for the Assessment of General Education 2010 Annual Report
33
errors when compared to a standard score of 4. However, this approach examined classification errors under the assumption that faculty judges’ ratings of proficiency reflected an artifact’s actual level of proficiency. This assumption may not be tenable since the inter-rater agreement among our three faculty judges was relatively low.
Based on our experience in this pilot study, we would recommend Method 1 in carrying out a standard setting process for rubrics. The discussion and engagement of the panelists during the standard setting process produced many benefits by enhancing panelists’ understanding of the rubric and the learning outcome. This method also gave panelists the opportunity to reflect upon and discuss our expectations for student achievement in this important domain. Although the two approaches we piloted resulted in somewhat different standard scores, the process of setting performance expectations provides a context for answering the three of HLC’s questions on assessment at OSU. The next step for us at Oklahoma State is to implement a similar standard setting process with other groups of faculty members both within- and across-departments and to expand the standard setting process to other general education learning outcomes.
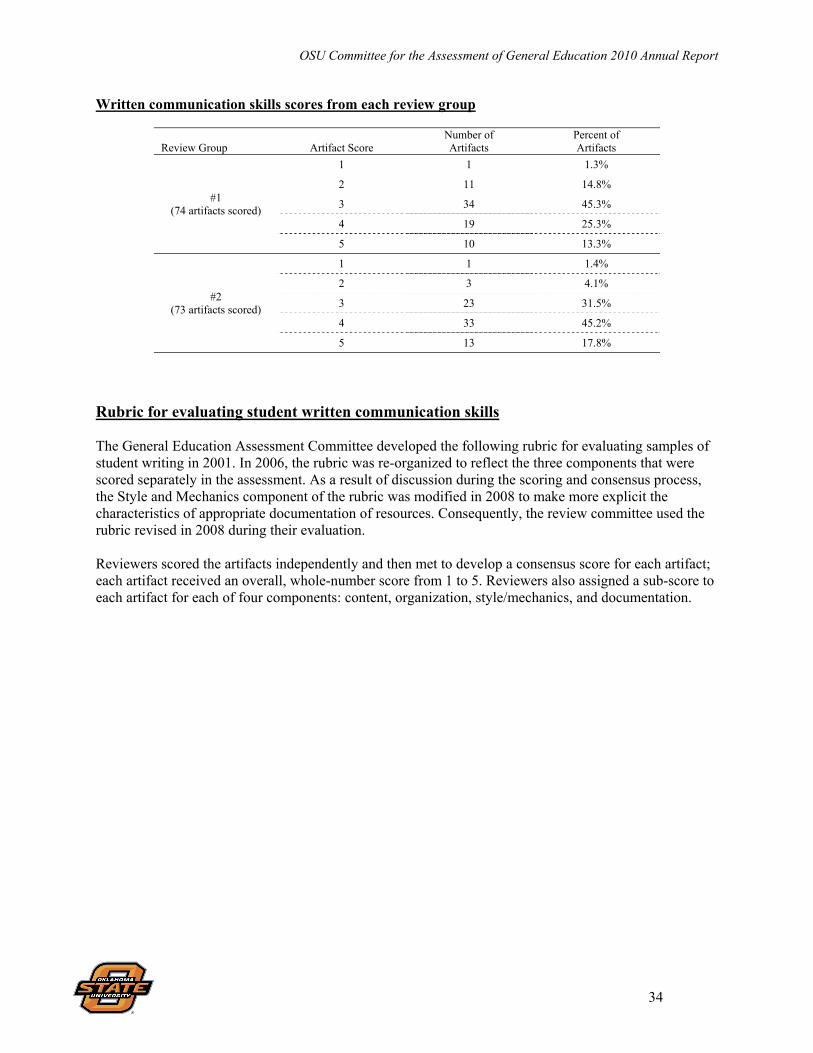
OSU Committee for the Assessment of General Education 2010 Annual Report
34
Written communication skills scores from each review group
Review Group
Artifact Score
Number of Artifacts
Percent of Artifacts
#1 (74 artifacts scored)
1 1 1.3%
2 11 14.8%
3 34 45.3%
4 19 25.3%
5 10 13.3%
#2 (73 artifacts scored)
1 1 1.4%
2 3 4.1%
3 23 31.5%
4 33 45.2%
5 13 17.8%
Rubric for evaluating student written communication skills The General Education Assessment Committee developed the following rubric for evaluating samples of student writing in 2001. In 2006, the rubric was re-organized to reflect the three components that were scored separately in the assessment. As a result of discussion during the scoring and consensus process, the Style and Mechanics component of the rubric was modified in 2008 to make more explicit the characteristics of appropriate documentation of resources. Consequently, the review committee used the rubric revised in 2008 during their evaluation. Reviewers scored the artifacts independently and then met to develop a consensus score for each artifact; each artifact received an overall, whole-number score from 1 to 5. Reviewers also assigned a sub-score to each artifact for each of four components: content, organization, style/mechanics, and documentation.

OSU Committee for the Assessment of General Education 2010 Annual Report
35
OSU Written Communication Rubric Learning Outcome: Graduates will be able to communicate effectively in writing.
Level of Achievement
Skill 1
2*
3
4**
5
A
Content
Topic is poorly developed; support is only vague or general; ideas are trite; wording is unclear, simplistic; reflects lack of understanding of topic and audience; minimally accomplishes goals of the assignment.
Topic is evident; some supporting detail; wording is generally clear; reflects understanding of topic and audience; generally accomplishes goals of the assignment.
Topic/thesis is clearly stated and well developed; details/wording is accurate, specific, appropriate for the topic & audience, with no digressions; evidence of effective, clear thinking; completely accomplishes the goals of the assignment.
B
Organization
Most paragraphs are rambling and unfocused; no clear beginning or ending paragraphs; inappropriate or missing sequence markers. No clear over-all organization
Most paragraphs are focused; discernible beginning and ending paragraphs; some appropriate sequence markers. Overall organization can be inferred and is appropriate for the assignment
Paragraphs are clearly focused and organized around a central theme; clear beginnings and ending paragraphs; appropriate, coherent sequences and sequence markers. Overall organization is clearly marked and is appropriate for the assignment
C
Style and mechanics
Inappropriate or inaccurate word choice; repetitive words and sentence types; inappropriate or inconsistent point of view and tone. Frequent non-standard grammar, spelling, punctuation interferes with comprehension and writer's credibility.
Generally appropriate word choice; variety in vocabulary and sentence types; appropriate point of view and tone. Some non-standard grammar, spelling, and punctuation; errors do not generally interfere with comprehension or writer's credibility.
Word choice appropriate for the task; precise, vivid vocabulary; variety of sentence types; consistent and appropriate point of view and tone. Standard grammar, spelling, punctuation; no interference with comprehension or writer's credibility.
D Documentation
Intext and ending documentation are generally inconsistent and incomplete; cited information is not incorporated into the document.
Intext and ending documentation are generally clear, consistent, and complete; cited information is somewhat incorporated into the document.
Intext and ending documentation are clear, consistent, and complete; cited information is incorporated effectively into the document.
* Exhibits most characteristics of ‘1’ and some of ‘3’ ** Exhibits most characteristics of ‘3’ and some of ‘5’ revised 5-14-08
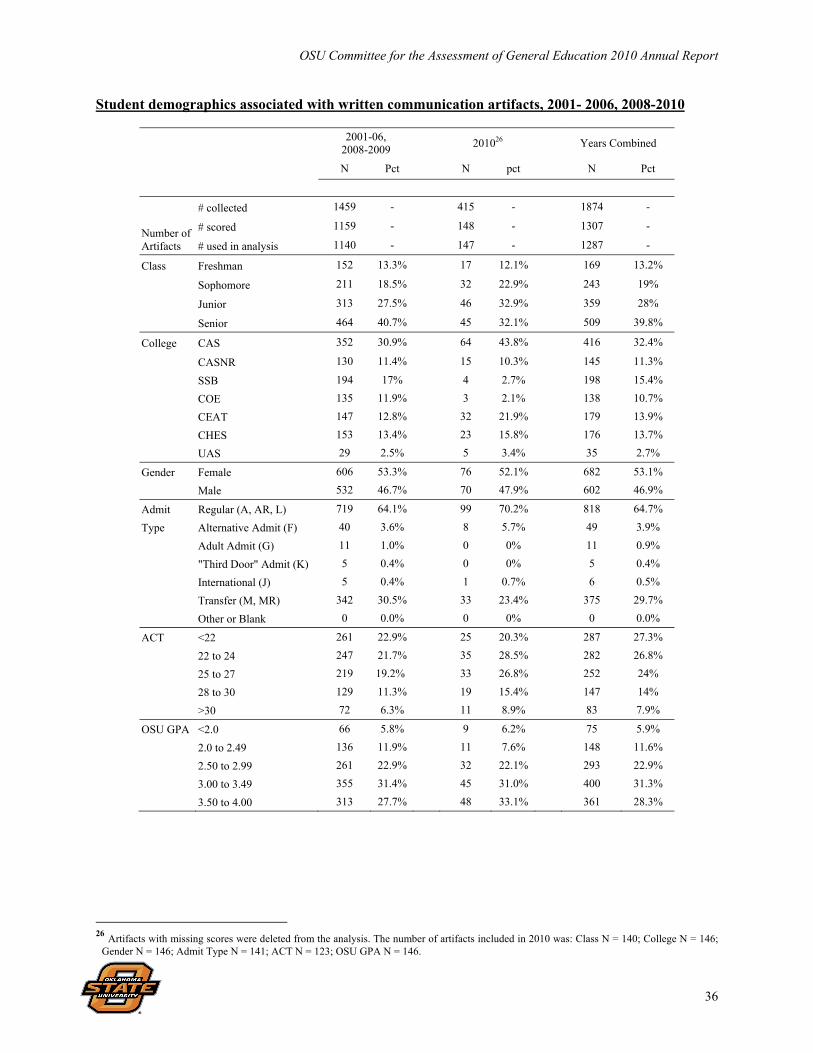
OSU Committee for the Assessment of General Education 2010 Annual Report
36
Student demographics associated with written communication artifacts, 2001- 2006, 2008-2010
2001-06,
2008-2009 201026 Years Combined
N Pct N pct N Pct
Number of Artifacts
# collected 1459 - 415 - 1874 -
# scored 1159 - 148 - 1307 -
# used in analysis 1140 - 147 - 1287 -
Class Freshman 152 13.3% 17 12.1% 169 13.2%
Sophomore 211 18.5% 32 22.9% 243 19%
Junior 313 27.5% 46 32.9% 359 28%
Senior 464 40.7% 45 32.1% 509 39.8%
College CAS 352 30.9% 64 43.8% 416 32.4%
CASNR 130 11.4% 15 10.3% 145 11.3%
SSB 194 17% 4 2.7% 198 15.4%
COE 135 11.9% 3 2.1% 138 10.7%
CEAT 147 12.8% 32 21.9% 179 13.9%
CHES 153 13.4% 23 15.8% 176 13.7%
UAS 29 2.5% 5 3.4% 35 2.7%
Gender Female 606 53.3% 76 52.1% 682 53.1%
Male 532 46.7% 70 47.9% 602 46.9%
Admit Regular (A, AR, L) 719 64.1% 99 70.2% 818 64.7%
Type Alternative Admit (F) 40 3.6% 8 5.7% 49 3.9%
Adult Admit (G) 11 1.0% 0 0% 11 0.9%
"Third Door" Admit (K) 5 0.4% 0 0% 5 0.4%
International (J) 5 0.4% 1 0.7% 6 0.5%
Transfer (M, MR) 342 30.5% 33 23.4% 375 29.7%
Other or Blank 0 0.0% 0 0% 0 0.0%
ACT <22 261 22.9% 25 20.3% 287 27.3%
22 to 24 247 21.7% 35 28.5% 282 26.8%
25 to 27 219 19.2% 33 26.8% 252 24%
28 to 30 129 11.3% 19 15.4% 147 14%
>30 72 6.3% 11 8.9% 83 7.9%
OSU GPA <2.0 66 5.8% 9 6.2% 75 5.9%
2.0 to 2.49 136 11.9% 11 7.6% 148 11.6%
2.50 to 2.99 261 22.9% 32 22.1% 293 22.9%
3.00 to 3.49 355 31.4% 45 31.0% 400 31.3%
3.50 to 4.00 313 27.7% 48 33.1% 361 28.3%
26 Artifacts with missing scores were deleted from the analysis. The number of artifacts included in 2010 was: Class N = 140; College N = 146;
Gender N = 146; Admit Type N = 141; ACT N = 123; OSU GPA N = 146.
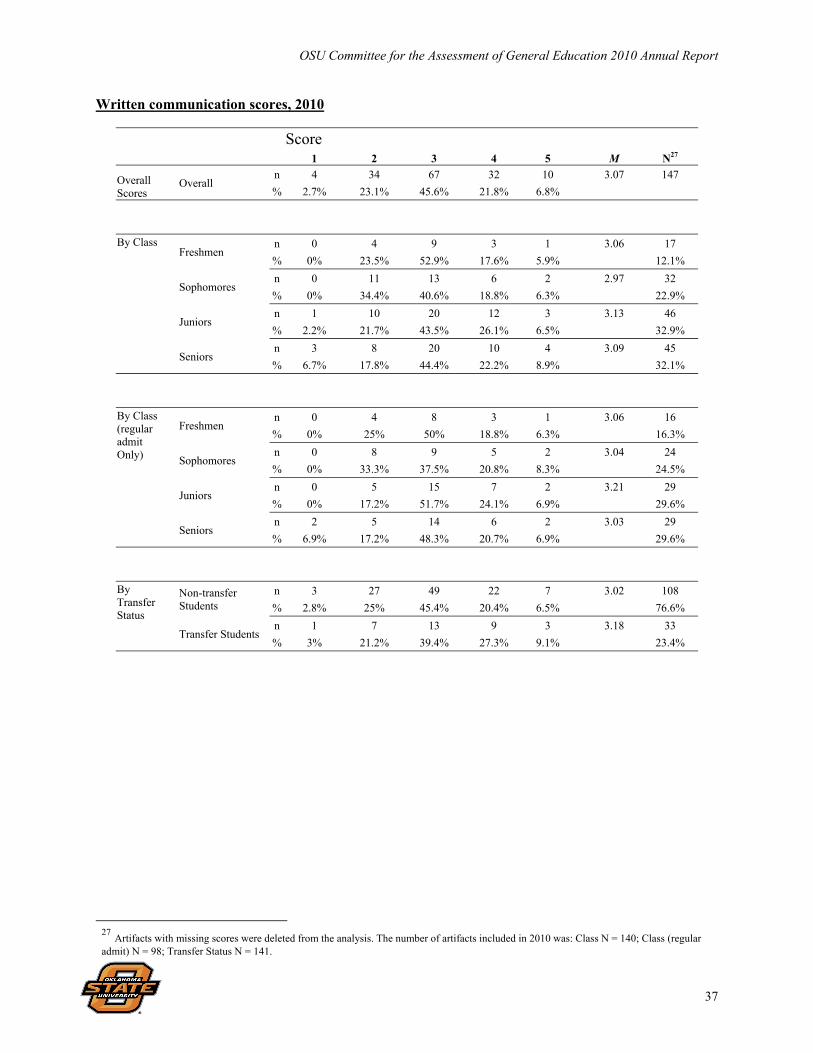
OSU Committee for the Assessment of General Education 2010 Annual Report
37
Written communication scores, 2010
Score
1 2 3 4 5 M N27
Overall Scores
Overall n 4 34 67 32 10 3.07 147
% 2.7% 23.1% 45.6% 21.8% 6.8%
By Class Freshmen
n 0 4 9 3 1 3.06 17
% 0% 23.5% 52.9% 17.6% 5.9% 12.1%
Sophomores n 0 11 13 6 2 2.97 32
% 0% 34.4% 40.6% 18.8% 6.3% 22.9%
Juniors n 1 10 20 12 3 3.13 46
% 2.2% 21.7% 43.5% 26.1% 6.5% 32.9%
Seniors n 3 8 20 10 4 3.09 45
% 6.7% 17.8% 44.4% 22.2% 8.9% 32.1%
By Class (regular admit Only)
Freshmen n 0 4 8 3 1 3.06 16
% 0% 25% 50% 18.8% 6.3% 16.3%
Sophomores n 0 8 9 5 2 3.04 24
% 0% 33.3% 37.5% 20.8% 8.3% 24.5%
Juniors n 0 5 15 7 2 3.21 29
% 0% 17.2% 51.7% 24.1% 6.9% 29.6%
Seniors n 2 5 14 6 2 3.03 29
% 6.9% 17.2% 48.3% 20.7% 6.9% 29.6%
By Transfer Status
Non-transfer Students
n 3 27 49 22 7 3.02 108
% 2.8% 25% 45.4% 20.4% 6.5% 76.6%
Transfer Students n 1 7 13 9 3 3.18 33
% 3% 21.2% 39.4% 27.3% 9.1% 23.4%
27 Artifacts with missing scores were deleted from the analysis. The number of artifacts included in 2010 was: Class N = 140; Class (regular admit) N = 98; Transfer Status N = 141.

OSU Committee for the Assessment of General Education 2010 Annual Report
38
Average component scores for sub-areas of written communication for 2010
Component Content Organization Style/Mechanics Documentation Average Score28
3.27 (N=147)
3.10 (N=147)
3.03 (N=147)
2.93 (N=82)
Component scores and weights by reviewer: Written communication Content Organization Style / Mechanics
Reviewer mean β weight mean β weight mean β weight
Team 1
1 3.42 .38*** 3.29 .12 3.12 .50***
2 3.62 .41*** 3.56 .14 3.32 .48***
3 3.66 .35*** 3.23 .37*** 3.19 .31***
Team 2
4 3.01 .30** 2.85 .19* 2.64 .52***
5 3.02 .51*** 2.88 .18 2.97 .30***
6 2.85 .42*** 2.75 .38*** 2.91 .27*** *p < 0.05, **p < 0.01, ***p < 0.001 on individual-level regression with overall score as the dependent variable; An insufficient number of scores for documentation were provided by reviewers so this variable was left out of the analysis.
28 Individual reviewers provided scores for each component. Averages were calculated by the total sum of reviewers’ scores divided by the total number of reviewers.
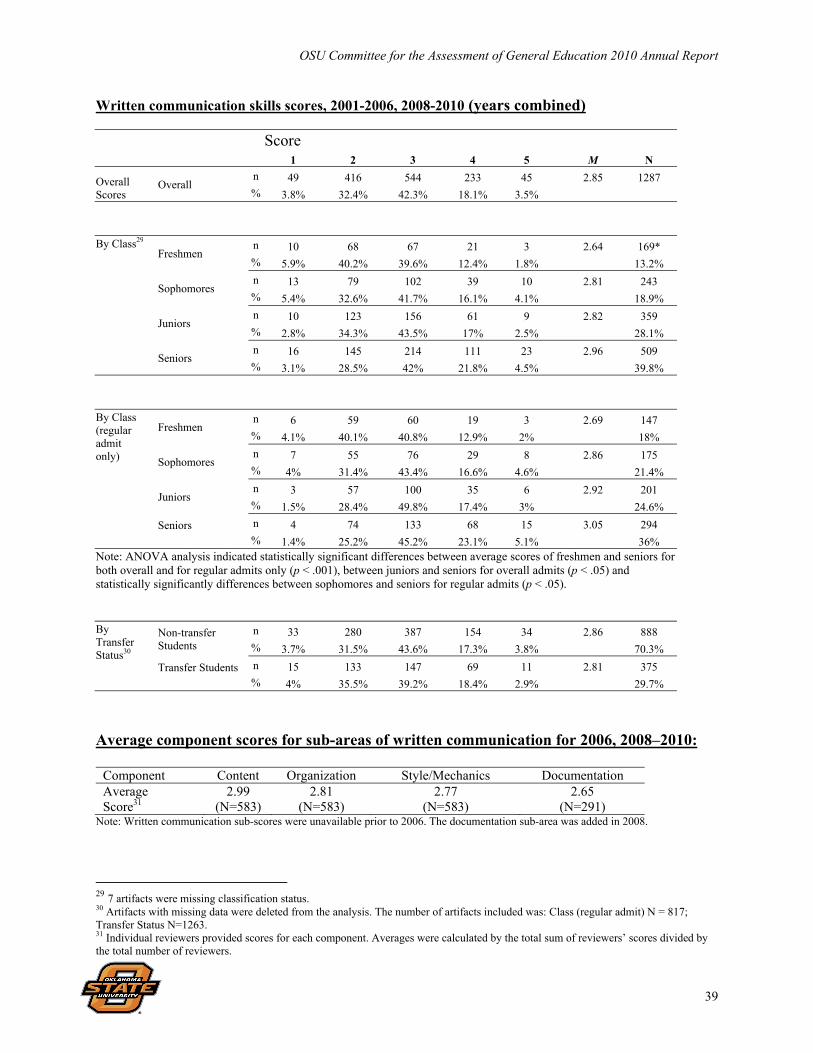
OSU Committee for the Assessment of General Education 2010 Annual Report
39
Written communication skills scores, 2001-2006, 2008-2010 (years combined)
Score
1 2 3 4 5 M N
Overall Scores
Overall n 49 416 544 233 45 2.85 1287 % 3.8% 32.4% 42.3% 18.1% 3.5%
By Class29 Freshmen
n 10 68 67 21 3 2.64 169* % 5.9% 40.2% 39.6% 12.4% 1.8% 13.2%
Sophomores n 13 79 102 39 10 2.81 243 % 5.4% 32.6% 41.7% 16.1% 4.1% 18.9%
Juniors n 10 123 156 61 9 2.82 359 % 2.8% 34.3% 43.5% 17% 2.5% 28.1%
Seniors n 16 145 214 111 23 2.96 509 % 3.1% 28.5% 42% 21.8% 4.5% 39.8%
By Class (regular admit only)
Freshmen n 6 59 60 19 3 2.69 147 % 4.1% 40.1% 40.8% 12.9% 2% 18%
Sophomores n 7 55 76 29 8 2.86 175 % 4% 31.4% 43.4% 16.6% 4.6% 21.4%
Juniors n 3 57 100 35 6 2.92 201 % 1.5% 28.4% 49.8% 17.4% 3% 24.6%
Seniors
n 4 74 133 68 15 3.05 294 % 1.4% 25.2% 45.2% 23.1% 5.1% 36%
Note: ANOVA analysis indicated statistically significant differences between average scores of freshmen and seniors for both overall and for regular admits only (p < .001), between juniors and seniors for overall admits (p < .05) and statistically significantly differences between sophomores and seniors for regular admits (p < .05).
By Transfer Status30
Non-transfer Students
n 33 280 387 154 34 2.86 888 % 3.7% 31.5% 43.6% 17.3% 3.8% 70.3%
Transfer Students
n 15 133 147 69 11 2.81 375 % 4% 35.5% 39.2% 18.4% 2.9% 29.7%
Average component scores for sub-areas of written communication for 2006, 2008–2010:
Component Content Organization Style/Mechanics Documentation Average Score31
2.99 (N=583)
2.81 (N=583)
2.77 (N=583)
2.65 (N=291)
Note: Written communication sub-scores were unavailable prior to 2006. The documentation sub-area was added in 2008.
29 7 artifacts were missing classification status. 30 Artifacts with missing data were deleted from the analysis. The number of artifacts included was: Class (regular admit) N = 817; Transfer Status N=1263. 31 Individual reviewers provided scores for each component. Averages were calculated by the total sum of reviewers’ scores divided by the total number of reviewers.

OSU Committee for the Assessment of General Education 2010 Annual Report
40
Comparison of overall average written communication scores by year
Score
1 2 3 4 5 M N
Overall Scores
Overall n 49 416 544 233 45 2.85 1287
% 3.8% 32.3% 42.3% 18.1% 3.5%
By Year
2001 n 2 28 36 15 5 2.92 86
% 2.4% 32.9% 41.2% 17.6% 5.9%
2002 n 11 26 53 20 1 2.77 111
% 9.9% 23.4% 47.7% 18% 0.9%
2003 n 8 64 99 48 6 2.91 225
% 3.6% 28.4% 44% 21.3% 2.7%
2004 n 6 37 53 33 11 3.04 140
% 4.3% 26.4% 37.9% 23.6% 7.9%
2005 n 7 41 65 23 6 2.86 142
% 4.9% 28.9% 45.8% 16.2% 4.2%
2006 n 2 25 51 30 1 3.03 109
% 1.8% 22.9% 46.8% 27.5% 0.9%
2008 n 7 104 56 13 1 2.43 181
% 3.9% 57.5% 30.9% 7.2% 0.6%
2009 n 2 57 64 19 4 2.77 146
% 1.4% 39% 43.8% 13% 2.7%
2010 n 4 34 67 32 10 3.07 147
% 2.7% 23.1% 45.6% 21.8% 6.8%
Comparison of overall average written communication scores by classification and by year Year
2001 2002 2003 2004 2005 2006 2008 2009 2010 N
Freshmen n 15 23 31 19 16 6 17 25 17 169
M 2.47 2.65 2.58 2.74 2.69 2.67 2.24 2.68 3.06
Sophomores n 19 14 48 25 35 10 40 19 32 242
M 2.90 2.57 2.79 3.32 2.83 2.90 2.43 2.74 2.97
Juniors n 20 34 52 39 46 38 45 39 46 359
M 3.00 2.82 3.04 2.74 2.65 2.92 2.47 2.67 3.13
Seniors n 31 40 94 57 45 55 79 63 45 509
M 3.10 2.85 3.01 3.23 3.16 3.16 2.46 2.87 3.09
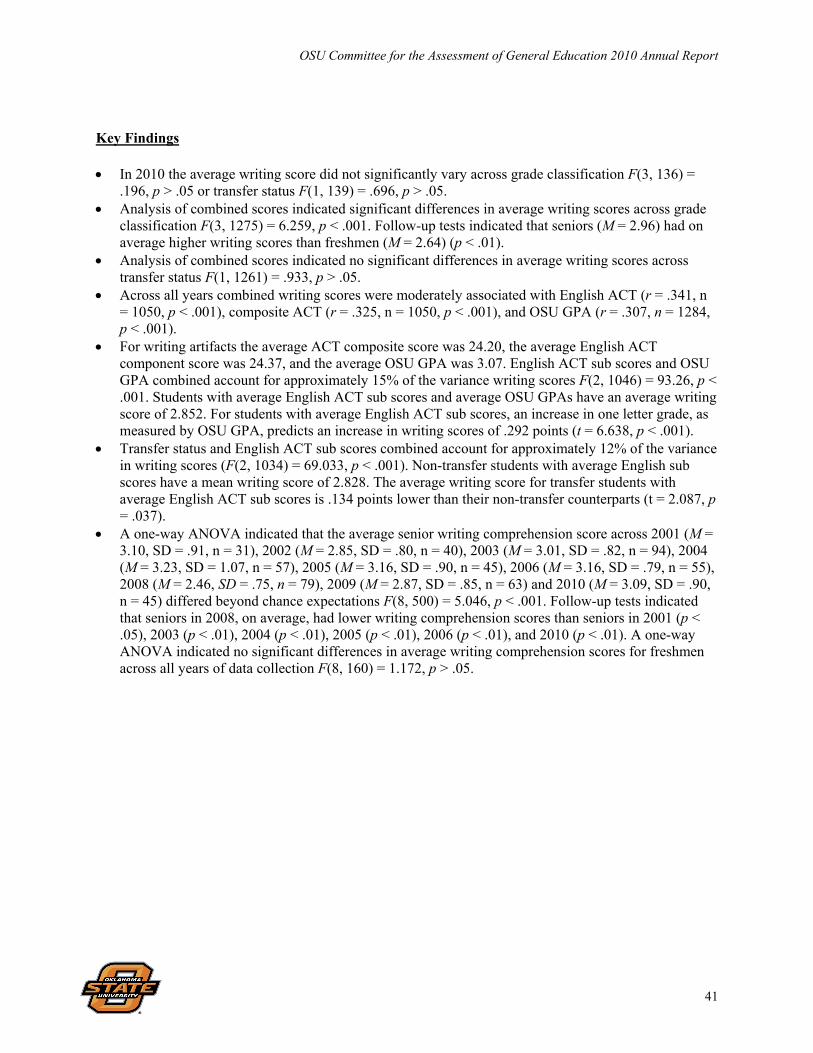
OSU Committee for the Assessment of General Education 2010 Annual Report
41
Key Findings In 2010 the average writing score did not significantly vary across grade classification F(3, 136) =
.196, p > .05 or transfer status F(1, 139) = .696, p > .05. Analysis of combined scores indicated significant differences in average writing scores across grade
classification F(3, 1275) = 6.259, p < .001. Follow-up tests indicated that seniors (M = 2.96) had on average higher writing scores than freshmen (M = 2.64) (p < .01).
Analysis of combined scores indicated no significant differences in average writing scores across transfer status F(1, 1261) = .933, p > .05.
Across all years combined writing scores were moderately associated with English ACT (r = .341, n = 1050, p < .001), composite ACT (r = .325, n = 1050, p < .001), and OSU GPA (r = .307, n = 1284, p < .001).
For writing artifacts the average ACT composite score was 24.20, the average English ACT component score was 24.37, and the average OSU GPA was 3.07. English ACT sub scores and OSU GPA combined account for approximately 15% of the variance writing scores F(2, 1046) = 93.26, p < .001. Students with average English ACT sub scores and average OSU GPAs have an average writing score of 2.852. For students with average English ACT sub scores, an increase in one letter grade, as measured by OSU GPA, predicts an increase in writing scores of .292 points (t = 6.638, p < .001).
Transfer status and English ACT sub scores combined account for approximately 12% of the variance in writing scores (F(2, 1034) = 69.033, p < .001). Non-transfer students with average English sub scores have a mean writing score of 2.828. The average writing score for transfer students with average English ACT sub scores is .134 points lower than their non-transfer counterparts (t = 2.087, p = .037).
A one-way ANOVA indicated that the average senior writing comprehension score across 2001 (M = 3.10, SD = .91, n = 31), 2002 (M = 2.85, SD = .80, n = 40), 2003 (M = 3.01, SD = .82, n = 94), 2004 (M = 3.23, SD = 1.07, n = 57), 2005 (M = 3.16, SD = .90, n = 45), 2006 (M = 3.16, SD = .79, n = 55), 2008 (M = 2.46, SD = .75, n = 79), 2009 (M = 2.87, SD = .85, n = 63) and 2010 (M = 3.09, SD = .90, n = 45) differed beyond chance expectations F(8, 500) = 5.046, p < .001. Follow-up tests indicated that seniors in 2008, on average, had lower writing comprehension scores than seniors in 2001 (p < .05), 2003 (p < .01), 2004 (p < .01), 2005 (p < .01), 2006 (p < .01), and 2010 (p < .01). A one-way ANOVA indicated no significant differences in average writing comprehension scores for freshmen across all years of data collection F(8, 160) = 1.172, p > .05.

OSU Committee for the Assessment of General Education 2010 Annual Report
42
Assessment of Minimum Writing Requirements for GE Designated Courses Increased writing requirements for General Education (GE) designated courses began being phased into the requirements for receipt of the GE designation in 2005. Subsequent analyses were performed in order to explore whether the implementation of these requirements were aiding student writing outcomes. Descriptive characteristics by GE designation for artifacts from 2001 to 2010 are provided below. Descriptive Statistics for GE Designated Writing Artifacts from 2001 to 2010
GE 2001 2002 2003 2004 2005 2006 2008 2009 2010 Total None n
M 39 2.74
52 2.60
111 2.93
98 3.06
67 2.93
48 2.88
145 2.39
87 2.71
113 2.97
760 2.79
H n M
42 3.14
29 3.24
49 2.96
10 3.20
0 n/a
30 3.37
18 2.89
19 3.21
0 n/a
197 3.13
I n M
0 n/a
0 n/a
0 n/a
0 n/a
0 n/a
9 3.22
0 n/a
12 2.58
10 3.50
31 3.06
S n M
0 n/a
20 2.75
40 2.85
22 2.91
0 n/a
8 2.75
0 n/a
15 2.67
0 n/a
105 2.81
HI n M
0 n/a
5 3.00
7 3.00
0 n/a
0 n/a
0 n/a
0 n/a
6 2.67
0 n/a
18 2.89
N n M
5 2.40
0 n/a
0 n/a
0 n/a
54 2.76
14 2.86
0 n/a
7 2.86
0 n/a
80 2.76
IS n M
0 n/a
5 1.60
18 2.78
10 3.00
21 2.91
0 n/a
18 2.33
0 n/a
24 3.38
96 2.83
Total n M
86 2.91
111 2.77
225 2.91
140 3.04
142 2.86
109 3.03
181 2.43
146 2.77
147 3.07
1287
Given that a relatively small number of artifacts exist within some GE designations, a decision was made to categorize artifacts into the following two groups based upon their GE designation: 1 = GE designated courses and 2 = No GE designation. These two groups were then examined for changes in their average writing score across 2001 and 2010 (see Figure 6). A visual examination of Figure 6 suggests that before 2005, or the year in which GE writing requirements were fully phased into OSU standards, no obvious patterns in writing scores emerged across the two groups. After 2005 however, a clear pattern appears to emerge wherein average writing scores for GE designated courses are consistently higher than averages for non-GE designated courses. In other words, after 2005 writing artifacts sampled from GE designated courses had an average consensus score consistently higher than writing artifacts sampled from courses without GE designations. Figure 6 reflects an interaction among GE designation and year of data collection. That is, the effect of GE designation on writing scores may change across year of data collection. A true longitudinal investigation of this effect however, is hindered by the fact that different artifacts are collected from different students each year of data collection.
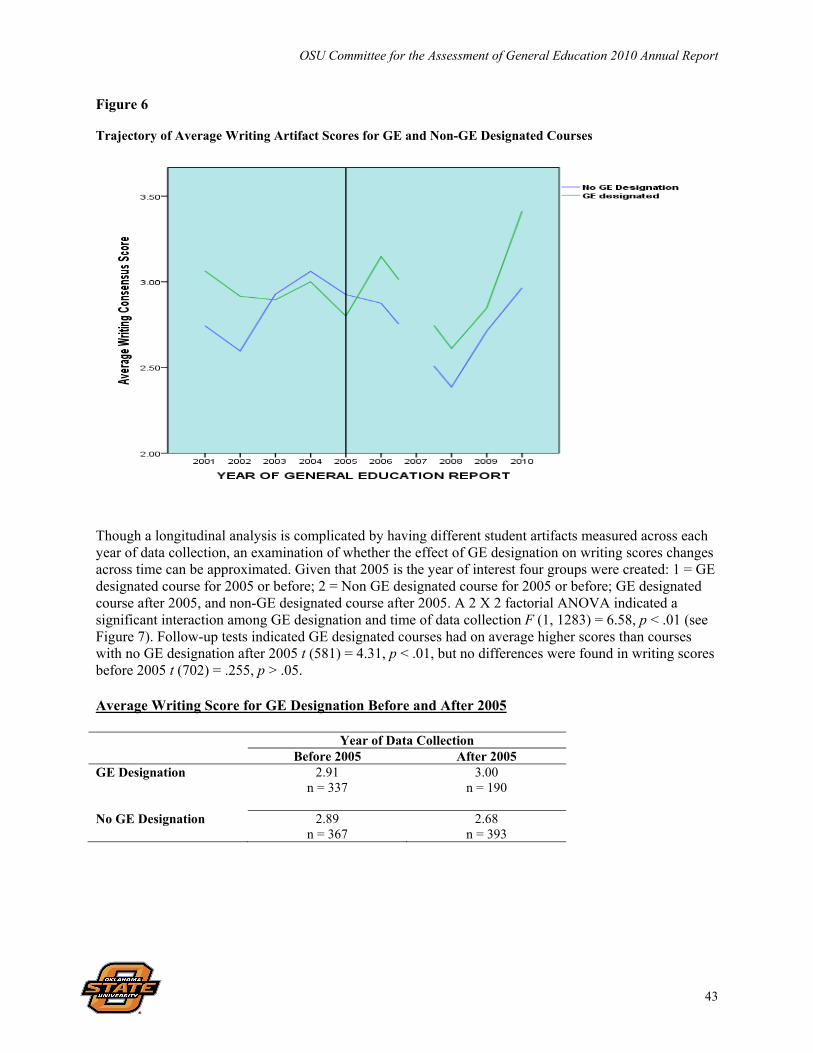
OSU Committee for the Assessment of General Education 2010 Annual Report
43
Figure 6 Trajectory of Average Writing Artifact Scores for GE and Non-GE Designated Courses
Though a longitudinal analysis is complicated by having different student artifacts measured across each year of data collection, an examination of whether the effect of GE designation on writing scores changes across time can be approximated. Given that 2005 is the year of interest four groups were created: 1 = GE designated course for 2005 or before; 2 = Non GE designated course for 2005 or before; GE designated course after 2005, and non-GE designated course after 2005. A 2 X 2 factorial ANOVA indicated a significant interaction among GE designation and time of data collection F (1, 1283) = 6.58, p < .01 (see Figure 7). Follow-up tests indicated GE designated courses had on average higher scores than courses with no GE designation after 2005 t (581) = 4.31, p < .01, but no differences were found in writing scores before 2005 t (702) = .255, p > .05. Average Writing Score for GE Designation Before and After 2005 Year of Data Collection Before 2005 After 2005 GE Designation 2.91
n = 337
3.00 n = 190
No GE Designation 2.89 n = 367
2.68 n = 393
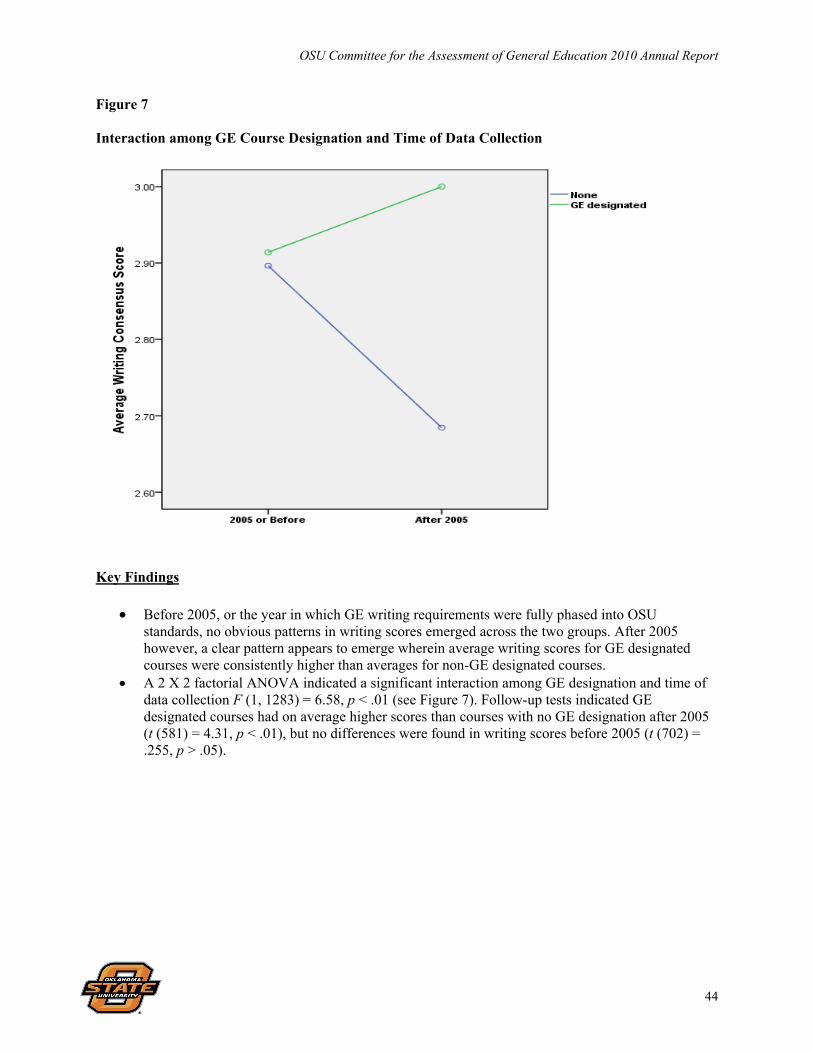
OSU Committee for the Assessment of General Education 2010 Annual Report
44
Figure 7 Interaction among GE Course Designation and Time of Data Collection
Key Findings
Before 2005, or the year in which GE writing requirements were fully phased into OSU standards, no obvious patterns in writing scores emerged across the two groups. After 2005 however, a clear pattern appears to emerge wherein average writing scores for GE designated courses were consistently higher than averages for non-GE designated courses.
A 2 X 2 factorial ANOVA indicated a significant interaction among GE designation and time of data collection F (1, 1283) = 6.58, p < .01 (see Figure 7). Follow-up tests indicated GE designated courses had on average higher scores than courses with no GE designation after 2005 (t (581) = 4.31, p < .01), but no differences were found in writing scores before 2005 (t (702) = .255, p > .05).
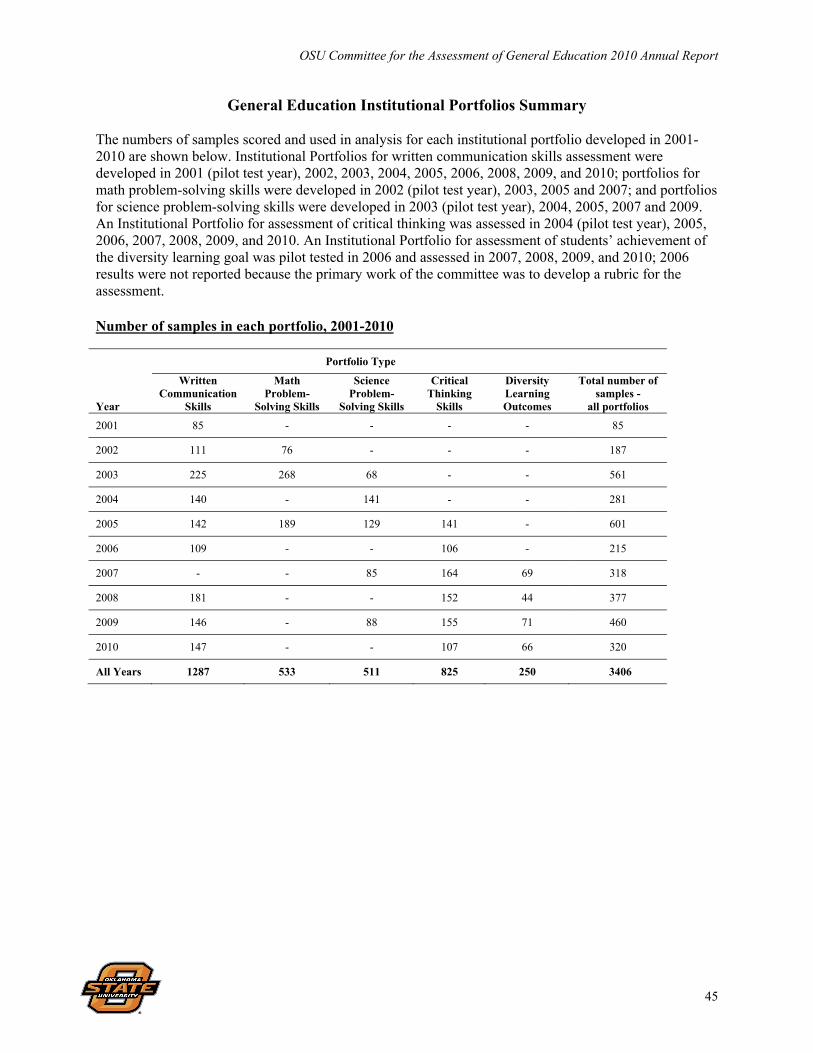
OSU Committee for the Assessment of General Education 2010 Annual Report
45
General Education Institutional Portfolios Summary The numbers of samples scored and used in analysis for each institutional portfolio developed in 2001-2010 are shown below. Institutional Portfolios for written communication skills assessment were developed in 2001 (pilot test year), 2002, 2003, 2004, 2005, 2006, 2008, 2009, and 2010; portfolios for math problem-solving skills were developed in 2002 (pilot test year), 2003, 2005 and 2007; and portfolios for science problem-solving skills were developed in 2003 (pilot test year), 2004, 2005, 2007 and 2009. An Institutional Portfolio for assessment of critical thinking was assessed in 2004 (pilot test year), 2005, 2006, 2007, 2008, 2009, and 2010. An Institutional Portfolio for assessment of students’ achievement of the diversity learning goal was pilot tested in 2006 and assessed in 2007, 2008, 2009, and 2010; 2006 results were not reported because the primary work of the committee was to develop a rubric for the assessment. Number of samples in each portfolio, 2001-2010
Year
Portfolio Type Written
Communication Skills
Math Problem-
Solving Skills
Science Problem-
Solving Skills
Critical Thinking
Skills
Diversity Learning Outcomes
Total number of samples -
all portfolios
2001 85 - - - - 85
2002 111 76 - - - 187
2003 225 268 68 - - 561
2004 140 - 141 - - 281
2005 142 189 129 141 - 601
2006 109 - - 106 - 215
2007 - - 85 164 69 318
2008 181 - - 152 44 377
2009 146 - 88 155 71 460
2010 147 - - 107 66 320
All Years 1287 533 511 825 250 3406
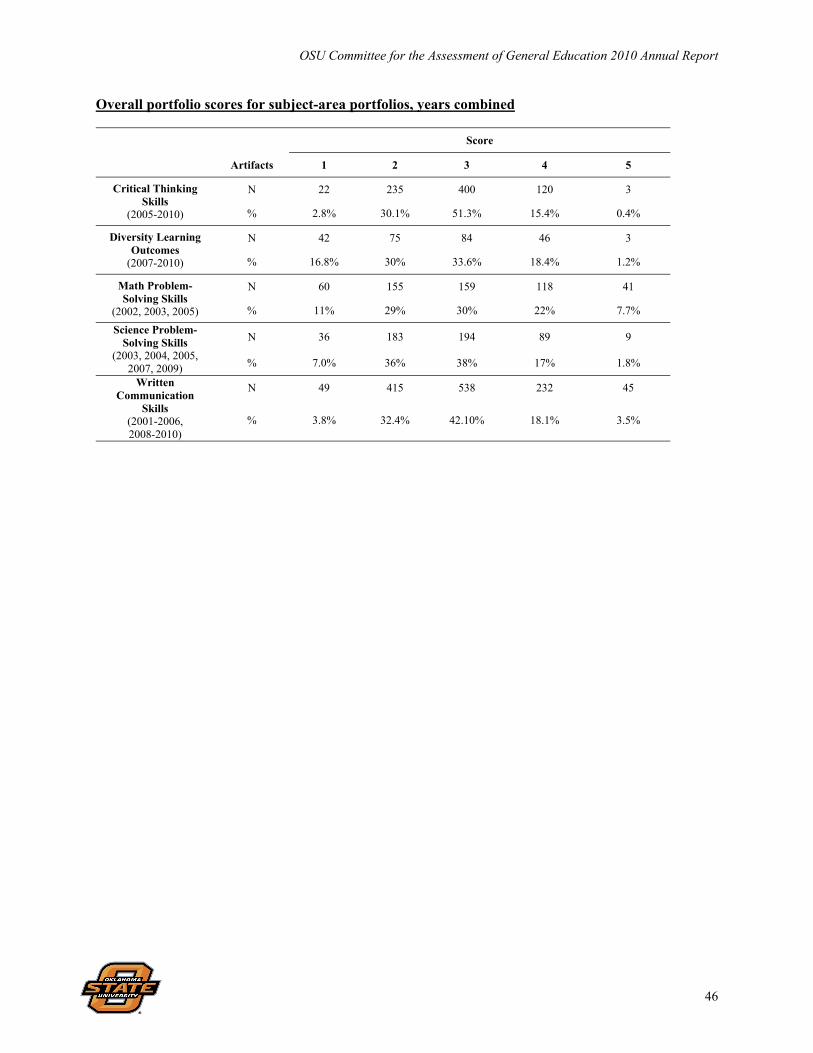
OSU Committee for the Assessment of General Education 2010 Annual Report
46
Overall portfolio scores for subject-area portfolios, years combined
Score
Artifacts 1 2 3 4 5
Critical Thinking Skills
(2005-2010)
N 22 235 400 120 3
% 2.8% 30.1% 51.3% 15.4% 0.4%
Diversity Learning Outcomes
(2007-2010)
N 42 75 84 46 3
% 16.8% 30% 33.6% 18.4% 1.2%
Math Problem- Solving Skills
(2002, 2003, 2005)
N 60 155 159 118 41
% 11% 29% 30% 22% 7.7%
Science Problem- Solving Skills
(2003, 2004, 2005, 2007, 2009)
N 36 183 194 89 9
% 7.0% 36% 38% 17% 1.8%
Written Communication
Skills (2001-2006, 2008-2010)
N 49 415 538 232 45
% 3.8% 32.4% 42.10% 18.1% 3.5%
Related Documents