Oil Spill Response Utilizing SAR Imagery in the Gulf of Mexic Xiaofeng Li 1 , William Pichel 1 , Yongcun Cheng 2 , Oscar Garcia-Pineda 3 , Peng Liu 4 , Davida Streett 1 and Sonia Gallegos 5 1 NOAA, 5200 Auth Road, Room 102, Camp Springs, MD, 20746, USA 2 Danish National Space Center, DTU, DK-2100, Copenhagen, Denmark 3 Florida State University, 117 N. Woodward Avenue, Tallahassee, FL, 32306, USA 4 Ocean University of China, Qingdao, 266003, China 5 NRL, John C. Sennis Space Center, MS, 39529, USA Presented by Xiaofeng Li [email protected]

Oil Spill Response Utilizing SAR Imagery in the Gulf of Mexico Xiaofeng Li 1, William Pichel 1, Yongcun Cheng 2, Oscar Garcia-Pineda 3, Peng Liu 4, Davida.
Dec 17, 2015
Welcome message from author
This document is posted to help you gain knowledge. Please leave a comment to let me know what you think about it! Share it to your friends and learn new things together.
Transcript

Oil Spill Response Utilizing SAR Imagery in the Gulf of Mexico
Xiaofeng Li1, William Pichel1, Yongcun Cheng2, Oscar Garcia-Pineda3, Peng Liu4, Davida Streett1 and Sonia Gallegos5
1NOAA, 5200 Auth Road, Room 102, Camp Springs, MD, 20746, USA2Danish National Space Center, DTU, DK-2100, Copenhagen, Denmark
3Florida State University, 117 N. Woodward Avenue, Tallahassee, FL, 32306, USA4Ocean University of China, Qingdao, 266003, China5NRL, John C. Sennis Space Center, MS, 39529, USA
Presented by Xiaofeng Li

Outline
1. Oil Spill Detection in SAR image
2. Simulation of oil spill movement in the Gulf of Mexico
3. NESDIS Response to Deepwater Horizon Event in the Gulf of Mexico
4. Summary
Outline:
1 SAR Oil detection on the ocean surface
2 Feature Extraction Algorithms2.1 Neural Network Based2.2 Fuzzy Logic Based
3 Results and GIS Display
1. Oil Slicks Detection with SAR
January, 2009
Mechanism:• Oil slick damp the ocean surface capillary waves – making the surface
smoother• The smooth surface will reflect the radar pulse in the forward direction -
> Less backscatter. Radar image is dark.
Challenge:• There are a lot of look-alikes in the SAR image, i.e., low wind, coastal
upwelling, island shadow, rain cell, biogenic slicks, etc.
Solution:• Statistical method to extract oil slick from the SAR image• Separate the look-alikes from the oil slick
1. Oil Slicks Detection with SAR

1 Neural Network Algorithm
1. Oil Slicks Detection with SAR - Algorithm
In press Canadian J. of R.S. 2010

Neural Network Algorithm demo
Slick
No-Slick
8bit pixel valueWind MagnitudWind Direction
Wind Magnitud (-3 h)Wind Direction (-3 h)
Wind Magnitud (-6 h)Wind Direction (-6 h)
Wind Magnitud (-9 h)Wind Direction (-9 h)
Beam Mode Incidence AngleSea Surface Height
Geostrophic Currents MagnitudGeostrophic Currents Direction
Neighboor Texture 1 (Brightness)Neighboor Texture 2 (Contrast)
Neighboor Texture 3 (Distribution)Neighboor Texture 4 (Entropy)
Neighboor Texture 5 (variability)Neighboor Texture 6 (Std Deviation)
1st Filter Reaction2nd Filter Reaction3rd Filter Reaction4th Filter Reaction5th Filter Reaction6th Filter Reaction7th Filter Reaction8th Filter Reaction9th Filter Reaction
1. Oil Slicks Detection with SAR - Algorithm
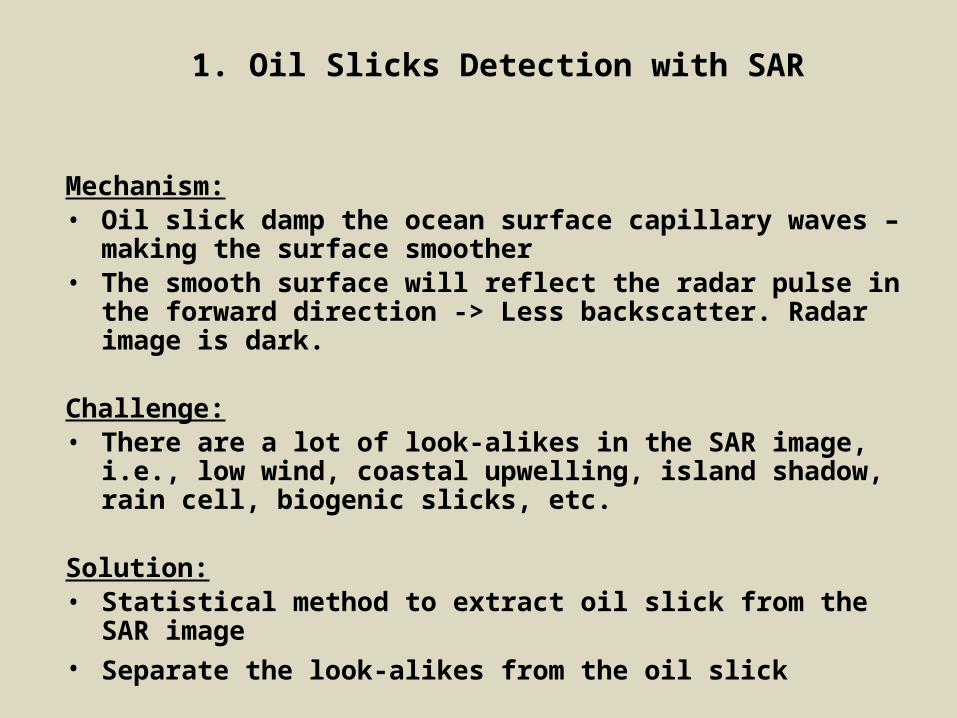
Image preprocessing Image segmentation Feature extraction and filtering Oil spill recognition based on FLS
S am p les
P r ep r o c es sC alib r a tio nD en o is in g
G eo r ef er en c eM ap s e tt in g
S eg m en ta tio nF ea tu r e
ex tr ac t io nC las s if ic a tio n O il s p ill
Feature Extraction basedGeometry and shape: 1. Complexity (COM), a ratio between the perimeter and area of an object (Solberg, 1999) 2. Form factor (FF), a ratio between the width and length of an object (Gasull, 2002) Physical characteristics of backscatter level : 3. Ratio between backscattering standard deviation and its standard deviation outside the area (RBSDO) (Nirchio, 2005) Texture features:4. Angular second moment (ASM) 5. Entropy second order (ENO) (Assilzadeh and Mansor ,2001)
1.2 Oil spill recognition based on fuzzy logic system
1. Oil Slicks Detection with SAR- Algorithm
Accepted IJRS,2010
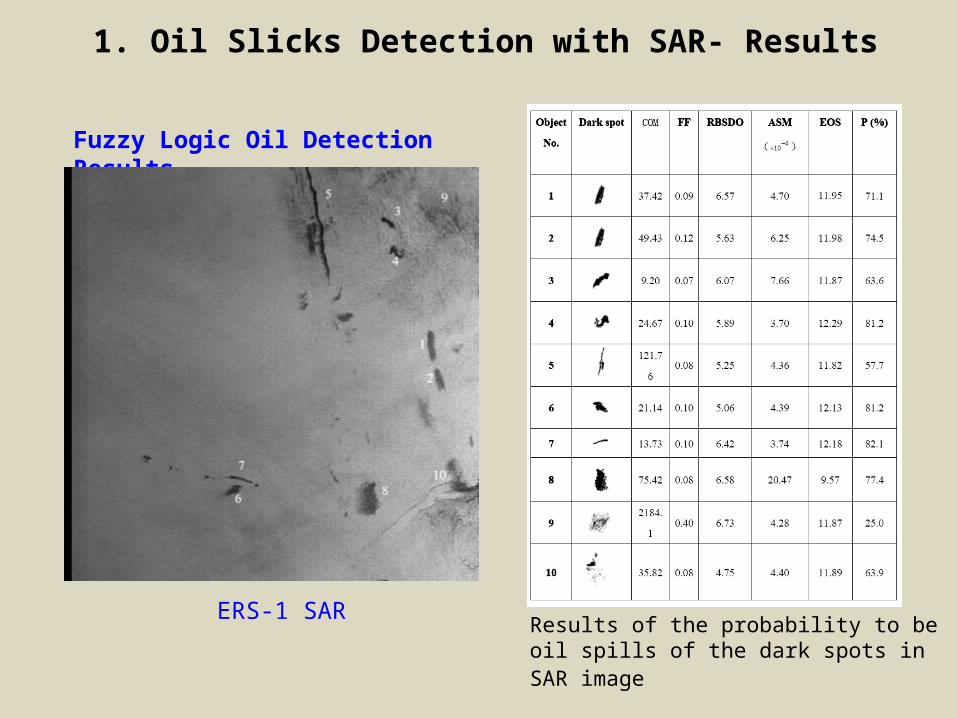
Fuzzy Logic Oil Detection Results
ERS-1 SAR Results of the probability to be oil spills of the dark spots in SAR image
1. Oil Slicks Detection with SAR- Results

1. Oil Slicks Detection with SAR- Results

1. Oil Slicks Detection with SAR- Results

1. Oil Slicks Detection with SAR- Results in GIS

SAR oil detection summary
• Statistical-based SAR oil detection algorithms are developed• These algorithm are tuned for RADARSTA-1, ENVISAT, ALOS, ERS in various beam mode• Interactive oil spill analysis software have been developed to aid oil spill analysis at NOAA

• Introduction to GNOME model• GNOME Simulation• Simulation results – case study• Conclusions
Main impacts are: - harm to life, property and commerce- environmental degradation
2. Simulation of Oil Slicks drifting

Oil Slicks drifting simulation with GNOME model
GNOME (General NOAA Operational Modeling Environment) is the oil spill trajectory model used by NOAA’s Office of Response and Restoration (OR&R) Emergency Response Division (ERD) responders during an oil spill. ERD trajectory modelers use GNOME in Diagnostic Mode to set up custom scenarios quickly.
NOAA OR&R employs GNOME as a nowcast/forecast model primarily in pollution transport analyses.
GNOME can:• predict how wind, currents, and other processes might move and spread oil spilled on the water. • learn how predicted oil trajectories are affected by inexactness ("uncertainty") in
current and wind observations and forecasts. • see how spilled oil is predicted to change chemically and physically ("weather")
during the time that it remains on the water surface.
2. Simulation of Oil Slicks drifting
Model modes
GNOME was designed with three model modes: Standard Mode, GIS Output Mode, and Diagnostic Mode.
Standard and GIS Output Modes must use Location Files to run.
Diagnostic Mode can use Location Files or user files.

GNOME input:
- Location file, specific for each region (tide, bathymetry ,etc.)
- User fileCurrents: ocean model outputsWinds: model or buoy windOil information: Oil locations from SAR image

Model Output
Spill Trajectory Types• Best Guess Trajectory (Black Splots) Spill trajectory that assumes all environmental data and forecasts are
correct. This is where we think the oil will go. • Minimum Regret Trajectory (Red Splots) Summary of uncertainty in
spill trajectories from possible errors in environmental data and forecasts. This is where else the oil could go.

Case study: Oil pipeline leak in July 2009

Oil Pipeline leaking in July 2009


Oil pipeline leak in July 2009
Surface Currents: Navy Coastal Ocean Model (NCOM)
outputsspatial resolution of NCOM is 1/8º temporal resolution is 3 hours

Oil pipeline leak in July 2009
Winds: NDBC hourly wind vector

Oil pipeline leak in July 2009
Initial Oil distribution information: denoted by blue dots.
Model run: 7/26/2009 15:00 UTC 7/29/2009 04:00 UTC

16:30 UTC on July 27, 2009
Simulation Results:GNOME simulated best guess trajectory of oil spill denoted by blue circles:
At the ending of the simulation, 04:00 UTC on July 29, 2009.

GNOME simulated locations of the oil spill at 04:00 UTC on July 29, 2009: (a) only use wind to force the model; (b) only use the currents to force the model.
Simulation Results:GNOME simulated best guess trajectory of oil spill denoted by blue circles:

GNOME Simulation summary:
• In this work, the GNOME model was used to simulate an oil spill accident in the Gulf of Mexico. The ocean current fields from NCOM and wind fields measured from NDBC buoy station were used to force the model. The oil spill observations from ENVISAT ASAR and ALOS SAR images were used to determine the initial oil spill information and verify the simulation results. The comparisons at different time show good agreements between model simulation and SAR observations.
• Based on the calculation, 60.5% of the oil will float and 19.8% of the oil will evaporate and disperse.

3. NESDIS Response to Deepwater Horizon Event in the Gulf of Mexico

4/20 - Explosion and Fire on Deepwater Horizon Oil Rig4/21 – NOAA Emergency Response Division (ERD) of NOS Office of Response and
Restoration informs STAR and SAB of Deepwater Horizon event and asks us to see what the remote sensing data shows. Mike Aslaksen of NOS RemoteSensing Branch informs us of the accident.
4/21 - STAR and SAB begin working together along with the Remote Sensing Applications Working Group of the Subcommittee on Disaster Reduction to obtain many types of satellite imagery to use in oil spill mapping.
4/21 - STAR scheduled two SAR passes for purchase from CSTARS: RADARSAT-2 on 4/23, and TerraSAR-X on 4/25
4/21 - First reports of oil sheen by Search and Rescue personnel on the scene4/22 - SAB issues its first NESDIS Marine Pollution Surveillance Report based on
a MODIS Sun glint image. The analysis is confirmed by a NOAA ERD map. The Surveillance Reports are delivered to NOS EmergencyResponse Division (ERD), the Coast Guard, NGA, Minerals ManagementService, and other Government agencies.
4/22 - International Disaster Charter invoked – SAB as Project Manager4/22 - Oil rig sinks, drill pipe collapses, and begins leaking from three places.
NESDIS Response to Deepwater Horizon Oil Spill

4/23 - SAB issues its first NESDIS Marine Pollution Surveillance Report based ona SAR image – RADARSAT-2 image taken at CSTARS
04/23 – Drill pipe shut off valve does not work. ERD informs us that spill may be a major one
04/24 - SAB issues first bulletin based on Disaster Charter image from ALOS. Bulletinis distributed on a weekend in less than 2 hours after satellite overpass. SABis doing analyses 24/7. Analyses match overflight maps very well.
04/25 - SAB issues first bulletin based on X-band TerraSAR-X SAR imageSAB has issued at least daily bulletins (sometimes multiple bulletins per day) since 04/22 with imagery taken from: MODIS, AVHRR, SPOT,RADARSAT-1/2 SAR, ALOS PALSAR, ENVISAT ASAR, TerraSAR-X. Other imagery that is becoming available includes COSMO-SkyMed, GeoEye, IKONOS, Quickbird, NASA AVIRIS, ASTER, NASA UAVSAR, andENVISAT MERIS
04/26 - STAR schedules ALOS and ENVISAT coverage of a wider area of theGulf for the next few weeks.
04/26 – USGS begins daily Remote Sensing Working Group telecons to coordinateremote sensing data collections
04/30 - Florida State University under contract to NESDIS begins processing the SARimagery of the spill to test the oil spill mapping software under development
for eventual operational implementation (part of our NASA ROSES researchproject: “Oil Slick Detection Using NASA Active and Passive Sensors”).
NESDIS Response to Deepwater Horizon Oil Spill (Cont.)
05/03 - CoastWatch Gulf/Caribbean Node begins providing MERIS 300m imageryof Gulf of Mexico
05/05 – STAR meets with SAB to discuss providing tailored oceanographic data ofthe Gulf from ocean color, SST, altimeter, scatterometer instruments
05/06 – STAR/SAB/ERD Telecon on tailored oceanographic data05/06 – NASA moves airborne assets to Gulf for AVIRIS and UAVSAR flights05/06 – Sonia Gallegos of NRL (NASA ROSES project PI) goes aboard ship in the
Gulf to take oil samples for our ROSES oil spill project05/11 – First Scheduled STAR briefing to SAB on tailored oceanographic data
NESDIS Response to Deepwater Horizon Oil Spill (cont.)

Above: MODIS image 4/22 15:30 localtime showing oil in Sun Glint (bright). Green dot is oil rig. (SAB Analysis)Right: NOAA overflight map from 4/2213:45 local time (ERD Analysis)
First Deepwater Horizon Oil AnalysisApril 22, 2010

SAB Analysis and Shapefile, 4/25/10TerraSAR-X SAR Image
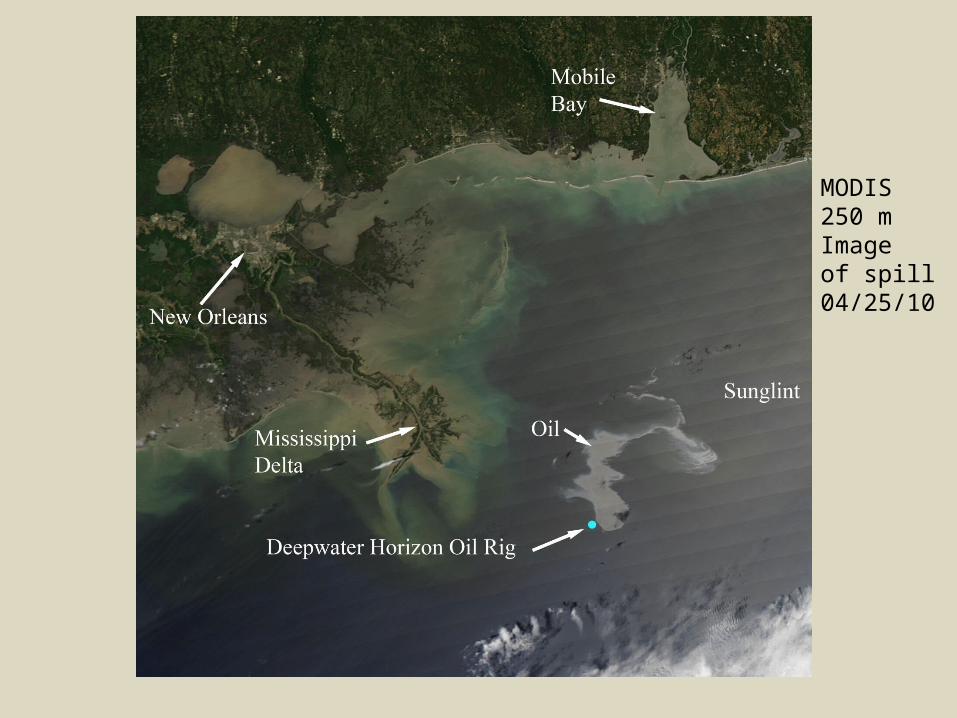
MODIS250 mImageof spill04/25/10
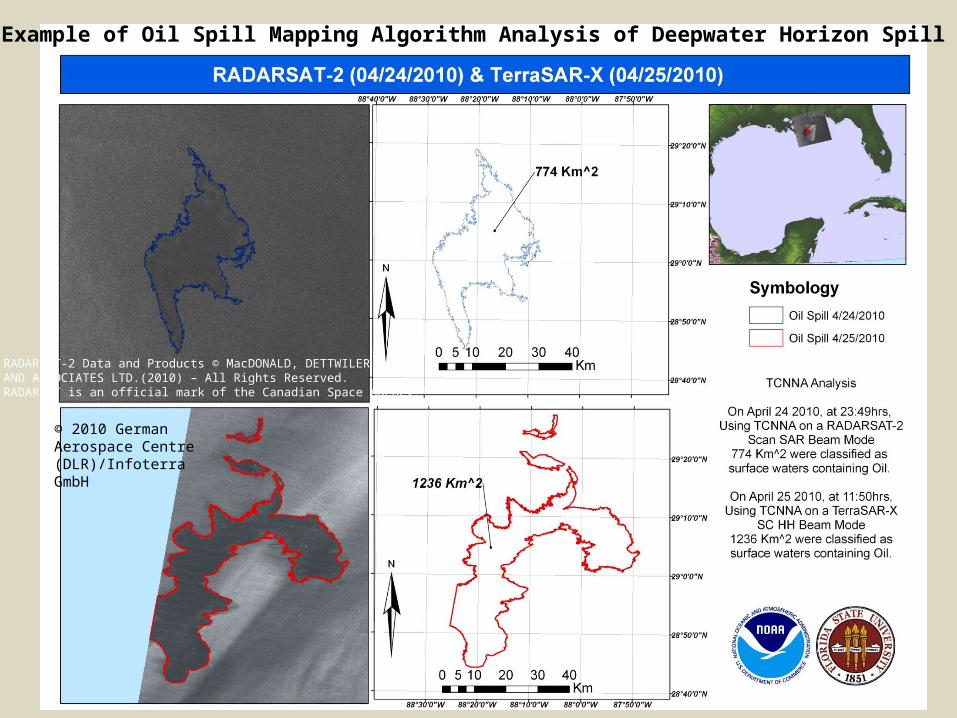
Example of Oil Spill Mapping Algorithm Analysis of Deepwater Horizon Spill
RADARSAT-2 Data and Products © MacDONALD, DETTWILER AND ASSOCIATES LTD.(2010) – All Rights Reserved. RADARSAT is an official mark of the Canadian Space Agency.
© 2010 German Aerospace Centre (DLR)/Infoterra GmbH
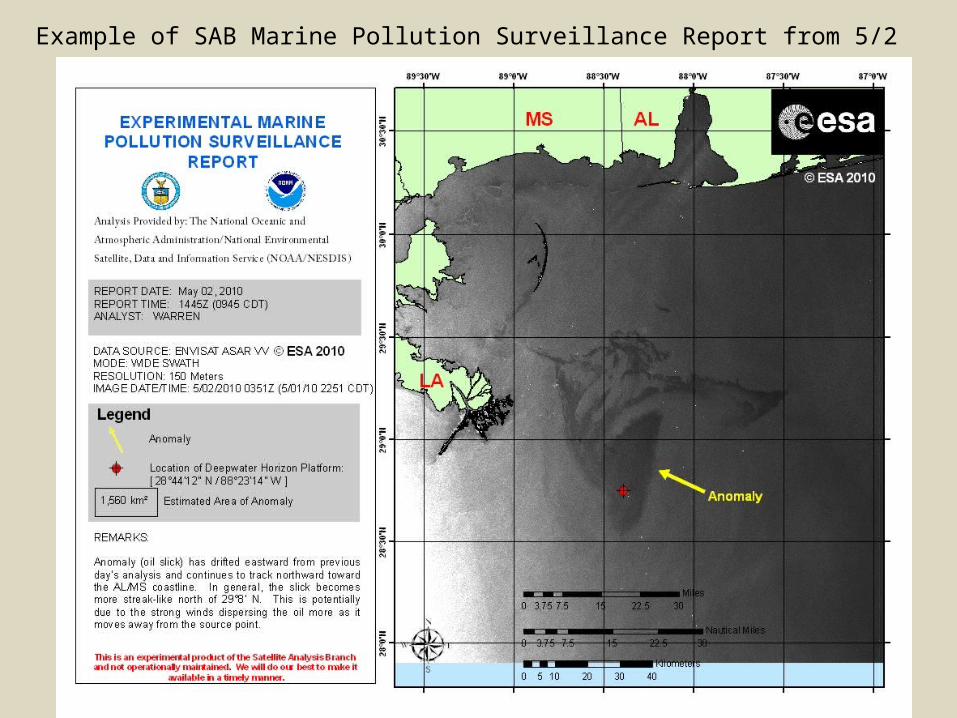
Example of SAB Marine Pollution Surveillance Report from 5/2
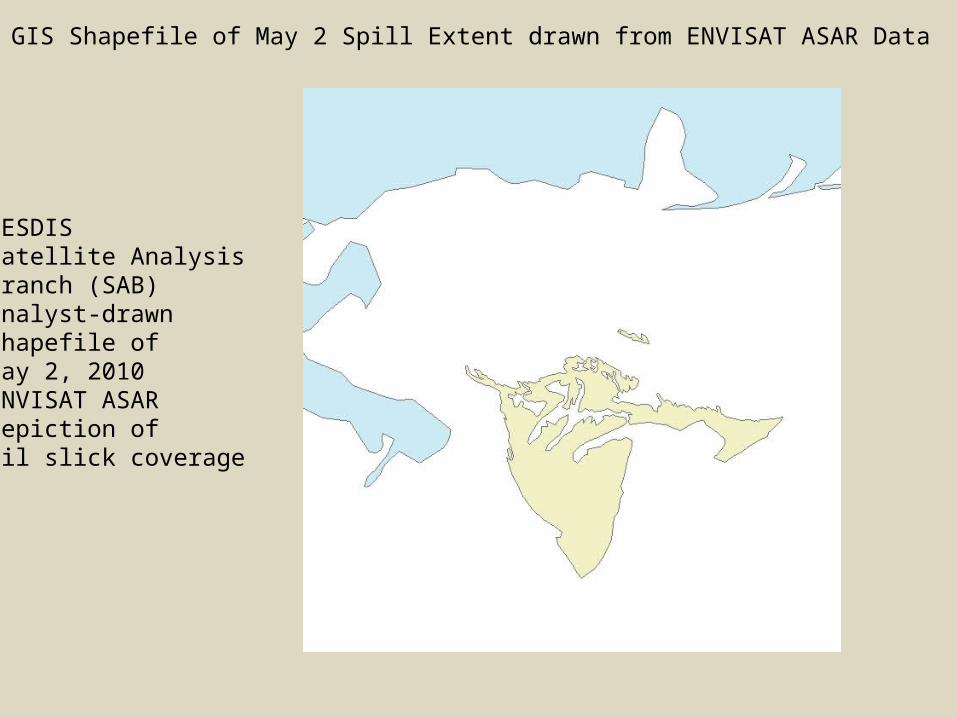
NESDISSatellite AnalysisBranch (SAB)analyst-drawnShapefile of May 2, 2010ENVISAT ASARdepiction of oil slick coverage
GIS Shapefile of May 2 Spill Extent drawn from ENVISAT ASAR Data

Example of Automated Oil Spill Mapping Algorithm Analysis of Deepwater Horizon Spill
© ESA, 2010

STAR and SAB Respond to Deepwater Horizon Accident with Oil Spill Analyses
STAR personnel have assisted the OSDPD Satellite Analysis Branch (SAB) in response to the Deepwater Horizon Oil Platform Accident in the Gulf of Mexico, beginning in April 2010. STAR has scheduled SAR imagery, consulted in analyses, and continued with the development of automated oil spill mapping software in collaboration with Florida State University.
Left: Experimental Marine Pollution Surveillance Report issued by OSDPD Satellite Analysis Branch for May 2, 2010. Right: Texture Classifying Neural Network (TCNNA) oil spill map for the same day. This algorithm is being developed by STAR for possible use as an automated oil spill mapping tool.
© ESA, 2010

International Space Station Sun Glint Image of Oil May 5, 2010
Picture taken by astronaut Soichi Noguchi – NASA Image
Oil Slick


• SAR images from multiplatform spaceborne SAR satellite can be used for oil spill/seep detection in the Gulf of Mexico.
• Statistical-based oil spill detection algorithms have been developed. These algorithms have been tuned for different satellites and different imaging mode.
• The oil spill drifting can be simulated using the NOAA GNOME model with inputs from background current field, time series of wind measurement, and the initial oil spill location.
Thanks!For more information:[email protected]
4. Summary
Related Documents