THE CASE FOR SWITCHING FEDERAL TRANSPORTATION SPENDING TO ALTERNATIVE FUEL VEHICLES OIL SHIFT: AUGUST 2012

Welcome message from author
This document is posted to help you gain knowledge. Please leave a comment to let me know what you think about it! Share it to your friends and learn new things together.
Transcript

i
THE CASE FOR SWITCHING FEDERAL TRANSPORTATION SPENDING TO ALTERNATIVE FUEL VEHICLES
OIL SHIFT:
AUGUST 2012
750 1st Street, NE, Suite 1100 | Washington, DC 20002 | Main: 202.682.6294 | Fax: 202.682.3050
www.cleanskies.org | Twitter: @cleanskiesfdn
© American Clean Skies Foundation 2012
OIL SHIFT:THE CASE FOR SWITCHING FEDERAL TRANSPORTATION
SPENDING TO ALTERNATIVE FUEL VEHICLES
AUGUST 2012
BY WARREN G. LAVEY AND GREGORY C. STAPLE

3
Warren G. Lavey is Senior Regulatory Counsel at the American Clean Skies Foundation and Senior Fellow at the Environmental Law and Policy Center. He was a partner at the law firm Skadden, Arps, Slate, Meagher & Flom LLC, and an adjunct professor at Northwestern University's Kellogg School of Management and Washington University's School of Law. He holds a JD from Harvard Law School, a Diploma in Economics from Cambridge University, and an MS and BA in Applied Mathematics from Harvard University.
Gregory C. Staple is the CEO of the American Clean Skies Foundation. Prior to joining the Foundation he was a partner in the Washington, DC office of Vinson & Elkins and co-founder of the firm's climate change law practice. He was awarded a JD from the University of Michigan and a BA in political economy from the University of Rochester.
The Authors
About American Clean Skies FoundationEstablished in 2007, ACSF seeks to advance America’s energy independence and a cleaner, low-carbon environment through expanded use of natural gas, renewables, and efficiency. The Foundation is a not-for-profit organization exempt from federal income taxes under Section 501(c)(3) of the Internal Revenue Code.
AcknowledgementsThe authors gratefully acknowledge helpful comments and insights from the following people who reviewed prior drafts of this report: Patrick Bean, Damian Breen, Geoff Bromaghim, Allison Clements, Jack Deutsch, Stephanie Lavey, Brandon Little, Ron Meissen, Steven Pearlman, Joel Swisher, Ilyse Veron and Steven Winkelman. Special thanks are also due Marika Tatsutani, who served as the general editor for this publication.

i
ContentsExecutive Summary. . . . . . . . . . . . . . . . . . . . . . . . . . . . . . . . . . . . . . . . . . . . . . . . . . . . . . . . . . . . . . . . . . . . . . . . . . . . 1
Introduction . . . . . . . . . . . . . . . . . . . . . . . . . . . . . . . . . . . . . . . . . . . . . . . . . . . . . . . . . . . . . . . . . . . . . . . . . . . . . . . . . . .4
1 Alternative Fuel Vehicles for Freight Shipments. . . . . . . . . . . . . . . . . . . . . . . . . . . . . . . . . . . . . . . . . . . 7
A Alternative Fuel Options for the Medium and Heavy-Duty Vehicle Market . . . . . . . . . . . . . . . . . 7
B Operating and Life Cycle Cost Benefits . . . . . . . . . . . . . . . . . . . . . . . . . . . . . . . . . . . . . . . . . . . . . . . . . 9
C Air Quality Benefits . . . . . . . . . . . . . . . . . . . . . . . . . . . . . . . . . . . . . . . . . . . . . . . . . . . . . . . . . . . . . . . . . . 13
2 Reducing U.S. Dependence on Petroleum: A Long-Standing National Interest Priority . . . . . . . . 15
A Recent Presidential Statements . . . . . . . . . . . . . . . . . . . . . . . . . . . . . . . . . . . . . . . . . . . . . . . . . . . . . . . 16
B Existing Federal Policies and Initiatives . . . . . . . . . . . . . . . . . . . . . . . . . . . . . . . . . . . . . . . . . . . . . . . . 17
C Alternative Fuel Opportunities Related to Federal Fleet Vehicles . . . . . . . . . . . . . . . . . . . . . . . . 18
D Alternative Fuel Opportunities Related to Federal Procurement of Third-Party Transportation Services . . . . . . . . . . . . . . . . . . . . . . . . . . . . . . . . . . . . . . . . . . . . . . . . . . . . . . . . . . . . . .20
3 Alternative Fuels for the Federal Government: Saving Money for Taxpayers
and Moving Markets. . . . . . . . . . . . . . . . . . . . . . . . . . . . . . . . . . . . . . . . . . . . . . . . . . . . . . . . . . . . . . . . . . 21
A Federal Fleets . . . . . . . . . . . . . . . . . . . . . . . . . . . . . . . . . . . . . . . . . . . . . . . . . . . . . . . . . . . . . . . . . . . . . . . 21
B Third-Party Transportation Service Providers . . . . . . . . . . . . . . . . . . . . . . . . . . . . . . . . . . . . . . . . . .23
C Using the Government's Buying Power to Move Markets . . . . . . . . . . . . . . . . . . . . . . . . . . . . . . . .24
4 Current Government Efforts to Buy Transport Services With Cheaper,
Cleaner Domestic Fuels . . . . . . . . . . . . . . . . . . . . . . . . . . . . . . . . . . . . . . . . . . . . . . . . . . . . . . . . . . . . . . .26
A Federal Agencies' Strategic Sustainability Performance Plans . . . . . . . . . . . . . . . . . . . . . . . . . . .26
B Progress at the U.S. Postal Service . . . . . . . . . . . . . . . . . . . . . . . . . . . . . . . . . . . . . . . . . . . . . . . . . . . .28
C EPA's SmartWay Transport Partners Program . . . . . . . . . . . . . . . . . . . . . . . . . . . . . . . . . . . . . . . . . .29
D GSA Procurement Initiatives . . . . . . . . . . . . . . . . . . . . . . . . . . . . . . . . . . . . . . . . . . . . . . . . . . . . . . . . . .30
E DOE's National Clean Fleets Partnership. . . . . . . . . . . . . . . . . . . . . . . . . . . . . . . . . . . . . . . . . . . . . . . 31
F State and Local Government Purchasing Programs . . . . . . . . . . . . . . . . . . . . . . . . . . . . . . . . . . . . .34
5 Recommendations for Federal Action . . . . . . . . . . . . . . . . . . . . . . . . . . . . . . . . . . . . . . . . . . . . . . . . . . 37
A Improving Procurements of Transportation Carrier Services . . . . . . . . . . . . . . . . . . . . . . . . . . . . . 37
B Improving Transportation Services in Procurement of Products . . . . . . . . . . . . . . . . . . . . . . . . . .39
C GAO Reports on Agency Actions . . . . . . . . . . . . . . . . . . . . . . . . . . . . . . . . . . . . . . . . . . . . . . . . . . . . . 41
Conclusion . . . . . . . . . . . . . . . . . . . . . . . . . . . . . . . . . . . . . . . . . . . . . . . . . . . . . . . . . . . . . . . . . . . . . . . . . . . .43

ii
Boxes, Tables, and AppendixBox 1 New Alternative Fuel Trucking Options ............................................................................................................. 8
Box 2 Price Comparisons Between Petroleum and Alternative Fuels ............................................................ 10
Box 3 Two Calculations of Savings in Total Cost of Ownership for
Alternative Fuel Trucks .............................................................................................................................................12
Box 4 LNG, CNG, and Electricity Reduce Harmful Life Cycle Vehicle Air Emissions .................................14
Box 5 President Challenges Trucking Carriers and Federal Agencies .............................................................15
Box 6 Measuring and Tracking to Achieve Performance .......................................................................................19
Box 7 EPA SmartWay Collection of Data on Alternative Fuel Vehicles and Usage ................................. 30
Box 8 GreenGov Supply Chain Partnership for Federal Agencies .....................................................................31
Box 9 Private Sector Initiatives to Promote Sustainable Transportation Services ....................................32
Box 10 Port of Los Angeles and Long Beach Clean Truck Program ..................................................................35
Table 1 Largest Agency Vehicle Fleets and Their Petroleum Consumption in FY 2010 ............................22
Table 2 USPS Savings from Reduced Fleet Petroleum Consumption ................................................................22
Table 3 USPS Savings from Reducing Petroleum Consumption by 20 Percent in
its Transportation Services and Fleet ..............................................................................................................23
Table 4 Estimates of Annual Government-Wide Savings from a 20 Percent Reduction
in Petroleum Consumption by Third Party Transportation Providers ................................................24
Table 5 Agencies Achieving Largest Reductions in Fleet Petroleum Use ........................................................27
Appendix Selected Non-Petroleum Platforms for Trucking Carriers .............................................................. 44

1
Every year, federal agencies spend roughly $150 billion on third-party transportation services. We propose a “Buy American” program for procuring these services that would promote objectives shared by both political parties and the American public: energy security, jobs, economic growth, public health, and environmental protection.
Specifically, our plan ratchets down the government’s consumption of oil—and the fiscal and environmental costs that come with it—by requiring federal agencies to apply to third-party transportation providers the same kinds of alternative fuel targets, efficiency standards and reporting practices they currently apply to their own vehicle fleets. These purchasing and tracking practices have already proved successful in saving taxpayer dollars; reducing our nation’s dependence on petroleum; stimulating new markets for clean, domestic alternative fuels and vehicle technologies; and lowering emissions of harmful pollutants.
Applying the same practices to federal spending on transportation services will deliver like benefits. In particular, we estimate that implementation of the recommendations in this report could deliver approximately $7 billion in annual cost savings; cut petroleum consumption by billions of gallons each year; stimulate the introduction of tens of thousands of new alternatively fueled vehicles; and reduce greenhouse gas pollution by over 20 million metric tons annually.
Moreover, by leveraging its influence with freight carriers and other suppliers, the program detailed here offers the federal government an opportunity to create very large multiplier benefits nationwide–effectively reducing the oil dependence of the trucking industry and other private sector transportation providers.
Key Recommendations
1. Federal Procurement of Transportation Carrier Services
A Starting in 2014, federal agencies should develop and report annual targets, measures and initiatives for increasing the use of alternative fuels, reducing petroleum consumption, and lowering emissions associated with the transportation carrier services they procure.
B Starting in 2015, federal agencies should require transportation carriers to use alternative fuels for at least 5 percent of federally contracted shipments (measured in ton-miles). This requirement should increase by at least 2 percent each year from 2015 to 2025.
2. Transportation Services Associated With Federal Procurement of Products
Starting in 2016, federal agencies should develop and report annual targets, measures and initiatives for increasing the use of alternative fuels, reducing petroleum consumption and lowering emissions associated with transportation services in procurements of products from major suppliers (i.e., for supplier-owned and contracted shipping not covered by the transportation carriers in the prior recommendation).
3. Reports to Congress
In 2013 and annually thereafter, at the request of Congress, the General Accountability Office (GAO) should report on the effectiveness of federal programs to increase the use of alternative fuels and to reduce petroleum consumption, costs and emissions associated with the transportation services directly or indirectly purchased by federal agencies.
Executive Summary

2
Using the federal government’s purchasing power to drive the transition to cleaner, domestically-produced, and ultimately less expensive transportation fuels responds to a number of widespread public concerns and national policy objectives: minimizing taxpayer outlays to pay for high-priced conventional gasoline and diesel; reducing our country’s dependence on foreign petroleum and our economy’s exposure to volatile world oil markets; improving our balance of trade; and addressing the public health and environmental harms caused by vehicle emissions of particulate matter, smog-forming chemicals, and greenhouse gases (GHG).
Americans expect the federal government, as well as state and local governments, to lead by example in reducing the country's oil dependency not just in their own vehicle fleets, but also in their other purchases.
National Goals and Savings
Over the past four decades, successive Congresses and presidents have repeatedly sought to decrease the nation’s petroleum consumption. Addressing America’s dependence on oil has been a long-standing and broadly-held goal of U.S. energy policy for several reasons—most prominently, promoting energy security, spurring economic growth, improving public health and sustaining the environment. To achieve these national goals, America needs more non-petroleum-fueled vehicles running on domestic, lower-cost, cleaner fuels.
Currently-available alternative fuels and technologies offer huge cost savings over petroleum-based fuels. For example, in April and May of 2012, fuel costs to operate cars, trucks and buses on compressed natural gas (CNG) or liquefied natural gas (LNG) were 26–43 percent lower than for vehicles operating on gasoline or diesel fuel. The Department of Energy (DOE) recently has estimated that the significant ($1.00 or more per gallon) price advantage of CNG/LNG over diesel fuel will continue for at least 20 years. Likewise,
all-electric and hybrid-electric light-duty vehicles yield average fuel cost savings of 30–87 percent compared to conventional vehicles. The lower operating costs of alternative fuel vehicles translate into lower total life cycle costs of ownership and attractive payback periods across a wide range of uses.
Alternative fuel vehicles also provide large reductions in many forms of harmful air pollution compared to gasoline or diesel-powered vehicles.
Policies are already in place to promote alternative fuels and vehicle technologies in federal vehicle fleets (i.e., in the 660,000 cars and trucks that are directly owned or leased by federal agencies). In fact, existing laws and executive orders require federal agencies to reduce their direct consumption of gasoline and diesel to operate federal vehicles. However, these policies have had only limited effect so far. In 2011, U.S. taxpayers spent $1.3 billion to purchase approximately 400 million gallons of gasoline and diesel fuel for use in federal vehicles. Non-petroleum fuels (mostly ethanol, biodiesel and CNG) accounted for only 4 percent of the total fuel consumed by federal fleets.
While federal agencies must continue to reduce petroleum usage in their own fleet vehicles, this report analyzes the much larger, related area of direct and indirect federal spending on third-party transportation services.
The federal government's shift from oil to alternative fuel and greater fuel-efficiency is not just about leading by example. It is about changing the management of fleets common to both government and private transportation service contracts.
3
Annually, federal agencies spend about $50 billion directly to procure transportation services from private sector trucking companies and other carriers. For example, the U.S. Postal Service (USPS) currently spends more to reimburse its suppliers for their fuel purchases than all federal agencies combined spend on gasoline and diesel for the vehicles they directly own or lease. Additionally, the federal government indirectly spends an estimated $100 billion annually on transportation services in procurements of products (such as paying suppliers to deliver their products to federal facilities).
Together, these direct and indirect federal procurements of transportation offer an enormous opportunity to drive broader shifts in the vehicles and fuels used for shipping freight and packages in the U.S., and to reap significant benefits for the taxpayer at the same time.
Standards and Plans for Federal Fleets and Transportation Services
Several existing laws and executive orders require federal departments and agencies to lead by example in reducing petroleum consumption, raising energy efficiency, and mitigating adverse environmental impacts from the use of federally-owned vehicles as well as federal purchases of transportation services.
For example, each federal agency annually is required to (a) reduce the petroleum used in its fleet vehicles by 2 percent; (b) increase its consumption of non-petroleum fuels by 10 percent; (c) ensure that alternative fuel vehicles account for at least 75 percent of new vehicle purchases or leases; and (d) cut GHG emissions. Each agency publishes an annual Strategic Sustainability Performance Plan, which is subject to approval by the Council on Environmental Quality (CEQ). The Office of Management and Budget (OMB) issues an annual scorecard that tracks agency performance.
Pursuant to these standards and reporting requirements, most federal agencies have implemented vehicle purchasing, fueling and
optimization initiatives for their fleets. The programs have yielded substantial benefits; by 2010, eight agencies had already surpassed their petroleum consumption targets for 2015 (cutting their usage 23–57 percent compared to 2005). These agency initiatives are spurring the development and production of cleaner vehicles and domestic fuels to power them.
Building on Executive Order 13514
Executive Order 13514, adopted in 2009, directs federal agencies to purchase transportation services that promote energy security, energy efficiency, and cleaner air. There has been some progress in complying with this directive, especially at the USPS and through the General Services Administration (GSA).
Much more could be achieved by extending the framework of specific standards, performance tracking and plans from federally-owned fleets to third-party transportation service providers. Most large freight carriers and many major product shippers already partner with the U.S. Environmental Protection Agency (EPA) and/or the DOE to track their use of petroleum and alternative fuels, increase their fuel efficiency and cut their emissions. Efforts to improve federal transportation procurement practices could use data already reported by these suppliers. Also, several states, local governments, and major corporations have proved that programs aimed at reducing petroleum use and emissions from third-party transportation services can be successful and cost-effective.
The federal government’s shift from oil to alternative fuel and greater fuel-efficiency is not just about leading by example. It is about changing the management of fleets common to both government and private transportation service contracts. That could not only save taxpayer dollars, but it could have large economic and environmental benefits — positively shifting supply and prices for alternative fuels and vehicles throughout the nation.
4
1 In the CNN/ORC Poll on March 24-25, 2012, 20 percent of respondents said that the price of gasoline is the most important economic issue facing the country today. http://tinyurl.com/d9brrc7.
IntroductionHigh oil prices have played a prominent role in the prolonged economic downturn of the last several years and in the public’s near-term frustration with stagnant or falling living standards and longer-term anxieties about America’s future competitiveness and prosperity.1 Though gasoline prices have recently moderated somewhat and domestic hydrocarbon production has been increasing with the development of new offshore areas and unconventional reserves, oil dependence remains an ongoing source of vulnerability for the U.S. economy and a key concern for political leaders and citizens alike.
Because oil prices are set by the world market, global supply and demand fluctuations—along with the ever-present possibility of a major supply disruption—can send prices surging upward again. Reducing the still near-total reliance of our transportation systems on this single fuel is therefore the only effective, long-term strategy for insulating the U.S. economy and U.S. consumers from future oil market gyrations. The federal government can play a central role in this effort by investing in cost-effective, sustainable transportation options and by stimulating private sector investment in alternative fuels and energy efficiency.
Over the past four decades, successive presidents and Congresses—Republican and Democrat alike—have declared their commitment to improving national security through greater energy independence. Increased energy efficiency and greater reliance on cost-effective, domestically-produced natural gas, electricity, and other alternative fuels in the U.S. transportation sector would also yield many other benefits: reduced
outlays for imported oil and an improved balance of trade; reduced public and private sector expenditures on energy (with concomitant benefits for the federal budget and for firms and households); an economy that is less exposed to high and volatile gasoline and diesel prices; lower public health risks from harmful tailpipe pollution; and lower GHG emissions.
Despite these large benefits and strong bipartisan support for reducing America’s petroleum dependence, progress toward diversifying our transportation energy supply has been slow and still has a long way to go. A few statistics help to underscore the scale of our nation’s continued dependence on oil and the liabilities that come with it:
• U.S. crude oil imports averaged 8.767 million barrels per day in March 2012, an amount that translated to about $1 billion in daily payments to foreign governments and other sources. This actually represented an improvement on the prior year’s record: compared to March 2011, overall domestic oil consumption was down 6.4 percent and imports had declined 2.9 percent. The DOE cites several factors behind these positive developments, including increased domestic crude oil and natural gas production, increased use of biofuels, and demand reductions resulting from the adoption of new efficiency standards and from rising energy prices. Despite these largely positive trends, however, DOE forecasts that net oil imports to the United States will decline only slowly over the next two decades (by 0.8 percent per year, on average, for the period 2010–2035), while overall oil consumption

5
2 Reuters, “US crude oil imports fall in March from year earlier” (May 30, 2012) http://tinyurl.com/cxlx2uw; U.S. Energy Information Admin-istration (EIA), “Short-Term Energy Outlook Market Prices and Uncertainty Report” (May 2012) http://tinyurl.com/cyl58uk; EIA, “Annual Energy Outlook 2012” 153 (Table A11, reference case) (June 2012) http://tinyurl.com/bpnnuwh; EIA, “How dependent are we on foreign oil?” (May 2, 2012) http://tinyurl.com/3bfq3ha.3 U.S. Energy Information Administration (EIA), “What are the major sources and users of energy in the United States?” (May 18, 2012) http://tinyurl.com/6lz4e2x; EIA, “Annual Energy Review” Tables 5.11, 5.13c (2011) (data for 2010) http://tinyurl.com/6tbe9yr; EIA, “Annual Energy Outlook 2012”, supra, at 134 (Table A2, reference case).4 R. Mullett (Con-way Inc.), “Natural Gas Fuel Discussion” at 3 (May 17, 2012) (presentation at Houston, TX C2ES conference on Leveraging Natural Gas to Reduce GHG Emissions).5 “Shale Gas Set to Reshape Trucking” Wall Street Journal (May 23, 2012) (“No one doubts that the potential market is enormous. The 3.2 mil-lion big rigs on U.S. roads today burn some 25 billion gallons of diesel annually. Almost 7 million single-unit trucks, such as United Parcel Service Inc. or FedEx Corp. trucks, consume another 10 billion gallons of diesel. Converting even a modest number of these trucks, which often get 5 to 8 miles a gallon, to natural gas could save significant amounts of money. Tailpipe emissions also would drop, since natural gas burns cleaner than diesel or gasoline.”) http://tinyurl.com/86fw4ck; EPA and DOT, “FACTSHEET: Paving the Way Toward Cleaner, More Efficient Trucks” at 2 (2011) http://tinyurl.com/bqjy9fg; Y. Heng & S. Lim, “Accounting for Greenhouse Gas Emissions in Trucking Production,” 37 J. Econ. 55, 71 (2011) (econo-metric study using 2000-2007 data found that more efficient operations of the trucking industry could expand desirable output and reduce GHG emissions by an average of 11 percent annually).6 GSA, “Federal Fleet Report” 2009, 2010, 2011 http://tinyurl.com/7lroa35; http://tinyurl.com/c8zt9sp; http://tinyurl.com/bvlewnt. The types of fuel vary in their energy content for vehicle engine output. For example, a gallon of LNG typically yields less energy for vehicles than a gallon of diesel. To aggregate and compare the usage of various fuels, GSA converts the consumption of the various fuels, including electricity, into “gasoline gallon equivalents.” See “2009 Federal Fleet Report” at Table 1-4 n.*. Similarly, some sources develop a common unit by converting into “diesel gallon equivalents” or “energy equivalents.” See Box 2 below.7 EIA, “Annual Energy Outlook 2012: Emissions” http://tinyurl.com/czgn3h8; EPA and DOT, “FACTSHEET: Paving the Way Toward Cleaner, More Efficient Trucks,” supra, at 2. See Section 1.C below.
will decline hardly at all (by just 0.3 percent per year on average over the same period).2
• Transportation accounts for about 71 percent of petroleum use in America and petroleum remains by far the dominant fuel used for transportation, providing 97 percent of the total energy used in this sector. The transportation sector consumed 26.88 quadrillion Btu from liquid fuels and other petroleum sources in 2010, up 2 percent from 2009. DOE projects that overall transportation energy consumption will continue growing through 2020.3
• Trucking, a relatively inefficient mode of transport, accounts for most shipments of goods in the United States. In fact, 70 percent of all goods (by weight), and 97 percent of all consumer goods move by truck.4 Heavy-duty and medium-duty trucks burn about 35 billion gallons of diesel annually, often getting only 5 to 8 miles per gallon. Heavy-duty vehicles account for 17 percent of transportation oil use and 12 percent of all U.S. oil consumption.5
• Despite federal efforts to accelerate the introduction of alternative fuels in government-owned vehicle fleets, petroleum fuels still accounted for 96 percent of total fuel use by federal fleet vehicles in 2011. The federal government did succeed in boosting its purchases of alternative vehicle fuels, which grew by 12 percent from 2009 to 2011. However, the federal government’s consumption of gasoline and diesel also continued to rise, growing by 6 percent from 2009 to 2011.6
• Petroleum is the largest source of carbon dioxide (CO
2) emissions in the U.S. (about 44
percent of the nation’s total CO2 emissions
inventory). Since petroleum is heavily used for transportation, the transport sector alone accounts for approximately one third of U.S. CO
2 emissions. Nearly 6 percent of all U.S. GHG
emissions come from heavy-duty vehicles. Diesel emissions also contain carcinogens and other pollutants that are harmful to public health.7
To cut U.S. petroleum consumption, costs, and harmful air emissions, federal agencies should apply to major third-party transportation service providers and product suppliers with whom they do business the same kinds of standards and reporting requirements they now use to improve government-owned fleets. These requirements and practices, along with other government-led initiatives to improve efficiency and promote clean energy alternatives, have proved not only successful, but often cost-saving.
For example, DOE’s Clean Cities program has reached nearly 100 communities. In 2010, this program produced an estimated 600 million gallons of fuel savings among state- and local-government-owned fleets, as well as private fleets. Alternative fuels and vehicles (mostly natural gas) accounted for 77 percent of these fuel savings; idle reduction, reduced vehicle travel, hybrid electric vehicles, off-road, and increased fuel economy accounted for the remaining gains.8 These fuel savings translate to direct cost savings, freeing scarce taxpayer

6
resources for more productive uses. As acting GSA Administrator Dan Tangherlini said in June 2012, “Making buildings more efficient, saving energy, and creating a more fuel efficient fleet is helping government to improve its environmental performance and saves taxpayer dollars.”9
Indeed, as detailed on Table 4 on page 24, we estimate that the transportation-related fuel-switching and efficiency improvements recommended here for federal agencies could produce annual cost savings of as much as $7 billion, or more than $25 billion by 2025. The annual savings are equivalent to over five times what the government now spends each year on fuel for the 660,000 vehicles in the federal fleet. See Section 3.
The remainder of this report describes a “Buy American” program for freight transportation services provided to the federal government that would allow Washington to lead by example in reducing the nation’s dependence on oil while also promoting other important fiscal, economic, public health, and environmental goals. The report is organized as follows:
Section 1 describes the availability of alternative fuel vehicles for freight shipments, as well as the benefits they offer in terms of lower cost and reduced air pollution;
Section 2 reviews the national goal of reducing dependence on petroleum and the federal government’s obligation to lead by example;
Section 3 outlines opportunities for greater fuel efficiency and use of alternative fuels by the federal government;
Section 4 describes current federal, state and local government as well as corporate programs to spur transportation services that are more efficient and that use cheaper and cleaner domestic fuels; and
Section 5 provides recommendations for actions to improve federal procurements of transportation services.
8 DOE, “Vehicle Technologies Program: Clean Cities” at 1, 3 (Mar. 2012) http://tinyurl.com/cda5hsc. See Section 4 below.9 For the complete remarks and the GSA sustainability scorecard see http://tinyurl.com/82syyzk. In May 2012, Defense Secretary Leon Panetta also drew headlines when he remarked: “As someone who now faces a budget shortfall exceeding $3 billion because of higher-than-expected fuel costs, I have a deep interest in more sustainable and efficient energy options.” A. Snider, “Panetta links environment, energy and national security in groundbreaking speech” Greenwire (May 3, 2012) http://tinyurl.com/8237oll.
Nearly 6 percent of all U.S. GHG emissions come from heavy-duty vehicles. Diesel emissions also contain carcinogens and other pollutants that are harmful to public health.
7
10 See EPA, “SmartWay Transport Partnership: Overview of Carrier Strategies” (reviewing potential reductions in fuel use, costs and emissions from idle reduction, improved aerodynamics, improved freight logistics, automatic tire inflation systems, single wide-base tires, driver training, low-viscosity lubricants, intermodal shipping, longer combination vehicles, reducing highway speed, weight reduction, hybrid powertrain technology, and renewable fuels) http://tinyurl.com/88rzh2h; H. Frey and P. Kuo, “Best Practices Guidebook for Greenhouse Gas Reductions in Freight Transportation”(2007) (report prepared for the U.S. Department of Transportation) http://tinyurl.com/7zelw32; N. Lutsey and D. Sperling, “Greenhouse Gas Mitigation Supply Curve for the United States for Transport versus Other Sectors,” 14 Transportation Research Part D 222 (2009) http://tinyurl.com/7gbn2fn; Cambridge Systematics, Moving Cooler (2009) http://tinyurl.com/c63rssp.11 EPA, “Clean Alternative Fuels: Liquefied Natural Gas”, EPA420-F-00-038 (March 2002) http://tinyurl.com/6wo9k2p.12 EIA, “Renewable & Alternative Fuels: Alternative Fuel Vehicle Data” (supplier data) http://tinyurl.com/6o37wwp. 13 DOE, “Clean Cities’ Guide to Alternative Fuel and Advanced Medium- and Heavy-Duty Vehicles” at 4 (Sept. 2010) http://tinyurl.com/7cehkgw.
Several options for reducing petroleum consumption, costs, and emissions associated with freight transport have now been extensively studied. These options include both behavior changes and technology improvements.10 To remain competitive, freight carriers, shippers and customers are pursuing various strategies, often in combination, including moving some shipments from airplanes to a mix of rail and trucks, optimizing the locations of distribution centers, changing delivery routes and delivery frequency, limiting truck drivers’ speed and idling time, increasing the fuel efficiency of truck engines and tires, installing emission filters, and switching to alternative fuels.
The recommendations in this report reflect the range of opportunities that exists to reduce petroleum consumption in federal freight shipments. Rather than pursue a prescriptive approach, we propose a framework of targets, measurements and reports that would give individual agencies the flexibility to determine which combination of actions is best suited to their circumstances and needs.
As discussed in Section 2, support for domestic alternative fuels is bipartisan and long-standing. Alternative fuels have also been the largest contributor to the success of the DOE Clean Cities program in reducing petroleum consumption in participating communities. (See further discussion in Section 4 of this report.)
In light of the increasing availability of alternative fuel vehicles and fueling stations, this report starts with a focus on fuel-switching options. A wide range of freight shipments could be handled by medium- and heavy-duty vehicles using alternative fuel engines. Lower fuel costs for CNG, LNG and electric-powered vehicles yield lower total costs of
ownership for many uses. Additionally, these fuels provide public health and environmental benefits.
A. Alternative Fuel Options for the Medium and Heavy-Duty Vehicle Market
Currently-available alternative fuels and vehicles could replace gasoline and diesel fuels in many medium and heavy-duty vehicle applications. The use of alternative fuels for freight shipments has become more widespread in recent years as the driving range of alternative fueled heavy-duty vehicles and the availability of fueling stations has increased.
As early as 2002 after reviewing the experience with heavy-duty LNG trucks and buses, EPA concluded that: “There are no discernible differences in LNG vehicle performance, operation, and utility when compared with diesel. The high ignition quality of LNG is similar to that of diesel, providing for similar durability and engine life overall.”11
In 2010, with an estimated 5,339 heavy-duty and 93,510 medium-duty alternative fuel vehicles in use in the United States,12 DOE summarized potential applications for such vehicles as follows:13
School Buses—CNG and propane are popular alternatives to gasoline and diesel fuel for school buses. Hybrid electric buses and plug-in electric hybrids are also available.
Shuttle Buses—CNG, propane, hybrid electric power, and fuel cells are potential power sources for shuttle buses and large passenger vehicles that provide transportation on standard routes.
Alternative Fuel Vehiclesfor Freight Shipments
1

8
Transit Buses—Hybrid-powered transit buses, along with CNG and LNG buses, are available. Fuel cell demonstrations are also in progress.
Refuse Trucks—Natural-gas-fueled vehicles are available, and some can use biomethane produced from landfill gas. Standard routes and stop-and-go operation make refuse haulers a good application for hybrid operation. Hydraulic hybrid systems are well suited to refuse service.
Tractors—Diesel electric hybrids offer fuel-saving hybrid operation with the convenient availability of diesel. CNG and LNG operation are also available in some models.
Vans—Step vans that service a set route, such as a package delivery service, may find all-electric battery operation an effective, low-polluting alternative. CNG and propane operation are also popular alternatives.
Vocational Trucks—CNG, propane, all-electric, and hybrid vehicles operate in a variety of roles from beverage delivery to utility boom truck, paint striping truck, and merchandise delivery.
As described in Box 1 and the Appendix, freight shippers now have many alternative fuel choices for heavy-duty trucks and vans, and these choices are expected to expand considerably in the next decade.14
DOE has compiled detailed profiles of available
heavy-duty, alternative fueled vehicles (see
Appendix). Of the 14 heavy-duty vehicles DOE
identified in the tractor category (including dual-
fueled vehicles), seven run on LNG, five run on CNG,
three are diesel/electric, two are all-electric, two
are fuel cell/electric, and one runs on hydrogen. Of
the 20 heavy-duty vehicles in the vocational truck
category (again, including dual-fueled vehicles),
six are diesel/electric, five run on CNG, five are
all-electric, three run on LNG, and three run on
propane. DOE describes 11 heavy-duty vehicles in
the van category: five are all-electric, four run on
propane, and two run on CNG.
Medium and heavy-duty engines fueled by CNG
and LNG are now offered by several vendors, and
are already being deployed by leading shippers.
For instance, in 2011, UPS planned to add 48 new
trucks with 15-liter, 450 horsepower LNG engines
at its transport hubs in California and Nevada.15
In February 2012, Frederick W. Smith, the CEO
of FedEx Corp. advised a DOE conference that
“there are LNG engines by Cummins and Navistar
that appear to be quite competitive with internal
combustion engines given the cost differential
between natural gas and diesel.” According to
Smith, FedEx “will have [its] first prototype of
long-haul trucks with 11.9 liter LNG engines on the
roads this summer.”16 Several other major shippers,
including Ryder System, Sysco Food Services and
Heckmann Corp., have also begun to roll out fleets
of CNG and LNG trucks. For example, as of April
2012, Ryder leased about 250 natural gas trucks
to customers in California, Arizona and Michigan,
including Daimler Freightliners using a Cummins
Westport ISL G 8.9 liter engine; Ryder planned to
deploy 50 more natural gas trucks and to expand
its alternative fueled vehicle offerings in at least
four more states.17
At the Mid-America Trucking Show in March 2012,
Cummins and other manufacturers announced
plans to expand their CNG and LNG engine lines.
According to a press release from America’s Natural
Gas Alliance: “Cummins announced new 12-liter and
15-liter natural gas engines; Freightliner announced
a 12-liter engine will power some of its models;
Volvo will partner with Westport Innovations to
develop a new 13-liter platform; and Kenworth
announced that four of their truck configurations
will be available with a 12-liter natural gas engine.”18
The growing use of natural gas engines in both
medium-duty (delivery) and heavy-duty (long-haul,
18-wheel trucks) recently prompted the CEO of the
American Trucking Association to observe that
“serious competition now exists between suppliers
of diesel and natural gas trucking services.”19
Box 1 New Alternative Fuel Trucking Options
14 See also, e.g. the new report by the National Petroleum Council (an advisory committee to the DOE) detailing "policy options and pathways to integrating new fuels and vehicles into the marketplace" through 2030. National Petroleum Council, "News: Report on Future Transportation Fuels Featured at National Petroleum Council Meeting" (July 18, 2012) http://tinyurl.com/cz24hyb.15 M. Wald, “U.P.S. Finds a Substitute For Diesel: Natural Gas, at 260 Degrees Below Zero.” New York Times. Green (Feb. 22, 2011) http://tinyurl.com/47lg2hy.16 See ARPAE 2012, Energy Innovations Summit, Keynote, Frederick W. Smith http://tinyurl.com/7w7xttp. 17 B. Sechler, “Ryder aims for traction in gas truck leasing” Marketwatch (Apr. 5, 2012) http://tinyurl.com/c82wg88; Daimler Trucks North America Release, “Daimler Trucks North America Celebrates 1,000 Natural Gas Truck” (Nov. 8, 2011) http://tinyurl.com/764dx2m.18 America’s Natural Gas Alliance, “ANGA Applauds Increased Production of Heavy-Duty Engines Powered by Natural Gas” (Mar. 30, 2012) http://tinyurl.com/7j4alt7.19 Pegasus TransTech Release, “Graves Upbeat on Natural Gas, Concerned About Infrastructure Funding,” (April 19, 2012) http://tinyurl.com/6vps24m.

9
19 EIA, “Annual Energy Outlook 2012”, supra, at 35; P. Orszag, “Natural-Gas Cars Can Drive Us Toward a Better Economy” Bloomberg (June 26, 2012) http://tinyurl.com/7adh5hs.20 DOE, “Alternative Fueling Station Total Counts by State and Fuel Type” http://tinyurl.com/5vnjwp7.21 TAX, “U.S. and Canadian Natural Gas Vehicle Market Analysis: Compressed Natural Gas Infrastructure” at vi (2012) http://tinyurl.com/7ecctxn.22 D. Biello, “Cheap Fracked Gas Could Help Americans Keep on Truckin’” Scientific American (Apr. 23, 2012) http://tinyurl.com/6nkovlp.23 Financial Post (2012, June 8), Shell is Changing the Energy Game – and in a Big Way, http://tinyurl.com/cryl8ct.24 See DOE, “Vehicle Cost Calculator” http://tinyurl.com/cwgqnol; “Making the Business Case for Alternative-Energy Vehicles” Green Fleet (May 2, 2012) http://tinyurl.com/8547at2.
While alternative fuel vehicles are being produced and used in fleets, the limited availability of refueling stations for these vehicles remains a substantial barrier to further deployment.20
Alternative fueling stations are rapidly becoming more available for agency and other fleets, but they are still scarce compared to the 150,000 public stations that offer petroleum fuels in the U.S. Relevant statistics regarding the status of refueling networks for alternative fueled vehicles include the following:
As of April 25, 2012, the nation had 9,006 electric charging stations; 2,662 liquefied petroleum gas (LPG) stations; 2,498 E85 stations (E85 refers to a fuel blend that is composed of at least 85 percent ethanol); 992 CNG stations; 617 B20 stations (B20 refers to a 20 percent biodiesel blend); 56 hydrogen stations; and 47 LNG stations serving the U.S. interstate highway system.21
The average cost to build a CNG refueling station ranges between $600,000 and $1 million.22
Clean Energy Fuels Corp. and its partners plan to invest about $450 million to build a network of 150 natural gas refueling stations:23
These stations may be higher than average investments due to the cost of land acquisition and more pumps.
In June, 2012 Shell said it will invest $300 million in 100 new LNG fueling outlets in the U.S. Most of the fueling outlets will be hosted at Travel Centers of America truck stops along interstate highways.24
B. Operating and Life Cycle Cost Benefits
Vehicles running on CNG, LNG or electricity offer substantial savings in fuel costs compared to gasoline and diesel (see Box 2). In many heavy-duty vehicle applications, lower operating costs yield lower total cost of ownership (life cycle costs) than in the case of petroleum-fueled vehicles (see Box 3). In general these fuel/operating cost advantages are more pronounced the more intensively the vehicle is used (i.e., more miles driven per year). This is because, for high-mileage vehicles, fuel cost savings offset the higher initial costs of alternative fuel engines and other vehicle equipment.25
It also bears emphasis that the DOE expects the current $1.00 plus per gallon price differential between CNG/LNG and diesel fuel to continue over the next 20 years; indeed the gap may actually widen. See Box 2.
In March 2012, the CEO of the American Trucking Association observed that "serious competition now exists between suppliers of diesel and natural gas trucking services."
Vehicles running on CNG, LNG or electricity offer substantial savings in fuel costs compared to gasoline and diesel (see Box 2).

10
26 DOE, “Clean Cities Alternative Fuel Price Report” at 3 (Jan. 2012, Oct. 2011, July 2011, April 2011) http://tinyurl.com/3su879c.27 “Diesel and gasoline data from the U.S. Energy Information Administration. CNG and LNG data from a nationwide price survey of Clean Energy Fuels public-access stations.” Clean Energy Fuels Corp., “Fuel Price Report” http://tinyurl.com/8367ayf.28 DOE, “Benefits of Hybrid and Plug-In Electric Vehicles” http://tinyurl.com/6z334nm.
Nationwide Average Price in Gasoline Gallon Equivalents26
Box 2 Price Comparisons Between Petroleum and Alternative Fuels
Fuel Jan. 2012 Oct. 2011 July 2011 April 2011
Gasoline $3.37 $3.46 $3.68 $3.69
Diesel $3.46 $3.42 $3.54 $3.62
Compressed Natural Gas (CNG)
$2.13 (38% less than diesel)
$2.09 (39% less than diesel)
$2.07 (42% less than diesel)
$2.06 (43% less than diesel)
Ethanol (E85) $4.44 $4.51 $4.60 $4.52
Propane $4.26 $4.23 $4.26 $4.41
Biodiesel (B20) $3.61 $3.57 $3.67 $3.69
Biodiesel (B99-B100) $4.14 $4.12 $4.13 $4.26
Nationwide Average Price in Diesel Gallon Equivalents27
Fuel Cost per Mile for Gasoline, Hybrid, and Electric Vehicles28
Fuel Price in Week of April 9, 2012 Price in Week of May 21, 2012
Gasoline $3.55 $3.34
Diesel $4.15 $3.96
Compressed Natural Gas (CNG) $2.37 (43% less than diesel) $2.29 (42% less than diesel)
Liquefied Natural Gas (LNG) $2.86 (31% less than diesel) $2.92 (26% less than diesel)
Fuel Typical costs per mile for fuel
Gasoline $0.10 to $0.15
Hybrid electric vehicles$0.05 to $0.07
(30%-67% less than gasoline)
Electric vehicles$0.02 to $0.04
(60%-87% less than gasoline)

11
Box 2 Continued
Fuel Cost per Mile for Gasoline and Electric Vehicles29
Plug-In Electric Vehicles Evaluated Cost to Drive 25 Miles
Four 2011-12 electric cars $0.90 to $1.38
Two 2011-12 electric light-duty trucks $1.62
Diesel and Natural Gas Transportation Fuel Prices 2005 - 2035
Source: EIA, "Annual Energy Outlook 2012," heavy duty vehicle reference case, supra at 40.
20
10 D
olla
rs p
er
Die
sel G
allo
n E
qu
ivale
nt
29 OE and EPA, “www.fueleconomy.gov” http://tinyurl.com/dyox63b.
12
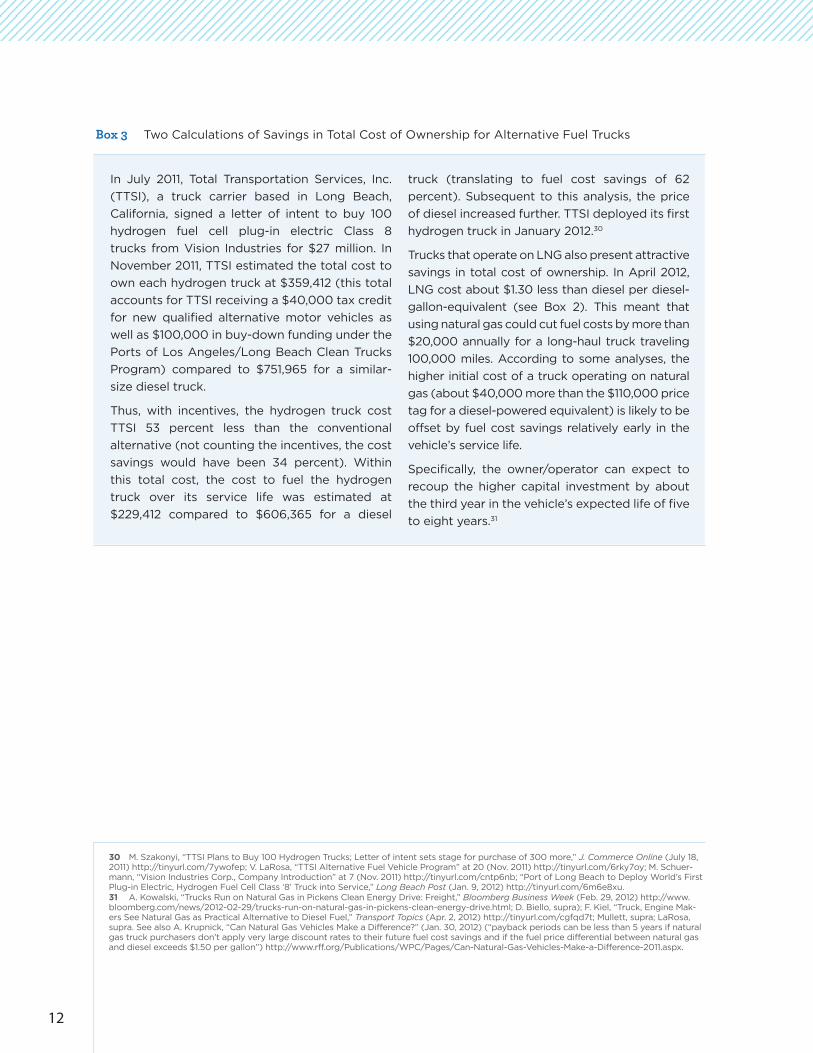
In July 2011, Total Transportation Services, Inc.
(TTSI), a truck carrier based in Long Beach,
California, signed a letter of intent to buy 100
hydrogen fuel cell plug-in electric Class 8
trucks from Vision Industries for $27 million. In
November 2011, TTSI estimated the total cost to
own each hydrogen truck at $359,412 (this total
accounts for TTSI receiving a $40,000 tax credit
for new qualified alternative motor vehicles as
well as $100,000 in buy-down funding under the
Ports of Los Angeles/Long Beach Clean Trucks
Program) compared to $751,965 for a similar-
size diesel truck.
Thus, with incentives, the hydrogen truck cost
TTSI 53 percent less than the conventional
alternative (not counting the incentives, the cost
savings would have been 34 percent). Within
this total cost, the cost to fuel the hydrogen
truck over its service life was estimated at
$229,412 compared to $606,365 for a diesel
truck (translating to fuel cost savings of 62
percent). Subsequent to this analysis, the price
of diesel increased further. TTSI deployed its first
hydrogen truck in January 2012.30
Trucks that operate on LNG also present attractive
savings in total cost of ownership. In April 2012,
LNG cost about $1.30 less than diesel per diesel-
gallon-equivalent (see Box 2). This meant that
using natural gas could cut fuel costs by more than
$20,000 annually for a long-haul truck traveling
100,000 miles. According to some analyses, the
higher initial cost of a truck operating on natural
gas (about $40,000 more than the $110,000 price
tag for a diesel-powered equivalent) is likely to be
offset by fuel cost savings relatively early in the
vehicle’s service life.
Specifically, the owner/operator can expect to
recoup the higher capital investment by about
the third year in the vehicle’s expected life of five
to eight years.31
Box 3 Two Calculations of Savings in Total Cost of Ownership for Alternative Fuel Trucks
30 M. Szakonyi, “TTSI Plans to Buy 100 Hydrogen Trucks; Letter of intent sets stage for purchase of 300 more,” J. Commerce Online (July 18, 2011) http://tinyurl.com/7ywofep; V. LaRosa, “TTSI Alternative Fuel Vehicle Program” at 20 (Nov. 2011) http://tinyurl.com/6rky7oy; M. Schuer-mann, “Vision Industries Corp., Company Introduction” at 7 (Nov. 2011) http://tinyurl.com/cntp6nb; “Port of Long Beach to Deploy World’s First Plug-in Electric, Hydrogen Fuel Cell Class ‘8’ Truck into Service,” Long Beach Post (Jan. 9, 2012) http://tinyurl.com/6m6e8xu.31 A. Kowalski, “Trucks Run on Natural Gas in Pickens Clean Energy Drive: Freight,” Bloomberg Business Week (Feb. 29, 2012) http://www.bloomberg.com/news/2012-02-29/trucks-run-on-natural-gas-in-pickens-clean-energy-drive.html; D. Biello, supra); F. Kiel, “Truck, Engine Mak-ers See Natural Gas as Practical Alternative to Diesel Fuel,” Transport Topics (Apr. 2, 2012) http://tinyurl.com/cgfqd7t; Mullett, supra; LaRosa, supra. See also A. Krupnick, “Can Natural Gas Vehicles Make a Difference?” (Jan. 30, 2012) (“payback periods can be less than 5 years if natural gas truck purchasers don’t apply very large discount rates to their future fuel cost savings and if the fuel price differential between natural gas and diesel exceeds $1.50 per gallon”) http://www.rff.org/Publications/WPC/Pages/Can-Natural-Gas-Vehicles-Make-a-Difference-2011.aspx.

13
32 California Environmental Protection Agency’s Office of Environmental Health Hazard Assessment and The American Lung Association of California, “Health Effects of Diesel Exhaust” http://tinyurl.com/3h2p5ov. See also South Coast Air Quality Management District, “Multiple Air Toxics Exposure Study (MATES II)” (2000) http://tinyurl.com/6r8ua5b; State and Territorial Air Pollution Program Administrators and the As-sociation of Local Air Pollution Control Officials, “Cancer Risk from Diesel Particulate: National and Metropolitan Area Estimates for the United States” (2000) http://tinyurl.com/7ydpjam.33 EPA and National Highway Transportation Safety Administration (NHTSA), “Regulatory Impact Analysis: Final Rule making to Establish Greenhouse Gas Emissions Standards and Fuel Efficiency Standards for Medium- and Heavy-Duty Engines and Vehicles” at Chapter 8 (2011) http://tinyurl.com/3v8jn3r; EPA, “Regulatory Impact Analysis: Heavy-Duty Engine and Vehicle Standards and Highway Diesel Fuel Sulfur Control Requirements” Executive Summary at iii, xv (2000) http://tinyurl.com/7snazay; Clean Air Task Force, “An Analysis of Diesel Air Pollution and Public Health in America” (2005) http://tinyurl.com/7fvtbx4.34 EPA and NHTSA, supra, at 8-105 – 8-111; National Research Council, Advancing the Science of Climate Change (2010); P. Epstein and D. Ferber, Changing Planet, Changing Health (2011); Massachusetts v. EPA, 549 U.S. 497 (2007).35 EPA’s Denial of Petitions to Reconsider the Endangerment and Cause or Contribute Findings for Greenhouse Gases Under Section 202(a) of the Clean Air Act, 75 Fed. Reg. 49,556, at 49,557 (2010), aff’d sub nom. Coalition for Responsible Regulation v. EPA, slip op. (D.C. Cir. June 26, 2012) http://tinyurl.com/6oqn7y7.36 DOE, “Alternative & Advanced Vehicles” http://tinyurl.com/7xco7fx.
C. Air Quality Benefits
In addition to cost savings, alternative fuel vehicles
have important environmental advantages,
including lower emissions of conventional air
pollutants (such as particulate matter and nitrogen
oxides) and GHGs (primarily carbon dioxide).
Emissions from conventional vehicles—especially
those operated on diesel—cause premature
mortality and increased morbidity. According to a
comprehensive health assessment of diesel exhaust
by the California Environmental Protection Agency
in 1998, diesel exhaust contains more than 40
toxic air contaminants, including arsenic, benzene,
formaldehyde and nickel. The California Air
Resources Board estimated that about 70 percent
of the cancer risk that the average Californian faced
from breathing toxic air pollutants stemmed from
diesel exhaust particles. In response, California
introduced regulations that call for the use of
cleaner-burning diesel fuel, require operators to
retrofit existing engines with particle-trapping filters,
and require manufacturers of new diesel engines to
incorporate advanced technologies that produce
fewer particulate emissions. California’s air quality
policies and regulations also support switching to
alternative fuels. According to the California EPA:
“The use of other fuels, such as natural gas, propane
and electricity offers alternatives to diesel fuel. All
of them produce fewer polluting emissions than
current formulations of diesel fuel.”32
At the federal level, the U.S. EPA set standards
for heavy-duty vehicle emissions of particulates
and other pollutants in 2000 and 2011 based on
epidemiological evidence linking diesel exhaust
to increased risk of lung cancer and other health
effects, including chronic bronchitis, asthma attacks,
and significant numbers of hospital visits, lost work
days, and multiple respiratory ailments. The EPA
also cited welfare impacts from other components
of heavy-duty vehicle exhaust, including agricultural
crop damage, impacts on forest productivity,
visibility, and nitrogen deposition in rivers
and lakes.33
As sources of soot (black carbon) and carbon
dioxide, heavy-duty diesel vehicles also account
for nearly 6 percent of all U.S. GHG emissions. In
this way, they contribute to the problem of global
climate change, which in turn has been linked
to a variety of potentially far-reaching adverse
impacts on ecosystems and human health and
welfare (e.g. sea level rise, increased frequency
of severe weather events, droughts and water
shortages, habitat loss and species extinction,
and increased human mortality and morbidity
from heat-related and vector-borne illnesses).34
As the U.S. EPA recently concluded in finding a
basis for regulating GHG emissions from certain
sources, including heavy-duty vehicles, under the
Clean Air Act, the scientific record indicating that
“elevated concentrations of greenhouse gases in
the atmosphere may reasonably be anticipated to
endanger the public health and welfare of current
and future U.S. generations is robust, voluminous,
and compelling.”35
By contrast, a number of studies find that life cycle
GHG emissions for vehicles operated on CNG
and LNG are substantially lower than for vehicles
operated on gasoline and diesel. In a recent
review of studies by National Renewable Energy
Laboratory and Argonne National Laboratory, for
example, DOE concluded that “[t]hroughout its life
cycle, natural gas emits a much smaller amount of
GHGs than gasoline.”36
Likewise, several studies have concluded that
driving an electric car on the average U.S. electricity
mix—which includes some power generated by
high-emitting, coal-fired power plants, as well
power from natural gas, nuclear, and renewable
generators—results in substantial emissions
reductions compared to driving the average
gasoline-fueled car. These environmental benefits
would be expected to increase over time as new
Clean Air Act regulations and a shift to cleaner
generating sources (primarily renewable and natural
gas) further reduce overall emissions from the U.S.
power sector (see Box 4).

14
37 Id.38 These studies do not reflect certain technologies that are available but not standard for diesel-fueled vehicles, such as diesel particulate filters. Regarding GHGs, DOE reported the California Energy Commission’s finding for buses in 2007. DOE noted that the diesel “counterparts, however, are cleaner in California than in the rest of the nation, therefore understating the benefits of natural gas vehicles.” Id.39 See R. Alvarez, et al., “Greater Focus Needed on Methane Leakage from Natural Gas Infrastructure,” Proceedings of the National Academy of Sciences (2012) (concluding that GHG benefits from switching to natural gas in the transportation sector arise only if methane leakage is below approximately 1 percent of natural gas production, whereas EPA’s 2010 estimates are approximately 2.4 percent) http://tinyurl.com/7r4p6xl. A recent survey of several hundred wells put methane leakage below 0.5 percent, however, where “green completions” were used. IHS Cambridge Energy Research Associates, “Mismeasuring Methane: Estimating Greenhouse Gas Emissions from Upstream Natural Gas Development” 8, 10 (2011) (“Common industry practice is to capture gas for sale as soon as it is technically feasible. Gas that cannot be sold is generally flared rather than vented for safety reasons…. The volume of gas vented or flared is a very small percentage of total gas production each year, and IHS CERA believes that EPA has greatly overestimated these volumes.”) http://tinyurl.com/clepya3.40 EPA, “Oil and Natural Gas Sector: New Source Performance Standards and National Emission Standards for Hazardous Air Pollutants Reviews” (April 17, 2012) http://tinyurl.com/7rnhdu5. 41 S. Boschert, “The Cleanest Cars: Well to Wheels Emissions Comparisons” (May 2008) http://tinyurl.com/7t6d7md. 42 Union of Concerned Scientists, “State of Charge: Electric Vehicles’ Global Warming Emissions and Fuel-cost Savings across the United States” 4, 55 (2012) (“Over the lifetime of an EV, the owner can save more than 6,000 gallons of gasoline – a significant contribution to U.S. energy security. But, our nation’s reliance on coal-powered electricity limits electric vehicles from delivering their full potential.”) http://tinyurl.com/bmdc2bj.43 Electric Power Research Institute and Natural Resources Defense Council, “Environmental Assessment of Plug-in Hybrid Electric Vehicles”(2007) http://tinyurl.com/4e8vrxx.44 DOE and EPA, “Greenhouse Gas Emissions for Electric and Plug-In Hybrid Electric Vehicles” http://tinyurl.com/6nzrtj7.
DOE’s review of studies that have analyzed the life
cycle emissions of alternative and conventionally
fueled vehicles shows that, compared to reformulated
gasoline, CNG and LNG vehicles reduce life cycle
GHG emissions by 21–26 percent, particulate matter
emissions by 80 percent, carbon monoxide emissions
by 20–40 percent, and emissions of volatile organic
compounds by 10 percent.37
In studies of heavy-duty vehicles, DOE’s review
finds that the use of CNG and LNG, when compared
to diesel, reduces life cycle GHGs by at least 16–23
percent, particulate matter emissions from 85
percent to near 100 percent (i.e., undetectable levels),
and emissions of nitrogen oxides by 17–80 percent.38
Various recent studies report a range of GHG life
cycle comparisons between alternative fuels and
petroleum-base fuels.39 According to the DOE review,
“[m]any of the GHGs emitted from the life cycle of
natural gas fuels result from leakage,” mostly at wells.
Some states (Wyoming and Colorado) regulate wells
to reduce such leakage; in addition, EPA in April 2012
adopted national restrictions on fugitive methane
emissions from natural gas wells.40
Several studies found that the life cycle emissions
of plug-in electric vehicles, taking into account
upstream emissions from power plants, are
significantly lower than the life cycle emissions of
comparable petroleum-fueled vehicles in most parts
of the country.41 The life cycle emissions of electric
vehicles depend on the emissions of the power
plants that generate the electricity used to charge
them. According to a recent study by the Union of
Concerned Scientists: “[N]o matter where you live
in the United States, electric vehicles charged on the
power grid have lower global warming emissions
than the average gasoline-based vehicle sold today….
Nearly half of Americans live in regions where driving
an electric vehicle means lower global warming
emissions than driving even the best hybrid gasoline
vehicle available."42 Another study by the Electric
Power Research Institute and the Natural Resources
Defense Council notes that the air quality benefits of
electric vehicles can be expected to increase as the
electricity supply mix becomes cleaner over time.43
Another evaluation of seven light-duty electric
and plug-in hybrid electric vehicles by DOE and
EPA found, on average nationally, 28–60 percent
reductions in CO2 emissions compared to the average
new conventional gasoline vehicle. Larger reductions
are achievable in regions with a less carbon-intensive
electricity supply mix (typically regions with less
power generated by coal-fired plants).
Box 4 LNG, CNG, and Electricity Reduce Harmful Life Cycle Vehicle Air Emissions
Carbon Dioxide Emissions from Electric and Plug-in Electric Hybrid Light-Duty Vehicles44
Electric and Plug-in Electric Hybrid Vehicles Evaluated
CO2 Reductions Compared to Average New Vehicle
Five 2011-12 electric cars 48% - 60%
Two 2011-12 electric light-duty trucks 28%
15
45 The Congressional Budget Office (CBO) recently summarized federal support for alternatives to petroleum since the 1970s: “From 1916 to the 1970s, federal energy-related tax policy focused almost exclusively on increasing the production of domestic oil and natural gas; there were no tax incentives for promoting renewable energy or increasing energy efficiency. Beginning in the 1970s, lawmakers began adding tax preferences for new sources of fossil fuel, alternatives to fossil fuel, and energy efficiency. Disruptions in the supply of oil in the 1970s heightened interest in encouraging the production of alternative transportation fuels, such as ethanol and “unconventional fuels” (for example, oil produced from shale and tar sands, or synthetic fuel produced from coal). Furthermore, growing awareness of environmental damage caused by producing energy from fossil fuels—such as the harmful effects of the carbon dioxide (CO
2) emissions from burning coal—led to
tax preferences for improvements in energy efficiency and for the production of electricity from renewable sources." CBO, “Federal Financial Support for the Development and Production of Fuels and Energy Technologies” at 2 (Mar. 2012) http://tinyurl.com/87fwoso. See generally “President Obama Stresses Energy Independence” (Mar. 22, 2012) (“[A]nyone who says that just drilling more will bring gas prices down just isn’t playing it straight…. I don’t want the energy jobs of tomorrow going to other countries. I want them here…. If we’re going to end our de-pendence on foreign oil and bring gas prices down once and for all, we need to develop every single source of American energy, and every new technology that can help us use it more efficiently.”) http://tinyurl.com/78a3gtd; C. Krauss & E. Lipton, “U.S. Inches Toward Goal of Energy In-dependence” N.Y. Times (Mar. 22, 2012) (“[T]he increasing production and declining consumption have unexpectedly brought the United States markedly closer to a goal that has tantalized presidents since Richard Nixon: independence from foreign energy sources, a milestone that could reconfigure American foreign policy, the economy and more.”) http://tinyurl.com/7q46tdh. 46 “Remarks by the President on the Clean Fleet Partnership in Landover, Maryland” (Apr. 1, 2011) http://tinyurl.com/8x9kgq7. 47 “Remarks by the President on American-Made Energy” (Jan. 26, 2012) http://tinyurl.com/8ytvfpk.
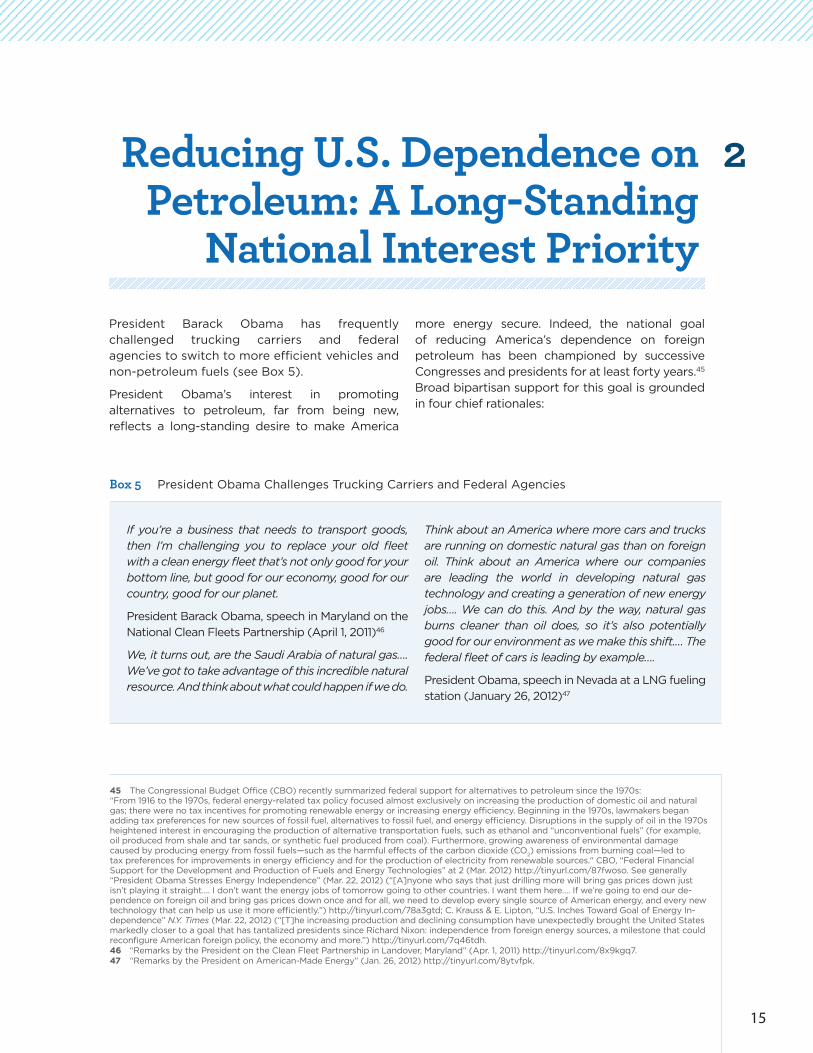
President Barack Obama has frequently challenged trucking carriers and federal agencies to switch to more efficient vehicles and non-petroleum fuels (see Box 5).
President Obama’s interest in promoting alternatives to petroleum, far from being new, reflects a long-standing desire to make America
more energy secure. Indeed, the national goal of reducing America’s dependence on foreign petroleum has been championed by successive Congresses and presidents for at least forty years.45
Broad bipartisan support for this goal is grounded in four chief rationales:
Reducing U.S. Dependence on Petroleum: A Long-Standing
National Interest Priority
2
If you’re a business that needs to transport goods, then I’m challenging you to replace your old fleet with a clean energy fleet that’s not only good for your bottom line, but good for our economy, good for our country, good for our planet.
President Barack Obama, speech in Maryland on the
National Clean Fleets Partnership (April 1, 2011)46
We, it turns out, are the Saudi Arabia of natural gas…. We’ve got to take advantage of this incredible natural resource. And think about what could happen if we do.
Think about an America where more cars and trucks are running on domestic natural gas than on foreign oil. Think about an America where our companies are leading the world in developing natural gas technology and creating a generation of new energy jobs…. We can do this. And by the way, natural gas burns cleaner than oil does, so it’s also potentially good for our environment as we make this shift.… The federal fleet of cars is leading by example….
President Obama, speech in Nevada at a LNG fueling
station (January 26, 2012)47
Box 5 President Obama Challenges Trucking Carriers and Federal Agencies

16
48 “Remarks by the President in State of the Union Address” (Jan. 25, 2012) http://tinyurl.com/6wlclp5.49 “Remarks of the President on American-Made Energy” (Jan. 26, 2012) http://tinyurl.com/87qzkbq.50 “Remarks of the President on Energy – Mount Holly, NC” (Mar. 7, 2012) http://tinyurl.com/7kek4ju.
• Dependence on a single energy source in a major sector of the U.S. economy makes our nation less energy secure, particularly when that energy source (in this case, petroleum) is subject to potential supply disruptions and other global-scale market perturbations that are beyond U.S. control.
• Given projected global demand growth, world oil prices are likely to remain high by historic standards for the foreseeable future. At the same time, the United States, despite considerable (and recently expanding) domestic oil production, can be expected to continue importing large quantities of petroleum. In this context, reducing our overall use of petroleum can save money for American consumers and businesses, while improving the nation’s balance of payments.
• Developing domestic sources of energy creates American jobs.
• Alternative fuel vehicles generate lower harmful air emissions, including sulfur dioxide, nitrogen oxides, particulate matter and carbon dioxide.
This section describes past efforts to reduce America’s dependence on, and consumption of, petroleum. It also reviews existing federal policies and programs to promote the deployment of alternative fuel vehicles.
A. Recent Presidential Statements
President Obama has called attention to the twin goals of reducing oil consumption and increasing the use of non-petroleum, domestic fuels on a number of occasions, including in his 2012 State of the Union address:48
[N]owhere is the promise of innovation greater than in American-made energy…. [L]ast year, we relied less on foreign oil than in any of the past 16 years.
But with only 2 percent of the world’s oil reserves, oil isn’t enough. This country needs an all-out, all-of-the-above strategy that develops every available source of American energy. A strategy that’s cleaner, cheaper, and full of new jobs.
We have a supply of natural gas that can last America nearly 100 years…. The development of natural gas will create jobs and power trucks and factories that are cleaner and cheaper, proving that we don’t have to choose between our environment and our economy.
The next day, at a United Parcel Service Inc. (UPS) fueling facility for liquefied natural gas trucks in Nevada, President Obama returned to this national goal:49
[P]art of my blueprint and what I want to focus on a little bit today is for an economy built to last with American energy…. For decades, Americans have been talking about how do we decrease our dependence on foreign oil…. Over the last three years, we negotiated the toughest new efficiency standards for cars and trucks in history. We’ve opened millions of new acres for oil and gas exploration…. Think about an America where more cars and trucks are running on domestic natural gas than on foreign oil…. The federal fleet of cars is leading by example.
On March 7, 2012, the President spoke at a North Carolina factory that manufactures trucks fueled by natural gas:50
[A]s much as we’re doing to increase oil production, we’re not going to be able to drill our way out of the problem of high gas prices…. If we are going to control our energy future, then we’ve got to have an all-of-the-above strategy. We’ve got to develop every source of American energy – not just oil and gas, but wind power and solar power, nuclear power, biofuels.

17
51 “Remarks by the President on Oil and Gas Subsidies” http://tinyurl.com/7ac6r75.52 As part of his speech at the North Carolina natural gas truck plant, Obama highlighted the importance of federal leadership in this area: “We’re … making it easier for big companies… to make the shift to fuel-efficient cars and trucks. We call it the National Clean Fleets Partner-ship…. We’re creating more customers for your trucks. And I am proud to say that the federal government is leading by example. One thing the federal government has a lot of is cars and trucks…. And so what I did was I directed every department, every agency in the federal govern-ment, to make sure that by 2015, 100 percent of the vehicles we buy run on alternative fuels…. So we’re one of the biggest customers in the world for cars and trucks and we want to set that bar high.” “Remarks of the President on Energy – Mount Holly, NC”, supra.53 Energy Policy Act of 1992, Section 303-311. See U.S. General Accounting Office, “Energy Policy Act of 1992: Limited Progress in Acquiring Alternative Fuel Vehicles and Reaching Fuel Goals” (2000) http://www.gao.gov/assets/230/228667.pdf. As a significant exemption, in 2007, DOE authorized “Alternative Compliance”, allowing fleets to employ petroleum reduction measures (including reducing vehicle miles traveled or idling) in lieu of acquiring alternative fuel vehicles. DOE, “Vehicle Technologies Program: Alternative Compliance” http://tinyurl.com/6rose2s. This legislation also mandates acquisitions of alternative fuel vehicles or Alternative Compliance by state government fleets and certain busi-nesses whose principal activity is based on the production or sale of alternative fuels (including electric and gas utilities and propane provid-ers). DOE, “Vehicles Technologies Program: State and Alternative Fuel Provider Fleet Compliance Methods” http://tinyurl.com/7fqrfhm.
We need to invest in the technology that will help us use less oil in our cars and our trucks, in our buildings, in our factories.
Later the same month, on March 29, 2012, President Obama declared:
I don't want folks...to have to pay more at the pump every time that there's some unrest in the Middle East and oil speculators get nervous about whether there's going to be enough supply.51
B. Existing Federal Policies and Initiatives
The presidential statements excerpted above point to several of the major federal strategies that have been used in an effort to reduce U.S. petroleum consumption: fuel efficiency standards for cars and trucks; federal support for research and development on alternative fuel technologies; federal tax incentives for the purchase and/or manufacture of alternative fuel vehicles; incentives for the construction of fueling stations for alternative fuels; and alternative fuel requirements for federal fleet vehicles.52
As discussed further in sections 2.C and 2.D, the federal government has two main sources of leverage in using its buying power to create demand for alternative fuels and alternative fuel vehicles.
• First, federal agencies can focus on their own fleets, by directly acquiring more alternative fuel vehicles and taking other steps to reduce their petroleum consumption.
• Second, federal agencies can apply preferences for alternative fuel and fuel-efficient vehicles when directly and indirectly procuring transportation services from third-party carriers and other suppliers who themselves require transport services to meet federal orders.
Over the last two decades, a variety of provisions aimed at increasing the federal government’s use of alternative fuels have been included in
energy-related legislation and executive orders. These include the Energy Policy Act of 1992; the Energy Policy Act of 2005; the Energy Security and Independence Act of 2007; the America Competes Act of 2007; Executive Order 13423 issued by President George W. Bush; and Executive Order 13514 issued by President Obama. The key directives are summarized below.
• The Energy Policy Act of 1992, as amended in 2005, sets minimum requirements by year for the federal procurement of alternative fuel vehicles. For light-duty vehicle acquisitions (purchases or leases), 25 percent had to qualify as alternative fuel vehicles in 1996. The proportion increased to 33 percent in 1997, 50 percent in 1998, and 75 percent in subsequent years. The legislation also required agencies to issue annual reports on their use of alternative fuels and created several incentive programs to encourage switching to alternative fuel vehicles. DOE can grant exemptions from these purchase requirements if the vehicles or the alternative fuels needed to operate them are not available.53
Contrary to the intent of the 1992 legislation, however, most of the vehicles that have been acquired by federal agencies pursuant to these requirements are “flex fuel” or “dual fuel” vehicles and most of them operate most of the time on conventional, petroleum-based fuels. Gasoline and diesel still accounted for the vast majority (96 percent) of vehicle fuel purchased by federal agencies in 2011, and overall petroleum consumption by the federal government has continued to increase.
• The Energy Independence and Security Act of 2007 established energy management goals and requirements for the federal government. Among other provisions, this legislation mandated energy conservation measures in federal buildings, energy-efficient product procurements, and efforts to reduce petroleum use by federal fleets. Section 141 requires that light-duty vehicles and medium-duty passenger

18
vehicles acquired by federal agencies must have low GHG emissions. Alternatively, an agency can achieve a comparable reduction in GHG emissions by adopting cost-effective policies to reduce its petroleum consumption. Section 142 also requires agencies to achieve, by 2015 and for each year thereafter, at least a 20 percent reduction in annual petroleum consumption and a 10 percent increase in annual alternative fuel consumption, from a 2005 baseline.54
• In the America Competes Act of 2007, Congress created the Advanced Research Projects Agency-Energy (ARPA-E) “to enhance the economic and energy security of the United States through the development of energy technologies that result in (i) reductions of imports of energy from foreign sources; (ii) reductions of energy-related emissions, including GHGs; and (iii) improvements in the energy efficiency of all economic sectors.”55
• In 2007, President George W. Bush issued Executive Order 13423, "Strengthening Federal Environmental, Energy, and Transportation Management." The order directed federal agencies to become more energy efficient and reduce their GHG emissions. This meant, among other efforts, applying energy-efficiency and environmental sustainability criteria to the acquisition of goods and services.56
Specifically, Executive Order 13423 required each federal agency to reduce petroleum consumption in its fleet vehicles by 2 percent annually through the end of FY2015, increase total fleet consumption of non-petroleum fuels by 10 percent annually, and use plug-in hybrid vehicles where such vehicles are commercially available at a life cycle cost reasonably comparable to that of other vehicles. Finally, each agency was required
to establish an environmental management system for its transportation functions and to create leadership awards for outstanding transportation management performance.57
C. Alternative Fuel Opportunities Related to Federal Fleet Vehicles
In 2009, President Obama issued Executive Order 13514, "Federal Leadership in Environmental, Energy, and Economic Performance". The order was intended to strengthen earlier legislative and administrative initiatives by establishing a measurement-based program to hold federal agencies accountable for progress on energy objectives. According to the text:58
In order to create a clean energy economy that will increase our Nation’s prosperity, promote energy security, protect the interests of taxpayers, and safeguard the health of our environment, the Federal Government must lead by example. It is therefore the policy of the United States that Federal agencies shall increase energy efficiency; measure, report, and reduce their greenhouse gas emissions from direct and indirect activities;… leverage agency acquisitions to foster markets for sustainable technologies and environmentally preferable materials, products, and services….
It is further the policy of the United States that to achieve these goals and support their respective missions, agencies shall prioritize actions based on a full accounting of both economic and social benefits and costs and shall drive continuous improvement by annually evaluating performance, extending or expanding projects that have net benefits, and reassessing or discontinuing under-performing projects.
54 DOE, “Energy Independence & Security Act” http://tinyurl.com/7rd6f39; EPA, “Guidance for Implementing Section 141 of the Energy Inde-pendence and Security Act of 2007: Federal Vehicle Fleets and Low Greenhouse Gas-Emitting Vehicles” (2010) http://tinyurl.com/73b8un4.55 P.L 110-69, Section 5012 (c)(1)(A) http://tinyurl.com/7yhb6up.56 Executive Order 13423, Sections 1, 2(a), 2(d) http://tinyurl.com/855xpg6.57 Id. at Sections 2(g) (applying baseline year of FY2005), 3(b), 3(c).58 Executive Order 13514, Section 1 http://tinyurl.com/ybdutq2
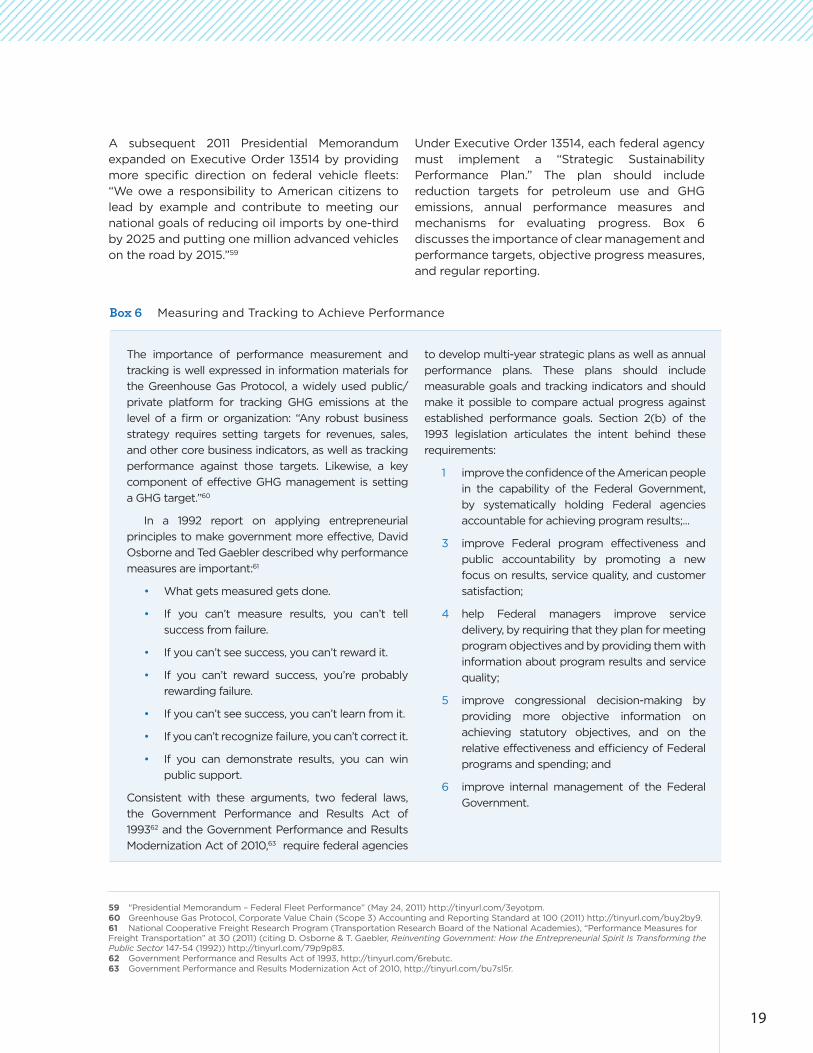
19
59 "Presidential Memorandum – Federal Fleet Performance” (May 24, 2011) http://tinyurl.com/3eyotpm.60 Greenhouse Gas Protocol, Corporate Value Chain (Scope 3) Accounting and Reporting Standard at 100 (2011) http://tinyurl.com/buy2by9. 61 National Cooperative Freight Research Program (Transportation Research Board of the National Academies), “Performance Measures for Freight Transportation” at 30 (2011) (citing D. Osborne & T. Gaebler, Reinventing Government: How the Entrepreneurial Spirit Is Transforming the Public Sector 147-54 (1992)) http://tinyurl.com/79p9p83.62 Government Performance and Results Act of 1993, http://tinyurl.com/6rebutc.63 Government Performance and Results Modernization Act of 2010, http://tinyurl.com/bu7sl5r.
A subsequent 2011 Presidential Memorandum expanded on Executive Order 13514 by providing more specific direction on federal vehicle fleets: “We owe a responsibility to American citizens to lead by example and contribute to meeting our national goals of reducing oil imports by one-third by 2025 and putting one million advanced vehicles on the road by 2015.”59
Under Executive Order 13514, each federal agency must implement a “Strategic Sustainability Performance Plan.” The plan should include reduction targets for petroleum use and GHG emissions, annual performance measures and mechanisms for evaluating progress. Box 6 discusses the importance of clear management and performance targets, objective progress measures, and regular reporting.
The importance of performance measurement and
tracking is well expressed in information materials for
the Greenhouse Gas Protocol, a widely used public/
private platform for tracking GHG emissions at the
level of a firm or organization: “Any robust business
strategy requires setting targets for revenues, sales,
and other core business indicators, as well as tracking
performance against those targets. Likewise, a key
component of effective GHG management is setting
a GHG target.”60
In a 1992 report on applying entrepreneurial
principles to make government more effective, David
Osborne and Ted Gaebler described why performance
measures are important:61
• What gets measured gets done.
• If you can’t measure results, you can’t tell
success from failure.
• If you can’t see success, you can’t reward it.
• If you can’t reward success, you’re probably
rewarding failure.
• If you can’t see success, you can’t learn from it.
• If you can’t recognize failure, you can’t correct it.
• If you can demonstrate results, you can win
public support.
Consistent with these arguments, two federal laws,
the Government Performance and Results Act of
199362 and the Government Performance and Results
Modernization Act of 2010,63 require federal agencies
to develop multi-year strategic plans as well as annual
performance plans. These plans should include
measurable goals and tracking indicators and should
make it possible to compare actual progress against
established performance goals. Section 2(b) of the
1993 legislation articulates the intent behind these
requirements:
1 improve the confidence of the American people
in the capability of the Federal Government,
by systematically holding Federal agencies
accountable for achieving program results;...
3 improve Federal program effectiveness and
public accountability by promoting a new
focus on results, service quality, and customer
satisfaction;
4 help Federal managers improve service
delivery, by requiring that they plan for meeting
program objectives and by providing them with
information about program results and service
quality;
5 improve congressional decision-making by
providing more objective information on
achieving statutory objectives, and on the
relative effectiveness and efficiency of Federal
programs and spending; and
6 improve internal management of the Federal
Government.
Box 6 Measuring and Tracking to Achieve Performance

20
Executive Order 13514 further requires that agencies’ Strategic Sustainability Performance Plans address GHG emissions from the agency’s own direct operations, from indirect or upstream energy sources (including purchases of electricity, steam and heat from utilities and other suppliers), and from other sources (employee travel, suppliers of goods and services, etc.). The GHG reduction targets developed by the agencies are subject to approval by the CEQ, with review and evaluation by the OMB. Each agency’s annual plan must identify the specific actions and milestones that will be implemented to achieve targeted petroleum use and emissions reductions, and to evaluate progress.64
Three specific actions are listed in the order itself as opportunities for federal agencies to reduce their use of fossil fuels:
• use low GHG-emitting vehicles including alternative fuel vehicles;
• optimize the number of vehicles in the agency fleet; and
• reduce fleet consumption of petroleum products by a minimum of 2 percent annually through FY2020, relative to a baseline of FY2005.65
Finally, the order requires that by December 31, 2015, all new light-duty vehicles purchased or leased by federal agencies must be alternative fuel vehicles.66 Meanwhile, DOE, in coordination with the GSA, is directed to issue guidance on federal fleet management that addresses alternative fuel vehicles, biodiesel blends, electric vehicles, and options for improving fuel economy, optimizing fleets, reducing petroleum use, and installing renewable fuel pumps.67
D. Alternative Fuel Opportunities Related to Federal Procurement of Third-Party Transportation Services
Executive Order 13514 contains two provisions that address the procurement of third-party transportation services and other goods.68 First, agencies are required to ensure that 95 percent of their new contracts with outside vendors or providers are for products and services that are energy efficient and environmentally preferable. This mandate applies to purchases that affect an agency’s direct operations (such as fleets and related products and services). Moreover, the standard also applies to third-party services (such as carriers delivering freight to, from, or between agency locations) and other supply-chain activities (such as the energy used by product suppliers to ship their goods to agency locations, as well as the energy used to produce the goods before they are shipped). Implementing and enforcing these requirements is proving problematic, however, because agencies are not required to measure and report the extent to which their acquisitions are “energy efficient” and “environmentally preferable.”
Second, Executive Order 13514 encourages agencies to establish targets for reducing GHG emissions from their suppliers, including especially emissions from third-party providers of transportation services. According to the text of the order:
In establishing the target, the agency head shall consider reductions associated with: (i) pursuing opportunities with vendors and contractors to address and incorporate incentives to reduce greenhouse gas emissions (such as changes to manufacturing, utility or delivery services, modes of transportation used, or other changes in supply chain activities)….
Finally, the order directs the CEQ to issue guidance on GHG accounting and reporting, and the GSA to lead the development of recommendations for working with vendors and contractors to track and reduce their emissions.69
64 Executive Order 13514, supra, Sections 2(a), 2(b).65 Id. at Section 2(a)(iii).66 Presidential Memorandum, supra, at Section 1 (some exceptions apply).67 Executive Order 13514, supra, Sections 8, 12.68 Id. at Secs. 2(b)(i), (h).69 CEQ’s guidance issued in October 2010 determined that agencies were not required to report emissions related to their vendors and contractors at that time because accepted methods for calculating such emissions “are evolving”. The guidance anticipated a phased approach to expanding the tracking of sup-pliers’ emissions “to the greatest extent feasible”, and allowed agencies voluntarily to report GHG emissions from any type of activity related to their vendors and contractors. CEQ, “Federal Greenhouse Gas Accounting and Reporting Guidance: Technical Support Document” at 13-17 (2010) (types of indirect emissions subject to initial plans and annual tracking limited to federal employee business air and ground travel; federal employee commuting; contracted solid waste dis-posal; contracted wastewater treatment; and transmission and distribution losses associated with purchased electricity) http://tinyurl.com/chcl7a7. Similarly, GSA supported a phased approach to supplier GHG emissions to oversight of agency procurements. Greenhouse Gas Protocol, supra (The Greenhouse Gas Protocol standards “are the most widely used accounting tools to measure, manage and report greenhouse gas emissions.” Id. at back cover. This program is sponsored by World Business Council for Sustainable Development and World Resources Institute.). Despite the release of these new GHG accounting tools, however, in June 2012, the CEQ did not require accounting for third-party transportation emissions. CEQ, “Federal Greenhouse Gas Accounting and Reporting Guidance” at 16-19 (2012) http://tinyurl.com/bq6myuy. CEQ started: “The goal of this approach is to continually improve [indirect emissions] data quality. Over time, new methodologies and procedures will be included in revisions to this document and the [Technical Support Document] to improve the Federal Government’s ability to account for and report GHG emissions through the inventory process.” Id. at 17. While affirming that agencies need not develop precise measurements, the guidance noted the beneficial effects of even voluntary, partial efforts by the agencies to measure their supply-chain emissions: “Preliminary efforts to inventory agency [indirect] vendor and contractor emissions serves to signal to industry that the government finds supply chain sustainability important.” Id. at 19.

21
70 GSA, “Fiscal Year 2011 Federal Fleet Report” Tables 1, 3-2, 5-1 and 5-2 (figures include U.S. Postal Service; fuel consumption for alternative fuels converted to gasoline gallon equivalents) http://tinyurl.com/bouvcg5.71 Id.
Collectively, federal agencies own a sizable number of motor vehicles—about 660,000, in fact. Thus, federal fleets are plainly worthy of attention in terms of the opportunity they present for cutting costs to taxpayers, reducing petroleum dependence, increasing the use of alternative fuels, and reducing emissions. However, the federal government contracts for a far larger volume of transportation services than it directly provides using its own vehicles. Hence the opportunity to influence fuel and vehicle markets through federal procurement contracts with third-party transportation providers is potentially much greater than the opportunity available by just focusing on federal fleets. This section reviews the size and scope of the federal government’s transportation activities, both as the owner and operator of its own fleet vehicles and as a direct and indirect purchaser of transportation services.
A. Federal Fleets
In FY2011, federal agencies owned or leased about 660,000 “fleet” vehicles. The majority of these vehicles (61 percent) are trucks; 38
percent are passenger vehicles, and less than 1 percent are other types of vehicles (buses, ambulances, etc.).70 To operate these vehicles, the federal government spent approximately $1.4 billion to purchase about 417 million gallons of fuel in FY2011. A breakdown of these purchases reveals that petroleum-based gasoline and diesel still dominate:
• 77 percent gasoline
• 19 percent diesel
• 2 percent ethanol blend (E85)
• 2 percent biodiesel blend (B20)
• 0.1 percent CNG
• small amounts of liquefied petroleum gas, electricity, pure or “neat” biodiesel (B100), hydrogen and LNG
In terms of costs, federal agencies spent $4.4 billion in FY2011 on fleet vehicle expenses, including maintenance, leases, depreciation and indirect expenditures.
A handful of agencies own the great majority of all federal fleet vehicles. Agencies with more than 10,000 vehicles are listed in Table 1.71
Alternative Fuels for the Federal Government: Saving Money for Taxpayers and Moving Markets
3
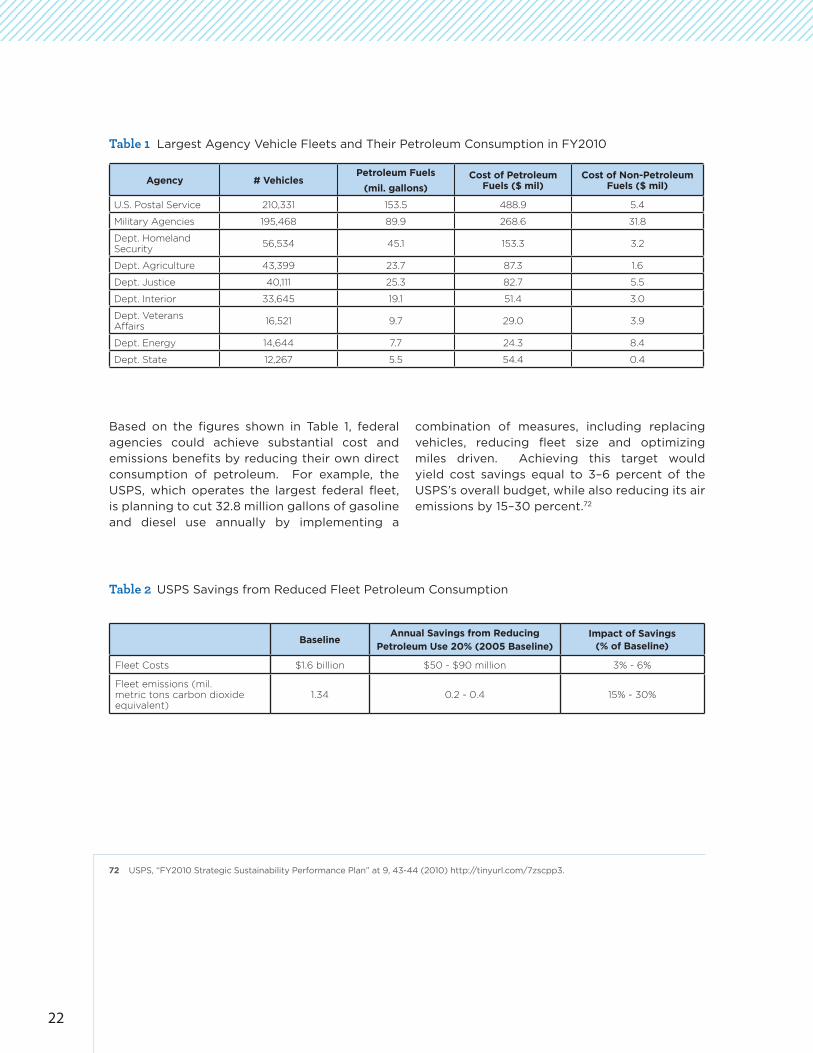
22
Table 1 Largest Agency Vehicle Fleets and Their Petroleum Consumption in FY2010
72 USPS, “FY2010 Strategic Sustainability Performance Plan” at 9, 43-44 (2010) http://tinyurl.com/7zscpp3.
Based on the figures shown in Table 1, federal agencies could achieve substantial cost and emissions benefits by reducing their own direct consumption of petroleum. For example, the USPS, which operates the largest federal fleet, is planning to cut 32.8 million gallons of gasoline and diesel use annually by implementing a
combination of measures, including replacing vehicles, reducing fleet size and optimizing miles driven. Achieving this target would yield cost savings equal to 3–6 percent of the USPS’s overall budget, while also reducing its air emissions by 15–30 percent.72
Table 2 USPS Savings from Reduced Fleet Petroleum Consumption
Agency # VehiclesPetroleum Fuels
(mil. gallons)Cost of Petroleum
Fuels ($ mil)Cost of Non-Petroleum
Fuels ($ mil)
U.S. Postal Service 210,331 153.5 488.9 5.4
Military Agencies 195,468 89.9 268.6 31.8
Dept. Homeland Security
56,534 45.1 153.3 3.2
Dept. Agriculture 43,399 23.7 87.3 1.6
Dept. Justice 40,111 25.3 82.7 5.5
Dept. Interior 33,645 19.1 51.4 3.0
Dept. Veterans Affairs
16,521 9.7 29.0 3.9
Dept. Energy 14,644 7.7 24.3 8.4
Dept. State 12,267 5.5 54.4 0.4
BaselineAnnual Savings from Reducing
Petroleum Use 20% (2005 Baseline)Impact of Savings
(% of Baseline)
Fleet Costs $1.6 billion $50 - $90 million 3% - 6%
Fleet emissions (mil. metric tons carbon dioxide equivalent)
1.34 0.2 - 0.4 15% - 30%
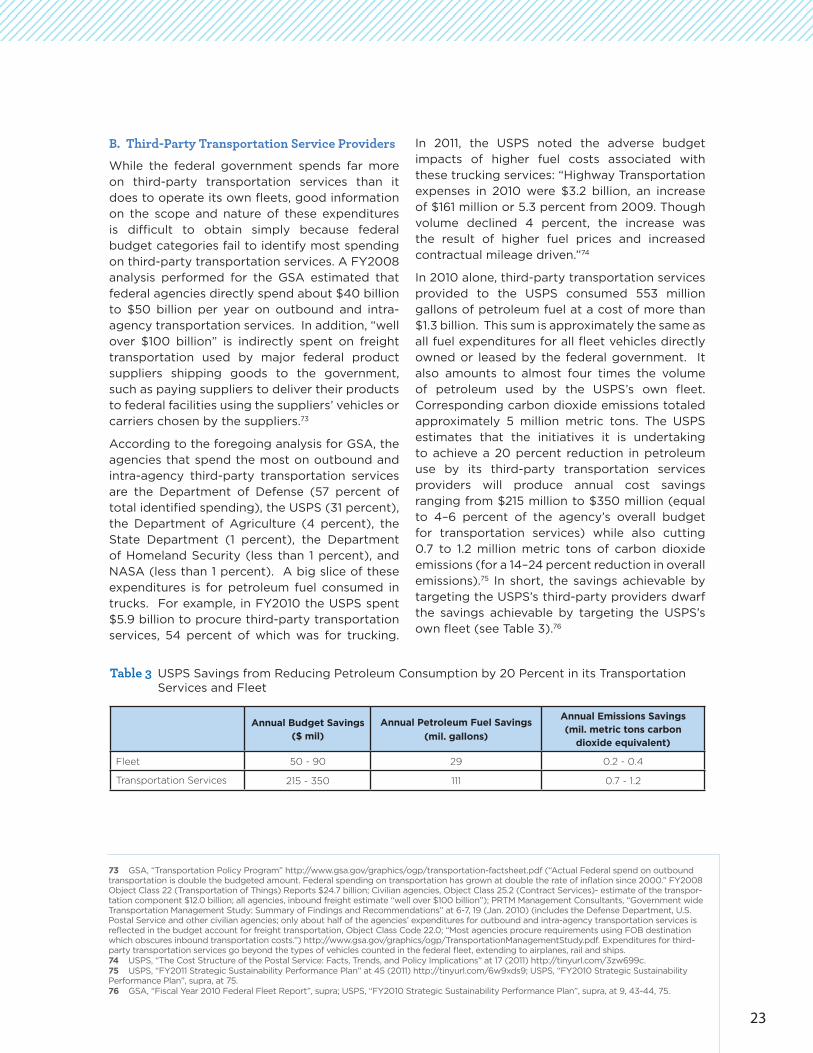
23
73 GSA, “Transportation Policy Program” http://www.gsa.gov/graphics/ogp/transportation-factsheet.pdf (“Actual Federal spend on outbound transportation is double the budgeted amount. Federal spending on transportation has grown at double the rate of inflation since 2000.” FY2008 Object Class 22 (Transportation of Things) Reports $24.7 billion; Civilian agencies, Object Class 25.2 (Contract Services)- estimate of the transpor-tation component $12.0 billion; all agencies, inbound freight estimate “well over $100 billion”); PRTM Management Consultants, “Government wide Transportation Management Study: Summary of Findings and Recommendations” at 6-7, 19 (Jan. 2010) (includes the Defense Department, U.S. Postal Service and other civilian agencies; only about half of the agencies’ expenditures for outbound and intra-agency transportation services is reflected in the budget account for freight transportation, Object Class Code 22.0; “Most agencies procure requirements using FOB destination which obscures inbound transportation costs.”) http://www.gsa.gov/graphics/ogp/TransportationManagementStudy.pdf. Expenditures for third-party transportation services go beyond the types of vehicles counted in the federal fleet, extending to airplanes, rail and ships.74 USPS, “The Cost Structure of the Postal Service: Facts, Trends, and Policy Implications” at 17 (2011) http://tinyurl.com/3zw699c.75 USPS, “FY2011 Strategic Sustainability Performance Plan” at 45 (2011) http://tinyurl.com/6w9xds9; USPS, “FY2010 Strategic Sustainability Performance Plan”, supra, at 75.76 GSA, “Fiscal Year 2010 Federal Fleet Report”, supra; USPS, “FY2010 Strategic Sustainability Performance Plan”, supra, at 9, 43-44, 75.
B. Third-Party Transportation Service Providers
While the federal government spends far more on third-party transportation services than it does to operate its own fleets, good information on the scope and nature of these expenditures is difficult to obtain simply because federal budget categories fail to identify most spending on third-party transportation services. A FY2008 analysis performed for the GSA estimated that federal agencies directly spend about $40 billion to $50 billion per year on outbound and intra-agency transportation services. In addition, “well over $100 billion” is indirectly spent on freight transportation used by major federal product suppliers shipping goods to the government, such as paying suppliers to deliver their products to federal facilities using the suppliers’ vehicles or carriers chosen by the suppliers.73
According to the foregoing analysis for GSA, the agencies that spend the most on outbound and intra-agency third-party transportation services are the Department of Defense (57 percent of total identified spending), the USPS (31 percent), the Department of Agriculture (4 percent), the State Department (1 percent), the Department of Homeland Security (less than 1 percent), and NASA (less than 1 percent). A big slice of these expenditures is for petroleum fuel consumed in trucks. For example, in FY2010 the USPS spent $5.9 billion to procure third-party transportation services, 54 percent of which was for trucking.
In 2011, the USPS noted the adverse budget impacts of higher fuel costs associated with these trucking services: “Highway Transportation expenses in 2010 were $3.2 billion, an increase of $161 million or 5.3 percent from 2009. Though volume declined 4 percent, the increase was the result of higher fuel prices and increased contractual mileage driven.”74
In 2010 alone, third-party transportation services provided to the USPS consumed 553 million gallons of petroleum fuel at a cost of more than $1.3 billion. This sum is approximately the same as all fuel expenditures for all fleet vehicles directly owned or leased by the federal government. It also amounts to almost four times the volume of petroleum used by the USPS’s own fleet. Corresponding carbon dioxide emissions totaled approximately 5 million metric tons. The USPS estimates that the initiatives it is undertaking to achieve a 20 percent reduction in petroleum use by its third-party transportation services providers will produce annual cost savings ranging from $215 million to $350 million (equal to 4–6 percent of the agency’s overall budget for transportation services) while also cutting 0.7 to 1.2 million metric tons of carbon dioxide emissions (for a 14–24 percent reduction in overall emissions).75 In short, the savings achievable by targeting the USPS’s third-party providers dwarf the savings achievable by targeting the USPS’s own fleet (see Table 3).76
Table 3 USPS Savings from Reducing Petroleum Consumption by 20 Percent in its Transportation Services and Fleet
Annual Budget Savings ($ mil)
Annual Petroleum Fuel Savings
(mil. gallons)
Annual Emissions Savings (mil. metric tons carbon
dioxide equivalent)
Fleet 50 - 90 29 0.2 - 0.4
Transportation Services 215 - 350 111 0.7 - 1.2

24
The figures shown in the USPS’s Strategic Sustainability Performance Plan can be used to make a rough calculation of potential savings from a government-wide program to reduce the amount of petroleum used by third-party providers of transportation services to federal agencies more broadly. The USPS program addresses about 4 percent of total federal expenditures on such services (about $5.9 billion per year out of a total of $150 billion per year estimated by the GSA). Table 4 shows
an estimate of government-wide savings if one simply applies this multiplier to the USPS’s calculations.
These are only very rough estimates, of course, but they point to the large opportunity that exists to achieve cost savings and emissions reductions by using the federal government’s purchasing power to drive a reduction in petroleum consumption by third-party providers of federal transportation services.
Table 4 Estimates of Annual Government-Wide Savings from a 20 Percent Reduction in Petroleum Consumption by Third-Party Transportation Providers
Annual Estimate – Business As Usual USPS Estimate For All Federal Agencies
Spending on transportation services $5.9 billion $150 billion*
Petroleum used (gallons) 553 million 14 billion**
Carbon-dioxide equivalent emissions (million metric tons)
5 125**
Estimated annual impacts of a 20 percent reduction in petroleum consumption
USPS Estimate For All Federal Agencies
Saving in transportation services expenditures $215 - $350 million $7 billion**
Petroleum savings (gallons) 111 million 3 billion**
GHG reductions (million metric tons CO
2-equivalent) 0.7 – 1.2 20**
C. Using the Government’s Buying Power to Move Markets
The information presented in earlier sections indicates that a concerted effort to use the federal government’s buying power to impact vendor fuel choice and emissions would have a much greater impact on nationwide fuel and vehicle markets than clean energy initiatives limited to the federal fleets. As the chair of the CEQ pointed out in a 2010 speech about
“greening” the government’s supply chain, “The Federal government is the single largest energy consumer in the US economy and purchases more than $500 billion in goods and services every year. It is our responsibility to lead by example to improve efficiency, eliminate waste, and promote clean energy in our supply chain.”77
77 GSA, “Obama Administration Officials Unveil GreenGov Supply Chain Partnership with Industry to Create Cleaner, More Efficient Federal Supply Chain” (Nov. 10, 2010) (emphasis added) http://tinyurl.com/6lwb6ax.
*GSA estimate**Based on multiplying USPS estimate by 25 (ratio of estimated government wide spending on transportation services to the amount of USPS spending analyzed)
25
78 GSA, “Fiscal Year 2010 Federal Fleet Report”, supra, at Table 4-2; A. Krupnick, “Will Natural Gas Vehicles Be In Our Future?” at 7, 10 (2011) (Resources for the Future Issue Brief) http://tinyurl.com/cz3oqjr.79 D. Hendel, “Top U.S. Postal Service Suppliers for Fiscal Year 2011” http://tinyurl.com/7bqjfr3; AlterNet, “FedEx and Pepsi Are Top Defense Contractors? 5 Corporate Brands Making a Killing in America’s Wars” (Sept. 3, 2011) http://tinyurl.com/7kjutf9. FedEx total revenues in 2011 were $39.3 billion. “FedEx Annual Report 2011” at 8 http://tinyurl.com/6pds3kn.
Third-party transportation providers present a large leveraging opportunity for three main reasons:
• First, the volume of transportation services provided to the government is much larger than the volume of transportation services the government supplies using its own fleets. As noted above, total federal expenditures on outbound and intra-agency freight transportation services (roughly $50 billion in FY2008) are about 10 times the federal government’s expenditures on its own fleet vehicles (which totaled $4.9 billion in FY2010); indirect federal expenditures on freight transportation used by major product suppliers (roughly $100 billion in FY2008), meanwhile, totaled about 20 times the amount spent on federal fleet vehicles and fuel.
• Second, commercial trucks generally are used more intensively than federal fleet vehicles. Fleet trucks operated by federal agencies traveled on average 6,438 miles in 2010; by comparison, the average commercial fleet truck logs 27,372 miles per year and the average commercial long-haul, heavy-duty truck logs 70,000 miles per year.78
This means that more efficient, alternative fuel trucks in commercial fleets will yield greater reductions in petroleum use and emissions over the course of a year than equivalent alternative fuel trucks in the federal fleet.
Higher annual mileage also makes the switch to alternative fuel vehicles more cost-effective. This is because more intensive use means that fuel and operating cost savings more quickly offset the higher capital costs of the vehicle. Put another way, it is likely to be cheaper
for commercial operators to achieve a given alternative fuel use or petroleum reduction target than for a federal agency to achieve the same target within its own fleet of vehicles.
• Third, federal procurement of alternative fueled transportation services could influence carriers serving a wide range of other customers. For example, in recent years the USPS and the Department of Defense have each spent about $1.5 billion annually on transportation services provided by FedEx.79 As very large customers, these agencies have close relationships with, and considerable influence over FedEx’s operations. Many other suppliers of transportation services, as well as suppliers of goods with large transportation elements, have close relationships with federal agencies and also serve many other customers.
For all of these reasons, federal standards and initiatives targeted to third-party providers could have a large public multiplier effect–spurring changes in the transportation services used by millions of business and residential customers.
A concerted effort to use the federal government’s buying power to impact vendor fuel choice and emissions would have a much greater impact on nationwide fuel and vehicle markets than clean energy initiatives limited to the federal fleets.

26
Overall, the Clean Cities program aims to reduce U.S. petroleum use by 2.5 billion gallons per year by 2020.
The successes described below illustrate the types of opportunities and benefits that could be obtained by applying stricter standards and performance measurements to federal transportation procurements.
A. Federal Agencies’ Strategic Sustainability Performance Plans
Several federal agencies have already achieved substantial reductions in fleet petroleum consumption. Pursuant to Executive Order 13154, agencies filed initial Strategic Sustainability Performance Plans in 2010. Their second filings, submitted in June 2011, reported fleet-wide petroleum use in 2010 compared to 2005. The performance plans report progress in several areas:
• Performance relative to annual targets including, specifically, whether the agency is on track to (A) reduce petroleum use by 2 percent per year (for a total reduction of 20 percent by 2015 and 30 percent by 2020, compared to a 2005 baseline), (B) increase
80 DOE, “Vehicle Technologies Program: Clean Cities” at 1, 3 (Mar. 2012) http://tinyurl.com/cda5hsc.
Various government programs aimed at procurements of transportation services and fuels have been introduced to advance the goal of reducing petroleum consumption and expanding markets for clean, domestic, alternative fuels. The opportunity to leverage progress in these areas via federal procurement is not only large; it is feasible, cost-effective and proven.
For example, DOE’s Clean Cities initiative was established as a result of the Energy Policy Act
of 1992; it now works with nearly 100 coalitions in communities across the country. DOE has reported that this program achieved 600 million gallons of petroleum savings in 2010, in vehicles operated by state and local governments and private fleets.80 More than three-quarters of this reduction in petroleum use (77 percent) came from the increased use of alternative fuels and vehicles, chiefly natural gas (64 percent of alternative fuel use under the program), ethanol/E85 (15 percent), and biodiesel (11 percent).
4 Current Government Efforts to Buy Transport Services with Cheaper, Cleaner Domestic Fuels
Clean Cities 2010 Petroleum Savings by Technology Type
Breakdown of Petroleum Savings by Alternative Fuel Vehicle Type
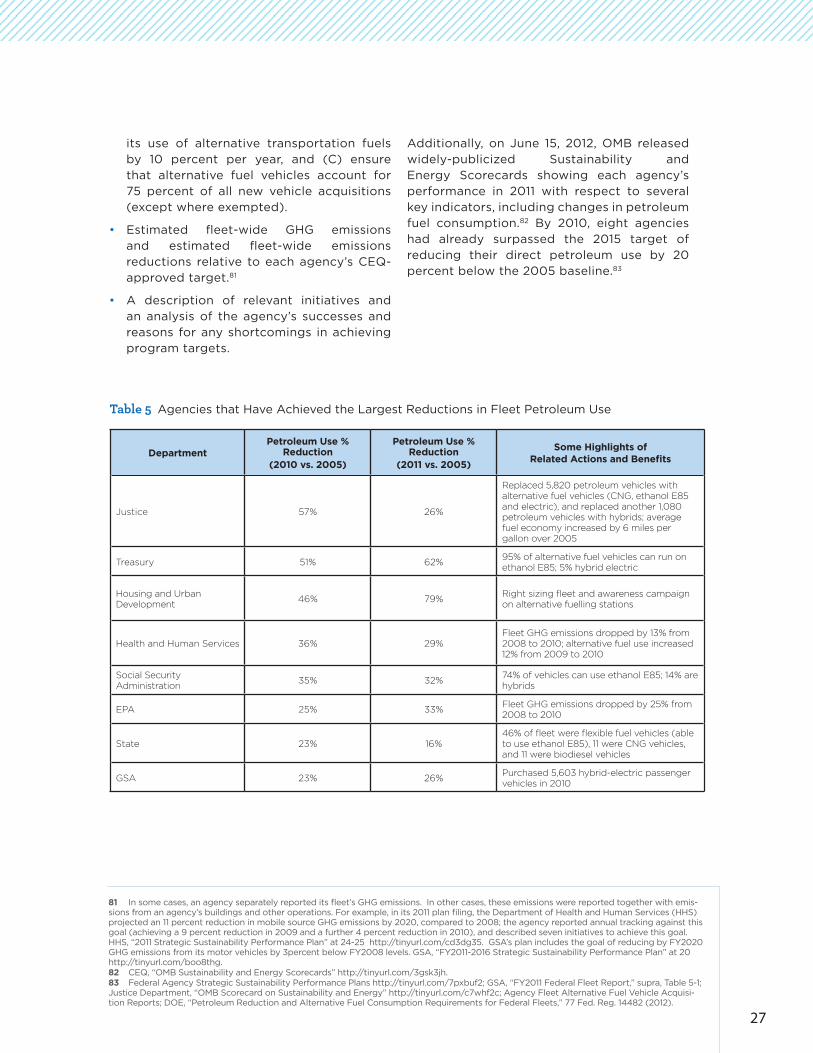
27
Table 5 Agencies that Have Achieved the Largest Reductions in Fleet Petroleum Use
DepartmentPetroleum Use %
Reduction (2010 vs. 2005)
Petroleum Use % Reduction
(2011 vs. 2005)
Some Highlights of Related Actions and Benefits
Justice 57% 26%
Replaced 5,820 petroleum vehicles with alternative fuel vehicles (CNG, ethanol E85 and electric), and replaced another 1,080 petroleum vehicles with hybrids; average fuel economy increased by 6 miles per gallon over 2005
Treasury 51% 62%95% of alternative fuel vehicles can run on ethanol E85; 5% hybrid electric
Housing and Urban Development
46% 79%Right sizing fleet and awareness campaign on alternative fuelling stations
Health and Human Services 36% 29%Fleet GHG emissions dropped by 13% from 2008 to 2010; alternative fuel use increased 12% from 2009 to 2010
Social Security Administration
35% 32%74% of vehicles can use ethanol E85; 14% are hybrids
EPA 25% 33%Fleet GHG emissions dropped by 25% from 2008 to 2010
State 23% 16%46% of fleet were flexible fuel vehicles (able to use ethanol E85), 11 were CNG vehicles, and 11 were biodiesel vehicles
GSA 23% 26%Purchased 5,603 hybrid-electric passenger vehicles in 2010
81 In some cases, an agency separately reported its fleet’s GHG emissions. In other cases, these emissions were reported together with emis-sions from an agency’s buildings and other operations. For example, in its 2011 plan filing, the Department of Health and Human Services (HHS) projected an 11 percent reduction in mobile source GHG emissions by 2020, compared to 2008; the agency reported annual tracking against this goal (achieving a 9 percent reduction in 2009 and a further 4 percent reduction in 2010), and described seven initiatives to achieve this goal. HHS, “2011 Strategic Sustainability Performance Plan” at 24-25 http://tinyurl.com/cd3dg35. GSA’s plan includes the goal of reducing by FY2020 GHG emissions from its motor vehicles by 3percent below FY2008 levels. GSA, “FY2011-2016 Strategic Sustainability Performance Plan” at 20 http://tinyurl.com/boo8thg.82 CEQ, “OMB Sustainability and Energy Scorecards” http://tinyurl.com/3gsk3jh.83 Federal Agency Strategic Sustainability Performance Plans http://tinyurl.com/7pxbuf2; GSA, “FY2011 Federal Fleet Report,” supra, Table 5-1; Justice Department, “OMB Scorecard on Sustainability and Energy” http://tinyurl.com/c7whf2c; Agency Fleet Alternative Fuel Vehicle Acquisi-tion Reports; DOE, “Petroleum Reduction and Alternative Fuel Consumption Requirements for Federal Fleets,” 77 Fed. Reg. 14482 (2012).
its use of alternative transportation fuels by 10 percent per year, and (C) ensure that alternative fuel vehicles account for 75 percent of all new vehicle acquisitions (except where exempted).
• Estimated fleet-wide GHG emissions and estimated fleet-wide emissions reductions relative to each agency’s CEQ-approved target.81
• A description of relevant initiatives and an analysis of the agency’s successes and reasons for any shortcomings in achieving program targets.
Additionally, on June 15, 2012, OMB released widely-publicized Sustainability and Energy Scorecards showing each agency’s performance in 2011 with respect to several key indicators, including changes in petroleum fuel consumption.82 By 2010, eight agencies had already surpassed the 2015 target of reducing their direct petroleum use by 20 percent below the 2005 baseline.83

28
84 CEQ, “Federal Agencies Release Annual Performance Updates on Energy and Sustainability Goals” (June 15, 2012) http://tinyurl.com/7d8epn7.85 GAO, “Opportunities to Reduce Potential Duplication in Government Programs, Save Tax Dollars, and Enhance Revenue” at 56 (2011) http://tinyurl.com/4gdkt7r.86 USPS, supra, at 2, 23, 42-47. USPS measured fuel use from its highway contract route transport, and estimated fuel use from its contract air, rail and ship transport as well as employee-owned vehicles. For its indirect emissions, USPS applied the Environmental Measurement and Monitoring System of the International Post Corporation (IPC) and had a domestic consulting firm review its methods. International Post Cor-poration, “Environmental Measurement and Monitoring System” http://tinyurl.com/7d2hb8s. USPS and other postal operators participating in IPC committed to a 20 percent reduction in their total carbon emissions by 2020, based on 2008 levels.87 USPS, supra, at 45.
Table 5 summarizes key agency-level achievements. A few observations drawn from the table are worth highlighting:
• Only two of the agencies with the largest fleets (see Table 1 for fleet size by agency) – Justice and State – exceeded the 20-percent reduction target for fleet petroleum use by 2010. Some of the other agencies with the largest fleets, however, are on track to achieve the 30-percent reduction target for 2020. These agencies received a “Green Light” on their OMB Scorecard for achieving a 12 percent or greater reduction in fleet petroleum use in 2011 compared to 2005. For example, by 2011, the Department of Defense and the Department of Interior had achieved reductions of 13 percent and 14 percent, respectively, relative to their 2005 baselines.
• As noted in the Introduction, alternative fuels comprised only 4 percent of the total fuel used by the federal fleet in 2011. Yet, the use of alternative fuels in federal fleet vehicles increased by 12 percent from 2009 to 2011, twice as much as the increase in petroleum consumption over the same two-year period. Several of the best-performing agencies made a significant switch to alternative fuels, especially the Social Security Administration (which met 31 percent of its fleet fuel needs using alternative fuels) and EPA (11 percent of fleet fuel needs met by alternative fuels). Some other agencies substantially increased their reliance on alternative fuels, including the Departments of Energy (22 percent alternative fuels) and Defense (9 percent alternative fuels).
• Standards, performance measurements, analyses and reports played an important role in keeping agencies on track and accountable. According to the Chair of the CEQ: “These scorecards provide agencies with a useful tool to keep focused on saving billions in energy costs over the next decade and help the Federal Government lead the Nation by example.”84 Several agencies highlighted their sustainability performance scorecards through their own press releases and websites.
Experience with Executive Order 13154 also highlights the importance of defining goals in terms of petroleum use and emissions rather than simply pushing agencies to purchase alternative fuel vehicles (AFVs). As the General Accountability Office (GAO) found in 2011:
Agencies are required to purchase AFVs, but this requirement may, in some cases, undermine the requirement to reduce petroleum consumption. Virtually every agency has succeeded in acquiring more AFVs, but there have been only modest reductions in petroleum use and modest increases in alternative fuel use, due to the lack of available alternative fuels. As previously stated, the lack of available alternative fuels results in agencies using petroleum to fuel AFVs. In areas where alternative fuels are not available, purchasing more fuel efficient non-AFVs could reduce petroleum consumption more than purchasing AFVs.85
Of course, as refueling stations for alternative fuels become more prevalent, agencies can make better use of the AFVs they already own to achieve actual petroleum reductions.
B. Progress at the U.S. Postal Service
The USPS’s Strategic Sustainability Performance Plan covered petroleum consumption and emissions from all its contracted mail transportation vehicles, including trucks on highways, employee-owned vehicles used on rural delivery routes, planes, ships, and trains.86 The plan revealed that transportation services accounted for the largest share of the USPS’s total (direct and indirect) petroleum consumption and GHG emissions. As noted previously (see discussion in section 3.B), contracts with third-party transportation providers accounted for 80 percent of the USPS’s overall (direct and indirect) petroleum consumption and 40 percent of its overall (direct and indirect) GHG emissions.87
This information helped the USPS to develop a sustainability strategy that focused on contracted transportation services as well as its own direct operations. As a target for these third-party
29
88 USPS, “FY2011 Strategic Sustainability Performance Plan”, supra, at 42-43; USPS, “Sustainability: Leaner, Greener, Faster, Smarter – 2010 Report” at 27, 29 http://tinyurl.com/7sqg3fn; USPS, “Innovation & Sustainability” (“Suppliers who focus on innovation and sustainability have a competitive ad-vantage in today’s supply market.”) http://tinyurl.com/7pl52m4; USPS, “Supplying Principles and Practices” Sec. 2-26 (Dec. 12, 2011) (roles of non-price factors in defining best value and bid evaluation) http://tinyurl.com/7hffobt; USPS, “Strategic Sustainability Performance Plan Overview” at 9 (July 2010) http://tinyurl.com/74lrzsd.89 USPS, “FY2011 Strategic Sustainability Performance Plan”, supra, at 68 (“The size of the USPS supplier network and our relative purchasing power allows us to influence our suppliers to improve the sustainability performance of the materials, products, and services they provide to us. This improves the Postal Service’s sustainable acquisition efforts, as well as our ability to offer more sustainable products and services to our customers.”).90 DoD, ”FY2011 Strategic Sustainability Performance Plan” at I-15, I-17, II-64 – II-70 http://tinyurl.com/7pxbuf2. DoD’s Strategic Sustainability Perfor-mance Plan filed in 2011 reflected the absence of relevant targets, measures, or initiatives for suppliers moving its freight. The agency noted little prog-ress in making purchases of transportation services energy efficient and environmentally preferable: (a) the data systems necessary to implement this provision of Executive Order 13514 were not developed; (b) the agency was working on “developing a methodology to better integrate sustainability thinking into the DoD acquisition process”; (c) DoD expected to add measures of supply chain emissions only as federal guidance and data collection methods are improved; and (d) DoD was engaged in on-going review of a green procurement program strategy.91 EPA, “SmartWay Program Highlights” http://tinyurl.com/6up63e2; EPA, “SmartWay Transport Partnership” http://tinyurl.com/7z2d58y; EPA, “General SmartWay Frequently Asked Questions” http://tinyurl.com/753f8oo (answer to “Why is the SmartWay Transport Partnership important?”).
services, the agency committed to achieve a 20-percent reduction (compared to 2008 levels) in petroleum use and GHG emissions by 2020. Based on information through 2010, the USPS has reported a 5 percent reduction in petroleum use and a 3 percent reduction in GHG emissions from contracted transportation services.
The USPS has collaborated with suppliers in several key areas, including reducing the number of routes and total miles driven, moving mail from air to ground transportation (trucks are more fuel efficient and have lower GHG emissions per ton-mile than planes), and engaging drivers to adopt fuel-efficiency behaviors (limiting speed, idling, etc.). The USPS has also stated that it intends to take several additional steps:88
• Encourage suppliers to use more efficient vehicles
• Use benchmarks to compare transportation suppliers on the basis of fuel efficiency
• Focus on doing business with suppliers who are committed to improving their sustainability performance
• Require all suppliers with current contract commitments of more than $500,000 to provide sustainability data to USPS by FY2015
• Include standard sustainability clauses in all new contracts by FY2015
• Present awards to suppliers who demonstrate a commitment to sustainability
To implement these changes, the USPS is increasing its collaboration with transportation carriers as well as with companies that ship products to the USPS.89 Similar opportunities exist at DoD, which like the USPS, spends far more on third-party transportation services than any other federal agency. As DoD observed in its 2011 Strategic Sustainability Performance Plan: “Procuring goods and services that are sustainable presents
an enormous opportunity for the Department to make better decisions on matters that often have long lasting environmental impacts and improved operational capabilities.90
C. EPA’s SmartWay Transport Partners Program
EPA’s SmartWay program aims to create incentives to improve supply-chain fuel efficiency and thereby reduce transportation-related emissions. SmartWay Transport Partners agree to assess their freight operations, calculate their fuel consumption and emissions, and track these measures annually. SmartWay’s accounting tools and methods are used by more than 2,900 U.S. corporations, including almost all of the large truck carriers, all class 1 rail companies, and many Fortune 500 companies.
According to EPA, the SmartWay program has already achieved considerable benefits in terms of reduced petroleum consumption, costs and emissions:91
• Since 2004, SmartWay partners have saved 50 million barrels of oil. This is equivalent to taking over 3 million cars off the road for an entire year.
• SmartWay is helping U.S. businesses to slash fuel costs, saving $6.1 billion to date.
• In 2012, the Partnership aims to cut CO2
emissions by 33 to 66 million metric tons, and nitrogen oxides emissions by up to 200,000 tons per year.
Among other components of this program, carriers, logistics companies and freight shippers voluntarily track the types of fuel used by each class of vehicles they own, benchmark the emissions generated by their current operations, identify technologies and strategies to reduce their carbon emissions, and project future improvements. Box 7 describes some of the detailed information that SmartWay partners have collected and reported regarding their alternative fuel vehicles and fuel usage.
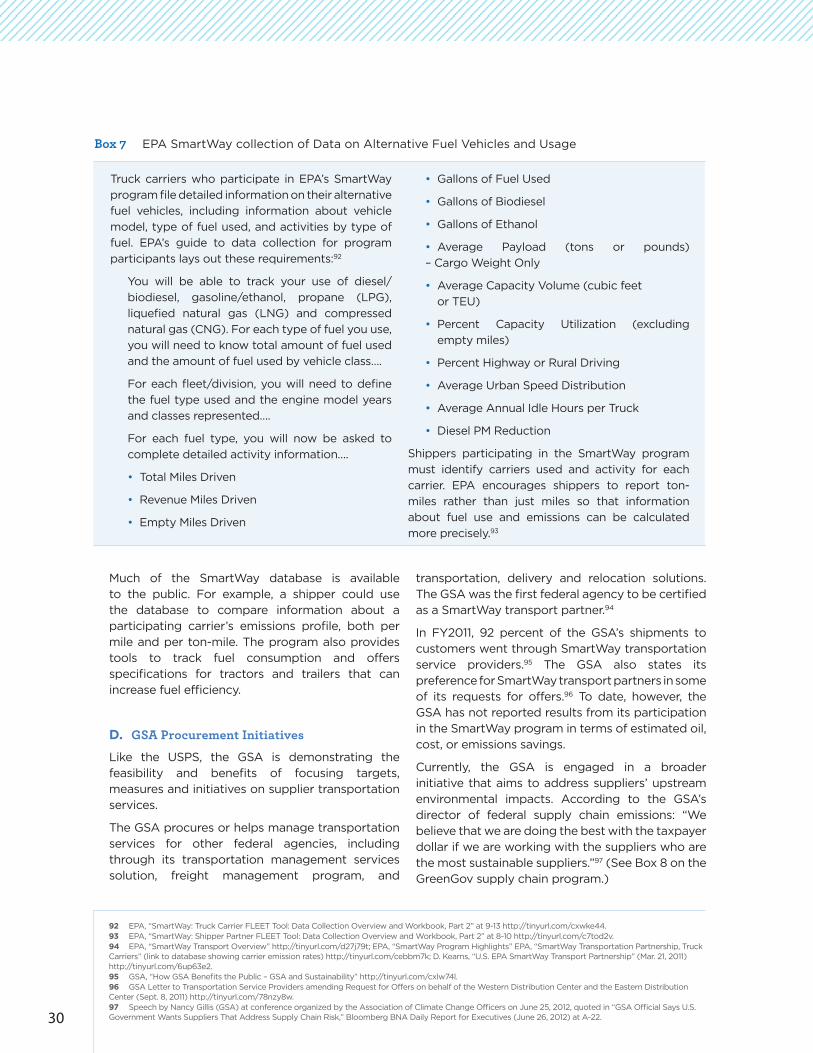
30
Truck carriers who participate in EPA’s SmartWay
program file detailed information on their alternative
fuel vehicles, including information about vehicle
model, type of fuel used, and activities by type of
fuel. EPA’s guide to data collection for program
participants lays out these requirements:92
You will be able to track your use of diesel/
biodiesel, gasoline/ethanol, propane (LPG),
liquefied natural gas (LNG) and compressed
natural gas (CNG). For each type of fuel you use,
you will need to know total amount of fuel used
and the amount of fuel used by vehicle class….
For each fleet/division, you will need to define
the fuel type used and the engine model years
and classes represented….
For each fuel type, you will now be asked to
complete detailed activity information….
• Total Miles Driven
• Revenue Miles Driven
• Empty Miles Driven
• Gallons of Fuel Used
• Gallons of Biodiesel
• Gallons of Ethanol
• Average Payload (tons or pounds)
– Cargo Weight Only
• Average Capacity Volume (cubic feet
or TEU)
• Percent Capacity Utilization (excluding
empty miles)
• Percent Highway or Rural Driving
• Average Urban Speed Distribution
• Average Annual Idle Hours per Truck
• Diesel PM Reduction
Shippers participating in the SmartWay program
must identify carriers used and activity for each
carrier. EPA encourages shippers to report ton-
miles rather than just miles so that information
about fuel use and emissions can be calculated
more precisely.93
Box 7 EPA SmartWay collection of Data on Alternative Fuel Vehicles and Usage
92 EPA, “SmartWay: Truck Carrier FLEET Tool: Data Collection Overview and Workbook, Part 2” at 9-13 http://tinyurl.com/cxwke44. 93 EPA, “SmartWay: Shipper Partner FLEET Tool: Data Collection Overview and Workbook, Part 2” at 8-10 http://tinyurl.com/c7tod2v.94 EPA, “SmartWay Transport Overview” http://tinyurl.com/d27j79t; EPA, “SmartWay Program Highlights” EPA, “SmartWay Transportation Partnership, Truck Carriers” (link to database showing carrier emission rates) http://tinyurl.com/cebbm7k; D. Kearns, “U.S. EPA SmartWay Transport Partnership” (Mar. 21, 2011) http://tinyurl.com/6up63e2. 95 GSA, “How GSA Benefits the Public – GSA and Sustainability” http://tinyurl.com/cxlw74l. 96 GSA Letter to Transportation Service Providers amending Request for Offers on behalf of the Western Distribution Center and the Eastern Distribution Center (Sept. 8, 2011) http://tinyurl.com/78nzy8w. 97 Speech by Nancy Gillis (GSA) at conference organized by the Association of Climate Change Officers on June 25, 2012, quoted in “GSA Official Says U.S. Government Wants Suppliers That Address Supply Chain Risk,” Bloomberg BNA Daily Report for Executives (June 26, 2012) at A-22.
Much of the SmartWay database is available to the public. For example, a shipper could use the database to compare information about a participating carrier’s emissions profile, both per mile and per ton-mile. The program also provides tools to track fuel consumption and offers specifications for tractors and trailers that can increase fuel efficiency.
D. GSA Procurement Initiatives
Like the USPS, the GSA is demonstrating the feasibility and benefits of focusing targets, measures and initiatives on supplier transportation services.
The GSA procures or helps manage transportation services for other federal agencies, including through its transportation management services solution, freight management program, and
transportation, delivery and relocation solutions. The GSA was the first federal agency to be certified as a SmartWay transport partner.94
In FY2011, 92 percent of the GSA’s shipments to customers went through SmartWay transportation service providers.95 The GSA also states its preference for SmartWay transport partners in some of its requests for offers.96 To date, however, the GSA has not reported results from its participation in the SmartWay program in terms of estimated oil, cost, or emissions savings.
Currently, the GSA is engaged in a broader initiative that aims to address suppliers’ upstream environmental impacts. According to the GSA’s director of federal supply chain emissions: “We believe that we are doing the best with the taxpayer dollar if we are working with the suppliers who are the most sustainable suppliers.”97 (See Box 8 on the GreenGov supply chain program.)
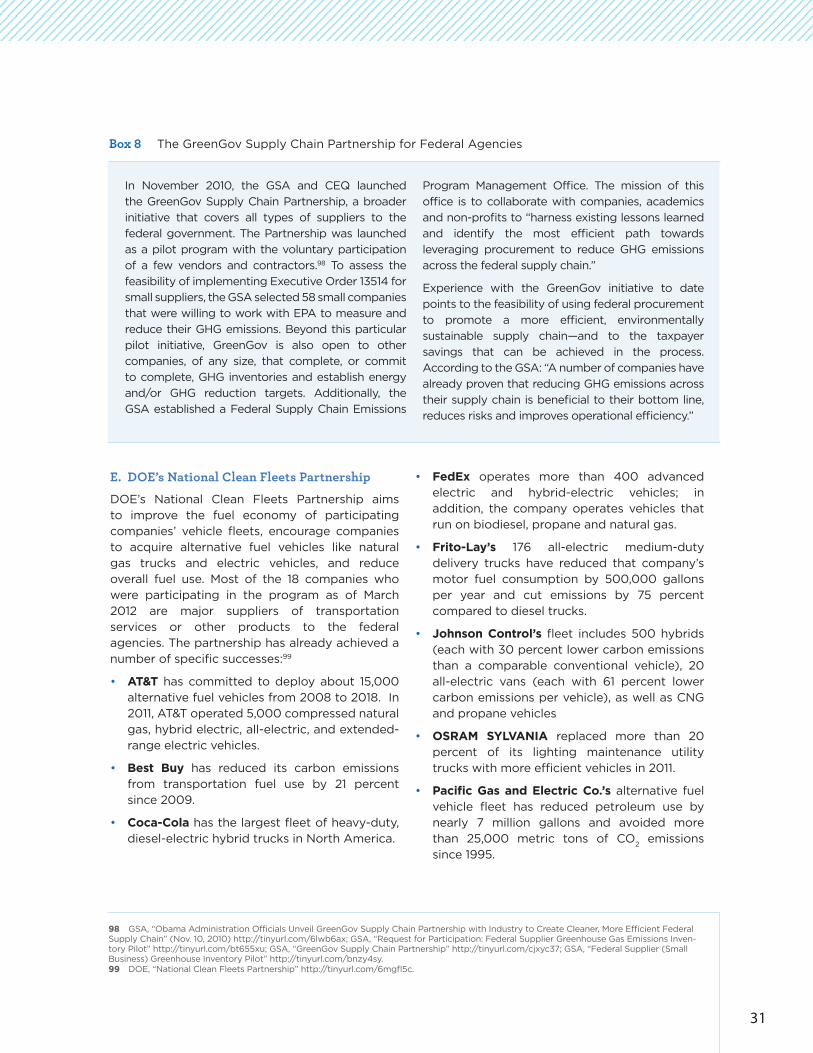
31
98 GSA, “Obama Administration Officials Unveil GreenGov Supply Chain Partnership with Industry to Create Cleaner, More Efficient Federal Supply Chain” (Nov. 10, 2010) http://tinyurl.com/6lwb6ax; GSA, “Request for Participation: Federal Supplier Greenhouse Gas Emissions Inven-tory Pilot” http://tinyurl.com/bt655xu; GSA, “GreenGov Supply Chain Partnership” http://tinyurl.com/cjxyc37; GSA, “Federal Supplier (Small Business) Greenhouse Inventory Pilot” http://tinyurl.com/bnzy4sy.99 DOE, “National Clean Fleets Partnership” http://tinyurl.com/6mgfl5c.
In November 2010, the GSA and CEQ launched
the GreenGov Supply Chain Partnership, a broader
initiative that covers all types of suppliers to the
federal government. The Partnership was launched
as a pilot program with the voluntary participation
of a few vendors and contractors.98 To assess the
feasibility of implementing Executive Order 13514 for
small suppliers, the GSA selected 58 small companies
that were willing to work with EPA to measure and
reduce their GHG emissions. Beyond this particular
pilot initiative, GreenGov is also open to other
companies, of any size, that complete, or commit
to complete, GHG inventories and establish energy
and/or GHG reduction targets. Additionally, the
GSA established a Federal Supply Chain Emissions
Program Management Office. The mission of this
office is to collaborate with companies, academics
and non-profits to “harness existing lessons learned
and identify the most efficient path towards
leveraging procurement to reduce GHG emissions
across the federal supply chain.”
Experience with the GreenGov initiative to date
points to the feasibility of using federal procurement
to promote a more efficient, environmentally
sustainable supply chain—and to the taxpayer
savings that can be achieved in the process.
According to the GSA: “A number of companies have
already proven that reducing GHG emissions across
their supply chain is beneficial to their bottom line,
reduces risks and improves operational efficiency.”
Box 8 The GreenGov Supply Chain Partnership for Federal Agencies
E. DOE’s National Clean Fleets Partnership
DOE’s National Clean Fleets Partnership aims to improve the fuel economy of participating companies’ vehicle fleets, encourage companies to acquire alternative fuel vehicles like natural gas trucks and electric vehicles, and reduce overall fuel use. Most of the 18 companies who were participating in the program as of March 2012 are major suppliers of transportation services or other products to the federal agencies. The partnership has already achieved a number of specific successes:99
• AT&T has committed to deploy about 15,000 alternative fuel vehicles from 2008 to 2018. In 2011, AT&T operated 5,000 compressed natural gas, hybrid electric, all-electric, and extended-range electric vehicles.
• Best Buy has reduced its carbon emissions from transportation fuel use by 21 percent since 2009.
• Coca-Cola has the largest fleet of heavy-duty, diesel-electric hybrid trucks in North America.
• FedEx operates more than 400 advanced electric and hybrid-electric vehicles; in addition, the company operates vehicles that run on biodiesel, propane and natural gas.
• Frito-Lay’s 176 all-electric medium-duty delivery trucks have reduced that company’s motor fuel consumption by 500,000 gallons per year and cut emissions by 75 percent compared to diesel trucks.
• Johnson Control’s fleet includes 500 hybrids (each with 30 percent lower carbon emissions than a comparable conventional vehicle), 20 all-electric vans (each with 61 percent lower carbon emissions per vehicle), as well as CNG and propane vehicles
• OSRAM SYLVANIA replaced more than 20 percent of its lighting maintenance utility trucks with more efficient vehicles in 2011.
• Pacific Gas and Electric Co.’s alternative fuel vehicle fleet has reduced petroleum use by nearly 7 million gallons and avoided more than 25,000 metric tons of CO
2 emissions
since 1995.

32
99 See generally Carbon Disclosure Project, “CDP Supply Chain Report 2012” http://tinyurl.com/bo2up86; Greenhouse Gas Protocol, supra.100 “Sustainability Is Brand-Enhancing, UPS Executive Says” Daily Report for Executives (May 29, 2012 ) (interview with Scott Wicker).101 Kraft Foods, “Corporate Responsibility Expectations for Direct Suppliers” http://tinyurl.com/c4qswb5; “Kraft Roods Pursues Sustainability with Steps ‘Big & Small’” (Nov. 8, 2010) http://tinyurl.com/c7fs6sm; Carbon Disclosure Project, supra.
• Ryder expects to displace more than 1.5 million gallons of diesel fuel use per year by operating heavy-duty vehicles on compressed or liquefied natural gas.
• Schwan’s Home Service uses propane fuel in about 75 percent of its 6,000 trucks
• Staples has increased the fuel efficiency of its fleet by more than 20 percent since 2007, saving nearly 3 million gallons of fuel annually.
• ThyssenKrupp Elevator reduced petroleum use by its fleet of 3,200 vehicles 20 percent between 2009 and 2011.
• UPS has more than 2,500 CNG, LNG, propane, electric, and hybrid-electric vehicles.
• Veolia Environmental Services operates four compressed natural gas fueling stations, and more than 100 natural gas refuse-collection and support vehicles.
• Verizon operated more than 2,500 alternative fuel vehicles in 2011; the company aims to have 15 percent of its fleet running on alternative fuels by 2015.
Many leading corporations have reduced
product transportation expenses, petroleum
consumption, and emissions by managing their
purchases of transportation services from vendors
and contractors.100 In May 2012, UPS’s Chief
Sustainability Officer commented on the demands
from large shipping customers:101
About five or six years ago, we began to get a lot of requests from our larger customers to quantify the carbon emissions of the goods that we move for them. And that led us to developing a carbon calculator. [It tracks] what type of vehicle [a package] goes on, when it goes on a train, when it goes on a plane, and we can very accurately calculate the carbon associated with it….
Years ago, we realized that we had to really understand and calculate our impacts, both to the environment and to society. We have a motto that we go by here and it’s “manage, measure, and mitigate,” so we’re very into measuring what we do. And once you measure your impacts, you have the ability to manage it better, and you have the ability to mitigate it or lessen your impacts. That’s why we’re into it and why I think a lot of companies are getting into it. Their customers are demanding it.
Large shipping customers have used a variety of
approaches to address sustainability goals with
third-party transportation services providers:
For Example, Kraft Foods requires each direct
supplier to commit to “work to continuously
improve its environmental performance by setting
and then working toward quantifiable goals that
reduce the environmental impact of its activities.”
Kraft has encouraged its carriers to join SmartWay
and it has recruited new carriers that are SmartWay
Transport Partners. In 2010, the company raised
the portion of its freight transported by SmartWay-
certified carriers from 70 percent to 80 percent.
In 2009, Kraft’s transportation/distribution
sustainability efforts eliminated about 4.5 million
truck miles, saving about 750,000 gallons of
diesel fuel and avoiding over 8,000 tons of CO2
emissions. Kraft has estimated the GHG emissions
of its transportation and logistics suppliers as part
of its complete carbon footprint inventory.102
Another example comes from IBM, which since
2009 has used only SmartWay logistics providers
to ship goods within the U.S. and from the U.S. to
Canada and Mexico. The company’s intent is to
improve fuel efficiency and reduce GHG emissions.
Box 9 Private Sector Initiatives that Promote Sustainable Transportation Services
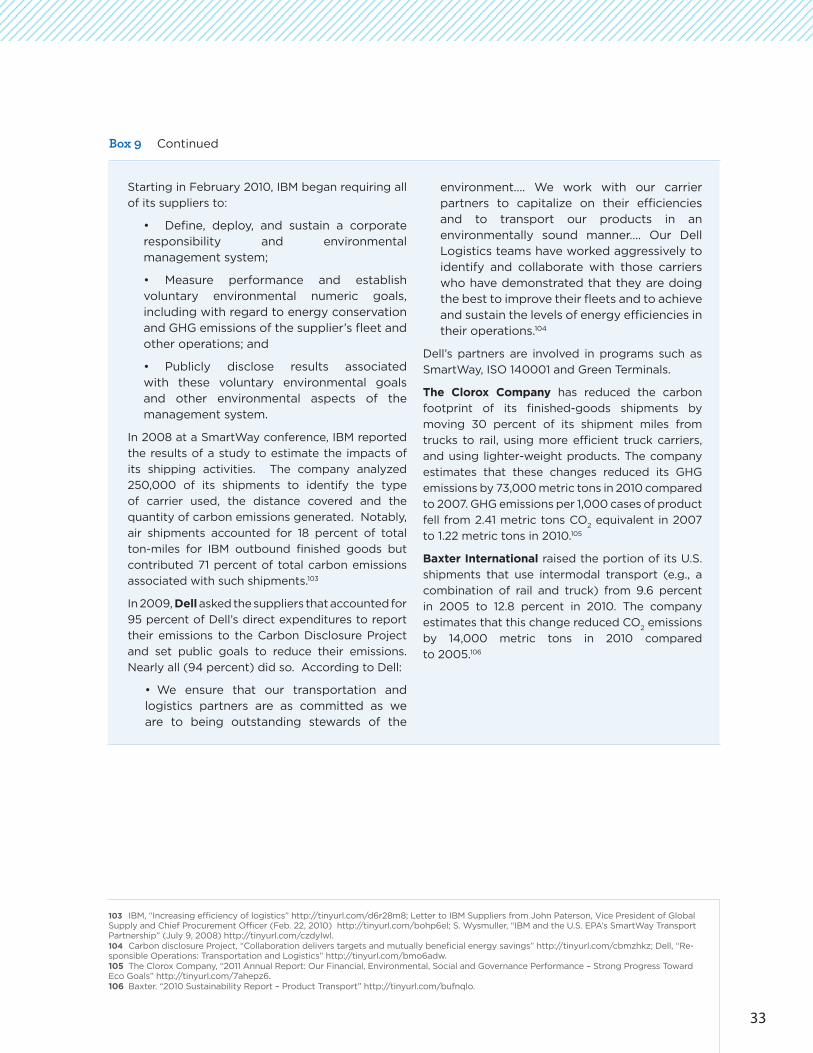
33
103 IBM, “Increasing efficiency of logistics” http://tinyurl.com/d6r28m8; Letter to IBM Suppliers from John Paterson, Vice President of Global Supply and Chief Procurement Officer (Feb. 22, 2010) http://tinyurl.com/bohp6el; S. Wysmuller, “IBM and the U.S. EPA’s SmartWay Transport Partnership” (July 9, 2008) http://tinyurl.com/czdylwl.104 Carbon disclosure Project, “Collaboration delivers targets and mutually beneficial energy savings” http://tinyurl.com/cbmzhkz; Dell, “Re-sponsible Operations: Transportation and Logistics” http://tinyurl.com/bmo6adw.105 The Clorox Company, “2011 Annual Report: Our Financial, Environmental, Social and Governance Performance – Strong Progress Toward Eco Goals” http://tinyurl.com/7ahepz6.106 Baxter. “2010 Sustainability Report – Product Transport” http://tinyurl.com/bufnqlo.
Box 9 Continued
Starting in February 2010, IBM began requiring all
of its suppliers to:
• Define, deploy, and sustain a corporate responsibility and environmental management system;
• Measure performance and establish voluntary environmental numeric goals, including with regard to energy conservation and GHG emissions of the supplier’s fleet and other operations; and
• Publicly disclose results associated with these voluntary environmental goals and other environmental aspects of the management system.
In 2008 at a SmartWay conference, IBM reported
the results of a study to estimate the impacts of
its shipping activities. The company analyzed
250,000 of its shipments to identify the type
of carrier used, the distance covered and the
quantity of carbon emissions generated. Notably,
air shipments accounted for 18 percent of total
ton-miles for IBM outbound finished goods but
contributed 71 percent of total carbon emissions
associated with such shipments.103
In 2009, Dell asked the suppliers that accounted for
95 percent of Dell’s direct expenditures to report
their emissions to the Carbon Disclosure Project
and set public goals to reduce their emissions.
Nearly all (94 percent) did so. According to Dell:
• We ensure that our transportation and logistics partners are as committed as we are to being outstanding stewards of the
environment…. We work with our carrier partners to capitalize on their efficiencies and to transport our products in an environmentally sound manner…. Our Dell Logistics teams have worked aggressively to identify and collaborate with those carriers who have demonstrated that they are doing the best to improve their fleets and to achieve and sustain the levels of energy efficiencies in their operations.104
Dell’s partners are involved in programs such as
SmartWay, ISO 140001 and Green Terminals.
The Clorox Company has reduced the carbon
footprint of its finished-goods shipments by
moving 30 percent of its shipment miles from
trucks to rail, using more efficient truck carriers,
and using lighter-weight products. The company
estimates that these changes reduced its GHG
emissions by 73,000 metric tons in 2010 compared
to 2007. GHG emissions per 1,000 cases of product
fell from 2.41 metric tons CO2 equivalent in 2007
to 1.22 metric tons in 2010.105
Baxter International raised the portion of its U.S.
shipments that use intermodal transport (e.g., a
combination of rail and truck) from 9.6 percent
in 2005 to 12.8 percent in 2010. The company
estimates that this change reduced CO2 emissions
by 14,000 metric tons in 2010 compared
to 2005.106
34
F. State and Local Government Purchasing Programs
State and local governments own more than 4.1 million fleet vehicles (cars and trucks).107 Many governments have implemented purchasing programs that award preferences to cleaner vehicles. In some cases, these preferences also extend to companies that supply state and local governments or to other private fleets. Purchasing programs have been established through legislation, executive orders, agency rules, grant programs and other actions. As noted previously, the DOE’s Clean Cities program works with state and local governments as well as with private fleet owners in nearly 100 communities nationwide, and has achieved significant petroleum savings.
States have sometimes joined forces to reduce petroleum consumption. In April 2012, for example, 13 states announced a joint effort to procure natural gas vehicles for their state fleets. To foster a competitive choice of vehicles, the governors of these states sent a letter to the CEOs of 19 auto companies encouraging them to manufacture natural gas vehicles: “[W]e are committed to exploring ways to aggregate our annual state fleet vehicle procurements to provide an incentive to manufacture affordable, functional natural gas vehicles.”108
Experience in four states – California, New York, North Carolina and Washington – helps to illustrate the benefits of such purchasing initiatives.
i. California
On March 23, 2012, California Governor Jerry Brown signed an executive order to accelerate the commercialization of zero-emission vehicles. Among other steps, the executive order calls for state agencies to ensure that zero-emission vehicles account for at least 10 percent of fleet purchases of light-duty vehicles by 2015 and at least 25 percent by
2020. Governor Brown has also ordered the California Air Resources Board, the California Energy Commission, the Public Utilities Commission and other relevant agencies to establish benchmarks to promote the widespread use of zero-emission vehicles for freight transport by 2020.109
Pursuant to legislation adopted in 2007, the California State and Consumer Services Agency must develop, implement, and submit to the California Legislature and governor a plan to increase the state’s use of alternative fuels, synthetic lubricants, and fuel-efficient fleet vehicles. The plan must achieve a 10-percent reduction in petroleum consumption by the state’s vehicle fleet by January 1, 2012, and a 20-percent reduction by January 1, 2020 (these reductions are relative to a 2003 baseline). Vehicles owned or leased by the state that are capable of operating on alternative fuel must operate on alternative fuels unless such fuels are unavailable. In addition, California has cut the size of its agencies’ fleets and replaced older vehicles with newer, more fuel-efficient models.110
Every city, county, and special district, including school and community college districts, may require that 75 percent of the passenger cars and/or light-duty trucks it acquires must be energy efficient. Qualifying vehicles include hybrid electric vehicles and alternative fuel vehicles that meet California’s advanced technology, partial zero emission vehicle standards. Fuel economy and life cycle factors may also be considered when evaluating vehicle procurement contracts.111
Several cities in California’s Bay Area Air Quality Management District have taken steps to reduce petroleum use and promote alternatives. For example, the City of San Jose had 954 vehicles (40 percent of its fleet) running on alternative fuels in 2011 (the city intends to increase this number to 100 percent
107 Bay Area Climate Collaborative, “Bay Area Impact” http://tinyurl.com/bsnybwn. 108 Colorado Governor’s Energy Office, “Gov. Hickenlooper, 12 other governors send letter to promote natural gas vehicle development” (Apr. 27, 2012) (participating states are Colorado, Kentucky, Louisiana, Maine, Mississippi, New Mexico, Ohio, Oklahoma, Pennsylvania, Texas, Utah, West Virginia and Wyoming) http://tinyurl.com/yjkcohy. 109 Office of Governor Edmund G. Brown, “Executive Order B-16-2012” (Mar. 23, 2012) http://tinyurl.com/cjkpth7; Government Fleet, “California Sets Goals to Add EVs in Significant Numbers to State Fleet” (Apr. 18, 2012) http://tinyurl.com/7e5jrgu. 110 DOE, “California: Vehicle Acquisition and Petroleum Reduction Requirements” (citing Executive Order S-14-09 and California Public Resources Code 25722.5, 25722.6 and 25722.8) http://tinyurl.com/8aa8fug; California DGS, “California Action Plan for Reducing or Displacing the Consump-tion of Petroleum Products by the State Fleet and First Annual Progress Report” (Aug. 13, 2010) http://tinyurl.com/6rg8s39; An analysis of California’s program in 2011 emphasized the need to track progress annually and hold agencies accountable for their initiatives and deficiencies: “While many planned and existing policies are steering the state in the right direction, no one is tracking progress and the relevant state agencies generally do not include petroleum reduction in their funding and regulatory decision-making process.” The California Secure Transportation Energy Partnership, “California Action Plan 2.0 for Transportation Energy Security” at 24 (2011) http://tinyurl.com/796j9aq. 111 DOE, “California: Fleet Vehicle Procurement Requirements” (citing California Public Resources Code 25725-26) http://tinyurl.com/875fyf3.

35
112 City of San Jose, “Green Vision 2011 Annual Report” at 53-58 http://tinyurl.com/chzf6xt; The Sustainable Earth Initiative and The San Francisco Department of the Environment, “San Francisco Bay Area Clean Fleets Toolkit: A Guide for On-Road Commercial Fleets” at 10 (2009) http://tinyurl.com/d7e3os8; J. Addison, “San Francisco Doubles Taxi Fleet while Cutting Gasoline Use in Half” (Feb. 14, 2012) http://tinyurl.com/7p9deow; Bay Area Climate Collaborative, “Bay Area Impact” http://tinyurl.com/cyze364; SF Environment, “SF Diesel Fleet now 100% Biodiesel” (Nov. 30, 2007) http://tinyurl.com/7orfzu8; Alameda County, “Sustainability: Our Fleet” http://tinyurl.com/7t5nee5. 113 DOE, “California: Fleet Emissions Reduction Requirements – South Coast” (citing South Coast Air Quality Management District (SCAQMD) Rules 1186.1, 1191-96) http://tinyurl.com/6tqrp32; DOE, “South Coast Air Quality Management District” (citing SCAQMD Rule 1194) http://tinyurl.com/7u5ljaq.114 “Port of Los Angeles Clean Truck Program, Effective Jan. 1, 2012” http://tinyurl.com/6ng9mxl; Port of Long Beach, “Clean Trucks: Port Reduces Truck Pollution by 90%” http://tinyurl.com/64ls3j.
by 2022); San Jose also cut its annual gasoline consumption and associated GHG emissions by 13 percent between 2007 and 2011. The goal is to achieve a 43 percent reduction in gasoline use and a 29 percent cut in GHG emissions by 2022, compared to 2007. In San Francisco, as the result of a program adopted by the city’s Taxi Commission, 92 percent of taxis are hybrid or CNG-fueled vehicles. This translates to 2.9 million gallons of gasoline saved annually and 35,000 tons of GHG emissions avoided. In 2007, San Francisco also finished converting all of its 1,500 diesel vehicles to run on biodiesel (B20). This step is displacing about 1.2 million gallons of diesel use annually. Since 2010, local governments in the Bay Area have deployed 90 electric vehicles for use in a broad range of functions, along with the necessary recharging
infrastructure to operate these vehicles. Finally, Alameda County saves more than $200,000 in fuel costs annually from its 140 gas/electric hybrids and eight all-electric vans; it also runs two trucks and two sedans on waste vegetable oil.112
The South Coast Air Quality Management District requires government agencies and private contractors under contract with public entities to purchase lower emission and alternative fuel vehicles. This requirement applies to transit bus, school bus, refuse hauler, and other fleets of 15 or more vehicles. Additionally, public and private fleet operators that provide passenger pickup service at commercial airports in the district must acquire cleaner burning or alternative fueled vehicles.113
Box 10 Ports of Los Angeles and Long Beach Clean Truck Program
The ports of Los Angeles and Long Beach (the
nation’s two largest container ports—together
they are served by more than 20,000 drayage
trucks) implemented a Clean Truck Program
(CTP) on October 1, 2008. Under this coordinated
program, emissions for trucks serving these ports
were required to be 80–90 percent lower than the
emissions average in 2007. The program started
by banning trucks with model years prior to 1989;
extended the ban to all pre-1994 trucks as of 2010,
and required that trucks meet EPA’s 2007 heavy
duty truck emissions standards by 2012. These
actions have produced strong results in terms of
purchases of alternative fuel vehicles and reduced
emissions:114
In 2008, the Port of Los Angeles provided $44 million in payments to licensed motor carriers in order to incentivize their purchase of 2,200 Clean Trucks. Another $12.5 million was approved in May 2008 for incentive payouts on the purchase of 500 natural gas fueled trucks. These incentives, coupled
with the effect of the truck ban schedule and associated fees, have led to over $1 billion in private investment toward the purchase or lease of approximately 7,000 more Clean Trucks….
Effective January 1, 2012, [the total] 9,800 Clean Trucks, including more than 880 natural gas vehicles, are making all of the total containerized cargo gate moves at Port of Los Angeles terminals. Operation of 9,800 Clean Trucks will reduce more than 40 tons of diesel particulate matter emitted by trucks per year at the Port….
[The California Air Resources Board] estimated that before the [Clean Truck Program], Southern Californians paid between $100 million and $590 million annually in health impact costs related to drayage truck pollution…. By its 80 percent reduction in drayage truck pollution, the CTP has also helped to reduce these health impact costs.

36
115 DOE, “New York: Alternative Fuel Vehicle (AFV) Acquisition Requirements” (citing Executive Orders 42 (2005), 9 (2008) and 111 (2001)) http://tinyurl.com/d5odbxk; New York State Office of General Services and Department of Environmental Conservation, “Greening New York State: Fiscal Year 2008-2009” 22 (2009) http://tinyurl.com/6tnsjz6.116 DOE, “New York: Alternative Fuel Bus and Infrastructure Funding” http://www.afdc.energy.gov/afdc/laws/law/NY/5318; Government Fleet, “New York Funds Alternative Fuel Vehicles for Private Fleets” (June 18, 2008) http://tinyurl.com/ch2p2gc; Government Fleet, “New York City Adding 70 EVs to Fleet” (July 13, 2011) http://www.government-fleet.com/Channel/Green-Fleet/News/Story/2011/07/New-York-City-Adding-70-EVs-to-Fleet.aspx.117 North Carolina Solar Center’s Clean Transportation Program, “North Carolina FY2010-2011 Petroleum Displacement Program Report” (2011) http://tinyurl.com/ctpdvy7.118 DOE, “Washington: Alternative Fuel Use Requirement” (citing Revised Code of Washington 43.19.647-43.19.648) http://tinyurl.com/bwo86t8; “WSDOT fleet wins Green Fleet Award” (Oct. 28, 2011) http://tinyurl.com/bwqxzla.119 DOE, “Washington: Low carbon Fuel and Fuel-Efficient Vehicle Acquisition Requirement” (citing Revised Code of Washington 43.41.130) http://tinyurl.com/c4kgj2d.
ii. New York
State agencies and other affected entities that operate medium and heavy-duty vehicles must implement strategies to reduce petroleum consumption and emissions by using alternative fuels and improving vehicle fleet fuel efficiency. For light-duty vehicles, state agencies and other affected entities must procure only alternative fuel vehicles, with some exceptions. The New York State Energy Research and Development Authority (NYSERDA) provides funds to state and local transit agencies, municipalities, and schools for up to 100 percent of the incremental cost of purchasing alternative fuel buses and fueling equipment. For FY2008-09, the Central New York Regional Transportation Authority reported that 120 of its 265 large and small buses ran on CNG.115 NYSERDA together with the New York City Department of Transportation offered a competitive grant program for private and not-for-profit fleets operating in New York City to purchase alternative fuel vehicles. The chief aim of this program was to improve air quality, but the evaluation of applicants took into account environmental, energy and economic benefits. In July 2011, New York City announced that its fleet of electric vehicles had reached 430.116
iii. North Carolina
A law adopted in 2005 requires state fleet operators to use alternative fuels and fuel-efficient vehicles and to take other actions aimed at displacing 20 percent of petroleum consumption by January 1, 2010. This target was later adjusted to 17.5 percent; state fleets actually achieved a 16 percent reduction in petroleum use. In 2011, the legislature extended this program through 2016.117
iv. Washington
All state and local agencies must achieve 40 percent biofuel or electricity use in publicly-owned vehicles by June 1, 2013; the requirement increases to 100 percent by June 1, 2018. Comparing 2010 to 2008, the Washington State Department of Transportation reduced fuel consumption by 10 percent, used 50 percent more biofuel, and purchased 43 percent more hybrid vehicles.118
Starting in 2010, state agencies must consider purchasing vehicles with ultra-low carbon emissions or convert conventional vehicles to use ultra-low carbon fuels where the cost of those fuels is comparable or lower than the cost of conventional fuels over the vehicle’s useful life. Ultra-low carbon fuels include hydrogen, biomethane, electricity, or at least 90 percent natural gas. The average fuel economy of passenger vehicle fleets owned by state agencies must reach 36 miles per gallon (mpg) by 2015. Vehicles purchased by state agencies must either operate on ultra-low carbon fuel or, if they operate on conventional fuel, must have a fuel economy rating of at least 40 mpg for light-duty passenger vehicles and 27 mpg for light-duty vans and sport utility vehicles.119
The many successful programs that have already been implemented to promote more fuel-efficient, less costly, and cleaner transportation services strengthen the case for an aggressive push on federal procurements. The next section describes three major recommendations for further federal action.

37
120 In setting targets and planning reductions for these transportation services, carriers’ participation in the SmartWay program is helpful but is not enough. There are substantial variations in petroleum consumption and emissions across SmartWay carriers. A carrier’s participation in this program does not signify its adoption of best practices. Instead, agency initiatives should follow the USPS lead and use a carrier’s performance in terms of measured petroleum use and emissions – data already measured and reported by SmartWay participants. The levels of these measures would be treated as significant, or even decisive, non-price factors in procurements.121 DOE, “What is the GREET Fleet Footprint Calculator?” (Feb. 2011) http://tinyurl.com/d8838g9.
Federal agencies should increase their efforts to purchase transportation services that use less petroleum and rely on cheaper, cleaner domestic fuels. The road forward has already been mapped and paved (at least in part). The challenge of quantifying total emissions for some parts of the federal supply chain should not stand in the way of the relatively easy progress that can be made on buying cleaner, less petroleum-intensive transportation services.
A framework of standards, numeric targets and annual performance measures for federal transport purchases would significantly reduce the federal government’s dependence on petroleum. It would also leverage billions of taxpayer dollars to spur increased demand for cost-competitive alternative fuel vehicles and cheaper, cleaner, domestically-produced fuels, which would ultimately broaden the shipping choices for tens of millions of citizens as well as the government they fund.
This section describes three sets of recommendations to apply the requirements of Executive Order 13514 to direct and indirect federal purchases of transportation services from third-party providers. They cover procurements of transportation carrier services; transportation services in procurements of products from major suppliers; and GAO reports on the effectiveness of these programs.
A. Improving Procurements of Transportation Carrier Services
A rigorous framework of standards, numeric targets, annual performance measurements, and publicly-reported initiatives and evaluations has
now been applied to federal fleets for several years. This framework should be extended to federal purchases of transportation services from third-party carriers.
Starting in 2014, federal agencies should develop and report annual targets, measures and initiatives for increasing the use of alternative fuels, reducing petroleum consumption, and lowering emissions associated with the transportation carrier services they procure.
In September 2010, federal agencies filed plans outlining measures and initiatives to be implemented for their own fleets. Now, agencies should also begin tracking the use of alternative fuels and petroleum as well as air emissions in procurements from major third-party transportation services carriers. Numeric targets and annual performance measures would drive agencies to work with their carriers to find cost-effective opportunities for cleaner, domestic fuels and other efficiencies.
USPS has shown that developing and applying targets and performance measures to an agency’s third-party transportation services carriers is feasible and cost effective. GSA as well as Kraft Foods, IBM, Dell and other large shippers require or encourage their truck carriers and logistics providers to participate in EPA’s SmartWay program or similar initiatives (see Box 9).120 Other tools, including the GREET Fleet Footprint Calculator developed by Argonne National Laboratory, have been widely used to calculate petroleum consumption and GHG emissions for key fuel/vehicle combinations.121 These existing tools and resources can help carriers and logistics providers report alternative fuels and petroleum consumption and also identify their emissions and options for improving environmental
Recommendations for Federal Action
5

38
122 Executive Order 13514, supra, at Section 3(d) and (e).123 GSA, “Executive Order 13514 Section 13: Recommendations for Vendor and Contractor Emissions” (Apr. 2010) http://tinyurl.com/cr5c8d9; GSA, “Greening the Supply Chain” (describing GSA’s Federal Supply Chain Emissions Program Management Office and the sub-working groups of the Executive Order 13514 Section 13 Working Group) http://tinyurl.com/6od4pg9; J. Kohm, E. Sommer & B. Conaway, “Overview of Section 13 Product Standards and Eco-labels Sub-group” (2011) http://tinyurl.com/86u7r35.124 Id. at Sections 4(a) and 5(e).125 Id. at Section 9(c).126 CEQ, “Federal Greenhouse Gas Accounting and Reporting Guidance” at 1, 17 (2012) http://tinyurl.com/bq6myuy.
performance. Federal agencies interested in implementing procurement initiatives could utilize data already reported by these carriers, without imposing new burdens and costs.
CEQ and OMB should update their standards for reviewing the agencies’ Strategic Sustainability Performance Plans and reporting guidance under Executive Order 13514 so that the agencies are required to include procurements of transportation carrier services in their plans. CEQ and OMB have the authority and obligation to take these actions under several provisions of this order:
• The OMB Director and the CEQ Chair shall establish an interagency Steering Committee which shall, inter alia, determine appropriate federal actions to achieve the policy of Section 1 and goals of Section 2 of this order, and ensure that federal agencies are held accountable for conformance to the requirements of this order.122
As described above, Section 1 explicitly seeks increased energy and reduced GHG emissions from the agencies’ indirect as well as direct activities. Also, Section 2 requires the agencies to ensure that 95 percent of their new contracts with outside vendors or providers are for products and services that are energy efficient and environmentally preferable; and encourages the agencies to establish targets for reducing GHG emissions from their suppliers, which explicitly include emissions from third-party providers of transportation services. An existing working group of agencies, led by GSA, has been working on pilot programs to expand supply-chain accountability for upstream environmental impacts, surveying vendors and exploring other steps.123
• OMB shall review and approve, and the CEQ shall review and evaluate, each annual update of an agency’s Strategic Sustainability Performance Plan.124
Annual filings of the agencies’ plans should be approved only if they comply with the policy and goals of the order. As described above, the order requires the agencies to apply energy-efficiency and environmental standards to their procurements of transportation services.
• DOE, through its Federal Energy Management Program and in coordination with certain other agencies, shall every three years develop and provide recommendations to the CEQ Chair for revised federal GHG reporting procedures for the agencies.125
As stated in the June 2012 revision to the “Federal Greenhouse Gas Accounting and Reporting Guidance”:126
[A]dditional requirements, methodolo-gies, and procedures will be included in revisions to this document and supporting documents to improve the Federal Govern-ment’s overall ability to accurately account for and report GHG emissions over time…. [T]his Guidance utilizes a phased approach for the inclusion of [indirect] emissions…. [S]ubstantial fractions of the [indirect] emissions of many agencies will not initially be captured. The goal of this approach is to continually improve [indirect emissions] data quality.
Specifically, OMB and CEQ should direct the agencies to define targets for increasing alternative fuels use, reducing petroleum consumption, and cutting emissions from these services. Targets should be subject to review by OMB and CEQ to ensure that they are well-designed and sufficiently aggressive. Future Strategic Sustainability Performance Plans would provide annual tracking, evaluate performance and describe each agency’s initiatives with respect to major third-party transportation carriers.
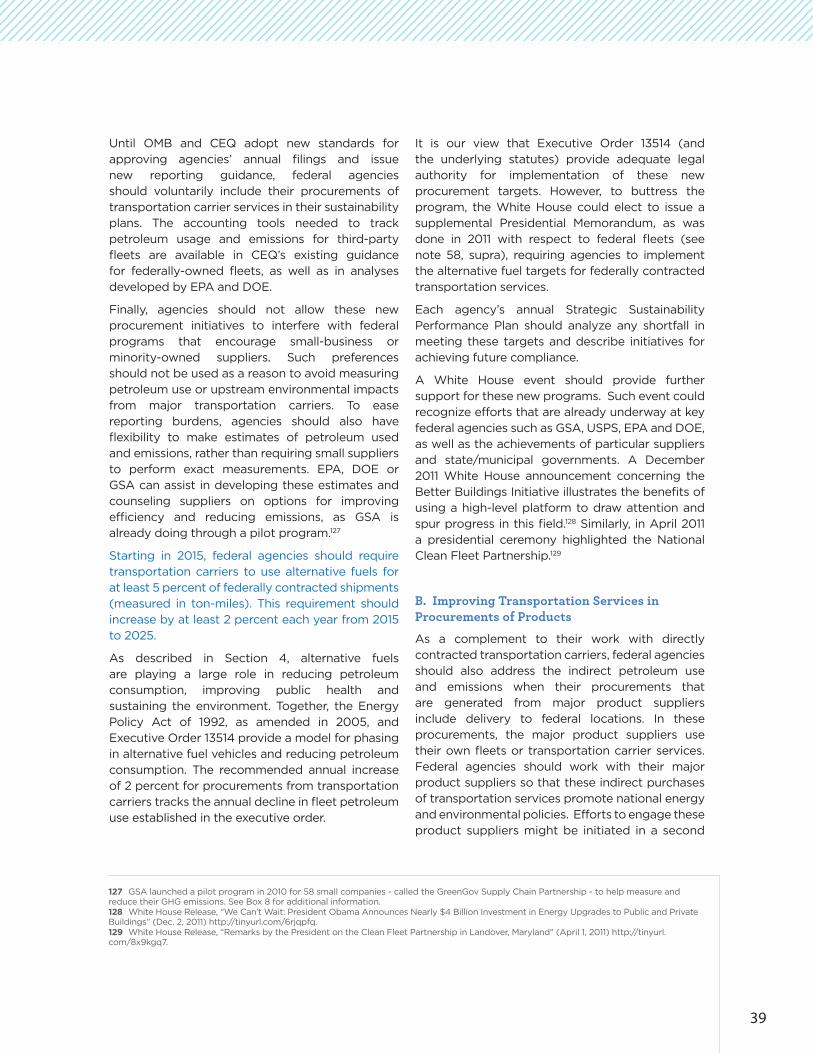
39
127 GSA launched a pilot program in 2010 for 58 small companies - called the GreenGov Supply Chain Partnership - to help measure and reduce their GHG emissions. See Box 8 for additional information.128 White House Release, “We Can’t Wait: President Obama Announces Nearly $4 Billion Investment in Energy Upgrades to Public and Private Buildings” (Dec. 2, 2011) http://tinyurl.com/6rjqpfq. 129 White House Release, “Remarks by the President on the Clean Fleet Partnership in Landover, Maryland” (April 1, 2011) http://tinyurl.com/8x9kgq7.
Until OMB and CEQ adopt new standards for approving agencies’ annual filings and issue new reporting guidance, federal agencies should voluntarily include their procurements of transportation carrier services in their sustainability plans. The accounting tools needed to track petroleum usage and emissions for third-party fleets are available in CEQ’s existing guidance for federally-owned fleets, as well as in analyses developed by EPA and DOE.
Finally, agencies should not allow these new procurement initiatives to interfere with federal programs that encourage small-business or minority-owned suppliers. Such preferences should not be used as a reason to avoid measuring petroleum use or upstream environmental impacts from major transportation carriers. To ease reporting burdens, agencies should also have flexibility to make estimates of petroleum used and emissions, rather than requiring small suppliers to perform exact measurements. EPA, DOE or GSA can assist in developing these estimates and counseling suppliers on options for improving efficiency and reducing emissions, as GSA is already doing through a pilot program.127
Starting in 2015, federal agencies should require transportation carriers to use alternative fuels for at least 5 percent of federally contracted shipments (measured in ton-miles). This requirement should increase by at least 2 percent each year from 2015 to 2025.
As described in Section 4, alternative fuels are playing a large role in reducing petroleum consumption, improving public health and sustaining the environment. Together, the Energy Policy Act of 1992, as amended in 2005, and Executive Order 13514 provide a model for phasing in alternative fuel vehicles and reducing petroleum consumption. The recommended annual increase of 2 percent for procurements from transportation carriers tracks the annual decline in fleet petroleum use established in the executive order.
It is our view that Executive Order 13514 (and the underlying statutes) provide adequate legal authority for implementation of these new procurement targets. However, to buttress the program, the White House could elect to issue a supplemental Presidential Memorandum, as was done in 2011 with respect to federal fleets (see note 58, supra), requiring agencies to implement the alternative fuel targets for federally contracted transportation services.
Each agency’s annual Strategic Sustainability Performance Plan should analyze any shortfall in meeting these targets and describe initiatives for achieving future compliance.
A White House event should provide further support for these new programs. Such event could recognize efforts that are already underway at key federal agencies such as GSA, USPS, EPA and DOE, as well as the achievements of particular suppliers and state/municipal governments. A December 2011 White House announcement concerning the Better Buildings Initiative illustrates the benefits of using a high-level platform to draw attention and spur progress in this field.128 Similarly, in April 2011 a presidential ceremony highlighted the National Clean Fleet Partnership.129
B. Improving Transportation Services in Procurements of Products
As a complement to their work with directly contracted transportation carriers, federal agencies should also address the indirect petroleum use and emissions when their procurements that are generated from major product suppliers include delivery to federal locations. In these procurements, the major product suppliers use their own fleets or transportation carrier services. Federal agencies should work with their major product suppliers so that these indirect purchases of transportation services promote national energy and environmental policies. Efforts to engage these product suppliers might be initiated in a second

40
130 See Section 1, supra.131 Greenhouse Gas Protocol, supra, at 24, 105.
phase, after establishing the program for direct procurements of transportation carrier services.
Starting in 2016, however, federal agencies should develop and report annual targets, measures and initiatives for increasing the use of alternative fuels, reducing petroleum consumption and lowering emissions associated with transportation services in procurements of products from major suppliers (i.e., for supplier-owned and contracted shipping not covered by the transportation carriers in the prior recommendation).
Sections 3 and 4 previously provided illustrations of the feasibility and cost-effectiveness of working with major product suppliers to reduce their petroleum consumption and emissions. For example, the USPS is requiring all suppliers with current contract commitments of more than $500,000 to provide sustainability data to USPS and including standard sustainability clauses in all new contracts. Many companies are responding to their customers’ demands to measure, manage and mitigate their impacts. Kraft, Dell, UPS and other large purchasers are working with their major suppliers to measure and reduce their fuel consumption and environmental impacts. Many large shippers are already reporting this kind of information for their vehicle fleets through the SmartWay or National Clean Fleet Partnership programs or other methods, such as GREET calculator. Additionally, federal agencies can look to California’s experience with a range of initiatives targeted to private fleets.
Importantly, the tools needed to analyze and document transportation-related fuel use and emissions are better developed than for some other supply chain activities. While agencies should strive to obtain complete inventories of their suppliers’ energy use and emissions, the complexities of developing such inventories should
not stand in the way of incremental progress toward accounting for upstream, supply-chain impacts. In other words, just because a supplier cannot account for the energy and emissions of its manufacturing or agricultural operations does not mean that agencies should ignore the portion of the supplier’s transportation operations that can be measured. In its 2010 guidance, CEQ urges agencies to expand their tracking of supply-chain emissions “to the greatest extent possible.”130 The sooner an agency includes a type of supplier and activity in its plan, the sooner and more effectively it can set targets and track changes. The Greenhouse Gas Protocol has established procedures for reflecting an expanded range of supplier activities in an organization’s GHG accounts; it has also recommended actions to improve consistency and transparency in benchmarking and tracking performance.131
As in the case of direct procurements of transportation carrier services, OMB and CEQ should direct federal agencies to define targets for increasing alternative fuels use, reducing petroleum consumption, and cutting emissions from the transportation services in procurements of products. All agencies should include transportation services for purchased goods in their Strategic Sustainability Performance Plans. This requirement could be limited to major suppliers using a threshold similar to that applied by the USPS: suppliers selling more than $500,000 in goods to an agency in a specified year. For suppliers that clear the threshold, agencies should be required to provide estimates of transportation-related petroleum use and emissions, which should be subject to reduction targets going forward. Agencies’ sustainability plans should track supplier progress and describe the specific actions being taken to achieve reduction targets.
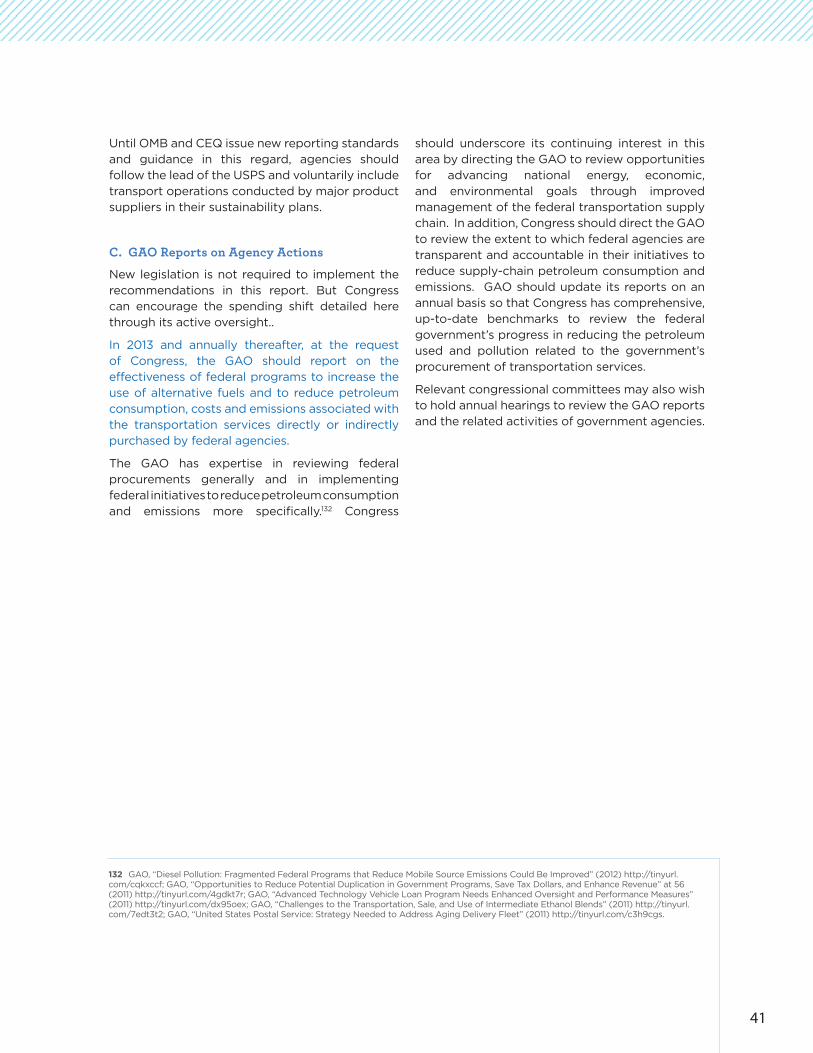
41
132 GAO, “Diesel Pollution: Fragmented Federal Programs that Reduce Mobile Source Emissions Could Be Improved” (2012) http://tinyurl.com/cqkxccf; GAO, “Opportunities to Reduce Potential Duplication in Government Programs, Save Tax Dollars, and Enhance Revenue” at 56 (2011) http://tinyurl.com/4gdkt7r; GAO, “Advanced Technology Vehicle Loan Program Needs Enhanced Oversight and Performance Measures” (2011) http://tinyurl.com/dx95oex; GAO, “Challenges to the Transportation, Sale, and Use of Intermediate Ethanol Blends” (2011) http://tinyurl.com/7edt3t2; GAO, “United States Postal Service: Strategy Needed to Address Aging Delivery Fleet” (2011) http://tinyurl.com/c3h9cgs.
Until OMB and CEQ issue new reporting standards and guidance in this regard, agencies should follow the lead of the USPS and voluntarily include transport operations conducted by major product suppliers in their sustainability plans.
C. GAO Reports on Agency Actions
New legislation is not required to implement the recommendations in this report. But Congress can encourage the spending shift detailed here through its active oversight..
In 2013 and annually thereafter, at the request of Congress, the GAO should report on the effectiveness of federal programs to increase the use of alternative fuels and to reduce petroleum consumption, costs and emissions associated with the transportation services directly or indirectly purchased by federal agencies.
The GAO has expertise in reviewing federal procurements generally and in implementing federal initiatives to reduce petroleum consumption and emissions more specifically.132 Congress
should underscore its continuing interest in this area by directing the GAO to review opportunities for advancing national energy, economic, and environmental goals through improved management of the federal transportation supply chain. In addition, Congress should direct the GAO to review the extent to which federal agencies are transparent and accountable in their initiatives to reduce supply-chain petroleum consumption and emissions. GAO should update its reports on an annual basis so that Congress has comprehensive, up-to-date benchmarks to review the federal government’s progress in reducing the petroleum used and pollution related to the government’s procurement of transportation services.
Relevant congressional committees may also wish to hold annual hearings to review the GAO reports and the related activities of government agencies.

42
43
Legislation over the past four decades, together with executive orders issued by Presidents George W. Bush and Barack Obama, correctly focus on the potential for federal agencies to lead by example in reducing our nation’s dependence on oil and promoting cleaner and more efficient, domestically fueled transportation options. In taking these steps, America’s political leaders have recognized that clearly defined, publicly-reported targets, performance measures, and actions are more effective than general directives that merely encourage federal agencies to “buy green.” Based on these targets and reports, many agencies have already achieved commendable progress.
The federal government’s ability to spur a broader transition to clean, affordable, domestic fuels can be multiplied many fold, however, when these programs extend beyond government-owned vehicle fleets. Federal agencies purchase a far larger volume of transportation services from private companies than they supply using their own vehicles and fuels. As long as the federal transportation supply chain goes unaddressed, billions of taxpayer dollars will continue to be spent in support of transportation technologies and services that are more costly, more polluting and less energy secure than is necessary.
This report has outlined several concrete, near-term steps that federal agencies and Congress can take to create powerful incentives for greater private sector investment in more efficient, alternative fueled transportation options. These steps will save the government billions of dollars and decrease costs.
Several recent developments bolster confidence that the recommendations in this report can be implemented successfully and cost-effectively:
• the life cycle costs of alternative fuel vehicles have declined;
• the availability of new vehicle technologies and fueling options is increasing rapidly;
• companies widely use analytical tools and report data for their transportation energy use and emissions, and;
• a growing number of firms have considerable experience in reducing petroleum use through numerous private sector initiatives and government programs.
Some might argue that federal agencies should not be asked to take on a new challenge. We disagree. At a time of growing doubt about government’s fundamental ability to tackle the issues most central to our nation’s future, a demonstration of real progress on transportation, sustainability, public health, and security—areas of critical and long-term importance—could not be more welcome.
Conclusion

44
133 DOE, “Alternative Fuels & Advanced Vehicles Data Center — Heavy-Duty Vehicle and Engine Search” (as of May 7. 2012) http://tinyurl.com/ckatvk7.
AppendixSelected Non-Petroleum Platforms for Trucking Carriers
A. Heavy-Duty Tractors
DOE’s Alternative Fuels & Advanced Vehicles Data Center shows heavy-duty vehicles in the tractor category. Including dual-fueled vehicles, 7 run on LNG, 5 run on CNG, 3 are diesel/electric, 2 are all-electric, 2 are fuel cell/electric, and 1 runs on hydrogen.133 These vehicles include:
Balqon - Nautilus E20
Application: Tractor
Fuel Type Option: Electricity
Transmission Make: Allison 3000 RDS
Transmission Type: Automatic
Description: Nautilus E20 is an all-electric vehicle designed to transport cargo containers within terminal facilities. The E20 uses lead acid batteries and has a 95-mile range on a single charge.
Balqon - Nautilus E30
Application: Tractor
Fuel Type Option: Electricity
Transmission Type: Automatic
Description: Nautilus Model E-30 is a zero-emission, all-electric tractor designed to transport containers in terminal or on-road applications.
This section provides details on three categories of heavy-duty vehicles shown on selected models included in DOE’s Alternative Fuels & Advanced Vehicles Data Center: (A) tractors; (B) vocational trucks; and (C) vans.

45
Capacity of Texas - PHETT Pluggable Hybrid Terminal Tractor
Application: Tractor
Fuel Type Option: Diesel/Electric
Number of Passengers: 1
Description: Diesel/electric hybrid terminal truck.
Compatible Power Sources:
Cummins Westport Inc. - ISL G 250 - 320 hp
Capacity of Texas - TJ9000 CNG/LNG Terminal Tractor
Application: Tractor
Fuel Type Options: CNG, LNG
Transmission Make: Allison RDS3000
Number of Passengers: 1
Description: The Capacity of Texas CNG- or LNG-powered terminal tractor is designed for hauling cargo in the warehouse area.
Compatible Power Sources:
Cummins Westport Inc. - ISL G 250 - 320 hp

46
Cargotec Solutions - Ottawa 4x2
Application: Tractor
Fuel Type Options: CNG, LNG
Vehicle Class: Class 5 (16,001 - 19,500 lbs)
Transmission Make: Allison 3000 RDS
Transmission Type: Automatic
Number of Passengers: 1
Description: The Ottawa 4x2 is a natural gas vehicle used for moving trailers and containers in a terminal environment.
Compatible Power Sources:
Cummins Westport Inc. - ISL G 250 - 320 hp
Freightliner - Business Class M2 112 tractor
Application: Tractor
Fuel Type Options: CNG, LNG
Vehicle Class: Class 8 (over 33,000 lbs)
Description: The Freightliner M2 112 is a heavy-duty Class 8 tractor that operates on CNG or LNG.
Compatible Hybrids: Eaton - Diesel Electric
Kenworth - T370 diesel electric tractor
Application: Tractor
Fuel Type Option: Diesel/Electric
Vehicle Class: Class 7 (26,001 - 33,000 lbs)
Transmission Type: Automatic
Number of Passengers: 3
Description: The T370 is a Class 7 medium-duty hybrid truck with PACCAR PX-6 engine and the Eaton diesel-electric hybrid power system.
Compatible Power Sources: Westport Innovations - Westport HD
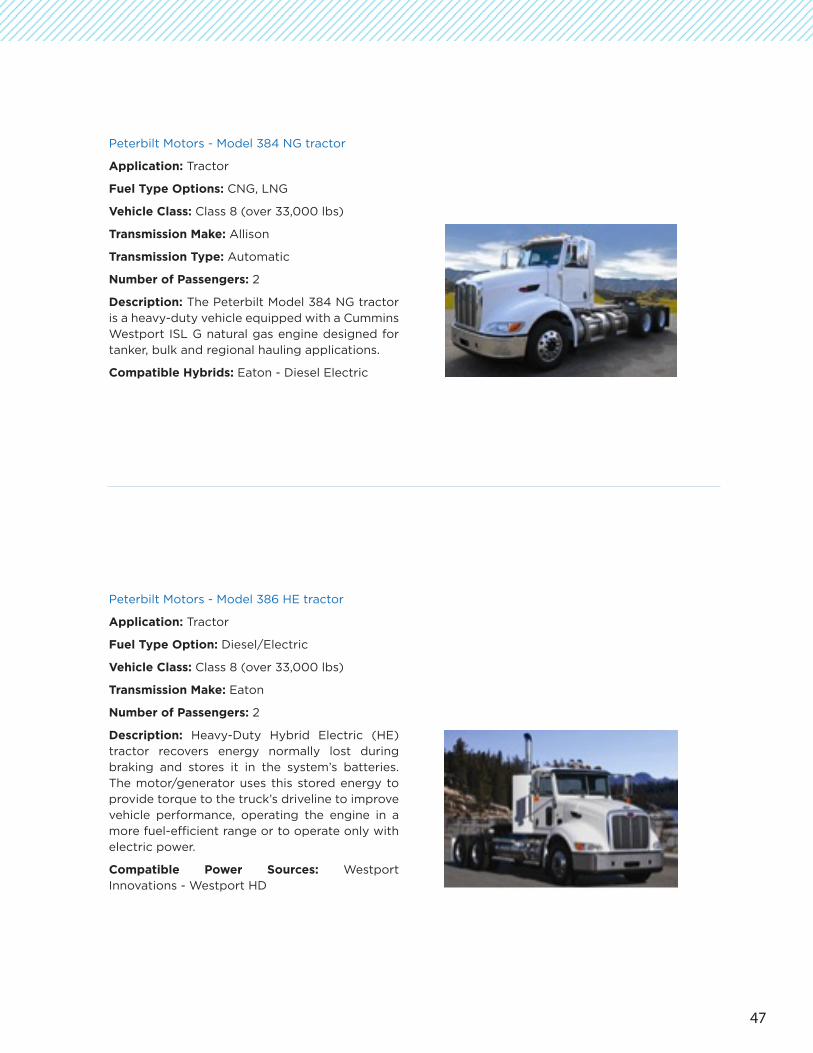
47
Peterbilt Motors - Model 384 NG tractor
Application: Tractor
Fuel Type Options: CNG, LNG
Vehicle Class: Class 8 (over 33,000 lbs)
Transmission Make: Allison
Transmission Type: Automatic
Number of Passengers: 2
Description: The Peterbilt Model 384 NG tractor is a heavy-duty vehicle equipped with a Cummins Westport ISL G natural gas engine designed for tanker, bulk and regional hauling applications.
Compatible Hybrids: Eaton - Diesel Electric
Peterbilt Motors - Model 386 HE tractor
Application: Tractor
Fuel Type Option: Diesel/Electric
Vehicle Class: Class 8 (over 33,000 lbs)
Transmission Make: Eaton
Number of Passengers: 2
Description: Heavy-Duty Hybrid Electric (HE) tractor recovers energy normally lost during braking and stores it in the system’s batteries. The motor/generator uses this stored energy to provide torque to the truck’s driveline to improve vehicle performance, operating the engine in a more fuel-efficient range or to operate only with electric power.
Compatible Power Sources: Westport Innovations - Westport HD
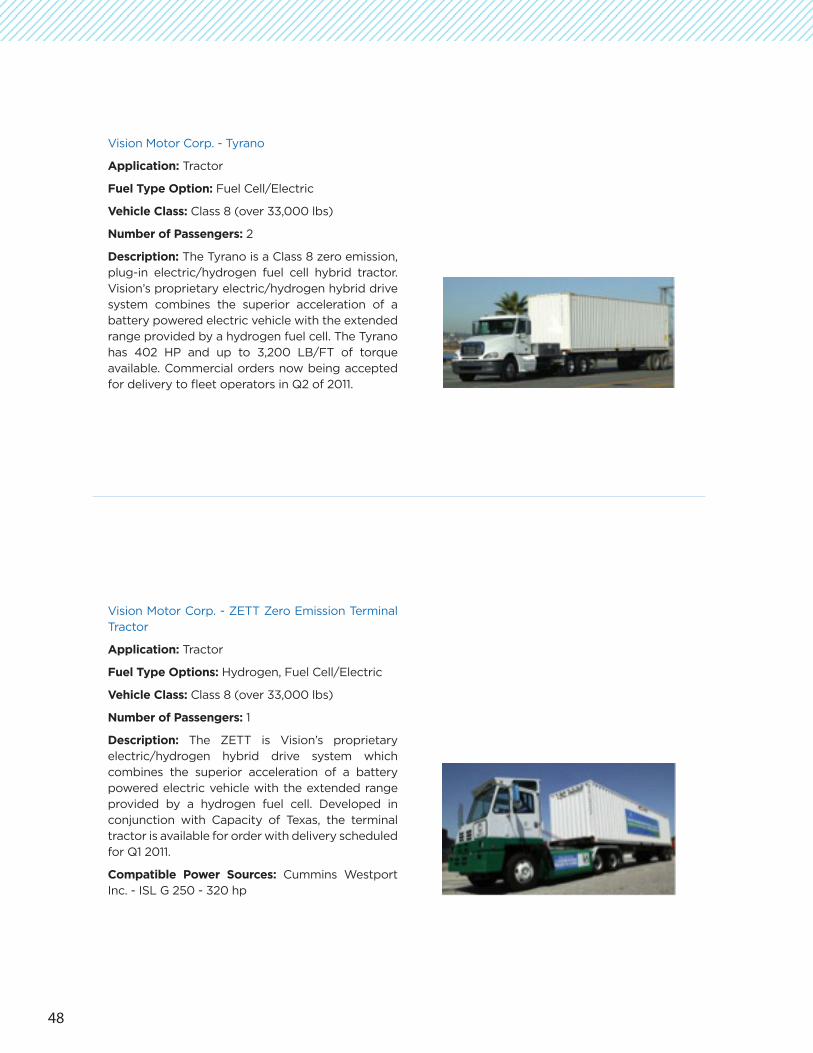
48
Vision Motor Corp. - Tyrano
Application: Tractor
Fuel Type Option: Fuel Cell/Electric
Vehicle Class: Class 8 (over 33,000 lbs)
Number of Passengers: 2
Description: The Tyrano is a Class 8 zero emission, plug-in electric/hydrogen fuel cell hybrid tractor. Vision’s proprietary electric/hydrogen hybrid drive system combines the superior acceleration of a battery powered electric vehicle with the extended range provided by a hydrogen fuel cell. The Tyrano has 402 HP and up to 3,200 LB/FT of torque available. Commercial orders now being accepted for delivery to fleet operators in Q2 of 2011.
Vision Motor Corp. - ZETT Zero Emission Terminal Tractor
Application: Tractor
Fuel Type Options: Hydrogen, Fuel Cell/Electric
Vehicle Class: Class 8 (over 33,000 lbs)
Number of Passengers: 1
Description: The ZETT is Vision’s proprietary electric/hydrogen hybrid drive system which combines the superior acceleration of a battery powered electric vehicle with the extended range provided by a hydrogen fuel cell. Developed in conjunction with Capacity of Texas, the terminal tractor is available for order with delivery scheduled for Q1 2011.
Compatible Power Sources: Cummins Westport Inc. - ISL G 250 - 320 hp

49
B. Heavy-Duty Vocational Trucks
DOE shows heavy-duty vehicles in the vocational truck category. Including dual-fueled vehicles, 6 are diesel/electric, 5 run on CNG, 5 are all-electric, 3 run on LNG, and 3 run on propane. The list includes:
Balqon - Mule M150
Application: Vocational truck
Fuel Type Option: Electricity
Transmission Make: Allison 3000
Transmission Type: Automatic
Number of Passengers: 2
Description: The Mule M150 is an electric truck with heavy-duty transmission for off-highway applications. The Mule has a 150-mile range on a single charge, uses lithium-ion batteries and is a zero emission vehicle.
Electric Vehicles International - MD EVI
Application: Vocational truck
Fuel Type Option: Electricity
Vehicle Class: Class 4 (14,001 - 16,000 lbs)
Transmission Make: Eaton Ultrashift 6-sp
Transmission Type: Automatic
Description: The MD EVI is a medium-duty Freightliner M2-based truck using Valence U-Charge XP lithium iron phosphate batteries.

50
Freightliner - Business Class M2 112
Application: Vocational truck
Fuel Type Options: CNG, LNG
Vehicle Class: Class 7 (26,001 - 33,000 lbs)
Description: Freightliner’s M2 112 is a natural gas powered vocational truck suitable for dump truck or standard box truck configuration.
Compatible Hybrids: Eaton - Parallel Hybrid with Power Take-Off (PTO)
GGT Electric - Electric
Application: Vocational truck
Fuel Type Option: Electricity
Vehicle Class: Class 3 (10,001 - 14,000 lbs)
Description: The GGT all-electric three-seat chassis is available in dropside, dumpbox and box van models. It is powered by a battery using a proprietary blend of lithium ferrous phosphate and manganese dioxide. 40Kw, 60Kw, and 80Kw packages available. Maximum speed is 55 mph with a range of 80-200 miles.
Compatible Power Sources:
Bi-Phase Technologies, LLC - LPEFI 8.1L V8, CleanFuel USA - Liquid Propane Injection, General Motors - Vortec 6.0 Liter
Kenworth - T270 hybrid
Application: Vocational truck
Fuel Type Option: Diesel/Electric
Vehicle Class: Class 6 (19,501 - 26,000 lbs)
Transmission Make: Eaton
Transmission Type: Automatic
Number of Passengers: 3
Description: Kenworth Class 6 medium duty hybrid truck is powered by a PACCAR PX-6 engine and features an integral transmission-mounted motor/generator, a frame-mounted 340-volt battery pack, and a dedicated power management system.
Compatible Hybrids: Eaton - Hybrid Drive System

51
Kenworth - T370 hybrid truck
Application: Vocational truck
Fuel Type Option: Diesel/Electric
Vehicle Class: Class 7 (26,001 - 33,000 lbs)
Transmission Make: Eaton
Transmission Type: Automatic
Number of Passengers: 2
Description: Class 7 T370 is powered by a Cummins diesel engine and features an integral transmission-mounted motor/generator, a frame-mounted 340-volt battery pack, and a dedicated power management system.
Compatible Power Sources: Cummins Westport Inc. - ISL G 250 - 320 hp
Peterbilt Motors - Model 330 Hybrid
Application: Vocational truck
Fuel Type Option: Diesel/Electric
Vehicle Class: Class 6 (19,501 - 26,000 lbs)
Description: Peterbilt’s Model 330 hybrid electric medium duty vehicle is designed for all van body applications.. The integration of the Eaton Hybrid Drive System and the 260-hp PACCAR PX-6 engine delivers up to 860 ft-lbs of torque.
Compatible Hybrids: Eaton - Deisel Electric
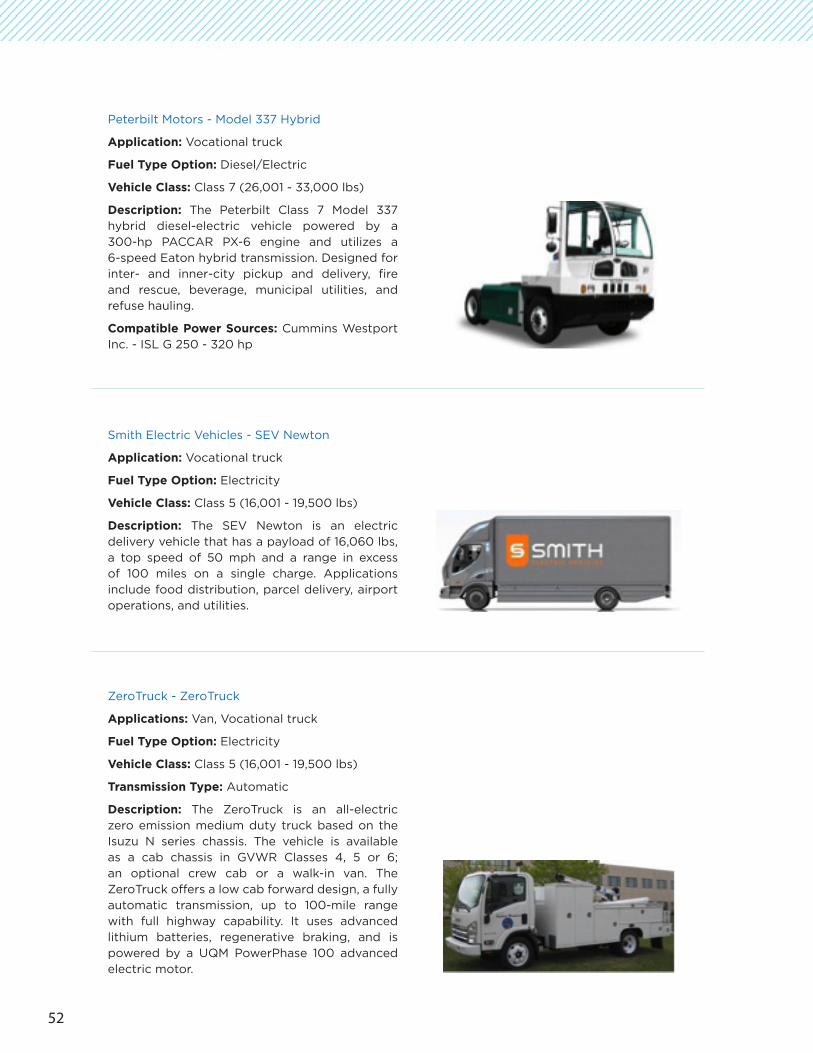
52
Peterbilt Motors - Model 337 Hybrid
Application: Vocational truck
Fuel Type Option: Diesel/Electric
Vehicle Class: Class 7 (26,001 - 33,000 lbs)
Description: The Peterbilt Class 7 Model 337 hybrid diesel-electric vehicle powered by a 300-hp PACCAR PX-6 engine and utilizes a 6-speed Eaton hybrid transmission. Designed for inter- and inner-city pickup and delivery, fire and rescue, beverage, municipal utilities, and refuse hauling.
Compatible Power Sources: Cummins Westport Inc. - ISL G 250 - 320 hp
Smith Electric Vehicles - SEV Newton
Application: Vocational truck
Fuel Type Option: Electricity
Vehicle Class: Class 5 (16,001 - 19,500 lbs)
Description: The SEV Newton is an electric delivery vehicle that has a payload of 16,060 lbs, a top speed of 50 mph and a range in excess of 100 miles on a single charge. Applications include food distribution, parcel delivery, airport operations, and utilities.
ZeroTruck - ZeroTruck
Applications: Van, Vocational truck
Fuel Type Option: Electricity
Vehicle Class: Class 5 (16,001 - 19,500 lbs)
Transmission Type: Automatic
Description: The ZeroTruck is an all-electric zero emission medium duty truck based on the Isuzu N series chassis. The vehicle is available as a cab chassis in GVWR Classes 4, 5 or 6; an optional crew cab or a walk-in van. The ZeroTruck offers a low cab forward design, a fully automatic transmission, up to 100-mile range with full highway capability. It uses advanced lithium batteries, regenerative braking, and is powered by a UQM PowerPhase 100 advanced electric motor.
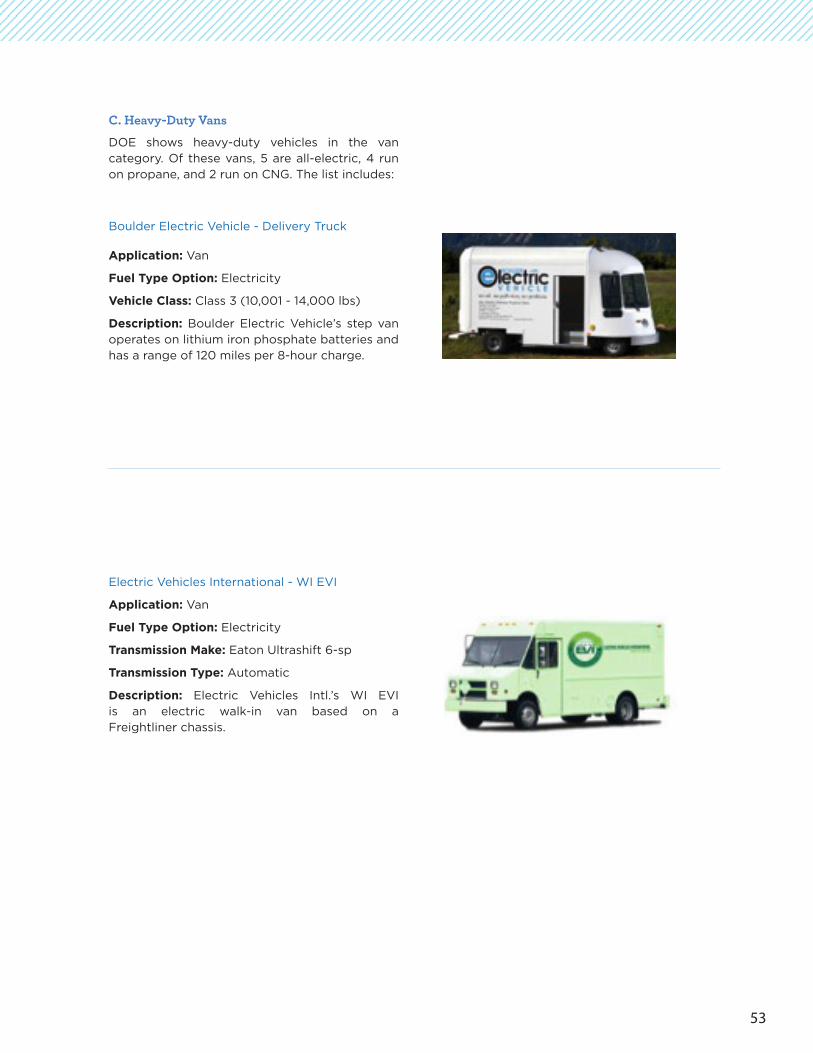
53
C. Heavy-Duty Vans
DOE shows heavy-duty vehicles in the van category. Of these vans, 5 are all-electric, 4 run on propane, and 2 run on CNG. The list includes:
Boulder Electric Vehicle - Delivery Truck
Application: Van
Fuel Type Option: Electricity
Vehicle Class: Class 3 (10,001 - 14,000 lbs)
Description: Boulder Electric Vehicle’s step van operates on lithium iron phosphate batteries and has a range of 120 miles per 8-hour charge.
Electric Vehicles International - WI EVI
Application: Van
Fuel Type Option: Electricity
Transmission Make: Eaton Ultrashift 6-sp
Transmission Type: Automatic
Description: Electric Vehicles Intl.’s WI EVI is an electric walk-in van based on a Freightliner chassis.
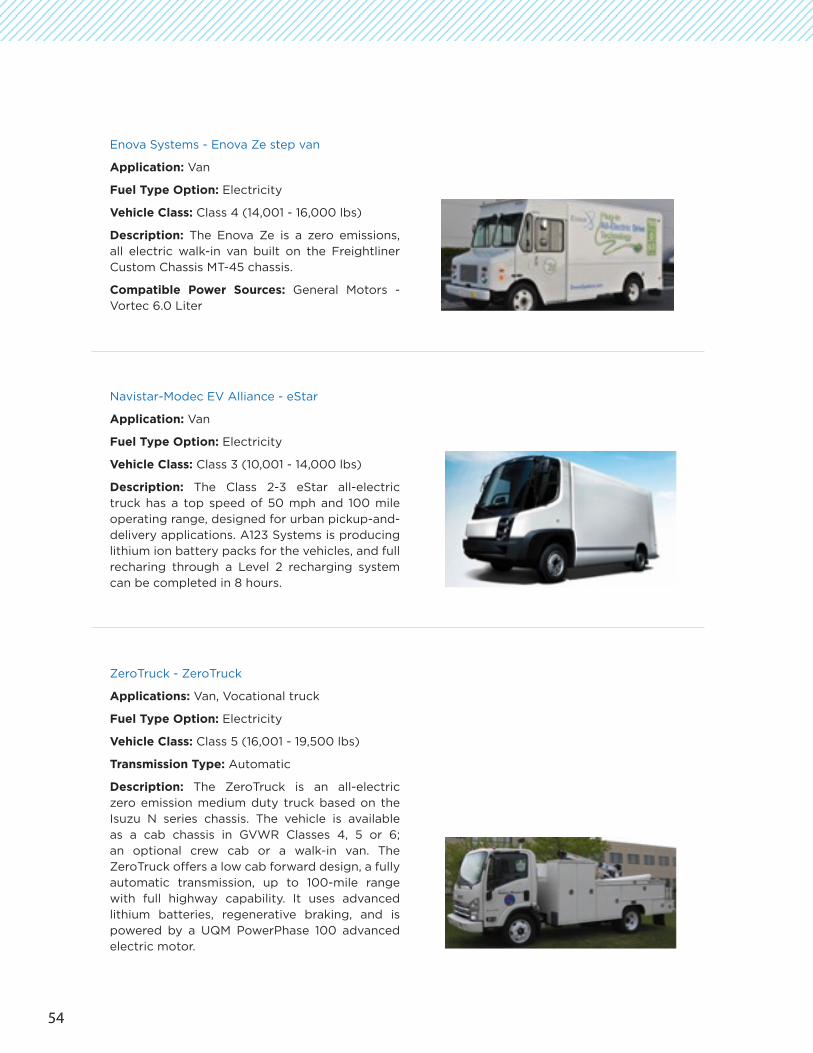
54
Enova Systems - Enova Ze step van
Application: Van
Fuel Type Option: Electricity
Vehicle Class: Class 4 (14,001 - 16,000 lbs)
Description: The Enova Ze is a zero emissions, all electric walk-in van built on the Freightliner Custom Chassis MT-45 chassis.
Compatible Power Sources: General Motors - Vortec 6.0 Liter
Navistar-Modec EV Alliance - eStar
Application: Van
Fuel Type Option: Electricity
Vehicle Class: Class 3 (10,001 - 14,000 lbs)
Description: The Class 2-3 eStar all-electric truck has a top speed of 50 mph and 100 mile operating range, designed for urban pickup-and-delivery applications. A123 Systems is producing lithium ion battery packs for the vehicles, and full recharing through a Level 2 recharging system can be completed in 8 hours.
ZeroTruck - ZeroTruck
Applications: Van, Vocational truck
Fuel Type Option: Electricity
Vehicle Class: Class 5 (16,001 - 19,500 lbs)
Transmission Type: Automatic
Description: The ZeroTruck is an all-electric zero emission medium duty truck based on the Isuzu N series chassis. The vehicle is available as a cab chassis in GVWR Classes 4, 5 or 6; an optional crew cab or a walk-in van. The ZeroTruck offers a low cab forward design, a fully automatic transmission, up to 100-mile range with full highway capability. It uses advanced lithium batteries, regenerative braking, and is powered by a UQM PowerPhase 100 advanced electric motor.

55
General Motors - Chevrolet Express 3500 cutaway van
Applications: Bus - Shuttle, Van
Fuel Type Option: CNG
Vehicle Class: Class 4 (14,001 - 16,000 lbs)
Transmission Type: Automatic
Description: The Express van uses a 6.0L Vortec V8 engine with factory-installed hardened exhaust valves and intake/exhaust valve seats engineered for gaseous fuel use. The van is available in a 3-tank system for a range of up to 200 miles or a 4-tank system that provides a range up to 300 miles.
Compatible Power Sources: Bi-Phase Technologies, LLC - LPEFI 8.1L V8, CleanFuel USA - Liquid Propane Injection, General Motors - Vortec 6.0 Liter
General Motors - GMC Savana 3500 cutaway van
Applications: Bus - Shuttle, Van
Fuel Type Option: CNG
Vehicle Class: Class 4 (14,001 - 16,000 lbs)
Transmission Type: Automatic
Description: The GMC Savana van uses a 6.0L Vortec V8 engine with factory-installed hardened exhaust valves and intake/exhaust valve seats engineered for gaseous fuel use. The van is available in a 3-tank system for a range of up to 200 miles or a 4-tank system that provides a range up to 300 miles.
Compatible Power Sources: Bi-Phase Technologies, LLC - LPEFI 8.1L V8, CleanFuel USA - Liquid Propane Injection, General Motors - Vortec 6.0 Liter

56
750 1ST Street, NW, Suite 1100
Washington, D.C. 20002
T: 202-682-6294 | F: 202-682-3050
Twitter: @cleanskiesfdn
www.cleanskies.org
Related Documents