OIL SANDS PERFORMANCE REPORT Muskeg River Mine & Scotford Upgrader

Welcome message from author
This document is posted to help you gain knowledge. Please leave a comment to let me know what you think about it! Share it to your friends and learn new things together.
Transcript

Oil SandS PerfOrmance rePOrtMuskeg River Mine & Scotford Upgrader
ScOPeAs in the Issues and Opportunities series, this report provides discussion on oil sands mining and upgrading, specifically as it relates to the operation of the Athabasca Oil Sands Project (AOSP), a joint venture between Shell (60%), Chevron Canada Limited (20%) and Marathon Oil Canada Corporation (20%). The AOSP includes the Shell Albian Sands Muskeg River Mine (MRM), an open pit bitumen mining operation located north of Fort McMurray, Alberta and the Shell Scotford Upgrader (SU), located near Fort Saskatchewan, Alberta, which upgrades bitumen into synthetic crude oil. Shell operates the SU and MRM on behalf of the AOSP joint venture. The MRM currently has mining production capacity of 155,000 barrels per day (bpd). The SU currently has upgrading capacity of 155,000 bpd.
AOSP Expansion 1 (60% Shell share), which is currently under construction, and the in situ oil sands business are not included in the scope of this report.
Unless otherwise stated, all data presented is in reference to total AOSP performance before division amongst the joint venture partners.
All monetary amounts referenced in this document are in Canadian dollars unless otherwise noted.
This document is a report to our stakeholders and is an important part of Shell’s continuing dialogue with governments, industry, environmental groups, community stakeholders, Aboriginal Peoples and the public about our oil sands mining and upgrading operations. In this report we provide discussion on the Muskeg River Mine’s and Scotford Upgrader’s performance in 2009 in five key areas: carbon dioxide, water, tailings, land and reclamation and community.
While the focus of this report is performance, further discussion on the five key areas can be found in our series entitled Canada’s Oil Sands: Issues and Opportunities, available online at www.shell.ca/oilsands.
aBOUt tHiS rePOrt 01
OVerVieW02
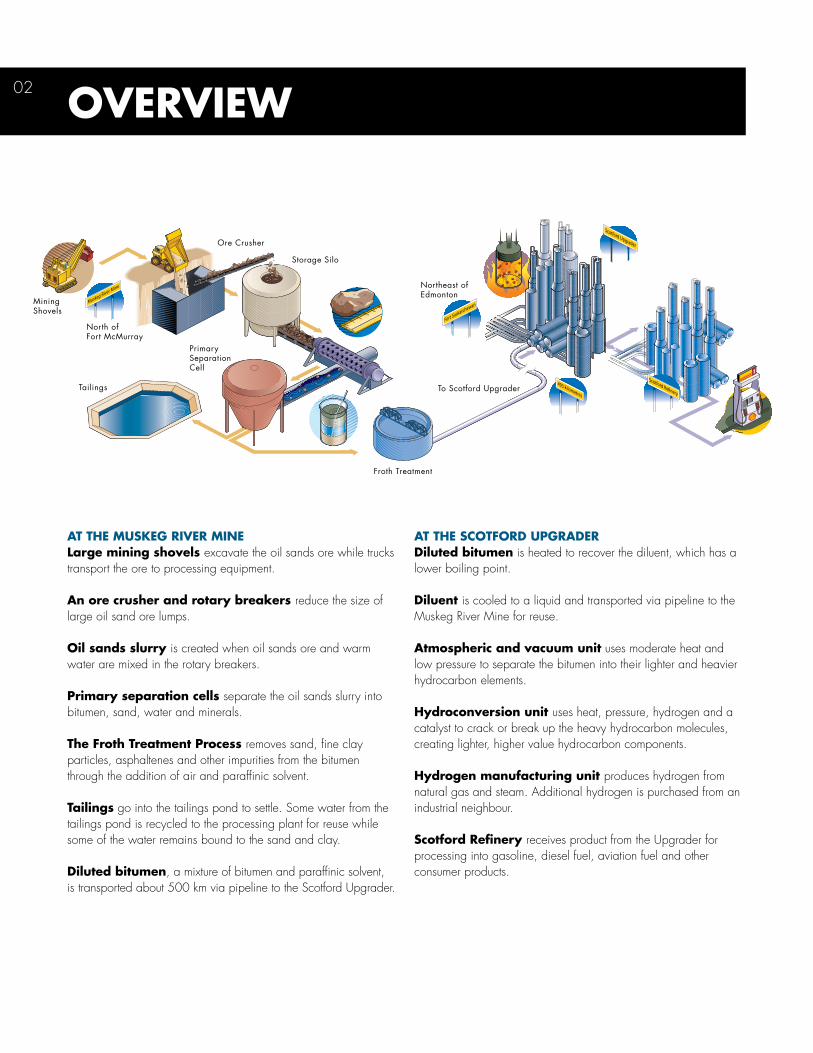
at tHe mUSkeg riVer minelarge mining shovels excavate the oil sands ore while trucks transport the ore to processing equipment.
an ore crusher and rotary breakers reduce the size of large oil sand ore lumps.
Oil sands slurry is created when oil sands ore and warm water are mixed in the rotary breakers.
Primary separation cells separate the oil sands slurry into bitumen, sand, water and minerals.
the froth treatment Process removes sand, fine clay particles, asphaltenes and other impurities from the bitumen through the addition of air and paraffinic solvent.
tailings go into the tailings pond to settle. Some water from the tailings pond is recycled to the processing plant for reuse while some of the water remains bound to the sand and clay.
diluted bitumen, a mixture of bitumen and paraffinic solvent, is transported about 500 km via pipeline to the Scotford Upgrader.
at tHe ScOtfOrd UPgraderdiluted bitumen is heated to recover the diluent, which has a lower boiling point.
diluent is cooled to a liquid and transported via pipeline to the Muskeg River Mine for reuse.
atmospheric and vacuum unit uses moderate heat and low pressure to separate the bitumen into their lighter and heavier hydrocarbon elements.
Hydroconversion unit uses heat, pressure, hydrogen and a catalyst to crack or break up the heavy hydrocarbon molecules, creating lighter, higher value hydrocarbon components.
Hydrogen manufacturing unit produces hydrogen from natural gas and steam. Additional hydrogen is purchased from an industrial neighbour.
Scotford refinery receives product from the Upgrader for processing into gasoline, diesel fuel, aviation fuel and other consumer products.
Northeast ofEdmonton
North ofFort McMurray
Storage Silo
Ore Crusher
MiningShovels
Tailings
PrimarySeparationCell
Froth Treatment
To Scotford Upgrader
Total greenhouse gas (GHG) emissions from the AOSP in 2009 showed an increase of about six per cent since 2008. This is due to a variety of factors, including an increase in diesel consumption at the MRM to accommodate longer truck travel distances and construction activities such as the southern extension to the External Tailings Facility and preparation for in-pit disposal of tailings.
alBerta’S SPecified gaS emitterS regUlatiOn (Sger)Under the SGER (which came into effect in 2007), the MRM and SU are required to achieve a two per cent reduction per year in their direct emissions intensity over the 2006 baseline until a 12 per cent target is reached. The regulators target direct emissions since they include emission sources under the direct operational control of each facility.
Under the SGER, compliance can be achieved in four ways: through the implementation of energy efficiency projects; the
purchase of certified emissions offsets from Alberta based projects; from Emission Performance Credits generated at facilities that operate below their regulatory target; and through contributions to the Climate Change and Emissions Management Fund at $15 for each tonne over the allowable limit.
In 2009, the MRM and SU met their regulated intensity target through energy efficiency projects and the procurement of Alberta based offsets equivalent to more than 600,000 tonnes of CO2e. energy management PlanSIn 2009, five--year energy management plans were formalized for the MRM and SU to implement energy abatement opportunities at each facility and reduce subsequent GHG emission levels from business as usual.
mOre infOrmatiOnIssues and Opportunities - Carbon Dioxide
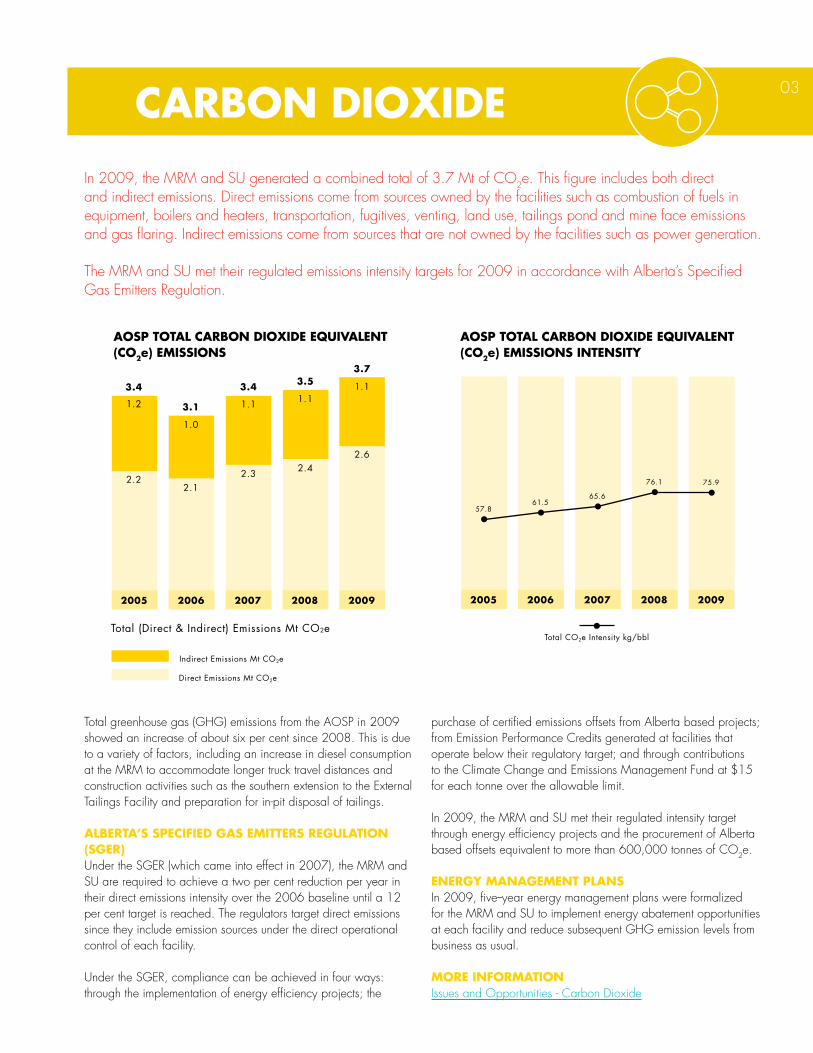
aOSP tOtal carBOn diOxide eqUiValent (cO2e) emiSSiOnS
aOSP tOtal carBOn diOxide eqUiValent (cO2e) emiSSiOnS intenSity
In 2009, the MRM and SU generated a combined total of 3.7 Mt of CO2e. This figure includes both direct and indirect emissions. Direct emissions come from sources owned by the facilities such as combustion of fuels in equipment, boilers and heaters, transportation, fugitives, venting, land use, tailings pond and mine face emissions and gas flaring. Indirect emissions come from sources that are not owned by the facilities such as power generation.
The MRM and SU met their regulated emissions intensity targets for 2009 in accordance with Alberta’s Specified Gas Emitters Regulation.
carBOn diOxide 03
2005
160
140
120
100
80
60
40
20
0
3.7
3.6
3.5
3.4
3.3
3.2
3.1
3.0
2.9
2.8 2006 2007 2008 2009
3.4
Total (Direct & Indirect) EmissionsMt CO2e
3.1
3.4 3.53.7
3.7
3.6
3.5
3.4
3.3
3.2
3.1
3.0
2.9
2.8
57.861.5
65.6
76.1 75.9
2005 2006 2007 2008 2009
Total CO2e Intensity kg/bbl
2005
160
140
120
100
80
60
40
20
0
3.7
3.6
3.5
3.4
3.3
3.2
3.1
3.0
2.9
2.8 2006 2007 2008 2009
3.4
3.1
3.4 3.53.7
3.7
3.6
3.5
3.4
3.3
3.2
3.1
3.0
2.9
2.8
57.861.5
65.6
76.1 75.9
2005 2006 2007 2008 2009
CO2e Intensity kg/bbl
2.2
1.2
2.1
1.0
2.3
1.1
2.4
1.1
2.6
1.1
Indirect Emissions Mt CO2e
Direct Emissions Mt CO2e
Total (Direct & Indirect) Emissions Mt CO2e
04
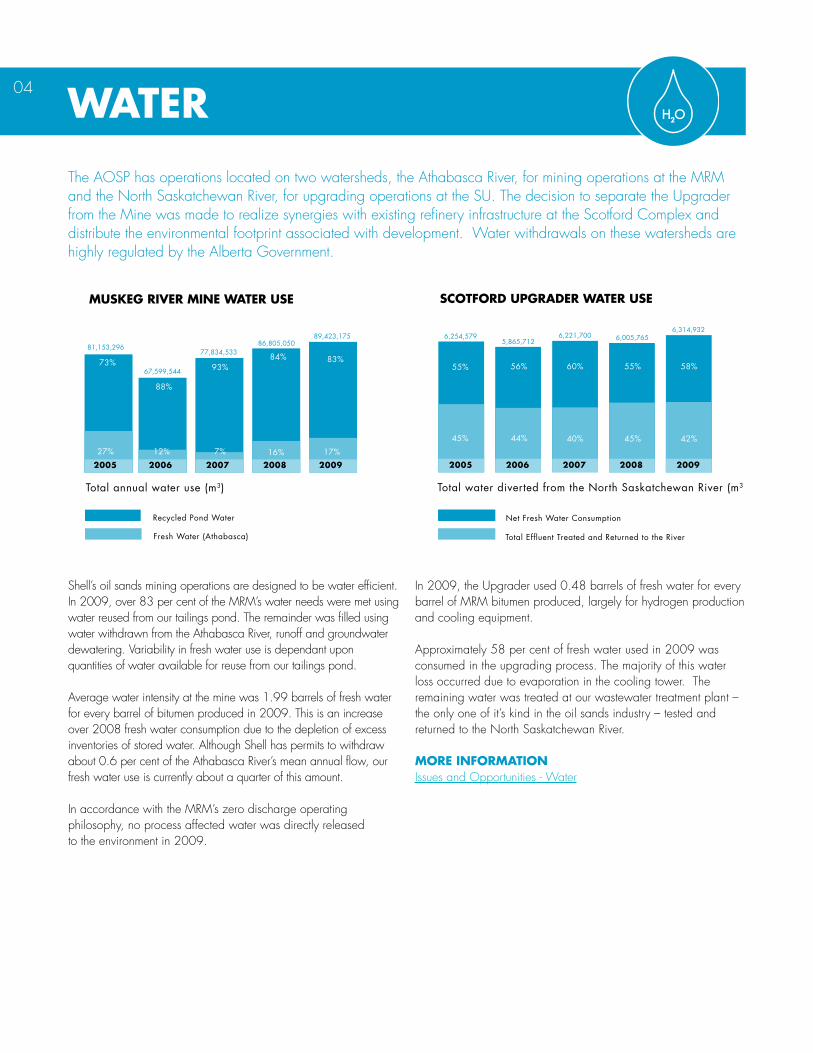
ScOtfOrd UPgrader Water USemUSkeg riVer mine Water USe
Shell’s oil sands mining operations are designed to be water efficient. In 2009, over 83 per cent of the MRM’s water needs were met using water reused from our tailings pond. The remainder was filled using water withdrawn from the Athabasca River, runoff and groundwater dewatering. Variability in fresh water use is dependant upon quantities of water available for reuse from our tailings pond.
Average water intensity at the mine was 1.99 barrels of fresh water for every barrel of bitumen produced in 2009. This is an increase over 2008 fresh water consumption due to the depletion of excess inventories of stored water. Although Shell has permits to withdraw about 0.6 per cent of the Athabasca River’s mean annual flow, our fresh water use is currently about a quarter of this amount.
In accordance with the MRM’s zero discharge operating philosophy, no process affected water was directly released to the environment in 2009.
In 2009, the Upgrader used 0.48 barrels of fresh water for every barrel of MRM bitumen produced, largely for hydrogen production and cooling equipment.
Approximately 58 per cent of fresh water used in 2009 was consumed in the upgrading process. The majority of this water loss occurred due to evaporation in the cooling tower. The remaining water was treated at our wastewater treatment plant – the only one of it’s kind in the oil sands industry – tested and returned to the North Saskatchewan River.
mOre infOrmatiOnIssues and Opportunities - Water
WaterThe AOSP has operations located on two watersheds, the Athabasca River, for mining operations at the MRM and the North Saskatchewan River, for upgrading operations at the SU. The decision to separate the Upgrader from the Mine was made to realize synergies with existing refinery infrastructure at the Scotford Complex and distribute the environmental footprint associated with development. Water withdrawals on these watersheds are highly regulated by the Alberta Government.
2005
3.7
3.6
3.5
3.4
3.3
3.2
3.1
3.0
2.9
2.8 2006 2007 2008 2009
3.4
57.861.5
66.6
76.1 75.9
3.1
3.4
3.5
3.7
2005
0
10
20
30
40
50
60
70
2006 2007 2008 2009
2005 2006 2007 2008 2009 0
10
20
30
40
50
60
70
80
90
100
2005 2006 2007 2008 2009
2.321
6,254,5795,865,712
6,221,700 6,005,7656,314,932
73%
81,153,296
88%
67,599,544 93%
77,834,533 84%
86,805,050
83%
89,423,175
12%27% 7% 16% 17%
1.028
1.838
0.696
1.990
Net Fresh Water Consumption
bbl water consumed / bbl MRM bitumen
2005 2006 2007 2008 2009
0.372
0.4500.404
0.455 0.481
bbl water consumed / bbl MRM bitumen
Total water diverted from the North Saskatchewan River (m3) Total annual water use (m3)
Total Effluent Treated and Returned to the River
Recycled Pond Water
Fresh Water (Athabasca)
55%
45%
56%
44%
60%
40%
55%
45%
58%
42%
2005
3.7
3.6
3.5
3.4
3.3
3.2
3.1
3.0
2.9
2.8 2006 2007 2008 2009
3.4
57.861.5
66.6
76.1 75.9
3.1
3.4
3.5
3.7
2005
0
10
20
30
40
50
60
70
2006 2007 2008 2009
2005 2006 2007 2008 2009 0
10
20
30
40
50
60
70
80
90
100
2005 2006 2007 2008 2009
2.321
6,254,5795,865,712
6,221,700 6,005,7656,314,932
73%
81,153,296
88%
67,599,544 93%
77,834,533 84%
86,805,050
83%
89,423,175
12%27% 7% 16% 17%
1.028
1.838
0.696
1.990
Net Fresh Water Consumption
bbl water consumed / bbl MRM bitumen
2005 2006 2007 2008 2009
0.372
0.4500.404
0.455 0.481
bbl water consumed / bbl MRM bitumen
Total water diverted from the North Saskatchewan River (m3) Total annual water use (m3)
Total Effluent Treated and Returned to the River
Recycled Pond Water
Fresh Water (Athabasca)
55%
45%
56%
44%
60%
40%
55%
45%
58%
42%
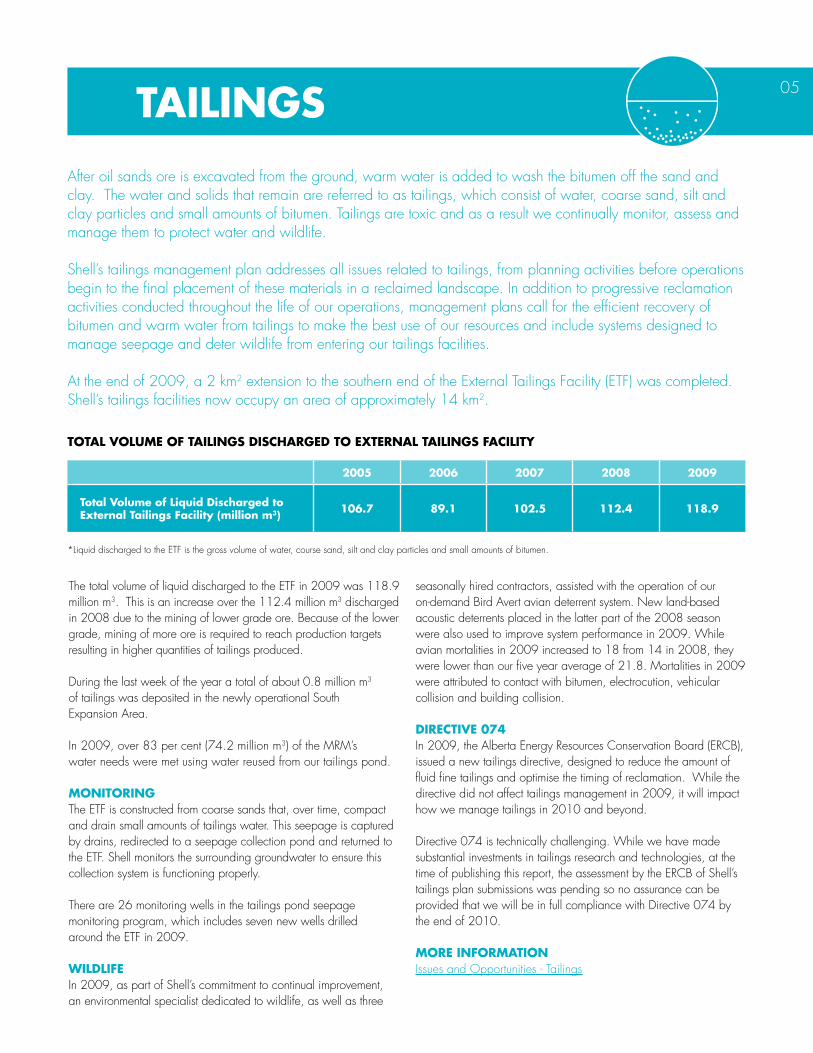
The total volume of liquid discharged to the ETF in 2009 was 118.9 million m3. This is an increase over the 112.4 million m3 discharged in 2008 due to the mining of lower grade ore. Because of the lower grade, mining of more ore is required to reach production targets resulting in higher quantities of tailings produced.
During the last week of the year a total of about 0.8 million m3 of tailings was deposited in the newly operational South Expansion Area.
In 2009, over 83 per cent (74.2 million m3) of the MRM’s water needs were met using water reused from our tailings pond.
mOnitOringThe ETF is constructed from coarse sands that, over time, compact and drain small amounts of tailings water. This seepage is captured by drains, redirected to a seepage collection pond and returned to the ETF. Shell monitors the surrounding groundwater to ensure this collection system is functioning properly.
There are 26 monitoring wells in the tailings pond seepage monitoring program, which includes seven new wells drilled around the ETF in 2009. WildlifeIn 2009, as part of Shell’s commitment to continual improvement, an environmental specialist dedicated to wildlife, as well as three
seasonally hired contractors, assisted with the operation of our on-demand Bird Avert avian deterrent system. New land-based acoustic deterrents placed in the latter part of the 2008 season were also used to improve system performance in 2009. While avian mortalities in 2009 increased to 18 from 14 in 2008, they were lower than our five year average of 21.8. Mortalities in 2009 were attributed to contact with bitumen, electrocution, vehicular collision and building collision.
directiVe 074In 2009, the Alberta Energy Resources Conservation Board (ERCB), issued a new tailings directive, designed to reduce the amount of fluid fine tailings and optimise the timing of reclamation. While the directive did not affect tailings management in 2009, it will impact how we manage tailings in 2010 and beyond.
Directive 074 is technically challenging. While we have made substantial investments in tailings research and technologies, at the time of publishing this report, the assessment by the ERCB of Shell’s tailings plan submissions was pending so no assurance can be provided that we will be in full compliance with Directive 074 by the end of 2010.
mOre infOrmatiOnIssues and Opportunities - Tailings
After oil sands ore is excavated from the ground, warm water is added to wash the bitumen off the sand and clay. The water and solids that remain are referred to as tailings, which consist of water, coarse sand, silt and clay particles and small amounts of bitumen. Tailings are toxic and as a result we continually monitor, assess and manage them to protect water and wildlife.
Shell’s tailings management plan addresses all issues related to tailings, from planning activities before operations begin to the final placement of these materials in a reclaimed landscape. In addition to progressive reclamation activities conducted throughout the life of our operations, management plans call for the efficient recovery of bitumen and warm water from tailings to make the best use of our resources and include systems designed to manage seepage and deter wildlife from entering our tailings facilities.
At the end of 2009, a 2 km2 extension to the southern end of the External Tailings Facility (ETF) was completed. Shell’s tailings facilities now occupy an area of approximately 14 km2.
05
2005 2006 2007 2008 2009
total Volume of liquid discharged to external tailings facility (million m3) 106.7 89.1 102.5 112.4 118.9
tOtal VOlUme Of tailingS diScHarged tO external tailingS facility
*Liquid discharged to the ETF is the gross volume of water, course sand, silt and clay particles and small amounts of bitumen.
tailingS
06
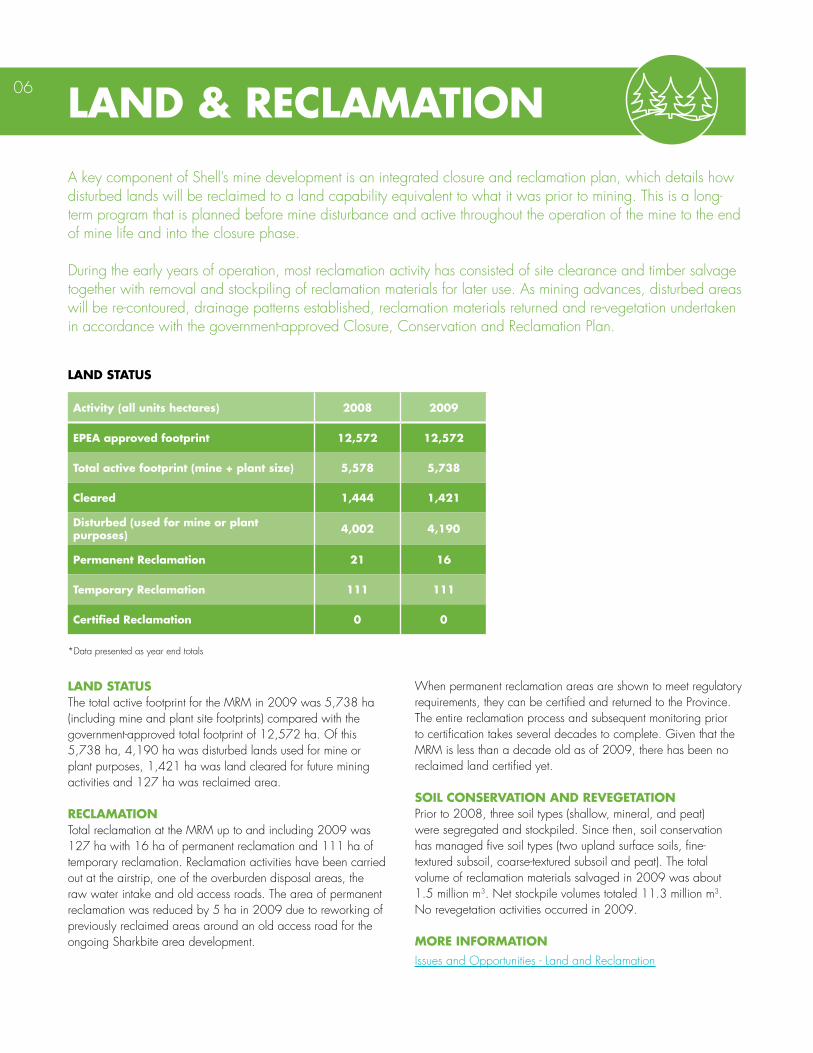
land StatUSThe total active footprint for the MRM in 2009 was 5,738 ha (including mine and plant site footprints) compared with the government-approved total footprint of 12,572 ha. Of this 5,738 ha, 4,190 ha was disturbed lands used for mine or plant purposes, 1,421 ha was land cleared for future mining activities and 127 ha was reclaimed area.
reclamatiOn Total reclamation at the MRM up to and including 2009 was 127 ha with 16 ha of permanent reclamation and 111 ha of temporary reclamation. Reclamation activities have been carried out at the airstrip, one of the overburden disposal areas, the raw water intake and old access roads. The area of permanent reclamation was reduced by 5 ha in 2009 due to reworking of previously reclaimed areas around an old access road for the ongoing Sharkbite area development.
When permanent reclamation areas are shown to meet regulatory requirements, they can be certified and returned to the Province. The entire reclamation process and subsequent monitoring prior to certification takes several decades to complete. Given that the MRM is less than a decade old as of 2009, there has been no reclaimed land certified yet.
SOil cOnSerVatiOn and reVegetatiOnPrior to 2008, three soil types (shallow, mineral, and peat) were segregated and stockpiled. Since then, soil conservation has managed five soil types (two upland surface soils, fine- textured subsoil, coarse-textured subsoil and peat). The total volume of reclamation materials salvaged in 2009 was about 1.5 million m3. Net stockpile volumes totaled 11.3 million m3. No revegetation activities occurred in 2009.
mOre infOrmatiOnIssues and Opportunities - Land and Reclamation
land & reclamatiOnA key component of Shell’s mine development is an integrated closure and reclamation plan, which details how disturbed lands will be reclaimed to a land capability equivalent to what it was prior to mining. This is a long-term program that is planned before mine disturbance and active throughout the operation of the mine to the end of mine life and into the closure phase.
During the early years of operation, most reclamation activity has consisted of site clearance and timber salvage together with removal and stockpiling of reclamation materials for later use. As mining advances, disturbed areas will be re-contoured, drainage patterns established, reclamation materials returned and re-vegetation undertaken in accordance with the government-approved Closure, Conservation and Reclamation Plan.
activity (all units hectares) 2008 2009
ePea approved footprint 12,572 12,572
total active footprint (mine + plant size) 5,578 5,738
cleared 1,444 1,421
disturbed (used for mine or plant purposes) 4,002 4,190
Permanent reclamation 21 16
temporary reclamation 111 111
certified reclamation 0 0
land StatUS
*Data presented as year end totals
cOmmUnity 07
2009 HigHligHtS• Contracts to Aboriginal companies worth $222 million. • AOSP joint venture partners invested over $2.3 million in social programs.• Through the Shell Community Service Fund, 60 Shell Albian
Sands and Scotford employees volunteered more than 6,600 hours, resulting in almost $60,000 contribution to various local not-for-profit organizations.
• Shell Albian Sand’s United Way campaign raised over $650,000 (employee pledges, and fundraising activities plus corporate match) to support a range of programs and social and health service agencies.
• Contributed $5 million towards a new Fort McKay Elder and Day Care Centre.
aBOriginal ecOnOmic deVelOPmentIn 2009, about $222 million of AOSP’s total local spending went to purchase supplies and services from Aboriginal companies. One example was a catering, housekeeping and maintenance contract for Albian Village which accommodates 2,500 workers on Shell’s oil sands mining sites. The total spend with Aboriginal companies since the AOSP began operating stands at more than $800 million.
fOrt mckay elder and day care centreAfter a fire destroyed the original Fort McKay Elder and Day Care Centre building in 2007, the community and Shell worked together to rebuild it with the AOSP joint venture partners contributing $5 million towards construction. The new building, officially opened in December 2009, acts as a gathering place
and provides programs for Elders and children such as cultural activities, arts and crafts, cooking and fitness classes. Significantly, the centre was built using Fort McKay’s in-house construction team, thereby building capacity and skills in the community.
fOrt cHiPeWyan aWqa dayFort Chipewyan community members, Elders and students from Athabasca Delta Community School joined Shell Canada representatives in May to participate in Alberta Water Quality Awareness (AWQA) Day. AWQA Day is a provincial program focusing on increasing awareness and understanding of water quality and watershed health through hands-on water quality testing. Highlights of the outing included learning how to use water quality test kits, observing a wide variety of species and the opportunity for the students to interact with and learn from the Elders.
ScOtfOrd cOmmUnity grOUndtrUtHingAs part of Shell Scotford’s regulatory requirements, a process of groundtruthing (information gathering) is done every two years. This enables an update on new residents and businesses in the site’s emergency planning zone within the surrounding Strathcona and Sturgeon Counties, as well as giving an opportunity to gauge neighbours’ concerns. The 2009 survey indicated significant improvement over the previous one, with only eight per cent of those surveyed reporting any concerns.
mOre infOrmatiOnIssues and Opportunities - Community
Social Performance is the term Shell uses to describe how we manage the impacts of our business on the communities and societies in which we operate. Those impacts can be positive or negative, but how well we manage them affects the wellbeing of our neighbours and ultimately of our business.
Shell has an ongoing dialogue with stakeholders and seeks appropriate ways to contribute to communities in the vicinity of our operations and planned future developments. This includes company-wide social investment programs such as the United Way, Shell Community Service Fund and Shell Environmental Fund as well as oil sands business support for local economic development and capacity building.
glOSSary08
aOSP The Athabasca Oil Sands Project, a joint venture among Shell Canada Limited (60%), Chevron Canada Limited (20%) and Marathon Oil Canada Corporation (20%). The AOSP consists of the Muskeg River and Jackpine Mines located north of Fort McMurray, Alberta and the Scotford Upgrader, located near Edmonton, Alberta.
BBl Barrel.
B/d Barrels per day.
BitUmen Bitumen is best described as a thick, sticky form of crude oil, so heavy and viscous that it will not flow unless heated or diluted with lighter hydrocarbons. At room temperature, it is much like cold molasses. Technically speaking, bitumen is a tar-like mixture of petroleum hydrocarbons with a density greater than 960 kilograms per cubic metre; light crude oil, by comparison, has a density as low as 793 kilograms per cubic metre. (Source: Government of Alberta, Department of Energy)
certified reclamatiOn Reclaimed areas for which a certifi-cate has been issued under the terms of the Alberta Environmental Protection and Enhancement Act (EPEA) , signifying that the terms and conditions of the EPEA approval have been complied with and the lease is returned to the Crown.
climate cHange and emiSSiOnS management fUnd The fund set up under the Climate Change and Emissions Management Act that is used to support research, development and deployment of transformative change technologies to reduce greenhouse gas emissions in Alberta. (Source: Specified Gas Emitters Regulation)
cO2e The 100-year time horizon global warming potential of a specified gas expressed in terms of equivalency to CO2. (Source: Specified Gas Emitters Regulation)
cOgeneratiOn Combined production of heat for use in industrial facilities and the production of electricity as a by-product. (Source: Specified Gas Emitters Regulation)
direct emiSSiOnS The release of specified gases from sources under the direct control of the operating facility expressed in tonnes CO2e.
emiSSiOnS intenSity the quantity of specified gases released by a facility per unit of production from that facility.
emiSSiOn OffSet A reduction in one or more specified gases (regulated greenhouse gas emissions) occurring at sites not covered by the Specified Gas Emitters Regulation. (Source: Specified Gas Emitters Regulation)
emiSSiOn PerfOrmance credit Generated when a facility reduces its Net Emissions Intensity below its Net Emissions Intensity Limit. EPCs are awarded on a tonne CO2e reduction basis. (Source: Specified Gas Emitters Regulation)
gJ Gigajoule. A term used to measure energy use equal to one billion joules.
greenHOUSe gaS (gHg) Mainly, carbon dioxide (CO2), methane (CH4), and nitrous oxide (N2O), all of which contribute to the warming of the Earth’s atmosphere. (Source: Government of Alberta, Department of Energy)
ha – Hectare. A unit of surface area equal to a square that is 100 metres on each side.
km2 – Square kilometre. A unit of surface area equal to a square that is one kilometre on each side.
m3 – Cubic metre. A unit of volume or capacity equal to 1000 litres.
mt – Megatonne. A unit of mass equal to one million tonnes.
net emiSSiOnS intenSity (nei) A facility’s Total Annual Emissions minus true-up options used (Offsets, EPCs, or Fund Contributions) divided by the facility’s total annual production expressed in appropriate units. (Source: Specified Gas Emitters Regulation)
net emiSSiOnS intenSity limit (neil) A facility’s maximum net emissions intensity permitted under the Specified Gas Emitters Regulation. (Source: Specified Gas Emitters Regulation)
Permanent reclamatiOn Landform construction and contouring, placement of capping and reclamation materials and revegetation for terrestrial or wetlands areas. Land cannot be listed under the permanent reclamation category until revegetation has occurred that is reflective of the approved Reclamation Plans.
reclamatiOn Returning disturbed land to a land capability equivalent to what it was prior to mining. Reclaimed property is returned to the province of Alberta at the end of operations.
SeePage The slow movement of water or other fluids through a process medium (e.g., tailings), or through small openings in the surface of unsaturated soil.
SOcial PerfOrmance How Shell manages the impacts of our business on the communities and societies in which we operate.
SPecified gaS emitterS regUlatiOn Regulates six GHG species – carbon dioxide (CO2), methane (CH4), nitrous oxide (N2O), PFCs, HFCs, and sulphur hexafluoride (SF6) – for facilities emitting over 100,000 tonnes of CO2 per annum in Alberta. SyntHetic crUde Oil A mixture of hydrocarbons, similar to crude oil, derived by upgrading bitumen from oil sands.
tailingS The residual by-product that remains after the bitumen is separated from the mined oil sands ore; tailings are composed of residual bitumen, water, sand, silt and clay particles.
temPOrary reclamatiOn Includes seeding, planting or natural regrowth of vegetation in areas slated to be re-disturbed by future mining or construction activities. This is often done to control erosion and achieve slope stability.
tOtal gHg emiSSiOnS Includes GHG emissions from direct and indirect sources.
cautionary note The companies in which Royal Dutch Shell plc directly and indirectly owns investments are separate entities. In this report “Shell”, “Shell group” and “Royal Dutch Shell” are sometimes used for convenience where references are made to Royal Dutch Shell plc and its subsidiaries in general. Likewise, the words “we”, “us” and “our” are also used to refer to subsidiaries in general or to those who work for them. These expressions are also used where no useful purpose is served by identifying the particular company or companies. ‘‘Subsidiaries’’, “Shell subsidiaries” and “Shell companies” as used in this report refer to companies in which Royal Dutch Shell either directly or indirectly has control, by having either a majority of the voting rights or the right to exercise a controlling influence. The companies in which Shell has significant influence but not control are referred to as “associated companies” or “associates” and companies in which Shell has joint control are referred to as “jointly controlled entities”. In this report, associates and jointly controlled entities are also referred to as “equity-accounted investments”. The term “Shell interest” is used for convenience to indicate the direct and/or indirect (for example, through our 34% shareholding in Woodside Petroleum Ltd.) ownership interest held by Shell in a venture, partnership or company, after exclusion of all third-party interest. This report contains forward-looking statements concerning the financial condition, results of operations and businesses of Royal Dutch Shell. All statements other than statements of historical fact are, or may be deemed to be, forward-looking statements. Forward-looking statements are statements of future expectations that are based on management’s current expectations and assumptions and involve known and unknown risks and uncertainties that could cause actual results, performance or events to differ materially from those expressed or implied in these statements. Forward-looking statements include, among other things, statements concerning the potential exposure of Royal Dutch Shell to market risks and statements expressing management’s expectations, beliefs, estimates, forecasts, projections and assumptions. These forward-looking statements are identified by their use of terms and phrases such as ‘‘anticipate’’, ‘‘believe’’, ‘‘could’’, ‘‘estimate’’, ‘‘expect’’, ‘‘intend’’, ‘‘may’’, ‘‘plan’’, ‘‘objectives’’, ‘‘outlook’’, ‘‘probably’’, ‘‘project’’, ‘‘will’’, ‘‘seek’’, ‘‘target’’, ‘‘risks’’, ‘‘goals’’, ‘‘should’’ and similar terms and phrases. There are a number of factors that could affect the future operations of Royal Dutch Shell and could cause those results to differ materially from those expressed in the forward-looking statements included in this report, including (without limitation): (a) price fluctuations in crude oil and natural gas; (b) changes in demand for the Shell’s products; (c) currency fluctuations; (d) drilling and production results; (e) reserve estimates; (f) loss of market share and industry competition; (g) environmental and physical risks; (h) risks associated with the identification of suitable potential acquisition properties and targets, and successful negotiation and completion of such transactions; (i) the risk of doing business in developing countries and countries subject to international sanctions; (j) legislative, fiscal and regulatory developments including regulatory measures addressing climate change; (k) economic and financial market conditions in various countries and regions; (l) political risks, including the risks of expropriation and renegotiation of the terms of contracts with governmental entities, delays or advancements in the approval of projects and delays in the reimbursement for shared costs; and (m) changes in trading conditions. All forward-looking statements contained in this report are expressly qualified in their entirety by the cautionary statements contained or referred to in this section. Readers should not place undue reliance on forward-looking statements. Additional factors that may affect future results are contained in Royal Dutch Shell’s 20-F for the year ended December 31, 2009 (available at www.shell.com/investor and www.sec.gov ). These factors also should be considered by the reader. Each forward-looking statement speaks only as of the date of this report, July 8, 2010. Neither Royal Dutch Shell nor any of its subsidiaries undertake any obligation to publicly update or revise any forward-looking statement as a result of new information, future events or other information. In light of these risks, results could differ materially from those stated, implied or inferred from the forward-looking statements contained in this report.

yOUr inPUt iS imPOrtant tO US.
We’d like to hear your thoughts about Canada’s oil sands, Shell’s activity in this sector, and this brochure series. We hope you’ll take a few minutes to complete this feedback form and send it back to us.
If you’d rather provide your input online, e-mail us at [email protected]
Which of our canada’s Oil Sands – issues and Opportunities brochures have you read?o Carbon Dioxide o Community o Economics o Water o Tailings o Land and Reclamation o 2009 Oil Sands Perormance Report
Where did you get the brochure(s)o Shell open house o Other event (please specify) o Shell head office o Shell field office o Passed on from a friend o Other (please specify)
How useful did you find the information?o Very useful o Somewhat useful o Not at all useful
did the brochure increase your level of understanding about the oil sands?o Yes, a lot o Yes, a little o No, not very much o No, not at all
Why or why not?
What additional questions do you have, or information would you like?
any other comments?
Thank you for your time.
If you would like to receive a reply to your questions, or more information, please provide us with your contact information.Name: email address:Mailing Address:Phone number: ( )
Please send your completed form to:Shell canada limited400 - 4th avenue S.W.calgary, albertat2P 0J4attention: Oil Sands communications
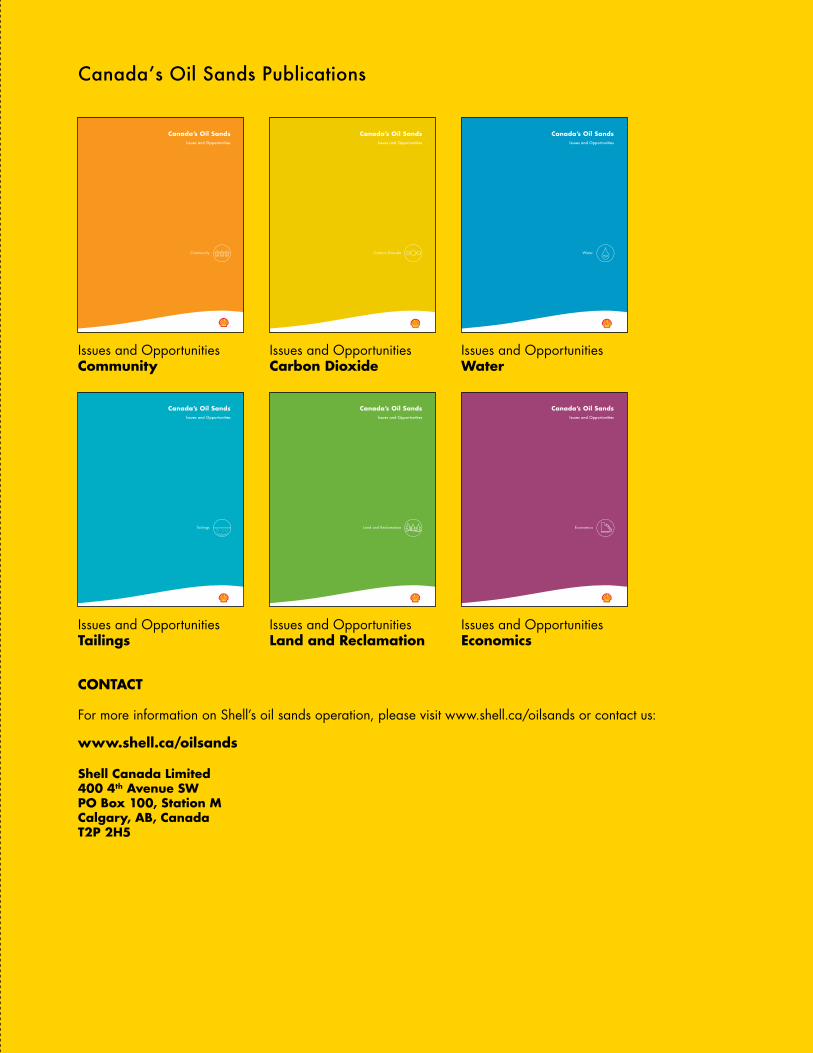
Canada’s Oil Sands Publications
Issues and Opportunitiescommunity
Issues and Opportunitiescarbon dioxide
Issues and OpportunitiesWater
Issues and Opportunitiestailings
Issues and Opportunitiesland and reclamation
Issues and Opportunitieseconomics
cOntact
For more information on Shell’s oil sands operation, please visit www.shell.ca/oilsands or contact us:
www.shell.ca/oilsands
Shell canada limited400 4th avenue SWPO Box 100, Station mcalgary, aB, canadat2P 2H5
Related Documents