Oil Prices and Stock Prices of Alternative Energy Companies: Time Varying Relationship with Recent Evidence Alex YiHou Huang * Department of Finance, Yuan Ze University, Taiwan Chiao-Ming Cheng Graduate School of Management, Yuan Ze University, Taiwan Chih-Chun Chen Graduate School of Management, Yuan Ze University, Taiwan Wen-Cheng Hu Graduate School of Management, Yuan Ze University, Taiwan Abstract This paper examines the recent interactive relationships between crude oil prices and stock performances of alternative energy companies. The examination was conducted from 2001 to mid 2010, and the sample period is divided into three sub-periods according to two Middle East wars. Different dynamics of oil prices across these sub-periods are significantly documented for the first time. By method of vector autoregression model, oil prices and stock indices of alternative energy sector were found independent from each other only before late 2006. In the recent years, oil prices become significantly responsible for the stock performances of alternative energy companies. This finding suggests that the stock market investors of alternative energy sector incorporate oil price shocks into their trading decisions only recently. The oil prices and stock index of oil companies also found to be interdependent with each other during recent years. Keywords: Crude oil price; Alternative energy; Oil stock index; VAR JEL Classifications: Q43; P28; G10 * Corresponding author: Assistant professor, Department of Finance, Yuan Ze University, 135 Yuan-Tung Road, Chung-Li, Taoyuan 32003, Taiwan. Email: [email protected]. Phone: 886-3-4638800 ext. 2668. Fax: 886-3-4354624. Huang gratefully acknowledges support from the National Science Council of Taiwan (NSC98-2410-H-155-025).

Welcome message from author
This document is posted to help you gain knowledge. Please leave a comment to let me know what you think about it! Share it to your friends and learn new things together.
Transcript
Oil Prices and Stock Prices of Alternative Energy Companies: Time Varying Relationship with Recent Evidence
Alex YiHou Huang* Department of Finance, Yuan Ze University, Taiwan
Chiao-Ming Cheng
Graduate School of Management, Yuan Ze University, Taiwan
Chih-Chun Chen Graduate School of Management, Yuan Ze University, Taiwan
Wen-Cheng Hu
Graduate School of Management, Yuan Ze University, Taiwan
Abstract
This paper examines the recent interactive relationships between crude oil prices and stock
performances of alternative energy companies. The examination was conducted from 2001
to mid 2010, and the sample period is divided into three sub-periods according to two
Middle East wars. Different dynamics of oil prices across these sub-periods are significantly
documented for the first time. By method of vector autoregression model, oil prices and
stock indices of alternative energy sector were found independent from each other only
before late 2006. In the recent years, oil prices become significantly responsible for the stock
performances of alternative energy companies. This finding suggests that the stock market
investors of alternative energy sector incorporate oil price shocks into their trading decisions
only recently. The oil prices and stock index of oil companies also found to be
interdependent with each other during recent years.
Keywords: Crude oil price; Alternative energy; Oil stock index; VAR JEL Classifications: Q43; P28; G10
* Corresponding author: Assistant professor, Department of Finance, Yuan Ze University, 135 Yuan-Tung Road, Chung-Li, Taoyuan 32003, Taiwan. Email: [email protected]. Phone: 886-3-4638800 ext. 2668. Fax: 886-3-4354624. Huang gratefully acknowledges support from the National Science Council of Taiwan (NSC98-2410-H-155-025).
1. Introduction
Oil is the primary energy source in modern economies. For example, the average daily
global consumption of crude oil in 2008 was 8.5 billion in US dollar, which was higher than
any other type of energy.1 However, recently, the development of alternative energy has
gained immense popularity because of the recognition of environmental protection and
political instability of oil export countries (e.g., Bleischwitz and Fuhrmann, 2006; McDowall
and Eames, 2006). Therefore, the relationship between oil price and alternative energy
industry in recent years requires close examination.
Henriques and Sadorsky (2008) found that oil prices and stock prices of alternative
energy companies do not interact with each other, where the trend of alternative energy stock
index is significantly linked with that of technology stock prices. Choi and Hammoudeh
(2009) showed that oil prices are better modeled with the nonlinear ARFIMA and structural
breaks have partially reduced the persistence of oil price returns. Chiou and Lee (2009)
documented significant structural change in recent oil price and showed that the impacts
from oil to stock prices are dynamical and asymmetrical. This study extends this line of
research and focuses on the recent interaction between oil prices and financial performances
of alternative energy companies in recent years. The stock performances of oil industry are
also considered to interact with the two variables, where prior studies suggested their
significant relations (Osmundsen, et al. 2006). In addition, since oil prices have fluctuated
significantly in recent years and have been affected by the two Middle East wars (i.e., the
Iraq and Lebanon Wars), the empirical examination of this research is applied with three
different time segments according to the period of said wars.2 Our findings show that oil
prices apparently behaved differently across these sub-periods, as well as the
inter-relationships between oil prices, stock prices of alternative energy companies, and
stock prices of oil industry. This paper also finds that owing to the recent developments and
attentions of green energy, and oil price had its most volatile state in history;3 the stock
prices of alternative energy companies become depending on crude oil price dynamics.
This study differs with previous studies in several aspects. One, it provides the first
1 Statistical Review of World Energy (June 2009), the British Petroleum Corporation 2 Detailed description of time period segmentation is provided in Section 3. The trend of oil price and summary statistics of oil price for the entire sample period, as well as for the three sub-periods, can be found in Figure 1 and Table 2. 3 During this period, the oil price of West Texas Intermediate (WTI) reached its highest in history at $143.74 in July 2, 2008 and dropped to $32.94 in December 24, 2008. In September 30, 2009, the WTI bounced back to $66.56. Data are extracted from the Thomson Datastream database.
Page 2 of 21

empirical examination on the interactive relationships between oil prices, stock performance
of alternative energy firms, and stock performances of oil companies covering the recent
period of economic recession. Two, this study shows apparent different dynamics of oil
prices before and after the two Middle East wars. Three, consistent with previous studies,
this paper shows that the interactions between oil prices and stock prices of alternative
energy firms are insignificant prior to the Lebanon War in 2006; however, they become
significant after 2006. These findings, the first in literature, should be of use to investors and
policy makers.
The rest of the paper is organized as follows: Section 2 reviews literatures; Section 3
discusses the methodology and data; Section 4 presents the empirical outcomes; and the last
section concludes the research.
2. Literature Review
Since the Industrial Revolution, the impacts of crude oil production on global economy
have been highly significant. Hamilton (1983) and Gisser and Goodwin (1986) showed
significant negative effects of oil shock on macroeconomic conditions. Sadorsky (1999)
found significant impacts on economic activities from oil price shock and concluded that oil
price movement is an important explanatory factor to stock return. Balke et al. (2002)
studied asymmetric effects of oil shocks on US economic activities. Jones et al. (2004)
examined empirical relationships between oil price shocks and macroeconomic variables.
Nandha and Faff (2008) further documented the complexities of crude oil price, and their
results showed that oil derivatives generated wider effects on economic conditions than
expected.
In particular, many prior studies have confirmed the significant and direct relationship
between oil price and stock performance of oil companies. Huang et al. (1996) found
significant interactions between oil price and stock returns of major US oil companies during
1980s under the framework of vector autoregressive (VAR) model, as well as insignificant
relationships between oil price and the S&P500 index return. Sadorsky (2001) documented
oil price as a major risk factor in stock returns of Canadian oil and natural gas companies
using a multifactor market model. In addition to oil price, Boyer and Filion (2007) further
showed that reserves of oil, volume of oil production, and drilling success rate also serve as
key factors in explaining the stock prices of Canadian energy companies. Cong et al. (2008)
Page 3 of 21
provided evidence of the significant impacts of oil shocks on the stock returns of oil
companies, and they also found that higher oil price volatility contributed to positive returns
of mining and petrochemical stock indices.
The economic development triggered by oil production has generated intense impacts
on the global environment. Glick (2004) showed a significant increase of the atmospheric
CO2 concentration from 275 to 375 ppm during the past 140 years, where CO2 concentration
had remained unchanged for the previous 1,000 years. Duncan (2006) argued that higher
atmospheric CO2 concentration is one major cause of global warming, and discussed the
possibility of reducing carbon emission by excising carbon tax. In addition to recent oil price
jumps, the understanding of environmental protection significantly contributes to the
development of alternative energy in recent years. In 1980, the global consumption of
alternative energy was 1,753 billion kWh; in 2007, such consumption reached 3,472 billion
kWh, a 98% increase.4 The US Economic Report of the President in 2006 concluded,
“In the long run, households and businesses respond to higher fuel prices by cutting
consumption, purchasing products that are more efficient, and switching to alternative
energy sources. Higher energy prices also encourage entrepreneurs to invest in the research
and development of new energy-conserving technologies and alternative fuels, further
expanding the opportunities available to households and businesses to reduce energy use
and switch to low-cost sources…”
While high oil price has allowed the use of alternative energy to receive great deal of
attention, larger oil price volatility creates greater challenges for oil-related analyses. Basher
and Sadorsky (2006) showed that different levels of oil price volatility would result in
various impacts on economic activities and stock markets, and Kilian (2009) argued that the
global demand shocks contribute to higher oil price volatility. Aguilera et al. (2009) provided
evidences showing that petroleum resources are likely to last longer than oil market
expectation, where the idea of depletion needed not drive the oil prices at their high levels
during 2007-2008. Moreover, since many major oil-exporting countries are Middle East
sovereign states, the instabilities or conflicts in the region have created significant impacts
on oil prices.5 For instance, the WTI jumped by 86% from $16.10 to approximately $30
immediately after the occupation of Kuwait by Iraq in 1990.
4 Data source: Energy Information Administration (EIA). 5 The Middle East region holds 60% of global oil reserve and 32% of current oil production. Data source: Energy Information Administration (EIA), http://www.eia.doe.gov/. See the article, “As the price of oil soars, so does its power to shape politics from Washington to Beijing,” (New York Times, July 25, 2006), http://www.nytimes.com/2006/07/25/world/middleeast/25oil.html.
Page 4 of 21
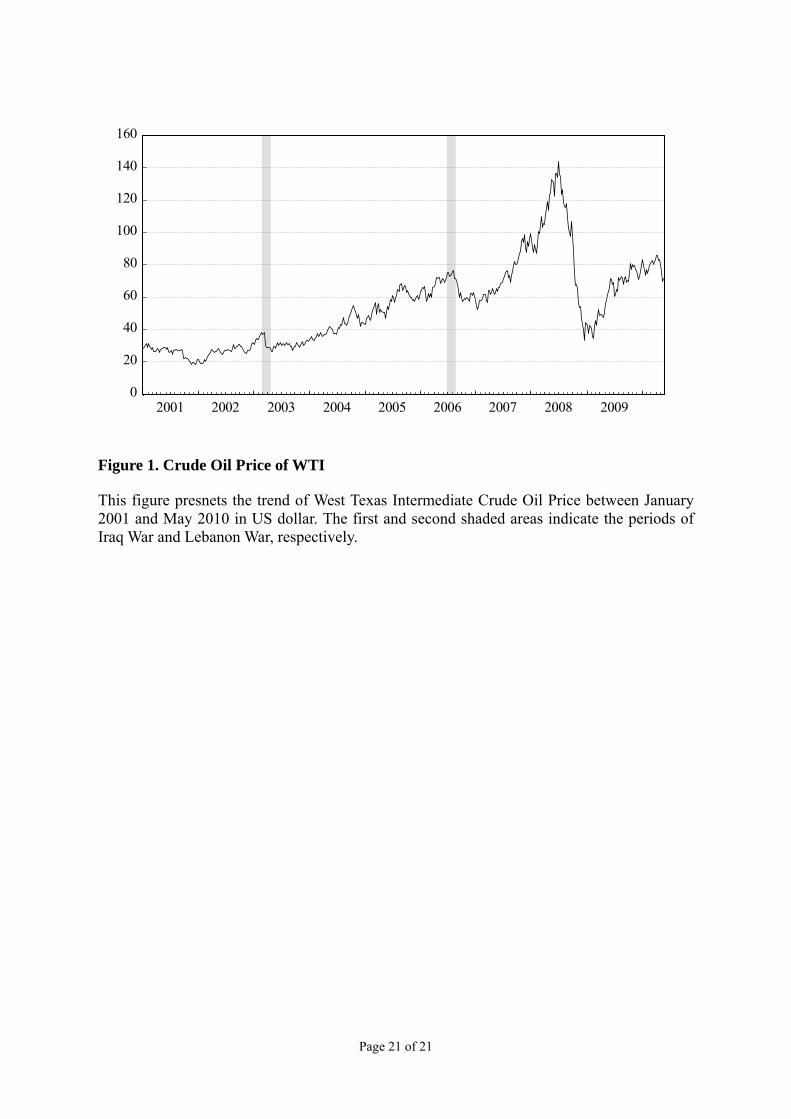
Figure 1 illustrates the oil price of West Texas Intermediate (WTI) between January
2001 and May 2010. The two shaded areas indicate the periods of Iraq and Lebanon Wars.
The figure shows that the WTI oil price before the 2002 Iraq War was generally stable
between $20 and $40. However, after the Iraq War, the change in oil price showed a
significantly upward and stable trend, reaching nearly $80. After the Lebanon War of 2006, a
small drop of oil price was first observed, followed by a dramatic jump up to more than $140
within two years. The price then crashed below $40 in late 2008; such severely volatile oil
price confirmed the recent structural changes in oil price dynamics (Chiou and Lee, 2009).
The summary statistics of oil price between these three periods are provided in Table 1.
These statistics are discussed in detail in the next section, confirming the observations in
Figure 1.
3. Methodology and Data 3.1 Vector Error Correction Model
This study adopts the VAR or vector error correction model (VECM) by Johansen
(1991) in order to examine the interdependencies between crude oil prices, stock index of
alternative energy companies, and stock index of oil industry. Kilian (2010) applied VAR to
investigate the relationship between gasoline price in the US and crude oil prices. VAR or
VECM are maximum likelihood estimation model allowing full information to be diagnosed
in a single stage of regression. Maysami and Koh (2000) documented the reliability of the
VECM, and many prior studies have commonly adopted the method in analyzing the
dynamics of economic and financial time series (Enders, 2004). VECM can be shown as
∑−
=−− ++′+ΔΓ=Δ
1
1
k
itktjtjt XXX εμβα , (1)
where variable is an n vector of endogenous variables with same order of integration; ∆
represents the first difference; shows the lag length;
tX
k jΓ is an n × n matrix of
coefficients to be estimated; and μ and εt are the intercept vector and i.i.d. error term,
respectively. In addition, α is an n × r matrix showing the speed of correction and β is the
cointegrated matrix.
VECM can be seen as a first-difference version of VAR model and is applied when each
variable of regression is integrated with an order of 1. Therefore, prior to the application of
VAR or VECM, proper tests of stationarity and cointegration must be conducted. In this
Page 5 of 21

study, both Augmented Dickey-Fuller (ADF) and Phillips-Perron (PP) unit root tests are used
for test of stationarity, and the Johansen cointegration test is applied to investigate if the
target I(1) variables exhibited long-term relationships. Under the Johansen test, both trace
and maximum eigenvalue statistics are composed.6 In addition, under the framework of
VAR/VECM, the Granger Causality test is also conducted to evaluate the empirical
outcomes.7
3.2 Data
Three oil price series are used in this study: the spot prices of West Texas Intermediate
(WTI), spot prices of Brent (Brent), and NYMEX Crude Futures (Futures). The first two
spot prices of oil have been widely applied in literature (e.g., Hammoudeh et al., 2004;
El-Sharif et al., 2005; Scholtens and Wang, 2008; and Cong et al., 2008). Sadorsky (2001)
and Scholtens and Wang (2008) argued that futures price of oil better reflects the value of
crude oil because spot prices can easily be driven by short-term supply-demand shocks.
Following Huang et al. (1996) and Hammoudeh and Li (2005), the NYMEX futures price of
oil is adopted in this study.
Following Henriques and Sadorsky (2008), the WilderHill Clean Energy Index (ECO)
is applied to represent the stock performance of alternative energy companies. The ECO
index is the first stock index to focus on clean energy-related firms. All the components of
the index must have at least one business concentration that produces or develops
environmentally friendly energy.8 Following Sadorsky (2008), the crude oil stock index of
American Stock Exchange is used to proxy the financial performance of oil companies,
where the index is comprised of the stock prices of 12 global oil companies.
The data period spans January 3, 2001 to May 31, 2010, and all data are extracted from
the Thomson Datastream database. Weekly data are comprised from original daily
frequencies, using the Wednesday price to avoid holidays. In case of holiday falling on a
Wednesday, Thursday data are used. The two wars that separate the sample period are the
Iraq War (a.k.a. the Second Gulf War) in March 2003 and the Lebanon War (a.k.a. the
Israel-Hezbollah War) in July 2006. In order to avoid extreme volatile movements of oil
6 See Johansen (1988) and Johansen and Juselins (1990) for detailed descriptions. 7 See Granger (1969) for details. 8 There are currently 40 components covered in ECO index, composed according to US dollar. Detailed descriptions of the index are shown at www.wilderhill.com.
Page 6 of 21

prices during the two Middle East wars, a four-month period during the war is omitted from
the empirical application.
Table 1 provides summary statistics for the variables of both spot prices of oil, WTI and
Brent, futures price of oil (Futures), ECO index, and the stock index of oil industry (Oil
index). The statistics are shown for the entire sample period, as well as the three sub-periods.
The statistics for the spot prices and futures price of crude oil are close, with similar mean,
median, standard deviation, skewness, and kurtosis across periods. When the statistics of oil
prices across time periods are compared, using WTI as an example, the standard deviations
are 4.01, 13.54, and 23.41 for Periods I, II, and III, respectively, with coefficients of
variation (CVs) of 0.15, 0.28, and 0.30 respectively for the three sub-periods. Moreover, the
differences between maximum and minimum of WTI are 19.58, 46.02, and 110.80 for
Periods I, II, and III, respectively. Such statistics show the volatilities and ranges of oil prices
increase from Periods I to III. In addition, the skewness of WTI is -0.04, 0.14, and 0.77 for
Period I, II, and III, respectively, implying that the price structures of oil are different across
the three periods. In sum, we can see that the oil prices are relatively stable in Period I
(lowest CV), grows gradually in Period II (skewed to the right), and fluctuates most strongly
in Period III (highest CV and range). This observation is consistent with Figure 1.
The ECO index also exhibits different dynamics across the sub-periods. For example,
the CVs of the index are 0.30, 0.19, and 0.38 with skewness of 0.16, 0.79, and 0.05 for
Periods I, II, and III, respectively. Such trend shows that the alternative energy stock index is
least volatile in Period II but yet most skewed. In addition to observation where the kurtosis
of the ECO index also apparently differs across the three sub-periods, these statistics imply
that price behaviors for alternative energy stocks vary through time. The Oil index seems to
have an inverse trend of CVs compared to ECO index with the CVs of 0.09, 0.29, and 0.18
for Periods I, II, and III, respectively. Contrary to the oil price, the volatility of Oil index is at
its highest in Period II, rather than Period III.
4. Empirical Results
We first investigate the levels of correlation between the oil prices, alternative energy
stock, and oil stock to understand their simple linear relationships. We then conduct unit root
and cointegration tests for these time series and provide key results based on VAR/VECM
applications.
Page 7 of 21
Table 2 presents the correlation analysis between three variables: oil prices, stock index
of alternative energy companies, and stock index of oil industry. During the full sample
period from January 2001 to May 2010, the correlations between stock index of alternative
energy companies (ECO) and the three oil prices, WTI, Brent, and Futures, are 0.3470,
0.3529, and 0.3464, respectively, and the correlation between the ECO index and Oil index
is 0.4848. At the same time, the correlations between Oil index and the three oil prices, WTI,
Brent, and Futures, are 0.9025, 0.9172, and 0.9036, respectively.
When exploring the correlations in further detail according to sub-periods, for Period I
(pre-Iraq War), the correlations between ECO index and the three oil prices, WTI, Brent, and
Futures, are -0.2240, -0.1748, and -0.2242, respectively. Likewise, for Period I, the
correlations between Oil index and the three oil prices, WTI, Brent, and Futures, are -0.2623,
-0.1698, and -0.2591, respectively. These correlation coefficients are significantly different
from the ones in Periods II and III where the correlations turn positive. The coefficients
between stock indices of oil and ECO indices for Periods I, II, and III are 0.8141, 0.8212,
and 0.9236, respectively, showing a closer relation between the two variables over time. Oil
index and the three oil prices, WTI, Brent, and Futures, are highly correlated in Period II,
with the correlations as 0.9759, 0.9776, and 0.9769, respectively. In general, based on Table
2, the correlations between oil prices and ECO index are smallest in Period I and strongest in
Period II; this is also true for the relationships between oil prices and Oil index. In contrast,
the relationship between Oil index and ECO index becomes tighter from Period I to III.
Table 3 presents the unit root test result for all data series by both ADF and PP statistics.
None of the tests is able to reject the null hypothesis of unit root process for all series in level,
while all tests confirm stationarity for the first differences of the sample series. The results
show that all variables are integrated to an order of 1 during the entire sample period and the
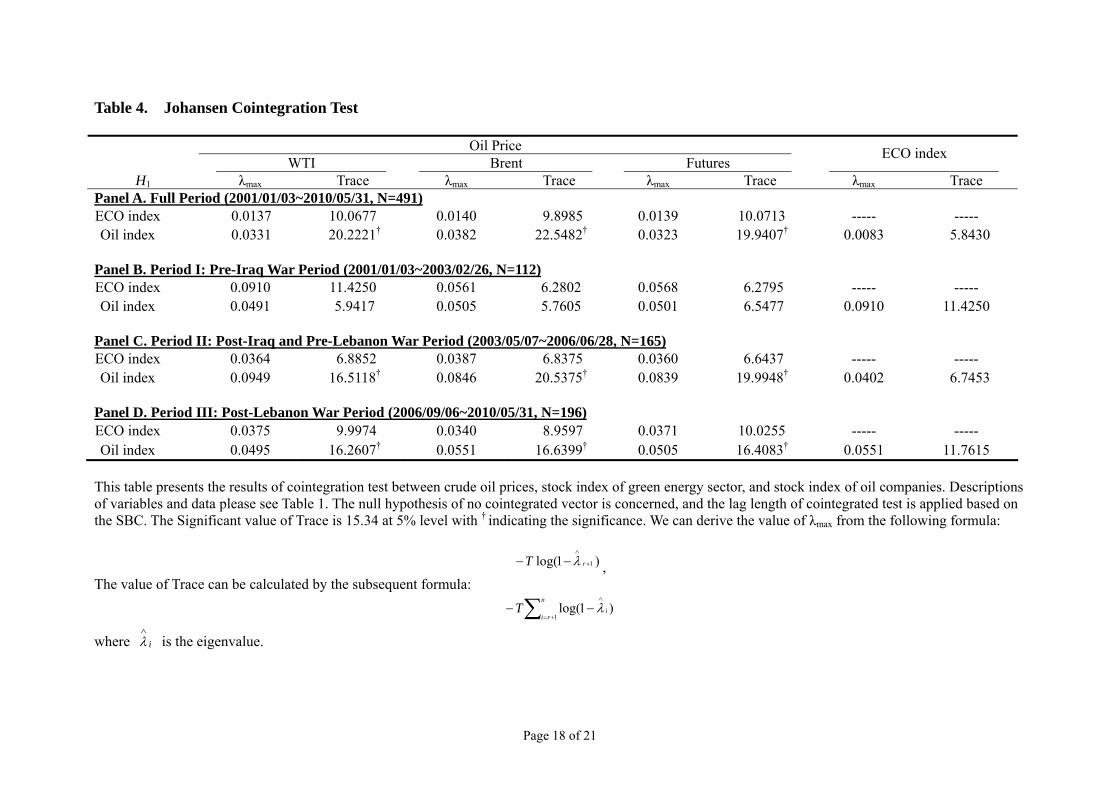
sub-periods. Table 4 presents the cointegration test result based on Johansen statistics.
Between ECO index and oil prices, regardless which sample periods being examined, the
results are not able to reject the null hypothesis of no cointegrarted vector. Therefore, these
two series do not have statistically significant long-term relations. However, between Oil
index and the oil prices, only for Periods II and III, the trace statistics exceed the 5%
significance threshold implying that they are cointegrated during these time periods. The
results of Table 4 suggest that long-term relationships between the targeted variables differ
across periods, requiring different processes of investigation on their interdependencies.
Table 5 presents the VAR/VECM and Granger Causality results. Since oil prices and the
ECO index are both I(1) and not statistically cointegrated, VAR is applied on their first
Page 8 of 21
differences to determine their interactive relationships. The cointegrated series (between oil
prices and Oil index in Periods II and III) are applied with VECM. Granger Causality test is
used for robustness check. The optimal lag length is one, which is selected based on SBC for
all pair of tests, which is consistent to prior empirical studies using weekly data. The first
and second columns of the table are the left-hand-side and right-hand-side variables, with
every two rows estimated under bivariate VAR/VECM framework.
In Panel A of Table 5, the first two rows for the entire sample period show the VAR
outcome between WTI and ECO index. Here, the coefficient estimates are 0.1310 and
0.0482 for vectors of WTI-ECO index, respectively, with only one-way causality from oil
prices to ECO index found positive and statistically significant at 1%. The result shows that
the ECO index has no effects on WTI price, which is confirmed by Granger Causality test
with χ2 as 1.16 (insignificant). This result is consistent with the results of ECO index against
the other two oil prices. In contrast, between WTI and Oil index, interdependence is
significant in two-way causality. For example, the estimated coefficients are -0.3649 and
0.0037, respectively, for the third and fourth rows of Panel A; both are significant at 1%. The
relationships between the other oil two prices (i.e., Brent and Futures) and Oil index are
similar to WTI-Oil index relations with significant negative impacts from Oil index to oil
price and significant positive impacts from oil prices to the Oil index. The last two rows of
Panel A show only mild one-way dependence from ECO index to Oil index during the entire
examination period.
Panel B of Table 5 presents the results for Period I, the pre-Iraq War period, from
January 3, 2001 to February 26, 2003; this is also the period when oil prices are least volatile.
Using the same structure as Panel A, the first two rows show relations between WTI and
ECO index where both coefficients are positive and insignificant. All estimated coefficients
for the oil prices-ECO index vector are statistically insignificant. This finding implies that
the oil prices and alternative energy stock performance did not interact with each other
between 2001 and early 2003. This relationship is also true between oil prices and the Oil
index, where none of the vectors have significant VAR outcomes. The results of Granger
Causality suggest the same observations.
Compared to the results for the entire period, the outcomes of Panel B of Period I
suggest that when oil prices are relatively stable, their impacts on other variables are rather
limited. Boyer and Filion (2007) and Park and Ratti (2008) showed that oil price volatility is
a key factor in stock market operation. Higher uncertainties of oil price movements generate
Page 9 of 21

greater impacts on stock returns. 9 Therefore, when oil prices are rather stable and
inexpensive, the stock performances for both green energy firms and oil companies do not
interact with oil prices. This finding implies that at this low and less volatile oil prices era,
market participants of green energy and oil stocks generally did not need to incorporate
shocks of oil prices into their trading behaviors.
Panel C of Table 5 provides the outcomes for Period II (May 2003 to June 2006), the
time between the Iraq and Lebanon wars. Between oil prices and ECO index, all estimated
coefficients are statistically insignificant. For instance, the first two rows show that the
estimates are -0.0093 and -0.0186 for vectors of WTI-ECO index with p-values as 0.9705
and 0.4724, respectively. Between oil prices and Oil index, however, there is one-way
causality from oil prices to stock index of oil industry, where the significant estimates are
0.0097, 0.0077, and 0.0081 for WTI, Brent, and Futures, respectively. The result is
confirmed by Granger Causality test, and this outcome is different from one in previous
period. In addition, there is also a one-way causality significant at 10% from ECO index to
Oil index during this period. Therefore, not only do the sample series exhibit different
dynamics across the three sub-periods constructed from this study, but their relationships
also change from one period to another.
The outcomes of Panel C suggest that when oil prices gradually rise, they generate
stronger impacts on stock performances of oil industry. Hammoudeh and Li (2005) found
that the increase of oil prices affects the levels of oil export and performances of oil
companies. The stock market investors of oil firms now more closely relate their trading
decisions to the price movements of crude oil, which have higher prices and greater impacts
on the general economic conditions. The stock investors of alternative energy companies, on
the other hand, have not yet response to oil price behaviors. In addition, the investors of oil
stocks also now mildly consider shocks of green energy stocks into their investment
behaviors.
Panel D of Table 5 presents the outcomes for Period III (June 2006 to May 2010;
post-Lebanon War). Between oil prices and the ECO index, there is now a significant
one-way dependence for ECO index on oil prices, found for the first time compared to
previous periods. For instance, the first two rows have the estimated coefficients of 0.1050
and 0.1066 for vector of WTI-ECO index with only second row significant at 1%. Such
result can also be seen in both vectors of Brent-ECO index and Futures-ECO index
9 The total consumption of alternative energy increased by 37% from 2001 to 2008. Data source: Energy Information Administration (EIA) at http://www.eia.doe.gov/.
Page 10 of 21
suggesting that ECO index significantly depends on oil price movements during this period.
Between oil prices and Oil index, highly significant interactive relations with negative
impacts from oil stock to oil prices and positive ones in reverse directions are obtained, also
newly found in this period. Between Oil and ECO indices, one-way significant causality (at
10% level) is found from Oil index to ECO index; this result is contrary to Period II.
The time-varying relations from Panel B to Panel D are consistent with prior studies.
Miller and Ratti (2009) documented significant changes in the relationships between oil
prices and stock market after 1999, and Hamilton (1983) pointed out that changes in the
dynamics of oil prices can have different impacts on key macroeconomic variables.
Therefore, when examining the relations between oil prices and other key variables, using a
period in which oil price dynamics structurally change (such as the results of Panel A for the
entire period) may mislead true relationships.
Only in Period III, after the Lebanon War in 2006, ECO index is found depending on oil
prices. As shown in Figure 1 and Table 1, this is the period when oil prices exhibits highly
drastic movements. This is also the time when financial crisis emerges (thus, the ECO and
Oil indices also become more volatile). This finding implies that investors of alternative
energy companies now pay closer attention on oil price shocks when making their
investment decisions. When oil prices jump and fluctuate, higher demand of green energy
emerges and leads to a better performance of ECO index. In addition, only in this period, the
two-way causality between oil prices and Oil index is observed. This finding suggests not
only must the investors of oil firms closely observe oil price behaviors when conducting
stock trading, but crude oil market participants also start to determine their levels of oil
trading according to the stock performances of oil companies.
5. Conclusions
This study explores the recent interdependent relationship between oil prices and stock
performances of alternative energy companies using the method of VAR/VECM and Granger
Causality test. The examination is conducted separately for three sub-periods, constructed
according to two Middle East wars. The oil price movements significantly differ from one
sub-period to another: oil prices are relatively stable in Period I, grow gradually in Period II,
and fluctuate strongest in Period III. The empirical results show no interdependence between
the oil prices and stock index of green energy companies during Period I. No interactive
relation is found between oil prices and stock index of oil industry neither in the same period.
Page 11 of 21
During Period II, oil prices begin to significantly affect the stock index of oil companies, and
in Period III, the oil prices generate significant impacts on the stock index of green energy
companies, and an interdependent relationship between oil prices and Oil index is
documented.
In sum, while price uncertainty of crude oil rises and green energy gains greater deal of
attention in recent years, the interrelationships between oil prices and stock performances of
alternative energy companies become more significant. For Periods I and II, time before the
Lebanon War from 2001 to late 2006, no causality is shown from oil prices to ECO index or
vice verse, implying that the movements of crude oil prices do not affect how the investors
trade with the stocks of alternative energy industry. In the most recent period, when oil prices
reach historical high and crash back with volatile dynamics, oil price behavior becomes
responsible for stock performances of alternative energy companies. Also only recently, the
dynamics in oil trading also depend on how stocks of oil companies perform. These results
add to literature showing that investors of alternative energy companies conduct their trading
decisions upon observation of crude oil price shocks. The two markets, i.e. crude oil market
and stock market for green energy sector, seem to be more closely interactive with each other.
The full picture of how the crude oil markets react to the development of green energy,
however, requires additional examinations and is certainly an area worthy of future
exploration.
Page 12 of 21

References
Aguilera, R.F., R.G. Eggert, G. Lagos, and J.E. Tilton (2009). “Depletion and the future availability of petroleum resources,” The Energy Journal, 30(1), 141-174.
Andrews, D.W.K. (1991). “Heteroskedasticity and autocorrelation consistent covariance matrix estimation,” Econometrica, 59(3), 817–858.
Balke, N.S., S.P.A. Brown, and M.K. Yucel (2002). “Oil Price Shocks and the U.S. Economy: Where Does the Asymmetry Originate?” The Energy Journal, 23(3), 27-52.
Basher, S.A. and P. Sadorsky (2006). “Oil price risk and emerging stock markets,” Global Finance Journal, 17(2), 224-251.
Bleischwitz, R. and K. Fuhrmann (2006). “Introduction to the special issue on hydrogen in Energy Policy,” Energy Policy, 34(11), 1223-1226.
Boyer, M.M. and D. Filion (2007). “Common and fundamental factors in stock returns of Canadian oil and gas companies,” Energy Economics, 29(3), 428-453.
Chiou, J.S. and Y.H. Lee (2009). “Jump dynamics and volatility: Oil and the stock markets,” Energy, 34(6), 788-796.
Choi, K. and S. Hammoudeh (2009). “Long memory in oil and refined products markets.” The Energy Journal, 30(2), 97-116.
Cong, R.G., Y.M. Wei, J.L. Jiao, and Y. Fan (2008). “Relationships between oil price shocks and stock market: An empirical analysis from China,” Energy Policy, 36(9), 3544-3553.
Duncan, E. (2006). “The heat is on: a survey of climate change,” The Economist 380, 8494 Sept. 9, 2006.
Economic Report of the President, (2006). United States Government Printing Office, Washington, DC.
El-Sharif, I., D. Brown, B. Burton, B. Nixon, and A. Russell (2005). “Evidence on the nature and extent of the relationship between oil prices and equity values in the UK,” Energy Economics, 27(6), 819-830.
Enders, W. (2004). Applied Econometric Time Series, 2nd edition, John Wiley & Sons, New Jersey.
Gisser, M. and T.H. Goodwin (1986). “Crude oil and the macroeconomy: tests of some popular notions,” Journal of Money, Credit and Banking, 18(1), 95-103.
Glick, D. (2004). Geosign, National Geographic, 206(3), 12-33. Granger, C.W.J. (1969). “Investigating causal relations by econometric models and
cross-spectral methods,” Econometrica, 37(2), 424-438. Hamilton, J.D. (1983). “Oil and the Macroeconomy since World War II,” Journal of Political
Economy, 91(2), 228-248. Hammoudeh, S. and H. Li (2005). “Oil sensitivity and systematic risk in oil-sensitive stock
indices,” Journal of Economics and Business, 57(1), 1-21. Hammoudeh, S., S. Dibooglu, and E. Aleisa (2004). “Relationships among U.S. oil prices
and oil industry equity indices,” International Review of Economics and Finance, 13(4), 427-453.
Henriques, I. and P. Sadorsky (2008). “Oil prices and the stock prices of alternative energy companies,” Energy Economics, 30(3), 998-1010.
Huang, R.D., R.W. Masulis, and H.R. Stoll (1996). “Energy shocks and financial markets,” Journal of Futures Markets, 16(1), 1-27.
Johansen, S. and K. Juselius (1990). “Maximum likelihood estimation and inference on cointegration - With applications to the demand for money,” Oxford Bulletin of Economics and Statistics, 52(2), 169-210.
Page 13 of 21
Johansen, S. (1988). “Statistical analysis of cointegration vectors,” Journal of Economic Dynamics and Control, 12(2-3), 231-254.
Johansen, S. (1991). “Estimation and hypothesis testing of cointegration vectors in Gaussian Vector autoregressive models,” Econometrica, 59(6), 1551-1580.
Jones, D.W., P.N. Leiby, and I.K. Paik (2004). “Oil price shocks and the macroeconomy: What has been learned since 1996?” The Energy Journal, 25(2), 1-32.
Kilian, L. (2009). “Not all oil price shocks are alike: Disentangling demand and supply shocks in the crude oil market,” American Economic Review, 99(3), 1053-1069.
Kilian, L. (2010). “Explaining fluctuations in gasoline prices: A joint model of the global oil market and the U.S. retail gasoline market,” The Energy Journal, 31(2), 87-112.
Maghyereh, A. and A. Al-Kandari (2007). “Oil prices and stock markets in GCC countries: new evidence from nonlinear cointegration analysis,” Managerial Finance, 33(7), 449-460.
Maysami, R.C. and T.S. Koh (2000). “A vector error correction model of the Singapore stock market,” International Review of Economics and Finance, 9(1), 79-96.
McDowall, W. and M. Eames (2006). “Forecasts, scenarios, visions, backcasts and roadmaps to the hydrogen economy: A review of the hydrogen futures literature,” Energy Policy, 34(11), 1236-1250.
Miller, J.I. and R.A. Ratti (2009). “Crude oil and stock markets: Stability, instability, and bubbles,” Energy Economics, 31(4), 559-568.
Nandha, M. and R. Faff (2008). “Does oil move equity prices? A global view,” Energy Economics, 30(3), 986-997.
Newey, W. and K. West (1987). “A simple positive semi-definite, heteroskedasticity and autocorrelation-consistent covariance matrix,” Econometrica, 55(3), 703-708.
Osmundsen, P., F. Asche, B. Misund, and K. Mohn (2006). “Valuation of international oil companies,” The Energy Journal, 27(3), 49-64.
Park, J. and R.A. Ratti (2008). “Oil price shocks and stock markets in the U.S. and 13 European countries,” Energy Economics, 30(5), 2587-2608.
Sadorsky, P. (1999). “Oil price shocks and stock market activity,” Energy Economics, 21(5), 449-469.
Sadorsky, P. (2001). “Risk factors in stock returns of Canadian oil and gas companies,” Energy Economics, 23(1), 17-28.
Sadorsky, P. (2008). “The oil price exposure of global oil companies,” Applied Financial Economics Letters, 4(2), 93-96.
Scholtens, B. and L. Wang (2008). “Oil risk in oil stocks,” The Energy Journal, 29(1), 89-111.
Page 14 of 21
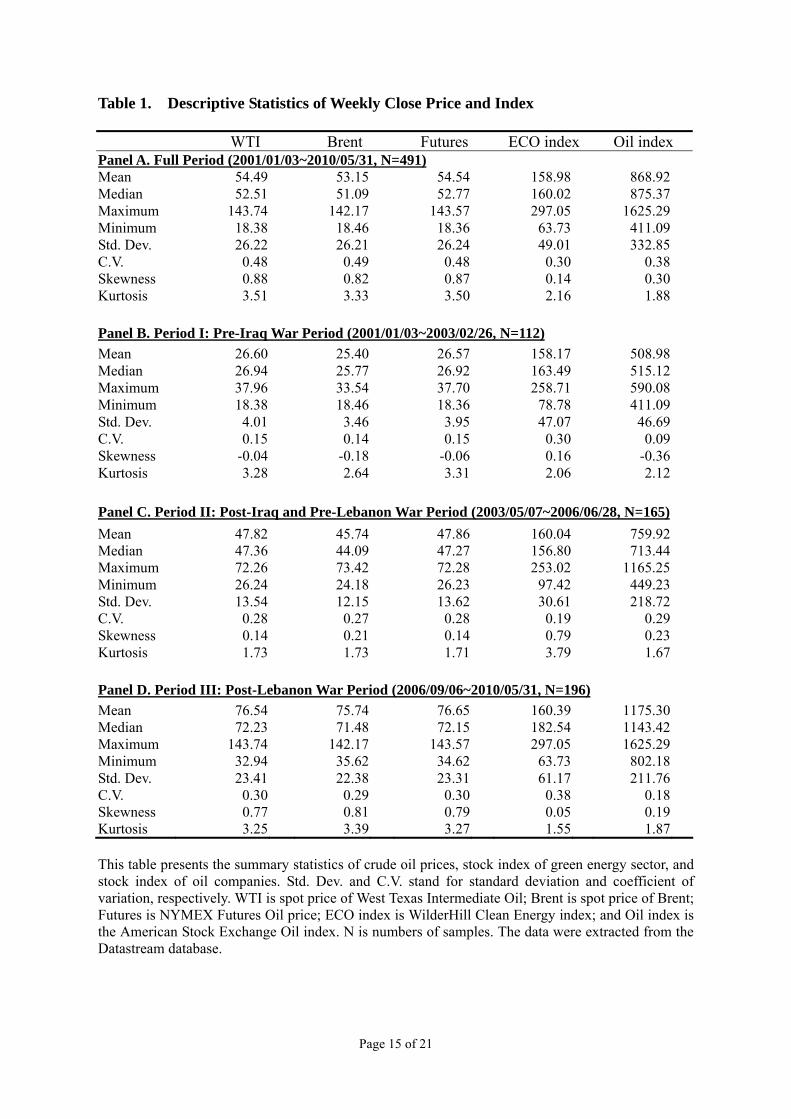
Table 1. Descriptive Statistics of Weekly Close Price and Index
WTI Brent Futures ECO index Oil index Panel A. Full Period (2001/01/03~2010/05/31, N=491)
Mean 54.49 53.15 54.54 158.98 868.92Median 52.51 51.09 52.77 160.02 875.37Maximum 143.74 142.17 143.57 297.05 1625.29Minimum 18.38 18.46 18.36 63.73 411.09Std. Dev. 26.22 26.21 26.24 49.01 332.85C.V. 0.48 0.49 0.48 0.30 0.38Skewness 0.88 0.82 0.87 0.14 0.30Kurtosis 3.51 3.33 3.50 2.16 1.88 Panel B. Period I: Pre-Iraq War Period (2001/01/03~2003/02/26, N=112)
Mean 26.60 25.40 26.57 158.17 508.98Median 26.94 25.77 26.92 163.49 515.12Maximum 37.96 33.54 37.70 258.71 590.08Minimum 18.38 18.46 18.36 78.78 411.09Std. Dev. 4.01 3.46 3.95 47.07 46.69C.V. 0.15 0.14 0.15 0.30 0.09Skewness -0.04 -0.18 -0.06 0.16 -0.36Kurtosis 3.28 2.64 3.31 2.06 2.12 Panel C. Period II: Post-Iraq and Pre-Lebanon War Period (2003/05/07~2006/06/28, N=165)
Mean 47.82 45.74 47.86 160.04 759.92Median 47.36 44.09 47.27 156.80 713.44Maximum 72.26 73.42 72.28 253.02 1165.25Minimum 26.24 24.18 26.23 97.42 449.23Std. Dev. 13.54 12.15 13.62 30.61 218.72C.V. 0.28 0.27 0.28 0.19 0.29Skewness 0.14 0.21 0.14 0.79 0.23Kurtosis 1.73 1.73 1.71 3.79 1.67 Panel D. Period III: Post-Lebanon War Period (2006/09/06~2010/05/31, N=196)
Mean 76.54 75.74 76.65 160.39 1175.30Median 72.23 71.48 72.15 182.54 1143.42Maximum 143.74 142.17 143.57 297.05 1625.29Minimum 32.94 35.62 34.62 63.73 802.18Std. Dev. 23.41 22.38 23.31 61.17 211.76C.V. 0.30 0.29 0.30 0.38 0.18Skewness 0.77 0.81 0.79 0.05 0.19Kurtosis 3.25 3.39 3.27 1.55 1.87 This table presents the summary statistics of crude oil prices, stock index of green energy sector, and stock index of oil companies. Std. Dev. and C.V. stand for standard deviation and coefficient of variation, respectively. WTI is spot price of West Texas Intermediate Oil; Brent is spot price of Brent; Futures is NYMEX Futures Oil price; ECO index is WilderHill Clean Energy index; and Oil index is the American Stock Exchange Oil index. N is numbers of samples. The data were extracted from the Datastream database.
Page 15 of 21

Table 2. Correlation Matrix of Weekly Close Price and Index
WTI Brent Futures ECO index Panel A. Full Period (2001/01/03~2010/05/31, N=491)
Brent 0.9965 ----- (0.0001)
Futures 0.9998 0.9968 ----- (0.0001) (0.0001)
ECO index 0.3470 0.3529 0.3464 ----- (0.0001) (0.0001) (0.0001) Oil index 0.9025 0.9172 0.9036 0.4848 (0.0001) (0.0001) (0.0001) (0.0001) Panel B. Period I: Pre-Iraq War Period (2001/01/03~2003/02/26, N=112)
Brent 0.9609 ----- (0.0001)
Futures 0.9958 0.9643 ----- (0.0001) (0.0001)
ECO index -0.2240 -0.1748 -0.2242 ----- (0.0176) (0.0651) (0.0175) Oil index -0.2623 -0.1698 -0.2591 0.8141 (0.0052) (0.0734) (0.0058) (0.0001)
Panel C. Period II: Post-Iraq and Pre-Lebanon War Period (2003/05/07~2006/06/28, N=165)
Brent 0.9942 ----- (0.0001)
Futures 0.9994 0.9950 ----- (0.0001) (0.0001)
ECO index 0.7678 0.7753 0.7690 ----- (0.0001) (0.0001) (0.0001) Oil index 0.9759 0.9776 0.9769 0.8212 (0.0001) (0.0001) (0.0001) (0.0001) Panel D. Period III: Post-Lebanon War Period (2006/09/06~2010/05/31, N=196)
Brent 0.9935 ----- (0.0001)
Futures 0.9998 0.9936 ----- (0.0001) (0.0001)
ECO index 0.5166 0.5326 0.5159 ----- (0.0001) (0.0001) (0.0001)
Oil index 0.6982 0.7172 0.6977 0.9236 (0.0001) (0.0001) (0.0001) (0.0001) This table presents the correlation statistics between crude oil prices, stock index of green energy sector, and stock index of oil companies. Descriptions of variables and data please see Table 1. The numbers shown in parentheses are p-values.
Page 16 of 21

Page 17 of 21
Table 3. Unit Root Test Levels First differences
ADF PP ADF PP Panel A. Full Period (2001/01/03~2010/05/31, N=491)
WTI -1.43 -1.71 -22.80*** -23.20*** Brent -1.40 -1.74 -21.93*** -22.66*** Futures -1.40 -1.73 -22.20*** -22.83*** ECO index -1.75 -1.89 -21.39*** -21.42*** Oil index -1.33 -1.31 -20.18*** -20.09*** Panel B. Period I: Pre-Iraq War Period (2001/01/03~2003/02/26, N=112)
WTI -0.44 -0.49 -11.04*** -11. 03*** Brent -0.97 -1.25 -10.63*** -10.63*** Futures -0.30 -0.42 -11.17*** -11.18*** ECO index -1.49 -0.74 -5.73*** -10.60*** Oil index -1.36 -1.04 -11.17*** -11.91*** Panel C. Period II: Post-Iraq and Pre-Lebanon War Period (2003/05/07~2006/06/28, N=165)
WTI -0.82 -0.70 -14.01*** -14.07*** Brent -0.55 -0.51 -12.50*** -12.51*** Futures -0.75 -0.70 -13.38*** -13.39*** ECO index -1.92 -1.95 -13.07*** -13.06*** Oil index -0.40 -0.31 -12.86*** -12.86*** Panel D. Period III: Post-Lebanon War Period (2006/09/06~2010/05/31, N=196)
WTI -1.32 -1.53 -14.24*** -14.30*** Brent -1.32 -1.62 -13.99*** -14.19*** Futures -1.30 -1.53 -13.92*** -14.01*** ECO index -0.83 -0.90 -12.48*** -12.42*** Oil index -1.30 -1.36 -12.35*** -12.26*** This table presents the results of unit root test for crude oil prices, stock index of green energy sector, and stock index of oil companies. Descriptions of variables and data please see Table 1. All tests use an intercept with no trend, and the null hypothesis is that the series has a unit root. Each Augmented Dickey-Fuller (ADF) statistic is reported for the shortest lag length which has been chosen based on the AIC. The Phillips–Perron (PP) test uses the same models as the ADF tests, but uses a nonparametric correction, due to Newey and West (1987), to address the potential serial correlation. The lag truncation for the nonparametric correction is conducted with an automated bandwidth estimator of the Bartlett kernel (Andrews, 1991). *,**,*** Significant at the 10%, 5% and 1% critical level.
Page 18 of 21
Table 4. Johansen Cointegration Test
Oil Price WTI Brent Futures
ECO index
H1 λmax Trace λmax Trace λmax Trace λmax Trace Panel A. Full Period (2001/01/03~2010/05/31, N=491)ECO index 0.0137 10.0677 0.0140 9.8985 0.0139 10.0713 ----- ----- Oil index 0.0331 20.2221† 0.0382 22.5482† 0.0323 19.9407† 0.0083 5.8430
Panel B. Period I: Pre-Iraq War Period (2001/01/03~2003/02/26, N=112)
ECO index 0.0910 11.4250 0.0561 6.2802 0.0568 6.2795 ----- ----- Oil index 0.0491 5.9417 0.0505 5.7605 0.0501 6.5477 0.0910 11.4250
Panel C. Period II: Post-Iraq and Pre-Lebanon War Period (2003/05/07~2006/06/28, N=165)
ECO index 0.0364 6.8852 0.0387 6.8375 0.0360 6.6437 ----- ----- Oil index 0.0949 16.5118† 0.0846 20.5375† 0.0839 19.9948† 0.0402 6.7453
Panel D. Period III: Post-Lebanon War Period (2006/09/06~2010/05/31, N=196)ECO index 0.0375 9.9974 0.0340 8.9597 0.0371 10.0255 ----- ----- Oil index 0.0495 16.2607† 0.0551 16.6399† 0.0505 16.4083† 0.0551 11.7615
This table presents the results of cointegration test between crude oil prices, stock index of green energy sector, and stock index of oil companies. Descriptions of variables and data please see Table 1. The null hypothesis of no cointegrated vector is concerned, and the lag length of cointegrated test is applied based on the SBC. The Significant value of Trace is 15.34 at 5% level with † indicating the significance. We can derive the value of λmax from the following formula:
∑ +=
∧
−−n
riiT
1)1log( λ
)1log( 1+
∧
−− rT λ , The value of Trace can be calculated by the subsequent formula:
where is the eigenvalue. i∧λ

Table 5. VAR/VECM and Granger Causality
VAR/VECM Causality Left- hand side
Right- hand side
Coefficient p-value 2χ p-value
Panel A. Full Period (2001/01/03~2010/05/31, N=491)
WTI ECO index 0.1310 0.2825 1.16 0.2820 ECO index WTI
0.0482 0.0061*** 7.60 0.0059***
WTI Oil index -0.3649 0.0058*** 7.66 0.0056*** Oil index WTI
0.0037 0.0002*** 14.42 0.0001***
Brent ECO index 0.1473 0.2565 1.29 0.2560 ECO index Brent
0.0480 0.0035*** 8.59 0.0034***
Brent Oil index -0.3694 0.0100** 6.70 0.0097*** Oil index Brent
0.0041 0.0001*** 17.30 0.0001***
Futures ECO index 0.1119 0.3741 0.79 0.3736 ECO index Futures
0.0426 0.0127** 6.26 0.0123**
Futures Oil index -0.3604 0.0067*** 7.40 0.0065*** Oil index Futures
0.0035 0.0002*** 14.19 0.0002***
Oil index ECO index 0.0248 0.0603* 3.55 0.0597* ECO index Oil index
0.2657 0.2117 1.56 0.2111
Panel B. Period I: Pre-Iraq War Period (2001/01/03~2003/02/26, N=112)
WTI ECO index 0.6271 0.3987 0.72 0.3968 ECO index WTI
0.0088 0.4864 0.49 0.4849
WTI Oil index -0.0026 0.9984 0.01 0.9984 Oil index WTI
0.0068 0.3981 0.72 0.3962
Brent ECO index -0.0682 0.9340 0.01 0.9339 ECO index Brent
0.0108 0.3599 0.85 0.3578
Brent Oil index -0.2875 0.8408 0.04 0.8404 Oil index Brent
0.0093 0.2192 1.53 0.2165
Futures ECO index 0.3397 0.6702 0.18 0.6694 ECO index Futures
-0.0005 0.9608 0.01 0.9607
Futures Oil index -1.0805 0.4495 0.58 0.4478 Oil index Futures
0.0012 0.8705 0.03 0.8702
Oil index ECO index 0.0728 0.2322 1.44 0.2296 ECO index Oil index
0.0570 0.7299 0.12 0.7292
This table presents the results of VAR or VECM between crude oil prices, stock index of green energy sector, and stock index of oil companies. When two series are cointegrated according to results of Table 4, VECM is applied; otherwise, VAR in differences is applied. Descriptions of variables and data please see Table 1. For Granger Causality, the null hypothesis states no causality relationships between two variables, and the selection of lag length based on the SBC. *,**,*** Significant at the 10%, 5% and 1% critical level.
Page 19 of 21
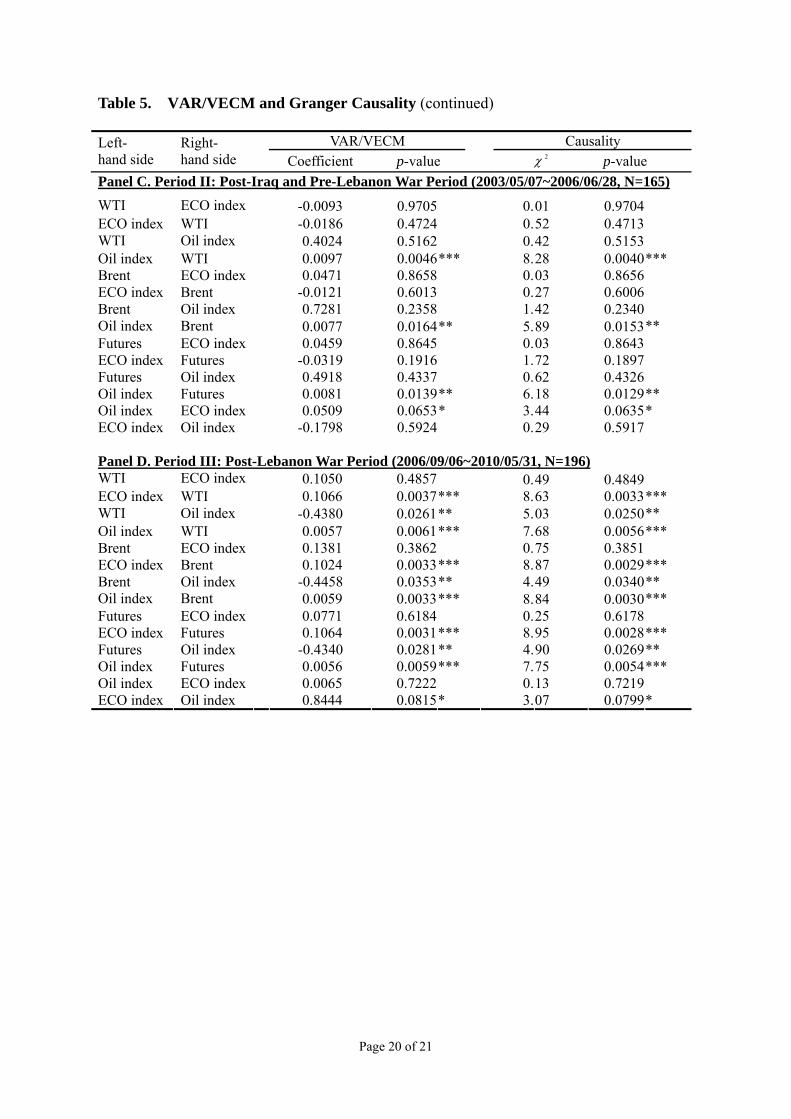
Table 5. VAR/VECM and Granger Causality (continued)
VAR/VECM Causality Left- hand side
Right- hand side
Coefficient p-value 2χ p-value
Panel C. Period II: Post-Iraq and Pre-Lebanon War Period (2003/05/07~2006/06/28, N=165)
WTI ECO index -0.0093 0.9705 0.01 0.9704 ECO index WTI
-0.0186 0.4724 0.52 0.4713
WTI Oil index 0.4024 0.5162 0.42 0.5153 Oil index WTI
0.0097 0.0046*** 8.28 0.0040***
Brent ECO index 0.0471 0.8658 0.03 0.8656 ECO index Brent
-0.0121 0.6013 0.27 0.6006
Brent Oil index 0.7281 0.2358 1.42 0.2340 Oil index Brent
0.0077 0.0164** 5.89 0.0153**
Futures ECO index 0.0459 0.8645 0.03 0.8643 ECO index Futures
-0.0319 0.1916 1.72 0.1897
Futures Oil index 0.4918 0.4337 0.62 0.4326 Oil index Futures
0.0081 0.0139** 6.18 0.0129**
Oil index ECO index 0.0509 0.0653* 3.44 0.0635* ECO index Oil index
-0.1798 0.5924 0.29 0.5917
Panel D. Period III: Post-Lebanon War Period (2006/09/06~2010/05/31, N=196)
WTI ECO index 0.1050 0.4857 0.49 0.4849 ECO index WTI
0.1066 0.0037*** 8.63 0.0033***
WTI Oil index -0.4380 0.0261** 5.03 0.0250** Oil index WTI
0.0057 0.0061*** 7.68 0.0056***
Brent ECO index 0.1381 0.3862 0.75 0.3851 ECO index Brent
0.1024 0.0033*** 8.87 0.0029***
Brent Oil index -0.4458 0.0353** 4.49 0.0340** Oil index Brent
0.0059 0.0033*** 8.84 0.0030***
Futures ECO index 0.0771 0.6184 0.25 0.6178 ECO index Futures
0.1064 0.0031*** 8.95 0.0028***
Futures Oil index -0.4340 0.0281** 4.90 0.0269** Oil index Futures
0.0056 0.0059*** 7.75 0.0054***
Oil index ECO index 0.0065 0.7222 0.13 0.7219 ECO index Oil index
0.8444 0.0815* 3.07 0.0799*
Page 20 of 21
0
20
40
60
80
100
120
140
160
2001 2002 2003 2004 2005 2006 2007 2008 2009
Figure 1. Crude Oil Price of WTI This figure presnets the trend of West Texas Intermediate Crude Oil Price between January 2001 and May 2010 in US dollar. The first and second shaded areas indicate the periods of Iraq War and Lebanon War, respectively.
Page 21 of 21
Related Documents