OIL PRICE ASYMMETRIC SHOCKS AND ECONOMIC ACTIVITY: THE CASE OF GREECE Evangelia Papapetrou* University of Athens, Department of Economics, Athens, Greece and Bank of Greece, Economic Research Department August 2009 The paper studies the relationship between oil prices and economic activity in Greece during the period 1982:1 to 2008:8. Different empirical methods are used to estimate whether oil price changes affect asymmetrically the economic activity. A regime-switching model (RS- R) and a threshold regression modeling (TA-R) are applied which have the advantage to capture the dependence structure of the series both in terms of constant and variance. The empirical evidence suggests that the degree of negative correlation between oil prices and economic activity strengths during periods of rapid oil price changes and high oil price change volatility. Key words: Markov switching regime and threshold models; oil price shocks; production JEL classification: C220; E320; Q430 *The views expressed in this paper are those of the author and not those of the Bank of Greece. The author would like to thank Spyros Droukopoulos for providing part of the data and for helpful comments. Address for correspondence: Evangelia Papapetrou Economic Research Department Bank of Greece 21 El. Venizelou St. 102 50 Athens, Greece Tel.: +30210 320. 2377 Fax: +30210 323.3025 e-mail: [email protected]

Welcome message from author
This document is posted to help you gain knowledge. Please leave a comment to let me know what you think about it! Share it to your friends and learn new things together.
Transcript
OIL PRICE ASYMMETRIC SHOCKS AND ECONOMIC ACTIVITY: THE CASE OF GREECE
Evangelia Papapetrou*
University of Athens, Department of Economics, Athens, Greece and Bank of Greece, Economic Research Department
August 2009 The paper studies the relationship between oil prices and economic activity in Greece during the period 1982:1 to 2008:8. Different empirical methods are used to estimate whether oil price changes affect asymmetrically the economic activity. A regime-switching model (RS-R) and a threshold regression modeling (TA-R) are applied which have the advantage to capture the dependence structure of the series both in terms of constant and variance. The empirical evidence suggests that the degree of negative correlation between oil prices and economic activity strengths during periods of rapid oil price changes and high oil price change volatility.
Key words: Markov switching regime and threshold models; oil price shocks; production JEL classification: C220; E320; Q430 *The views expressed in this paper are those of the author and not those of the Bank of Greece. The author would like to thank Spyros Droukopoulos for providing part of the data and for helpful comments. Address for correspondence: Evangelia Papapetrou Economic Research Department Bank of Greece 21 El. Venizelou St. 102 50 Athens, Greece Tel.: +30210 320. 2377 Fax: +30210 323.3025 e-mail: [email protected]
2
I. Introduction
The correlation between oil prices and real output has received considerable attention
especially for most industrialized countries (Hamilton, 1983; Burbridge and Harrison, 1984;
Gisser and Goodwin, 1986; Mork, 1989; and Ferderer, 1996; Guo and Kliesen, 2005). One
explanation for such a relationship is that oil prices increases lower future GDP growth by
raising production costs.
Various researchers have documented a negative relationship between oil price
changes and economic activity. In a seminal work, Hamilton (1983) showed that oil price
increases are responsible for almost every post World War II US recession. Later other
researchers extended Hamilton’s basic findings using alternative data and estimation
procedures (Burbridge and Harrison, 1984; Gisser and Goodwin, 1986; Olson, 1988).1
However, in several recent studies evidence on the negative linear relationship
between oil prices and output was not supported throughout the period under examination
and the analysis provided evidence of asymmetries in the link between the two variables. In
particular, it has been documented that rising oil prices appear to impede aggregate economic
activity by more than falling oil prices stimulate it (Mork, 1989; Ferderer, 1996; Brown and
Yücel, 2002 and Lardic and Mignon 2008). In particular, Mork (1989) extends Hamilton’s
analysis, by including the oil price collapse of 1986. He confirms Hamilton's (1983) results
by finding that a strong, negative correlation between oil price increases and the growth of
GNP for the United States persists when the sample is extended beyond the 1985-86 decline
of oil prices. However, the coefficients on oil price increases and oil price decreases were
significantly different from each other indicating that the effects of oil price increases and
decreases were asymmetric.
The paper examines the oil - output relationship in Greece. Greece is a medium-sized
economy heavily dependent on oil, and is more vulnerable than other economies to changes
in the international oil market. The Greek economy relies heavily on energy imports and has
only minor domestic reserves of oil. Greece energy dependency was 71.9% in 2006, well
above the European average (EU-27: 53.8 percent).2 Oil is the main fuel consumed in Greece 1 For an extensive review on the oil price shocks and macroeconomy and a discussion on various transmission channels of oil price shocks, see among others, Jones et. al. (2004) and Cologni and Manera (2008, 2009). 2 Energy dependency shows the extent to which an economy relies upon imports in order to meet its energy needs. The indicator is calculated as net imports divided by the sum of gross inland energy consumption plus bunkers.
3
and it represents 64 percent of all energy consumption in 2006. Coal consumption represents
(23 percent), dry natural gas (8 percent) while hydroelectric and renewable energy combined
account for 5 percent. Moreover Greece is a European Union country which experienced
quite remarkable growth rates after the early nineties that have enabled the country to enter
the Euro zone. Besides, during the period under examination, Greece went through a process
of financial liberalization, while the macroeconomic environment evolved reflecting changes
in policy regimes.
This paper’s contribution to the existing literature is as follows. First, using monthly
data for Greece for the period 1982:1-2008:8 the analysis extends our understanding on the
potential evidence of asymmetries in the link between oil prices and economic activity.
Second, contrary to previous studies three methods, the linear model, the switching model
(RS-R) and a threshold model (TA-R) are utilized to examine the dynamics of this
relationship. The regime-switching model (RS-R) and a threshold model (TA-R) are
employed to analyze the short-run behavior of the oil price – economic activity relationship
when this is subject to regime shifts or changes above or below a threshold value. Under this
assumption, the estimated model can accurately capture nonlinearities and asymmetries,
which may be present in the data. In this analysis, the regime-switching model (RS-R) has
two regimes: regime 1 is characterized by low oil price changes and regime 2 by high oil
price changes. Under these alternative regimes the impact of oil price changes on economic
activity is exemplified. Finally, in the threshold model (TA-R) the oil price change and the
oil price volatility are used as the threshold variables to examine whether a nonlinear
relationship between oil price and economic activity exists. With different regimes as
represented by different threshold vales, the different impact of oil price changes on
economic activity is depicted.
The rest of the paper is organized as follows. Section II presents a review of previous
studies on the empirical evidence of oil price changes and economic activity. Section III
deals with methodological issues and the data used in the empirical analysis, while in Section
IV the empirical evidence is presented. Finally, in Section V, the conclusions of the analysis
are summarized.

4
II. Asymmetric relationship between oil prices and output: evidence from the
literature
The negative correlation between oil prices and real output has been addressed by
various researchers. In a series of papers Hamilton (1983, 1996, 2003) showed that oil shocks
have a substantial effect on output and that these shocks are responsible for the recessions in
the U.S economy. Hamilton finds that changes in oil prices Granger-caused changes in GNP
whereas oil prices were determined exogenously. However, he argues that not all oil price
changes have the same effect on the economy. He claims that a fall in the price of oil is
unlikely to boost the economy in the same way that a price increase can it depress it
downwards. Moreover he argues that oil price increases that reverse previous price decreases
are expected not to have a significant effect on the economy. Hamilton (1996) proposed a
transformation of raw oil prices, as an alternative specification for oil price changes. In
particular, an oil shock is equal to the difference between the current oil price and the
maximum price of the previous four or twelve quarters. Hamilton finds that this alternative
oil shock measure shows a negative and stable relation with future GDP growth.
Burbidge and Harrison (1984) examine the impact of oil price shocks on some
macroeconomic variables in the U.S.A., Canada, U.K., Japan and Germany. Using VAR
models they show that the 1973-74 oil embargo explains a substantial part of the behavior of
industrial production in each of the countries examined. They reach the same conclusions as
in Hamilton’s work. However, for the oil changes in 1979-80 they find little evidence that the
changes in oil prices have an effect on industrial production.
The existence of an asymmetric relationship between oil price changes and economic
output was studied by various researchers. Mork (1989) extends Hamilton’s analysis, by
including the oil price collapse of 1986. He confirms Hamilton's (1983) results by finding
that a strong, negative correlation between oil price increases and the growth of GNP for the
United States persists when the sample is extended beyond the 1985-86 the decline of oil
price. Moreover, the coefficients on oil price increases and oil price decreases were
significantly different from each other indicating that the effects if oil price increases and
decreases were asymmetric.
The study of Mork, Olsen and Mysen (1994) extents the findings of the previous
studies to include six other industrialized countries, namely, Japan, Germany (West), France,
5
Canada, the United Kingdom, and Norway. These countries vary considerably in the degree
to which their economies depend on oil as an input and to which they are dependent on
foreign oil. They conclude that the negative correlation between oil price increases and
growth in GDP is present and significant for most of the countries examined for data
extending through 1992. Moreover, for most countries they show evidence of asymmetric
effects.
Cunado and de Gracia (2005) study how oil price shocks affect the growth rate of
output of a number of developed countries employing alternative regime switching models.
The findings of their analysis show that positive oil price changes, net oil price increases and
oil price volatility have an affect on output growth.
Guo and Kliesen (2005) employing a volatility measure constructed using daily crude
oil futures prices show that it has a negative and significant effect on future GDP growth and
other measures of the U.S. macroeconomy over the period 1984-2004. Their results are
consistent with the nonlinear effect documented in Hamilton’s work (1996). They also find
that macroeconomic variables do not forecast realized oil price volatility.
Huang, Hwang and Peng (2005) apply the multivariate threshold model to examine
the impacts of an oil price change and its volatility on economic activity. Using monthly data
of the US, Canada, and Japan during the period from 1970 to 2002 they show that changes in
oil price and its volatility above a threshold level help explain output changes.
Recently, Zhang (2008) investigates the relationship between oil price shock and
economic growth in Japan using a nonlinear approach developed by (2003). He finds
evidence of nonlinearities in the relationship, and in particular the show that negative oil
price shocks tend to have larger impact on output growth than positive shocks do.
Lardic and Mignon (2008) examine the U.S economy, the G7, Europe and Euro area
countries to study the long-term relationship between oil prices and economic activity.
Employing asymmetric cointegration methodology they show evidence for asymmetric
cointegration between oil prices and GDP.
Cologni and Manera (2009) using a Markov-switching analysis for the G-7 countries
show that positive oil price changes, net oil price increases and oil price volatility tend to
have a greater impact on output growth. Moreover, their analysis suggests that the role of oil
6
shocks in explaining recessionary episodes have decreased over time. Finally, they conclude
that oil shocks tend to be asymmetric.
However, fewer studies have examined the macroeconomic impacts of oil shocks for
other countries except the U.S. (Papapetrou, 2001; Cunado and de Gracia (2003); Miguel,
Manzano and Martin-Moreno, 2003). Papapetrou (2001) using a VAR approach among oil
prices, real stock prices, interest rates, real economic activity and employment in Greece
shows that oil price changes affect real economic activity and that they are important in
explaining stock price movements. Cunado and de Gracia (2003) concentrate on the effects
of oil price shocks on the industrial production and consumer price indices for 14 European
countries. Miguel, Manzano and Martin-Moreno (2003) use a dynamic general equilibrium
model for Spain. Their results suggest that oil shocks account for more than half the size of
the aggregate fluctuations of the economy. They show that increases in the relative price of
oil had a negative and significant effect on welfare.
III. Methodological Issues and Data
The purpose of the empirical analysis is to explore whether the relationship between
oil prices and economic activity exists and whether asymmetric transformations of oil price
changes such as oil price volatility affect this relationship. Under continuous oil price
changes an increase in oil price volatility may asymmetrically affect production.
In the empirical analysis we perform switching-regime and threshold regression
models to explain the dynamic interactions among oil price and output. The two methods
have the advantage than they can capture the dependence structure of the series both in terms
of the mean and the variance. These types of models are employed to analyze multiple time
series when the generating data mechanism is subject to regime shifts. In the model the
variable of interest, that is output, has a certain probability of switching suddenly among a
number of regimes. This type of behavior enables the estimated model to accurately capture
nonlinearities and asymmetries, which are present.
Before estimating the relationship among the variables we test for the order of
integration of the variables. Standard tests for the presence of a unit root based on the work of
Dickey and Fuller (1979, 1981), Perron (1988), Phillips (1987), Phillips and Perron (1988),
Kwiatkowski et al. (1992) are employed to investigate the degree of integration of the

7
variables used in the empirical analysis. Once the order of integration of the variables has
been determined, the long-run relationship, between economic activity and oil prices, is
detected. Testing for cointegration is performed using the fully modified OLS (FM-OLS)
regression technique of Phillips and Hansen (1990), which modifies least squares to account
for the endogeneity in the regressors that result from the existence of a cointegration
relationship. In addition, the Johansen maximum likelihood approach is used (Johansen,
1988; Johansen and Juselius, 1990, 1992) to test for co-integration between the two variables.
The Johansen-Juselius estimation method is based on the error-correction representation of
the VAR model with Gaussian errors. If a long-run relationship exists the third step, involves
estimation of the vector error-correction modeling (VECM) and testing otherwise a VAR
model in first differences is estimated.
However, if there is a structural change in the short-run dynamics of the VAR the
resulting estimates are not consistent. Unlike other methods an underlying assumption of
OLS estimator is that the coefficients are constant. If a regime change has occurred the OLS
estimator averages the old regime with the new regime with equal weights. The OLS method
is static since it implicitly gives the same weight to each observation and the estimated value
may significantly depend on the length of the series employed. Hence, the estimated
coefficients remain constant through time. However, structural changes and regime shifts
occur and affect the magnitude of short-run dynamics due to many possible factors such as
changes in oil price volatility.
Therefore, in order to capture regime changes (regime shifts) a regime-switching
model (RS-M) and a threshold model (TA-R) are estimated. The regime-switching regression
model and threshold regression model are based on the idea that it is possible to decompose a
series in a finite sequence of regimes. Each of the processes is linear but their combination is
not and creates a nonlinear regime. In the regime-switching model the regime shift is
exogenously determined, while in the threshold model the regime-generating process is not
assumed to be exogenous but directly linked to the variable. Both models are estimated with
two regimes.3 Following Krolzig (1997) the switching model is estimated with shifts in the
mean, the coefficients and the error variance.4 The advantage of these models is that it
incorporates in the estimation of the relationship between oil price and economic activity the
3 The RS-M and TA-R are estimated by means of the EM algorithm proposed by Dempsteir et al. (1977) using the MSVAR software developed by Krolzig. For more details, see Krolzig (1997). 4 For more details see Krolzig (1997) and Krolzig et al. (2002).
8
structural breaks observed during the estimation period.5 Thus, a switching regime regression
model is estimated with two observable regimes representing “low oil price change” and
“high oil price change”. In addition, two threshold regression models are estimated with two
unobservable regimes. In the first model, the unobservable regimes represent “low oil price
change” (regime 1) and “high oil price change” (regime 2) and in the second model “low oil
price volatility” (regime 1) and “high oil price volatility” (regime 2).
The empirical analysis has been carried out using monthly data for the period 1982:1
to 2008:8 for Greece. The output variable is the industrial production (PROD) (a measure of
output), the oil price (OIL) is the consumer price index for fuels. All variables are not
seasonally adjusted and are expressed in logarithms (LPROD, LOIL). All data are taken from
the Bulletin of Conjectural Indicators of the Bank of Greece. Finally, VOL _OIL, used as a
proxy for uncertainty, is the variance of the oil price variable which is estimated employing a
GARCH specification. We believe that this data set is superior in terms of the length of the time
series, consistency of definition and availability over time of important variables for the study
of the oil prices and output relationship in a medium-sized economy.
In particular, we constructed a GARCH measure of volatility as follows:
Mean equation: ttt DLOILDLOIL εαα ++= −110 (1)
Variance equation: 212
2110
2−− ++= ttt σβεββσ (2)
where tDLOIL is the rate of increase of the oil price and is expressed as the first difference of the
log of the oil prices and tε is a random error. The conditional variance in equation (2) is a
function of the terms: (i) the mean, 0β ; (ii) news about volatility from the previous period,
measured as the lag of the squared residuals from the mean equation, 21tε − (the ARCH term);
(iii) the last period’s forecast error variance, 21tσ − (the GARCH term).
Then, an alternative definition of the oil variable was introduced as an extension to
the basic model. Real oil price (OILEURO) was constructed by multiplying the nominal
dollar oil price by the nominal exchange rate and deflated by the Greek consumer price
index.
5 The RS-R is estimated by means of EM algorithm proposed by Dempsteir et al. (1977) using MSVAR software developed by Krolzig. For more details see Krolzig (1997).
9
IV. Empirical Results
The ADF, PP and KPSS tests are estimated for the three variables, oil price (LOIL),
oil price volatility (VOL_OIL) and industrial production (LPROD) in the analysis in levels
and first differences. All test statistic suggests that oil price volatility is stationary variable
while the other two variables, that is oil price and industrial production are integrated of
order one, I(1).
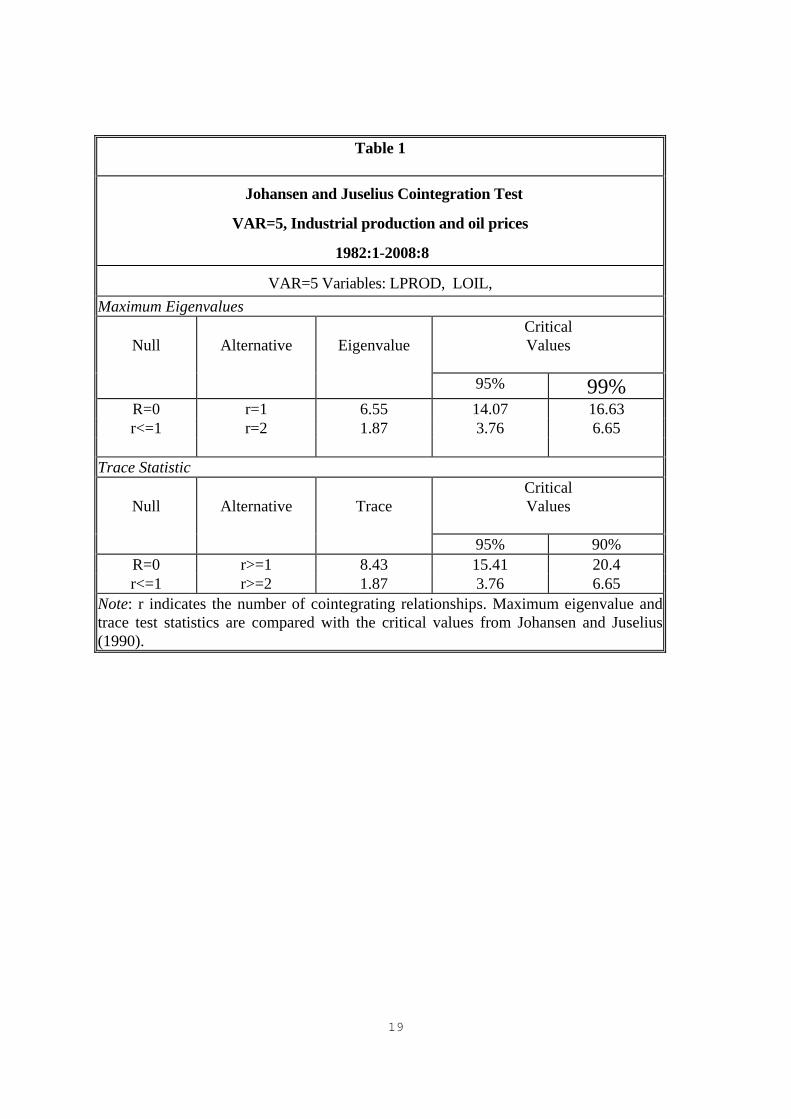
Since oil price and industrial production are integrated of the same order, it is
appropriate to look for a relationship between the two variables. The results of cointegration
analysis using the Phillips-Hansen methodology suggest that the hypothesis of no
cointegration between the two variables, oil price and industrial production, cannot be
rejected.6 This result is confirmed by the Johansen methodology. In particular both test
statistic, eigenvalue and trace can not reject the null hypothesis of no co-integration.
(INSERT TABLE 1)
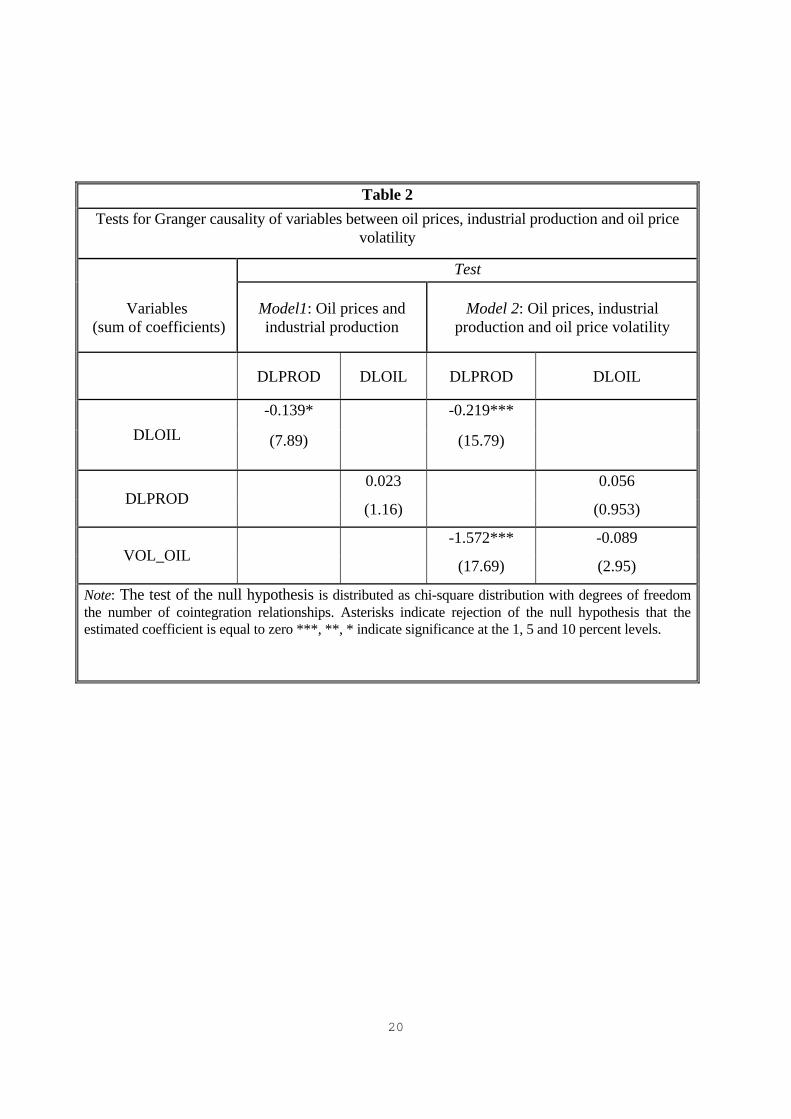
Next, the VAR model between the two variables in first differences is estimated
initially for the whole period. Estimates of the parameters show that the estimated
coefficients for oil price changes jointly are statistically significant and negative implying
that increases in oil prices will affect negatively changes in the economic activity (sum of
estimated oil price coefficients = -0.139). However, the reverse causality is not confirmed. In
particular, the Wald test implies that the estimated coefficients for economic activity changes
jointly are not statistically significant and do not affect oil price changes (Table 2, Model 1)
To test if oil price uncertainty affects the relationship between economic activity and
oil price, the oil price volatility as it is estimated employing a GARCH(1,1), is added in the
VAR estimation (Table 2, Model 2). When oil price volatility was added as I(0) variable in
the VAR specification the estimated coefficients for oil price changes are negative and
statistically significant implying that oil price changes will affect negatively changes in the
economic activity (sum of estimated oil price volatility coefficients = -0.219). In addition, the
results show that the estimated coefficients of oil price volatility are statistically significant
and affect negatively economic activity (sum of estimated oil price volatility coefficients = -
6 The ADF, PP and KPSS tests used to test the unit root hypothesis of the residuals of the estimated regression equation between oil price and industrial production. All three tests suggest that the residuals are integrated of order zero, I(0). The detailed results are available from the authors upon request.

10
1.572). These findings suggest that there exists a negative causal relationship among oil price
changes and oil price volatility and changes in the economic activity.
(INSERT TABLE 2)
However, the estimated linear model may not be appropriate to capture regime shifts
(last column of table 3). The underlying assumption is that the assessed VAR coefficients are
constant overtime since OLS averages the old with the new regime. As a result the estimated
coefficient is considered as an average for the whole period. However, many economic time
series behave quite differently during economic turndowns (Hamilton, 1989 and Chauvet and
Hamilton, 2005).
For this purpose the SR-R and TA-R models are employed. Contrary, to all previous
studies RS-R model (regime-switching regression model) is employed to test for the existence
of different regimes. The RS-R model is applied with two regimes and shifts in the mean, the
estimated coefficients and the error variance is estimated. Table 3 presents the VAR estimates
employing three RS-R models with four lags. All the RS-R models have two regimes. Regime 1
is characterized by low price changes. Specifically, in the first regime, oil prices changes
increased less than 3 percent month to month in the previous period. During regime 2 oil price
changes were high and oil prices increased more than 3 percent in the previous month. Next, a
threshold model (TA-R 1) with two regimes is estimated. The threshold is determined by the oil
price changes in the previous month. Finally, in the third threshold model (TA-R 2) the two
regimes are determined by changes in oil price volatility two months before.
(INSERT TABLE 3)
The linearity test strongly rejects the null hypothesis of linear relationship for both
models among the variables (LR=47.98, LR=48.95 and LR=48.75) even when the upper
bound Davies (1977) is invoked. The AIC and SC criteria are smaller in value in the case of
non-linear relationship. In addition, standard errors are different among regimes. This last
finding suggests that the correlation between the two variables is different across regimes.
Specifically, in the regime-switching regression model (RS-R) under regime 1 the sum of
estimated coefficients of oil price changes is negative (sum = -0.0125) but not statistically
significant during the first regime. Contrary, for the second regime (regime 2) the sum of
estimated coefficients for oil price changes is negative (sum=-0.791) and statistically
11
significant. This finding suggests that oil price changes affect negatively and significantly
industrial production only when oil prices increased more than 3% month to month.
In the second model (TA-R 1) when the oil price change is used as the threshold
variable the threshold is estimated equal to 3.37%. This finding suggests that in the first
regime (Regime 1) oil price changes are lower that 3.37% and in regime two (Regime 2) are
higher that 3.37%. Specifically, in the first model (Regime 1) the sum of estimated
coefficients of oil price changes is negative (sum = -0.005) but not statistically significant
during the first regime. Contrary, for the second regime (Regime 2) the sum of estimated
coefficients for oil price changes is negative (sum = -0.686) and statistically significant. This
finding suggests that oil price changes affect negatively and significantly industrial
production only when oil prices increased more than 3.37% month to month.
In the third model (TA-R 2) when the oil price volatility is used as the threshold
variable the threshold is estimated equal to 0.22%. This finding suggests that in the first
regime (Regime 1) oil price changes volatility is lower that 0.22% and in regime two
(Regime 2) is higher than 0.22%. Specifically, in the first model the sum of estimated
coefficients of oil price changes is positive (sum = 0.172) but not statistically significant
during the first regime. Contrary, for the second regime the sum of estimated coefficients for
oil price changes is negative (sum = -0.973) and statistically significant. This finding
suggests that oil price changes affect negatively and significantly industrial production only
when oil price volatility is higher than 0.22% per month or 2.4% on annual basis.
For Greece the threshold level for oil price changes (3 percent) and the threshold level
for oil price volatility (0.22%) appear to be relatively high (Cunado and de Gracia (2003) and
Huang et. al. (2005). Cunado and de Gracia (2003) report different effects of oil prices on
output and inflation within the European Union area. Huang et. al. (2005) report relatively
lower threshold levels for oil and oil price volatility for countries that have different oil
dependency levels (Canada, Japan and the U.S.A). On explanation for these differences is
that although Greece is an oil-dependent country it has not developed alternative energy-
saving technologies and as a result has a very high tolerance of an oil price change and
volatility. Moreover, differences in the sectoral composition, the tax structure, the position of
a country as oil importer or exporter might affect the impact of oil on the economy.

12
From the empirical analysis we can conclude that: First, oil price changes
asymmetrically affect economic activity in Greece. Second, when oil prices increase more
than 3% month to month then oil prices affect significantly and negatively the economic
activity. Third, when oil price changes are higher that 3.37% per month the oil price changes
affect significantly and negatively the economic activity. Finally, when oil price changes
volatility is higher that 2.4% per year then oil price changes affect significantly and negative
the economic activity.
V. Some extension of the basic model
Following the discussion in section II, an alternative measure of oil prices was
introduced in the analysis in an effort to follow the main stream of the literature in
constructing oil prices. Therefore, we explore the relationship between oil prices and
economic activity when an alternative definition of the oil variable was introduced. Real oil
price (LOILEURO) was constructed by multiplying the nominal dollar oil price by the
nominal exchange rate and deflated by the Greek consumer price index.7 However, we
believe that changes in crude oil prices do not represent a better measure of the oil prices that
influence the economic activity in Greece. In a recent study, it is documented that changes in
crude oil prices are not directly transmitted in the Greek market (IOBE, 2009). Several
explanations have been provided to support this argument. The study claims that refinery
prices in Greece have a lower volatility than international crude oil prices as the ‘market can
have access to lower prices in case the Greek refineries try to charge higher prices’. 8 Second,
part of the final oil products that are consumed in the Greek market are directly imported
from abroad without having to go through the refinery process.
The empirical results partially confirm this view.9 In particular, the estimated VAR
model between the two variables (LPROD and LOILEURO) in first differences show that,
for the estimated coefficients for real oil price changes jointly are statistically significant
7 Greece entered the euro area, effective January 1, 2001. For the period 1982 to December 1999 the drachma’s central rate against the euro (340.75 drachmas per euro) was used to convert the currencies. 8 Hellenic Petroleum owns almost half of Greece's refining capacity. Two private refineries are export oriented selling only limited volumes to the national market. Hellenic Petroleum also is the largest player in the Greek retail oil market at a 26% market share. 9 The ADF, PP and KPSS tests are estimated for the variables, oil price (LOILEURO) and oil price volatility (VOL_OILEURO) in levels and first differences. All test statistic suggests that oil price volatility is stationary variable while the oil price is integrated of order one, I(1). The results are available from the author upon request.
13
(chi-squared =9.59) but are positive implying that increases in real oil prices will affect
positively changes in the economic activity (sum of estimated real oil price coefficients =
0.035). This result contradicts the main stream of empirical findings suggesting that real oil
changes will induce economic activity. When real oil price uncertainty was added as I(0)
variable in the VAR specification real oil price changes are significant (chi-squared =12.24),
however the overall effect remains positive (sum of estimated coefficients = 0.016). In
addition, the results show that the estimated coefficients of real oil price volatility are not
statistically significant (chi-squared=1.54) and do not affect negatively the economic activity
(sum of estimated coefficients=0.021). Since the estimated linear model may not be
appropriate to capture regime shifts a TA-R model is employed. The threshold is determined
by the real oil price changes in the previous month.10 In the TA-R model the threshold is
estimated equal to 9.1%. This finding suggests that in the first regime (Regime 1) oil price
changes are lower that 9.1% and in regime two (Regime 2) are higher that 9.1%. In the first
regime the sum of estimated coefficients of real oil price changes is positive (sum = 0.008)
but not statistically significant (chi-squared =5.0). Contrary, in the second regime the sum of
estimated coefficients for real oil price changes is negative (sum = -0.292) and statistically
significant (chi-squared=35.9). This finding suggests that real oil price changes affect
negatively and significantly industrial production only when oil price increased more than 9.1
month to month.
VI. Conclusion
Although the bulk of the empirical work has studied whether or not a long-run
relationship exists between oil prices and economic activity fewer studies have provided
evidence on the presence of asymmetries in the link between these two variables. In this
paper the possible asymmetries in the influence of oil price changes on industrial production
are analyzed for Greece over the period 1982:1 to 2008:8. A regime-switching model (RS-R)
and a threshold model (TA-R) are employed to examine the dynamics of this relationship and
the presence of potential asymmetries in the link between oil prices and economic activity.
These types of models are utilized to analyze the short-run behavior of the oil price –
10 The linearity test strongly rejects the null hypothesis of linear relationship among the variables (LR=54.34) even when the upper bound Davies (1977) is invoked. The AIC and SC criteria are smaller in value in the case of non-linear relationship. In addition, standard errors are different among regimes.
14
economic activity relationship when this is subject to regime shifts or changes above or
below a threshold value.
The RS-R model is applied with two regimes. Regime 1 is characterized by low price
changes. Specifically, in the first regime, oil prices changes increased less than 3 percent month
to month in the previous period. During regime 2 oil price changes were high and oil prices
increased more than 3 percent in the previous month. Under regime 1 although the sum of the
estimated coefficients is negative it is not statistically significant. On the other hand, for regime
2 the sum of the estimated coefficients for oil price changes is negative and statistically
significant. This finding suggests that oil price changes affect negatively and significantly
industrial production only when oil prices increased more than 3% month to month.
Next, a threshold model (TA-R) with two regimes is estimated. The threshold is
determined by the oil price changes in the previous month. In the second model (TA-R 1),
when the oil price change is used as the threshold variable, the threshold is estimated equal to
3.37% implying that in the first regime (Regime 1) oil price changes are lower that 3.37%
and in regime two (Regime 2) are higher that 3.37%. The empirical findings suggest that oil
price changes affect negatively and significantly industrial production only when oil prices
increased more than 3.37% month to month.
Finally, in the third threshold model the two regimes are determined by changes in oil
price volatility two months before. In the third model (TA-R 2), when the oil price volatility
is used as the threshold variable the threshold is estimated equal to 0.22% suggesting that in
the first regime (Regime 1) oil price changes volatility is lower that 0.22% and in regime two
(Regime 2) is higher than 0.22%. The empirical findings suggests that oil price changes
affect negatively and significantly industrial production only when oil price volatility is
higher than 0.22% per month.
The analysis sheds light on the asymmetrical influence of oil price changes and oil
price volatility on output: responses of economic activity are rather limited in regime 1 but
become evident in regime 2 when oil price changes and its volatility exceed a threshold level
or are higher than a specific level.
A general conclusion that can be derived for the analysis is that oil price changes
asymmetrically affect economic activity in Greece. In particular, it is shown that oil price
increases more than 3% month to month and oil price volatility higher than 2.4% per year

15
affect significantly and negatively the economic activity in Greece. Greece shows a very high
tolerance of an oil price change and volatility despite the fact that its economy is heavily
dependent on oil perhaps due to the fact that it has not developed alternative energy-saving
technologies.
16
References
Brown, S. and Yücel, M. (2002). ‘Energy Prices and Aggregate Economic Activity: an Interprettive Survey’, Quarterly Review of Economics and Finance, Vol. 42, pp. 193–208.
Burbridge, J. and Harrison, A. (1984). ‘Testing for the Effects of Oil-Price Rises Using Vector Autoregressions’, International Economic Review, Vol. 25, No.1, pp. 459-484.
Chauvet, M. and Hamilton, J.D. (2005). ‘Dating Business Cycle Turning Points Oil Prices’, NBER Working Papers: 11422
Cologni, A. and Manera, M. (2008). ‘Oil Prices, Inflation and Interest Rates in a Structural Cointegrated VAR Model for the G-7 Countries’, Energy Economics, Vol. 30, No.3, pp. 8569-888.
Cologni, A. and Manera, M. (2009). ‘The asymmetric effects of oil shocks on output growth: A Markov-Switching Analysis for the G-7 Countries’, Economic Modelling, Vol. 26, pp. 1-29.
Cunado J. and de Gracia F. (2003). ‘Do Oil Shocks Matter? Evidence for some European Countries’, Energy Economics, Vol. 25, pp. 137–154.
Cunado J. and de Gracia F. (2005). ‘Oil prices, economic activity and inflation: evidence for some Asian countries ’, Energy Economics, Vol. 45, pp. 65–83.
Davis, R.B. (1977). ‘Hypothesis Testing when a Nuisance Parameter is Present only Under the Alternative’, Biometrica, Vol. 64, pp. 247-254.
Dempsteir, A. P., Laird, N. M., Rubin, D. B., 1977. Maximum likelihood from incomplete data via the EM algorithm. Journal of the Royal Statistical Society (Series B) 39, 1-38.
Dickey, D.A. and Fuller, W.A (1979). ‘Distributions of the Estimators for Autoregressive Time Series with a Unit Root’, Journal of the American Statistical Association, Vol. 74, pp. 427-31.
Dickey, D.A. and Fuller, W.A. (1981). ‘The Likelihood Ratio Statistics for Autoregressive Time Series with a Unit Root’, Econometrica, Vol. 49, pp. 1057-72.
Ferderer, P.J. (1996). ‘Oil Price Volatility and the Macroeconomy’, Journal of Macroeconomics, Vol. 18, No. 1. pp. 1-26.
Gisser, M., and Goodwin, T.H. (1986). ‘Crude Oil and the Macroeconomy: Tests of Some Popular Notions’, Journal of Money, Credit and Banking, Vol. 18, No.1, pp. 95-103.
Guo, H. and. Kliesen, K (2005). ‘Oil Price Volatility and U.S. Macroeconomic Activity’, Federal Reserve Bank of St. Luis, Review, Vol. 87, No.6, pp. 669-683.
Hamilton, J.D. (1983). ‘Oil and the Macroeconomy since World War II’, Journal of Political Economy, Vol. 92, No. 2, pp. 228-248.
Hamilton J.D. (1996), ‘This is What Happened to the Oil Price-Macroeconomy Relationship’, Journal of Monetary Economics, Vol. 38, No.2, pp. 215-220.
Hamilton J.D. (2003), ‘What is an Oil Shock’, Journal of Econometrics, Vol. 113, No.2, pp. 363-396.
17
Huang, B.N., M.J. Hwang, and Peng, H.P. (2005). ‘The Asymmetry of the Impact of Oil Price Shocks on Economic Activities: An Application of the Multivariate Threshold Model’, Energy Economics, Vol. 27, pp. 455-476.
Johansen, S. (1988). ‘Statistical and hypothesis Testing of Cointegration Vectors’, Journal of Economic Dynamics and Control, Vol. 12, pp. 231-254.
Johansen, S. and. Juselius, K (1992). ‘Cointegration in Partial Systems and the Efficiency of Single Equation Analysis’, Journal of Econometrics, Vol. 52, pp. 389-402.
Johansen, S. and. Juselius, K. (1990). ‘Maximum Likelihood Estimation and Inference on Cointegration - with Applications to the Demand for Money’, Oxford Bulletin of Economics, Vol. 52, pp. 169-210.
Johansen, S. and Juselius, K. (1992). ‘Testing Structural Hypotheses in a Multivariate Cointegration Analysis at the Purchasing Power Parity and the Uncovered Interest Parity for the UK’, Journal of Econometrics, Vol. 53, pp. 211-244.
Krolzig, H. M., 1997. Markov Switching Vector Autoregressions. Modelling Statistical Inference and Application to Business Cycle Analysis, Lecture Notes in Economics and Mathematical Systems, Springer.
Kwiatkowski, D., P.C.B. Phillips, Schmidt, P.and Shin, Y. (1992). ‘Testing the Null Hypothesis of Stationarity Against the Alternative of a Unit Root’, Journal of Econometrics, Vol. 54, pp. 159-78.
Lardic, S. and Mignon, V. (2008). ‘Oil Prices and Economic Activity: An Asymmetric Cointegration Approach’, Energy Economics, Vol. 30, pp. 847–855.
Lardic, S. and Mignon, V. (2006). ‘The Impact of Oil Prices on GDP in European Countries: An Empirical Investigation Based on Asymmetric Cointegration’, Energy Policy, Vol. 30, pp. 3910–3915.
Miguel, C., de, B. Manzano and Martin-Moreno, J.M. (2003). ‘Oil Price Shocks and Aggregate Fluctuations’, Energy Journal ,Vol.24, No.2, pp.47-61.
Mork, K.A (1989). ‘Oil and the Macroeconomy When Prices Go Up and Down: An Extension of Hamilton’s Results’, Journal of Political Economy, Vol. 97, No. 3, pp. 740-744.
Mork, K.A., Olsen, O. and Mysen, H.T. (1994). ‘Macroeconomic Responses to Oil Price Increases and Decreases in Seven OECD Countries’, Energy Journal, Vol.15, No.4, pp.19-35.
Papapetrou, E. (2001). ‘Oil Price Shocks, Stock Market, Economic Activity and Employment in Greece’, Energy Economics, Vol. 23, pp. 511-532.
Perron, P. (1988). ‘Trends and Random Walks in Macroeconomic Time: Series Further Evidence from a New Approach’, Journal of Dynamic and Control, Vol. 12, pp. 297-332.
Phillips, P.C.B. (1987). ‘Time Series Regression with a Unit Root’, Econometrica, Vol. 55, pp. 277-346.
Phillips, P. C. B., Hansen, B. E., 1990. Statistical inference in instrumental variables regression with I(1) processes. Review of Economic Studies 57, 99-125.

18
Phillips, P.C.B. and Perron, P. (1988). ‘Testing for a Unit Root in Time Series Regression’, Biometrica, Vol. 75, pp. 335-346.
Zhang, D. (2008). ‘Oil Shock and Economic Growth in Japan: A Nonlinear Approach’, Energy Economics, Vol. 30, No. 5, pp. 2374-90
19
Table 1
Johansen and Juselius Cointegration Test
VAR=5, Industrial production and oil prices
1982:1-2008:8
VAR=5 Variables: LPROD, LOIL, Maximum Eigenvalues
Null
Alternative
Eigenvalue
Critical Values
95% 99% R=0 r=1 6.55 14.07 16.63 r<=1 r=2 1.87 3.76 6.65
Trace Statistic
Null
Alternative
Trace
Critical Values
95% 90% R=0 r>=1 8.43 15.41 20.4 r<=1 r>=2 1.87 3.76 6.65
Note: r indicates the number of cointegrating relationships. Maximum eigenvalue and trace test statistics are compared with the critical values from Johansen and Juselius (1990).
20
Table 2 Tests for Granger causality of variables between oil prices, industrial production and oil price
volatility
Test
Variables (sum of coefficients)
Model1: Oil prices and industrial production
Model 2: Oil prices, industrial production and oil price volatility
DLPROD DLOIL DLPROD DLOIL
-0.139* -0.219*** DLOIL (7.89) (15.79)
0.023 0.056 DLPROD
(1.16) (0.953)
-1.572*** -0.089 VOL_OIL
(17.69) (2.95)
Note: The test of the null hypothesis is distributed as chi-square distribution with degrees of freedom the number of cointegration relationships. Asterisks indicate rejection of the null hypothesis that the estimated coefficient is equal to zero ***, **, * indicate significance at the 1, 5 and 10 percent levels.
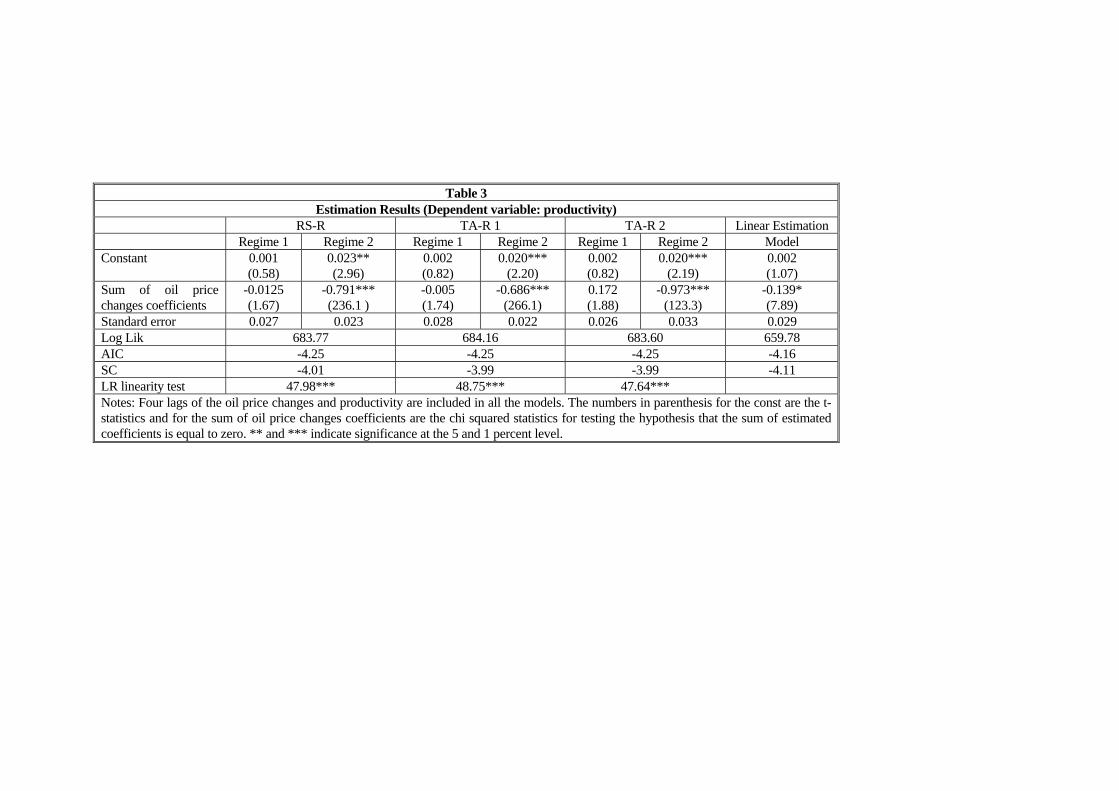
Table 3 Estimation Results (Dependent variable: productivity)
RS-R TA-R 1 TA-R 2 Linear Estimation Regime 1 Regime 2 Regime 1 Regime 2 Regime 1 Regime 2 Model Constant 0.001
(0.58) 0.023** (2.96)
0.002 (0.82)
0.020*** (2.20)
0.002 (0.82)
0.020*** (2.19)
0.002 (1.07)
Sum of oil price changes coefficients
-0.0125 (1.67)
-0.791*** (236.1 )
-0.005 (1.74)
-0.686*** (266.1)
0.172 (1.88)
-0.973*** (123.3)
-0.139* (7.89)
Standard error 0.027 0.023 0.028 0.022 0.026 0.033 0.029 Log Lik 683.77 684.16 683.60 659.78 AIC -4.25 -4.25 -4.25 -4.16 SC -4.01 -3.99 -3.99 -4.11 LR linearity test 47.98*** 48.75*** 47.64*** Notes: Four lags of the oil price changes and productivity are included in all the models. The numbers in parenthesis for the const are the t-statistics and for the sum of oil price changes coefficients are the chi squared statistics for testing the hypothesis that the sum of estimated coefficients is equal to zero. ** and *** indicate significance at the 5 and 1 percent level.

Related Documents