1 Oil & Natural Gas: The Evolving Freight Transportation Impacts Prepared for July 30, 2013 Jackson Hole, WY GE Capital Q3 All Employee Meeting Logis&cs Engineering Supply Chain CIT Rail Resources Conference

Oil & Natural Gas. The Evolving Freight Transportation Impacts
Jul 14, 2015
Welcome message from author
This document is posted to help you gain knowledge. Please leave a comment to let me know what you think about it! Share it to your friends and learn new things together.
Transcript

1
Oil & Natural Gas: The Evolving Freight Transportation Impacts Prepared for
July 30, 2013 Jackson Hole, WY
GE Capital Q3 All Employee Meeting
Logis&cs Engineering Supply Chain
CIT Rail Resources Conference
2
» Boutique consulting firm specializing in logistics, engineering, and supply chain § Established in 2001 § Over 100 clients and 250 engagements
» Headquarters in Chicago USA, with team members throughout the US and with “on the ground” experience in: § North America / Europe / South America / Asia / Middle East
» Consulting services § Strategy & optimization § Assessments & benchmarking § Transportation assets & infrastructure § Logistics operations § M&A/investments/private equity
» Key industry verticals § Oil & gas § Chemicals & plastics § Wind energy & project cargo § Bulk commodities (minerals, mining, agricultural) § Industrial manufactured goods § Private equity
About PLG Consulting

3
The Shale Development Revolution – Big Picture
Disruptive Technologies
• Hydraulic Fracturing • Horizontal Drilling
Continuous Evolution
• Constant Change • Rapid Change
Market Dynamics • Supply & Demand • Customers • Price • Logistics
3

4
Hydraulic Fracturing and Horizontal Drilling
» Rapid evolution of drilling technology § Fracking first used in 1947 § Revolutionary advances since 2009 § Time required for drilling 15,000+ ft. well cut in half in last
two years (nine days vs. 18) § Dramatic increase in efficiency per rig, making rig count
alone no longer a significant indicator of production § Hydraulic fracturing/horizontal drilling yields 3-10x the
initial production rate of conventional wells
» US uniquely positioned for the techniques § Private mineral rights § Drilling intensity (wells per acre) § 90% of rig fleet equipped for horizontal drilling
» Rapid ROI for E&P companies § Typical well earns back capital cost in 1-2 years § Depending on play productivity, “break even” point of
$40-85/bbl § Liquid plays providing highest returns
Source: L. Maugeri, Harvard Kennedy School; RBN; PLG analysis

5
Representative Productivity Gains – Fayetteville Shale Play
Source: Southwestern Energy investor presentation, June 2013

6
Shale Driving Growth in Natural Gas and Crude Oil Production
Source: Baker Hughes 2013
GAS OIL THERMAL
Source: Baker Hughes
U.S. Crude Oil Production
Source: EIA
April 2013 7.35 MM bpd
» 1,759 rigs in operation in USA as of June 21, 2013
» Dramatic production growth § 700% increase in gas production since 2007; forecast to grow 9
Bcf/d from 2012-2018 § Domestic oil production at 21 year high; forecast to reach 10MM
bbl/d by 2018
» IEA projects US to surpass Saudi Arabia in oil output, Russia in gas output by 2020

7
US Shale Plays
Gas: Marcellus Haynesville Barnett Oil: Bakken Eagle Ford Permian Basin
Most Active Plays
Utica (NGLs) Niobrara Mississippi Lime
Emerging Plays

8
Shale Development Supply Chain and Downstream Impacts
Feedstock (Ethane)
Byproduct (Condensate)
Home Heating (Propane)
Other Fuels
Other Fuels
Gasoline
Inputs >> Wellhead >> Direct Output >> Thermal >> Fuels >> Raw Materials >> Downstream Products
Gas
NGLs
Crude
Proppants
OCTG
Chemicals
Water
Cement
Generation Process Feedstocks
All Manufacturing
Steel
Fertilizer (Ammonia)
Methanol
Chemicals
Petroleum Products
Petrochemicals
» Over $95B in new announced “energy intensive” industrial plant expansions will come on-line over the next five years » Shale development impact on the railcar industry is long-term, wide-ranging, and positive with only one exception

9
Hydraulic Fracturing Materials Inputs and Logistics – Per Well
Materials
Chemicals
Clean Water/ Cement
Proppants
OCTG (Pipe)
Source to Transloading
2
Local source
40
5
Transloading to Wellhead Site
8
~1,000
160
20
47 Total Railcars
~1,200 Total Truckloads
Oil/Gas/NGLs
Truck, Rail, Pipeline
Waste Water
~500 Total Truckloads

10
Correlation of Operating Rig Count with Sand and Crude Shipments
STCC 14413 (sand) and 13111 (petroleum) Source: US Rail Desktop, Baker Hughes
1,695
1,814
1,270
886 939
1,073
1,299
1,467
1,604 1,665 1,691
1,798
1,911 1,972 1,948 1,965
1,864 1,763 1,762 1,759
0
500
1,000
1,500
2,000
2,500
0
20,000
40,000
60,000
80,000
100,000
120,000
140,000
160,000
180,000
2007 Avg. 2008 Avg. 2009 2010 2011 2012 2013
Ope
ratin
g O
nsho
re R
igs
Car
load
s
Operating On Shore Rigs All Sand Carloads Petroleum Carloads

11
All Sand Handled by Railroad
STCC 14413 Source: US Rail Desktop

12
» Wisconsin sand mining industry § 72 operational frac sand mines § 20 in development, 13 permitted, and 17
proposed § New applications are still coming in for new
mines
» Minnesota silica sand mining § 17 active frac sand mining facilities § Over 20 facilities in the planning stages
» Large barriers to entry § 1 - 3 years to find, permit, and start § Transportation key to success
» Industry consolidation continues § Focus on integrated supply chain
(US Silica)
Sand Mining Frac Sand Industry Across Wisconsin, May 1, 2013
Source: WisconsinWatch.org
Source: MPR News
Minnesota Frac Sand Mining, May 1, 2013
12 Source: WisconsinWatch.org, MPR News, May 2013

13
Processed Sand Total Delivered Cost
Source: PLG analysis
» Benchmark cost with well-executed performance § Example unit train movement from
Wisconsin to Texas with total delivered cost of approx. $180/ton
§ Logistics drives ~60% of total delivered sand cost
» Potential for significant cost add-ons caused by strategic and tactical issues
§ Sub-optimal logistics network design or infrastructure - Manifest service (rail) - Multi-carrier vs. single line haul (rail) - Equipment/driver shortages
§ Poor planning and/or execution - Rail and/or truck demurrage costs – Performance penalties
§ Uncompetitive sand price § Poor sand quality

14
Changes in Sand Logistics Model and Costs
» Rail rate advantage for volume and unit train vs. manifest service § On a per-ton basis between Wisconsin and Texas, spreads are 17-29%
» Western carriers are driving single line hauls and encouraging longer trains to Eagle Ford via pricing differentials
» Canadian and Eastern carriers are aggressively working to grow their markets by providing very competitive pricing and securing sand originations § CN/Superior Silica Sands – Poskin (Barron), WI
» Major sand providers establishing “in the play” transloading facilities to provide ready access to product § U.S. Silica - East Liverpool, OH § U.S. Silica – San Antonio, TX § Potential 2nd facility under consideration in San Antonio, TX
» Post-boom market maturation Source: PLG analysis
15
Sand Railcar Market Conditions
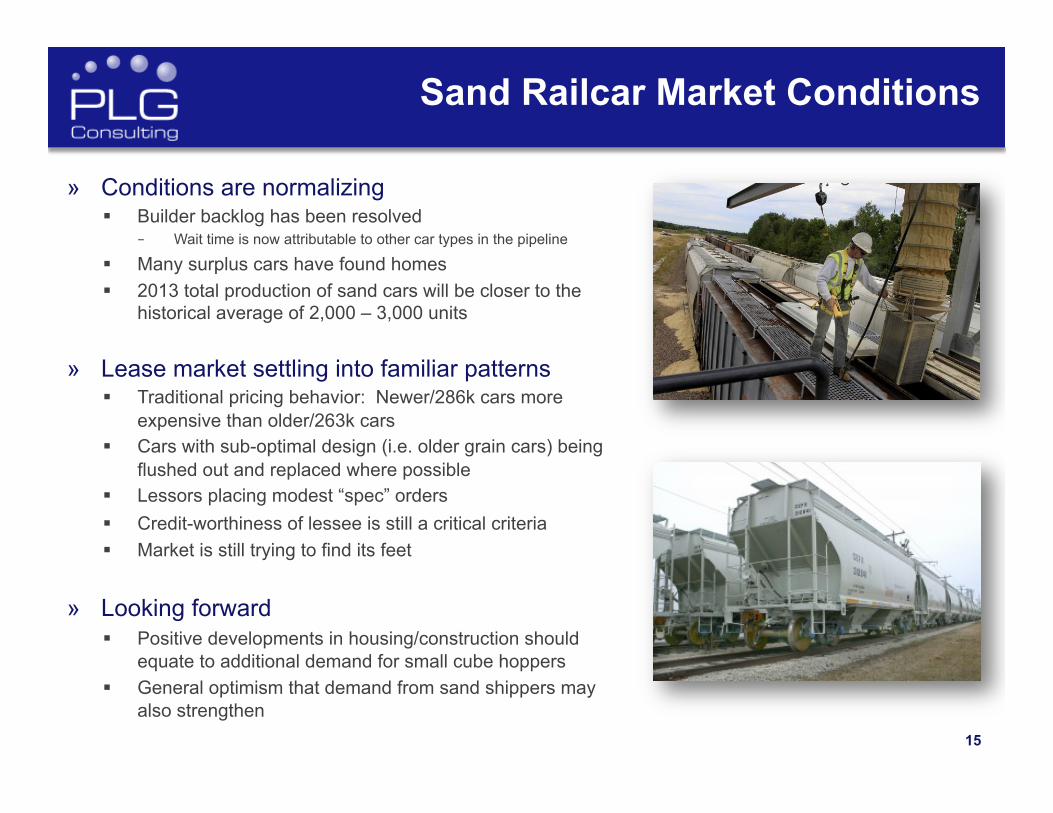
» Conditions are normalizing § Builder backlog has been resolved
– Wait time is now attributable to other car types in the pipeline
§ Many surplus cars have found homes § 2013 total production of sand cars will be closer to the
historical average of 2,000 – 3,000 units
» Lease market settling into familiar patterns § Traditional pricing behavior: Newer/286k cars more
expensive than older/263k cars § Cars with sub-optimal design (i.e. older grain cars) being
flushed out and replaced where possible § Lessors placing modest “spec” orders § Credit-worthiness of lessee is still a critical criteria § Market is still trying to find its feet
» Looking forward § Positive developments in housing/construction should
equate to additional demand for small cube hoppers § General optimism that demand from sand shippers may
also strengthen
16
Shale Play Product Flows Outbound
» Natural Gas § Majority via pipelines, some trucks
» Natural Gas Liquids (NGLs) § Requires processing (fractionation) § 3-9 gallons/MCF (thousand cubic feet)
– Ethane ~42-65% – Propane ~28% – Normal Butane ~8% – Iso-Butane ~9% – Condensate ~13%
» Crude Oil § Bakken play as a model § Surging Permian and Eagle Ford development

17
Shale Development Natural Gas Impacts
» Industry a “victim of its own success” § Fracking results in oversupply; gas prices down
33% since 2010 § Breakeven gas price at 10% IRR: ~$3.25 mm/btu § Rigs leave Marcellus, other gas plays for oil plays
(~700 “non producing” wells in PA) § Helped to deflate frac sand boom
» Lower gas prices have resulted in 10-13% market share capture from coal for thermal generation
» Low gas prices fueling industrial
renaissance § Overall manufacturing (cost of electricity; “re-
shoring”) § Specific sectors that use natural gas as a
feedstock – Methanol (16MM m/t new capacity under consideration) – Steel – Fertilizer
17 Source: RBN, PLG analysis
Source: RBN
18
Source: EIA, Deloitte
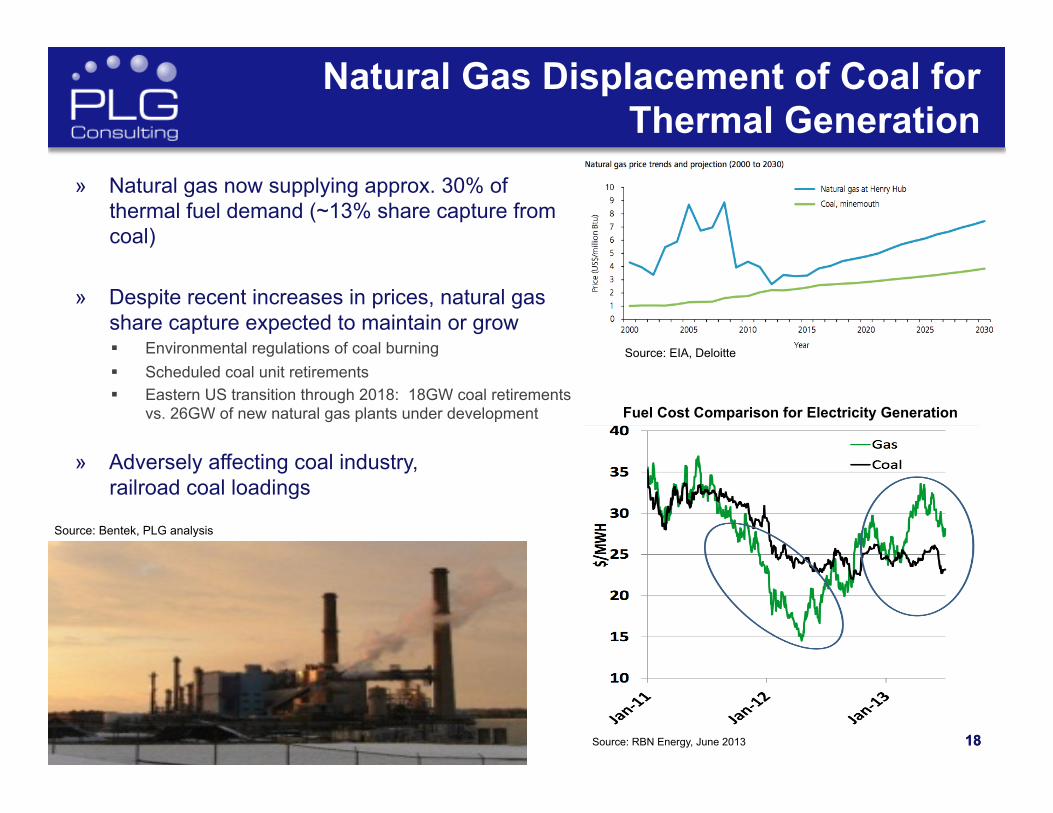
Natural Gas Displacement of Coal for Thermal Generation
» Natural gas now supplying approx. 30% of thermal fuel demand (~13% share capture from coal)
» Despite recent increases in prices, natural gas
share capture expected to maintain or grow § Environmental regulations of coal burning § Scheduled coal unit retirements § Eastern US transition through 2018: 18GW coal retirements
vs. 26GW of new natural gas plants under development
» Adversely affecting coal industry, railroad coal loadings
18 Source: RBN Energy, June 2013
Fuel Cost Comparison for Electricity Generation
Source: Bentek, PLG analysis

19
Shale Related Rail Traffic Still Small Relative to Coal Volumes
0
500,000
1,000,000
1,500,000
2,000,000
2,500,000
2008
2009
2010
2011
2012
2013
Sand Crude
Coal
Car
load
s
Quarterly Data
Sand
Crude
Coal
STCC 14413 (sand), 13111 (petroleum), 11212 (coal) Source: US Rail Desktop
Railcars Handled: Sand, Crude, & Coal

20
Coal, Crude & Sand Trends: Carloads and Revenue
$0
$2
$4
$6
$8
$10
$12
$14
$16
$18
-
1
2
3
4
5
6
7
8
9
10
2008 2009 2010 2011 2012
Bill
ions
Mill
ions
Carloads Revenue
$0.0
$0.5
$1.0
$1.5
$2.0
$2.5
$3.0
-
100
200
300
400
500
600
700
800
900
2008 2009 2010 2011 2012
Bill
ions
Thou
sand
s
Sand Crude Revenue
STCC 14413 (sand), 13111 (petroleum), 11212 (coal) Source: US Rail Desktop
Total Coal Carloads and Revenue Combined Sand and Crude Carloads and Revenue

21
Shale Gas Driving Steel Manufacturing Comeback in US
» Shale gas boom makes direct-reduced iron steel economical § Not new technology, but preferable with lower cost natural gas § DRI process uses natural gas in place of coal to produce iron § Cost of production 20% lower per ton vs. traditional blast furnace
» U.S. jobs and international investment § Steel production in the U.S has shrunk 13% since Jan. 2008 – Compare to 20% growth in steel production internationally
§ At least five new DRI steel plants being considered in the U.S. – now economical for the first time in 30 years due to low cost of natural gas
§ Both domestic and international firms investing in the technology
» Reciprocal growth § Increased demand for U.S. steel creates greater demand for U.S. gas § Tubular steel products has 8% yearly growth in demand, driven by
increase in shale oil and gas (Oilprice.com) § Joint venture between Nucor Corp. and Encana Corp. commits $3
billion to development of new gas wells to support DRI plants § Voestalpine $740MM investment in Texas § Potential US Steel-Republic Steel JV to produce DRI § DRI-derived steel of higher quality than that created from recycled
scrap, further driving demand
Source: World Steel Association
22
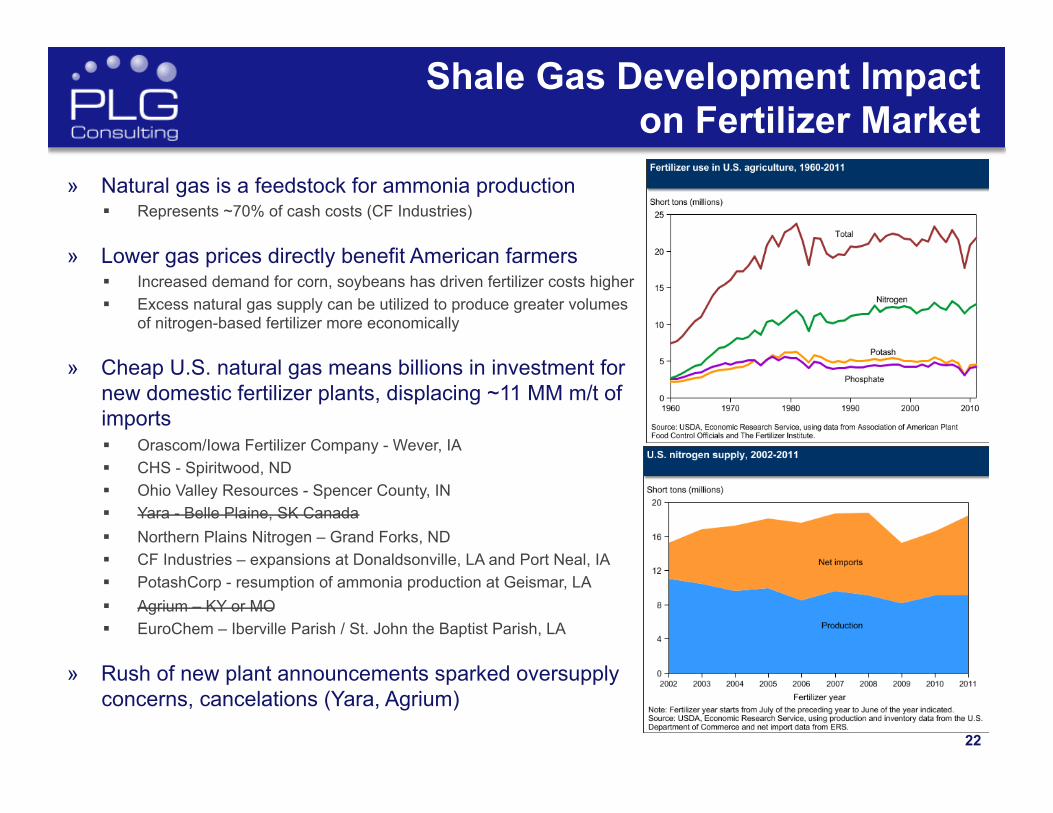
Shale Gas Development Impact on Fertilizer Market
» Natural gas is a feedstock for ammonia production § Represents ~70% of cash costs (CF Industries)
» Lower gas prices directly benefit American farmers § Increased demand for corn, soybeans has driven fertilizer costs higher § Excess natural gas supply can be utilized to produce greater volumes
of nitrogen-based fertilizer more economically
» Cheap U.S. natural gas means billions in investment for new domestic fertilizer plants, displacing ~11 MM m/t of imports § Orascom/Iowa Fertilizer Company - Wever, IA § CHS - Spiritwood, ND § Ohio Valley Resources - Spencer County, IN § Yara - Belle Plaine, SK Canada § Northern Plains Nitrogen – Grand Forks, ND § CF Industries – expansions at Donaldsonville, LA and Port Neal, IA § PotashCorp - resumption of ammonia production at Geismar, LA § Agrium – KY or MO § EuroChem – Iberville Parish / St. John the Baptist Parish, LA
» Rush of new plant announcements sparked oversupply concerns, cancelations (Yara, Agrium)
23
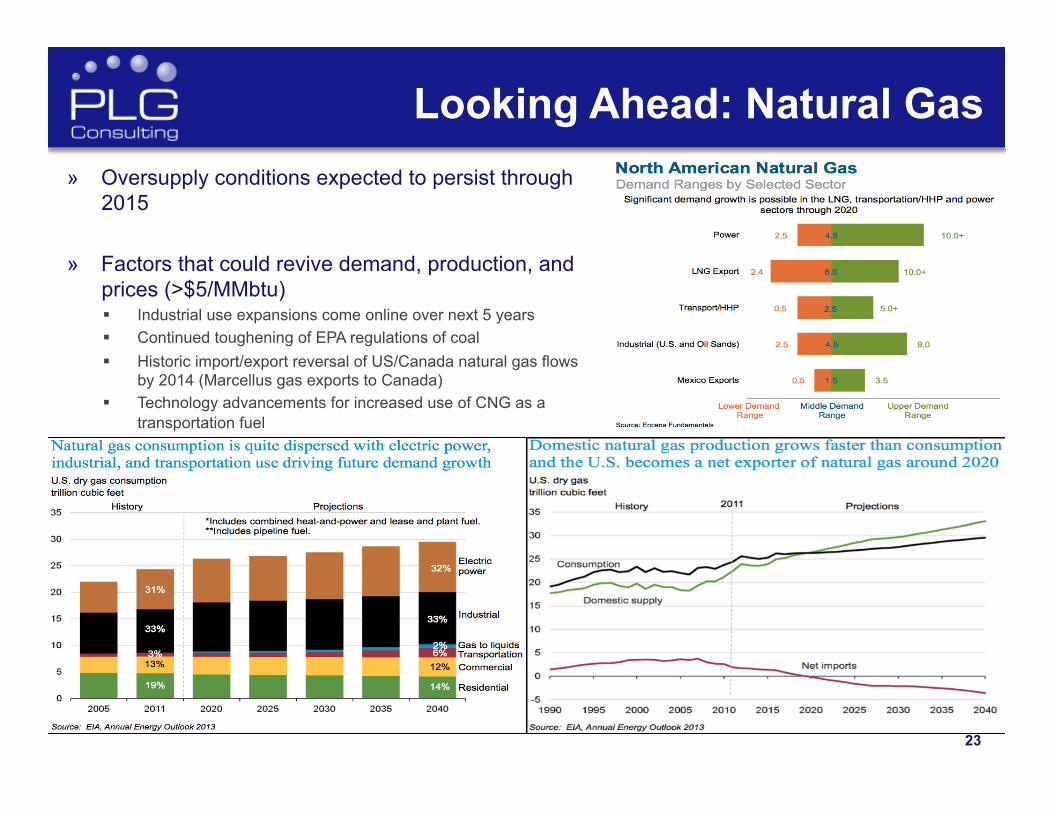
Looking Ahead: Natural Gas » Oversupply conditions expected to persist through
2015 » Factors that could revive demand, production, and
prices (>$5/MMbtu) § Industrial use expansions come online over next 5 years § Continued toughening of EPA regulations of coal § Historic import/export reversal of US/Canada natural gas flows
by 2014 (Marcellus gas exports to Canada) § Technology advancements for increased use of CNG as a
transportation fuel

24
LNG Export Opportunity » Political/policy battle between domestic industrial users and
producers
» Sabine Pass, LA and Freeport, TX now permitted for exports § 3.4 Bcf/day export capacity to come online by 2015 § Represents ~5% of projected US dry gas production
» 20 additional terminal applications totaling 29 Bcf/day of export capacity pending before FERC
Source: Waterborne Energy Inc. Data in $US/MMBtu Source: Congressional Research Service, EIA
Selected US Natural Gas Import & Export Infrastructure

25
Shale Development NGL Impacts
» Leading NGL and “wet gas” plays are Eagle Ford, Utica § Significant investment and expansion of gathering,
fractionation, and takeaway capacity underway in the Utica Play
§ Takeaway capacity in Eagle Ford well exceeds current production (4x)
» Requires fractionation facilities proximal to production § “Y-grade” must be separated into purified products § 75% of fractionation capacity in US Gulf Coast § Mt. Belvieu, TX major trading & storage hub § 500 Mb/d of new fractionation capacity planned for
Utica § Utica NGL production growth expected to exceed
600% between 2013-2015
» Similar to dry gas, strong production due to fracking has resulted in oversupply and depressed prices § Chemical industry benefits

26 Source: American Chemistry Council, May 2013
Shale Development Impact: Chemical Industry
» Abundant ethane supplies have sparked chemical industry renaissance
§ 100% of captured ethane is “cracked” to make ethylene, the most basic building block in the chemicals supply chain
§ Planned expansions will increase US ethylene capacity 33% (11 MMmt) by 2017
§ USA is now the low-cost producer of ethylene-based chemicals due to abundant supplies of ethane from shale plays (up to 60% raw materials cost advantage)
Source: EIA
§ Domestic end-use of materials, i.e. plastics, will expand significantly
§ Up to 40% of new petrochemical output will be for export
§ New demand for plastic resin hoppers, specialty and pressure tank cars

27
Natural Gas & Petrochemical Downstream Products
Feedstock/ Intermediary
Finished Products
Natural Gas, OIl
Ethane, Naphtha, etc.
Ethylene
Miscellaneous
Vinyl Acetate
Linear Alcohols
Ethyl Benzene
Ethylene Oxide
Ethylene Dichloride
High Density Polyethylene
Low-Density Polyethylene
Adhesives, coatings, textile/paper. finishing, flooring
Detergents
Styrene
Ethylene Glycol
Vinyl Chloride
House wares, crates, drums, food containers,
bottles.
Food packaging, film, trash bags, diapers, toys
PVC
Antifreeze
Fibers
PET
Miscellaneous
Polystyrene
SAN
SBR
Latex
Miscellaneous
Medical gloves, carpeting, coatings
Tire, hose
Instrument lenses, house wares
Insulation, cups
Siding, windows, frames, pipe, medical
tubing
Pantyhose, carpets, clothing
Bottles, film

28
Looking Ahead: NGLs
Source: Canadian Energy Research Ins&tute
Source: Sunoco Logis&cs
» US NGL production forecast to increase by 1.6MM b/d from 2012-2018
» The (somewhat) hidden Condensate story
§ Used as diluent for heavy Canadian tar sands oil – critical for transportation as “Dilbit”
§ Significant investment in infrastructure being made to deliver Eagle Ford, Utica condensate to Western Canada
§ Primary delivery via pipeline, but major rail volumes ex. Utica are required to get to Midwest pipeline injection points
§ Canadian diluent import demand expected to grow from 200 Mb/d to 500 Mb/d by 2018
» Expect export market for NGLs to expand § Pipeline reversals undertaken to meet demand,
particularly ex. Utica to Sarnia, ON petrochemical complex and export storage and dock facilities in Philadelphia
§ US projected to export over 1MM bb/d of NGLs by 2018
Source: RBN, PLG analysis

29
Shale Development Crude Oil Impacts
» Dramatic increases in US production due to hydraulic fracturing and horizontal drilling § 7.35 MM bbl./day § Projected to grow by ~30% over next four years § Strong play in Bakken; surging Permian and Eagle Ford development § “Tight” oil sources driving overall North American growth § Production forecasts frequently revised upward
Source: Morgan Stanley, February 2013

30
Driving Toward “Oil Independence?” » Decreasing dependency on foreign crude
§ Combination of US shale plus Canadian oil sands estimated to reduce imports to <15% by 2020
» Supply isn’t enough – “independence” also relies on lower domestic fuels consumption § CAFE standards the primary driver

31
Displacement of Waterborne Crudes by Mid-Continent Sources
» Reducing imports means reducing waterborne crudes § West African imports already down ~70% from 2010 levels
» Mid-continent sources displacing imports at coasts, making rail critical to the total crude market § Bakken as case study for large crude by rail operations
Source: BENTEK Energy

32
Some Basic Facts About Crude Oil: Grades and Qualities
» Not all crudes are created equal – light/sweet vs. heavy/sour § Heavy/sour crudes include Western
Canada, Venezuela, Mexico, Alaska North Slope (ANS), Middle East (light/sour)
§ Heavy/sour has higher sulfur content, yield for asphalt, diesel
» Refineries are generally configured to run certain types of crude § Significant investments made ($48B
since 2005) at select refineries to install coker units that will allow processing of heavy/sour
§ Major heavy/sour refining clusters: Texas Gulf Coast, Chicago, southern Illinois, California
Source: RBN Energy

33
Some Basic Facts About Crude Oil: Major Production and Refining Areas
» The special case of the Canada Oil Sands § Heavy/sour crude has a natural home in Midwest and US Gulf
Coast (~2.8 MM bpd demand at USGC) § Pipeline capacity to US Midwest refining centers is at capacity § Pipeline developments to coasts, US markets still 2+ years
away § Railbit/dilbit via rail requires coiled, lined/insulated cars
» Brent, WTI, and US shale play crudes (Bakken, Permian, Niobrara, Eagle Ford) are light/sweet § US is close to saturation point on light/sweet crude at mid-
continent and USGC refining areas Source: CAPP, June 2013
Source: Turner Mason, RBN Energy
US Crude Oil Production Growth by Grade
Source: RBN Energy
34
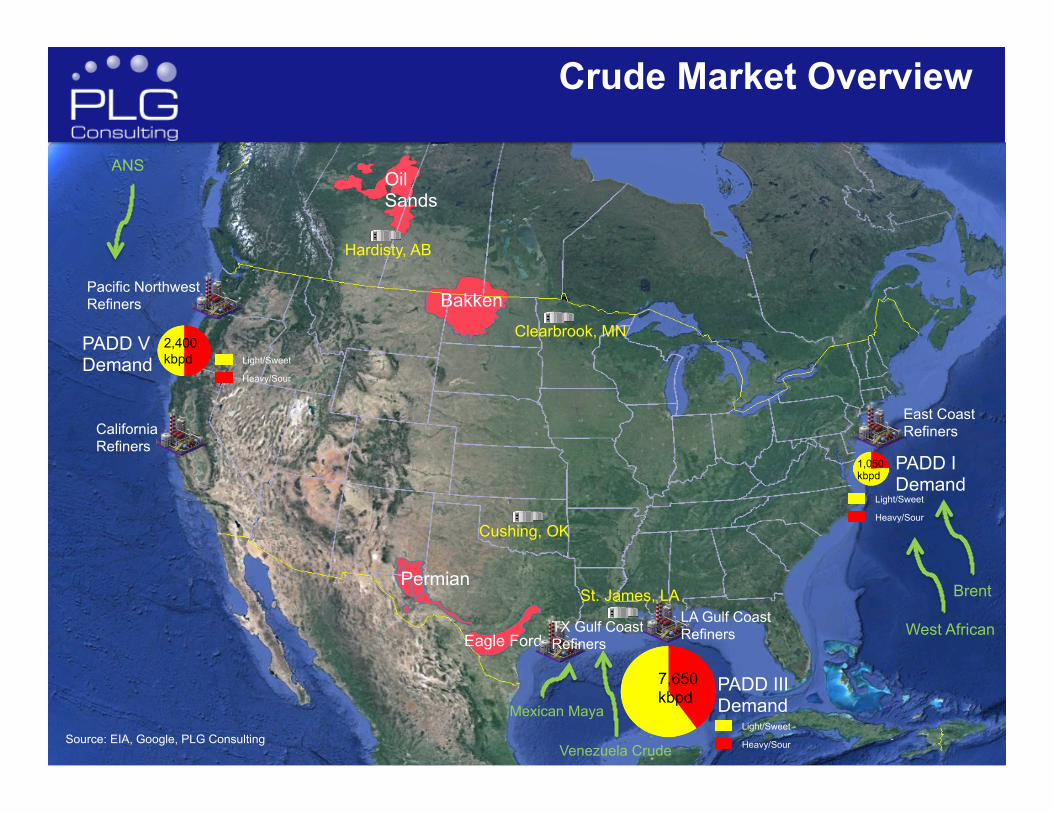
Crude Market Overview
Bakken
Oil Sands
Permian
Eagle Ford
Hardisty, AB
Clearbrook, MN
Cushing, OK
St. James, LA
East Coast Refiners
Pacific Northwest Refiners
California Refiners
TX Gulf Coast Refiners
LA Gulf Coast Refiners
PADD I Demand
PADD III Demand
7,650 kbpd
PADD V Demand
2,400 kbpd
1,050 kbpd
Light/Sweet
Heavy/Sour
Light/Sweet
Heavy/Sour
Light/Sweet
Heavy/Sour
Brent
Mexican Maya
Venezuela Crude
West African
ANS
Source: EIA, Google, PLG Consulting

35
Bakken Oil Production and Logistics - History
» 2010-2011 discount of ~$8-12/bbl for Bakken crude vs. peer WTI § Undervalued due to logistics constraints “stranding” the oil
» Early objective of crude-by-rail was to bridge gap until pipelines built, but has now become the primary transport mode for Bakken crude § ~70% rail market share § Pipelines operating below capacity; some project cancelations
» Significant development of crude by rail loading terminals in 2011-2012 § Takeaway capacity now exceeds production § Bakken vs. WTI differential near even (within ~$3) § Rail captures majority market share
Source: North Dakota Pipeline Authority, PLG Analysis
Source: EIA, North Dakota Pipeline Authority, PLG
~810,000 BPD May 2013
First outbound unit train shipment December, 2009

36
Crude Oil by Rail – North Dakota Terminals
North Dakota Crude Oil Rail Loading Capacity (Barrels Per Day) Rail Terminals 2013 2014* 2015* Rail Carrier EOG Rail, Stanley, ND (Up to 90,000 BOPD) 65,000 65,000 65,000 BNSF
Inergy COLT Hub, Epping, ND (Q2 2012) 120,000 120,000 120,000 BNSF
Hess Rail, Tioga, ND (Up to 120,000 BOPD) 60,000 60,000 60,000 BNSF
Bakken Oil Express, Dickinson, ND 100,000 100,000 100,000 BNSF
Savage Services, Trenton, ND (Q2 2012 Unit Trains) 90,000 90,000 90,000 BNSF
Enbridge, Berthold, ND (Q4 2012) 80,000 80,000 80,000 BNSF
Great Northern Midstream, Fryburg, ND (Q1 2013) 60,000 60,000 60,000 BNSF
Musket, Dore, ND (Q2 2012) 60,000 60,000 60,000 BNSF
Plains, Ross, ND 65,000 65,000 65,000 BNSF
Global/Basin Transload, Zap, ND (Estimate Not Confirmed) 40,000 40,000 40,000 BNSF
BNSF Total Capacity 740,000 740,000 740,000
Plains - Van Hook, New Town, ND 65,000 65,000 65,000 CP
Dakota Plains, New Town, ND 30,000 80,000 80,000 CP
Global Partners, Stampede, ND 60,000 60,000 60,000 CP
CP Total 155,000 205,000 205,000
Various Sites in Minot, Dore, Donnybrook, and Gascoyne 30,000 30,000 30,000
Total Crude Oil Rail Loading Capacity 925,000 975,000 975,000
*Project still in the review or proposed phase Year End System Capacity
Source: North Dakota Pipeline Authority (June 2013), PLG Analysis

37
North Dakota Class I Railroads and Crude Oil Terminals
Map by PLG Consulting 37

38
Bakken Area Outbound Pipelines
38
North Dakota Crude Oil Pipeline Capacity (Barrels Per Day) Pipelines 2013 2014* 2015* Butte Pipeline 160,000 160,000 160,000 Butte Loop* (Late 2014) - 110,000 110,000 Enbridge Mainline North Dakota 210,000 210,000 210,000 Enbridge Bakken Expansion Program (Q1-11/Q1-13) 145,000 145,000 145,000 Plains Bakken North (Q2 2013, Up to 75,000 BOPD) 50,000 50,000 50,000 High Prairie Pipeline* - 150,000 150,000 Enbridge Sandpiper* (Q1 2016) - - - TransCanada Keystone XL* (2015) - - 100,000 TransCanada Bakken Marketlink * (4Q 2015) - - 100,000
Hiland Partners Double H Pipeline (Q3 2014, Up to 100,000 BOPD) 50,000 50,000 Pipeline Total 565,000 875,000 1,075,000 *Project Still in the Review or Proposed Phase Year End System Capacity
Source: North Dakota Pipeline Authority (June 2013)
39
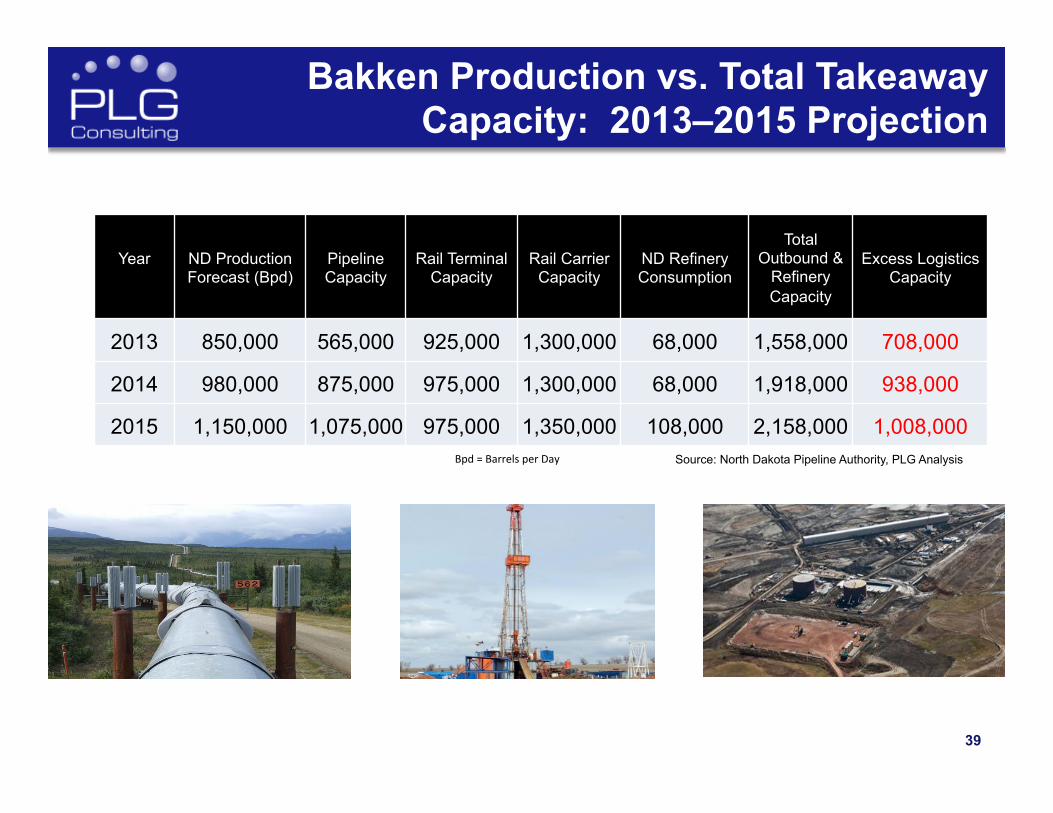
Bakken Production vs. Total Takeaway Capacity: 2013–2015 Projection
Year
ND Production Forecast (Bpd)
Pipeline Capacity
Rail Terminal Capacity
Rail Carrier Capacity
ND Refinery Consumption
Total Outbound &
Refinery Capacity
Excess Logistics Capacity
2013 850,000 565,000 925,000 1,300,000 68,000 1,558,000 708,000
2014 980,000 875,000 975,000 1,300,000 68,000 1,918,000 938,000
2015 1,150,000 1,075,000 975,000 1,350,000 108,000 2,158,000 1,008,000 Source: North Dakota Pipeline Authority, PLG Analysis Bpd = Barrels per Day
40
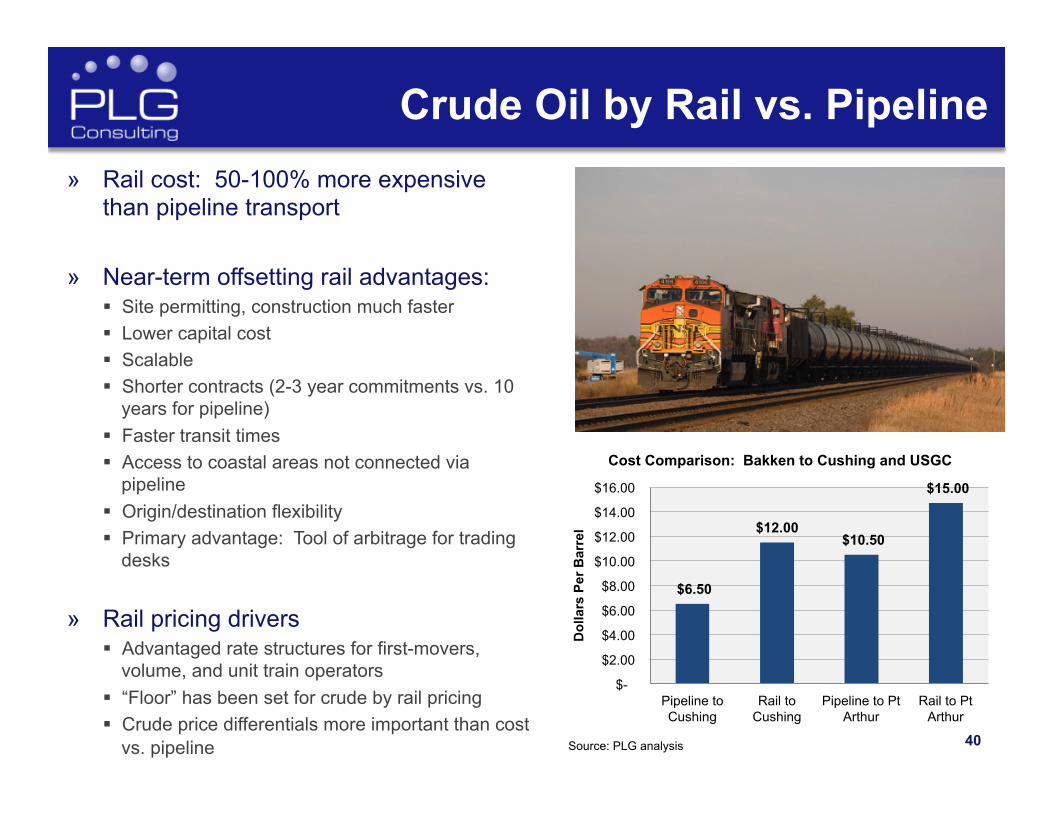
Crude Oil by Rail vs. Pipeline
$6.50
$12.00 $10.50
$15.00
$-
$2.00
$4.00
$6.00
$8.00
$10.00
$12.00
$14.00
$16.00
Pipeline to Cushing
Rail to Cushing
Pipeline to Pt Arthur
Rail to Pt Arthur
Dol
lars
Per
Bar
rel
Source: PLG analysis
» Rail cost: 50-100% more expensive than pipeline transport
» Near-term offsetting rail advantages: § Site permitting, construction much faster § Lower capital cost § Scalable § Shorter contracts (2-3 year commitments vs. 10
years for pipeline) § Faster transit times § Access to coastal areas not connected via
pipeline § Origin/destination flexibility § Primary advantage: Tool of arbitrage for trading
desks
» Rail pricing drivers § Advantaged rate structures for first-movers,
volume, and unit train operators § “Floor” has been set for crude by rail pricing § Crude price differentials more important than cost
vs. pipeline
Cost Comparison: Bakken to Cushing and USGC

41
All Crude Handled by Railroad Volume Growth
STCC 13111 Source: US Rail Desktop

42
Source: CAPP Report, 2013
Crude Oil Pipelines: Existing and Planned
» Current pipelines ex. Bakken operating below capacity § However, volumes have
increased over past 60 days
» Pipeline industry has been challenged by new dynamic NA oil market § Fixed routes, long lead times § 10 year commitments required
for new build pipeline projects § Lack of subscription interest in
KM Freedom project (Permian-California)
» Several natural gas pipeline conversions planned § Trunkline (ETP) – Patoka, IL-
St. James, LA § Energy East (TransCanada) –
Hardisty, AB-St. Johns, NS
43 43
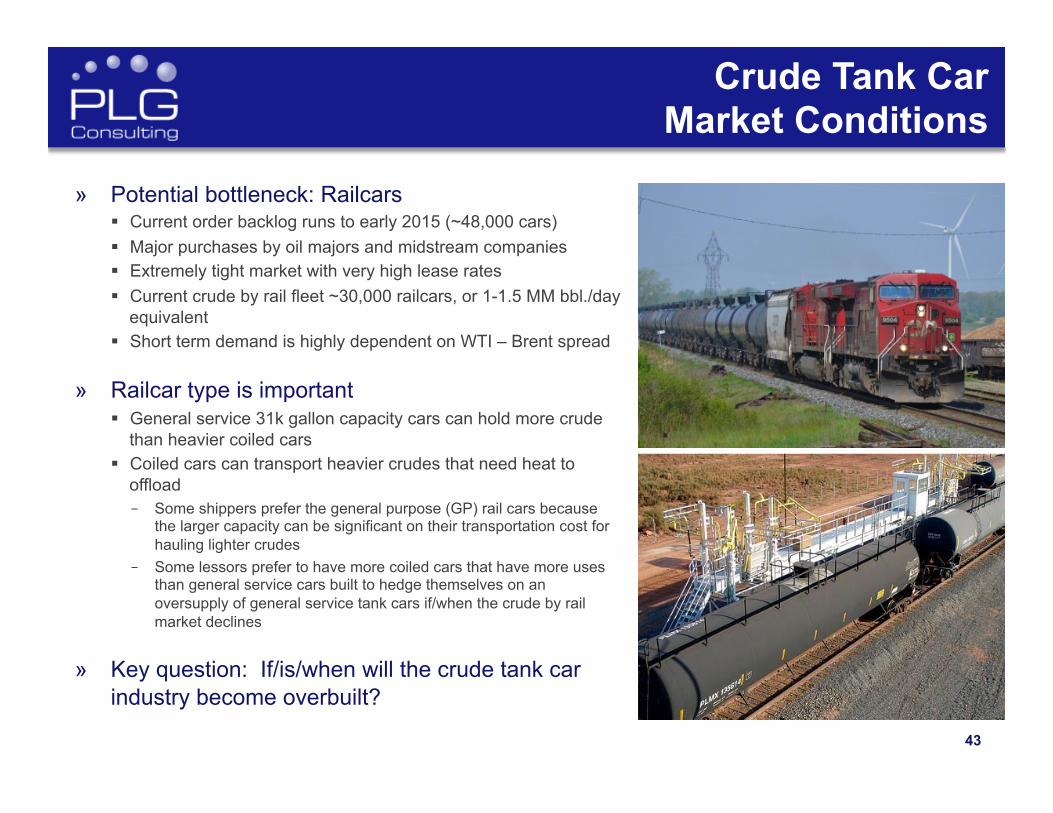
Crude Tank Car Market Conditions
» Potential bottleneck: Railcars § Current order backlog runs to early 2015 (~48,000 cars) § Major purchases by oil majors and midstream companies § Extremely tight market with very high lease rates § Current crude by rail fleet ~30,000 railcars, or 1-1.5 MM bbl./day
equivalent § Short term demand is highly dependent on WTI – Brent spread
» Railcar type is important § General service 31k gallon capacity cars can hold more crude
than heavier coiled cars § Coiled cars can transport heavier crudes that need heat to
offload – Some shippers prefer the general purpose (GP) rail cars because
the larger capacity can be significant on their transportation cost for hauling lighter crudes
– Some lessors prefer to have more coiled cars that have more uses than general service cars built to hedge themselves on an oversupply of general service tank cars if/when the crude by rail market declines
» Key question: If/is/when will the crude tank car industry become overbuilt?

44
0
500
1,000
1,500
2,000
2,500
3,000
Mar-13 Sep-13 Mar-14 Sep-14 Mar-15 Sep-15
Thou
sand
bbl
/day
Best-Case Crude by Rail Potential vs. Crude Railcar Capacity
Other Production Sources Williston (Bakken)
Oil Sands Crude Railcar Capacity
Forecast of Crude Railcar Supply and Demand
» Production increases vs. railcar capacity increases § March crude fleet was ~30k cars and
backlog was ~48.2k Backlog runs through mid 2015
§ If pipelines and local refining can consume production increases in Permian and Eagle Ford, crude by rail will be primarily Bakken and Canadian Oil Sands productions
» Under best-case scenario for rail market share capture, data suggests existing & planned tank car fleet exceeds demand
Sources: CAPP, AAR, NDPA, GATX, and PLG analysis
Railcar backlog is through mid 2015; retirement of old railcars will reduce capacity if no additional railcars built
Q1 2013 originated rail carloads of crude petroleum were 97,135, which equates to 755,000 barrels per day (assume 700/bbl. average capacity)
Assumptions: • 80% of projected Williston Basin production • 80% utilization of Oil Sands announced 300 kbpd of rail terminals through 2014, and 80% utilization of an additional 300 kbpd for 2015 • 30,000 crude railcars in March and build rate of 21,500 railcars/year through 2015 with attrition rate of 7,800 railcars/year • 700 bbl. average railcar capacity and average 17 day turn • Other production sources at constant 165 kbpd
45 45
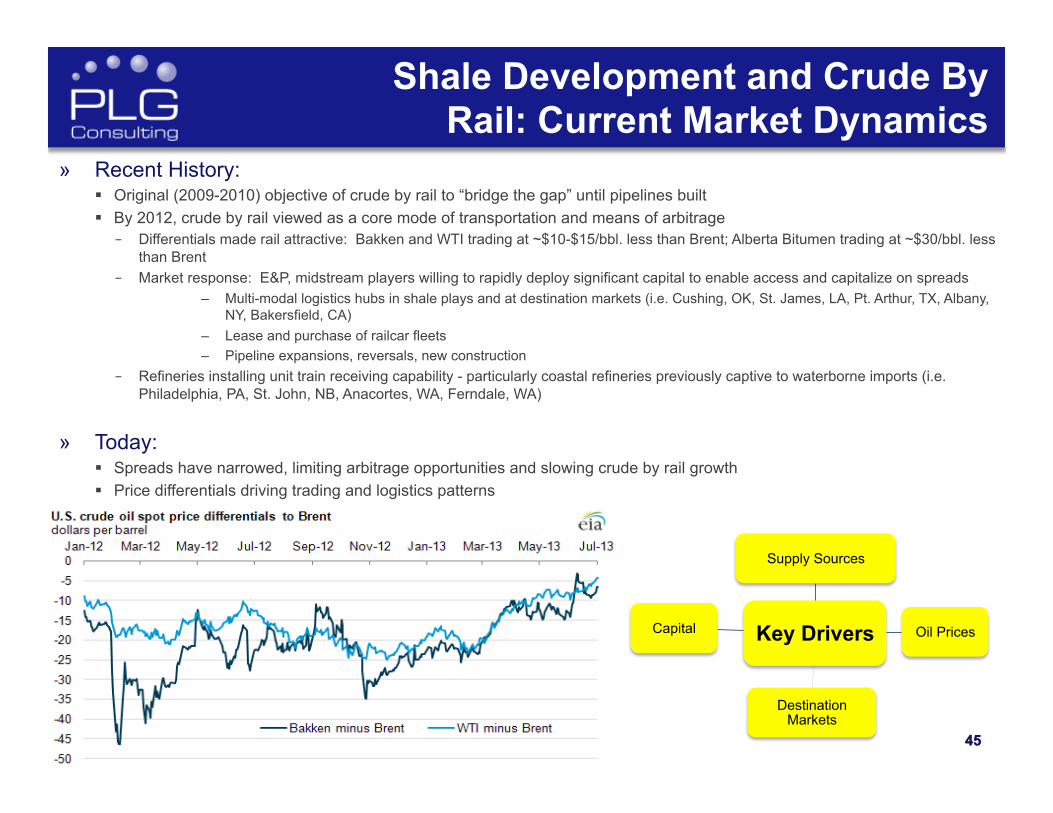
Shale Development and Crude By Rail: Current Market Dynamics
» Recent History: § Original (2009-2010) objective of crude by rail to “bridge the gap” until pipelines built § By 2012, crude by rail viewed as a core mode of transportation and means of arbitrage – Differentials made rail attractive: Bakken and WTI trading at ~$10-$15/bbl. less than Brent; Alberta Bitumen trading at ~$30/bbl. less
than Brent – Market response: E&P, midstream players willing to rapidly deploy significant capital to enable access and capitalize on spreads
– Multi-modal logistics hubs in shale plays and at destination markets (i.e. Cushing, OK, St. James, LA, Pt. Arthur, TX, Albany, NY, Bakersfield, CA)
– Lease and purchase of railcar fleets – Pipeline expansions, reversals, new construction
– Refineries installing unit train receiving capability - particularly coastal refineries previously captive to waterborne imports (i.e. Philadelphia, PA, St. John, NB, Anacortes, WA, Ferndale, WA)
» Today: § Spreads have narrowed, limiting arbitrage opportunities and slowing crude by rail growth § Price differentials driving trading and logistics patterns
45
Key Drivers
Supply Sources
Oil Prices
Destination Markets
Capital

46
Oil Sands
Hardisty, AB
Heavy/Sour Crude Logistics and Price Differentials – July 2013
$89
Heavy/Sour at TX GC Mexican Maya (ship): $98 WCS (pipe): $107 WCS (rail): $113
Spread Dec. 2012 July 2013 Change Mexican Maya - WCS $33.55/bbl $8.90/bbl -$24.65/bbl
Crude Prices from July 2013 Sources: EIA, CME Group, Platts, Google, PLG analysis 46
TX Gulf Coast Refiners
Pacific Northwest Refiners
California Refiners
PADD III Demand
7,650 kbpd
PADD V Demand
2,400 kbpd Light/Sweet
Heavy/Sour
Light/Sweet
Heavy/Sour Mexican Maya
Marine
Rail Pipeline
Clearbrook, MN
Chicago, IL

47
Light/Sweet Crude Logistics and Price Differentials – July 2013
Bakken
Permian
Eagle Ford
East Coast Refiners
Pacific Northwest Refiners
California Refiners
TX Gulf Coast Refiners
LA Gulf Coast Refiners
$6
Light/Sweet at TX GC Bakken (pipe): $107 Brent (ship): $108 WTI (pipe): $111
Light/Sweet at PNW Bakken (rail): $109 Brent (ship): $108
Light/Sweet at EC Bakken (rail): $111 Brent (ship): $108
Light/Sweet at LA GC Bakken (rail): $111 LLS (local): $110
Spread Dec. 2012 July 2013 Change Brent - WTI $21.83/bbl $2.82/bbl -$19.01/bbl LLS - WTI $20.00/bbl $4.90/bbl -$15.10/bbl WTI - Bakken (Clearbrook) $3.00/bbl $2.54/bbl -$0.46/bbl Brent
ANS
Brent
47
Crude Prices from July 2013 Sources: EIA, Bloomberg, Platts, Baytex Energy, Google, CME Group, PLG analysis
PADD I Demand
PADD III Demand
7,650 kbpd
PADD V Demand
2,400 kbpd
1,050 kbpd
Light/Sweet
Heavy/Sour
Light/Sweet
Heavy/Sour
Light/Sweet
Heavy/Sour
Marine
Rail Pipeline
Chicago, IL
Clearbrook, MN
Cushing, OK
St. James, LA
$96 (wellhead)
WTI:$105

48 48
Looking Ahead: North American Crude Oil Logistics
» The gusher of new US light/sweet shale oil production made possible by fracking has upended the traditional oil logistics and trading patterns § Result: “Wrong place/wrong oil” supply displacements, i.e. Cushing overflow § Rapid investment in new logistics infrastructure, routes, modes, and terminals – Bakken now sufficiently developed; next immediate areas for significant investment are Utica, Oil Sands,
Permian, coastal areas and intermediate routes and facilities that support bitumen transport in particular
» A “new normal” in crude oil flows will emerge in conjunction with
continued North American oil production over the next five years § Continued shifts of mid-continent light/sweet to coastal destinations § New modes and infrastructure to get Canadian bitumen to USGC, with or without Keystone
XL § Permian, Eagle Ford to meet USGC light/sweet demand; Bakken flows primarily east-west § Significant oversupply of light/sweet and super-light grades
» Expect eventual government approval of light/sweet crude oil and condensate exports on a limited basis, similar to LNG
» Primary threats to crude by rail business 1. Narrow WTI-Brent spread 2. Glut of Permian and Eagle Ford light sweet oil displacing rail volumes to USGC to Gulf
Coast (but somewhat offset by new rail deliveries from Oil Sands) 3. Continued pipeline development 4. Water-borne Eagle Ford crude deliveries to USEC

49
Looking Ahead: Crude Oil Anticipated Production Growth and Product Flows
Source: BENTEK Energy, CAPP, Railroad Commission of Texas, ND Pipeline Association, Google, PLG Consulting
= Current 2013 = Future 2017
Anticipated Production Growth
Permian 1,680 1,200 +40%
1,600 800 Eagle Ford
+100%
Bakken +56% 871
1,363
Marine
East Coast Refiners
Oil Sands
2,590 1,985 +30%
Hardisty, AB
Cushing, OK
LA Gulf Coast Refiners
Light/Sweet
St. James, LA
Rail Pipeline
Pacific Northwest Refiners
California Refiners
TX Gulf Coast Refiners
Heavy/Sour
Clearbrook, MN
Chicago, IL

50
Thank You! For follow up questions and information, please contact PLG:
+1-312-957-7757 / [email protected]
Taylor Robinson, President
Graham Brisben, CEO
Jean Arndt, Vice President
Jeff Dowdell, Senior Consultant
Gordon Heisler, Senior Consultant
Jeff Rasmussen, Senior Consultant
Jay Olberding, Analyst
This presentation is available at: WWW.PLGCONSULTING.COM
Professional Logistics Group
Related Documents