Oil and Gas Methane Emissions: Impacts, Sources, and Solutions Andrew Williams June 27, 2016

Welcome message from author
This document is posted to help you gain knowledge. Please leave a comment to let me know what you think about it! Share it to your friends and learn new things together.
Transcript

Oil and Gas Methane Emissions:Impacts, Sources, and Solutions
Andrew WilliamsJune 27, 2016
Visualizing Unseen Methane
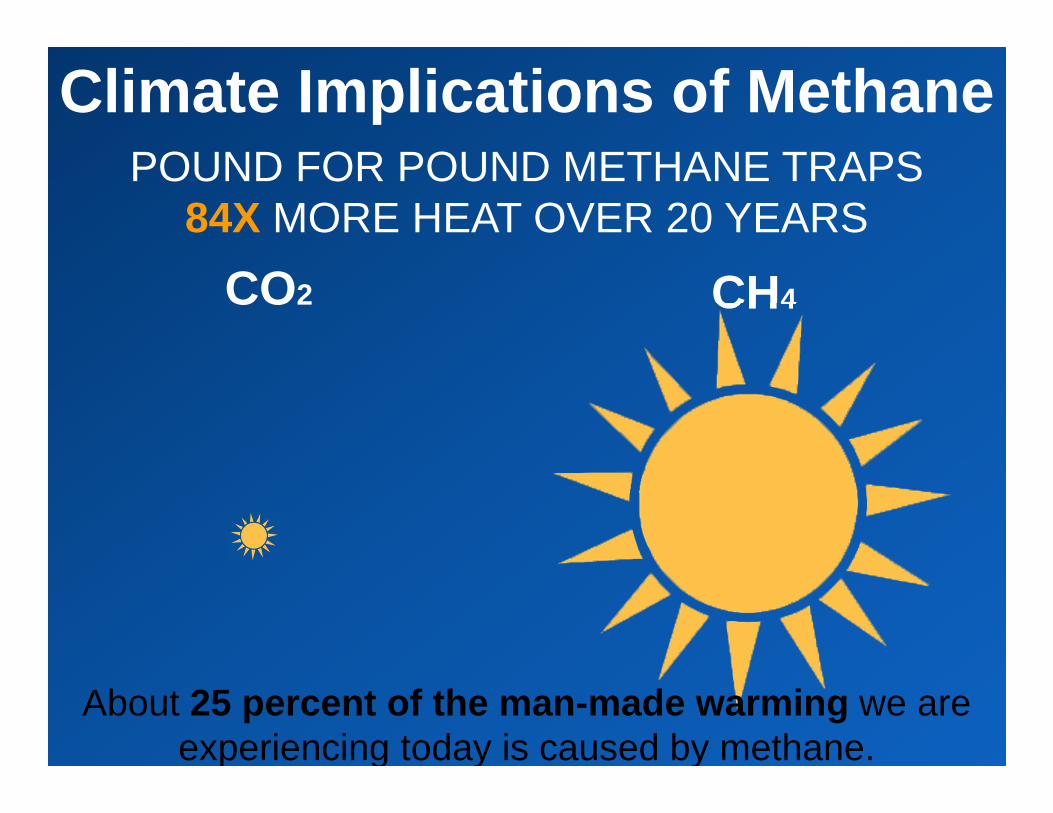
POUND FOR POUND METHANE TRAPS 84X MORE HEAT OVER 20 YEARS
CO2 CH4
Climate Implications of Methane
About 25 percent of the man-made warming we are experiencing today is caused by methane.
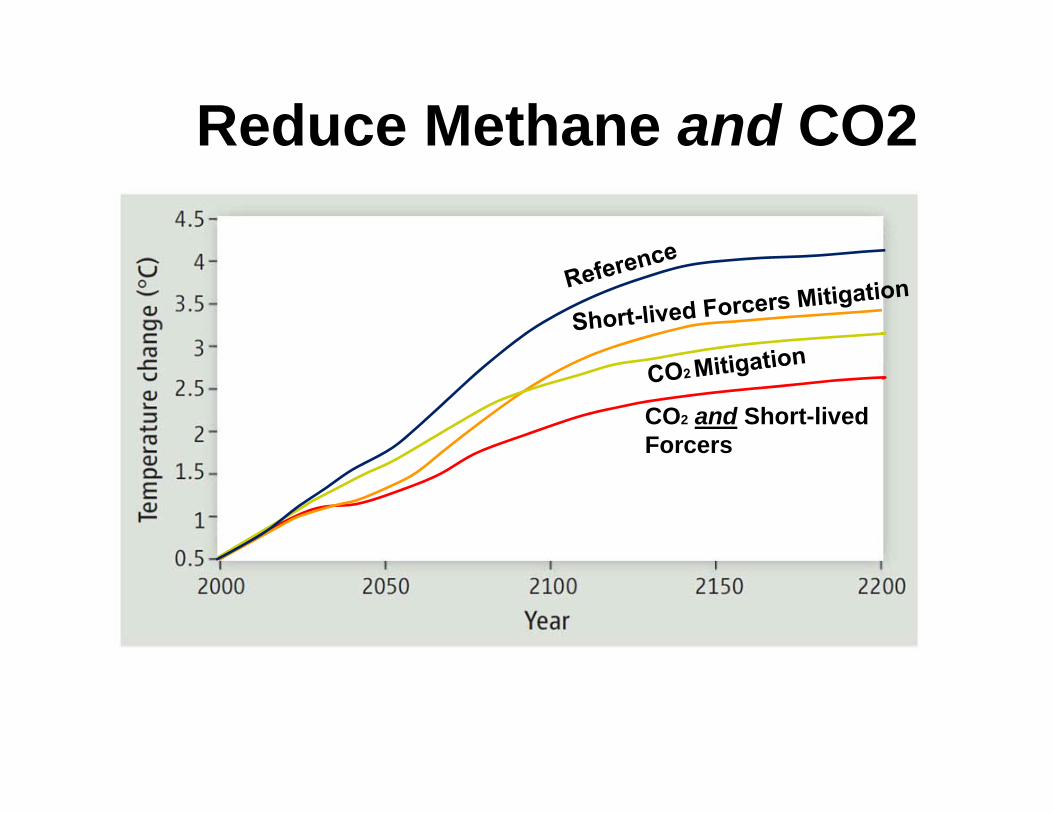
CO2 and Short-lived Forcers
Reduce Methane and CO2
Rhodium Group analysis, available at: www.edf/org/globalmethane
Rhodium Group analysis, available at: www.edf/org/globalmethane

United StatesUnited States
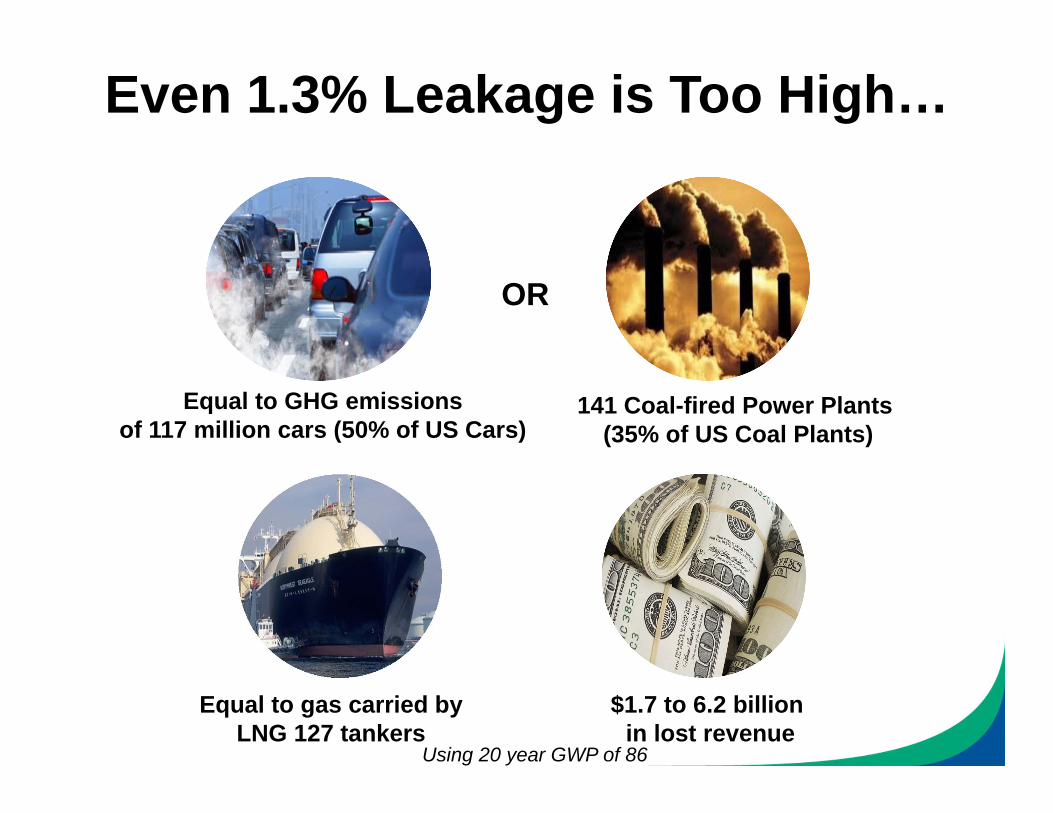
Even 1.3% Leakage is Too High…
Equal to GHG emissions of 117 million cars (50% of US Cars)
141 Coal-fired Power Plants(35% of US Coal Plants)
Equal to gas carried by LNG 127 tankers
$1.7 to 6.2 billionin lost revenue
OR
Using 20 year GWP of 86
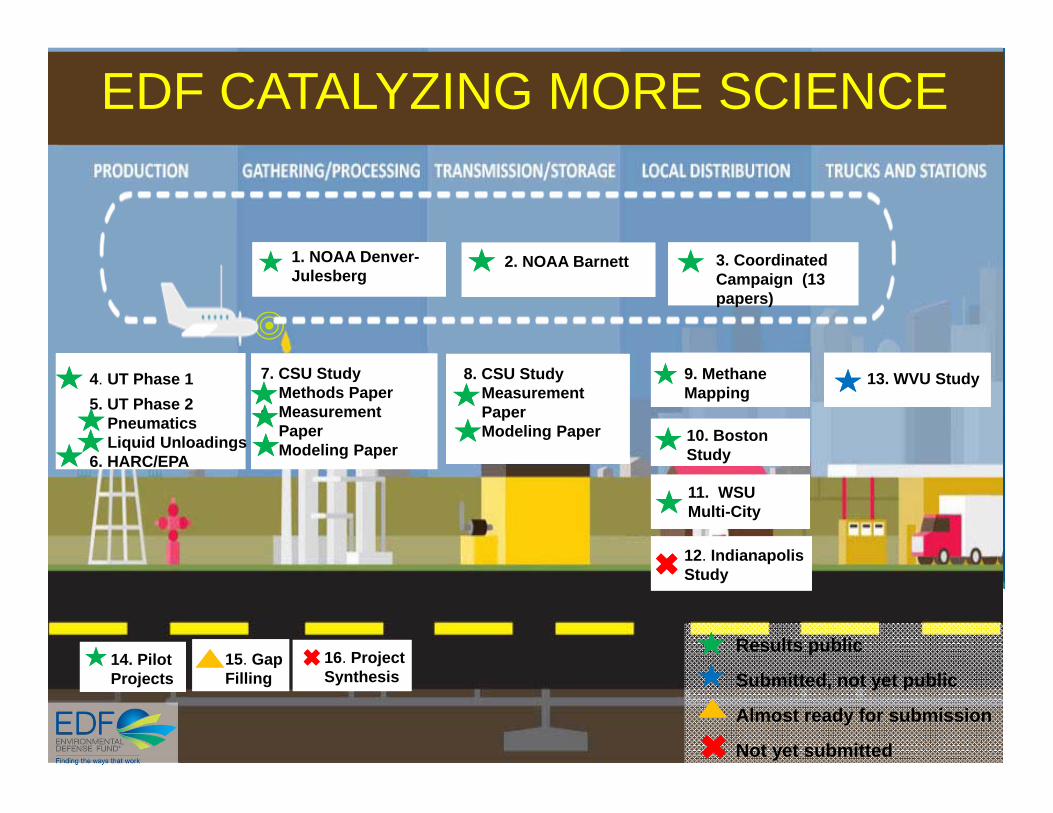
EDF CATALYZING MORE SCIENCE
1. NOAA Denver-Julesberg
2. NOAA Barnett
4. UT Phase 15. UT Phase 2• Pneumatics• Liquid Unloadings6. HARC/EPA
7. CSU Study• Methods Paper• Measurement
Paper• Modeling Paper
8. CSU Study• Measurement
Paper• Modeling Paper
13. WVU Study
14. Pilot Projects
15. Gap Filling
16. Project Synthesis
Results public
Submitted, not yet public
Almost ready for submission
Not yet submitted
3. Coordinated Campaign (13 papers)
11. WSU Multi-City
9. Methane Mapping
10. Boston Study
12. Indianapolis Study
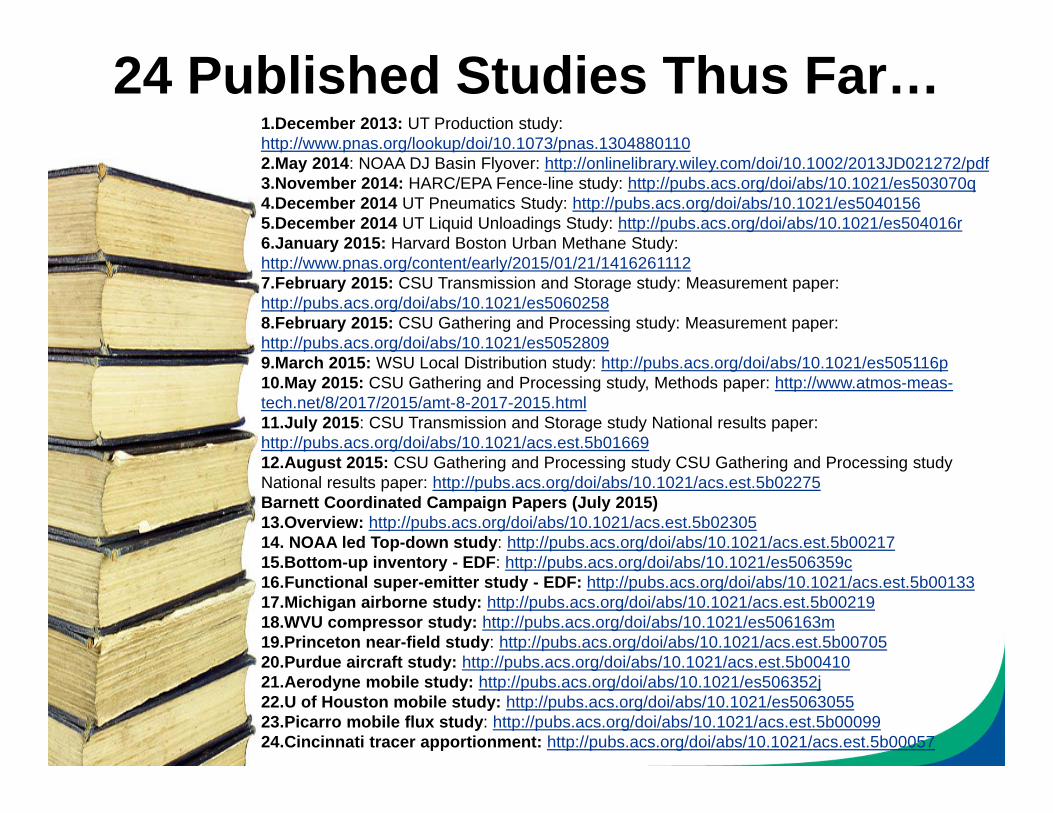
1.December 2013: UT Production study: http://www.pnas.org/lookup/doi/10.1073/pnas.13048801102.May 2014: NOAA DJ Basin Flyover: http://onlinelibrary.wiley.com/doi/10.1002/2013JD021272/pdf3.November 2014: HARC/EPA Fence-line study: http://pubs.acs.org/doi/abs/10.1021/es503070q4.December 2014 UT Pneumatics Study: http://pubs.acs.org/doi/abs/10.1021/es50401565.December 2014 UT Liquid Unloadings Study: http://pubs.acs.org/doi/abs/10.1021/es504016r6.January 2015: Harvard Boston Urban Methane Study: http://www.pnas.org/content/early/2015/01/21/14162611127.February 2015: CSU Transmission and Storage study: Measurement paper: http://pubs.acs.org/doi/abs/10.1021/es50602588.February 2015: CSU Gathering and Processing study: Measurement paper: http://pubs.acs.org/doi/abs/10.1021/es50528099.March 2015: WSU Local Distribution study: http://pubs.acs.org/doi/abs/10.1021/es505116p10.May 2015: CSU Gathering and Processing study, Methods paper: http://www.atmos-meas-tech.net/8/2017/2015/amt-8-2017-2015.html11.July 2015: CSU Transmission and Storage study National results paper: http://pubs.acs.org/doi/abs/10.1021/acs.est.5b0166912.August 2015: CSU Gathering and Processing study CSU Gathering and Processing study National results paper: http://pubs.acs.org/doi/abs/10.1021/acs.est.5b02275Barnett Coordinated Campaign Papers (July 2015)13.Overview: http://pubs.acs.org/doi/abs/10.1021/acs.est.5b0230514. NOAA led Top-down study: http://pubs.acs.org/doi/abs/10.1021/acs.est.5b0021715.Bottom-up inventory - EDF: http://pubs.acs.org/doi/abs/10.1021/es506359c16.Functional super-emitter study - EDF: http://pubs.acs.org/doi/abs/10.1021/acs.est.5b0013317.Michigan airborne study: http://pubs.acs.org/doi/abs/10.1021/acs.est.5b0021918.WVU compressor study: http://pubs.acs.org/doi/abs/10.1021/es506163m19.Princeton near-field study: http://pubs.acs.org/doi/abs/10.1021/acs.est.5b0070520.Purdue aircraft study: http://pubs.acs.org/doi/abs/10.1021/acs.est.5b0041021.Aerodyne mobile study: http://pubs.acs.org/doi/abs/10.1021/es506352j22.U of Houston mobile study: http://pubs.acs.org/doi/abs/10.1021/es506305523.Picarro mobile flux study: http://pubs.acs.org/doi/abs/10.1021/acs.est.5b0009924.Cincinnati tracer apportionment: http://pubs.acs.org/doi/abs/10.1021/acs.est.5b00057
24 Published Studies Thus Far…
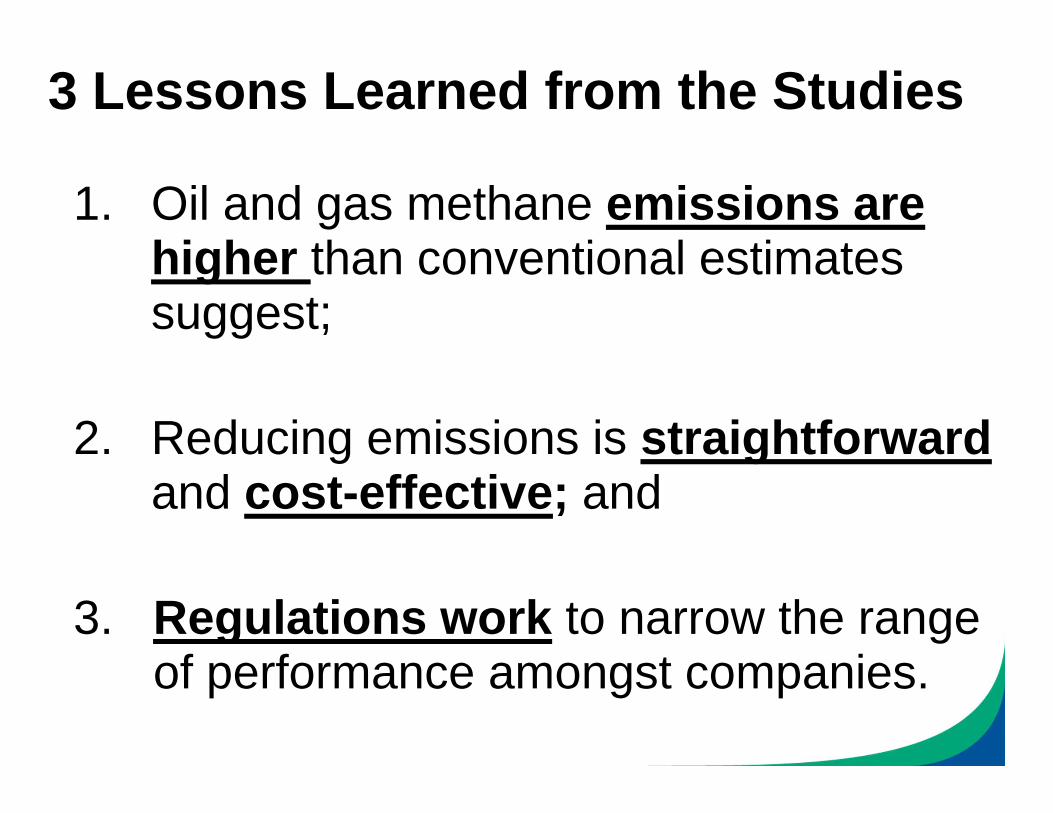
3 Lessons Learned from the Studies
1. Oil and gas methane emissions are higher than conventional estimates suggest;
2. Reducing emissions is straightforwardand cost-effective; and
3. Regulations work to narrow the range . of performance amongst companies.
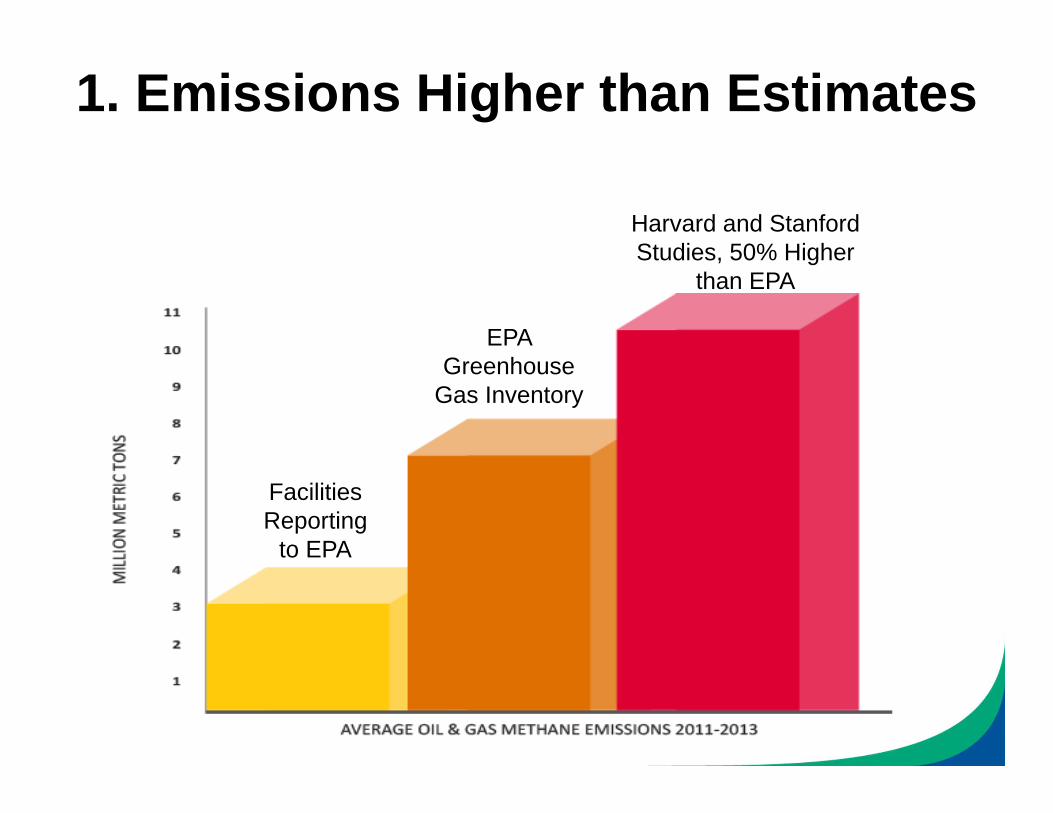
1. Emissions Higher than Estimates
EPA Greenhouse
Gas Inventory
Facilities Reporting
to EPA
Harvard and Stanford Studies, 50% Higher
than EPA
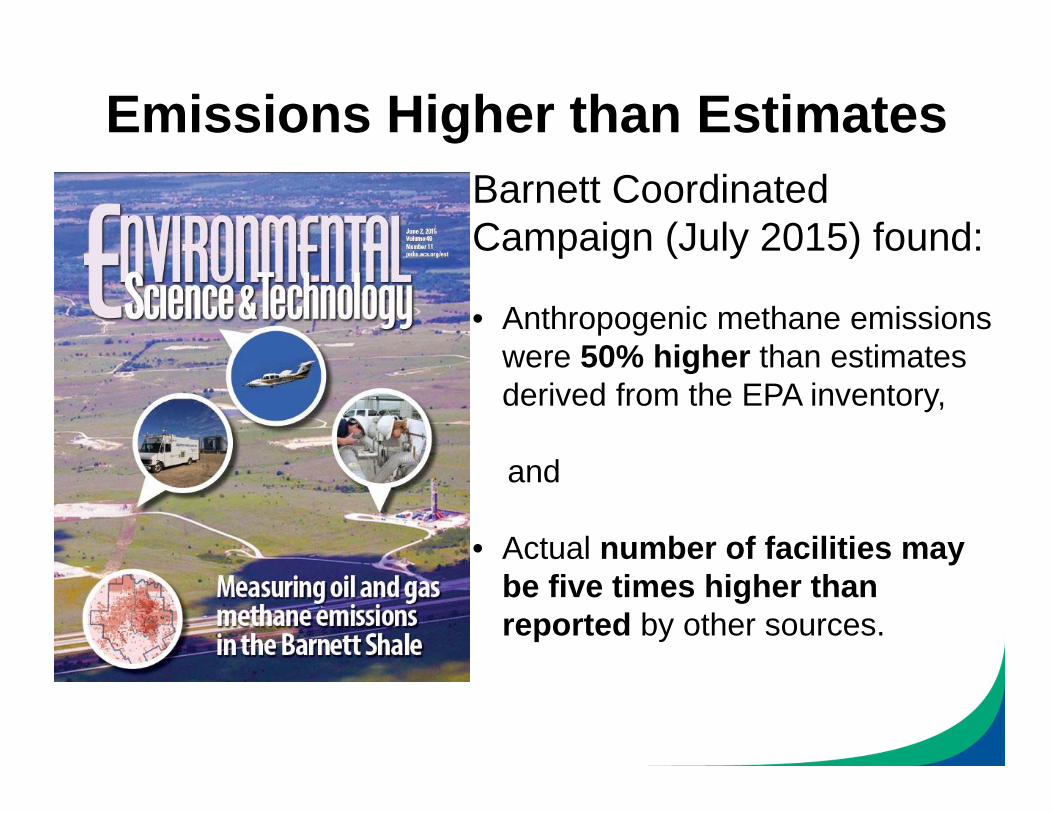
Emissions Higher than EstimatesBarnett Coordinated Campaign (July 2015) found:
• Anthropogenic methane emissions were 50% higher than estimates derived from the EPA inventory,
and
• Actual number of facilities may be five times higher than reported by other sources.
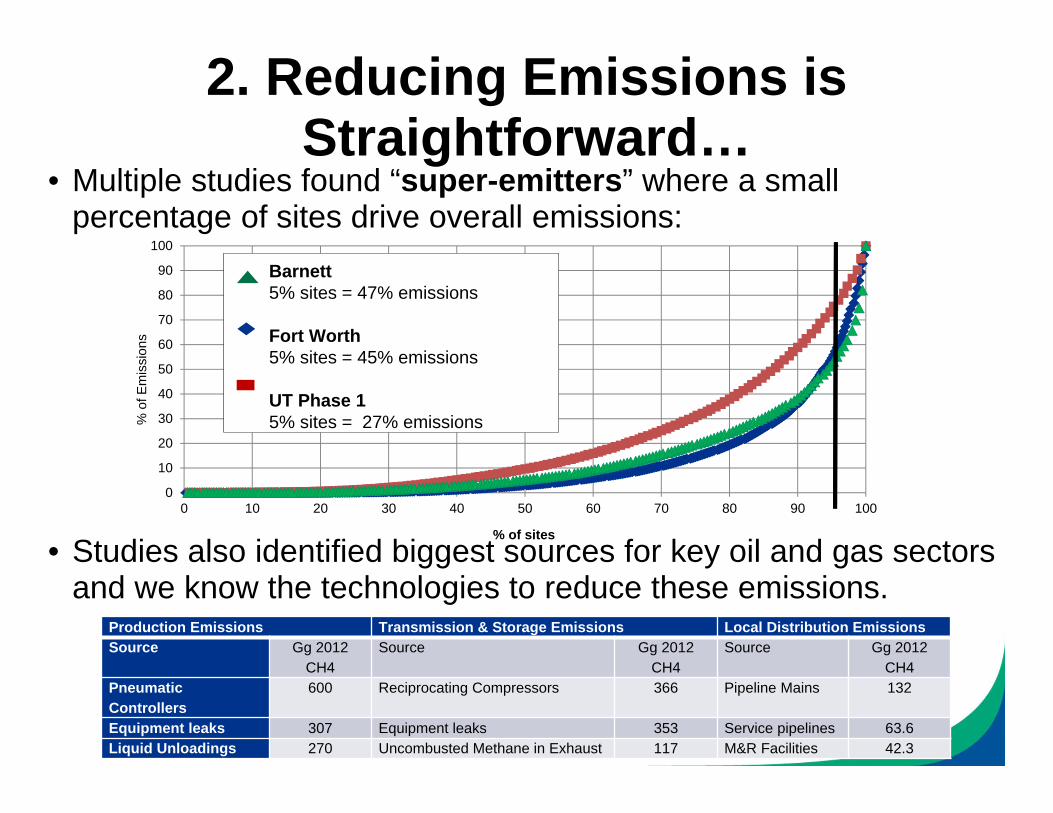
2. Reducing Emissions is Straightforward…
• Multiple studies found “super-emitters” where a small percentage of sites drive overall emissions:
• Studies also identified biggest sources for key oil and gas sectors and we know the technologies to reduce these emissions.
0
10
20
30
40
50
60
70
80
90
100
0 10 20 30 40 50 60 70 80 90 100
% of sites
Barnett5% sites = 47% emissions
Fort Worth5% sites = 45% emissions
UT Phase 15% sites = 27% emissions%
of E
mis
sion
s
Production Emissions Transmission & Storage Emissions Local Distribution EmissionsSource Gg 2012
CH4Source Gg 2012
CH4Source Gg 2012
CH4Pneumatic Controllers
600 Reciprocating Compressors 366 Pipeline Mains 132
Equipment leaks 307 Equipment leaks 353 Service pipelines 63.6Liquid Unloadings 270 Uncombusted Methane in Exhaust 117 M&R Facilities 42.3

…Reducing Emissions is Cost-Effective
• ICF Study found U.S. oil and gas methane emissions can be reduced by 40% for less than one cent per million cubic feet of gas, using existing technologies.
• Data shows Wyoming and Colorado methane regulations have led to increased oil and gas jobs and increased production.

3. Regulations Work • UT study found regulations requiring reduced emission
completion technologies reduced methane by 99%.
• CSU Transmission and Storage study found a wide range of performance amongst companies, with participating companies having emissions 30 percent lower than companies that were not involved. Smart regulations can narrow the gap and ensure best-practices are adopted by all companies, not just industry leaders
• Colorado, Wyoming and EPA regulations provide a template to follow, no need to reinvent the wheel.

Related Documents