December 19, 2007 Oil Allied Services: Huge opportunity ahead Sector: Oil Allied Services Shiv Vani Oil & Gas Exp Services Ltd Rating: BUY CMP (Rs): 585 Target price (Rs): 674 Alphageo India Ltd Rating: BUY CMP (Rs): 751 Target price (Rs): 916 Asian Oilfield Services Ltd Rating: Not Rated CMP (Rs): 275 India Infoline Research Team [email protected] 91-22-67491700 India Infoline Research can be accessed on Bloomberg (Code IILL), Thomson First Call and ISI Emerging markets. Rising E&P spend to warrant increased demand for support services Strong economic growth in India has warranted a strong demand for oil and natural gas in the country. With India importing more than 70% of crude oil requirements and starved for natural gas, investments in exploration activities of the companies have increased considerably. Government of India, through six rounds of NELP has attracted commitments of more than US$12bn. Off late, impetus for onshore blocks have increased and in the seventh round of National Exploration Licensing Policy (NELP), government has offered 57 blocks of which more than 50% are onshore blocks as compared to only 38% offered so far. These activities would unfold huge opportunity for onshore support service providers like Shiv Vani Oil and Gas Exploration Services Ltd (SVL), Alphageo India Ltd (AGIL) and Asian Oilfield Services Ltd (AOSL). Shiv Vani Oil and Gas Exploration Services Ltd SVL is the largest integrated player in the Indian onshore E&P service space with 25 drilling rigs and 10 sets of seismic crews. The company is expanding its fleet base to 32 rigs. It has ventured into CBM integrated services with a contract from ONGC. The current order book of the company is at Rs34bn as compared to CY06 sales of Rs5bn. We maintain BUY on the stock with a target price of Rs674. Alphageo India Ltd One of the leading seismic survey operators for onshore E&P fields, AGIL is upgrading its crew to make them capable of conducting 3-D seismic surveys. The company has also plans to add one more crew to the fleet. The current order book is at Rs1.8bn compared to FY07 sales of Rs500mn. We maintain BUY on the stock with a target price of Rs916. Asian Oilfield Services Ltd AOSL is another leading service provider for onshore seismic survey. It is in the process of acquiring two additional crew capable of conducting 3-D seismic survey. It also has plans to acquire a CBM rig and is scouting for acquisitions, which could trigger a strong revenue growth for future. The current order book with the company is Rs1.6bn as compared to sales of Rs250mn in FY07. Valuation summary Source: Company, India Infoline Research Sales (Rs mn) Growth yoy (%) OPM (%) PAT (Rs mn) Growth yoy (%) EPS (Rs) P/E (x) SVL CY06 2,768 25.2 35.0 371 75.4 11.6 50.5 FY08E 5,646 104.0 36.3 928 150.1 16.9 34.7 FY09E 9,003 59.5 37.6 1,714 84.7 39.0 15.0 FY10E 10,849 20.5 38.9 2,281 33.1 51.8 11.3 AGIL FY07 543 127.5 46.9 75 77.8 15.1 49.6 FY08E 910 67.7 50.0 196 161.5 35.7 21.0 FY09E 1,317 44.6 50.3 325 65.5 59.1 12.7 FY10E 1,646 25.0 50.4 420 29.3 76.4 9.8 AOSL FY04 95 80.8 13.5 5 (33.3) 0.9 - FY05 78 (18.3) 11.7 3 (36.0) 0.6 - FY06 103 32.7 12.4 6 81.2 1.1 - FY07 273 164.3 28.0 48 720.7 6.8 40.4

Welcome message from author
This document is posted to help you gain knowledge. Please leave a comment to let me know what you think about it! Share it to your friends and learn new things together.
Transcript
December 19, 2007
Oil Allied Services: Huge opportunity ahead
Sector: Oil Allied Services
Shiv Vani Oil & Gas Exp Services Ltd
Rating: BUY
CMP (Rs): 585
Target price (Rs): 674
Alphageo India Ltd
Rating: BUY
CMP (Rs): 751
Target price (Rs): 916
Asian Oilfield Services Ltd
Rating: Not Rated
CMP (Rs): 275
India Infoline Research Team
[email protected] 91-22-67491700
India Infoline Research can be accessed on Bloomberg (Code IILL), Thomson First Call and ISI Emerging markets.
Rising E&P spend to warrant increased demand for support services Strong economic growth in India has warranted a strong demand for oil and natural gas in the country. With India importing more than 70% of crude oil requirements and starved for natural gas, investments in exploration activities of the companies have increased considerably. Government of India, through six rounds of NELP has attracted commitments of more than US$12bn. Off late, impetus for onshore blocks have increased and in the seventh round of National Exploration Licensing Policy (NELP), government has offered 57 blocks of which more than 50% are onshore blocks as compared to only 38% offered so far. These activities would unfold huge opportunity for onshore support service providers like Shiv Vani Oil and Gas Exploration Services Ltd (SVL), Alphageo India Ltd (AGIL) and Asian Oilfield Services Ltd (AOSL). Shiv Vani Oil and Gas Exploration Services Ltd SVL is the largest integrated player in the Indian onshore E&P service space with 25 drilling rigs and 10 sets of seismic crews. The company is expanding its fleet base to 32 rigs. It has ventured into CBM integrated services with a contract from ONGC. The current order book of the company is at Rs34bn as compared to CY06 sales of Rs5bn. We maintain BUY on the stock with a target price of Rs674. Alphageo India Ltd One of the leading seismic survey operators for onshore E&P fields, AGIL is upgrading its crew to make them capable of conducting 3-D seismic surveys. The company has also plans to add one more crew to the fleet. The current order book is at Rs1.8bn compared to FY07 sales of Rs500mn. We maintain BUY on the stock with a target price of Rs916. Asian Oilfie ld Services Ltd AOSL is another leading service provider for onshore seismic survey. It is in the process of acquiring two additional crew capable of conducting 3-D seismic survey. It also has plans to acquire a CBM rig and is scouting for acquisitions, which could trigger a strong revenue growth for future. The current order book with the company is Rs1.6bn as compared to sales of Rs250mn in FY07. Valuation summary
Source: Company, India Infoline Research
Sales (Rs mn)
Growth yoy (%)
OPM (%)
PAT (Rs mn)
Growth yoy (%)
EPS (Rs)
P/E (x)
SVL CY06 2,768 25.2 35.0 371 75.4 11.6 50.5 FY08E 5,646 104.0 36.3 928 150.1 16.9 34.7 FY09E 9,003 59.5 37.6 1,714 84.7 39.0 15.0 FY10E 10,849 20.5 38.9 2,281 33.1 51.8 11.3 AGIL FY07 543 127.5 46.9 75 77.8 15.1 49.6 FY08E 910 67.7 50.0 196 161.5 35.7 21.0 FY09E 1,317 44.6 50.3 325 65.5 59.1 12.7 FY10E 1,646 25.0 50.4 420 29.3 76.4 9.8 AOSL FY04 95 80.8 13.5 5 (33.3) 0.9 - FY05 78 (18.3) 11.7 3 (36.0) 0.6 - FY06 103 32.7 12.4 6 81.2 1.1 - FY07 273 164.3 28.0 48 720.7 6.8 40.4
December 19, 2007 2
Oil Allied Services: Huge opportunity ahead
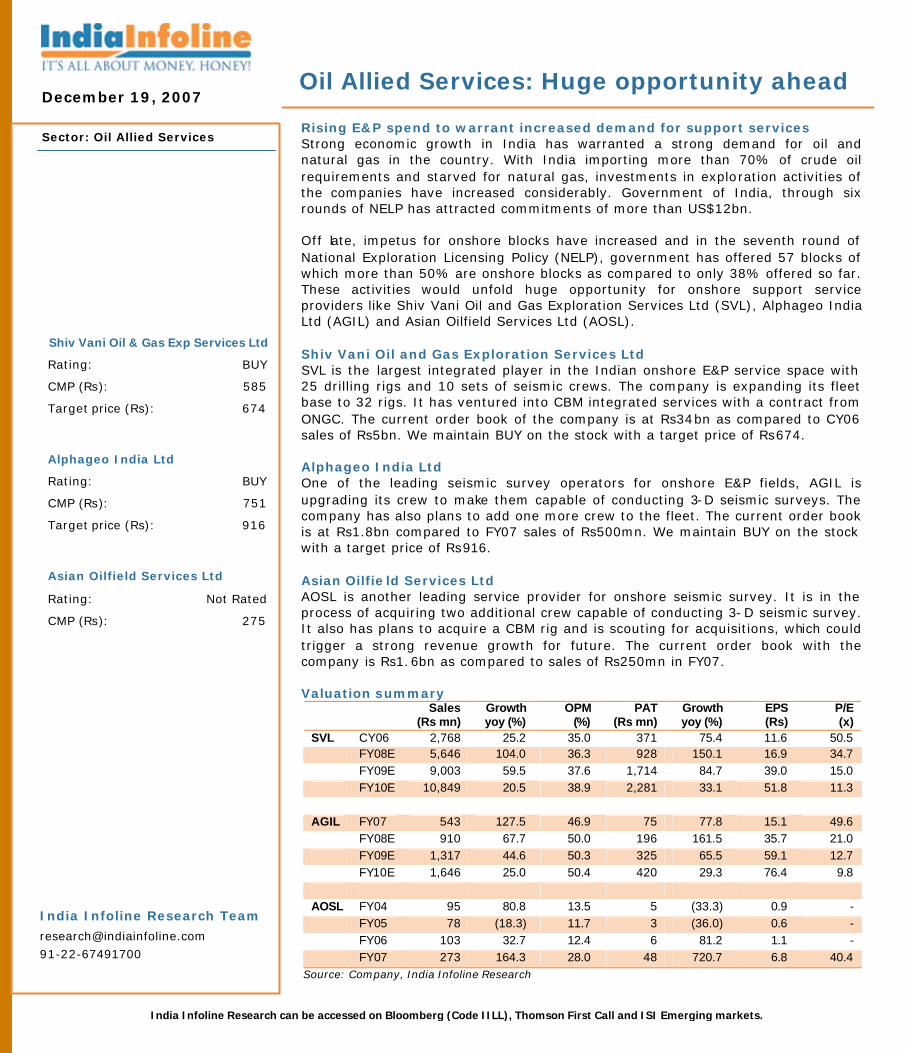
Huge E&P expenditure planned in India Strong economic growth is always accompanied by a robust demand for energy. India, over the last three years, has witnessed strong GDP growth, which we expect would continue in the years to come. The demand for energy would follow suit. With the country deriving more than 37% of its primary energy from crude oil and natural gas and still importing over 70% of crude oil requirements, search for new hydrocarbon reserves will surge. Of the 3.14mn square km of India’s sedimentary basin, only 20% has been well explored. Prognosticated reserves in 15 of the 26 basins are 205bn barrels, of which established reserves are only 62bn barrels. Apart from 11 basins where exploration is yet to be initiated, the existing 15 basins also provide huge opportunity for exploration activities. With an objective to attract investments from the private sector and foreign players, the Government of India initiated NELP in 2001. So far, there have been six rounds of bidding whereby 165 blocks were offered and commitments of US$12bn were made by various foreign and private entities. The government has offered 57 blocks in the seventh round of NELP, which was announced in the recent past. Government hopes to attract investments of US$3.5bn in these blocks.
Onshore segment getting impetus Of the 165 blocks offered so far in the six rounds of NELP, 102 have been offshore blocks. Only 21.8% of the identified onshore area in the Indian sedimentary basin has been offered under license where exploration has been initiated. In a scenario where finding oil on the offshore side is getting expensive day by day, onshore would be a better bet. Onshore fields are easier to explore and the lead time from discovery to production is also less as compared to an offshore field. 57 blocks have been offered in the seventh round of NELP and 29 (50.8%) of them are onshore fields as compared to 38% in first six rounds.
Industry scenario
Trend in production and import of crude oil in India Exploration status of the Indian sedimentary basin
0
20,000
40,000
60,000
80,000
100,000
120,000
FY01 FY02 FY03 FY04 FY05 FY06 FY07
('000 tons)
64
66
68
70
72
74
76
78(%)
Production Imports Imports as % of throughput
Well Explored
20%
Initiated44%
Poorly explored
21%
Unexplored15%
Source: Ministry of Petroleum & Natural Gas Source: Directorate General of Hydrocarbons
December 19, 2007 3
Oil Allied Services: Huge opportunity ahead
Current exploration status Sq Km On land Shallow Water Deep Water Acreage (A) 1.4 0.4 1.4 Under License (B) 0.3 0.3 0.9 B as % of A 21.8 75.0 63.7 Yet to be explored (%) 78.2 25.0 36.3
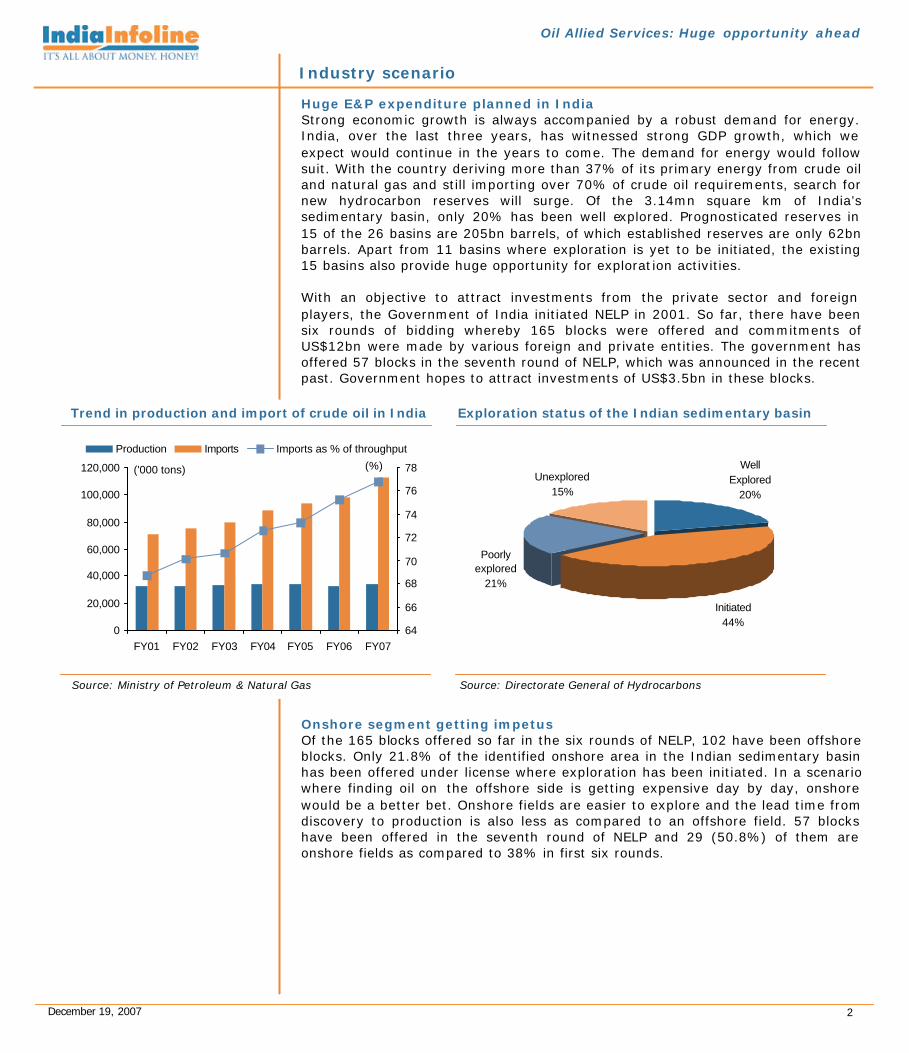
Source: Directorate General of Hydrocarbons Prior commitments not met: Increased demand for support services Over the last six rounds of NELP commitments were made for 22,118 square km of 2-D seismic survey, 15,600 line km of 3-D seismic survey and 237 exploratory wells. However, 41.3% of 2-D seismic survey, 60% of 3-D seismic survey and 53.2% of wells are yet to be completed. With the announcement of the seventh round of NELP, further commitments would be made. New fields on offer along with unfulfilled commitments of past six rounds will lead to huge demand for onshore exploration support services. It is estimated that Rs80bn worth of investments would be made for onshore seismic survey in the next few years of which 50-55% would be met by captive crews of oil exploration companies like ONGC and Oil India. Rest would be outsourced to companies such as SVL, AGIL and AOL. Increased demand with resource crunch: Increase in margins and realizations The onshore exploration support services segment is labour intensive with high requirement of skilled labour. With strong demand for manpower arising out of E&P spend, costs of manpower have increased substantially. Coupled with this, companies providing the services are few, making the market to be a sellers’ market, leading to jump in realizations. Higher realizations along with strong volume growth will lead to an expansion in operating margins of service providers like SVL, AGIL and AOL. CBM fields: huge prospects going ahead Of the total identified area of 35,400 sq km for CBM exploration, work has commenced only on 38% of the area. The government expects production from CBM blocks to increase from 0.15mmscmd in FY08 to 7.41mmscmd. With demand for natural gas likely to remain very firm on back of increased energy demand, every source of gas in the country needs to be tapped. CBM fields provide rich gas and India is rich with coal reserves. This should lead to increased exploration activities for CBM fields. SVL and AOSL would thus see increased order flow, as they have developed expertise in providing services for CBM exploration.
Commitments yet to be completed for onshore exploration in India 2-D Seismic Survey 3-D Seismic Survey Exploratory Wells
59%
41%
60%
40%
Completed To complete
47%
53%
Source: Directorate General of Hydrocarbons
BUY
Shiv Vani Oil & Gas Exp Services Ltd
Sensex: 19,106
CMP (Rs): 585
Target price (Rs): 674
Upside (%): 15.2
52 Week h/l (Rs): 638/253
Market cap (Rscr) : 2,227
6m Avg vol BSE&NSE (‘000Nos): 145.9
No of o/s shares (mn): 38
FV (Rs): 10
Bloomberg code: SVOG IN
Reuters code: SHVD.BO
BSE code: 522175
NSE code: SHIV-VANI Shareholding pattern
September 2007 (%)
Promoters 62.2
Foreign & institution 15.6
Non promoter corp hold 15.7
Public & others 6.5
Share price trend
0
50
100
150
200
250
Dec-06 Apr-07 Aug-07 Dec-07
SVL Sensex
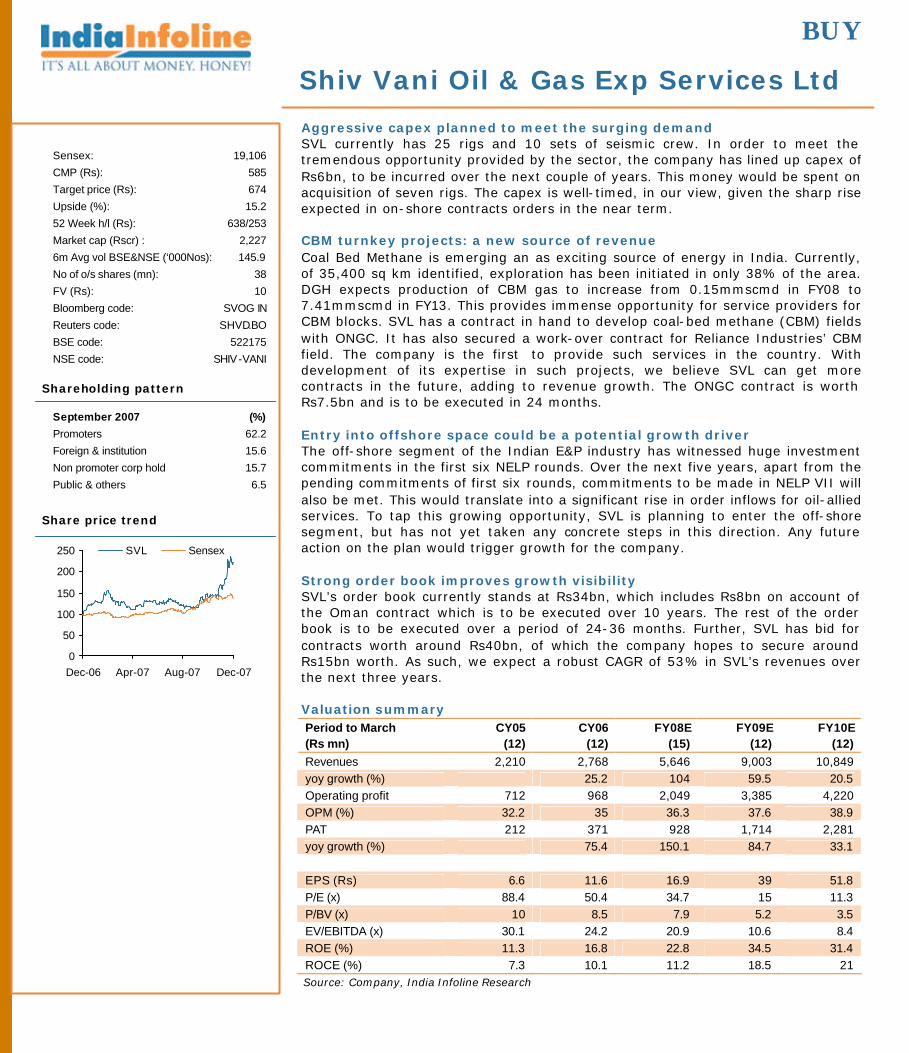
Aggressive capex planned to meet the surging demand SVL currently has 25 rigs and 10 sets of seismic crew. In order to meet the tremendous opportunity provided by the sector, the company has lined up capex of Rs6bn, to be incurred over the next couple of years. This money would be spent on acquisition of seven rigs. The capex is well-timed, in our view, given the sharp rise expected in on-shore contracts orders in the near term. CBM turnkey projects: a new source of revenue Coal Bed Methane is emerging an as exciting source of energy in India. Currently, of 35,400 sq km identified, exploration has been initiated in only 38% of the area. DGH expects production of CBM gas to increase from 0.15mmscmd in FY08 to 7.41mmscmd in FY13. This provides immense opportunity for service providers for CBM blocks. SVL has a contract in hand to develop coal-bed methane (CBM) fields with ONGC. It has also secured a work-over contract for Reliance Industries’ CBM field. The company is the first to provide such services in the country. With development of its expertise in such projects, we believe SVL can get more contracts in the future, adding to revenue growth. The ONGC contract is worth Rs7.5bn and is to be executed in 24 months. Entry into offshore space could be a potential growth driver The off-shore segment of the Indian E&P industry has witnessed huge investment commitments in the first six NELP rounds. Over the next five years, apart from the pending commitments of first six rounds, commitments to be made in NELP VII will also be met. This would translate into a significant rise in order inflows for oil-allied services. To tap this growing opportunity, SVL is planning to enter the off-shore segment, but has not yet taken any concrete steps in this direction. Any future action on the plan would trigger growth for the company. Strong order book improves growth visibility SVL’s order book currently stands at Rs34bn, which includes Rs8bn on account of the Oman contract which is to be executed over 10 years. The rest of the order book is to be executed over a period of 24-36 months. Further, SVL has bid for contracts worth around Rs40bn, of which the company hopes to secure around Rs15bn worth. As such, we expect a robust CAGR of 53% in SVL’s revenues over the next three years. Valuation summary Period to March CY05 CY06 FY08E FY09E FY10E (Rs mn) (12) (12) (15) (12) (12) Revenues 2,210 2,768 5,646 9,003 10,849 yoy growth (%) 25.2 104 59.5 20.5 Operating profit 712 968 2,049 3,385 4,220 OPM (%) 32.2 35 36.3 37.6 38.9 PAT 212 371 928 1,714 2,281 yoy growth (%) 75.4 150.1 84.7 33.1 EPS (Rs) 6.6 11.6 16.9 39 51.8 P/E (x) 88.4 50.4 34.7 15 11.3 P/BV (x) 10 8.5 7.9 5.2 3.5 EV/EBITDA (x) 30.1 24.2 20.9 10.6 8.4 ROE (%) 11.3 16.8 22.8 34.5 31.4 ROCE (%) 7.3 10.1 11.2 18.5 21 Source: Company, India Infoline Research
December 19, 2007 5
Shiv Vani Oil & Gas Exp Services Ltd
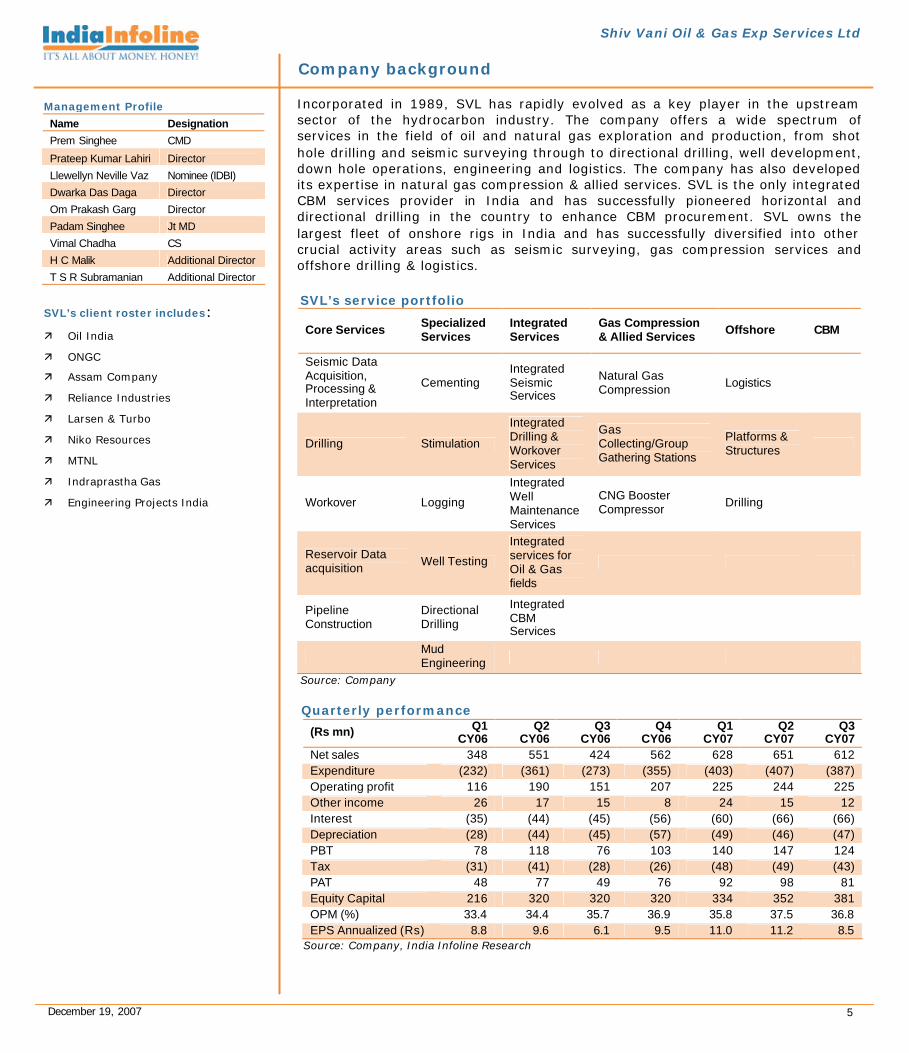
Incorporated in 1989, SVL has rapidly evolved as a key player in the upstream sector of the hydrocarbon industry. The company offers a wide spectrum of services in the field of oil and natural gas exploration and production, from shot hole drilling and seismic surveying through to directional drilling, well development, down hole operations, engineering and logistics. The company has also developed its expertise in natural gas compression & allied services. SVL is the only integrated CBM services provider in India and has successfully pioneered horizontal and directional drilling in the country to enhance CBM procurement. SVL owns the largest fleet of onshore rigs in India and has successfully diversified into other crucial activity areas such as seismic surveying, gas compression services and offshore drilling & logistics.
Quarterly performance
(Rs mn) Q1 CY06
Q2 CY06
Q3 CY06
Q4 CY06
Q1 CY07
Q2 CY07
Q3 CY07
Net sales 348 551 424 562 628 651 612 Expenditure (232) (361) (273) (355) (403) (407) (387) Operating profit 116 190 151 207 225 244 225 Other income 26 17 15 8 24 15 12 Interest (35) (44) (45) (56) (60) (66) (66) Depreciation (28) (44) (45) (57) (49) (46) (47) PBT 78 118 76 103 140 147 124 Tax (31) (41) (28) (26) (48) (49) (43) PAT 48 77 49 76 92 98 81 Equity Capital 216 320 320 320 334 352 381 OPM (%) 33.4 34.4 35.7 36.9 35.8 37.5 36.8 EPS Annualized (Rs) 8.8 9.6 6.1 9.5 11.0 11.2 8.5
Source: Company, India Infoline Research
Company background
Management Profile
Name Designation
Prem Singhee CMD
Prateep Kumar Lahiri Director
Llewellyn Neville Vaz Nominee (IDBI)
Dwarka Das Daga Director
Om Prakash Garg Director
Padam Singhee Jt MD
Vimal Chadha CS
H C Malik Additional Director
T S R Subramanian Additional Director
SVL’s client roster includes: ä Oil India
ä ONGC
ä Assam Company
ä Reliance Industries
ä Larsen & Turbo
ä Niko Resources
ä MTNL
ä Indraprastha Gas
ä Engineering Projects India
SVL’s service portfolio
Core Services Specialized Services
Integrated Services
Gas Compression & Allied Services Offshore CBM
Seismic Data Acquisition, Processing & Interpretation
Cementing Integrated Seismic Services
Natural Gas Compression Logistics
Drilling Stimulation
Integrated Drilling & Workover Services
Gas Collecting/Group Gathering Stations
Platforms & Structures
Workover Logging
Integrated Well Maintenance Services
CNG Booster Compressor Drilling
Reservoir Data acquisition Well Testing
Integrated services for Oil & Gas fields
Pipeline Construction
Directional Drilling
Integrated CBM Services
Mud Engineering
Source: Company
December 19, 2007 6
Shiv Vani Oil & Gas Exp Services Ltd
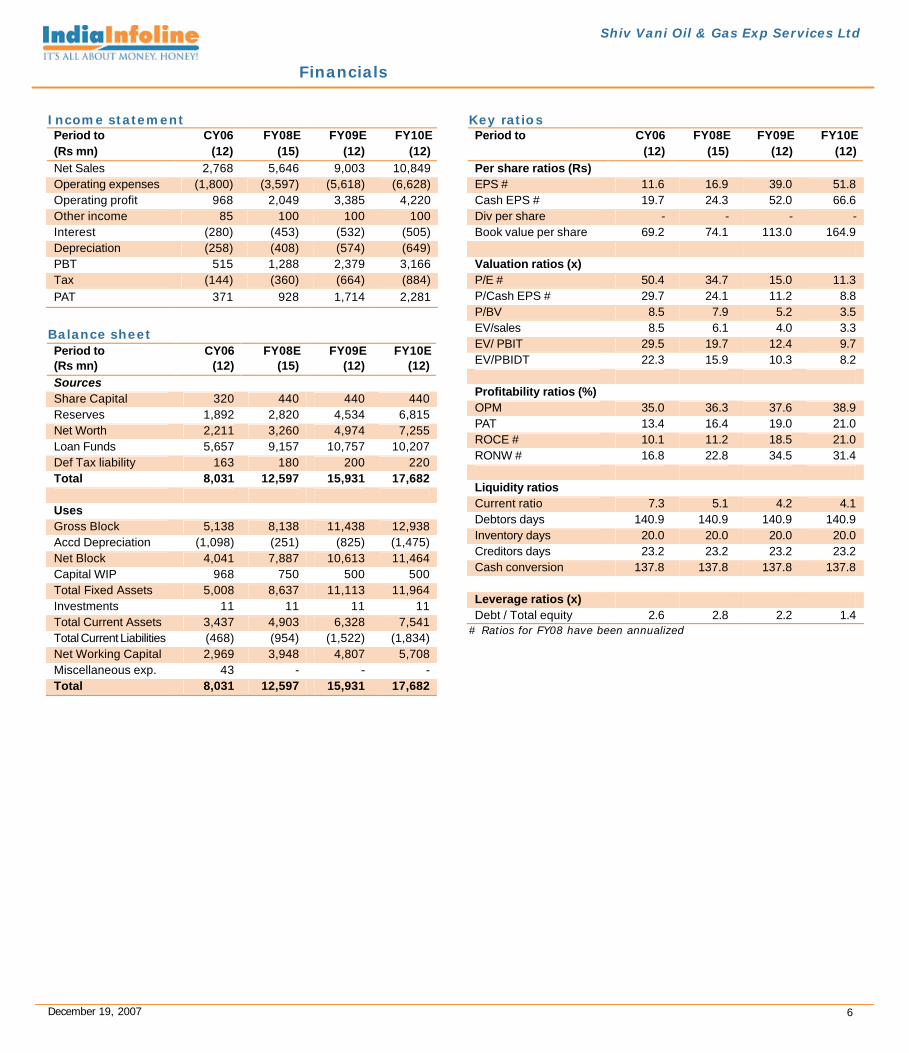
Income statement Period to CY06 FY08E FY09E FY10E (Rs mn) (12) (15) (12) (12) Net Sales 2,768 5,646 9,003 10,849 Operating expenses (1,800) (3,597) (5,618) (6,628) Operating profit 968 2,049 3,385 4,220 Other income 85 100 100 100 Interest (280) (453) (532) (505) Depreciation (258) (408) (574) (649) PBT 515 1,288 2,379 3,166 Tax (144) (360) (664) (884) PAT 371 928 1,714 2,281
Balance sheet Period to CY06 FY08E FY09E FY10E (Rs mn) (12) (15) (12) (12) Sources Share Capital 320 440 440 440 Reserves 1,892 2,820 4,534 6,815 Net Worth 2,211 3,260 4,974 7,255 Loan Funds 5,657 9,157 10,757 10,207 Def Tax liability 163 180 200 220 Total 8,031 12,597 15,931 17,682 Uses Gross Block 5,138 8,138 11,438 12,938 Accd Depreciation (1,098) (251) (825) (1,475) Net Block 4,041 7,887 10,613 11,464 Capital WIP 968 750 500 500 Total Fixed Assets 5,008 8,637 11,113 11,964 Investments 11 11 11 11 Total Current Assets 3,437 4,903 6,328 7,541 Total Current Liabilities (468) (954) (1,522) (1,834) Net Working Capital 2,969 3,948 4,807 5,708 Miscellaneous exp. 43 - - - Total 8,031 12,597 15,931 17,682
Key ratios Period to CY06 FY08E FY09E FY10E (12) (15) (12) (12) Per share ratios (Rs) EPS # 11.6 16.9 39.0 51.8 Cash EPS # 19.7 24.3 52.0 66.6 Div per share - - - - Book value per share 69.2 74.1 113.0 164.9 Valuation ratios (x) P/E # 50.4 34.7 15.0 11.3 P/Cash EPS # 29.7 24.1 11.2 8.8 P/BV 8.5 7.9 5.2 3.5 EV/sales 8.5 6.1 4.0 3.3 EV/ PBIT 29.5 19.7 12.4 9.7 EV/PBIDT 22.3 15.9 10.3 8.2 Profitability ratios (%) OPM 35.0 36.3 37.6 38.9 PAT 13.4 16.4 19.0 21.0 ROCE # 10.1 11.2 18.5 21.0 RONW # 16.8 22.8 34.5 31.4 Liquidity ratios Current ratio 7.3 5.1 4.2 4.1 Debtors days 140.9 140.9 140.9 140.9 Inventory days 20.0 20.0 20.0 20.0 Creditors days 23.2 23.2 23.2 23.2 Cash conversion 137.8 137.8 137.8 137.8 Leverage ratios (x) Debt / Total equity 2.6 2.8 2.2 1.4
# Ratios for FY08 have been annualized
Financials
BUY
Alphageo India Ltd
Sensex: 19,106
CMP (Rs): 751
Target price (Rs): 916
Upside (%): 22.0
52 Week h/l (Rs): 858/140
Market cap (Rscr) : 372
6m Avg vol BSE&NSE (‘000Nos): 21.9
No of o/s shares (mn): 5.0
FV (Rs): 10
Bloomberg code: APH IN
Reuters code: ALPI.BO
BSE code: 526397
NSE code: ALPHAGEO Shareholding pattern
September 2007 (%)
Promoters 34.5
Foreign & institution 9.8
Non promoter corp hold 11.6
Public & others 44.1
Share price trend
0
100
200
300
400
500
600
Dec-06 Apr-07 Aug-07 Dec-07
AGIL Sensex
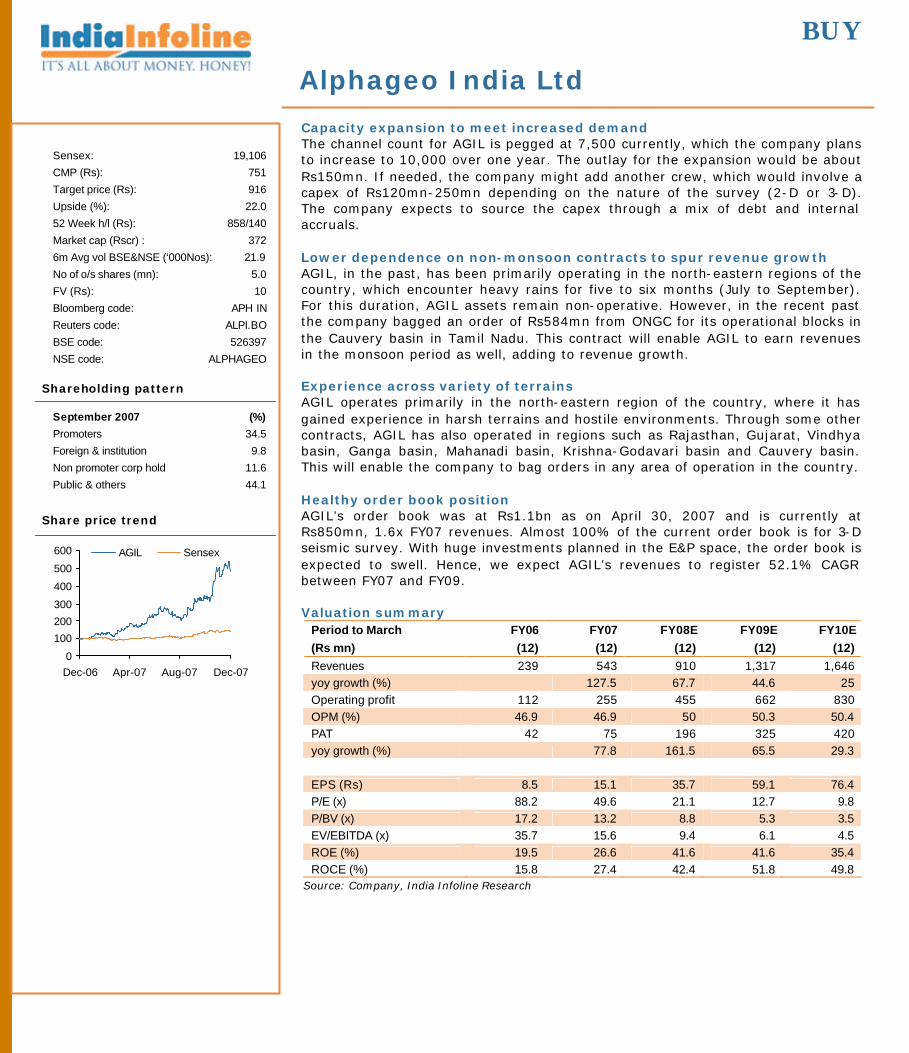
Capacity expansion to meet increased demand The channel count for AGIL is pegged at 7,500 currently, which the company plans to increase to 10,000 over one year. The outlay for the expansion would be about Rs150mn. If needed, the company might add another crew, which would involve a capex of Rs120mn-250mn depending on the nature of the survey (2-D or 3-D). The company expects to source the capex through a mix of debt and internal accruals. Lower dependence on non-monsoon contracts to spur revenue growth AGIL, in the past, has been primarily operating in the north-eastern regions of the country, which encounter heavy rains for five to six months (July to September). For this duration, AGIL assets remain non-operative. However, in the recent past the company bagged an order of Rs584mn from ONGC for its operational blocks in the Cauvery basin in Tamil Nadu. This contract will enable AGIL to earn revenues in the monsoon period as well, adding to revenue growth. Experience across variety of terrains AGIL operates primarily in the north-eastern region of the country, where it has gained experience in harsh terrains and hostile environments. Through some other contracts, AGIL has also operated in regions such as Rajasthan, Gujarat, Vindhya basin, Ganga basin, Mahanadi basin, Krishna-Godavari basin and Cauvery basin. This will enable the company to bag orders in any area of operation in the country. Healthy order book position AGIL’s order book was at Rs1.1bn as on April 30, 2007 and is currently at Rs850mn, 1.6x FY07 revenues. Almost 100% of the current order book is for 3-D seismic survey. With huge investments planned in the E&P space, the order book is expected to swell. Hence, we expect AGIL’s revenues to register 52.1% CAGR between FY07 and FY09. Valuation summary
Period to March FY06 FY07 FY08E FY09E FY10E (Rs mn) (12) (12) (12) (12) (12) Revenues 239 543 910 1,317 1,646 yoy growth (%) 127.5 67.7 44.6 25 Operating profit 112 255 455 662 830 OPM (%) 46.9 46.9 50 50.3 50.4 PAT 42 75 196 325 420 yoy growth (%) 77.8 161.5 65.5 29.3 EPS (Rs) 8.5 15.1 35.7 59.1 76.4 P/E (x) 88.2 49.6 21.1 12.7 9.8 P/BV (x) 17.2 13.2 8.8 5.3 3.5 EV/EBITDA (x) 35.7 15.6 9.4 6.1 4.5 ROE (%) 19.5 26.6 41.6 41.6 35.4 ROCE (%) 15.8 27.4 42.4 51.8 49.8
Source: Company, India Infoline Research
December 19, 2007 8
Alphageo India Ltd
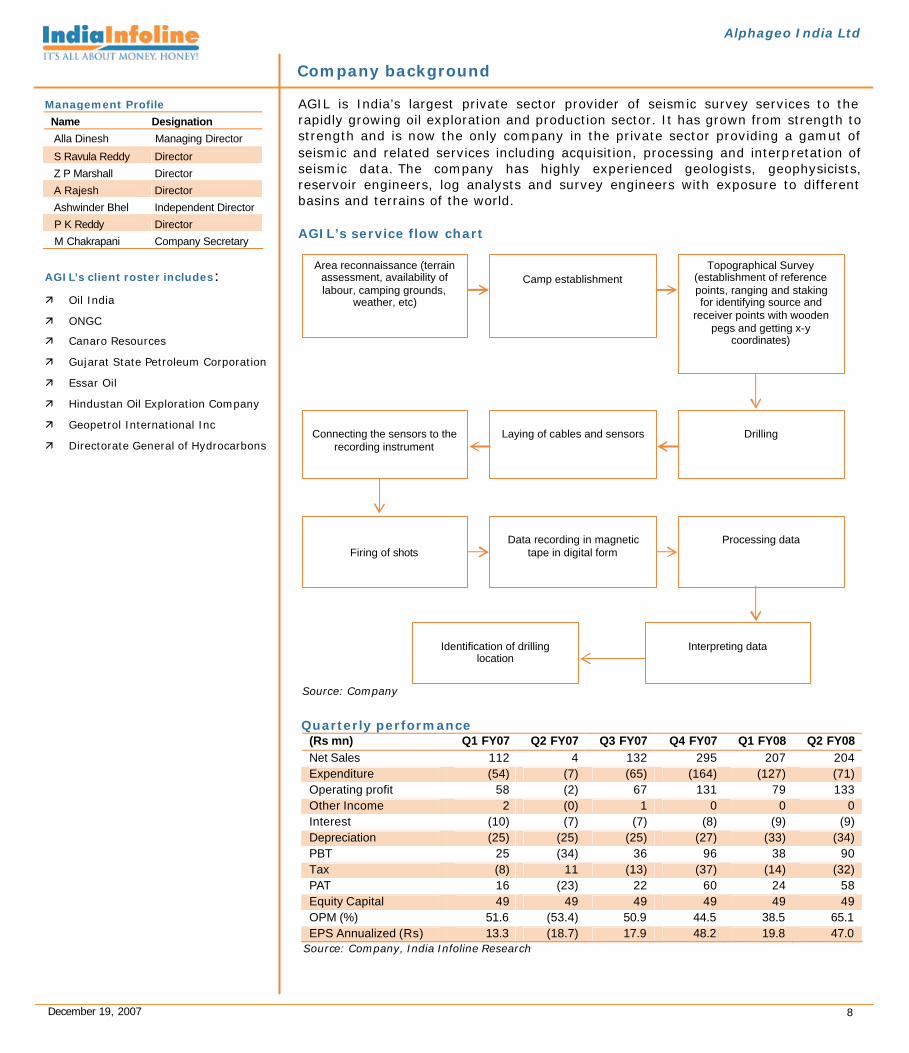
AGIL is India’s largest private sector provider of seismic survey services to the rapidly growing oil exploration and production sector. It has grown from strength to strength and is now the only company in the private sector providing a gamut of seismic and related services including acquisition, processing and interpretation of seismic data. The company has highly experienced geologists, geophysicists, reservoir engineers, log analysts and survey engineers with exposure to different basins and terrains of the world. AGIL’s service flow chart
Quarterly performance (Rs mn) Q1 FY07 Q2 FY07 Q3 FY07 Q4 FY07 Q1 FY08 Q2 FY08 Net Sales 112 4 132 295 207 204 Expenditure (54) (7) (65) (164) (127) (71) Operating profit 58 (2) 67 131 79 133 Other Income 2 (0) 1 0 0 0 Interest (10) (7) (7) (8) (9) (9) Depreciation (25) (25) (25) (27) (33) (34) PBT 25 (34) 36 96 38 90 Tax (8) 11 (13) (37) (14) (32) PAT 16 (23) 22 60 24 58 Equity Capital 49 49 49 49 49 49 OPM (%) 51.6 (53.4) 50.9 44.5 38.5 65.1 EPS Annualized (Rs) 13.3 (18.7) 17.9 48.2 19.8 47.0
Source: Company, India Infoline Research
Company background
Management Profile
Name Designation
Alla Dinesh Managing Director
S Ravula Reddy Director
Z P Marshall Director
A Rajesh Director
Ashwinder Bhel Independent Director
P K Reddy Director
M Chakrapani Company Secretary
AGIL’s client roster includes: ä Oil India
ä ONGC
ä Canaro Resources
ä Gujarat State Petroleum Corporation
ä Essar Oil
ä Hindustan Oil Exploration Company
ä Geopetrol International Inc
ä Directorate General of Hydrocarbons
Area reconnaissance (terrain assessment, availability of labour, camping grounds,
weather, etc)
Camp establishment
Topographical Survey (establishment of reference points, ranging and staking for identifying source and
receiver points with wooden pegs and getting x-y
coordinates)
Drilling
Laying of cables and sensors
Connecting the sensors to the
recording instrument
Firing of shots
Data recording in magnetic
tape in digital form
Processing data
Interpreting data
Identification of drilling
location
Source: Company
December 19, 2007 9
Alphageo India Ltd
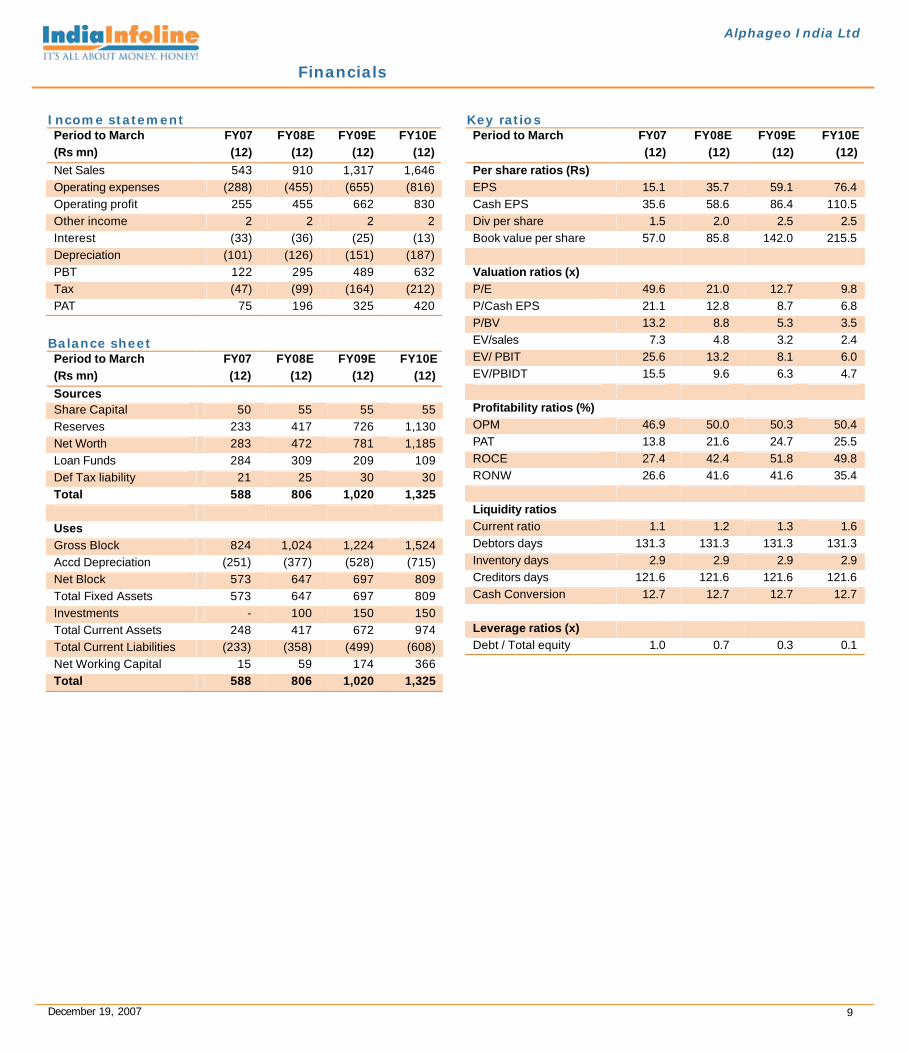
Income statement Period to March FY07 FY08E FY09E FY10E (Rs mn) (12) (12) (12) (12) Net Sales 543 910 1,317 1,646 Operating expenses (288) (455) (655) (816) Operating profit 255 455 662 830 Other income 2 2 2 2 Interest (33) (36) (25) (13) Depreciation (101) (126) (151) (187) PBT 122 295 489 632 Tax (47) (99) (164) (212) PAT 75 196 325 420
Balance sheet Period to March FY07 FY08E FY09E FY10E (Rs mn) (12) (12) (12) (12) Sources Share Capital 50 55 55 55 Reserves 233 417 726 1,130 Net Worth 283 472 781 1,185 Loan Funds 284 309 209 109 Def Tax liability 21 25 30 30 Total 588 806 1,020 1,325 Uses Gross Block 824 1,024 1,224 1,524 Accd Depreciation (251) (377) (528) (715) Net Block 573 647 697 809 Total Fixed Assets 573 647 697 809 Investments - 100 150 150 Total Current Assets 248 417 672 974 Total Current Liabilities (233) (358) (499) (608) Net Working Capital 15 59 174 366 Total 588 806 1,020 1,325
Key ratios Period to March FY07 FY08E FY09E FY10E (12) (12) (12) (12) Per share ratios (Rs) EPS 15.1 35.7 59.1 76.4 Cash EPS 35.6 58.6 86.4 110.5 Div per share 1.5 2.0 2.5 2.5 Book value per share 57.0 85.8 142.0 215.5 Valuation ratios (x) P/E 49.6 21.0 12.7 9.8 P/Cash EPS 21.1 12.8 8.7 6.8 P/BV 13.2 8.8 5.3 3.5 EV/sales 7.3 4.8 3.2 2.4 EV/ PBIT 25.6 13.2 8.1 6.0 EV/PBIDT 15.5 9.6 6.3 4.7 Profitability ratios (%) OPM 46.9 50.0 50.3 50.4 PAT 13.8 21.6 24.7 25.5 ROCE 27.4 42.4 51.8 49.8 RONW 26.6 41.6 41.6 35.4 Liquidity ratios Current ratio 1.1 1.2 1.3 1.6 Debtors days 131.3 131.3 131.3 131.3 Inventory days 2.9 2.9 2.9 2.9 Creditors days 121.6 121.6 121.6 121.6 Cash Conversion 12.7 12.7 12.7 12.7 Leverage ratios (x) Debt / Total equity 1.0 0.7 0.3 0.1
Financials
Not Rated
Asian Oilfield Services Ltd
Sensex: 19,106
CMP (Rs): 275
52 Week h/l (Rs): 318/26
Market cap (Rscr) : 193
6m Avg vol BSE&NSE (‘000Nos): 84.8
No of o/s shares (mn): 7
FV (Rs): 10
Bloomberg code: AOS IN
Reuters code: AOSL.BO
BSE code: 530355
Shareholding pattern
September 2007 (%)
Promoters 11.6
Consolidated Securities 25.6
Foreign & institution 1.5
Non promoter corp hold 9.2
Public & others 52.1
Share price trend
0
200
400
600
800
1,000
Dec-06 Apr-07 Aug-07 Dec-07
AOSL Sensex
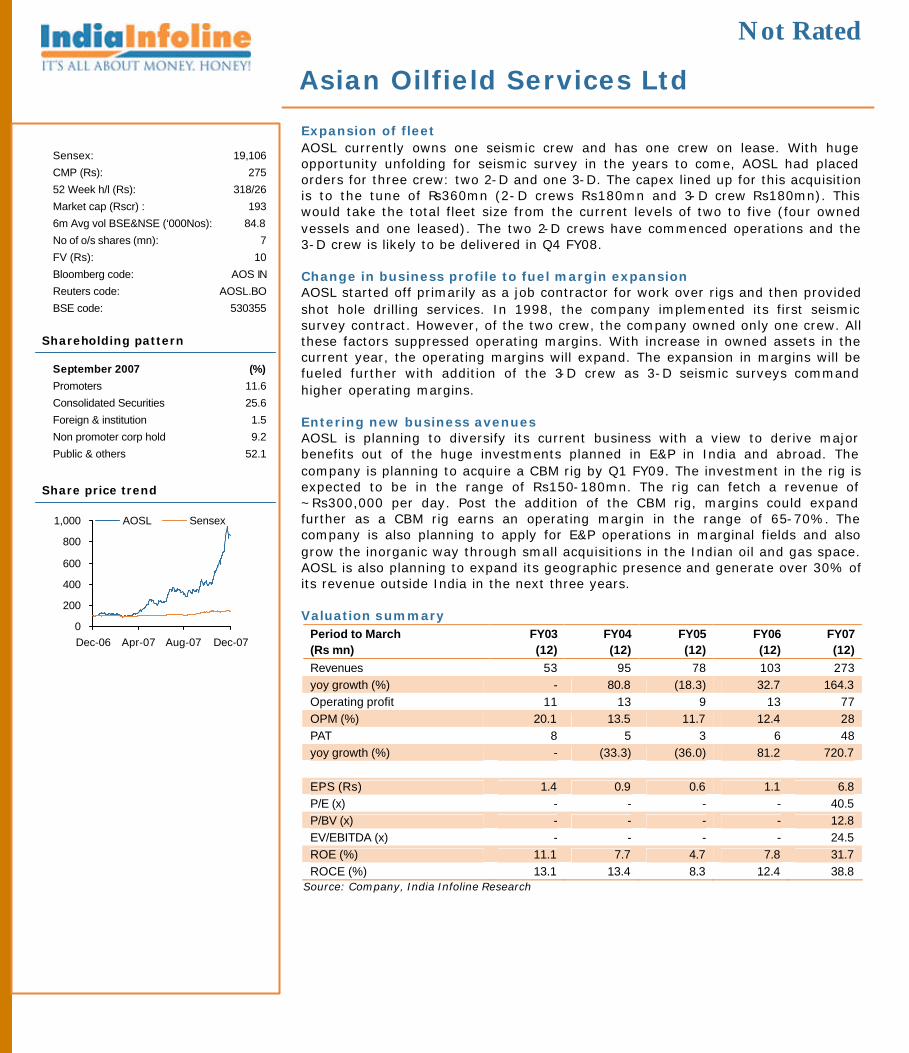
Expansion of fleet AOSL currently owns one seismic crew and has one crew on lease. With huge opportunity unfolding for seismic survey in the years to come, AOSL had placed orders for three crew: two 2-D and one 3-D. The capex lined up for this acquisition is to the tune of Rs360mn (2-D crews Rs180mn and 3-D crew Rs180mn). This would take the total fleet size from the current levels of two to five (four owned vessels and one leased). The two 2-D crews have commenced operations and the 3-D crew is likely to be delivered in Q4 FY08. Change in business profile to fuel margin expansion AOSL started off primarily as a job contractor for work over rigs and then provided shot hole drilling services. In 1998, the company implemented its first seismic survey contract. However, of the two crew, the company owned only one crew. All these factors suppressed operating margins. With increase in owned assets in the current year, the operating margins will expand. The expansion in margins will be fueled further with addition of the 3-D crew as 3-D seismic surveys command higher operating margins. Entering new business avenues AOSL is planning to diversify its current business with a view to derive major benefits out of the huge investments planned in E&P in India and abroad. The company is planning to acquire a CBM rig by Q1 FY09. The investment in the rig is expected to be in the range of Rs150-180mn. The rig can fetch a revenue of ~Rs300,000 per day. Post the addition of the CBM rig, margins could expand further as a CBM rig earns an operating margin in the range of 65-70%. The company is also planning to apply for E&P operations in marginal fields and also grow the inorganic way through small acquisitions in the Indian oil and gas space. AOSL is also planning to expand its geographic presence and generate over 30% of its revenue outside India in the next three years. Valuation summary
Period to March FY03 FY04 FY05 FY06 FY07 (Rs mn) (12) (12) (12) (12) (12) Revenues 53 95 78 103 273 yoy growth (%) - 80.8 (18.3) 32.7 164.3 Operating profit 11 13 9 13 77 OPM (%) 20.1 13.5 11.7 12.4 28 PAT 8 5 3 6 48 yoy growth (%) - (33.3) (36.0) 81.2 720.7 EPS (Rs) 1.4 0.9 0.6 1.1 6.8 P/E (x) - - - - 40.5 P/BV (x) - - - - 12.8 EV/EBITDA (x) - - - - 24.5 ROE (%) 11.1 7.7 4.7 7.8 31.7 ROCE (%) 13.1 13.4 8.3 12.4 38.8
Source: Company, India Infoline Research
December 19, 2007
Asian Oilfield Services Ltd
11
Robust order book position The current order book of the company is at Rs1.6bn which is 6.3x FY07 sales of Rs277mn. The executable period for the orders is 2 years. This order book comprises only seismic studies and a small order for job services. With addition of CBM rig in the next six months, the order book would swell. The company has also bid for more than Rs3bn worth of contracts. The company has a vision to earn revenue of US$100mn by FY11. Promoter share holding set to increase Currently the promoters hold around 11.6% and Consolidated Securities, a Delhi based private equity firm, hold 23.6% in the company. Low promoter holding has been the concern with the stock but with issue of fresh warrants the shareholding of promoters is set to increase. AOSL had issued 1mn warrants to promoters and 1.39mn warrants to Consolidated Securities in September 2007 at Rs76. The company is also in the process of issuing 1.5mn shares and 1.2mn warrants at Rs190 to Samara Capital, a private equity fund managed by three ex-officials of Citigroup Venture Capital International. Post issue promoters shareholding will increase to 15% whereas Consolidated Securities and Samara Capital will have 28.5% and 14.9% stakes respectively. Company background AOSL was incorporated in 1992 and was primarily an operator for oilfield work-over rigs. The company then diversified into shot hole drilling in 1996. This was the first step towards developing expertise in seismic survey as shot hole drilling is a key element of seismic data acquisition process. Since then AOSL executed contracts in almost every kind of terrain for shot hole drilling services. It was the first private company to execute a seismic survey order in the geographic complex terrains of Nagaland and Tripura. The company thus earned a great reputation in shot hole drilling services which aided them to bag prestigious contracts for seismic survey. The key clients include ONGC, Canaro Resources, Jubilant Oil and Gas and Premier Oil.
Management Profile
Name Designation
Krishna Kant Chairman
Avinash Manchanda Managing Director
Bhupendra Shah Director
N M Patel Director
D E ILavia Director
Somesh Shastri CS
Vikram Walie Additional Director
AOSL’s client roster includes: ä ONGC
ä Canaro Resources
ä Jubilant Oil and Gas
ä Premier Oil
ä Arrow Energy
ä Geo Empro
Performance in September quarter (Q2) is plagued by heavy rains in north eastern regions.
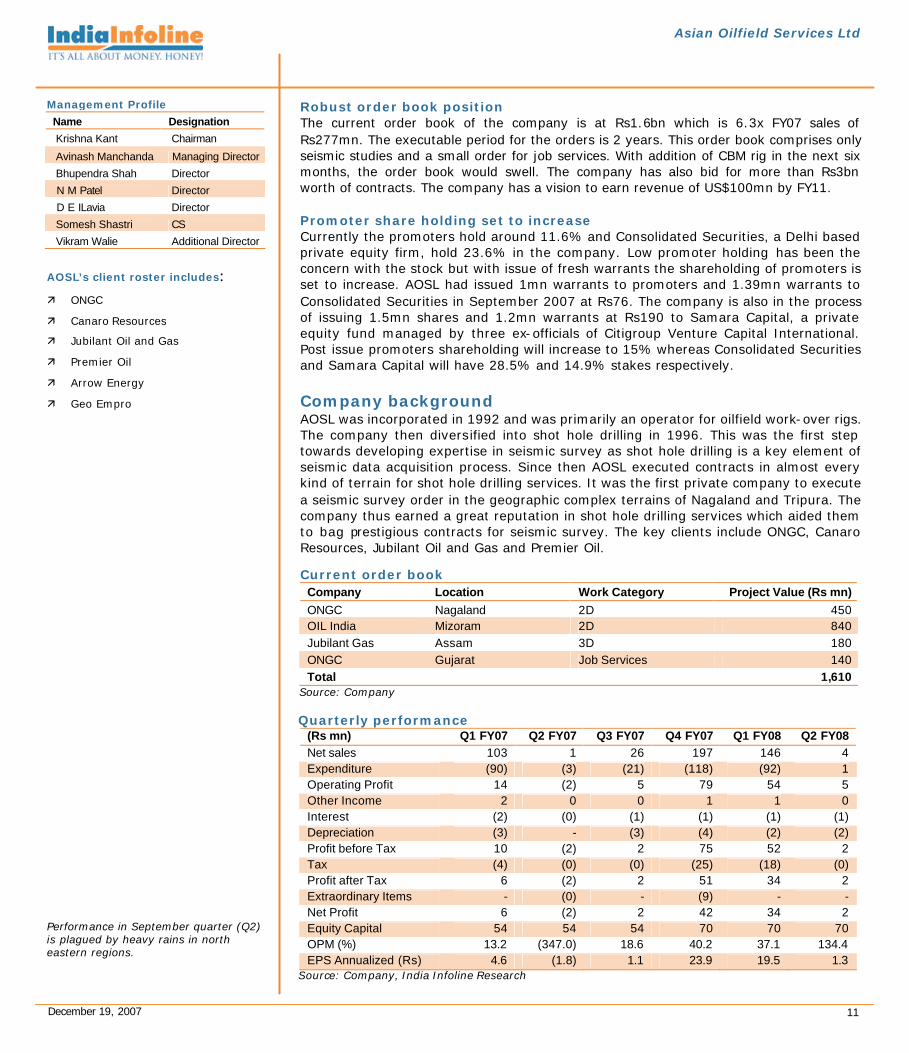
Current order book Company Location Work Category Project Value (Rs mn) ONGC Nagaland 2D 450 OIL India Mizoram 2D 840 Jubilant Gas Assam 3D 180 ONGC Gujarat Job Services 140 Total 1,610
Source: Company Quarterly performance
(Rs mn) Q1 FY07 Q2 FY07 Q3 FY07 Q4 FY07 Q1 FY08 Q2 FY08 Net sales 103 1 26 197 146 4 Expenditure (90) (3) (21) (118) (92) 1 Operating Profit 14 (2) 5 79 54 5 Other Income 2 0 0 1 1 0 Interest (2) (0) (1) (1) (1) (1) Depreciation (3) - (3) (4) (2) (2) Profit before Tax 10 (2) 2 75 52 2 Tax (4) (0) (0) (25) (18) (0) Profit after Tax 6 (2) 2 51 34 2 Extraordinary Items - (0) - (9) - - Net Profit 6 (2) 2 42 34 2 Equity Capital 54 54 54 70 70 70 OPM (%) 13.2 (347.0) 18.6 40.2 37.1 134.4 EPS Annualized (Rs) 4.6 (1.8) 1.1 23.9 19.5 1.3
Source: Company, India Infoline Research
December 19, 2007 12
Asian Oilfield Services Ltd
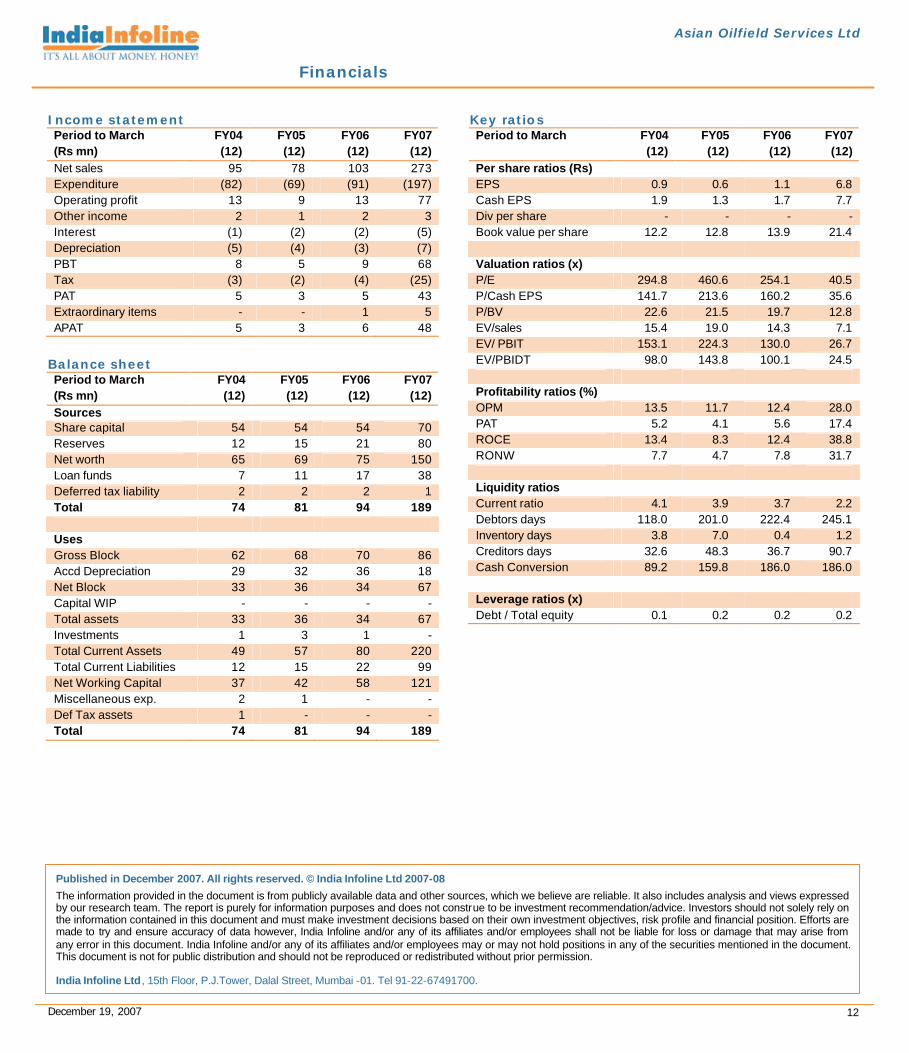
Income statement Period to March FY04 FY05 FY06 FY07 (Rs mn) (12) (12) (12) (12) Net sales 95 78 103 273 Expenditure (82) (69) (91) (197) Operating profit 13 9 13 77 Other income 2 1 2 3 Interest (1) (2) (2) (5) Depreciation (5) (4) (3) (7) PBT 8 5 9 68 Tax (3) (2) (4) (25) PAT 5 3 5 43 Extraordinary items - - 1 5 APAT 5 3 6 48
Balance sheet Period to March FY04 FY05 FY06 FY07 (Rs mn) (12) (12) (12) (12) Sources Share capital 54 54 54 70 Reserves 12 15 21 80 Net worth 65 69 75 150 Loan funds 7 11 17 38 Deferred tax liability 2 2 2 1 Total 74 81 94 189 Uses Gross Block 62 68 70 86 Accd Depreciation 29 32 36 18 Net Block 33 36 34 67 Capital WIP - - - - Total assets 33 36 34 67 Investments 1 3 1 - Total Current Assets 49 57 80 220 Total Current Liabilities 12 15 22 99 Net Working Capital 37 42 58 121 Miscellaneous exp. 2 1 - - Def Tax assets 1 - - - Total 74 81 94 189
Key ratios Period to March FY04 FY05 FY06 FY07 (12) (12) (12) (12) Per share ratios (Rs) EPS 0.9 0.6 1.1 6.8 Cash EPS 1.9 1.3 1.7 7.7 Div per share - - - - Book value per share 12.2 12.8 13.9 21.4 Valuation ratios (x) P/E 294.8 460.6 254.1 40.5 P/Cash EPS 141.7 213.6 160.2 35.6 P/BV 22.6 21.5 19.7 12.8 EV/sales 15.4 19.0 14.3 7.1 EV/ PBIT 153.1 224.3 130.0 26.7 EV/PBIDT 98.0 143.8 100.1 24.5 Profitability ratios (%) OPM 13.5 11.7 12.4 28.0 PAT 5.2 4.1 5.6 17.4 ROCE 13.4 8.3 12.4 38.8 RONW 7.7 4.7 7.8 31.7 Liquidity ratios Current ratio 4.1 3.9 3.7 2.2 Debtors days 118.0 201.0 222.4 245.1 Inventory days 3.8 7.0 0.4 1.2 Creditors days 32.6 48.3 36.7 90.7 Cash Conversion 89.2 159.8 186.0 186.0 Leverage ratios (x) Debt / Total equity 0.1 0.2 0.2 0.2
Financials
Published in December 2007. All rights reserved. © India Infoline Ltd 2007-08
The information provided in the document is from publicly available data and other sources, which we believe are reliable. It also includes analysis and views expressed by our research team. The report is purely for information purposes and does not construe to be investment recommendation/advice. Investors should not solely rely on the information contained in this document and must make investment decisions based on their own investment objectives, risk profile and financial position. Efforts are made to try and ensure accuracy of data however, India Infoline and/or any of its affiliates and/or employees shall not be liable for loss or damage that may arise from any error in this document. India Infoline and/or any of its affiliates and/or employees may or may not hold positions in any of the securities mentioned in the document. This document is not for public distribution and should not be reproduced or redistributed without prior permission. India Infoline Ltd, 15th Floor, P.J.Tower, Dalal Street, Mumbai -01. Tel 91-22-67491700.
Related Documents