Atmospheric Environment 37 (2003) 3639–3651 OH and HO 2 Chemistry in the urban atmosphere of New York City Xinrong Ren a, *, Hartwig Harder a,b , Monica Martinez a,b , Robert L. Lesher a , Angelique Oliger a , James B. Simpas a , William H. Brune a , James J. Schwab c , Kenneth L. Demerjian c , Yi He d , Xianliang Zhou d,e , Honglian Gao e a Department of Meteorology, Pennsylvania State University, University Park, PA 16802, USA b Max-Planck-Institut f . ur Chemie, D-55116 Mainz, Germany c Atmospheric Sciences Research Center, University at Albany, State University of New York, Albany, NY 12203, USA d Department of Environmental Health and Toxicology, University at Albany, State University of New York, Albany, NY 12222, USA e Wadsworth Center, New York State Department of Health, Albany, NY 12201, USA Received 6 March 2003; accepted 27 May 2003 Abstract Observed hydroxyl (OH) and hydroperoxy (HO 2 ) radicals, collectively called HO x , were compared with OH and HO 2 calculated by a box model that used the regional atmospheric chemistry mechanism and was constrained to the ancillary measurements during the PM 2.5 Technology Assessment and Characterization Study-New York (PMTACS- NY) summer 2001 intensive in New York City. The measurements are described in the companion paper, Ren et al. (HO x concentrations and OH reactivity observations in New York City during PMTACS-NY2001, Atmospheric Environment, this issue). This comparison enables an investigation of HO x chemistry in this polluted urban atmosphere. For HO 2 , the observed concentrations and diurnal variation were usually well reproduced by the model calculations, with an observed-to-modeled ratio of 1.24, on average, for day and night. For OH, the model was generally able to match the measured concentrations during daytime with an observed-to-modeled ratio of about 1.10, but the calculations significantly underestimated OH during nighttime. The budgets of HO x show that its production was dominated by the photolysis of HONO, accounting for B56% of HO x production on average, during daytime due to relatively high HONO concentrations, while nighttime HO x production was mainly from the O 3 reactions with alkenes. The OH reactivity measurements agree with the calculations to within 10% for both the composite diurnal variation and individual days. Calculations indicate that the reactions of OH with NO 2 , hydrocarbons, CO, NO, and carbonyls accounted for about 32%, 25%, 12%, 10% and 7% of total OH loss, respectively, in this urban area. Modeled instantaneous O 3 production from HO 2 and RO 2 reactions with NO was 1507100 ppbv day 1 .O 3 production rates from measured HO 2 ðPðO 3 Þ HO 2 obs Þ was greater than modeled HO 2 ðPðO 3 Þ HO 2 calc Þ at higher values of NO. Average daily cumulative PðO 3 Þ HO 2 obs was B140 ppbv day 1 , a factor of 1.5, greater than average daily PðO 3 Þ HO 2 calc : r 2003 Elsevier Ltd. All rights reserved. Keywords: Hydroxyl and hydroperoxy radicals; Model comparison; Urban environment; HO x budgets; Ozone production 1. Introduction Measurements of OH and HO 2 were made during the PM2.5 Technology Assessment and Characterization Study-New York (PMTACS-NY) intensive field cam- paign, which occurred during summer 2001 at Queens College in New York City. Simultaneous measurements of meteorological variables and other chemicals provide an opportunity to calculate the OH and HO 2 with a model for comparison to observations. The HO x measurements are discussed in a companion paper ARTICLE IN PRESS AE International – North America *Corresponding author. Fax: +1-814-865-3663. E-mail address: [email protected] (X. Ren). 1352-2310/03/$ - see front matter r 2003 Elsevier Ltd. All rights reserved. doi:10.1016/S1352-2310(03)00459-X

Welcome message from author
This document is posted to help you gain knowledge. Please leave a comment to let me know what you think about it! Share it to your friends and learn new things together.
Transcript
Atmospheric Environment 37 (2003) 3639–3651
OH and HO2 Chemistry in the urban atmosphere ofNew York City
Xinrong Rena,*, Hartwig Hardera,b, Monica Martineza,b, Robert L. Leshera,Angelique Oligera, James B. Simpasa, William H. Brunea, James J. Schwabc,
Kenneth L. Demerjianc, Yi Hed, Xianliang Zhoud,e, Honglian Gaoe
aDepartment of Meteorology, Pennsylvania State University, University Park, PA 16802, USAbMax-Planck-Institut f .ur Chemie, D-55116 Mainz, Germany
cAtmospheric Sciences Research Center, University at Albany, State University of New York, Albany, NY 12203, USAdDepartment of Environmental Health and Toxicology, University at Albany, State University of New York, Albany, NY 12222, USA
eWadsworth Center, New York State Department of Health, Albany, NY 12201, USA
Received 6 March 2003; accepted 27 May 2003
Abstract
Observed hydroxyl (OH) and hydroperoxy (HO2) radicals, collectively called HOx, were compared with OH and HO2
calculated by a box model that used the regional atmospheric chemistry mechanism and was constrained to the
ancillary measurements during the PM2.5 Technology Assessment and Characterization Study-New York (PMTACS-
NY) summer 2001 intensive in New York City. The measurements are described in the companion paper, Ren et al.
(HOx concentrations and OH reactivity observations in New York City during PMTACS-NY2001, Atmospheric
Environment, this issue). This comparison enables an investigation of HOx chemistry in this polluted urban
atmosphere. For HO2, the observed concentrations and diurnal variation were usually well reproduced by the model
calculations, with an observed-to-modeled ratio of 1.24, on average, for day and night. For OH, the model was
generally able to match the measured concentrations during daytime with an observed-to-modeled ratio of about 1.10,
but the calculations significantly underestimated OH during nighttime. The budgets of HOx show that its production
was dominated by the photolysis of HONO, accounting forB56% of HOx production on average, during daytime due
to relatively high HONO concentrations, while nighttime HOx production was mainly from the O3 reactions with
alkenes. The OH reactivity measurements agree with the calculations to within 10% for both the composite diurnal
variation and individual days. Calculations indicate that the reactions of OH with NO2, hydrocarbons, CO, NO, and
carbonyls accounted for about 32%, 25%, 12%, 10% and 7% of total OH loss, respectively, in this urban area.
Modeled instantaneous O3 production from HO2 and RO2 reactions with NO was 1507100 ppbv day�1. O3 production
rates from measured HO2ðPðO3ÞHO2obs Þ was greater than modeled HO2ðPðO3Þ
HO2calc Þ at higher values of NO. Average daily
cumulative PðO3ÞHO2obs was B140 ppbv day�1, a factor of 1.5, greater than average daily PðO3Þ
HO2calc :
r 2003 Elsevier Ltd. All rights reserved.
Keywords: Hydroxyl and hydroperoxy radicals; Model comparison; Urban environment; HOx budgets; Ozone production
1. Introduction
Measurements of OH and HO2 were made during the
PM2.5 Technology Assessment and Characterization
Study-New York (PMTACS-NY) intensive field cam-
paign, which occurred during summer 2001 at Queens
College in New York City. Simultaneous measurements
of meteorological variables and other chemicals provide
an opportunity to calculate the OH and HO2 with a
model for comparison to observations. The HOx
measurements are discussed in a companion paper
ARTICLE IN PRESS
AE International – North America
*Corresponding author. Fax: +1-814-865-3663.
E-mail address: [email protected] (X. Ren).
1352-2310/03/$ - see front matter r 2003 Elsevier Ltd. All rights reserved.
doi:10.1016/S1352-2310(03)00459-X
(Ren et al., 2003). Since OH and HO2 have very short
photochemical lifetimes and play important roles in the
atmospheric oxidation processes, comparison of mea-
sured and modeled HOx enables the examination of the
oxidation mechanisms in this urban environment.
Several intensive field campaigns with HOx measure-
ments have occurred at ground-based sites in the past
decade (Mather et al., 1997; Mount and Williams, 1997;
Kanaya et al., 1999, 2001; Creasey et al., 2001; Faloona
et al., 2001; Martinez et al., 2000, 2002; Holland et al.,
2003). Most of these were carried out in relatively clean
environments. Relatively few intensive field campaigns
with HOx measurements have been made in polluted
urban environments. These studies include Hard et al.
(1984, 1986, 1992) in Portland, Oregon; Abram et al.
(2000) near London, UK; George et al. (1999) near Los
Angeles, CA; Martinez et al. (2000) in Nashville, TN;
Martinez et al. (2002) in Houston, TX, and Holland et al.
(2003) near Berlin, Germany. Only the last five studies
had simultaneous measurements of several chemicals
that have strong influence on OH and HO2 and are
necessary to truly constrain the model for comparisons
to measurements.
Two interesting observations have been found in both
Nashville and Houston studies (Martinez et al., 2000,
2002). First, HO2 was greater than expected in air
containing copious NO, thus ozone production did not
decrease as much as expected when NO was greater than
2 ppbv. Second, the OH budget analysis indicated that
additional OH sources were required to balance the OH
sinks. A question remains: Are these observed-to-
modeled differences a result of misunderstood chemis-
try, and thus occurring in all environments, or are they a
result of the unique atmospheric chemical composition
of only certain environments?
Measurements and modeling studies of nighttime
HOx are very limited. George et al. (1999) observed
persistent OH radical at B1� 106 cm�3 at the beginning
of the evening in Los Angeles. Kanaya et al. (1999)
obtained HO2 concentration of about 3 pptv
(B7.5� 107 cm�3) for most of the night in the marine
atmosphere at Oki Island, Japan. In their recent work,
both Creasey et al. (2001) and Faloona et al. (2001)
found that OH radical persisted into the evening hours
after dark in small but significant concentrations at
forested areas in northwestern Greece and in Michigan,
respectively. While Carslaw et al. (2001) found that the
model could reproduce the evening OH in Greece,
Faloona et al. (2001) found that the model could
reproduce the prodigious nighttime OH only if reactions
between O3 and unknown super-reactive alkenes were
included in the model. Elevated nighttime OH and HO2
were frequently observed in Nashville and Houston,
providing strong evidence for an O3+alkene source of
HOx (Martinez et al., 2000, 2002). However, even when
considering the reaction mechanisms involving O3 and
alkenes, the nighttime OH and the HO2/OH ratio could
not be explained. Thus, while significant nighttime HO2
has been observed by several research groups using
different techniques, significant nighttime OH has not.
In this paper, we present a model comparison with the
OH and HO2 observations during the PMTACS-NY
intensive campaign in summer 2001. The purpose of this
work is to substantiate our understanding of the
chemistry controlling HOx levels in this highly polluted
environment. Model comparisons with observations as
well as HOx budgets and photochemical O3 production
are discussed.
2. Ancillary measurements and model description
The site description of the PMTACS-NY 2001
campaign is given in the companion paper (Ren et al.,
2003). During the campaign, the following ancillary data
were continuously measured: O3, CO, SO2, NO, NO2,
CH4, formaldehyde (HCHO), nitrous acid (HONO),
nitric acid (HNO3), speciated nonmethane hydrocar-
bons (NMHCs), some carbonyls, temperature, pressure,
relative humidity (RH), wind speed, wind direction.
HONO and HNO3 were measured by aqueous-phase
scrubbing and HPLC analysis (Huang et al., 2002). The
other measurements were made by the New York State
Department of Environmental Conservation from one
of their New York City PAMS (Photochemical Assess-
ment Monitoring Station) sites (US Environmental
Protection Agency (USEPA), 1994). HCHO was
scrubbed from ambient air into water, then mixed with
the reagents 2,4-pentanedione and ammonium acetate to
form stoichiometrically the product derivative 3,5-
diacetyl 1,4-dihydrolutidine followed by fluorescence
detection. Carbonyls including aldehydes from C2 to C5
and several ketones (including acetone, 2-butanone and
methacrolein) were measured by HPLC technique.
Speciated NMHCs were measured on every third day
with a 24-h integration time at the Queens College site,
while they were measured on-line with 1-h integration
times on the campus of Queensborough Community
College (QCC), which is located B2.5mile to the east of
the Queens College site. By comparing the speciated
NMHC measurements at the Queens College site and at
the QCC site (averaging data for the whole day), a ratio
was calculated for each chemical in the NMHCs. These
ratios were then used to scale the QCC NMHC data for
the days when NMHCs were measured at the Queens
College site. The same ratios were assumed for the day
before and the day after, when NMHCs were not
measured at the Queens College site. The ratios were
generally close to 1.0 and were between 0.5 and 2.0 for
most chemicals, suggesting that both sites had similar
speciated NMHC concentrations. These scaled 1-h
NMHC measurements were then used in the model.
ARTICLE IN PRESSX. Ren et al. / Atmospheric Environment 37 (2003) 3639–36513640
The measured chemicals that are important to HOx,
along with the detection methods, time resolution and
detection limits, are given in Table 1.
The data were reported at different time intervals for
different measurements. O3, NO, NO2, CO, SO2, and
CH4 were averaged over 1min. HONO, HNO3 and
HCHO were average over 10min. In the analysis, all
these data were average to 10-min time intervals. The
HONO and HNO3 data from 13 to 17 July were not
available, so average diurnal variation of the whole
campaign was used for these 5 days. Other missing data
were obtained by linear interpolation. Since NMHCs
were only measured in 1-h integrated samples, their
concentrations were assumed to remain constant during
the 1-h period. Sensitivity studies show that it matters
little to HOx whether an interpolation or constant values
are used. Carbonyls except HCHO were measured only
every third day with a 3-h integrated sampling period
(8 samples for a day). Their concentrations were also
assumed to remain constant during the sample period.
This assumption introduced maximum uncertainties of
4% for modeled OH and 7% for modeled HO2. H2 was
fixed at 500 ppbv for the whole campaign. Hydrogen
peroxide and organic hydroperoxides were not measured
and were calculated by the model.
For model calculations, the Regional Atmospheric
Chemistry Mechanism (RACM) (Stockwell et al., 1997)
was used to calculate the OH and HO2 concentrations.
Kinetic rate coefficients were updated using the results
by DeMore et al. (1997) and Sander et al. (2000). The
measured VOCs were categorized as suggested by
Stockwell et al. (1997) (Table 2). Since a-pinene,d-limonene and other such alkenes were not measured
during this campaign, reactions relevant to these
chemicals were not included in the model. Reactions of
O3 with alkenes have been largely revised to represent
latest radical yields suggested by recent experiments
(Paulson et al., 1999; Rickard et al., 1999; Fenske et al.,
2000). Heterogeneous reactions of SO3 and N2O5 were
included in the model, although no dry deposition
processes were. Dry deposition can be ignored if OH
and HO2 are in steady state. The assumption of steady
state certainly applies to OH, which had a lifetime
shorter than 0.1 s; it should usually apply to HO2 except
in very clean, rarely encountered conditions, when its
lifetime becomes a few tens of seconds.
During the field campaign, photolysis frequencies
were not measured directly. However, a Yankee ultra-
violet multifilter rotating shadowband radiometer (UV-
MFRSR) was used to measure the global, direct, and
diffuse UV components of solar irradiance at seven
different wavelength bands near 299, 305, 311, 317, 324,
332, 367 nm, each with a 2 nm effective bandwidth. All
photolysis frequencies (J values) used in the model were
calculated from following expression (Jenkin et al.,
1997):
Ji ¼ Li cosðwÞMi exp½�Ni secðwÞ�; ð1Þ
where w is the solar zenith angle and Li; Mi; Ni are
chemical-specific parameters. These parameters were
derived via a fitting procedure for each chemical
originally developed by Hough (1988). As described by
Grenfell et al. (1999), the parameters in this model are
suitable for a higher-latitude region with a clear sky and
higher ozone column density (345 Dobson units).
During the campaign, the average total ozone column
density over the site was 332 Dobson units, as measured
by total ozone mapping spectrometer-earth probe
satellite sensor (data available at http: //toms.gsfc.
nasa.gov/teacher/ozone overhead.html). The solar spec-
tral irradiance over the range 300–320 nm would be
similar to that with 345 Dobson units of column ozone.
Therefore expression (1) and the parameters by Jenkin
et al. (1997) were used to calculate the frequencies for
the 23 photolysis reactions in the RACM model. The
midday J values agreed to within 5–10% with those
calculated with the TUV radiative transfer model
(http://www.acd.ucar.edu/TUV). The field experiment
log and the UV radiation profile measured on 3 July
indicated that 3 July was a clean day with a clear sky.
Thus the ratio of calculated photolysis frequency to UV
radiation intensity for each photolytic chemical on this
ARTICLE IN PRESS
Table 1
Measured chemicals important to HOx, along with the detection methods, time resolution and detection limits
Chemicals Techniques/instruments Time resolution Detection limits
O3 UV absorption, TECO 49 1min 2 ppbv
NO, NO2 Chemiluminescence, TECO 42 1min 0.5 ppbv
NOy Chemiluminescence, modified TECO 42 1min 0.05 ppbv
CO IR correlation, modified TECO 48 1min 0.1 ppmv
SO2 Pulsed UV fluorescence, TECO 43 1min 0.5 ppbv
HONO Scrubbed derivatization HPLC 10min 5 pptv
HNO3 Scrubbed derivatization HPLC 10min 20 pptv
Hydrocarbons C2–C12 Auto GC/MS 1h —
HCHO Fluorescence assay, Alpha Omega 10min 0.1 ppbv
Carbonyls HPLC 3h —
X. Ren et al. / Atmospheric Environment 37 (2003) 3639–3651 3641
day was calculated and used as reference to correct for
cloud effects. The photolysis frequencies on other days
were then scaled to the UV radiation intensities. Since
the UV-MFRSR detector has a cosine light dependence
with incidence angle greater than 80�, the uncertainties
in the photolysis frequencies were about a factor of 2–3
at solar zenith angles greater than 80�.
The model was run with the FACSIMILE software
(UES Software Inc.). The model used the 10-min
average values of O3, NO, NO2, CO, SO2, categorized
VOCs, water vapor, temperature, pressure, and calcu-
lated photolysis frequencies as constrained input para-
meters. It then calculated OH and HO2 as well as other
reactive chemicals such as NO3 and organic peroxy
radicals (RO2). The uncertainty in this RACM model
was estimated to be745% for OH and770% for HO2,
with 2s confidence. These uncertainties are based on the
combined uncertainties of the kinetic rate coefficients
(DeMore et al., 1997; Sander et al., 2000; Stockwell et al.,
1997), the measured chemical concentrations, and the
calculated photolysis frequencies, as estimated with a
Monte Carlo approach (as in Carslaw et al., 1999).
3. Model results and comparison with observations
In situ OH and HO2 were measured by the Penn State
laser-induced fluorescence (LIF) instrument. As de-
scribed in the companion paper, the detection limits
were about 3� 105 cm�3 for OH and 2.5� 106 cm�3
(0.1 pptv) for HO2, with 2s confidence and a 1-min
integration time. The measurements were made from the
end of June to the beginning of August 2001. The OH
reactivity was measured at the same time, as discussed in
the companion paper. The overlap of all necessary
ancillary measurements allowed model comparisons
to be made with measurements between 10 July and
2 August.
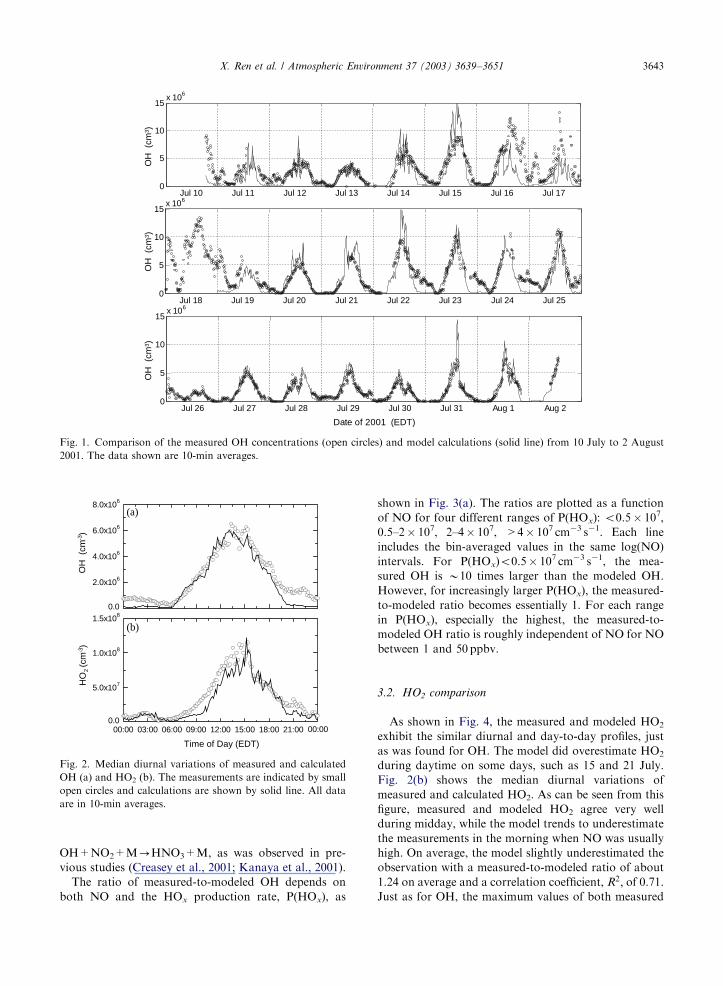
3.1. OH comparison
As shown in Fig. 1, the measurements and model
exhibit similar diurnal and day-to-day variations, with
maxima in the early afternoon and minima at night. The
agreement is good especially for the last part of the
campaign, although modeled values are often lower than
measured values in early evening and during nighttime.
Good agreement was obtained for daytime, which is
defined as period when O3 photolysis frequency J(O1D)
was greater than 0.1� 10�5 s�1, corresponding the
period from B7:00 to B18:30 (Eastern Daylight Time
(EDT)). The observed-to-modeled ratio was about 1.10
on average; the correlation coefficient, R2; was 0.65.
Unlike most of the study, the period between 16 and 19
July has measured OH substantially larger than modeled
OH. Because no instrument effects have been found that
can explain the discrepancy, more investigation will be
required to determine its cause. With a few exceptions,
the differences between the measurements and model are
less than the 2s uncertainties in the measurements and
model.
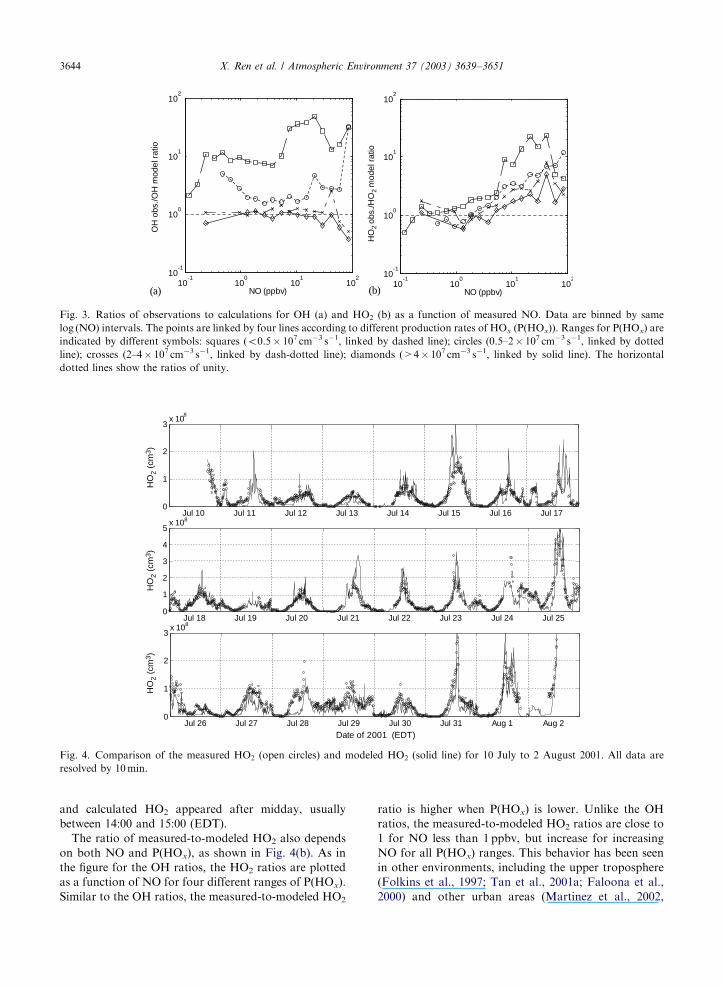
The median daytime OH and its variation are
captured by the model (Fig. 2(a)). Both the measure-
ments and the model show that the peak occurred about
2 h after local solar noon, which was at B12:55 EDT.
The delay was caused by the high morning NOx, which
acted as an effective sink for HOx by the reaction
ARTICLE IN PRESS
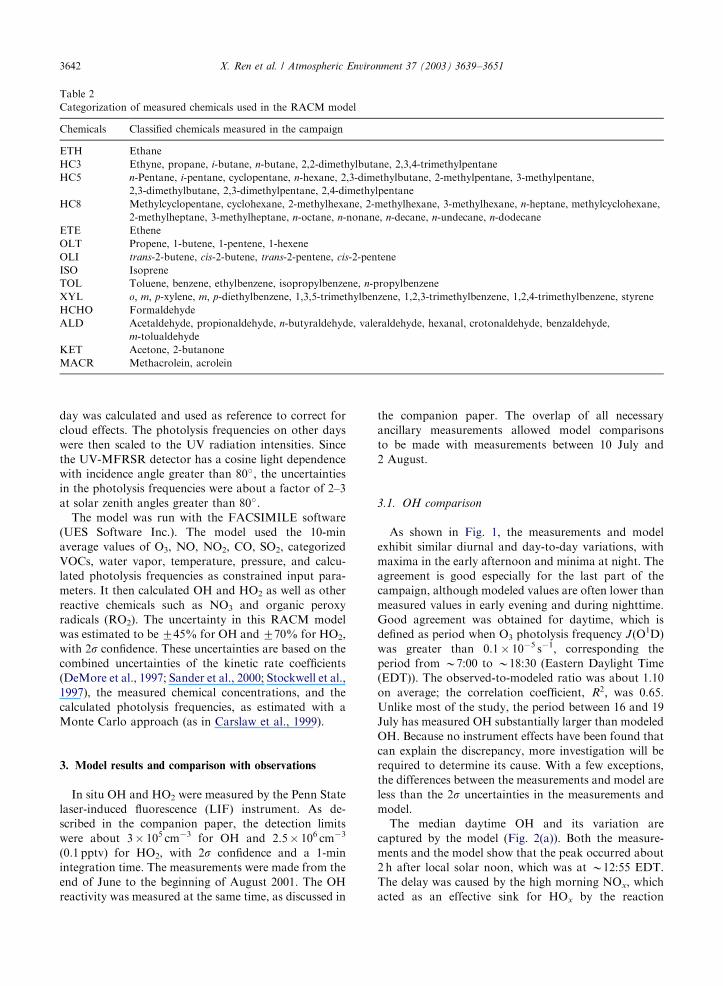
Table 2
Categorization of measured chemicals used in the RACM model
Chemicals Classified chemicals measured in the campaign
ETH Ethane
HC3 Ethyne, propane, i-butane, n-butane, 2,2-dimethylbutane, 2,3,4-trimethylpentane
HC5 n-Pentane, i-pentane, cyclopentane, n-hexane, 2,3-dimethylbutane, 2-methylpentane, 3-methylpentane,
2,3-dimethylbutane, 2,3-dimethylpentane, 2,4-dimethylpentane
HC8 Methylcyclopentane, cyclohexane, 2-methylhexane, 2-methylhexane, 3-methylhexane, n-heptane, methylcyclohexane,
2-methylheptane, 3-methylheptane, n-octane, n-nonane, n-decane, n-undecane, n-dodecane
ETE Ethene
OLT Propene, 1-butene, 1-pentene, 1-hexene
OLI trans-2-butene, cis-2-butene, trans-2-pentene, cis-2-pentene
ISO Isoprene
TOL Toluene, benzene, ethylbenzene, isopropylbenzene, n-propylbenzene
XYL o; m; p-xylene, m; p-diethylbenzene, 1,3,5-trimethylbenzene, 1,2,3-trimethylbenzene, 1,2,4-trimethylbenzene, styrene
HCHO Formaldehyde
ALD Acetaldehyde, propionaldehyde, n-butyraldehyde, valeraldehyde, hexanal, crotonaldehyde, benzaldehyde,
m-tolualdehyde
KET Acetone, 2-butanone
MACR Methacrolein, acrolein
X. Ren et al. / Atmospheric Environment 37 (2003) 3639–36513642
OH+NO2+M-HNO3+M, as was observed in pre-
vious studies (Creasey et al., 2001; Kanaya et al., 2001).
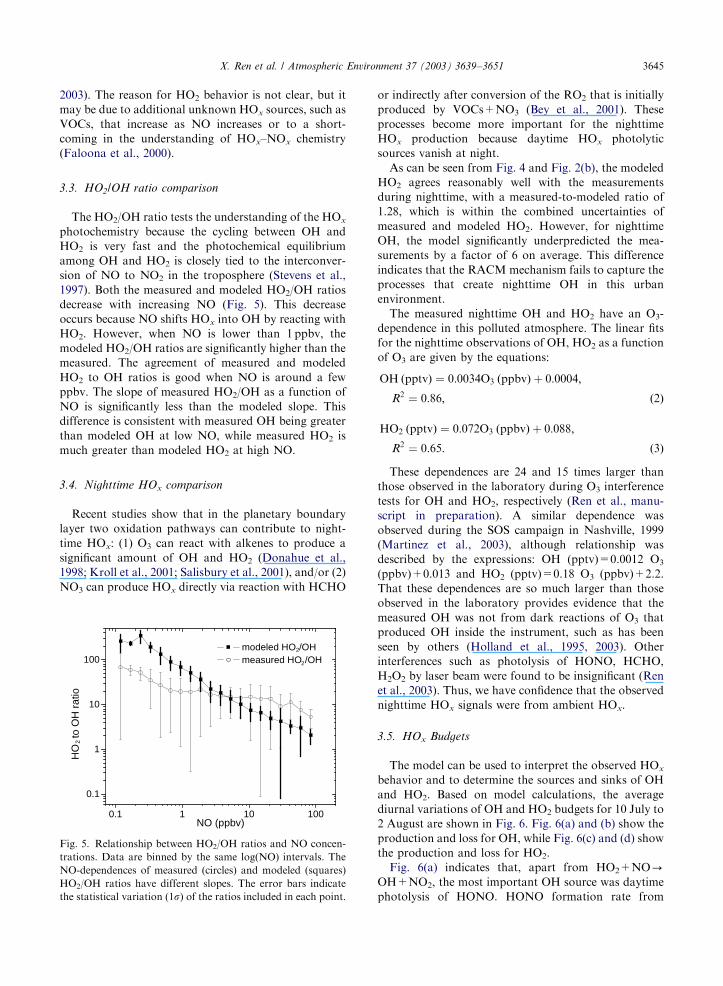
The ratio of measured-to-modeled OH depends on
both NO and the HOx production rate, P(HOx), as
shown in Fig. 3(a). The ratios are plotted as a function
of NO for four different ranges of P(HOx): o0.5� 107,
0.5–2� 107, 2–4� 107, >4� 107 cm�3 s�1. Each line
includes the bin-averaged values in the same log(NO)
intervals. For P(HOx)o0.5� 107 cm�3 s�1, the mea-
sured OH is B10 times larger than the modeled OH.
However, for increasingly larger P(HOx), the measured-
to-modeled ratio becomes essentially 1. For each range
in P(HOx), especially the highest, the measured-to-
modeled OH ratio is roughly independent of NO for NO
between 1 and 50 ppbv.
3.2. HO2 comparison
As shown in Fig. 4, the measured and modeled HO2
exhibit the similar diurnal and day-to-day profiles, just
as was found for OH. The model did overestimate HO2
during daytime on some days, such as 15 and 21 July.
Fig. 2(b) shows the median diurnal variations of
measured and calculated HO2. As can be seen from this
figure, measured and modeled HO2 agree very well
during midday, while the model trends to underestimate
the measurements in the morning when NO was usually
high. On average, the model slightly underestimated the
observation with a measured-to-modeled ratio of about
1.24 on average and a correlation coefficient, R2; of 0.71.Just as for OH, the maximum values of both measured
ARTICLE IN PRESS
Jul 10 Jul 11 Jul 12 Jul 13 Jul 14 Jul 15 Jul 16 Jul 170
5
10
15x 10
OH
(cm
3 )O
H (
cm3 )
OH
(cm
3 )
Jul 18 Jul 19 Jul 20 Jul 21 Jul 22 Jul 23 Jul 24 Jul 250
5
10
15x 106
6
Jul 26 Jul 27 Jul 28 Jul 29 Jul 30 Jul 31 Aug 1 Aug 20
5
10
15x 106
Date of 2001 (EDT)
Fig. 1. Comparison of the measured OH concentrations (open circles) and model calculations (solid line) from 10 July to 2 August
2001. The data shown are 10-min averages.
0.0
2.0x10⁶
4.0x10⁶
6.0x10⁶
8.0x10⁶
00:00 03:00 06:00 09:00 12:00 15:00 18:00 21:000.0
5.0x10⁷
1.0x10⁸
1.5x10⁸
(b)
(a)
OH
(cm
-3)
00:00
HO
2 (cm
-3)
Time of Day (EDT)
Fig. 2. Median diurnal variations of measured and calculated
OH (a) and HO2 (b). The measurements are indicated by small
open circles and calculations are shown by solid line. All data
are in 10-min averages.
X. Ren et al. / Atmospheric Environment 37 (2003) 3639–3651 3643
and calculated HO2 appeared after midday, usually
between 14:00 and 15:00 (EDT).
The ratio of measured-to-modeled HO2 also depends
on both NO and P(HOx), as shown in Fig. 4(b). As in
the figure for the OH ratios, the HO2 ratios are plotted
as a function of NO for four different ranges of P(HOx).
Similar to the OH ratios, the measured-to-modeled HO2
ratio is higher when P(HOx) is lower. Unlike the OH
ratios, the measured-to-modeled HO2 ratios are close to
1 for NO less than 1 ppbv, but increase for increasing
NO for all P(HOx) ranges. This behavior has been seen
in other environments, including the upper troposphere
(Folkins et al., 1997; Tan et al., 2001a; Faloona et al.,
2000) and other urban areas (Martinez et al., 2002,
ARTICLE IN PRESS
10-1
100
101
102
10-1
100
101
102
NO (ppbv)
HO
2 ob
s./H
O2
mod
el r
atio
10-1
100
101
102
10-1
100
101
102
NO (ppbv)
OH
obs
./OH
mod
el r
atio
(a) (b)
Fig. 3. Ratios of observations to calculations for OH (a) and HO2 (b) as a function of measured NO. Data are binned by same
log (NO) intervals. The points are linked by four lines according to different production rates of HOx (P(HOx)). Ranges for P(HOx) are
indicated by different symbols: squares (o0.5� 107 cm�3 s�1, linked by dashed line); circles (0.5–2� 107 cm�3 s�1, linked by dotted
line); crosses (2–4� 107 cm�3 s�1, linked by dash-dotted line); diamonds (>4� 107 cm�3 s�1, linked by solid line). The horizontal
dotted lines show the ratios of unity.
Jul 10 Jul 11 Jul 12 Jul 13 Jul 14 Jul 15 Jul 16 Jul 170
1
2
3x 10
8
HO
2 (c
m3 )
HO
2 (c
m3 )
HO
2 (c
m3 )
Jul 18 Jul 19 Jul 20 Jul 21 Jul 22 Jul 23 Jul 24 Jul 250
1
2
3
4
5x 10⁸
Jul 26 Jul 27 Jul 28 Jul 29 Jul 30 Jul 31 Aug 1 Aug 20
1
2
3x 10⁸
Date of 2001 (EDT)
Fig. 4. Comparison of the measured HO2 (open circles) and modeled HO2 (solid line) for 10 July to 2 August 2001. All data are
resolved by 10min.
X. Ren et al. / Atmospheric Environment 37 (2003) 3639–36513644
2003). The reason for HO2 behavior is not clear, but it
may be due to additional unknown HOx sources, such as
VOCs, that increase as NO increases or to a short-
coming in the understanding of HOx–NOx chemistry
(Faloona et al., 2000).
3.3. HO2/OH ratio comparison
The HO2/OH ratio tests the understanding of the HOx
photochemistry because the cycling between OH and
HO2 is very fast and the photochemical equilibrium
among OH and HO2 is closely tied to the interconver-
sion of NO to NO2 in the troposphere (Stevens et al.,
1997). Both the measured and modeled HO2/OH ratios
decrease with increasing NO (Fig. 5). This decrease
occurs because NO shifts HOx into OH by reacting with
HO2. However, when NO is lower than 1 ppbv, the
modeled HO2/OH ratios are significantly higher than the
measured. The agreement of measured and modeled
HO2 to OH ratios is good when NO is around a few
ppbv. The slope of measured HO2/OH as a function of
NO is significantly less than the modeled slope. This
difference is consistent with measured OH being greater
than modeled OH at low NO, while measured HO2 is
much greater than modeled HO2 at high NO.
3.4. Nighttime HOx comparison
Recent studies show that in the planetary boundary
layer two oxidation pathways can contribute to night-
time HOx: (1) O3 can react with alkenes to produce a
significant amount of OH and HO2 (Donahue et al.,
1998; Kroll et al., 2001; Salisbury et al., 2001), and/or (2)
NO3 can produce HOx directly via reaction with HCHO
or indirectly after conversion of the RO2 that is initially
produced by VOCs+NO3 (Bey et al., 2001). These
processes become more important for the nighttime
HOx production because daytime HOx photolytic
sources vanish at night.
As can be seen from Fig. 4 and Fig. 2(b), the modeled
HO2 agrees reasonably well with the measurements
during nighttime, with a measured-to-modeled ratio of
1.28, which is within the combined uncertainties of
measured and modeled HO2. However, for nighttime
OH, the model significantly underpredicted the mea-
surements by a factor of 6 on average. This difference
indicates that the RACM mechanism fails to capture the
processes that create nighttime OH in this urban
environment.
The measured nighttime OH and HO2 have an O3-
dependence in this polluted atmosphere. The linear fits
for the nighttime observations of OH, HO2 as a function
of O3 are given by the equations:
OH ðpptvÞ ¼ 0:0034O3 ðppbvÞ þ 0:0004;
R2 ¼ 0:86; ð2Þ
HO2 ðpptvÞ ¼ 0:072O3 ðppbvÞ þ 0:088;
R2 ¼ 0:65: ð3Þ
These dependences are 24 and 15 times larger than
those observed in the laboratory during O3 interference
tests for OH and HO2, respectively (Ren et al., manu-
script in preparation). A similar dependence was
observed during the SOS campaign in Nashville, 1999
(Martinez et al., 2003), although relationship was
described by the expressions: OH (pptv)=0.0012 O3
(ppbv)+0.013 and HO2 (pptv)=0.18 O3 (ppbv)+2.2.
That these dependences are so much larger than those
observed in the laboratory provides evidence that the
measured OH was not from dark reactions of O3 that
produced OH inside the instrument, such as has been
seen by others (Holland et al., 1995, 2003). Other
interferences such as photolysis of HONO, HCHO,
H2O2 by laser beam were found to be insignificant (Ren
et al., 2003). Thus, we have confidence that the observed
nighttime HOx signals were from ambient HOx.
3.5. HOx Budgets
The model can be used to interpret the observed HOx
behavior and to determine the sources and sinks of OH
and HO2. Based on model calculations, the average
diurnal variations of OH and HO2 budgets for 10 July to
2 August are shown in Fig. 6. Fig. 6(a) and (b) show the
production and loss for OH, while Fig. 6(c) and (d) show
the production and loss for HO2.
Fig. 6(a) indicates that, apart from HO2+NO-OH+NO2, the most important OH source was daytime
photolysis of HONO. HONO formation rate from
ARTICLE IN PRESS
0.1 1 10 100
0.1
1
10
100 modeled HO2/OH measured HO2/OH
HO
2 to
OH
rat
io
NO (ppbv)
Fig. 5. Relationship between HO2/OH ratios and NO concen-
trations. Data are binned by the same log(NO) intervals. The
NO-dependences of measured (circles) and modeled (squares)
HO2/OH ratios have different slopes. The error bars indicate
the statistical variation (1s) of the ratios included in each point.
X. Ren et al. / Atmospheric Environment 37 (2003) 3639–3651 3645
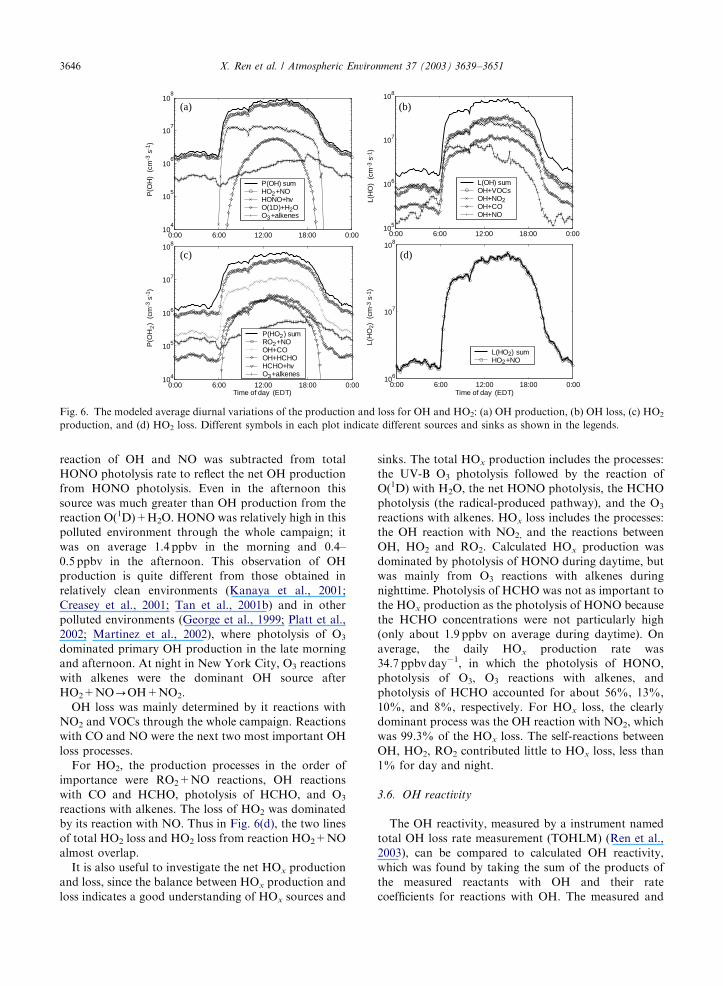
reaction of OH and NO was subtracted from total
HONO photolysis rate to reflect the net OH production
from HONO photolysis. Even in the afternoon this
source was much greater than OH production from the
reaction O(1D)+H2O. HONO was relatively high in this
polluted environment through the whole campaign; it
was on average 1.4 ppbv in the morning and 0.4–
0.5 ppbv in the afternoon. This observation of OH
production is quite different from those obtained in
relatively clean environments (Kanaya et al., 2001;
Creasey et al., 2001; Tan et al., 2001b) and in other
polluted environments (George et al., 1999; Platt et al.,
2002; Martinez et al., 2002), where photolysis of O3
dominated primary OH production in the late morning
and afternoon. At night in New York City, O3 reactions
with alkenes were the dominant OH source after
HO2+NO-OH+NO2.
OH loss was mainly determined by it reactions with
NO2 and VOCs through the whole campaign. Reactions
with CO and NO were the next two most important OH
loss processes.
For HO2, the production processes in the order of
importance were RO2+NO reactions, OH reactions
with CO and HCHO, photolysis of HCHO, and O3
reactions with alkenes. The loss of HO2 was dominated
by its reaction with NO. Thus in Fig. 6(d), the two lines
of total HO2 loss and HO2 loss from reaction HO2+NO
almost overlap.
It is also useful to investigate the net HOx production
and loss, since the balance between HOx production and
loss indicates a good understanding of HOx sources and
sinks. The total HOx production includes the processes:
the UV-B O3 photolysis followed by the reaction of
O(1D) with H2O, the net HONO photolysis, the HCHO
photolysis (the radical-produced pathway), and the O3
reactions with alkenes. HOx loss includes the processes:
the OH reaction with NO2, and the reactions between
OH, HO2 and RO2. Calculated HOx production was
dominated by photolysis of HONO during daytime, but
was mainly from O3 reactions with alkenes during
nighttime. Photolysis of HCHO was not as important to
the HOx production as the photolysis of HONO because
the HCHO concentrations were not particularly high
(only about 1.9 ppbv on average during daytime). On
average, the daily HOx production rate was
34.7 ppbv day�1, in which the photolysis of HONO,
photolysis of O3, O3 reactions with alkenes, and
photolysis of HCHO accounted for about 56%, 13%,
10%, and 8%, respectively. For HOx loss, the clearly
dominant process was the OH reaction with NO2, which
was 99.3% of the HOx loss. The self-reactions between
OH, HO2, RO2 contributed little to HOx loss, less than
1% for day and night.
3.6. OH reactivity
The OH reactivity, measured by a instrument named
total OH loss rate measurement (TOHLM) (Ren et al.,
2003), can be compared to calculated OH reactivity,
which was found by taking the sum of the products of
the measured reactants with OH and their rate
coefficients for reactions with OH. The measured and
ARTICLE IN PRESS
0:00 6:00 12:00 18:00 0:0010
4
105
106
107
108
P(O
H)
(cm
-3 s
-1)
P(OH) sumHO2+NOHONO+hvO(1D)+H2OO3+alkenes
0:00 6:00 12:00 18:00 0:00105
106
107
108
L(OH) sumOH+VOCsOH+NO2OH+COOH+NO
0:00 6:00 12:00 18:00 0:00104
105
106
107
108
P(O
H )
(cm
-3 s
-1)
2
Time of day (EDT)
P(HO2) sumRO2+NOOH+COOH+HCHOHCHO+hvO3+alkenes
0:00 6:00 12:00 18:00 0:00106
107
108
L(H
O2)
(cm
-3 s
-1)
L(H
O)
(cm
-3 s
-1)
Time of day (EDT)
L(HO2) sumHO2+NO
(a)
(c)
(b)
(d)
Fig. 6. The modeled average diurnal variations of the production and loss for OH and HO2: (a) OH production, (b) OH loss, (c) HO2
production, and (d) HO2 loss. Different symbols in each plot indicate different sources and sinks as shown in the legends.
X. Ren et al. / Atmospheric Environment 37 (2003) 3639–36513646
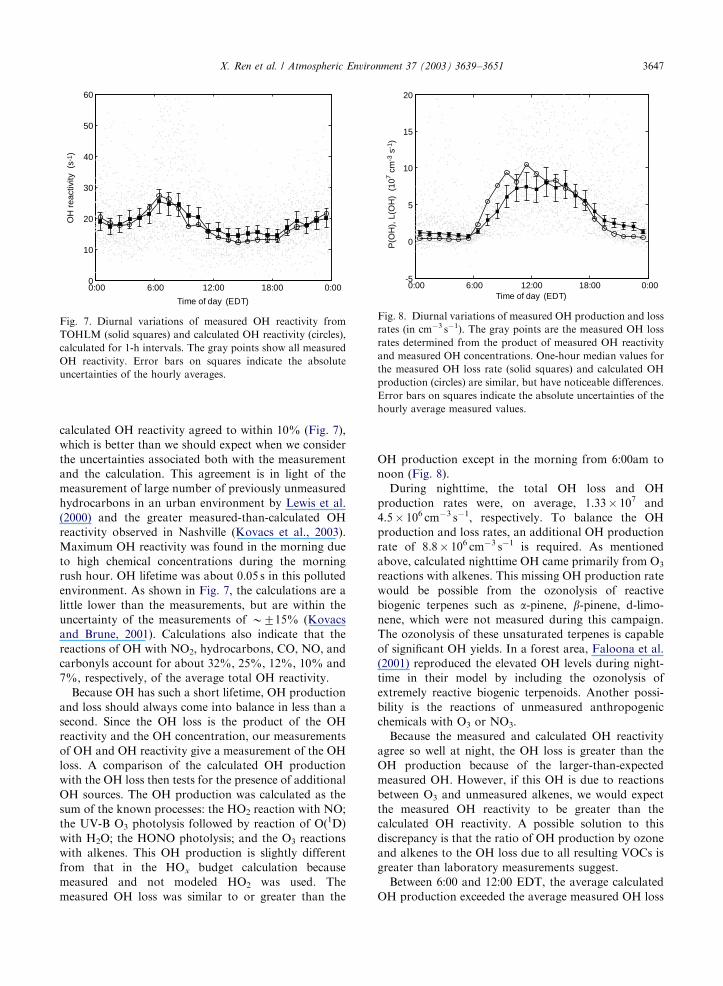
calculated OH reactivity agreed to within 10% (Fig. 7),
which is better than we should expect when we consider
the uncertainties associated both with the measurement
and the calculation. This agreement is in light of the
measurement of large number of previously unmeasured
hydrocarbons in an urban environment by Lewis et al.
(2000) and the greater measured-than-calculated OH
reactivity observed in Nashville (Kovacs et al., 2003).
Maximum OH reactivity was found in the morning due
to high chemical concentrations during the morning
rush hour. OH lifetime was about 0.05 s in this polluted
environment. As shown in Fig. 7, the calculations are a
little lower than the measurements, but are within the
uncertainty of the measurements of B715% (Kovacs
and Brune, 2001). Calculations also indicate that the
reactions of OH with NO2, hydrocarbons, CO, NO, and
carbonyls account for about 32%, 25%, 12%, 10% and
7%, respectively, of the average total OH reactivity.
Because OH has such a short lifetime, OH production
and loss should always come into balance in less than a
second. Since the OH loss is the product of the OH
reactivity and the OH concentration, our measurements
of OH and OH reactivity give a measurement of the OH
loss. A comparison of the calculated OH production
with the OH loss then tests for the presence of additional
OH sources. The OH production was calculated as the
sum of the known processes: the HO2 reaction with NO;
the UV-B O3 photolysis followed by reaction of O(1D)
with H2O; the HONO photolysis; and the O3 reactions
with alkenes. This OH production is slightly different
from that in the HOx budget calculation because
measured and not modeled HO2 was used. The
measured OH loss was similar to or greater than the
OH production except in the morning from 6:00am to
noon (Fig. 8).
During nighttime, the total OH loss and OH
production rates were, on average, 1.33� 107 and
4.5� 106 cm�3 s�1, respectively. To balance the OH
production and loss rates, an additional OH production
rate of 8.8� 106 cm�3 s�1 is required. As mentioned
above, calculated nighttime OH came primarily from O3
reactions with alkenes. This missing OH production rate
would be possible from the ozonolysis of reactive
biogenic terpenes such as a-pinene, b-pinene, d-limo-nene, which were not measured during this campaign.
The ozonolysis of these unsaturated terpenes is capable
of significant OH yields. In a forest area, Faloona et al.
(2001) reproduced the elevated OH levels during night-
time in their model by including the ozonolysis of
extremely reactive biogenic terpenoids. Another possi-
bility is the reactions of unmeasured anthropogenic
chemicals with O3 or NO3.
Because the measured and calculated OH reactivity
agree so well at night, the OH loss is greater than the
OH production because of the larger-than-expected
measured OH. However, if this OH is due to reactions
between O3 and unmeasured alkenes, we would expect
the measured OH reactivity to be greater than the
calculated OH reactivity. A possible solution to this
discrepancy is that the ratio of OH production by ozone
and alkenes to the OH loss due to all resulting VOCs is
greater than laboratory measurements suggest.
Between 6:00 and 12:00 EDT, the average calculated
OH production exceeded the average measured OH loss
ARTICLE IN PRESS
0:00 6:00 12:00 18:00 0:000
10
20
30
40
50
60
Time of day (EDT)
OH
rea
ctiv
ity (
s-1 )
Fig. 7. Diurnal variations of measured OH reactivity from
TOHLM (solid squares) and calculated OH reactivity (circles),
calculated for 1-h intervals. The gray points show all measured
OH reactivity. Error bars on squares indicate the absolute
uncertainties of the hourly averages.
0:00 6:00 12:00 18:00 0:00-5
0
5
10
15
20
Time of day (EDT)
P(O
H),
L(O
H)
(10
7 cm
-3 s
-1)
Fig. 8. Diurnal variations of measured OH production and loss
rates (in cm�3 s�1). The gray points are the measured OH loss
rates determined from the product of measured OH reactivity
and measured OH concentrations. One-hour median values for
the measured OH loss rate (solid squares) and calculated OH
production (circles) are similar, but have noticeable differences.
Error bars on squares indicate the absolute uncertainties of the
hourly average measured values.
X. Ren et al. / Atmospheric Environment 37 (2003) 3639–3651 3647
by (1–4)� 107 cm�3 s�1. OH production exceeding OH
loss is difficult to understand because the OH loss was
measured directly. One possibility is that the HO2
measurement was too high in the morning when the
NO was high, since the reaction HO2+NO dominated
OH production. However, no laboratory or field tests
have shown a problem with the HO2 measurement at
higher NO. A second and more likely possibility is that
we have under-corrected the OH decays in the OH
reactivity measurements for the reaction HO2+NO-OH+NO2 (Ren et al., 2003). In this case, the OH
reactivity was actually higher than was measured, and
the increase in OH loss rate will bring the production
and loss rates closer. Accurate correction of the OH
decays for NO requires accurate measurements of NO
and HO2/OH. While NO measurements were frequent in
New York City, measurements of HO2/OH inside
TOHLM were not, especially at morning rush hour.
The difference between the OH production and the OH
loss during morning rush hour correlated well with
ambient NO both in Nashville study (Martinez et al.,
2003) and in this study, indicating that the OH reactivity
may indeed be under-corrected for high NO.
3.7. Instantaneous O3 production
The instantaneous photochemical O3 production
during daytime can be calculated from expression:
PðO3Þ ¼ RðHO2 þNOÞ þX
RiðRO2i þNOÞ: ð4Þ
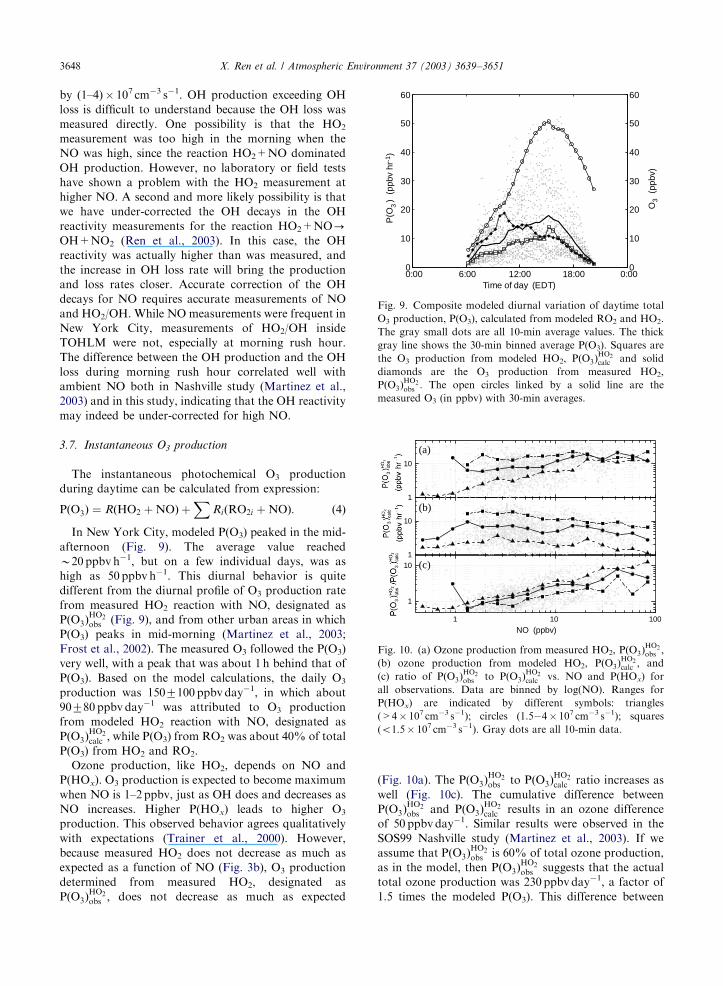
In New York City, modeled P(O3) peaked in the mid-
afternoon (Fig. 9). The average value reached
B20 ppbv h�1, but on a few individual days, was as
high as 50 ppbv h�1. This diurnal behavior is quite
different from the diurnal profile of O3 production rate
from measured HO2 reaction with NO, designated as
PðO3ÞHO2obs (Fig. 9), and from other urban areas in which
P(O3) peaks in mid-morning (Martinez et al., 2003;
Frost et al., 2002). The measured O3 followed the P(O3)
very well, with a peak that was about 1 h behind that of
P(O3). Based on the model calculations, the daily O3
production was 1507100 ppbv day�1, in which about
90780 ppbv day�1 was attributed to O3 production
from modeled HO2 reaction with NO, designated as
PðO3ÞHO2calc ; while P(O3) from RO2 was about 40% of total
P(O3) from HO2 and RO2.
Ozone production, like HO2, depends on NO and
P(HOx). O3 production is expected to become maximum
when NO is 1–2 ppbv, just as OH does and decreases as
NO increases. Higher P(HOx) leads to higher O3
production. This observed behavior agrees qualitatively
with expectations (Trainer et al., 2000). However,
because measured HO2 does not decrease as much as
expected as a function of NO (Fig. 3b), O3 production
determined from measured HO2, designated as
PðO3ÞHO2obs ; does not decrease as much as expected
(Fig. 10a). The PðO3ÞHO2obs to PðO3Þ
HO2calc ratio increases as
well (Fig. 10c). The cumulative difference between
PðO3ÞHO2obs and PðO3Þ
HO2calc results in an ozone difference
of 50 ppbv day�1. Similar results were observed in the
SOS99 Nashville study (Martinez et al., 2003). If we
assume that PðO3ÞHO2obs is 60% of total ozone production,
as in the model, then PðO3ÞHO2obs suggests that the actual
total ozone production was 230 ppbv day�1, a factor of
1.5 times the modeled P(O3). This difference between
ARTICLE IN PRESS
0:00 6:00 12:00 18:00 0:000
10
20
30
40
50
60
Time of day (EDT)
P(O
) (
ppbv
hr-
1 )3
0
10
20
30
40
50
60
O3
(pp
bv)
Fig. 9. Composite modeled diurnal variation of daytime total
O3 production, P(O3), calculated from modeled RO2 and HO2.
The gray small dots are all 10-min average values. The thick
gray line shows the 30-min binned average P(O3). Squares are
the O3 production from modeled HO2, PðO3ÞHO2calc and solid
diamonds are the O3 production from measured HO2,
PðO3ÞHO2obs : The open circles linked by a solid line are the
measured O3 (in ppbv) with 30-min averages.
1
10
1
10
1 10 100
1
10
(a)
(b)
(c)
NO (ppbv)
Fig. 10. (a) Ozone production from measured HO2, PðO3ÞHO2obs ;
(b) ozone production from modeled HO2, PðO3ÞHO2calc ; and
(c) ratio of PðO3ÞHO2obs to PðO3Þ
HO2calc vs. NO and P(HOx) for
all observations. Data are binned by log(NO). Ranges for
P(HOx) are indicated by different symbols: triangles
(>4� 107 cm�3 s�1); circles (1.5�4� 107 cm�3 s�1); squares
(o1.5� 107 cm�3 s�1). Gray dots are all 10-min data.
X. Ren et al. / Atmospheric Environment 37 (2003) 3639–36513648
measured and modeled P(O3) may be difficult to detect
in the ozone measurements.
4. Summary
The RACM model used here is able to simulate the
measured HO2, measured daytime OH, and measured
OH reactivity to within the 1s measurement uncertainty
for New York City in summer 2001. The measured
concentrations and diurnal variation of HO2 were
usually well reproduced by the model calculations for
day and night. For OH, the model could generally
match the measured concentrations during daytime. The
ratios of calculations to measurements for both OH and
HO2 are close to 1 when HOx production was high.
Agreement is less good when either P(HOx) is low or for
HO2, when NO is high. Measured and modeled HO2/
OH ratios agree reasonably when NO was around a few
ppbv.
The model could not reproduce the nighttime OH
levels, with modeled OH being significantly less than
measured OH. Several possibilities might explain this
difference. (1) A missing chemical or reaction mechan-
ism may convert HO2 to OH with a reduction potential
similar to NO (Tan et al., 2001b). (2) One or more of the
ancillary measurements may have a problem. (3)
Processes important to OH production are not included
in the current model.
The budget analysis shows that photolysis of HONO
dominated the HOx production during daytime. This
HONO dominance is a quite different result from HOx
sources in similar environments and the clean atmo-
sphere. At night, the O3 reaction with alkenes was the
main source of HOx. The OH lifetime was short in this
polluted area, B50ms on average. Comparison of total
OH production and loss rates suggests that
8.8� 106 cm�3 s�1 of OH production is required to
balance the measured OH loss; this additional produc-
tion might come from the ozonolysis of unmeasured
VOCs. Instantaneous O3 production is determined by
the concentrations of NOx and the production of HOx.
PðO3ÞHO2obs did not decrease as much as expected when
NO was greater than 2–3 ppbv while PðO3ÞHO2calc did,
resulting in 50 ppbv day�1 cumulative difference be-
tween PðO3ÞHO2obs and PðO3Þ
HO2calc :
This comparison between measured and modeled
HOx and OH reactivity is encouraging. However, the
discrepancies found here and in other environments, as
well as the differences among various instruments and
field studies, do point to the need for additional
investigation of HOx sources, the rapid cycling between
OH and HO2, and the instrument behavior. These
investigations will become more essential as more and
more polluted environments are explored and the
uncertainties of HOx-measuring instruments are reduced
by comparisons and technical improvements.
Acknowledgements
The authors thank all other participants in the
PMTACS-NY2001 field campaign for use of their data
in the model and Kenneth Demerjian for asking us to
participate in PMTACS-NY2001. Terry Shirley and
Jennifer Adams, who were supported by NSF Research
Experience for Undergraduate grants, did a terrific job
in the field measurements. Two anonymous reviewers
are acknowledged for providing insightful comments
and suggestions. This work was supported by NSF
(ATM-9974335 and ATM-0209972), the New York
State Energy Research and Development Authority
(NYSERDA) (contract #4918ERTERES99), the US
Environmental Protection Agency (EPA) (cooperative
agreement #R828060010), and New York State Depart-
ment of Environmental Conservation (NYS DEC)
(contract #C004210). Although the research described
in this article has been funded in part by the US
Environmental Protection Agency, it has not been
subjected to the Agency’s required peer and policy
review and therefore does not necessary reflect the views
of the Agency and no official endorsement should be
inferred.
References
Abram, J., Creasey, D.J., Heard, D.E., Lee, J.D., Pilling, M.J.,
2000. Hydroxyl radical and ozone measurements in England
during the solar eclipse of 11 August 1999. Geophysical
Research Letters 27, 3437–3440.
Bey, I., Aumont, B., Toupance, G., 2001. A modeling study of
the nighttime radical chemistry in the lower continental
troposphere 1. development of a detailed chemical mechan-
ism including nighttime chemistry. Journal of Geophysical
Research 106, 9959–9990.
Carslaw, N., Jacoba, P.J., Pilling, M.J., 1999. Modeling OH,
HO2, and RO2 radicals in the marine boundary layer, 2.
Mechanism reduction and uncertainty analysis. Journal of
Geophysical Research 104, 30257–30273.
Carslaw, N., Creasey, D.J., Harrison, D., Heard, D.E., Hunter,
M.C., Jacobs, P.J., Jenkin, M.E., Lee, J.D., Lewis, A.C.,
Pilling, M.J., Saunders, S.M., Seakins, P.W., 2001. OH and
HO2 radical chemistry in a forested region of northwestern
Greece. Atmospheric Environment 35, 4725–4737.
Creasey, D.J., Heard, D.E., Lee, J.D., 2001. OH and HO2
measurements in a forested region of northwestern Greece.
Atmospheric Environment 35, 4713–4724.
DeMore, W.B., Sander, S.P., Golden, D.M., Hampson, R.F.,
Kurylo, M.J., Howard, C.J., Ravishankara, A.R., Kolb,
C.E., Molina, M.J., 1997. Chemical kinetics and photo-
chemical data for use in stratospheric modeling, evaluation
ARTICLE IN PRESSX. Ren et al. / Atmospheric Environment 37 (2003) 3639–3651 3649
no. 12. JPL Publication 97-4, NASA Jet Propulsion
Laboratory, Pasadena, CA.
Donahue, N.M., Kroll, J.H., Anderson, J.G., 1998. Direct
observation of OH production from the ozonolysis of
olefins. Geophysical Research Letters 25, 59–62.
Faloona, I., Tan, D., Brune, W.H., Jaegl!e, L., Jacob, D.J.,
Kondo, Y., Koike, M., Chatfield, R., Pueschel, R., Ferry,
G., Sachse, G., Vay, S., Anderson, B., Hannon, J.,
Fuelberg, H., 2000. Observations of HOx and its relation-
ship with NOx in the upper troposphere during SONEX.
Journal of Geophysical Research 105, 3771–3783.
Faloona, I., Tan, D., Brune, W., Hurst, J., Barket Jr., D.,
Couch, T.L., Shepson, P., Apel, E., Riemer, D., Thornber-
ry, T., Carroll, M.A., Sillman, S., Keeler, G.J., Sagady, J.,
Hooper, D., Paterson, K., 2001. Nighttime observations of
anomalously high levels of hydroxyl radicals above a
deciduous forest canopy. Journal of Geophysical Research
106, 24315–24333.
Fenske, J.D., Hasson, A.S., Paulson, S.E., Kuwata, K.T., Ho,
A., Houk, K.N., 2000. The pressure dependence of the OH
radical yield from ozone–alkene reactions. Journal of
Physical Chemistry A 104, 7821–7833.
Folkins, I., Wennberg, P.O., Hanisco, T.F., Anderson, J.G.,
Salawitch, R.J., 1997. OH, HO2, and NO in two biomass
burning plumes: sources of HOx and implications for
ozone production. Geophysical Research Letters 24,
3185–3188.
Frost, G.J., Williams, E., Hereid, D., Jobson, B.T., Kuster, W.,
Roberts, J., Trainer, M., Fehsenfeld, F.C., Martinez, M.,
Harder, H., Brune, W., Di Carlo, P., Hall, S., Shetter, R.,
Karl, T., Apel, E., Riemer, D., Geyer, A., Stutz, J.,
Baumann, K., 2002. Model-measurement comparison of
[OH], [HO2], and P(O3) in Houston. Abstract A21F-11,
AGU Fall Meeting, EOS Transactions.
George, L.A., Hard, T.M., O’Brien, R.J., 1999. Measurement
of free radicals OH and HO2 in Los Angeles smog. Journal
of Geophysical Research 104, 11643–11655.
Grenfell, J.L., Savage, N.H., Harrison, R.M., Penkett, S.A.,
Forberich, O., Comes, F.J., Clemitshaw, K.C., Burgess,
R.A., C!ardenas, L.M., Davison, B., McFadyen, G.G., 1999.
Tropospheric box-modelling and analytical studies of the
hydroxyl (OH) radical and related species: comparison with
observations. Journal of Atmospheric Chemistry 33,
183–214.
Hard, T.M., O’Brien, R.J., Chan, C.Y., Mehrabzadeh, A.A.,
1984. Tropospheric free radical determination by FAGE.
Environmental Science and Technology 18, 768–777.
Hard, T.M., Chan, C.Y., Mehrabzadeh, A.A., Pan, W.H.,
O’Brien, R.J., 1986. Diurnal cycle of tropospheric OH.
Nature 322, 617–620.
Hard, T.M., Chan, C.Y., Mehrabzadeh, A.A., O’Brien, R.J.,
1992. Diurnal HO2 cycles at clean air and urban sites in the
troposphere. Journal of Geophysical Research 97,
9785–9794.
Holland, F., Hessling, M., Hofzumahaus, A., 1995. In situ
measurement of tropospheric OH radicals by laser-induced
fluorescence—a description of the KFA instrument. Journal
of Atmospheric Science 52, 3393–3401.
Holland, F., Hofzumahaus, A., Sch.afer, J., Kraus, A., P.atz, H.,
2003. Measurements of OH and HO2 radical concentrations
and photolysis frequencies during BERLIOZ. Journal of
Geophysical Research 108, 8246, doi:10.1029/
2001JD001393.
Hough, A.M., 1988. The calculation of photolysis rates for use
in global tropospheric modelling studies. United Kingdom
Atomic Energy Authority (UKAEA), Harwell Report
AERE H 13259.
Huang, G., Zhou, X., Deng, G., Qiao, H., Civerolo, K., 2002.
Measurements of atmospheric nitrous and nitric acid.
Atmospheric Environment 36, 2225–2235.
Jenkin, M.E., Saunders, S.M., Pilling, M.J., 1997. The tropo-
spheric degradation of volatile organic compounds: a
protocol for mechanism development. Atmospheric Envir-
onment 31, 81–104.
Kanaya, Y., Sadanaga, Y., Matsumoto, J., Sharma, U.K.,
Hirokawa, J., Kajii, Y., Akimoto, H., 1999. Nighttime
observation of the HO2 radical by a LIF instrument at Oki
island, Japan, and its possible origins. Geophysical Re-
search Letters 26, 2179–2182.
Kanaya, Y., Sadanaga, Y., Nakamura, K., Akimoto, H., 2001.
Behavior of OH and HO2 radicals during the observations
at a remote island of Okinawa (ORION99) field campaign
1. Observation using a laser-induced fluorescence
instrument. Journal of Geophysical Research 106,
24197–24208.
Kovacs, T.A., Brune, W.H., 2001. Total OH loss rate
measurement. Journal of Atmospheric Chemistry 39,
105–122.
Kovacs, T.A., Brune, W.H., Harder, H., Martinez, M., Simpas,
J.B., Frost, G.J., Williams, E., Jobson, T., Stroud, C.,
Young, V., Fried, A., Wert, B., 2003. Direct measurements
of urban OH reactivity during Nashville SOS in summer
1999. Journal of Environmental Monitoring 5, 68–74,
doi:10.1039/b204339d.
Kroll, J.H., Clarke, J.S., Donahue, N.M., Anderson, J.G.,
Demerjian, K.L., 2001. Mechanism of HOx formation in the
gas-phase ozone–alkene reaction. 1. Direct pressure-depen-
dent measurements of prompt OH yields. Journal of
Physical Chemistry A 105, 1554–1560.
Lewis, A.C., Carslaw, N., Marriott, P.J., Kinghorn, R.M.,
Morrison, P., Lee, A.L., Bartle, K.D., Pilling, M.J., 2000. A
large pool of ozone-forming carbon compounds in urban
atmospheres. Nature 405, 778–781.
Martinez, M., Harder, H., Simpas, J.B., Brune, W.H.,
Williams, E.J., Hall, S.E., Shetter, R.E., 2000. OH and
HO variations during summertime Nashville southern
oxidant study in 1999. Abstract A71E–10, AGU Fall
Meeting, San Francisco, CA, EOS Transactions.
Martinez, M., Harder, H., Brune, W., Di Carlo, P., Williams,
E., Hereid, D., Jobson, T., Kuster, W., Roberts, J., Trainer,
M., Fehsenfeld, F.C., Hall, S., Shetter, R., Apel, E., Riemer,
D., Geyer, A., 2002. The behavior of the hydroxyl and
hydroperoxyl radicals during TexAQS2000. Abstract
A12D-0174, AGU Fall Meeting, San Francisco, CA, EOS
Transactions.
Martinez, M., Harder, H., Kovacs, T.A., Simpas, J.B., Bassis,
J., Lesher, R., Brune, W.H., Williams, E.J., Stroud, C.A.,
Frost, G., Hall, S.R., Shetter, R.E., Wert, B., Fried, A.,
Alicke, B., Stutz, J., 2003. OH and HO2 concentrations,
production and loss rates during the southern oxidant study
in Nashville, TN, summer 1999. Journal of Geophysical
Research, submitted for publication.
ARTICLE IN PRESSX. Ren et al. / Atmospheric Environment 37 (2003) 3639–36513650
Mather, J.H., Stevens, P.S., Brune, W.H., 1997. OH and HO2
measurements using laser-induced fluorescence. Journal of
Geophysical Research 102, 6427–6436.
Mount, G.H., Williams, E.J., 1997. An overview of the
tropospheric OH photochemistry experiment, Fritz Peak,
Idaho Hill, Colorado, fall 1993. Journal of Geophysical
Research 102, 6171–6186.
Paulson, S.E., Chung, M.Y., Hasson, A., 1999. OH radical
formation from the gas-phase reaction of ozone with
terminal alkenes and the relationship between structure
and mechanism. Journal of Physical Chemistry A 103,
8125–8138.
Platt, U., Alicke, B., Dubois, R., Geyer, A., Hofzumahaus, A.,
Holland, F., Martinez, M., Mihelcic, D., Klupfel, T.,
Lohrmann, B., Patz, W., Perner, D., Rohrer, F., Schafer,
J., Stutz, J., 2002. Free radicals and fast photochemistry
during BERLIOZ. Journal of Atmospheric Chemistry 42,
359–394.
Ren, X., Harder, H., Martinez, M., Lesher, R.L., Oliger, A.,
Shirley, T., Adams, J., Simpas, J.B., Brune, W.H., 2003.
HOx concentrations and OH reactivity observations in
New York City during PMTACS-NY2001, Atmospheric
Environment, this issue, X-ref: doi:10.1016/S1352-2310(03)
00460-6.
Ren, X., Harder, H., Martinez, M., Faloona, I., Tan, D.,
Lesher, R.L., Di Carlo, P., Simpas, J.B., Brune, W.H.
Interference testing for atmospheric HOx measurements by
laser-induced fluorescence, in preparation.
Rickard, A.R., Johnson, D., McGill, C.D., Marston, G., 1999.
OH yields in the gas-phase reactions of ozone with alkenes.
Journal of Physical Chemistry A 103, 7656–7664.
Salisbury, G., Rickard, A.R., Monks, P.S., Allan, B.J.,
Bauguitte, S., Penkett, S.A., Carslaw, N., Lewis, A.C.,
Creasey, D.J., Heard, D.E., Jacobs, P.J., Lee, J.D., 2001.
The production of peroxy radicals at night via reactions of
ozone and the nitrate radical in the marine boundary layer.
Journal of Geophysical Research 106, 12669–12688.
Sander, S.P., Friedl, R.R., DeMore, W.B., Golden, D.M.,
Kurylo, M.J., Hampson, R.F., Huie, R.E., Moortgat, C.K.,
Ravishankara, A.R., Kolb, C.E., Molina, M.J., 2000.
Chemical kinetics and photochemical data for use in
stratospheric modeling. JPL Publication 00–3, NASA Jet
Propulsion Laboratory, Pasadena, CA.
Stevens, P.S., Mather, J.H., Brune, W.H., 1997. HO2/OH and
RO2/HO2 ratios during the Tropospheric OH photochem-
istry experiment: measurement and theory. Journal of
Geophysical Research 102, 6379–6391.
Stockwell, W.R., Kirchner, F., Kuhn, M., 1997. A new
mechanism for regional atmospheric chemistry modeling.
Journal of Geophysical Research 102, 25847–25879.
Tan, D., Faloona, I., Simpas, J.B., Brune, W., Olson, J.,
Crawford, J., Avery, M., Sachse, G., Vay, S., Sandholm, S.,
Guan, H.-W., Vaughn, T., Mastromarino, J., Heikes, B.,
Snow, J., Podolske, J., Singh, H., 2001a. OH and HO2 in the
tropical pacific: results from PEM-Tropics B. Journal of
Geophysical Research 106, 32667–32681.
Tan, D., Faloona, I., Simpas, J.B., Brune, W., Shepson, P.B.,
Couch, T.L., Sumner, A.L., Carroll, M.A., Thornberry, T.,
Apel, E., Riemer, D., Stockwell, W., 2001b. HOx budgets in
a deciduous forest: results from the prophet summer
campaign. Journal of Geophysical Research 106,
24407–24427.
Trainer, M., Parrish, D.D., Goladan, P.D., Roberts, J.,
Fehsenfeld, F.C., 2000. Review of observation-based
analysis of the regional factors influencing ozone concentra-
tions. Atmospheric Environment 34, 2045–2061.
US Environmental Protection Agency, 1994. Photochemical
Assessment Monitoring Stations (PAMS) Implementation
Manual. EPA-454/B-93/051. Research Triangle Park, NC,
USA.
ARTICLE IN PRESSX. Ren et al. / Atmospheric Environment 37 (2003) 3639–3651 3651
Related Documents