Offshore Wind Market and Economic Analysis 2014 Annual Market Assessment Prepared for: U.S. Department of Energy Client Contact Michael Hahn, Patrick Gilman Award Number DE-EE0005360 Navigant Consulting, Inc. 77 Bedford Street Suite 400 Burlington, MA 01803-5154 781.270.8314 www.navigant.com September 8, 2014

Welcome message from author
This document is posted to help you gain knowledge. Please leave a comment to let me know what you think about it! Share it to your friends and learn new things together.
Transcript

Offshore Wind Market and Economic
Analysis
2014 Annual Market Assessment
Prepared for:
U.S. Department of Energy
Client Contact Michael Hahn, Patrick Gilman
Award Number DE-EE0005360
Navigant Consulting, Inc.
77 Bedford Street
Suite 400
Burlington, MA 01803-5154
781.270.8314
www.navigant.com
September 8, 2014

Offshore Wind Market and Economic Analysis Page ii Document Number DE-EE0005360
U.S. Offshore Wind Market and Economic Analysis
2014 Annual Market Assessment
Document Number DE-EE0005360
Prepared for: U.S. Department of Energy
Michael Hahn
Patrick Gilman
Prepared by: Navigant Consulting, Inc.
Bruce Hamilton, Principal Investigator
Mark Bielecki
Charlie Bloch
Terese Decker
Lisa Frantzis
Kirsten Midura
Jay Paidipati
Feng Zhao
Bruce
Navigant Consortium Member Organizations Key Contributors
American Wind Energy Association Chris Long
Great Lakes Wind Collaborative Becky Pearson and Victoria Pebbles
Green Giraffe Energy Bankers Marie de Graaf, Jérôme Guillet, and Niels
Jongste
National Renewable Energy Laboratory Eric Lantz and Aaron Smith
Ocean & Coastal Consultants (a COWI company) Brent D. Cooper, P.E., and Joe Marrone, P.E.
Tetra Tech EC, Inc. Michael D. Ernst, Esq.

Offshore Wind Market and Economic Analysis Page iii Document Number DE-EE0005360
Notice and Disclaimer
This report was prepared by Navigant Consulting, Inc. for the exclusive use of the U.S. Department of
Energy—who supported this effort under Award Number DE-EE0005360. The work presented in this
report represents our best efforts and judgments based on the information available at the time this
report was prepared. Navigant Consulting, Inc. is not responsible for the reader’s use of, or reliance
upon, the report, nor any decisions based on the report. NAVIGANT CONSULTING, INC. MAKES NO
REPRESENTATIONS OR WARRANTIES, EXPRESSED OR IMPLIED. Readers of the report are advised
that they assume all liabilities incurred by them, or third parties, as a result of their reliance on the
report, or the data, information, findings and opinions contained in the report.
Neither the United States Government nor any agency thereof, nor any of their employees, makes any
warranty, express or implied, or assumes any legal liability or responsibility for the accuracy,
completeness, or usefulness of any information, apparatus, product, or process disclosed, or represents
that its use would not infringe privately owned rights. Reference herein to any specific commercial
product, process, or service by trade name, trademark, manufacturer, or otherwise does not necessarily
constitute or imply its endorsement, recommendation, or favoring by the United States government or
any agency thereof.
This report is being disseminated by the Department of Energy. As such, the document was prepared in
compliance with Section 515 of the Treasury and General Government Appropriations Act for Fiscal
Year 2001 (Public Law 106-554) and information quality guidelines issued by the Department of Energy.
Though this report does not constitute “influential” information, as that term is defined in DOE’s
information quality guidelines or the Office of Management and Budget's Information Quality Bulletin
for Peer Review (Bulletin), the study was reviewed both internally and externally prior to publication.
For purposes of external review, the study benefited from the advice and comments of a panel of
offshore wind industry stakeholders. That panel included representatives from private corporations,
national laboratories, and universities.

Offshore Wind Market and Economic Analysis Page iv Document Number DE-EE0005360
Acknowledgments
For their support of this report, the authors thank the entire U.S. Department of Energy (DOE) Wind &
Water Power Technologies Office, particularly Patrick Gilman and Michael Hahn.
Navigant would also like to thank the following for their contributions to this report:
Stacy Ambrozia Deepwater Wind
Bruce Bailey AWS Truepower
Kevin Banister Principle Power, Inc.
Eric Boessneck Santee Cooper
Doug Copeland EDF RE
Fara Courtney US Offshore Wind Collaborative
John Dalton Power Advisory LLC
Steve Dever Lake Erie Energy Development Company
Tim Downey Saint Lawrence Seaway Development Corporation
Jeremy Firestone Blue Hen Wind
William Follett SgurrEnergy Inc.
Richard Frost Maritime Applied Physics Corporation
Sunny Gupta AREVA
Robert Hare Dominion Resources
Jim Lanard Offshore Wind Development Consortium
Walter Musial National Renewable Energy Laboratory
Matt Overeem The WindWay
Steven Pietryk Dominion Resources
Jacques Roeth NYSERDA
Michael Shook AeroHydro, Inc.
Tyler Stehly National Renewable Energy Laboratory
Katarina Svabcikova Siemens
Larry Viterna Nautica Windpower
Gail Walder Environmental Planning
Bill White Massachusetts CEC
Paul Williamson Maine Ocean & Wind Industry Initiative
Andy Zalay Ewindfarm inc

Offshore Wind Market and Economic Analysis Page v Document Number DE-EE0005360
Table of Contents
Executive Summary ............................................................................................................... xiii
Section 1. Global Offshore Wind Development Trends ........................................................................ xiii Section 2. Analysis of Policy Developments ........................................................................................... xvi Section 3. Economic Impacts .................................................................................................................... xvii Section 4. Developments in Relevant Sectors of the Economy ............................................................ xvii
1. Global Offshore Wind Development Trends ............................................................. 1
1.1 Global Offshore Wind Development ................................................................................................ 2 1.2 U.S. Project Development Overview ................................................................................................ 5
1.2.1 Forecast Capacity and Completion Dates ....................................................................... 12 1.2.2 Notable Developments in Advanced-Stage Projects...................................................... 13 1.2.3 DOE Advanced Technology Demonstration Projects .................................................... 16
1.3 Capital Cost Trends .......................................................................................................................... 18 1.4 Market Segmentation and Technology Trends ............................................................................. 20
1.4.1 Depth and Distance from Shore ........................................................................................ 21 1.4.2 Plant Characteristics ........................................................................................................... 24 1.4.3 Turbine Trends .................................................................................................................... 25 1.4.4 Support Structure Trends .................................................................................................. 32 1.4.5 Electrical Infrastructure Trends ........................................................................................ 38 1.4.6 Logistical and Vessel Trends ............................................................................................. 39 1.4.7 Operations and Maintenance (O&M) Trends ................................................................. 41
1.5 Financing Trends ............................................................................................................................... 42 1.5.1 Rising Capital Requirements ............................................................................................. 43 1.5.2 Utility On-balance Sheet Financing .................................................................................. 43 1.5.3 Project Finance .................................................................................................................... 43 1.5.4 Multiparty Financing.......................................................................................................... 45 1.5.5 Importance of Government Financial Institutions ......................................................... 46 1.5.6 Support from the Supply Chain ........................................................................................ 46 1.5.7 New Financing Sources ...................................................................................................... 47 1.5.8 Likely Financing Trends for Offshore Wind in the United States ................................ 48 1.5.9 Cape Wind Financing ......................................................................................................... 49
2. Analysis of Policy Developments ................................................................................ 50
2.1 Offshore Wind Program Objectives ................................................................................................ 51 2.2 Potential Barriers to Meeting the Objectives ................................................................................. 53 2.3 Examples of Policies for Addressing the Cost Competitiveness of Offshore Wind Energy ... 53
2.3.1 General Discussion of Policy Examples ........................................................................... 53 2.3.2 Current U.S. and State Policies.......................................................................................... 55 2.3.3 Current Policies in Europe ................................................................................................. 64

Offshore Wind Market and Economic Analysis Page vi Document Number DE-EE0005360
2.4 Examples of Policies for Addressing Infrastructure Challenges ................................................ 72 2.4.1 General Discussion of Policy Examples ........................................................................... 72 2.4.2 Current U.S. and State Policies.......................................................................................... 77 2.4.3 Current Policies in Europe ................................................................................................. 78
2.5 Examples of Policies That Address Regulatory Challenges ........................................................ 80 2.5.1 General Discussion of Policy Examples ........................................................................... 80 2.5.2 Current U.S. and State Policies.......................................................................................... 82 2.5.3 Current Policies in Europe ................................................................................................. 90
2.6 Summary ............................................................................................................................................ 92
3. Economic Impacts ........................................................................................................... 95
3.1 Introduction ....................................................................................................................................... 95 3.2 Scope of Update................................................................................................................................. 95 3.3 Installed Cost Update ....................................................................................................................... 97
3.3.1 Overview .............................................................................................................................. 97 3.3.2 Typical Project ..................................................................................................................... 97 3.3.3 Turbine ................................................................................................................................. 98 3.3.4 Foundation and Substructure ........................................................................................... 99 3.3.5 Electrical System ............................................................................................................... 100 3.3.6 Development Services ...................................................................................................... 101 3.3.7 Financing ............................................................................................................................ 102 3.3.8 Summary of Capital Costs ............................................................................................... 103
3.4 Baseline Employment Estimate Update ....................................................................................... 104 3.4.1 Online Survey .................................................................................................................... 105 3.4.2 JEDI Estimates ................................................................................................................... 105
3.5 Results ............................................................................................................................................... 106
4. Developments in Relevant Sectors of the Economy .............................................. 107
4.1 Introduction ..................................................................................................................................... 107 4.2 Power Sector .................................................................................................................................... 109
4.2.1 Change in Overall Demand for Electricity .................................................................... 109 4.2.2 Change in the Country’s Nuclear Power Generation Capacity.................................. 109 4.2.3 Change in Natural Gas Prices ......................................................................................... 110 4.2.4 Change in the Country’s Coal-Based Generation Capacity ........................................ 111 4.2.5 Change in the Country’s Renewable Generation Capacity ......................................... 112
4.3 Oil and Gas ....................................................................................................................................... 112 4.3.1 Change in Level of Offshore Oil and Gas Development ............................................. 112
4.4 Construction .................................................................................................................................... 113 4.4.1 Change in Level of Construction Activity Using Similar Types of Equipment and/or
Raw Materials as Offshore Wind .................................................................................... 113 4.5 Manufacturing ................................................................................................................................. 114
4.5.1 Change in Manufacturing of Products That Utilize Similar Types of Raw Materials
as Offshore Wind .............................................................................................................. 114 4.6 Telecommunications ....................................................................................................................... 115
Offshore Wind Market and Economic Analysis Page vii Document Number DE-EE0005360
4.6.1 Change in Demand for Subsea Cable-Laying Vessels ................................................. 115 4.7 Financial ........................................................................................................................................... 115
4.7.1 Change in the Cost of Capital ......................................................................................... 115
5. Conclusion ...................................................................................................................... 116
References ................................................................................................................................ 117
Appendix A. Potential Barriers to Offshore Wind Development in the U.S. ...... 130
A.1 Cost-Competitiveness of Offshore Wind Energy ....................................................................... 130 A.2 Infrastructure Challenges ............................................................................................................... 130 A.3 Regulatory Challenges ................................................................................................................... 131
Appendix B. Offshore Wind Policies in Selected U.S. States ................................. 133
B.1 California .......................................................................................................................................... 133 B.2 Delaware........................................................................................................................................... 134 B.3 Illinois ............................................................................................................................................... 134 B.4 Maine ................................................................................................................................................ 136 B.5 Maryland .......................................................................................................................................... 137 B.6 Massachusetts .................................................................................................................................. 138 B.7 Michigan ........................................................................................................................................... 142 B.8 New Jersey ....................................................................................................................................... 143 B.9 New York ......................................................................................................................................... 144 B.10 North Carolina ................................................................................................................................. 145 B.11 Ohio ................................................................................................................................................... 146 B.12 Rhode Island .................................................................................................................................... 146 B.13 Texas ................................................................................................................................................. 147 B.14 Virginia ............................................................................................................................................. 147
Appendix C. Offshore Wind Policies in Selected European Countries ................ 149
C.1 Belgium ............................................................................................................................................. 149 C.2 Denmark ........................................................................................................................................... 151 C.3 France ................................................................................................................................................ 153 C.4 Germany ........................................................................................................................................... 155 C.5 The Netherlands .............................................................................................................................. 158 C.6 United Kingdom .............................................................................................................................. 160

Offshore Wind Market and Economic Analysis Page viii Document Number DE-EE0005360
List of Figures
Figure ES-1. Proposed U.S. Offshore Wind Energy Projects in Advanced Development Stages by
Jurisdiction and Project Size ................................................................................................................................. xiv Figure 1-1. Historical Growth of the Global Offshore Wind Market ................................................................. 3 Figure 1-2. Proposed U.S. Offshore Wind Energy Projects in Advanced Development Stages by
Jurisdiction and Project Size .................................................................................................................................... 6 Figure 1-3. Growth Trajectory for U.S. Offshore Wind Based on Forecast Construction Dates of Current
Advanced-Stage Projects ....................................................................................................................................... 12 Figure 1-4. Map of BOEM Atlantic Wind Energy Areas ................................................................................... 14 Figure 1-5. Reported Capital Cost Trends for Global Offshore Wind Projects over Time ........................... 19 Figure 1-6. Average Distance from Shore for Global Offshore Wind Projects over Time ............................ 21 Figure 1-7. Depth and Distance from Shore for Global Offshore Wind Farms .............................................. 22 Figure 1-8. Global Offshore Wind Plant Capacities over Time ........................................................................ 24 Figure 1-9. Reported Capacity Factors for Global Offshore Wind Plants over Time .................................... 25 Figure 1-10. Average Turbine Size for Historic Global and Planned U.S. Offshore Wind Farms ............... 26 Figure 1-11. Global Offshore Wind Plant Hub Heights over Time ................................................................. 28 Figure 1-12. Global Offshore Wind Plant Rotor Diameter over Time ............................................................. 29 Figure 1-13. Share of Cumulative Installed Offshore Wind Capacity by Drivetrain Configuration
(through 2013) ......................................................................................................................................................... 30 Figure 1-14. Offshore Wind Turbine Prototypes by Drivetrain Configuration and Year of First Offshore
Deployment ............................................................................................................................................................. 32 Figure 1-15. Substructure Types for Completed Offshore Wind Projects (Units through 2013) ................. 33 Figure 1-16. Substructure Types for Completed Offshore Wind Projects by Year Installed ........................ 34 Figure 1-17. Financing of Offshore Wind Farms: 2006 to 2013 (MEUR) ......................................................... 44 Figure 2-1. Summary of Policies to Address Cost Competitiveness in Selected U.S. States ........................ 57 Figure 2-2. Site Selection and Leasing Policies in U.S. States ........................................................................... 84 Figure 3-1. Annual U.S. Employment Supported by the U.S. Offshore Wind Industry, 2012 Projection .. 96 Figure 3-2. Annual U.S. Economic Activity Supported by the U.S. Offshore Wind Industry, 2012
Projection ................................................................................................................................................................. 96 Figure 3-3. Comparison of 2011 and 2014 Installed Cost Assumptions ........................................................ 103 Figure 4-1. U.S. Retail Electricity Sales: 2002-2013 (million kWh) ................................................................. 109 Figure 4-2. U.S. Power Generation Capacity Additions by Fuel Type .......................................................... 110 Figure 4-3. Henry Hub Gulf Coast Natural Gas Spot Price 2007-2014 .......................................................... 111 Figure 4-4. Producer Price Index for Selected Commodities (2003-2013) ..................................................... 113 Figure 4-5. Rare Earth Criticality Matrices ........................................................................................................ 114 Figure 4-6. Federal Funds Effective Rate (%): January 2000 – May 2014 ...................................................... 115 Figure B-1. Illinois Offshore Wind Leasing Areas ........................................................................................... 135 Figure B-2. VolturnUS Floating Turbine ........................................................................................................... 136 Figure B-3. Maryland Offshore Wind Leasing Areas ...................................................................................... 138 Figure B-4. Rhode Island and Massachusetts Offshore Wind Leasing Areas .............................................. 141 Figure B-5. New Jersey Offshore Wind Leasing Areas ................................................................................... 143 Figure B-6. New York Offshore Wind Leasing Areas ..................................................................................... 145 Figure B-7. Virginia Offshore Wind Leasing Areas ......................................................................................... 148

Offshore Wind Market and Economic Analysis Page ix Document Number DE-EE0005360
List of Tables
Table 1-1. Summary of Cumulative Installed Global Offshore Capacity through 2013 ................................. 4 Table 1-2. Summary of Advanced-Stage U.S. Offshore Wind Projects ............................................................. 8 Table 1-3. Overview of BOEM Wind Energy Areas as of August 2014 .......................................................... 15 Table 1-4. Operating and Planned Global Projects with Floating Foundations ............................................. 23 Table 1-5. Segmentation of Wind Turbine Drivetrain Architectures ............................................................... 31 Table 2-1. Key Offshore Wind Barriers ................................................................................................................ 53 Table 2-2. Policies to Address Cost Competitiveness of Offshore Wind in Selected U.S. States ................. 58 Table 2-3. Renewable Energy Investment Support Schemes in Europe ......................................................... 65 Table 2-4. Offshore Wind Capacity Installed Under Support Schemes Used in Europe .............................. 67 Table 2-5: SDE+ Phases for Offshore Wind in 2013 ............................................................................................ 70 Table 2-6. State-based Wind-focused Transmission Policies ............................................................................ 77 Table 2-7. Policies for Addressing Infrastructure Challenges in Europe ........................................................ 78 Table 2-8. Policies that Address Regulatory Challenges in Europe ................................................................. 90 Table 2-9. Offshore Wind Policy Examples and Developments ...................................................................... 92 Table 3-1. Reference Project ................................................................................................................................... 98 Table 3-2. 2014 Detailed Cost Breakdown ......................................................................................................... 104 Table 3-3. Estimated Employment in the U.S. Offshore Wind Industry ....................................................... 106 Table 4-1. Factors That Impact Offshore Wind ................................................................................................. 108
Offshore Wind Market and Economic Analysis Page x Document Number DE-EE0005360
Abbreviations
AC alternating current
ATD Advanced Technology Demonstration
AWC Atlantic Wind Connection
AWEA American Wind Energy Association
BOEM Bureau of Ocean Energy Management
BPU Board of Public Utilities
BTMU Bank of Tokyo-Mitsubishi UFJ (Japan)
CAISO California Independent System Operator
CBM condition-based maintenance
CEQ Council on Environmental Quality
CfD Contracts for Difference
COP Construction and Operations Plan
CREZ competitive renewable energy zone
CZMA Coastal Zone Management Act
DC direct current
DD Direct Drive
DEA Danish Energy Agency
DECC Department of Energy and Climate Change
(U.K.)
DNR Department of Natural Resources
DOE Department of Energy
EA environmental assessment
EERE Energy Efficiency & Renewable Energy
EEZ Exclusive Economic Zone (DK)
EIS environmental impact statement
EnWG New German Energy Act
EPA Environmental Protection Agency
EPAct Energy Policy Act of 2005 (U.S.)
ETI Energy Technologies Institute
EU European Union
EWEA European Wind Energy Association
FEPA Food and Environment Protection Act 1985
(U.K.)
FERC Federal Energy Regulatory Commission
FiT Feed-in Tariff
FONSI Finding of No Significant Impacts
FTE full-time equivalent
GBS gravity-based structure
GC green certificate
GDP gross domestic product
GE General Electric
GIB Green Investment Bank (U.K.)
GLOW Great Lakes Wind
GLWC Great Lakes Wind Collaborative
GW gigawatt
GWEC Global Wind Energy Council
HVAC high-voltage alternating current
HVDC high-voltage direct current
IAPEME International Advisory Panel of Experts on
Marine Ecology
IOU investor-owned utility
IPP independent power producer
IRR internal rate of return
ISO independent system operator
ITC investment tax credit
JEDI Jobs & Economic Development Impact
kcmil thousand circular mils
kV kilovolt
kW kilowatt
LCOE levelized cost of energy
LEEDCo Lake Erie Energy Development Corporation
LIPA Long Island Power Authority
LNG liquefied natural gas
METI Ministry of Economy, Trade and Industry
(Japan)
MISO Midcontinent Independent System Operator
mmBTU million British thermal units
MMS Minerals Management Service
MOU Memorandum of Understanding
MW megawatt
MWh megawatt-hours
NEPA National Environmental Policy Act
NIP National Infrastructure Plan
NOAA National Oceanic and Atmospheric
Administration
NPS National Policy Statement (U.K.)
NREL National Renewable Energy Laboratory
NYPA New York Power Authority
O&M operations and maintenance
OCS Outer Continental Shelf
OEM original equipment manufacturer
Ofgem Office of the Gas and Electricity Markets
(U.K.)
OFTO offshore transmission owner
OREC offshore wind renewable energy credit
OTB Offshore Terminal Bremerhaven
OWEDA Offshore Wind Economic Development Act
PEA programmatic EA

Offshore Wind Market and Economic Analysis Page xi Document Number DE-EE0005360
PEIS programmatic EIS
PMDD permanent magnetic direct drive
PMG permanent magnetic generator
POU publicly owned utility
PPA power purchase agreement
PSC Public Service Commission
PTC production tax credit
PUC Public Utilities Commission
R&D research and development
REC Renewable Energy Credit
RFP request for proposal
RO Renewable Obligation
ROC Renewable Obligation Certificate
RPS renewable portfolio standard
RTO regional transmission organization
SAP site assessment plan
SCADA supervisory control and data acquisition
SEA Strategic Environmental Assessment (U.K.)
TCE The Crown Estate
TSO transmission system operator
UMaine University of Maine
USACE U.S. Army Corps of Engineers
USFWS U.S. Fish and Wildlife Service
WAB Wind Agency Bremerhaven
WEA Wind Energy Area
WRA wind resource area

Offshore Wind Market and Economic Analysis Page xii Document Number DE-EE0005360
Introduction
This report was produced on behalf of the Wind and Water Power Technologies Office within the U.S.
Department of Energy’s (DOE) Office of Energy Efficiency and Renewable Energy (EERE) as an award
resulting from Funding Opportunity Announcement DE-FOA-0000414, entitled U.S. Offshore Wind:
Removing Market Barriers; Topic Area 1: Offshore Wind Market and Economic Analysis.
The objective of this report is to provide a comprehensive annual assessment of the U.S. offshore wind
market. The report has been updated and published annually for a three-year period. The report was
first published in early 2013 covering research performed in 2012. The 2nd annual report was published
in October 2013 and focused on developments that occurred in 2013. This 3rd annual report focuses on
new developments that have occurred in 2014. The report will provide stakeholders with a reliable and
consistent data source addressing entry barriers and U.S. competitiveness in the offshore wind market.
The report was produced by the Navigant Consortium, led by Navigant Consulting, Inc. (“Navigant”).
Additional members of the Navigant Consortium include the American Wind Energy Association
(AWEA), the Great Lakes Wind Collaborative (GLWC), Green Giraffe Energy Bankers, National
Renewable Energy Laboratory (NREL), Ocean & Coastal Consultants (a COWI company), and Tetra
Tech EC, Inc.

Offshore Wind Market and Economic Analysis Page xiii Document Number DE-EE0005360
Executive Summary
The U.S. offshore wind industry is transitioning from early development to demonstration of
commercial viability. While there are no commercial-scale projects in operation, there are 14 U.S. projects
in advanced development, defined as having either been awarded a lease, conducted baseline or
geophysical studies, or obtained a power purchase agreement (PPA). There are panels or task forces in
place in at least 14 states to engage stakeholders to identify constraints and sites for offshore wind. U.S.
policymakers are beginning to follow the examples in Europe that have proven successful in stimulating
offshore wind technological advancement, project deployment, and job creation.
This report is the third annual assessment of the U.S. offshore wind market. It includes the following
major sections:
Section 1: key data on developments in the offshore wind technology sector and the global
development of offshore wind projects, with a particular focus on progress in the United States
Section 2: analysis of policy developments at the federal and state levels that have been effective
in advancing offshore wind deployment in the United States
Section 3: analysis of actual and projected economic impact, including regional development and
job creation
Section 4: analysis of developments in relevant sectors of the economy with the potential to affect
offshore wind deployment in the United States
Section 1. Global Offshore Wind Development Trends
There are approximately 7 gigawatts (GW) of offshore wind installed worldwide. The majority of this
activity continues to center on northwestern Europe, but development in China is progressing as well. In
2013, more than 1,700 megawatts (MW) of wind power capacity was added globally, with the United
Kingdom alone accounting for 812 MW (47%) of new capacity. In total, capacity additions in 2013
showed a roughly 50 percent increase over 2012, finally surpassing the pace of installations achieved in
2010. It appears that near-term growth will continue, with more than 6,600 MW of offshore wind under
construction in 29 projects globally, including 1,000 MW in China. While this upward trend is
encouraging, uncertain political support for offshore wind in European nations and the challenges of
bringing down costs means that the pace of capacity growth may level off in the next two years.

Offshore Wind Market and Economic Analysis Page xiv Document Number DE-EE0005360
Since the last edition of this report, the U.S. offshore wind market has made incremental but notable
progress toward the completion of its first commercial-scale projects. Two of the United States’ most
advanced projects – Cape Wind and Deepwater’s Block Island project – have moved into their initial
stages of construction. In addition, continued progress with the Bureau of Ocean Energy Management
(BOEM) commercial lease auctions for federal Wind Energy Areas (WEAs) has contributed to more
projects moving into advanced stages of development. In total, 14 U.S. projects, representing
approximately 4.9 GW of potential capacity, can now be considered in advanced stages.1 A map showing
the announced locations and capacities of these advanced-stage projects appears in Figure ES-1.
Figure ES-1. Proposed U.S. Offshore Wind Energy Projects in Advanced Development Stages by
Jurisdiction and Project Size
1 In this report, “advanced stage” includes projects that have accomplished at least one of the following three
milestones: received approval for an interim limited lease or a commercial lease in state or federal waters; conducted
baseline or geophysical studies at the proposed site with a meteorological tower erected and collecting data,
boreholes drilled, or geological and geophysical data acquisition system in use; or signed a power purchase
agreement (PPA) with a power off-taker. Note that each of these criteria represents a requisite step that a project will
take before it gains final approvals and reaches the construction phase. Simply having achieved one of these
milestones, however, does not guarantee that a project will ultimately move forward, and any two projects
qualifying as “advanced” may have made different levels of progress relative to one another.

Offshore Wind Market and Economic Analysis Page xv Document Number DE-EE0005360
Source: Navigant analysis
On the demonstration project front, the DOE announced continued funding for Offshore Wind
Advanced Technology Demonstration (ATD) to three projects in May 2014. Fishermen’s Energy,
Dominion, and Principle Power were each selected for up to $46.7 million in federal funds for final
design and construction of pilot projects off New Jersey, Virginia and Oregon, respectively, from an
original group of seven projects that were selected in 2012. Two of the other original seven, the
University of Maine and the Lake Erie Economic Development Company of Ohio, will receive a
fewmillion each, under separate awards, to continue the engineering designs of their proposed pilot
projects.
Overall, offshore wind power project costs may be stabilizing somewhat compared to their recent
upward trend. Notably, for those projects installed in 2013 for which data were available, the average
reported capital cost was $5,187/kW, compared to $5,385/kW for projects completed in 2012. While it
appears that the stabilizing trend may continue for projects completed in 2014, a lack of data for projects
anticipated to reach completion in 2015 and 2016 makes it difficult to assess whether the trend will
continue. Note that all such capital cost data are self-reported by project developers and are not available
for all projects globally; therefore, it may not be fully representative of market trends.
Globally, offshore wind projects continue to trend farther from shore into increasingly deeper waters;
parallel increases in turbine sizes and hub heights are contributing to higher reported capacity
factors. While the trend toward greater distances helps reduce visual impacts and public opposition to
offshore wind, it also requires advancements in foundation technologies and affects the logistics and
costs of installation and maintenance. On the positive side, the trend toward higher-capacity machines
combines with increasing hub heights and rotor diameters to allow projects to improve energy capture
by taking better advantage of higher wind speeds.
The average nameplate capacity of offshore wind turbines jumped substantially from 2010 to 2011 as
projects increasingly deployed 3.6 MW and 5 MW turbines. Since then, however, average turbine size
has plateaued around 4 MW. This leveling off of average turbine size will likely continue over the next
two years as previously ordered 3.6 MW machines are deployed and Asian manufacturers work to catch
up with their European counterparts. The upward trend in average turbine sizes will likely resume
toward 2018 as developers begin deploying more 5.0 MW and larger turbines. The average turbine size
for advanced-stage projects in the United States is expected to range between 5.0 and 5.3 MW, indicating
that U.S. projects will likely utilize larger offshore turbines rather than smaller turbines that have
previously been installed in European waters.
The shift to more distant locations and larger capacity turbines, along with a desire to minimize tower
top mass, has driven continued innovation in drivetrain configurations; however, the majority of
installed turbines continue to use conventional drivetrain designs. Other configurations, such as
direct-drive and medium-speed drivetrains, have been limited to a combined 3 percent market share of
cumulative installed capacity. Deployment of turbines with alternative drivetrain configurations will
likely increase significantly over the next several years, as the new 5 to 8 MW class turbine models from
Siemens, Vestas, Areva, Alstom, and Mitsubishi are installed at commercial projects.
Offshore Wind Market and Economic Analysis Page xvi Document Number DE-EE0005360
The past year has seen a continued trend for substructure design innovations, as the challenges of
installing larger turbines, siting projects in deeper waters, and the need to reduce installed costs
persist. While much of the focus in recent years has been on alternatives to the conventional monopile
approach (due to various limitations), the advent of the extra-large (XL) monopile (suitable to a 45 m
water depth) may have somewhat lessened the impetus for significant change. Regardless, the optimal
type of substructure (and the potential for innovation) is largely driven by site-specific factors, and
plenty of opportunity remains for new designs that can address developers’ unique combinations of
needs. In the near-term, monopiles will continue to comprise the majority of new installations, with
multi-pile (jacket and tripod) designs showing notable increases. In addition, the industry continues to
explore the potential for floating foundations, with several demonstration-scale projects currently
operating and additional installations planned.
Section 2. Analysis of Policy Developments
U.S. offshore wind development faces significant challenges: (1) the cost competitiveness of offshore
wind energy;2 (2) a lack of infrastructure such as offshore transmission and purpose-built ports and
vessels; and (3) uncertain and lengthy regulatory processes. Various U.S. states, the U.S. federal
government, and European countries have used a variety of policies to address each of these barriers
with varying success.
For the U.S. to maximize offshore wind development, the most critical need continues to be
stimulation of demand through addressing cost competitiveness and providing policy certainty. Key
federal policies expired for projects that did not start construction by year-end 2013: the Renewable
Electricity Production Tax Credit (PTC), the Business Energy Investment Tax Credit (ITC), and the 50
percent first-year bonus depreciation allowance. However, the Senate Finance Committee recently
passed an extension of both of the PTC and ITC through 2015, maintaining the same new definition of
commencing construction, as part of a comprehensive tax extenders bill covering 51 other industries and
there is some chance that the full Senate and House will adopt this before the end of 2014.
Furthermore, the DOE announced three projects that will each receive up to $47 million to complete
engineering and construction as the second phase of the Offshore Wind Advanced Technology
Demonstration Program. On the state level, Maryland began promulgating rules for Offshore Renewable
Energy Credits (ORECs) for up to 200 MW, and the Maine Public Utility Commission approved a term
sheet with a team led by the University of Maine for a pilot floating wind turbine project.
Increased infrastructure is necessary to allow demand to be filled. Examples of transmission policies
that can be implemented in the short term with relatively little effort are to designate offshore wind
energy resources zones for targeted offshore grid investments, establish cost allocation and recovery
mechanisms for transmission interconnections, and promote utilization of existing transmission capacity
reservations to integrate offshore wind. In 2014, there were few tangible milestones in this area,
2 The first two contracts for U.S. offshore wind reflect the higher costs by being priced at $187/MWh plus 3.5%
annual escalation for Cape Wind and $244/MWh plus 3.5% annual escalation for the Deepwater Wind Block Island
Wind Farm.

Offshore Wind Market and Economic Analysis Page xvii Document Number DE-EE0005360
although long-term plans for offshore transmission projects such as the Atlantic Wind Connection and
the New Jersey Energy Link progressed steadily in their development efforts.
Regulatory policies cover three general categories: (a) policies that define the process of obtaining site
leases; (b) policies that define the environmental, permitting processes; and (c) policies that regulate
environmental and safety compliance of plants in operation. In 2014, the U.S. Bureau of Ocean Energy
Management (BOEM) announced additional competitive lease sales for renewable energy off
Massachusetts, Maryland and New Jersey.
Section 3. Economic Impacts
Our estimated installed costs have dropped 6% since our 2011 work. This is driven by: new data from
European projects, revised design assumptions and more refined estimates from U.S. projects in
planning stages. Expected installed costs for a 500 MW farm are $2.86 Billion or $5,700/kW.
Current U.S. employment levels could be between 550 and 4,600 full-time equivalents (FTEs), and
current investment could be between $146 million and $1.1 billion. The ranges are driven by
Navigant’s uncertainty about from where advanced-stage projects are sourcing components. As the
advanced-stage projects start construction, employment levels will likely double or triple to support
equipment transport and installation.
Section 4. Developments in Relevant Sectors of the Economy
The development of an offshore wind industry in the U.S. will depend on the evolution of other
sectors in the economy. Factors within the power sector, such as the capacity or price of competing
power generation technologies, will affect the demand for offshore wind. Factors within industries that
compete with offshore wind for resources (e.g., oil and gas, construction, and manufacturing) will affect
the price of offshore wind power.
Factors in the power sector that will have the largest impact include natural gas prices and the change
in coal-based generation capacity. As electricity prices have historically been linked to natural gas
prices, a decrease in prices of the latter can lead to a decrease in the price of the former. Natural gas
prices declined from above $4 per million British thermal units (MMbtu) in August 2011 to below
$2/MMbtu in April 2012, largely due to the supply of low-cost gas from the Marcellus Shale. Lower
resulting electricity prices can make investment in other power generation sources such as offshore wind
less economically attractive. However, natural gas prices have been rising steadily since then and have
remained above $4/MMbtu since late 2013 with periods exceeding $6/MMbtu3 and may continue to rise
with three new liquefied natural gas export terminals recently approved.
In terms of coal, Navigant analysis reveals executed and planned coal plant retirements through 2020 of
nearly 40 GW. As this capacity is removed from the U.S. electric generation base, it will need to be
replaced by other power generation resources, including but not limited to natural gas and offshore
3 U.S. Energy Information Administration Daily Energy Prices, June 12, 2014
(http://www.eia.gov/todayinenergy/prices.cfm).
Offshore Wind Market and Economic Analysis Page xviii Document Number DE-EE0005360
wind. As such, continued coal plant retirements could increase the demand for offshore wind plants in
the United States.

Offshore Wind Market and Economic Analysis Page 1 Document Number DE-EE0005360
1. Global Offshore Wind Development Trends
Since 2013, additional progress has been made to develop commercial and demonstration-scale projects
in U.S. waters. Two commercial-scale projects, Deepwater’s 30 MW Block Island project and Cape
Wind’s 468 MW project, have begun initial construction activities and expect to reach completion in
2016. In addition, the Bureau of Ocean Energy Management (BOEM) has continued to make steady
progress on its Smart from the Start initiative to facilitate siting, leasing and construction of offshore wind
energy projects on the Atlantic Outer Continental Shelf. At the demonstration level, the U.S. Department
of Energy (DOE) completed the down-selection process for its Advanced Technology Demonstration
awards program in May 2014, selecting three projects (from an original pool of seven) for up to $47
million each in funding to help complete engineering and design and reach full deployment by 2017.
As the U.S. market moves forward, it will continue to respond to and reflect the general trends occurring
in the global offshore wind market. Through 2014, offshore wind technology has generally continued
along historical trends. Turbine sizes and plant capacities have continued to grow, and water depth and
distances to shore have increased. As projects move further from shore, taller and larger turbines may
allow developers to take advantage of better and more sustained wind resources, thereby increasing
capacity factors. On the other hand, these deeper waters and longer distances present new challenges
and opportunities for foundations, drivetrains, installation logistics, and operations and maintenance
(O&M). Time will tell how well initial U.S. projects align with those global trends in light of region-
specific wind resource and seabed conditions.
This section presents an overview of the global offshore wind market and illustrates several of these
trends in more detail. This analysis draws upon an offshore wind project database compiled from
existing project databases and an ongoing review of developer announcements and industry news
coverage.4 Note that, for planned projects, these data rely primarily on developer projections and news
reports and that the status and details of projects under development are subject to change.
4The authors would like to acknowledge Navigant Research (formerly BTM Consult [BTM]), Green Giraffe Energy
Bankers, and the National Renewable Energy Laboratory (NREL) for their contributions of project information they
had previously collected. In addition, the team relied on publicly available information from the 4C Offshore Wind
Farm Database (4C Offshore 2014) and the Global Wind Energy Council (GWEC 2014).
Offshore Wind Market and Economic Analysis Page 2 Document Number DE-EE0005360
1.1 Global Offshore Wind Development
The majority of new offshore wind installations continue to occur in northwest Europe, and the Asian
markets continue to show tentative growth. In 2013, more than 1,700 MW of offshore wind power
capacity was added globally, bringing the cumulative global total to 7,031 MW. Of that new capacity
installed in 2013, most is attributable to four countries – Belgium (192 MW of new capacity), Denmark
(400 MW), Germany (230 MW) and the United Kingdom (812 MW) – with the U.K. comprising 47
percent of 2013 additions globally.5 Figure 1-1 summarizes the historical growth of the global offshore
wind market.
5 Various sources use different approaches for reporting annual capacity estimates. Navigant’s approach has
historically reported MW capacity installed in a particular year, regardless of whether it has been connected to the
grid. Other sources (e.g., the European Wind Energy Association [EWEA]) report MW capacity based on the year in
which it is connected to the grid. As a result, estimates of annual capacity additions may vary. For example, EWEA’s
estimate for 2011 European capacity additions shows 866 MW (EWEA 2012a), while Navigant Research’s shows
only 366 MW. This is likely a result of 500 MW installed in 2010 not being connected to the grid until 2011.
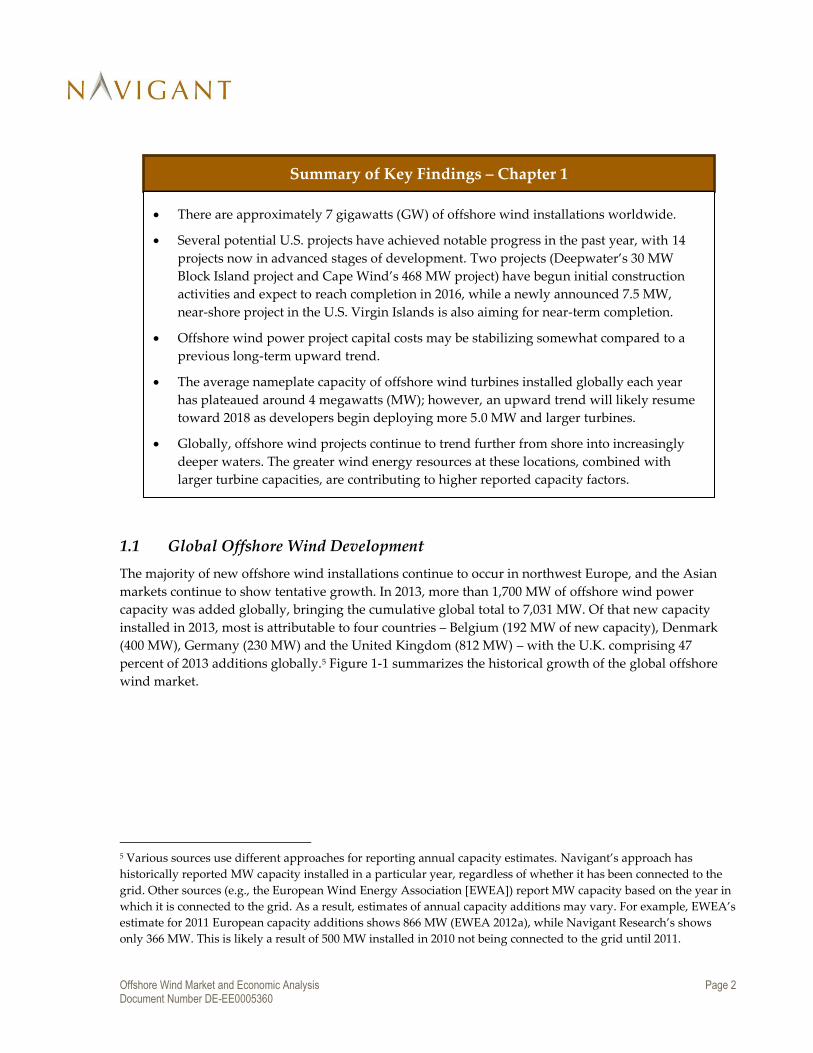
Summary of Key Findings – Chapter 1
There are approximately 7 gigawatts (GW) of offshore wind installations worldwide.
Several potential U.S. projects have achieved notable progress in the past year, with 14
projects now in advanced stages of development. Two projects (Deepwater’s 30 MW
Block Island project and Cape Wind’s 468 MW project) have begun initial construction
activities and expect to reach completion in 2016, while a newly announced 7.5 MW,
near-shore project in the U.S. Virgin Islands is also aiming for near-term completion.
Offshore wind power project capital costs may be stabilizing somewhat compared to a
previous long-term upward trend.
The average nameplate capacity of offshore wind turbines installed globally each year
has plateaued around 4 megawatts (MW); however, an upward trend will likely resume
toward 2018 as developers begin deploying more 5.0 MW and larger turbines.
Globally, offshore wind projects continue to trend further from shore into increasingly
deeper waters. The greater wind energy resources at these locations, combined with
larger turbine capacities, are contributing to higher reported capacity factors.
» Approaches to drivetrain configurations continue to diversify in an effort to improve

Offshore Wind Market and Economic Analysis Page 3 Document Number DE-EE0005360
Figure 1-1. Historical Growth of the Global Offshore Wind Market
Note: Shows capacity in the year it was installed but not necessarily grid-connected. Includes commercial, test,
and intertidal projects.
Source: Navigant analysis of data provided by NREL and Navigant Research (formerly BTM Consult)6
6 BTM Consult, an international wind market research consultancy based in Denmark, was acquired by Navigant in
2010 and is now known as Navigant Research.
7,031
0
1000
2000
3000
4000
5000
6000
7000
8000
0
200
400
600
800
1000
1200
1400
1600
1800
2000
Cu
mu
lati
ve M
W I
nst
alle
d
Incr
em
en
tal M
W In
stal
led
Europe (incremental) Asia (incremental) Cumulative Total

Offshore Wind Market and Economic Analysis Page 4 Document Number DE-EE0005360
In total, capacity additions in 2013 showed a roughly 50 percent increase over 2012, finally surpassing
the pace of installations achieved in 2010. While this upward trend is encouraging, uncertain political
support for offshore wind in European nations and the challenges of bringing down costs mean that the
pace of capacity growth may level off in the next two years (Global Wind Energy Council [GWEC] 2014).
In the Asian market, China’s progress toward a robust offshore wind power market has been slower
than planned; however, approximately 1,000 MW are currently under construction. Table 1-1 provides a
summary of the current global offshore market in number of projects, cumulative capacity, and number
of turbines by country.
Table 1-1. Summary of Cumulative Installed Global Offshore Capacity through 2013
Region Country
Number of
Operational
Projects
Total Capacity
(MW)
Total Number of
Turbines Installed
Asia
China 15 404 158
Japan 9 50 27
South Korea 2 5 2
Europe
Belgium 6 571 135
Denmark 17 1,274 517
Finland 3 32 11
Germany 8 516 115
Ireland 1 25 7
Netherlands 4 247 128
Norway 1 2 1
Portugal 1 2 1
Spain 1 5 1
Sweden 6 212 91
United Kingdom 30 3,686 1,083
Total 104 7,031 2,277
Note: Includes commercial and test projects. Individual phases of projects at a single site may be counted as separate
projects.
Source: Navigant analysis of data provided by NREL and Navigant Research
As shown in Table 1-1, the United Kingdom continues to lead
the market, with 3,686 MW, more than half of global installed
capacity. The European market will continue to grow rapidly
over the next two years, with projects under construction in
2014 in Belgium, Germany, the Netherlands, and the United
Kingdom. As noted above, however, the longer-term outlook
is less certain. In the Asia region, Japan, South Korea, and
Taiwan continue to work toward their respective goals for
offshore wind before the close of the decade; however, like China, initial progress has been slow.
Global capacity additions in
2013 showed a roughly 50
percent increase over 2012,
finally surpassing the pace of
installations achieved in 2010.

Offshore Wind Market and Economic Analysis Page 5 Document Number DE-EE0005360
In total, it appears that near-term growth will continue, with more than 6,600 MW of offshore wind
under construction in 29 projects globally (Navigant Research 2014). However, forecasts and predictions
for the global market in the long-term reflect the inherent uncertainty surrounding the offshore market.
Published forecasts for cumulative global offshore wind capacity range from approximately 40 GW to
more than 75 GW by 2022 (IHS Emerging Energy Research 2012; Navigant Research 2012; Douglas-
Westwood 2013).
1.2 U.S. Project Development Overview
Since the last edition of this report (published October 2013), the U.S. offshore wind market has made
incremental but notable progress toward the completion of its first commercial-scale projects. Two of the
more advanced projects – Cape Wind and Deepwater’s Block Island project – have moved into their
initial stages of construction, while Ocean Offshore Energy has quietly advanced efforts to install a
smaller (7.5 MW) near-shore project in the U.S. Virgin Islands. Other large-scale projects, however,
continue to show limited advancement.
On the demonstration project front, the DOE completed the down-selection process for its Advanced
Technology Demonstration (ATD) awards program, choosing three of the original seven ATD projects to
receive up to $47 million each in federal funding to reach full deployment. This section provides an
overview of these and other updates to U.S. offshore wind project developments.
Most of the progress over the past year has involved advancements in previously announced projects,
with a few additions of new advanced-stage projects related to smaller-scale or demonstration efforts.
This report defines “advanced-stage” projects as those that have accomplished at least one of the
following three milestones:
Received approval for an interim limited lease or a commercial lease in state or federal waters
Conducted baseline or geophysical studies at the proposed site with a meteorological tower
erected and collecting data, boreholes drilled, or geological and geophysical data acquisition
system in use
Signed a power purchase agreement (PPA) with a power off-taker
Note that each of these criteria represents a requisite step that
a project will take before it gains final approvals and reaches
the construction phase. Simply having achieved one of these
milestones, however, does not guarantee that a project will
ultimately move forward, and any two projects qualifying as
“advanced” may have made different levels of progress
relative to one another.
In addition, recent and upcoming BOEM WEA leasing activities suggest that additional project
announcements are likely to occur in the near future. For example, in late 2013, Dominion Virginia
Power signed a lease for the Virginia WEA, which is estimated to hold potential for up to 2,000 MW of
offshore wind; however, as of this report’s writing, the developer had not announced any detailed
project plans, as they are still working through the process of site assessment and analysis. However, the
The U.S. offshore wind market
has made incremental but
notable progress toward the
completion of its first
commercial-scale project.

Offshore Wind Market and Economic Analysis Page 6 Document Number DE-EE0005360
site is adjacent to a DOE funded demonstration project and should be able to leverage lessons learned
and technical results from the demonstration project.
Finally, some projects that have reached an advances stage in previous years may be relatively inactive
presently, with little evidence (or at least public announcements) that they are continuing to progress
their development plans. Conversely, some projects that are making visible progress have yet to achieve
any of the milestones that would categorize them as advanced stage.
A map showing the announced locations and capacities for each of 14 advanced-stage projects appears
in Figure 1-2Error! Reference source not found..
Figure 1-2. Proposed U.S. Offshore Wind Energy Projects in Advanced Development Stages by
Jurisdiction and Project Size
Source: Navigant analysis
These 14 projects represent approximately 4.9 GW of potential capacity. As shown in the figure, 95
percent of this capacity would lie in federal waters (i.e., typically outside a three-nautical-mile state

Offshore Wind Market and Economic Analysis Page 7 Document Number DE-EE0005360
boundary). Notably, this report reveals a significant decrease in advanced-stage project capacity in state
waters since 2013; after failing to win an additional DOE ATD award, Baryonyx Corporation canceled
U.S. Army Corps of Engineers (USACE) permits for both its demonstration- and commercial-scale
projects off the coast of Texas (ReNews 2014). According to USACE staff, the developer plans to re-submit
a permit for a scaled-down project in 2015; however, the Texas General Land Office announced in late
July 2014 that the developer appeared to be letting its leases for the proposed project site expire. These
changes continued to shift the balance of U.S. advanced-stage projects almost entirely into federal
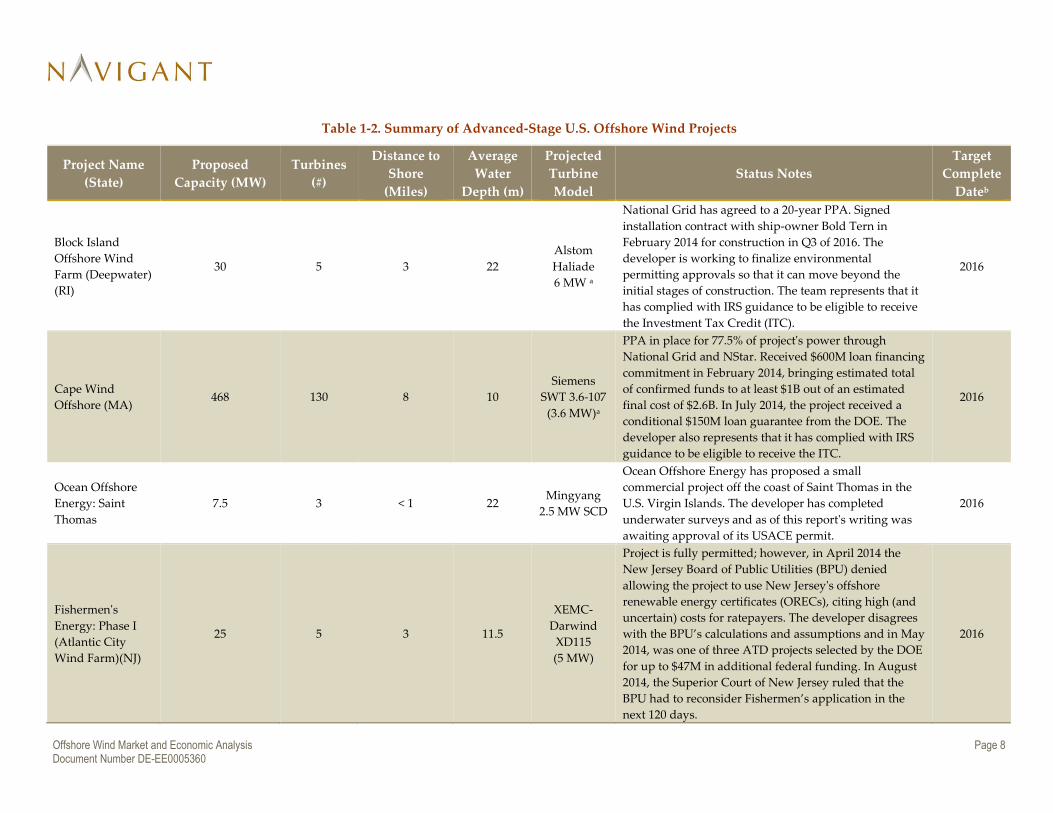
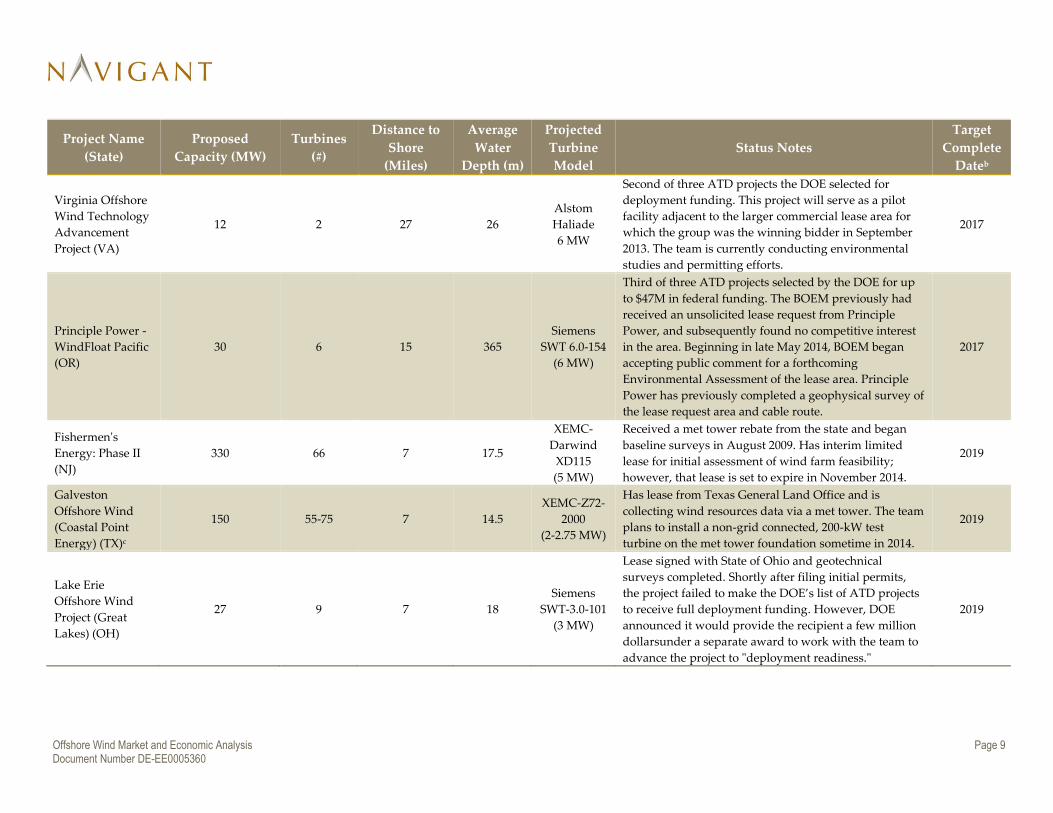
waters. Table 1-2 provides additional details about each of the 14 advanced-stage projects, including
nameplate capacity, number of turbines, turbine make and model, turbine capacity, water depth and
distance to shore, status notes, and an estimated completion date. As noted above, some of the
advanced-stage projects have been relatively inactive in the past 12 months, while some of the planned
demonstration-scale projects failed to gain anticipated federal funding. As a result, the estimated
completion dates for several projects (or whether they will be completed at all) should be considered as
uncertain.
Offshore Wind Market and Economic Analysis Page 8 Document Number DE-EE0005360
Table 1-2. Summary of Advanced-Stage U.S. Offshore Wind Projects
Project Name
(State)
Proposed
Capacity (MW)
Turbines
(#)
Distance to
Shore
(Miles)
Average
Water
Depth (m)
Projected
Turbine
Model
Status Notes
Target
Complete
Dateb
Block Island
Offshore Wind
Farm (Deepwater)
(RI)
30 5 3 22
Alstom
Haliade
6 MW a
National Grid has agreed to a 20-year PPA. Signed
installation contract with ship-owner Bold Tern in
February 2014 for construction in Q3 of 2016. The
developer is working to finalize environmental
permitting approvals so that it can move beyond the
initial stages of construction. The team represents that it
has complied with IRS guidance to be eligible to receive
the Investment Tax Credit (ITC).
2016
Cape Wind
Offshore (MA) 468 130 8 10
Siemens
SWT 3.6-107
(3.6 MW)a
PPA in place for 77.5% of project's power through
National Grid and NStar. Received $600M loan financing
commitment in February 2014, bringing estimated total
of confirmed funds to at least $1B out of an estimated
final cost of $2.6B. In July 2014, the project received a
conditional $150M loan guarantee from the DOE. The
developer also represents that it has complied with IRS
guidance to be eligible to receive the ITC.
2016
Ocean Offshore
Energy: Saint
Thomas
7.5 3 < 1 22 Mingyang
2.5 MW SCD
Ocean Offshore Energy has proposed a small
commercial project off the coast of Saint Thomas in the
U.S. Virgin Islands. The developer has completed
underwater surveys and as of this report's writing was
awaiting approval of its USACE permit.
2016
Fishermen's
Energy: Phase I
(Atlantic City
Wind Farm)(NJ)
25 5 3 11.5
XEMC-
Darwind
XD115
(5 MW)
Project is fully permitted; however, in April 2014 the
New Jersey Board of Public Utilities (BPU) denied
allowing the project to use New Jersey's offshore
renewable energy certificates (ORECs), citing high (and
uncertain) costs for ratepayers. The developer disagrees
with the BPU’s calculations and assumptions and in May
2014, was one of three ATD projects selected by the DOE
for up to $47M in additional federal funding. In August
2014, the Superior Court of New Jersey ruled that the
BPU had to reconsider Fishermen’s application in the
next 120 days.
2016
Offshore Wind Market and Economic Analysis Page 9 Document Number DE-EE0005360
Project Name
(State)
Proposed
Capacity (MW)
Turbines
(#)
Distance to
Shore
(Miles)
Average
Water
Depth (m)
Projected
Turbine
Model
Status Notes
Target
Complete
Dateb
Virginia Offshore
Wind Technology
Advancement
Project (VA)
12 2 27 26
Alstom
Haliade
6 MW
Second of three ATD projects the DOE selected for
deployment funding. This project will serve as a pilot
facility adjacent to the larger commercial lease area for
which the group was the winning bidder in September
2013. The team is currently conducting environmental
studies and permitting efforts.
2017
Principle Power -
WindFloat Pacific
(OR)
30 6 15 365
Siemens
SWT 6.0-154
(6 MW)
Third of three ATD projects selected by the DOE for up
to $47M in federal funding. The BOEM previously had
received an unsolicited lease request from Principle
Power, and subsequently found no competitive interest
in the area. Beginning in late May 2014, BOEM began
accepting public comment for a forthcoming
Environmental Assessment of the lease area. Principle
Power has previously completed a geophysical survey of
the lease request area and cable route.
2017
Fishermen's
Energy: Phase II
(NJ)
330 66 7 17.5
XEMC-
Darwind
XD115
(5 MW)
Received a met tower rebate from the state and began
baseline surveys in August 2009. Has interim limited
lease for initial assessment of wind farm feasibility;
however, that lease is set to expire in November 2014.
2019
Galveston
Offshore Wind
(Coastal Point
Energy) (TX)c
150 55-75 7 14.5
XEMC-Z72-
2000
(2-2.75 MW)
Has lease from Texas General Land Office and is
collecting wind resources data via a met tower. The team
plans to install a non-grid connected, 200-kW test
turbine on the met tower foundation sometime in 2014.
2019
Lake Erie
Offshore Wind
Project (Great
Lakes) (OH)
27 9 7 18
Siemens
SWT-3.0-101
(3 MW)
Lease signed with State of Ohio and geotechnical
surveys completed. Shortly after filing initial permits,
the project failed to make the DOE’s list of ATD projects
to receive full deployment funding. However, DOE
announced it would provide the recipient a few million
dollarsunder a separate award to work with the team to
advance the project to "deployment readiness."
2019
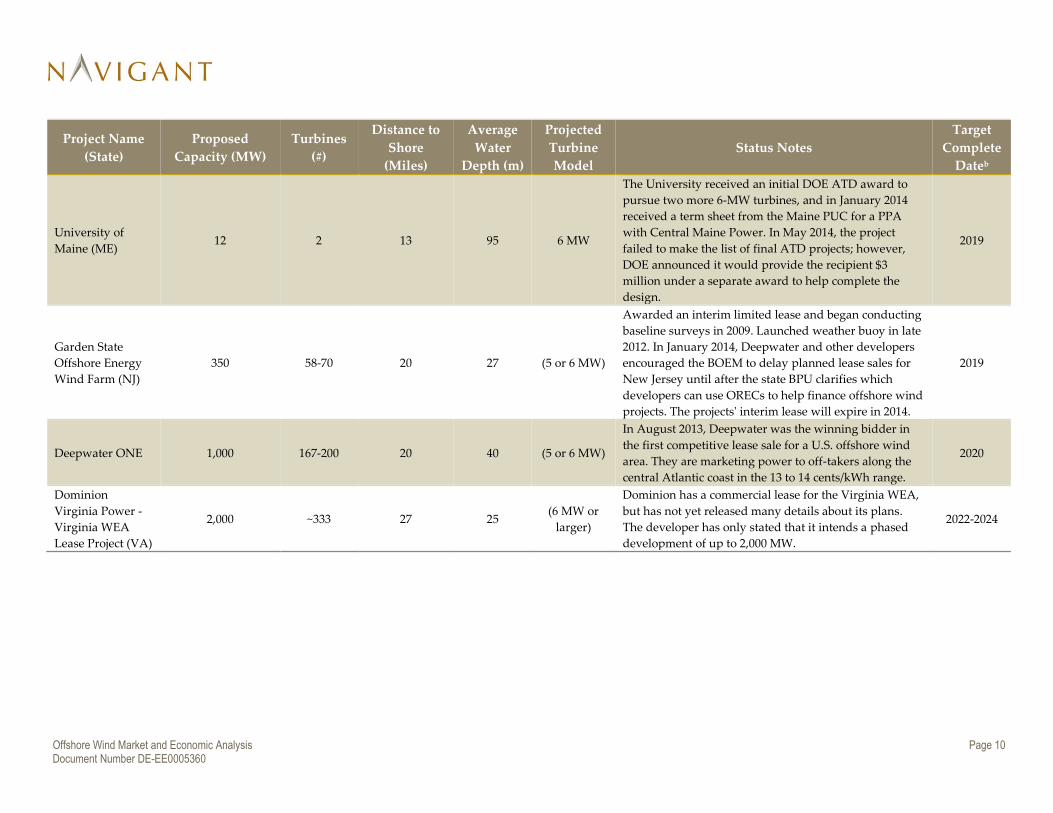
Offshore Wind Market and Economic Analysis Page 10 Document Number DE-EE0005360
Project Name
(State)
Proposed
Capacity (MW)
Turbines
(#)
Distance to
Shore
(Miles)
Average
Water
Depth (m)
Projected
Turbine
Model
Status Notes
Target
Complete
Dateb
University of
Maine (ME) 12 2 13 95 6 MW
The University received an initial DOE ATD award to
pursue two more 6-MW turbines, and in January 2014
received a term sheet from the Maine PUC for a PPA
with Central Maine Power. In May 2014, the project
failed to make the list of final ATD projects; however,
DOE announced it would provide the recipient $3
million under a separate award to help complete the
design.
2019
Garden State
Offshore Energy
Wind Farm (NJ)
350 58-70 20 27 (5 or 6 MW)
Awarded an interim limited lease and began conducting
baseline surveys in 2009. Launched weather buoy in late
2012. In January 2014, Deepwater and other developers
encouraged the BOEM to delay planned lease sales for
New Jersey until after the state BPU clarifies which
developers can use ORECs to help finance offshore wind
projects. The projects' interim lease will expire in 2014.
2019
Deepwater ONE 1,000 167-200 20 40 (5 or 6 MW)
In August 2013, Deepwater was the winning bidder in
the first competitive lease sale for a U.S. offshore wind
area. They are marketing power to off-takers along the
central Atlantic coast in the 13 to 14 cents/kWh range.
2020
Dominion
Virginia Power -
Virginia WEA
Lease Project (VA)
2,000 ~333 27 25 (6 MW or
larger)
Dominion has a commercial lease for the Virginia WEA,
but has not yet released many details about its plans.
The developer has only stated that it intends a phased
development of up to 2,000 MW.
2022-2024

Offshore Wind Market and Economic Analysis Page 11 Document Number DE-EE0005360
Project Name
(State)
Proposed
Capacity (MW)
Turbines
(#)
Distance to
Shore
(Miles)
Average
Water
Depth (m)
Projected
Turbine
Model
Status Notes
Target
Complete
Dateb
NRG Bluewater's
Mid-Atlantic
Wind Park (DE)
450 150 12.7 20 3 MW
Received one of the first U.S. offshore leases from BOEM
in October 2012 as part of "Smart from the Start"
program. However, Delmarva has since canceled a PPA
for 200 MW of the power. NRG filed its Site Assessment
Plan in 2014, but the project website states that the
project is officially on hold. NRG retains its development
rights; however, it is unclear whether the project will be
developed by NRG or sold.
2021
a) These projects have committed to a specific turbine with a turbine supply agreement in place. All other stated turbines are based on developer statements and may change.
b) Dates shown in this table are based on developer statements and Navigant analysis; they may change based on permitting, leasing, surveying, and other activities.
c) Leasing and permitting requirements for projects in Texas state waters do not involve the Federal Energy Regulatory Commission (FERC) or BOEM and may move more
quickly than projects in federal waters.
Source: Navigant analysis based on published project information, developer statements and media coverage
Offshore Wind Market and Economic Analysis Page 12 Document Number DE-EE0005360
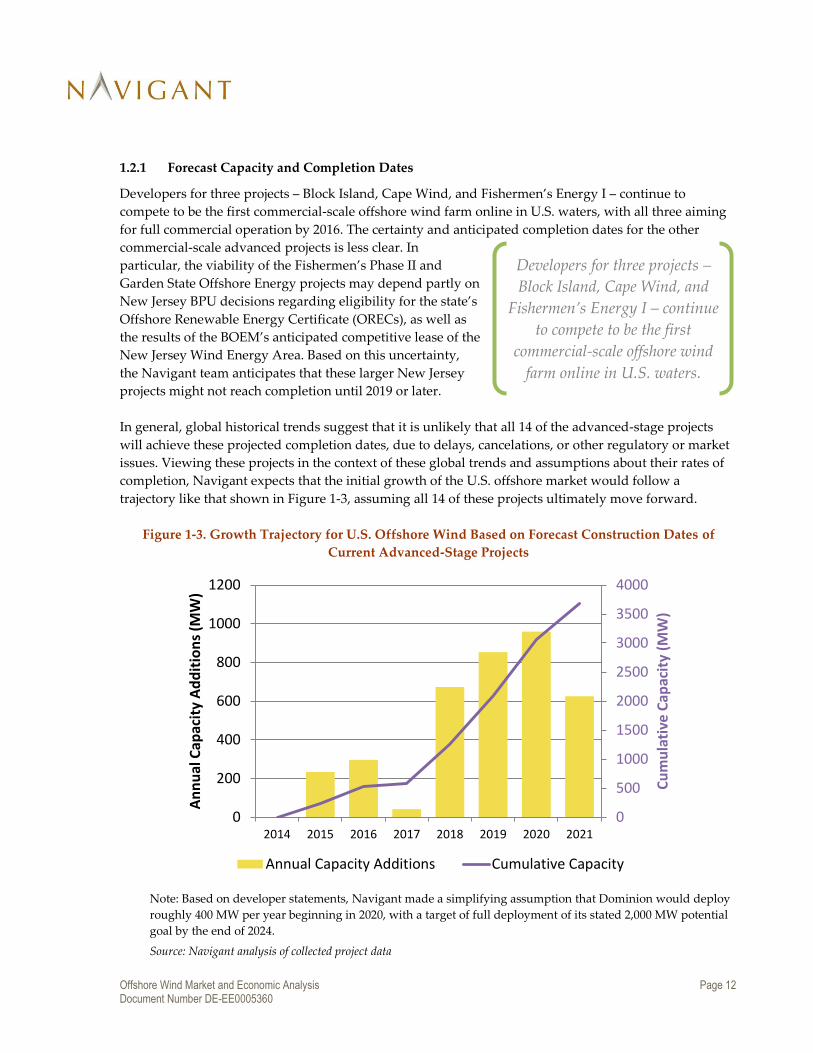
1.2.1 Forecast Capacity and Completion Dates
Developers for three projects – Block Island, Cape Wind, and Fishermen’s Energy I – continue to
compete to be the first commercial-scale offshore wind farm online in U.S. waters, with all three aiming
for full commercial operation by 2016. The certainty and anticipated completion dates for the other
commercial-scale advanced projects is less clear. In
particular, the viability of the Fishermen’s Phase II and
Garden State Offshore Energy projects may depend partly on
New Jersey BPU decisions regarding eligibility for the state’s
Offshore Renewable Energy Certificate (ORECs), as well as
the results of the BOEM’s anticipated competitive lease of the
New Jersey Wind Energy Area. Based on this uncertainty,
the Navigant team anticipates that these larger New Jersey
projects might not reach completion until 2019 or later.
In general, global historical trends suggest that it is unlikely that all 14 of the advanced-stage projects
will achieve these projected completion dates, due to delays, cancelations, or other regulatory or market
issues. Viewing these projects in the context of these global trends and assumptions about their rates of
completion, Navigant expects that the initial growth of the U.S. offshore market would follow a
trajectory like that shown in Figure 1-3, assuming all 14 of these projects ultimately move forward.
Figure 1-3. Growth Trajectory for U.S. Offshore Wind Based on Forecast Construction Dates of
Current Advanced-Stage Projects
Note: Based on developer statements, Navigant made a simplifying assumption that Dominion would deploy
roughly 400 MW per year beginning in 2020, with a target of full deployment of its stated 2,000 MW potential
goal by the end of 2024.
Source: Navigant analysis of collected project data
0
500
1000
1500
2000
2500
3000
3500
4000
0
200
400
600
800
1000
1200
2014 2015 2016 2017 2018 2019 2020 2021
Cu
mu
lati
ve C
apac
ity
(MW
)
An
nu
al C
apac
ity
Ad
dit
ion
s (M
W)
Annual Capacity Additions Cumulative Capacity
Developers for three projects –
Block Island, Cape Wind, and
Fishermen’s Energy I – continue
to compete to be the first
commercial-scale offshore wind
farm online in U.S. waters.

Offshore Wind Market and Economic Analysis Page 13 Document Number DE-EE0005360
The three DOE-supported ATD projects are expected to achieve deployment by the end of 2017, shown
as the 2017 installations in Figure 1-3. Their smaller scale, receipt of targeted federal support, and state
support may facilitate their installation and make them among the first projects in U.S. waters. Section
1.2.3 describes these projects in more detail.
1.2.2 Notable Developments in Advanced-Stage Projects
This section briefly highlights some of the key developments and advancements that have occurred in
U.S. offshore wind projects since the last edition of this report, which was released in October 2013.
1.2.2.1 BOEM Advancements and Leasing Activities
BOEM continued to make steady progress on its Smart from the Start initiative to facilitate siting,
leasing, and construction of offshore wind energy projects on the Atlantic Outer Continental Shelf.7 As of
this report’s writing, BOEM was assessing the suitability of and commercial interest in each of seven
WEAs, as well as several unsolicited lease requests. Under the initiative, BOEM selected these areas for
expedited assessments and planning to help facilitate development of projects along the Atlantic Coast.
Figure 1-4 shows the location of each of the seven WEAs.
7 See http://www.boem.gov/Renewable-Energy-Program/Smart-from-the-Start/Index.aspx
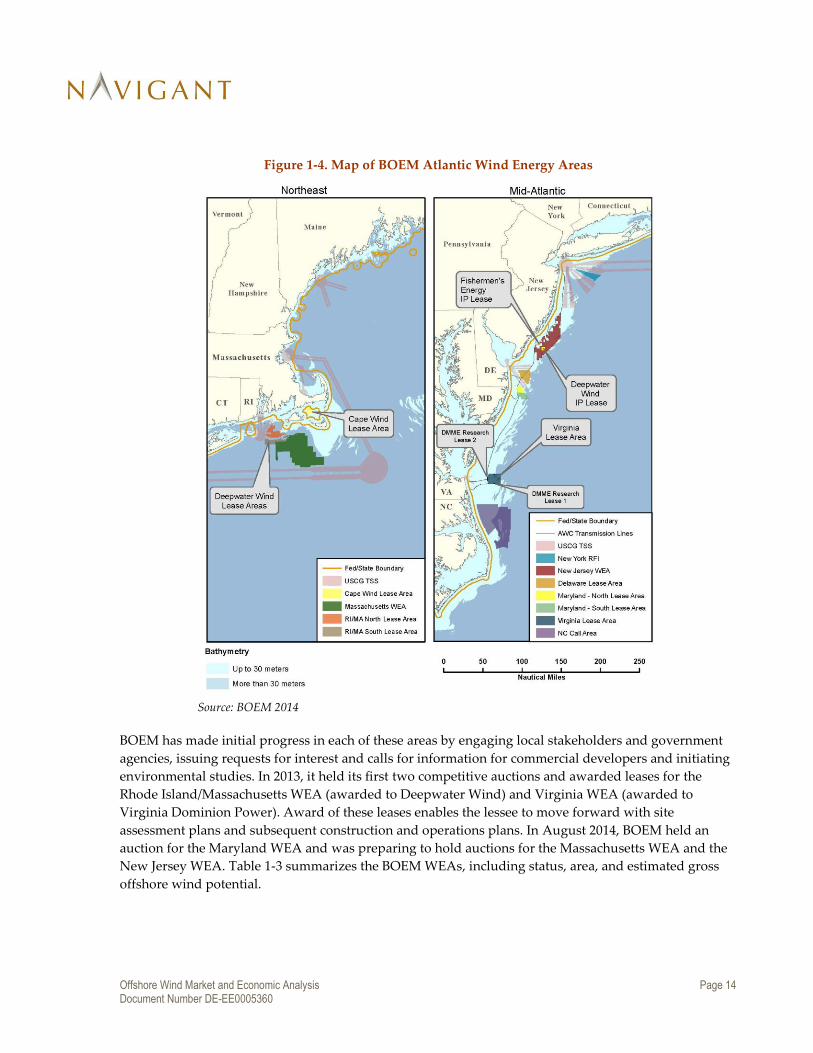
Offshore Wind Market and Economic Analysis Page 14 Document Number DE-EE0005360
Figure 1-4. Map of BOEM Atlantic Wind Energy Areas
Source: BOEM 2014
BOEM has made initial progress in each of these areas by engaging local stakeholders and government
agencies, issuing requests for interest and calls for information for commercial developers and initiating
environmental studies. In 2013, it held its first two competitive auctions and awarded leases for the
Rhode Island/Massachusetts WEA (awarded to Deepwater Wind) and Virginia WEA (awarded to
Virginia Dominion Power). Award of these leases enables the lessee to move forward with site
assessment plans and subsequent construction and operations plans. In August 2014, BOEM held an
auction for the Maryland WEA and was preparing to hold auctions for the Massachusetts WEA and the
New Jersey WEA. Table 1-3 summarizes the BOEM WEAs, including status, area, and estimated gross
offshore wind potential.

Offshore Wind Market and Economic Analysis Page 15 Document Number DE-EE0005360
Table 1-3. Overview of BOEM Wind Energy Areas as of August 2014
WEA Status Area
(acres)
Area
(sq. km)
Estimated OSW potential
(GW)*8
MA Announced 742,974 3,007 9.0
RI-MA Awarded 164,750 667 2.0
NY Scoping 81,280 329 1.1
NJ Announced 354,275 1,434 4.3
DE Scoping 103,323 418 1.3
MD Awarded 79,706 323 1.0
VA Awarded 112,799 457 1.4
Total (GW) 20
Source: NREL analysis (Musial et al. 2013a; Musial et al. 2013b) and National Wildlife Foundation analysis
As shown in Table 1-3, the commercial lease areas defined by BOEM have the potential to support
approximately 20 GW of installed offshore wind capacity off of the Atlantic coast.2 This estimate
conservatively assumes that not all of the gross potential capacity within a given WEA will be developed
due to technical challenges (e.g., depth or geotechnical characteristics) as well as to provide adequate
spacing between turbines (to minimize wake effects and address other siting constraints).
Since the Fall of 2013, BOEM has also received and responded to several unsolicited lease requests for
project sites related to two of the DOE ATD projects. Key activities include the following:
In December 2013, the BOEM determined that there was no competitive interest associated with
a research lease request submitted by the Commonwealth of Virginia Department of Mines,
Minerals and Energy (DMME), for an area related to the Dominion ATD project.
In April 2014, BOEM determined that there was no competitive interest associated with Principle
Power’s unsolicited lease application for its WindFloat Pacific Pilot Project
See Section 1.2.3 for additional information on each of these ATD projects.
1.2.2.2 Block Island – Initial Construction Underway
Deepwater’s 30-MW Block Island Offshore Wind Farm has begun early-stage construction activities. The
developer shifted plans for the proposed site where its export cable would come to shore to state-owned
Scarborough State Beach after failing to gain approval for the original site from the Town of
Narragansett (Kuffner 2013). Based on its early-stage construction and supply commitments, the
Deepwater team represents that it has complied with IRS guidance to be eligible to receive the federal
Investment Tax Credit (ITC), which expired at the end of 2013. In February 2014, Deepwater signed an
installation contract with ship-owner Bold Tern, indicating that it would begin turbine installation in the
8 Assumes an average capacity density of 3 MW per square kilometer based on standard spacing metrics developed
in Musial et al. 2013a and Musial et al. 2013b

Offshore Wind Market and Economic Analysis Page 16 Document Number DE-EE0005360
third quarter of 2016 (Energy Business Review 2014). In addition, Alstom announced in March 2014 that
it has agreed to supply the project with five of its 6 MW Haliade direct-drive turbines, including 15 years
of operations and maintenance support (Alstom 2014). As of this report’s writing, the developer was
working to finalize environmental permitting approvals so that it can move beyond initial construction
stages.
1.2.2.3 Cape Wind – Continued Focus on Financing and Supply Agreements
Since this report’s last update, the 468 MW Cape Wind Offshore wind project team has also made steady
progress, both in its effort to complete the project’s financing and by overcoming additional legal
challenges. The project had previously received approvals for PPAs representing 77.5 percent of the
project’s power offtake, combining agreements with NSTAR (27.5 percent) and National Grid (50
percent). In February 2014, the developer announced a $600 million loan commitment from Danish
export credit agency EKF and, in March 2014, announced that Natixis and Rabobank have signed on as
lead arrangers for the project’s remaining financing. Combined with previous announcements, these
developments brought the project’s total of confirmed funding to at least $1 billion of the estimated $2.6
billion final cost. In July 2014, the DOE announced a conditional $150-million loan guarantee for the
project, contingent on its securing the balance of its project financing. Like Block Island, the developer
represents that its initial construction activities and supply commitments make the project eligible to
take advantage of the federal Investment Tax Credit, which expired at the end of 2013 (Engblom 2014).
In late 2013, Cape Wind Associates and Siemens signed a supply agreement for Siemens 3.6 MW
turbines, an offshore electric service platform, and a 15-year service agreement (North American
Windpower 2013). In early 2014, the developer also announced supply agreements with German
company EEW Special Pipe Constructions GmbH for monopile foundations and Danish company Bladt
Industries A/S for transition pieces (OffshoreWind.biz 2014a).
1.2.3 DOE Advanced Technology Demonstration Projects
This section provides a brief overview on each of the three projects that the DOE has selected for
continued funding under its Advanced Technology Development (ATD) program. As mentioned at the
beginning of Section 1.2, these three projects were selected from an original field of seven to receive up
to $46.7 million each to reach full deployment by the end of 2017. In addition, the University of Maine
and the Lake Erie Economic Development Co. received DOE commitments valued at a few million
dollars each to continue the engineering design of their pilot projects off the Maine and Ohio shores.
Note that all five of these projects meet Navigant’s advanced-stage project criteria and appear in Table
1-2.9
1.2.3.1 Fishermen’s Energy I (Atlantic City Wind Farm)
Fishermen’s Energy proposes to install five 5 MW, direct-drive turbines in state waters 2.8 miles off the
coast of Atlantic City, New Jersey. The project will result in an advanced, bottom-mounted foundation
design and innovative installation procedures that aim to mitigate potential environmental impacts.
Innovations or “U.S. firsts” associated with the project include the following:
9 For more on each of the ATD projects, see the DOE’s Offshore Wind Advanced Technology Demonstration Projects
website at: http://energy.gov/eere/wind/offshore-wind-advanced-technology-demonstration-projects.

Offshore Wind Market and Economic Analysis Page 17 Document Number DE-EE0005360
First commercial use of Lockheed Martin Wind Tracer
First commercial use of AXYS Floating Light Detection and Ranging (LiDAR) System
5 MW, direct-drive turbines installed in an offshore environment
Innovative foundation design (i.e., “Inward Battered Guide Structure” or “twisted jacket”) and
installation techniques (allowing reduced dependence on heavy-lift vessels)
New technology, post-construction, intensive avian impact studies
Among the more advanced U.S. offshore wind projects, the Atlantic City Wind Farm has had a year of
mixed successes and setbacks. As last reported in late 2013, the proposed 25 MW project had completed
its permitting process only to be refused approval for state ratepayer-funded subsidies by the New
Jersey Board of Public Utilities (BPU) based on concerns about potentially high costs to ratepayers
(Johnson 2013, Milford 2013). The BPU gave the developers an opportunity to respond to its objections;
however, in March 2014, the Board again ruled against the project based on its analysis of the potential
costs and benefits, as well as the project’s apparent dependence on uncertain federal funding, including
a potential DOE ATD project award (Campbell 2014). After asking the BPU to again reconsider its
decision in light of what it claims were mistaken figures and assumptions, the developers received
notification that the DOE had in fact selected the project for one of the three ATD awards valued at up to
$47 million (North American Windpower 2014, Copley 2014). In August, 2014, the Superior Court of
New Jersey ordered the BPU to reconsider its decision, taking into consideration Fishermen’s lower
estimate of $199 per megawatt hour.
1.2.3.2 Virginia Offshore Wind Technology Advancement Project (VOWTAP)
A team led by Dominion Virginia Power of Richmond has proposed to design, develop, and install two 6
MW direct-drive turbines approximately 27 miles (or 23 nautical miles) off the coast of Virginia Beach.
The project will utilize an innovative foundation that offers the strength of traditional jacket or space-
frame structures, but use substantially less steel. Innovations associated with the VOWTAP that are
being developed include the following:
Alstom HALIADE 150-meter, 6-MW rotor
Permanent Magnet Direct Drive (PMDD) generator
Innovative foundation design (i.e., “Inward Battered Guide Structure” or “twisted jacket”) and
installation techniques (allowing reduced dependence on heavy-lift vessels)
Wake effects and wind farm controls
Supervisory control and data acquisition (SCADA) and condition-based maintenance (CBM)
systems
In February 2013, DMME submitted an unsolicited request to BOEM for a research lease in federal
waters off the coast of Virginia, and in December 2013, BOEM issued a Determination of No Competitive
Interest for the requested area. The research lease area is immediately adjacent to the western border of
the Virginia WEA, for which Dominion won and signed a competitive lease in late 2013 (see Figure 1-4).

Offshore Wind Market and Economic Analysis Page 18 Document Number DE-EE0005360
1.2.3.3 WindFloat Pacific (WFP)
Seattle, Washington-based Principle Power has proposed to install five semi-submersible, floating
foundations outfitted with Siemens 6 MW, direct-drive offshore wind turbines. The project will be sited
15 miles from Coos Bay, Oregon in approximately 350 meters of water.
Principle Power maintains that the WindFloat design will be more cost-effective than traditional offshore
wind foundations because the entire turbine and floating foundation will be built on shore and installed
with conventional tug vessels. The innovations associated with the WindFloat design include the
following:
Static and dynamic stability provide pitch performance low enough to use conventional (i.e.,
fixed-foundation), commercial offshore turbines
The design and size allow for onshore assembly and commissioning
The shallow draft of the semi-submersible foundation allows the assemblies to be sited,
transported (via wet tow), and deployed in a wide range of water depths
WindFloat's semi-submersible foundation includes patented water entrapment (heave) plates at the base
of each of three vertical columns. A closed-loop, active water ballast system moves water between the
columns in the semi-submersible foundation in response to changes in wind force and direction. This
allows the mast to remain vertical, thereby optimizing electricity production.
On May 14, 2013, Principle Power submitted an unsolicited commercial lease request to BOEM for the
demonstration project. In April 2014, BOEM issued a Determination of No Competitive Interest for the
area.
1.3 Capital Cost Trends
Overall, offshore wind power project costs may be stabilizing somewhat compared to their recent long-
term upward trend; however, data for projects anticipated to reach completion in 2015 and 2016 are
somewhat limited. Figure 1-5 shows the reported capital costs over time for both operational projects
and those under construction. Note that all such capital cost data are self-reported by project developers
and is not available for all projects globally; therefore, they may not be fully representative of market
trends.

Offshore Wind Market and Economic Analysis Page 19 Document Number DE-EE0005360
Figure 1-5. Reported Capital Cost Trends for Global Offshore Wind Projects over Time
Note: Data were not available for all projects. Capital costs were inflated to 2012 currency in original
currency and converted to U.S. dollars using 2012 average exchange rates. BARD Offshore I was
excluded due to a cost overrun of more than 1 billion Euros.
Source: NREL analysis10
As noted in past editions of this report, the long-term capital
cost increase has been a function of several trends: a
movement toward deeper-water sites located farther
offshore; increased siting complexity; and higher
contingency reserves that result from more limited
operational reserves and greater uncertainty when working
in the offshore environment (Chapman et al. 2012). As will
be discussed in Section 1.4, the industry has continued its efforts – via advancements in technology,
installation approaches, and project capacity factors – to try to address this cost issue. As noted above,
available capital cost estimates indicate that this upward trend may in fact be slowing. For those projects
installed in 2013 for which data were available, the average reported capital cost was $5,187/kW,
compared to $5,385/kW for projects completed in 2012.
10 Analysis was based on peer-reviewed literature, industry white papers, press releases, developer and contractor
press releases, and industry databases. Most cost estimates are self-reported figures from project developers and
could not be independently verified.
Offshore wind power project costs
may be stabilizing somewhat
compared to their recent long-
term upward trend.

Offshore Wind Market and Economic Analysis Page 20 Document Number DE-EE0005360
Notably, these capital cost estimates from global projects may not capture all of the costs for which a
project in the United States might be responsible. However, until such data become available for
advanced-stage offshore wind projects in the U.S., capital cost projections will have to rely on models
and assumptions that seek to address those differences. The most recent projection of capital costs by
category (e.g., turbine, foundation, installation, etc.) for a theoretical 500 MW project in the U.S. appears
in Section 3.3.
1.4 Market Segmentation and Technology Trends
As noted in the October 2013 edition of this report, global offshore wind projects have followed several
general trends over time that will influence the developing U.S. market. In particular, wind farm sites
continue to move farther offshore into deeper waters, where more energetic wind resources and
increased annual energy production can contribute to increased project revenues. While this trend helps
reduce visual impacts and public opposition to offshore wind, it also requires advancements in
foundation technologies and affects the logistics and costs of installation and maintenance. Related
trends in turbine design continue to shift toward higher capacity machines, which combine with
increasing hub heights and rotor diameters to allow projects to take better advantage of higher wind
speeds. Similarly, prototype machines are testing alternative drivetrain configurations that aim to
increase efficiencies, lower turbine weights, and decrease the frequency of costly trips to service and
maintain each turbine. The following sections discuss each of these trends in more detail.

Offshore Wind Market and Economic Analysis Page 21 Document Number DE-EE0005360
1.4.1 Depth and Distance from Shore
The global trend toward deeper water sites and greater distances from shore continued in 2013, both for
completed projects and those newly under construction. With this trend comes increased costs tied to
more complex installation in deeper waters, longer export cables (and subsequent line losses), and
greater distances for installation and ongoing O&M vessels to travel. Figure 1-6 illustrates the average
distance from shore for each global offshore wind project based on the year in which it was installed.
Figure 1-6. Average Distance from Shore for Global Offshore Wind Projects over Time
Note: Multi-phase projects were combined and are reported at the latest year when turbines were added at the
project site. Expansions or phases of existing projects sites currently under construction were omitted to avoid
skewing the data. Figure includes commercial-scale projects; test and demonstration-scale projects are
excluded.
Source: Navigant analysis of data provided by NREL and Navigant Research
As shown above, more projects under construction in 2014 will be installed in waters greater than 20
miles from shore than in any previous year. Of those projects under construction in waters less than 10
miles from shore, all but two are located in the nascent Asian
markets of China and South Korea. For commercial-scale
projects with capacity additions in 2013, the average water
depth was about 15 meters, and the average distance from
shore was 13 miles. Figure 1-7 shows the relationship between
average distance from shore and average water depth for
global offshore wind projects (both operational and under
More projects under construction
in 2014 will be installed in waters
greater than 20 miles from shore
than in any previous year.

Offshore Wind Market and Economic Analysis Page 22 Document Number DE-EE0005360
construction), as well as planned U.S. projects in advanced stages of development.
Figure 1-7. Depth and Distance from Shore for Global Offshore Wind Farms
Note: Bubble size indicates projects’ relative capacities; several projects are labeled for scale. Multi-phase projects
were combined to show cumulative project capacity.
Source: Navigant analysis of data provided by NREL and Navigant Research
As shown in Figure 1-6 and Figure 1-7, several projects currently under construction (particularly in
Germany) are pushing the current limits of water depth and distance to shore. While advanced-stage
U.S. projects are generally planned for closer to shore than these newer European projects, some are
planned in BOEM WEAs with relatively deeper waters (e.g., Deepwater ONE). Notably, some of the
WEAs have average depths that exceed those of any currently operating commercial projects. The
Massachusetts WEA, for example, has an average depth of 50 meters and a maximum depth of 64
meters.

Offshore Wind Market and Economic Analysis Page 23 Document Number DE-EE0005360
Also of note are several full-scale floating foundation demonstration projects operating in (or planned
for) waters at depths of more than 50 meters. Details of operating and planned full-scale floating
offshore turbine projects appear in Table 1-4.
Table 1-4. Operating and Planned Global Projects with Floating Foundations
Project Year
Installed
Location Turbine
Capacity
Water
Depth (m)
Foundation Type
Statoil Hywind 1 2010 Norway 2.3 MW 220 Floating Spar
Principle Power
WindFloat
2011 Portugal 2 MW 50 Semi-submersible Platform
Kabashima/Goto 2013 Japan 2 MW 91 Floating Spar
Fukushima Phase
1
2013 Japan 2 MW 120 Semi-submersible Platform
Fukushima Phase
2 (Planned)
U/C Japan 2 x 7 MW 120 One Semi-submersible
Platform; One Floating Spar
Statoil Hywind 2
(Planned)
Targeted
for 2016
Scotland 5 x 6 MW 100 Floating Spar
Principle Power
WindFloat Pacific
Targeted
for 2017
U.S
(Oregon)
6 x 5 MW 365 Semi-submersible Platform
Source: Navigant analysis of data provided by NREL and Navigant Research
In the U.S., the University of Maine has previously proposed two floating, 6 MW demonstration turbines
at an approximate depth of 86 meters, as shown in Figure 1-7, while Principle Power has proposed a 30
MW WindFloat Pacific project 15 miles off the Oregon coast in water estimated at 365 meters deep.

Offshore Wind Market and Economic Analysis Page 24 Document Number DE-EE0005360
1.4.2 Plant Characteristics
The trend of more distant and deeper plant sites has coincided with a continued shift toward larger and
higher-capacity projects. Figure 1-8 illustrates the increasing trend in plant sizes over time for both
operational projects and those under construction.
Figure 1-8. Global Offshore Wind Plant Capacities over Time
Note: Plant capacities are shown for the year each project reached completion. Multi-phase projects were
combined to show cumulative project capacity and are reported at the latest year when turbines were added at
the project site. Figure includes commercial-scale projects; test and demonstration-scale projects are excluded.
Source: Navigant analysis of data provided by NREL and Navigant Research
As shown in Figure 1-8, the cumulative average capacity for projects completed from 2010 through the
end of 2013 is approximately 177 MW.11 By comparison, the average per-project capacity for installations
currently expected to reach completion in 2014 or 2015 is 237 MW, suggesting that the average
developed area for these projects is also increasing.
11 This includes the total capacity for multi-phase projects that added turbines at an existing site over the course of
more than one year (e.g., Germany’s BARD Offshore and the United Kingdom’s Greater Gabbard site)

Offshore Wind Market and Economic Analysis Page 25 Document Number DE-EE0005360
As developers move further from shore, they also gain access to generally stronger and more consistent
wind resources, particularly at higher hub heights. As a result, new plants have continued to show a
slow but steady increase in reported capacity factors over time, as illustrated in Figure 1-9.
Figure 1-9. Reported Capacity Factors for Global Offshore Wind Plants over Time
Note: Plant capacity factors are shown for the year each project reached completion. Multi-phase projects were
combined to show a single capacity factor and are reported at the latest year when turbines were added at the
project site. Figure includes commercial-scale projects; test and demonstration-scale projects are excluded.
Source: Navigant analysis of data provided by NREL and Navigant Research
1.4.3 Turbine Trends
As the offshore wind power market has continued to grow, manufacturers have continued to design
larger and more innovative turbine models to address the specific challenges and design conditions of
the offshore environment. While fewer logistical constraints (relative to onshore projects) have allowed
for larger turbine and blade designs, manufacturers have sought to simultaneously control or reduce
overall project costs through increased reliability and tower top (nacelle plus blades) mass reductions, in
part through alternative drivetrain configurations. While the growth in average nameplate capacity of
installed turbines (as well as blade length and turbine height) has slowed in the past two years,
continued announcements of larger turbine and blade designs suggest that the upward trend will
continue in the near future. The most recent generation of offshore turbine technology comprises multi-
megawatt machines with several different drivetrain configurations specifically designed for offshore
use.

Offshore Wind Market and Economic Analysis Page 26 Document Number DE-EE0005360
1.4.3.1 Turbine Capacity
The average nameplate capacity of offshore wind turbines
jumped substantially from 2010 to 2011 as projects
increasingly deployed 3.6 MW and 5 MW turbines.12 Since
then, however, average turbine size has plateaued around 4
MW. In 2013, 66 units of 5 MW or larger turbines were
deployed, including 18 of Senvion’s 6.15 MW turbine at
Belgium’s Thornton Bank Phase II project site. Figure 1-10
shows the annual average turbine size, weighted by each
project’s share of annual capacity additions, for all global
projects and planned U.S. projects.
Figure 1-10. Average Turbine Size for Historic Global and Planned U.S. Offshore Wind Farms
Note: Average turbine size is based on an annual capacity-weighted figure – each individual turbine installed
is factored into the annual average. For U.S. Planned projects, the range provided reflects that some developers
have not settled on what size turbines they will use. Rest-of-world figures include commercial-scale projects
only; test and demonstration-scale projects are excluded.
Source: Navigant analysis of data provided by NREL and Navigant Research
12 This “capacity-weighted” average accounts for each individual turbine installed at projects globally each year.
The upward trend in average
turbine sizes will likely resume
toward 2018 as developers begin
deploying more 5.0 MW and
larger turbines.

Offshore Wind Market and Economic Analysis Page 27 Document Number DE-EE0005360
Figure 1-10 suggests that this leveling off of average turbine size will likely continue over the next two
years, with the average turbine size for known projects under construction totaling 3.94 MW. For those
projects currently under construction, 45 percent of the installed turbines are expected to be 3.6 MW
machines, while an additional 29 percent will be in the 2.5 to 3.0 MW range. Notably, a majority (about
64 percent) of the smaller (<3.6 MW) turbines currently planned for installation are from Asian
manufacturers for projects in China and South Korea. The 3.6 MW turbines mostly comprise Siemens
machines for which supply agreements were likely signed before the newer 6 MW turbine became
commercially available. This backlog of orders will likely carry through 2015, when Siemens will begin
to ramp-up delivery of its 4.0 and 6.0 MW turbines. In general, the upward trend in average turbine sizes
will likely resume toward 2018 as developers begin deploying more 5.0 MW and larger turbines. As
illustrated in Figure 1-10, this will likely include several U.S. advanced-stage projects, which are
expected to have an average capacity of around 5 MW.
As noted in previous editions of this report, there are several compelling drivers for this scaling of
offshore wind turbines, including the following:
Economies of scale may arise from components that do not vary in cost in direct proportion to
turbine size (e.g., controls) (EWEA 2009a).
Advancements in materials, design, processes, and logistics have also allowed manufacturers to
build larger components while lowering system costs (EWEA 2009a).
Higher hub heights and larger rotors enable significant energy capture improvements (Lantz,
Wiser, and Hand 2012).
Offshore wind turbines avoid many of the size constraints of land-based turbines, due to the
potential for portside manufacturing and marine transport.
Greater turbine size enables fewer units to achieve the same installed capacity, helping to reduce
total installation, balance of plant, and expected O&M costs on a $/kW or $/kWh basis (van
Bussel and Bierbooms 2003).
Given these drivers, turbine scaling is expected to play an important role in offshore wind technology,
and turbine manufactures are actively developing new, larger models in a bid to capture a greater share
of the growing market. As of 2013, seven companies had commercially available offshore turbines in the
5.0 to 6.15 MW range, including Alstom, Areva, Bard, XEMC Darwind, Senvion, Siemens, and Sinovel.
While manufacturers are expected to introduce additional turbines in this range, some are looking to
push the range even higher in the next two years, including Mingyang (6.5 MW), Mitsubishi (7 MW),
Samsung (7 MW), and Vestas (8 MW) (Navigant Research 2014). The largest of these turbines, the Vestas
V164, had a prototype installed in January 2014 and received its first commercial order in February, with
DONG Energy selecting the turbine for its extension of the Burbo Bank project in the U.K. (Smith 2014).
In late 2013, Areva also announced that it is working on an 8 MW offshore turbine model, while others
report that they are pursuing designs in the 10 to 15 MW range (Navigant Research 2014).
While these announcements suggest some continuous improvement and achievement in turbine design,
the development of these larger machines requires a vast array of technical innovations throughout the
turbine as well as in foundations, installation strategies, balance of plant equipment, and O&M practices.

Offshore Wind Market and Economic Analysis Page 28 Document Number DE-EE0005360
To some degree, limitations in these other areas may serve to block, or at least slow, the growth in
turbine capacities. For example, advancements in manufacturing will be needed as the castings and
bearings for such large turbines push the limits of existing foundries and other players in the wind
supply chain. New foundation designs, vessel capabilities, and innovative staging and assembly
strategies will likely be as important as the development of future generations of wind turbines.
1.4.3.2 Hub Height and Rotor Diameter
As with average turbine size, the trends toward increasing hub heights and large blade designs appear
to be slowing, though likely only temporarily. Figure 1-11 and Figure 1-12 show the hub height and rotor
diameters, respectively, of global offshore wind projects over time.
Figure 1-11. Global Offshore Wind Plant Hub Heights over Time
Note: Plant hub heights are shown for the year each project reached completion.
Multi-phase projects were combined to show a single hub height and are reported
for the latest year turbines were added. Figure includes commercial-scale projects;
test and demonstration-scale projects are excluded.
Source: Navigant analysis of data provided by NREL and Navigant Research
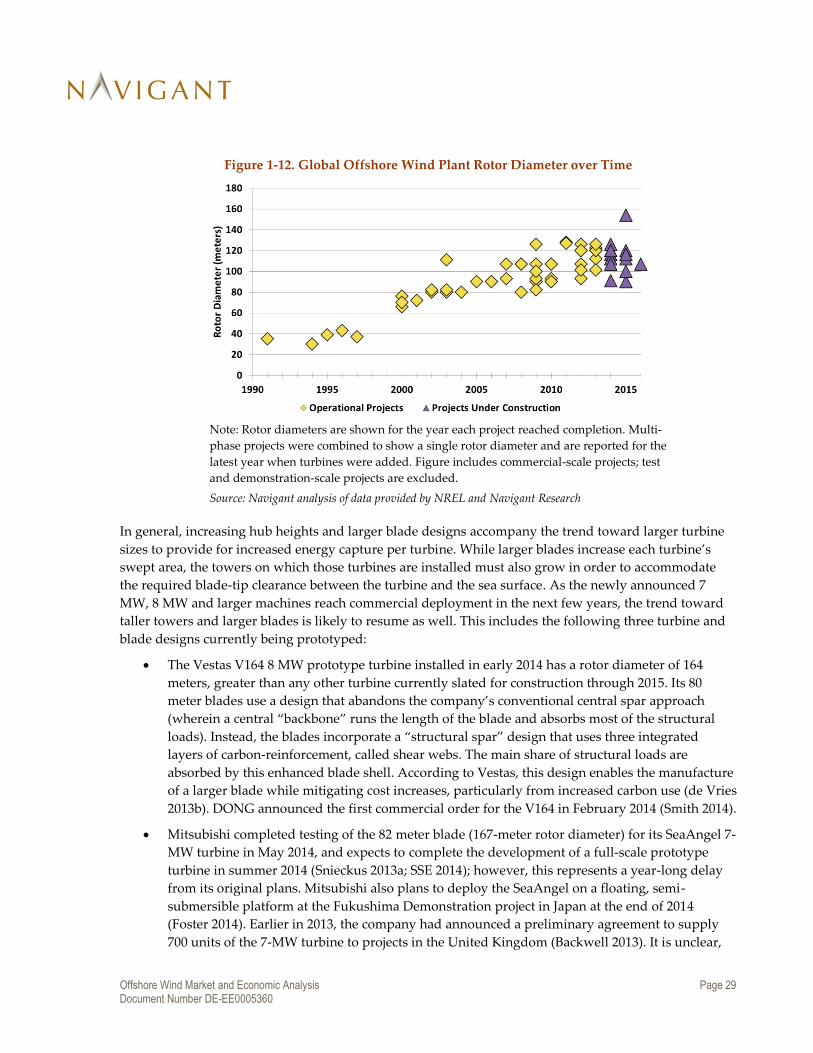
Offshore Wind Market and Economic Analysis Page 29 Document Number DE-EE0005360
Figure 1-12. Global Offshore Wind Plant Rotor Diameter over Time
Note: Rotor diameters are shown for the year each project reached completion. Multi-
phase projects were combined to show a single rotor diameter and are reported for the
latest year when turbines were added. Figure includes commercial-scale projects; test
and demonstration-scale projects are excluded.
Source: Navigant analysis of data provided by NREL and Navigant Research
In general, increasing hub heights and larger blade designs accompany the trend toward larger turbine
sizes to provide for increased energy capture per turbine. While larger blades increase each turbine’s
swept area, the towers on which those turbines are installed must also grow in order to accommodate
the required blade-tip clearance between the turbine and the sea surface. As the newly announced 7
MW, 8 MW and larger machines reach commercial deployment in the next few years, the trend toward
taller towers and larger blades is likely to resume as well. This includes the following three turbine and
blade designs currently being prototyped:
The Vestas V164 8 MW prototype turbine installed in early 2014 has a rotor diameter of 164
meters, greater than any other turbine currently slated for construction through 2015. Its 80
meter blades use a design that abandons the company’s conventional central spar approach
(wherein a central “backbone” runs the length of the blade and absorbs most of the structural
loads). Instead, the blades incorporate a “structural spar” design that uses three integrated
layers of carbon-reinforcement, called shear webs. The main share of structural loads are
absorbed by this enhanced blade shell. According to Vestas, this design enables the manufacture
of a larger blade while mitigating cost increases, particularly from increased carbon use (de Vries
2013b). DONG announced the first commercial order for the V164 in February 2014 (Smith 2014).
Mitsubishi completed testing of the 82 meter blade (167-meter rotor diameter) for its SeaAngel 7-
MW turbine in May 2014, and expects to complete the development of a full-scale prototype
turbine in summer 2014 (Snieckus 2013a; SSE 2014); however, this represents a year-long delay
from its original plans. Mitsubishi also plans to deploy the SeaAngel on a floating, semi-
submersible platform at the Fukushima Demonstration project in Japan at the end of 2014
(Foster 2014). Earlier in 2013, the company had announced a preliminary agreement to supply
700 units of the 7-MW turbine to projects in the United Kingdom (Backwell 2013). It is unclear,

Offshore Wind Market and Economic Analysis Page 30 Document Number DE-EE0005360
however, whether that agreement will change due to the delays in deployment and testing of the
prototype or Mitsubishi’s subsequent joint venture with Vestas (which the companies
announced in September 2013). Like the Vestas blade, the Mitsubishi blade incorporates carbon-
reinforced epoxy resin into its design to reduce weight (de Vries 2013b).
The Samsung S7.0-171 prototype turbine was commissioned in June 2014 at the Fife Energy Park
in Scotland (PE 2013). The blade, developed by SSP Technology, also uses carbon and holds the
current record for the longest blade ever produced at 83.5 meters (171-meter rotor diameter). The
blade is part of Samsung’s 7-MW turbine, which is expected to be deployed in 2015 in South
Korea’s first offshore wind plant (CompositeWorld 2013).
1.4.3.3 Drivetrain Characteristics
The shift to more distant locations and larger capacity turbines, along with a desire to minimize tower
top mass, has driven continued innovation in drivetrain configurations. As shown in Figure 1-13,
offshore wind turbines have historically used a conventional drivetrain design, incorporating a high-
speed, asynchronous generator (i.e., an induction generator) and a three-stage gearbox.
Figure 1-13. Share of Cumulative Installed Offshore Wind Capacity by Drivetrain Configuration
(through 2013)
Note: Figure only includes commercial-scale offshore wind projects. It does not
include pilot or prototype projects.
Source: Navigant analysis of data provided by NREL and Navigant Research
Figure 1-13 shows that 97 percent of offshore wind turbines installed in commercial-scale projects have
conventional high-speed drivetrain architectures. Other configurations, such as direct-drive and
medium-speed drivetrains, have been limited to a combined 3 percent market share of cumulative
installed capacity. Deployment of turbines with alternative drivetrain configurations will likely increase
significantly over the next several years, as the new 5 to 8 MW class turbine models from Siemens,
Vestas, Areva, Alstom, and Mitsubishi are installed at commercial projects (Miller 2014).
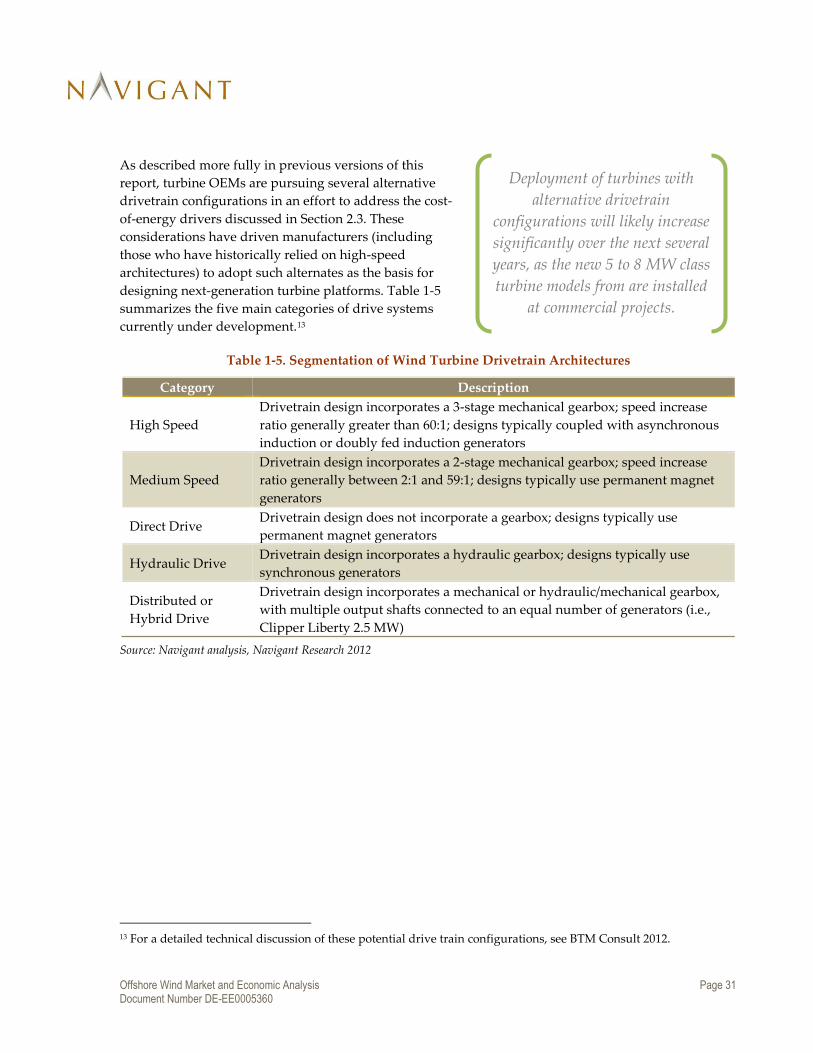
Offshore Wind Market and Economic Analysis Page 31 Document Number DE-EE0005360
As described more fully in previous versions of this
report, turbine OEMs are pursuing several alternative
drivetrain configurations in an effort to address the cost-
of-energy drivers discussed in Section 2.3. These
considerations have driven manufacturers (including
those who have historically relied on high-speed
architectures) to adopt such alternates as the basis for
designing next-generation turbine platforms. Table 1-5
summarizes the five main categories of drive systems
currently under development.13
Table 1-5. Segmentation of Wind Turbine Drivetrain Architectures
Category Description
High Speed
Drivetrain design incorporates a 3-stage mechanical gearbox; speed increase
ratio generally greater than 60:1; designs typically coupled with asynchronous
induction or doubly fed induction generators
Medium Speed
Drivetrain design incorporates a 2-stage mechanical gearbox; speed increase
ratio generally between 2:1 and 59:1; designs typically use permanent magnet
generators
Direct Drive Drivetrain design does not incorporate a gearbox; designs typically use
permanent magnet generators
Hydraulic Drive Drivetrain design incorporates a hydraulic gearbox; designs typically use
synchronous generators
Distributed or
Hybrid Drive
Drivetrain design incorporates a mechanical or hydraulic/mechanical gearbox,
with multiple output shafts connected to an equal number of generators (i.e.,
Clipper Liberty 2.5 MW)
Source: Navigant analysis, Navigant Research 2012
13 For a detailed technical discussion of these potential drive train configurations, see BTM Consult 2012.
Deployment of turbines with
alternative drivetrain
configurations will likely increase
significantly over the next several
years, as the new 5 to 8 MW class
turbine models from are installed
at commercial projects.

Offshore Wind Market and Economic Analysis Page 32 Document Number DE-EE0005360
Figure 1-14 illustrates the evolution of drivetrain systems for offshore wind turbines, highlighting the
parallel trends in increasing turbine capacity and changing drivetrain configurations since 2000.
Figure 1-14. Offshore Wind Turbine Prototypes by Drivetrain Configuration and Year of First
Offshore Deployment
Note: Deployments after 2013 based upon wind turbine manufacturers’ announced
schedules.
Source: NREL data
As shown, the average size of next-generation machines aligns with the continuing trend toward larger
turbines. The wide spread of rated capacity (between 3 MW and 8 MW) for turbines currently under
development reflects manufacturers’ divergent design approaches and internal philosophies for how
best to meet customer demands while minimizing manufacturing costs. Each architecture offers its own
set of advantages, and the diversity of proposed solutions suggests that an optimal approach for offshore
machines has yet to be established.
1.4.4 Support Structure Trends
The past year has seen a continued trend for substructure design innovations, as the challenges of
installing larger turbines, siting projects in deeper waters, and the need to reduce installed costs persist.
While much of the focus in recent years has been on alternatives to the conventional monopile approach
(due to various limitations), the advent of the extra-large (XL) monopile (suitable of 45 m water depth)
may have somewhat lessened the impetus for significant change. Regardless, the optimal type of
substructure (and the potential for innovation) is largely driven by site-specific factors, and plenty of
opportunity remains for new designs that can address developers’ unique combinations of needs.
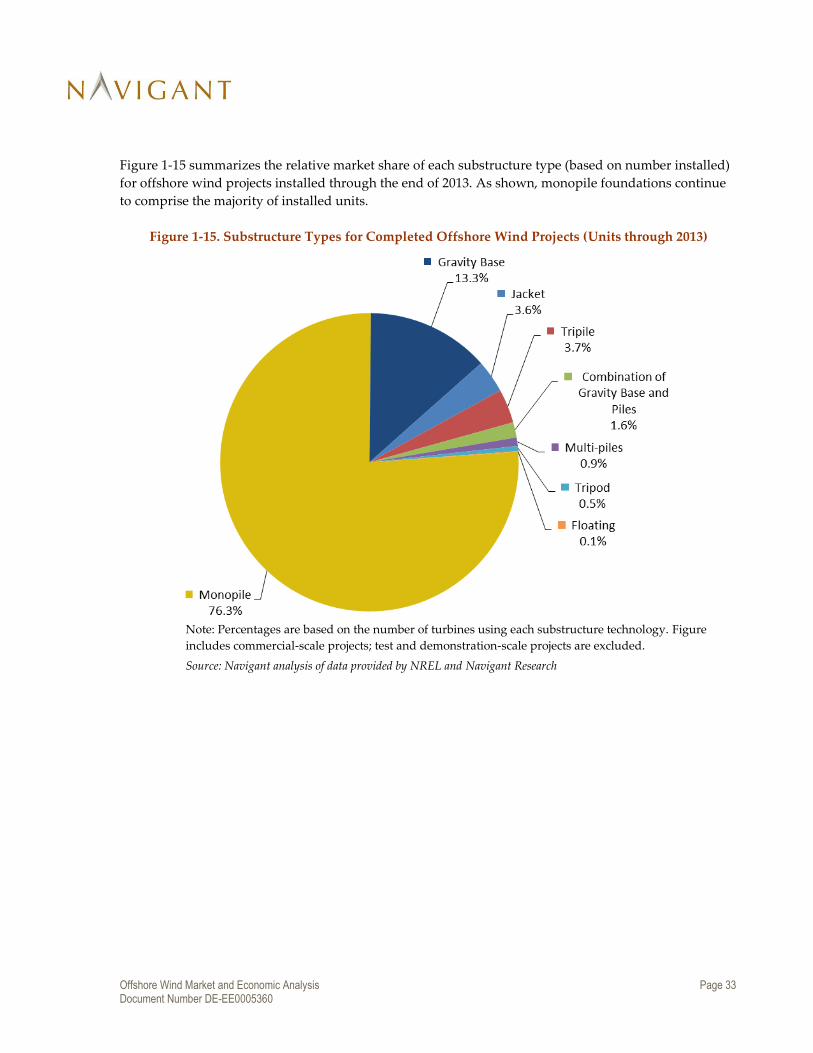
Offshore Wind Market and Economic Analysis Page 33 Document Number DE-EE0005360
Figure 1-15 summarizes the relative market share of each substructure type (based on number installed)
for offshore wind projects installed through the end of 2013. As shown, monopile foundations continue
to comprise the majority of installed units.
Figure 1-15. Substructure Types for Completed Offshore Wind Projects (Units through 2013)
Note: Percentages are based on the number of turbines using each substructure technology. Figure
includes commercial-scale projects; test and demonstration-scale projects are excluded.
Source: Navigant analysis of data provided by NREL and Navigant Research
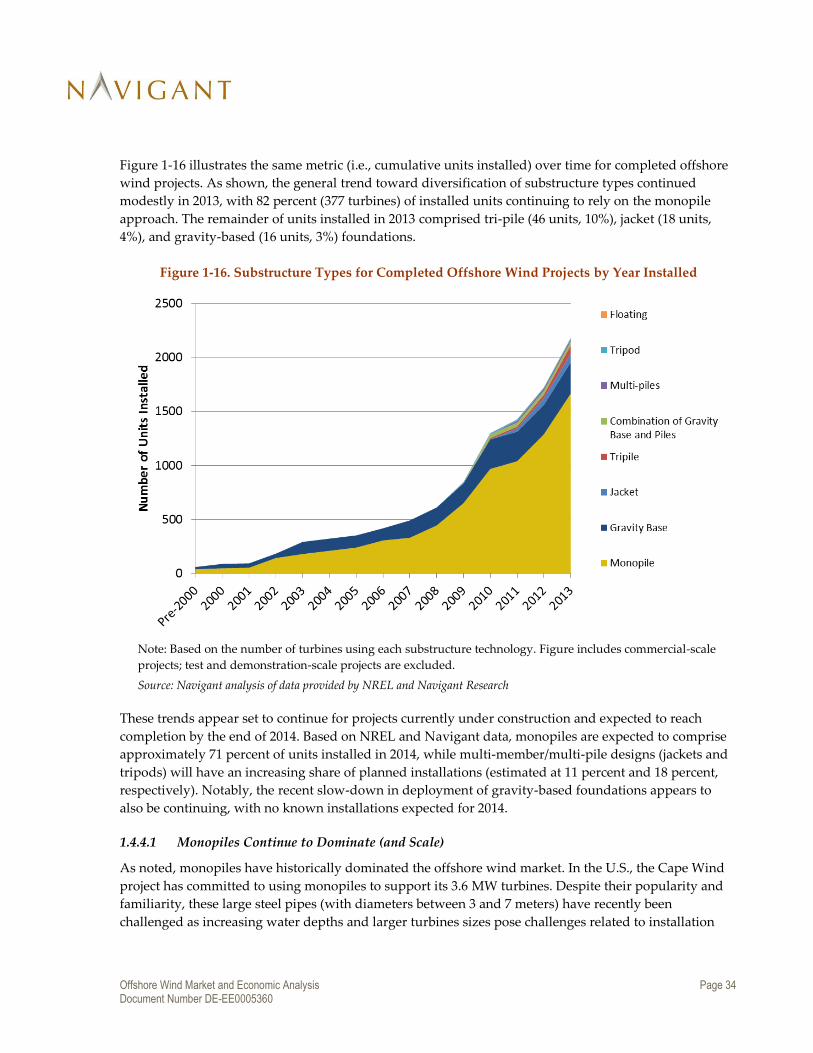
Offshore Wind Market and Economic Analysis Page 34 Document Number DE-EE0005360
Figure 1-16 illustrates the same metric (i.e., cumulative units installed) over time for completed offshore
wind projects. As shown, the general trend toward diversification of substructure types continued
modestly in 2013, with 82 percent (377 turbines) of installed units continuing to rely on the monopile
approach. The remainder of units installed in 2013 comprised tri-pile (46 units, 10%), jacket (18 units,
4%), and gravity-based (16 units, 3%) foundations.
Figure 1-16. Substructure Types for Completed Offshore Wind Projects by Year Installed
Note: Based on the number of turbines using each substructure technology. Figure includes commercial-scale
projects; test and demonstration-scale projects are excluded.
Source: Navigant analysis of data provided by NREL and Navigant Research
These trends appear set to continue for projects currently under construction and expected to reach
completion by the end of 2014. Based on NREL and Navigant data, monopiles are expected to comprise
approximately 71 percent of units installed in 2014, while multi-member/multi-pile designs (jackets and
tripods) will have an increasing share of planned installations (estimated at 11 percent and 18 percent,
respectively). Notably, the recent slow-down in deployment of gravity-based foundations appears to
also be continuing, with no known installations expected for 2014.
1.4.4.1 Monopiles Continue to Dominate (and Scale)
As noted, monopiles have historically dominated the offshore wind market. In the U.S., the Cape Wind
project has committed to using monopiles to support its 3.6 MW turbines. Despite their popularity and
familiarity, these large steel pipes (with diameters between 3 and 7 meters) have recently been
challenged as increasing water depths and larger turbines sizes pose challenges related to installation
Offshore Wind Market and Economic Analysis Page 35 Document Number DE-EE0005360
logistics, turbine design, and material costs. In 2013, however, it appears that these issues may have been
at least partially addressed by the introduction of the XL monopile.
In July 2013, EEW Special Pipe Construction, a major monopile supplier, purchased and demonstrated
new fabrication equipment capable of rolling 10-meter diameter piles (Snieckus 2013b). In October 2013,
the company shipped its first batch of 39 XL monopiles (albeit of a lesser, 6.5-meter diameter) for
EnBW’s Baltic 2 wind farm, where they will be installed in depths up to 35 meters and support Siemens
3.6 MW turbines (Snieckus 2013c). In early 2014, the firm also announced supply agreements to supply
DONG Energy’s Gode 1 and 2 offshore wind farms, which will use Siemens 6.0 MW turbines located in
water depths of 25 to 35 meters (OffshoreWind.biz 2014b). Some industry experts postulate that XL
monopiles could even be used in water depths up to 60 meters (Daubney 2013).
Despite the potential benefits of these XL monopiles, there may still be challenges to overcome. For
example, as they continue to increase in size, these larger foundations may encounter limitations in the
vessels that can handle their greater size, weight and diameter, which exceed the capabilities of available
piling hammers (IHC Merwede 2012, A2SEA 2014). In addition, some projects have encountered
limitations (some imposed, others voluntarily agreed to) related to monopile installation, including on
what times of day or parts of the year they can drive piles based on concerns about the noise and
vibrations’ effects on both the public and marine life (Kuffner 2014).
1.4.4.2 Multi-piles Lead to Broader Diversity in Design Approaches
For sites in deeper water (from 25 to 60 meters), or with 5 MW and larger turbines, developers have
historically shown a preference for multi-pile designs (e.g., jackets and tripods). Jacket structures derive
from the common fixed-bottom offshore oilrig design, relying on a three- or four-sided lattice-framed
structure that is “pinned” to the seabed using four smaller pilings, with one in each corner of the
structure (EWEA 2011; Chapman et al. 2012). The tripod structure utilizes a three-legged structure
assembled from steel tubing with a central shaft that consists of the transition piece and the turbine
tower (EWEA 2011). Like jackets, the tripod is also pinned to the seabed with smaller pilings. The tri-
pile, a related foundation type, uses three pilings tied together by a central transition piece above the
surface of the water (EWEA 2011).
Of these three multi-pile designs, jackets entail significantly more fabrication and assembly due to a
large number of required welds, but are less material intensive than either tripod or tri-pile designs
(EWEA 2011). Experience gained through deployment has
shown that pre-piled jackets have been much less costly to
deploy than either tripods or tri-piles. Thus far, low annual
production volumes for multi-pile substructures (less than
100 jackets have been installed, compared to more than 1,000
monopiles), has prevented the optimization of fabrication
yards. As a result, each foundation requires a relatively high
amount of manual labor to fabricate, which has a large
impact on delivered cost.
While the advent of the XL
monopile may be offsetting a shift
toward multi-pile designs to some
degree, it is likely that multi-pile
substructures will continue to gain
market acceptance.

Offshore Wind Market and Economic Analysis Page 36 Document Number DE-EE0005360
While the advent of the XL monopile may be offsetting a shift toward multi-pile designs to some degree,
it is likely that multi-pile substructures will continue to gain market acceptance, especially in water
depths greater than 30 meters and at sites with challenging subsea soil conditions. In addition, several
companies are developing new designs to address some of the disadvantages associated with more
conventional multi-pile designs. Keystone Engineering, for example, is developing an Inward Battered
Guide Structure (IBGS), or “twisted jacket,” which it claims offers a 20-percent weight reduction relative
to a standard four-leg jacket and has fewer welds to improve manufacturability. This twisted jacket was
used to support a met tower at the Hornsea development zone in the U.K. and has been selected as the
preferred design for the 12-MW Dominion and the 25-MW Fishermen’s demonstration projects in the
United States (Keystone 2014; DOE 2014). DONG Energy and SPT Offshore, supported by the U.K.’s
Carbon Trust, will deploy an innovative three-legged jacket in 2014 at its Borkum Riffgrund 1 project in
Germany (Carbon Trust 2014). This foundation differs substantially from conventional designs in that it
is anchored to the seafloor using suction bucket technology instead of driven piles. This design helps to
reduce installation costs while eliminating the environmental impacts associated with noise emissions
from pilling. Siemens has also filed patents for a jacket design that would replace welded node
connections with bolted connections to reduce labor requirements in manufacturing.
While promising, many of these new jacket concepts are still in the demonstration phase, and the
designs have yet to be verified. Such verification will be an essential step before the foundations can be
adopted for commercial offshore wind and will help to validate the claimed cost reduction potential.
There is also a potential near-term risk that the diversity of multi-pile designs that the industry is
considering will pose challenges for industrialized fabrication facilities seeking to efficiently
manufacture large numbers of foundations. Fragmentation of component designs reduces the
predictability of demand and could prevent the industry from achieving sufficient annual volumes
required for fabricators to recover investments.
1.4.4.3 Gravity-Based Designs Encountering Challenges
Gravity-base substructures represent the second most prevalent type of substructure, with a market
share of approximately 15 percent; however, the popularity of gravity bases has recently declined. The
48-MW Kårehamn offshore wind project was completed with gravity-based foundations in 2013, but no
additional projects are currently under construction. Recent experience suggests that conventional
gravity-base designs may encounter difficulties in water depths greater than 15 meters due to several
key challenges:
long fabrication durations to allow for curing of concrete;
high dredging requirements to achieve precise seabed preparation;
reliance on expensive heavy-lift vessels; and
the installation schedules’ high sensitivity to weather conditions.
Despite these challenges, gravity-base technology got a recent boost when EDF Energies Nouvelles,
DONG Energy and Wpd Offshore announced that they would deploy the Seatower Cranefree Gravity®
foundation at the Fécamp offshore wind farm located off the coast of France (Merecicky 2014). The
Seatower foundation is a self-installing foundation that addresses many of the challenges mentioned
above. First, the foundation is designed to be towed to the project site by a spread of three conventional
tugs and lowered to the sea floor by flooding the base, thus reducing dependencies on heavy-lift vessels

Offshore Wind Market and Economic Analysis Page 37 Document Number DE-EE0005360
and minimizing sensitivity to weather conditions. Second, the foundation’s base is outfitted with a steel
skirt that penetrates the seabed during installation and can be filled with concrete. This strategy aims to
minimize the amount of seabed preparation required for each foundation site.
If the Fécamp demonstration is successful and adequately addresses the historical issues with gravity
foundations, it is likely that the technology will see some resurgence in interest. Iberdrola recently
announced that it was considering gravity-based foundations for its 500 MW St-Brieuc project in France
due to geotechnical conditions that would pose challenges for jacket technology (Dodd 2014).
1.4.4.4 Floating Foundations Seek to Expand the Market’s Reach
Interest in floating offshore foundations continues to grow as the industry seeks to mitigate the material
requirements and complex and variable installation requirements of deeper-water project sites. In
addition, despite the prevalence of undeveloped project sites appropriate for current approaches,
governments and developers are also looking toward the vast wind resources available in sites with
deeper waters (those exceeding 60 meters). If successful, floating offshore foundations offer the potential
to open up vast new regions to offshore wind development, while reducing foundation material relative
to deep-water, fixed-bottom foundations; simplifying installation and decommissioning costs. Each of
these attributes has the potential to reduce costs moving forward.
Unfortunately, it will likely take several more years of design, development and testing of potential
floating turbine platforms for the industry to adequately assess the long-term cost implications of
moving to the technology. Notably, several demonstration-scale floating foundation projects are
currently operating, with additional installations planned (see Table 1-4 for a summary of operating and
near-term planned demonstrations). Existing demonstration projects include Statoil’s Hywind 1
(installed in Norway in 2010), Principle Power’s original WindFloat pilot (installed in Portugal in 2011),
and the Kabashima project (installed in Japan in 2013).
The most recent floating demonstration project is the Fukushima Floating Offshore Wind Farm
Demonstration Project, which is sponsored by the Japanese Ministry of Economy, Trade and Industry
(METI). The first phase of this project was completed at the end of 2013 and includes deployment of a 2
MW Hitachi wind turbine on a floating, semi-submersible foundation designed by Mitsui, as well as the
world’s first floating substation, which will transform power to 66 kV for export. The second phase of
the project is scheduled for 2014 and 2015, with plans to deploy two 7MW Mitsubishi SeaAngel turbines
on floating platforms (Bossler 2013). Fabrication of the first semi-submersible platform was completed by
the Mitsubishi Nagasaki Shipyard in June 2014, and deployment of the turbine is scheduled to occur by
the end of 2014.
A second notable demonstration project is the Wave Hub
demonstrator, which is funded by the Energy Technologies
Institute (ETI) in the United Kingdom. It includes an initial
$6 million engineering study of a 6 MW, direct-drive
Alstom turbine, coupled with the Pelastar Tension Leg
Platform designed by Glosten Associates. Based on the
initial study, ETI is prepared to commit up to $33 million to
If successful, floating offshore
foundations offer the potential to
open up vast new regions to offshore
wind development foundations;
simplifying installation and
decommissioning costs.

Offshore Wind Market and Economic Analysis Page 38 Document Number DE-EE0005360
fund the construction and deployment of the integrated system off the U.K.’s southern coast as early as
2015, likely making it the first global deployment of a tension leg platform (Glosten Associates 2013). A
third notable demonstration project is the Hywind II demonstration project off the Scottish cost, where
Statoil plans to deploy five 6 MW turbines on an optimized spar foundation, which should greatly
reduce costs relative to the Hywind I spar by minimizing the specific mass of the hull. The U.K.’s Crown
Estate granted Statoil a commercial lease for the site in November 2013, and the project is scheduled for
commissioning in 2017, which could make it one of the first floating offshore wind arrays (Crown Estate
2013; Statoil 2014). Finally, one of the DOE ATD projects described in Section 1.2.3, Principle Power’s
WindFloat Pacific, also seeks to deploy floating foundations off the coast of Oregon by year-end 2017.
1.4.5 Electrical Infrastructure Trends
In the past year, little has changed with regard to challenges and trends in electrical infrastructure for
offshore wind farms. In general, the electrical infrastructure has historically consisted of combinations of
medium-voltage (nominally 34 kVA) “array” cables that collect power from the wind turbines and
higher-voltage export cables to move the power to shore. A voltage step-up transformer substation
connects the two.
Two key trends that continued in 2013 have relevance to the nascent U.S. market. First is European
countries’ reliance on newly formed, dedicated transmission operation entities responsible for
overseeing the transmission networks that serve multiple projects. This approach may provide some
lessons for the geographically compact distribution of potential wind energy areas of the northeast coast
of the U.S. Second is the continued (but somewhat slowed) shift from high-voltage alternating current
(HVAC) to high-voltage direct current (HVDC) export lines. As developers continue to explore sites
further from shore, and as companies move up the learning curve in installing these more efficient
HVDC lines, the long-term per-unit cost decreases will help improve the overall economics for future
U.S. projects. Each of these two trends is described in more detail in the following subsections.
1.4.5.1 Dedicated Transmission Operators
As the European offshore wind power industry has matured, the density of projects and their associated
transmission networks has also increased. In response, industry and government stakeholders have
taken steps to improve overall costs and efficiencies by taking a more integrated approach to shared
transmission planning and operations. In 2009, the U.K. established a licensed regulatory regime for
offshore transmission, similar to the onshore grid, that provides for competitively selected Offshore
Transmission Owner (OFTO) firms to help develop and offshore transmission infrastructure (DECC
2010). Similarly, Germany requires Transmission System Operators (TSOs) to build out the offshore
transmission systems to connect projects to the land-based grid. In December 2009, nine nations
bordering the North Sea signed the declaration for the North Seas Countries’ Offshore Grid Initiative,
which aimed to coordinate the technical, market, political, and regulatory components of the region’s
offshore electricity infrastructure development.
In the United States, several companies have made efforts to proactively address potential transmission
capacity constraints to facilitate future development and interconnection of offshore wind projects. In
October 2010, Good Energies, Google, and Marubeni announced investment in a $5-billion, 250-mile
offshore transmission backbone along the Atlantic coast of the United States (Malone 2010). The Atlantic

Offshore Wind Market and Economic Analysis Page 39 Document Number DE-EE0005360
Wind Connection consortium received initial FERC approval for the project to receive a return on equity
of 12.59 percent, conditional on it being included in PJM’s regional transmission expansion plan (FERC
2011). In early 2013, the consortium announced that it was moving forward with development of the
project’s first phase along the New Jersey coast. In addition to providing transmission to future offshore
wind energy projects, this $1.8-billion New Jersey Energy Link transmission line will initially help to
address existing transmission constraints in the state’s land-based grid (LaMonica 2013). Notably, this
proposed approach could lessen the project’s overall financial reliance on serving U.S. offshore projects,
many of which continue to face delays and political uncertainty (Goossens 2013). However, as of this
report’s writing, the proposed project was still being evaluated by New Jersey regulators and grid
operator PJM Interconnection.
1.4.5.2 Shift to HVDC Transmission Lines
As projects have moved further from shore, industry interest in HVDC export cables has increased, as
they create lower line losses than conventional HVAC lines. Various complications, however, have
slowed the anticipated shift to HVDC over the past few years. For example, Siemens has suffered from
significant write-offs (totaling €1.1 billion since 2011) for over-budget transmission HVDC projects
intended to link offshore wind farms in the North Sea to the land-based grid (Webb 2014).
Notably, the AC-to-DC converter stations for these projects are enormous, expensive, and present some
new logistical challenges for their construction installation. In June 2014, for example, Drydock World
announced the completion of the DolWin beta HVDC converter platform, one of two major components
for TenneT’s 900-MW DC offshore grid connection in the North Sea. The structure, an adaptation of
semi-submersible offshore oil and gas rigs, weighs approximately 23,000 metric tonnes. The top-side
equipment alone weighed 10,000 tonnes, and its installation onto the substructure established a new
record for heavy lifts. From its construction port in Dubai, the converter station will be loaded onto a
heavy lift vessel for transportation to its commission port in Norway, after which it will be towed to the
project site. (Marine Log 2014).
In response to these recent cost overruns and logistical challenges presented by conversion to HVDC,
some developers are opting to reduce risk by instead running increasingly longer distances with AC
export cables (Simon 2014). In the U.S., the two most advanced U.S. projects, which are relatively near
shore compared to the larger European projects, will rely on conventional AC transmission. Deepwater’s
Block Island project will use a 34.5-kV AC export cable, while Cape Wind, plans to use a 115-kV AC
export cable (Tetra Tech 2012; DOE 2012a).
1.4.6 Logistical and Vessel Trends
While little has changed in installation and vessel trends since the last edition of this report, such issues
will play a key role in the developing U.S. offshore wind market. This section focuses in particular on
recent developments in vessels and logistics strategies in North America, as well as those from overseas
that are expected to affect the U.S. market. In particular, developers and contractors have been working
to create solutions to the limited availability of vessels, which could represent a potentially limiting
factor for the growth rate of the U.S. offshore wind market.

Offshore Wind Market and Economic Analysis Page 40 Document Number DE-EE0005360
The offshore wind project life cycle includes four general phases: pre-construction, construction, project
O&M, and decommissioning. Each of these phases comprises various types of services, each typically
requiring one or more unique types of vessel.14 Recent developments in North America have focused
primarily on vessels used during construction and O&M.
As global demand for vessels to serve the offshore wind market has increased, vessel suppliers and
construction teams have sought to reduce the time required for installation and for transferring
foundations, towers, turbines, and blades to sites farther from shore. In particular, newer jack-up vessels
are demonstrating several key trends, including the following:
Increasing deck space to facilitate storage of more and larger turbine components per trip
Greater crane capacities (i.e., lifting capacity typically greater than 1,000 metric tonnes and hook
heights in excess of 105 meters) to lift increasingly large turbine and substructure components
Increasingly advanced dynamic positioning (DP2 and DP3) systems to increase operational
efficiency and safety
Longer jack-up legs to enable lifting operations in deeper waters
Greater ability to continue operations in increasingly severe sea states (i.e., wave height limit of
at least two meters) to minimize construction downtime
While crane lifting capacity continues to increase, the maximum lifting height appears to be a new key
limitation in selecting the construction vessel, as the trend toward larger rotors and taller towers also
continues (Hashem 2014). In addition, the impact of moving to XL monopiles is not yet fully understood
by the vessel industry; however, there are a few existing vessels capable of lifting these extra-large
monopiles’ extreme weights.
As indicated in this report’s previous editions, U.S. projects and developers face an additional key
consideration in their need to comply with the Jones Act (also known as the Merchant Marine Act of
1920).15 The Jones Act prohibits transfer of merchandise between “points in the U.S.” unless the owner
and crew of the vessel are American as certified by the Secretary of Transportation. However, the
Secretary may approve the use of non-certified vessels upon a finding that no U.S. vessel is suitable and
reasonably available for transportation of a “platform jacket” for an offshore wind farm.16 Currently,
existing specialist vessels capable of offshore foundation and turbine installation are mostly European-
owned and are in high demand for European projects.
14 The full spectrum of vessels that may be needed at various points in the offshore wind life cycle is discussed in the
previous iteration of this annual market assessment, published in October 2013. 15 Section 27 of the Merchant Marine Act of 1920, as amended (46 App. U.S.C. 883). 16 “Platform jacket” is defined as “a single physical component and includes any type of offshore exploration,
development, or production structure or component thereof, including platform jackets, tension leg or SPAR
platform superstructures (including the deck, drilling rig and support utilities, and supporting structure), hull
(including vertical legs and connecting pontoons or vertical cylinder), tower and base sections of a platform jacket,
jacket structures, and deck modules (known as “topsides”). 46 App. U.S.C. 883.
Offshore Wind Market and Economic Analysis Page 41 Document Number DE-EE0005360
Some U.S.-based vessel owners and operators have begun efforts to position themselves to serve the U.S.
offshore wind power market. Cranford, NJ-based Weeks Marine, for example, has launched the hull and
is currently outfitting the R.D. MacDonald, a jack-up barge intended for U.S. projects (OffshoreWind.biz
2012). In addition, vessels initially used in other industries,
like Titan Salvage's lift boats Karlissa and Montco Offshore's
Lift Boat Robert, have been identified as capable of installing
turbines (Montco 2014). While these vessels may not be as
optimized and self-sufficient as the turbine installation
vessels in Europe, they have the potential to install initial
projects proposed in US waters.
In addition to traditional bottom-fixed installations, developers are also investigating ways to reduce
dependence on installation vessels. The University of Maine deployed the first (pilot-scale) floating wind
turbine in U.S. waters in May 2013; this turbine was fully fabricated on shore and towed to the
installation site. The DOE has also supported to varying degrees a number of floating demonstration
projects, including UMaine's VolturnUS, Statoil's Hywind, Principle Power's WindFloat Pacific and
Technology Development projects by Alstom, Clear Path Energy, Nautica, Pelastar and Texas A&M
(DOE 2012b). As discussed in Section 1.2.3, Principle Power was awarded continued funding from DOE
for its WindFloat Pacific demonstration project in May 2014. The WindFloat foundation and turbine will
be fully outfitted quayside at the installation port and towed into place.
Other strategies being pursued include bottom-fixed foundations that are floating or semi-floating
during transit to the installation site. For example, Freshwater Wind's Shallow Water Wind Optimization
for the proposed Great Lakes project relies on semi-floating, gravity-based foundation technology to
eliminate the need for installation vessels during foundation installation. Note, however, that these
projects would still require "traditional" jack up vessels to install the turbines.
Despite these developments and innovative near-term strategies, a thriving U.S. offshore wind market
will likely require the development of a more robust domestic fleet.
1.4.7 Operations and Maintenance (O&M) Trends
As highlighted in previous sections, the focus on increased reliability, larger turbines, and increased
capacity factors should all contribute to relative reductions in O&M requirements. In particular, larger
capacity turbines should lead to a lower maintenance cost per MWh generated. However, a general lack
of O&M data for the still relatively young offshore wind industry (most turbines are still under
warranty) make it difficult to draw any broad conclusions
about the expected long-term costs and trends of O&M
offshore wind farms.
Apart from turbine design considerations, a few key trends
have emerged over the past few years that bear mention. In
particular, some manufacturers have entered into long-term
servicing contracts with project owners (in addition to
Some U.S.-based vessel owners
and operators have begun efforts to
position themselves to serve the
U.S. offshore wind power market.
Some manufacturers have entered
into long-term servicing contracts
with project owners, signaling an
increased willingness to share in
the operational risks of the project.
Offshore Wind Market and Economic Analysis Page 42 Document Number DE-EE0005360
standard equipment warranty coverage), signaling an increased willingness to share in the operational
risks of the project. In May 2014, for example, Siemens agreed to its biggest ever service contract as part
of a $2.1-billion contract to supply turbines to the 600 MW Gemini project in the Netherlands. The
agreement will last 15 years and includes a dedicated ship and helicopter (Webb 2014). Notably, Siemens
has a 20 percent equity stake in the project. Siemens signed a similar service agreement with the Cape
Wind project as part of that turbine supply contract (Business Wire 2013).
Another recent development was the announcement by Offshore Wind Solutions GmbH (OWS) in early
2014 to assume responsibility for the operation and servicing of the BARD Offshore 1 Wind Farm. The
project’s developer, Bard Group, had announced its plan to cease operations in mid-2014 due to a lack of
new offshore wind contracts. In turn, OWS stepped in to take over the operations and service aspects of
the project, for which it will hire on many of Bard’s current employees (OffshoreWind.biz 2013a). The
move may signal the development of additional third-party firms that are dedicated specifically to
turbine O&M.
In a final note specific to the U.S. market, there is evidence that some agencies have started looking to
identify suitable O&M ports on the Atlantic Coast, building on previous DOE efforts to develop a
framework for port assessment (Elkinton et al. 2013). In April 2014, for example, the Maryland Energy
Administration issued a request for proposals for a state-specific port infrastructure assessment to
identify potential O&M ports to serve future projects to be developed in the Maryland WEA (MEA
2014).
1.5 Financing Trends
The wind power market, including land-based wind, has historically faced financing challenges. For the
U.S. market in particular, the federal tax credit-based incentive mechanism has typically required the
support of tax equity investors. In addition, the offshore wind industry entails additional risks relative to
land-based wind that make securing financing more challenging. For example, additional technology
risk arises from the newer multi-megawatt turbines, given their relatively short operating history, as
well as from new foundation types and HVDC transmission lines. Weather and supply chain constraints
may also add additional construction and operating risk. Furthermore, regulatory risk will exist in some
jurisdictions until clearly defined regimes for permitting and transmission development are established.
As a result, lenders charge risk premiums over the market interest rates for land-based projects to
compensate for the project risk they bear.
In the U.S., the Cape Wind project has made notable progress since late 2013, having secured at least $1
billion of its estimated $2.6 billion financing needs and secured a conditional $150-million DOE loan
guarantee. Globally, 2013 was a transition year for financing,
as regulatory instability in both the UK and Germany led to
fewer projects being launched. However, transactions related
to operating assets were numerous, reflecting the continued
increase in installed capacity, and overall financing volume
was stable compared to previous years. Altogether, non-
recourse debt finance for offshore wind reached €2.13 billion
in 2013, an increase compared to 2012, during which non-
Globally, 2013 was a transition
year for financing, as regulatory
instability in both the UK and
Germany led to fewer projects
being launched.

Offshore Wind Market and Economic Analysis Page 43 Document Number DE-EE0005360
recourse debt financing totaled €1.93 billion. The total amount in 2011 of €2.33 billion was slightly higher
than 2013. Over the past three years, project finance funding has represented around 40 percent of the
net amount invested in offshore wind for the construction of new wind farms.
1.5.1 Rising Capital Requirements
With projects increasing in size, and despite slight reduction in construction cost per MW, the funding
need for offshore wind projects has continued to increase. The increasing size of offshore wind projects
also puts pressure on contractors’ balance sheets, particularly when a project is large compared to a
contractor’s size. This increased funding need results in the market looking for alternative means of
financing or developing new solutions (see Section 1.5.7).
1.5.2 Utility On-balance Sheet Financing
Until 2012, most offshore wind projects were financed on the balance sheets of their developers,
generally utilities. Through October 2012, 85 percent of cumulative installed offshore wind capacity was
operated by utilities such as DONG Energy, Vattenfall, RWE, and E.ON (Navigant Research 2012). To
date, utilities have financed €12.3 billion of the €16 billion spent to build about 5 GW of operating
capacity for which detailed financing data are available. However, even though balance-sheet financing
costs less than project financing—and is less time-consuming due to a lighter due diligence process—the
capital requirements for ever-larger projects like those in U.K. Round 3 have begun to strain the on-
balance sheet financing capacity of these utilities. As a result, utilities are investigating alternative
financing options.
1.5.3 Project Finance
Despite investors’ increased risk aversion during and following the 2008 financial crisis (from which
countries are now slowly recovering), the offshore wind industry suffered less than some other markets.
Sufficient funding for well-structured projects remained available, in part from the support of
multilaterals and export credit agencies. Today, most banks continue to focus on Western European
countries, which benefit from current projects’ longer operating history and relatively strong
government support (e.g., Germany, Belgium and the United Kingdom).

Offshore Wind Market and Economic Analysis Page 44 Document Number DE-EE0005360
Projects that have secured non-recourse financing appeared insensitive to the effect of the financial crisis.
The first offshore wind farm financed with non-recourse debt was the Princess Amalia Wind Farm
(formerly Q7) in the Netherlands in 2006. It was followed by the C-Power phase 1 project in Belgium in
2007, which showed that larger turbines (the REpower 5M) were also bankable. In the midst of the
financial crisis in 2009, Belgium’s Belwind wind farm demonstrated that larger projects (in this case,
165 MW) were bankable and that they could be supported through multilateral involvement (e.g.,
European Investment Bank [EIB] or Eksport Kredit Fonden [EKF]). Also in 2009, the UK saw its first
project-financed deal with the refinancing of Centrica’s Boreas project, which involved the participation
of 14 banks. Figure 1-17 summarizes these and other key financings for offshore wind projects since
2006.
Figure 1-17. Financing of Offshore Wind Farms: 2006 to 2013 (MEUR)
Source: Green Giraffe Energy Bankers, Int.
As the global market weathered the recession, project financing deals continued to expand and achieve
notable milestones. In 2010, for example, C-Power phase 2 and 3 was the first project to receive over €1
billion in financing. This two-year period also saw the project financing of a number of German offshore
wind farms. The 200-MW Borkum West 2 project saw the first financing of Areva’s 5-MW turbines, while
the 288-MW Meerwind project was the first to include construction risk for Siemens turbines, the first to
include a private-equity investor (Blackstone), and the first under the German Development Bank’s
(KfW) offshore wind program. In 2011, the Global Tech I wind farm became the first to achieve the 400-
MW mark.
In 2012, key developments focused on the U.K. market, with more than 530 MW of projects (Lincs,
270 MW; Gunfleet Sands, 172 MW; and Walney, 92 MW) financed on a non-recourse basis. Notably, the

Offshore Wind Market and Economic Analysis Page 45 Document Number DE-EE0005360
Walney project was the first non-recourse refinancing of a minority share on the basis of commercial
project financing terms. This structure is unique in the sense that the project financing is not at the
project level (where the producing assets are), but rather one step above at the shareholder level. The
purpose of this structure was to broaden the universe of potential buyers of minority shares in
operational wind farms to include players who need the debt financing to reduce the size of their equity
commitment and/or increase their equity returns. Such structures could be replicated on future
transactions. In 2013, the refinancing of Masdar’s stake in the London Array project in the UK, the largest
offshore project in the world, confirmed the development of a secondary market in operating offshore
wind farms assets.
Also in 2013, the financing of the Butendiek project, one of Germany’s earliest offshore wind projects to
be developed, involved EIB, EKF and KfW (under its offshore wind programme) as well as nine
commercial banks. This arrangement followed the conventional pattern of mixing public and private
funding under a market-tested structure and a simultaneous equity transaction. Notably, this was the
first project where pension funds and infrastructure funds took full construction risk for an offshore
wind project, a welcome development for an industry that is looking to attract additional investment
sources. This development also reveals the financial markets’ improved understanding of the risks
associated with construction at sea. Previously, German offshore wind project development had slowed
due to regulatory uncertainties linked to grid connection availability for future wind farms. Reaching
financial close for the Butendiek project came as a positive signal for offshore wind in general, as it
signaled that good projects can overcome these kinds of issues and eventually complete the financing
process.
In another positive sign, in June 2014, Green Giraffe Energy Bankers announced the finance closing of
the 600 MW Gemini offshore wind project in the Netherlands. The €3 billion transaction included a non-
recourse debt financing of €2.1 million from a group of 16 international and public banks and the
associated equity commitments from a sponsor group
comprising Northland Power (60 percent), Siemens (20
percent) Van Oord (10 percent) and HVC (10 percent).
The financing was the largest ever for an offshore wind
farm and was arranged in record time – after the equity
group committed in August 2013 and the banking market
was approached in November 2013, the project reached
financial close in less than seven months.
1.5.4 Multiparty Financing
While a single entity finances most land-based wind farms, the multibillion-dollar offshore projects
generally involve co-investment by consortia for risk-sharing and pooling of resources and expertise. For
example, seven of the nine Round 3 development zones in the United Kingdom were awarded to
consortia, and the 9 GW Dogger Bank Zone was awarded to a consortium of four large utilities.
Similarly, projects that have secured project financing (rather than balance sheet financing) have also
generally done so through consortia of many banks and other institutions (see the Gemini description in
Section 1.5.3). Most of the projects closed over the last few years have typically gathered between five
and ten commercial banks, as well as export credit agencies and multilaterals.
The 2014 financing for the 600 MW
Gemini project was the largest ever
for an offshore wind farm and was
arranged in record time.

Offshore Wind Market and Economic Analysis Page 46 Document Number DE-EE0005360
1.5.5 Importance of Government Financial Institutions
For larger projects, the support of government or quasi-government agencies has long been critical. Most
offshore projects that have been project financed in Europe have received support from some
combination of the EIB; the Danish export credit agency, EKF; the German export credit agency, Euler
Hermes (EH); and, most recently, the Green Investment Bank (GIB) in the United Kingdom. Notably,
EKF is also supporting the Cape Wind project in the U.S. through a $600-million loan; the project has
also received U.S. government support via a $150-million loan guarantee from the DOE. The European
export credit agencies could potentially facilitate the financing of U.S.-based projects by supporting
turbine manufacturers, such as Vestas, Siemens, and REpower.
In addition, the availability of €5 billion from the KfW (the Germany development bank) has facilitated
financing for offshore wind projects in Germany. This financing complements other sources, such as the
EIB, other export credit agencies, and commercial banks. The proposed Meerwind wind farm,
mentioned above, is the first offshore project to have reached financial closing under the KfW’s program.
The project is also unique in that it did not include EIB funding. In 2012, the 367-MW Walney project in
the United Kingdom became the first project to receive funding from the United Kingdom’s Green
Investment Bank (GIB). The bank contributed approximately one-fifth of the amount needed for the
refinancing of the project.
In 2013, the public financing institutions mentioned above (EIB, GIB, EKF and KfW) remained active. In
addition to non-recourse debt, EIB also provided corporate financings (such as the €500-million
financing to EnBW for the Baltic 2 project and the €500-million funding to Tennet to build offshore grid
connections three large projects in Germany) and structured support to transactions such as the credit
enhancement bond for the Greater Gabbard OFTO. In the UK, GIB closed its second non-recourse
financing with London Array. While this help from public financial institutions has been crucial in the
past few years, it is likely to be less so as the offshore wind market matures. In 2012, for instance, the
270-MW Lincs project in the United Kingdom received financing from a group of 10 commercial banks
without leveraging any public finance institution funds.
1.5.6 Support from the Supply Chain
Contractors recognize that providing vendor-financing solutions can provide a competitive advantage
and shows their commitment to the project through shared financial risk. Such vendor financing
solutions include providing senior/mezzanine debt, equity investments, subordination of operational
costs, transferring capital expenditures to operational expenses (and vice versa), and guaranteeing pre-
completion revenues. The latter three of these are meant to optimize the senior debt amount. These
solutions have already been applied to various offshore wind financing structures. For example, Siemens
bank was part of the senior debt consortium that project financed the minority stake of the Dutch
investors PGGM and Ampere in 2012. Siemens has also directly invested in projects Gwynt y Mor in
2010 (a 10-percent stake) and, as discussed in Section 1.5.3, invested in the Gemini project (a 20-percent
stake) in 2014. Also, Van Oord provided subordinated debt for the financing of the construction of
Belwind in 2009, as well as a direct investment (10-percent stake) in the Gemini project in 2014.

Offshore Wind Market and Economic Analysis Page 47 Document Number DE-EE0005360
1.5.7 New Financing Sources
As the offshore wind sector matures, new investors, such as infrastructure and pension funds, private
equity groups, and other strategically minded corporations, are also demonstrating interest. These
investors have typically purchased minority stakes in
operating projects in order to avoid construction risk.
DONG Energy has been the primary “seller” of these
minority stakes.
In 2009, EIG Global Energy Partners (formerly TCW
Energy), an infrastructure fund, purchased a 50-percent
stake in a subsidiary of Centrica, which owned the Lynn
(97 MW) and Inner Dowsing (97 MW) projects in the
United Kingdom. In 2010, Dutch pension fund PGGM
joined Ampere Equity Fund to purchase a 24.8-percent stake in the UK’s Walney project. DONG again
sold off a minority stake of a project in 2011, when it sold 50 percent of the Anholt project to two Danish
pension funds, PensionDanmark (30 percent) and Pensionskassernes Administration (PKA, 20 percent).
Other examples of non-traditional offshore wind investors that have entered the market include:
The previously mentioned Meerwind project in Germany included financing from Blackstone, a
U.S.-based private equity firm and the first such firm to participate in an offshore wind project.
In November 2011, the Japanese trading company Marubeni acquired 49.9 percent of the UK’s
Gunfleet Sands project from DONG Energy. This deal marked the first to-date financing of a
majority stake. Marubeni showed a subsequent increase in its offshore wind activity with the
acquisition of Seajacks, a vessel operator, in March 2012, and a 25-percent stake in Mainstream
Renewable Power, an Irish project developer, in August 2012.
In February 2012, DONG Energy sold a 50-percent stake in the 277-MW Borkum Riffgrund I
project in Germany to the parent company of LEGO, a Danish toy company. The company cited
ambitious environmental goals and long-term financial returns as rationale for the investment.
In the summer of 2013, another Japanese conglomerate, Sumitomo, acquired minority stakes in a
Belgian portfolio of two offshore wind farms (totaling 381 MW) from Parkwind for €100 million.
The seller is a holding company jointly owned by an investment company of the Colruyt family
and a Flemish investment firm. Notably, one of the other bidders was IKEA, the Swedish
furniture company who seems to be following the path previously opened by LEGO.
In August of 2013, Northland Power Inc., a leading Canadian producer of sustainable energy,
agreed to be an equity sponsor of the 600-MW Dutch Gemini project.
The Green Energy Transmission consortium’s December 2013 acquisition of the Greater Gabbard
transmission assets was financed through the issue of senior secured project bonds (in an
amount of £305 million), including credit enhancement support provided by the EIB (under a
European Union-supported project to support infrastructure investment). This move set a
precedent for future capital market transactions in the sector and created an additional source of
financing for offshore wind assets.
As the offshore wind sector
matures, new investors, such as
infrastructure and pension funds,
private equity groups, and other
strategically minded corporations,
are also demonstrating interest.
Offshore Wind Market and Economic Analysis Page 48 Document Number DE-EE0005360
1.5.8 Likely Financing Trends for Offshore Wind in the United States
The independent power producers (IPPs) who are predominantly driving the development of U.S.
offshore wind projects are unlikely to self-finance projects through balance sheet financing and will
therefore need access to project financing. The banks likely to participate in these U.S. offshore projects
will initially be the European banks that have past offshore project financing experience, and they will
likely assess U.S. projects in the same way that they assess European projects. However, pricing and
other market conditions may be subject to the terms of the U.S. wind project finance market, which at
times has deviated from those that are typical in Europe. Given the size of proposed offshore wind
projects in the U.S., the support of government agencies (via loans or loan guarantees) could be critical.
As discussed in Chapter 2, offshore wind investors and lenders in Europe rely on support schemes that
provide long-term revenue stream stability, either directly through feed-in tariffs (FiTs) or public
payments, such as green certificates, or indirectly through long-term PPAs made possible by the
underlying regime. Projects in the U.S. to date, such as those in Massachusetts and Rhode Island, rely
upon income received from regulated PPAs that provide a fixed price per MWh produced that is well
above the wholesale price of power. In addition, each of these U.S. projects expects to qualify for the
federal Investment Tax Credit (ITC), an incentive that usually requires the involvement of tax equity
investors with sufficient tax liability to leverage the non-refundable credit.17
Another support regime that has been proposed in New Jersey is the Offshore Wind Renewable Energy
Certificate (OREC) system, which, as a “contract for differences,” is not that different from a FiT.
However, as discussed in Section 1.2.2, it remains to be seen how the state’s Board of Public Utilities will
develop guidelines for applying the OREC system.
Both the PPA and OREC systems are expected to be bankable, as they provide sufficient price support to
make projects economically viable. The European experience shows that many different regulatory
regimes can be successful, as long as the overall price level is compatible with the current installation
costs of offshore wind and there is sufficient regulatory stability to cover the relatively long development
and construction process.
The DOE’s Advanced Technology Demonstration (ATD) project award program has provided additional
useful support to demonstration-scale projects (some with ties to planned commercial-scale projects).
The application process also provided an opportunity to sound the banking market and gauge banks
appetite for offshore wind in the U.S. Based on these “in-principle” responses, there seems to be a
market for offshore wind projects that are able to present secured revenues and a sound cost structure.
17 At the time of this report’s writing, the PTC and ITC had expired at the end of 2013 and had not been renewed.
Only Cape Wind and Deepwater’s Block Island projects represent that they will qualify to apply the credit based on
progress through year-end 2013.

Offshore Wind Market and Economic Analysis Page 49 Document Number DE-EE0005360
1.5.9 Cape Wind Financing
Since the last version of this report, Cape Wind has made inroads in securing an estimated $1 billion in
financing for what analysts expect to amount to a total requirement of $2.6 billion (see Section 1.2.2.3 for
a detailed update). Key developments include the following:
The developer represents that its initial construction activities and supply commitments make
the project eligible to take advantage of the federal Investment Tax Credit, which expired at the
end of 2013.
In February 2014, the developer announced a $600 million loan commitment from Danish export
credit agency EKF.
In March 2014, the developer also announced that Natixis and Rabobank had signed on as lead
arrangers for the project’s remaining financing and that the Bank of Tokyo-Mitsubishi UFJ
(BTMU) would be the coordinating lead arranger of the debt portion of financing, corresponding
to commercial banks.
In July 2014, the DOE announced a conditional $150-million loan guarantee for the project,
contingent on its securing the balance of its project financing. (Engblom 2014).

Offshore Wind Market and Economic Analysis Page 50 Document Number DE-EE0005360
2. Analysis of Policy Developments
This section provides an analysis of state and federal policy developments with the potential to affect
U.S. offshore wind deployment. It includes a description of policies for promoting offshore wind and an
evaluation of policy examples to close any competitive gaps. The evaluation systematically defines the
offshore program objectives (Section 2.1), identifies barriers to meeting the objectives (Section 2.2), and
evaluates examples of policies to address the barriers (Sections 2.3 through 2.6). This section addresses
barriers and policies relating to:
Cost competitiveness of offshore wind energy (Section 2.3)
Infrastructure challenges (Section 2.4)
Regulatory challenges, including leasing, permitting, and operations (Section 2.5)
Summary of representative policies (Section 2.6)

Offshore Wind Market and Economic Analysis Page 51 Document Number DE-EE0005360
The following table summarizes major policy activities that have occurred in 2014 that affect offshore
wind development in various jurisdictions, each of which is discussed in Chapter 2 or in the appendices.
2.1 Offshore Wind Program Objectives
The goals of the U.S. offshore wind program include promoting the development and deployment of
offshore wind energy systems at competitive prices. The aim of this program is to maximize the MW
capacity of manufacturing production in the United States and increase the development of factories and
jobs. Competitive prices achieve a levelized cost of energy (LCOE) at which offshore wind can compete
with other regional generation sources without subsidies.
Summary of Key Findings – Chapter 2
Policies that address cost-competitiveness
o The U.S. PTC and ITC expired for projects that did not begin construction by year-end
2013. The 50% first-year bonus depreciation allowance also expired at the end of 2013.
o The DOE announced three projects that will receive up to $47 million each to complete
engineering and planning, fabrication and construction as the second phase of the Offshore
Wind Advanced Technology Demonstration Program, and two projects that will receive $3
million to continue engineering and design.
o Maryland began promulgating rules for Offshore Wind Renewable Energy Credits
(ORECs) for up to 200 MW and plans to issue a final rule by July 1, 2014.
o The New Jersey Board of Public Utilities rejected a proposal for ORECs by Fishermen’s
Energy for a five-turbine project off Atlantic City, NJ.
o The Maine Public Utility Commission approved a term sheet with a team led by the
University of Maine for a pilot floating wind turbine project.
o The United Kingdom announced the strike prices for land-based and offshore wind
generation through 2019, which should expedite the development of Round 3 projects.
o Spain has made various reductions to its FiT with, in some cases, retroactive effects on
existing projects.
Policies that address infrastructure challenges
o The New German Energy Act clarifies the compensation that projects impacted by grid
delays are entitled to; that law is expected to resolve the grid construction delays.
Policies that address regulatory challenges
o BOEM held competitive lease sales for renewable energy off Maryland and announced
additional competitive lease sales off Massachusetts and New Jersey in 2014 .
o China and Japan announced offshore wind target goals.

Offshore Wind Market and Economic Analysis Page 52 Document Number DE-EE0005360
The DOE’s 2008 report, 20% Wind Energy by 2030, determined that it is feasible for wind power to meet
20 percent of U.S. electricity demand by 2030, which would require wind power capacity to increase to
over 300 GW (DOE 2008). The report projects that the U.S. could install 54 GW of offshore wind by 2030,
with an average levelized cost of energy (LCOE) of 7¢/kWh. While the U.S. may not achieve this level,
and while the DOE is updating its projections in a new report to be issued in 201418, the DOE’s offshore
program aims to address barriers and minimize the LCOE of offshore wind.
In 2010, the DOE instituted the Offshore Wind Innovation and Demonstration Initiative (OSWInD) to
accelerate the development of commercial offshore wind. The OSWInD Initiative focuses on reducing
the cost of offshore wind energy and decreasing the deployment timeline uncertainty. The DOE sees
offshore wind as a method of reducing the nation’s greenhouse gas emissions, diversifying energy
supply, delivering cost-competitive electricity to coastal regions, and stimulating the economy.
The OSWInD initiative will address these objectives through a suite of three focus areas – Technology
Development, Market Barrier Removal, and Advanced Technology Demonstration. The following
section discusses market barriers that affect U.S. offshore wind development, and the policies that
various jurisdictions have considered to address those barriers.
18 DOE has announced that its new Wind Vision Initiative includes three major elements:
• A description of the status of wind technology and the wind business, including the state of wind power today,
what has changed since the 2008 wind vision report was published, and an updated credible national vision for
wind power going forward
• A comprehensive assessment of the national and regional impacts (i.e., benefits and costs) of this wind vision,
based on the best available science and other relevant information
• A roadmap describing what needs to be done in order to achieve the vision, including which sectors must
conduct needed activities, by when and in what sequence, and estimates of resources required

Offshore Wind Market and Economic Analysis Page 53 Document Number DE-EE0005360
2.2 Potential Barriers to Meeting the Objectives
There are three high-level barriers that could impact the achievement of the United States’ offshore wind
objectives. These are cost competitiveness, a lack of infrastructure, and uncertain regulatory processes
and timeline. A summary of these is included in Table 2-1 below. Further detail is provided in Appendix
A.
Table 2-1. Key Offshore Wind Barriers
Cost
Competitiveness
High Capital Cost
High Cost of Energy Produced by Offshore Wind
High Financing Costs Due to Regulatory
Uncertainty and Instability
Technical and
Infrastructure
Lack of Purpose-Built Ports and Vessels
Lack of Domestic Manufacturing
Inexperienced Labor
Insufficient Offshore Transmission Infrastructure
Insufficient Domestic O&M Capabilities
Regulatory
Uncertain Site Selection Process and Timeline
Fragmented Permitting Process
Environmental and Public Resistance
Uncertain Environmental Impacts
Source: Navigant
2.3 Examples of Policies for Addressing the Cost Competitiveness of Offshore Wind
Energy
2.3.1 General Discussion of Policy Examples
As mentioned in Section 2.2 and further described in 5.Appendix A, the high cost of energy produced by
offshore wind is the major contributing factor to the lack of cost competitiveness of the U.S. offshore
wind industry.19 The main driver of cost for offshore wind, a technology where most of the spending is
upfront, is the cost of capital to spread that upfront cost over many years. That cost of capital depends on
several things: the required internal rate of return (IRR) of equity investors and their time horizon; the
ability of the project to tap (cheaper) non-recourse debt; and in such cases, the leverage that can be
reached, and the maturity of such debt. The average cost of capital is a weighted average of the cost of
19 One factor that is helping to improve the cost competitiveness of offshore wind energy is the increasing awareness
that certain market structures recognize the economic value of peak-coincident generation with no fuel costs, such as
offshore wind, which results in substantial savings to most electric ratepayers.

Offshore Wind Market and Economic Analysis Page 54 Document Number DE-EE0005360
equity (IRR) and cost of debt (overall interest rate). IRR can vary quite a lot, from 8%/year for operating
assets to 15+%/year for pre-construction assets, while the cost of debt is typically in the 5-6%/year range.
Lowering the cost of offshore wind means implementing policies that: 1) maximize debt leverage (and,
ideally, for the longest possible tenure), and 2) attract capital with lower IRR requirements. What is
required is a simple and stable regulatory framework:
Lenders are willing to take offshore wind risk, including construction risk, and provide medium
to long term funding, but this requires a regulatory regime that (i) provides sufficient economics
for the project, and (ii) is not subject to later changes in policy. They can typically provide longer
(and cheaper) debt when there is limited price risk (i.e. fixed price PPAs, or FiTs, rather than
pure market mechanisms, and guaranteed access to the grid). That needs to be in place at the
moment of closing.
Investors need to also consider the permitting and development phase in their thinking; they
won’t invest development equity (in the tens of millions of dollars for offshore wind) if they
have no idea of what the regulatory
framework will be when the investment
decision needs to be made, and if they have
no idea of how long it will take them to get
there (i.e. obtain all permits and approvals).
The more uncertainty, the higher their IRR
requirement.
Some of these issues (permitting notably) can depend on multiple regulators but all of them can be acted
upon. Doing so is vital to reducing LCOE as the difference between a favorable regulatory framework
(Germany) and a less favorable one (the UK’s ROCs), can be worth more than $20/MWh, or close to 20%
of the overall cost, just from the difference in financing terms, for technically identical projects.
Support schemes that address cost competitiveness fall under “investment support schemes” (MW-
focused) and “operating support schemes” (MWh-focused). Examples of investment and operating
support schemes are listed below, all of which have been used in European countries that are active in
offshore wind.
2.3.1.1 Investment Support Schemes
Renewable energy is a capital-intensive industrial sector. Investment support schemes have helped
reduce financial burdens for project developers and/or manufacturers via direct or indirect investment
subsidies at the time of construction. These subsidies take the form of the following:
Cash grants, in which part of the investment is paid through public subsidies. This is the
simplest and most direct mechanism.
Loans, which are guaranteed by federal or state governments.
Accelerated depreciation of assets, which leads to higher taxable losses in early years. Investors
with corresponding taxable profits can reduce their tax bills in such years, leading to higher
profitability (linked to the tax rate applicable to such underlying taxable profits). Structures are
Investors won’t invest development
equity if they have no idea of what the
regulatory framework will be when the
investment decision needs to be made.

Offshore Wind Market and Economic Analysis Page 55 Document Number DE-EE0005360
put in place whereby tax investors (with taxable profits) notionally own the project at the time of
investment and share the tax gains from accelerated depreciation with the project’s real investors
in the form of “tax equity” (i.e., the volume of tax depreciation, multiplied by the tax rate, minus
a profit to the remunerator for the use of taxable income).
Tax breaks, low-interest loans, credits, or deductions, all of which are various direct or indirect
structures through the tax code amounting to some combination of the above two mechanisms.
In addition, low-interest loans or other incentive mechanisms are provided for manufacturing to
help reduce hardware costs.
The use of each of these mechanisms in Europe is summarized in Section 2.3.3.1.
2.3.1.2 Operating Support Schemes
Operating support schemes are linked to the actual energy production from renewable energy sources.
There are two main philosophies: one whereby the regulator offers a fixed price to renewable energy
producers (volume is therefore uncertain), and one whereby the regulator sets a target volume for
renewable energy production (in which case the value of the support will vary). The latter category is
typically considered to be more market-oriented.
The following mechanisms are the primary operating support schemes currently in use to support
offshore wind:
Price-driven mechanisms
FiTs
Feed-in premiums
Quantity-based mechanisms
Green certificates
Tendering
The use of each of these mechanisms in Europe is summarized in Section 2.3.3.2.
2.3.2 Current U.S. and State Policies
2.3.2.1 U.S. Policies
The primary vehicles for addressing the cost competitiveness of offshore wind energy at the federal level
are the Renewable Electricity Production Tax Credit (PTC) and the Business Energy Investment Tax
Credit (ITC). Investors in wind projects could choose between these two incentives if they began
construction or made non-refundable investments of 5% of total
project costs by year-end 2013. Most offshore wind project
investors claimed that they would choose the ITC (30 percent of
initial capital cost) over the PTC (approximately $23/MWh for
the first 10 years of operation), because it offers a larger level of
support for offshore wind systems. In 2012 and 2013, the U.S.
Most offshore wind project
investors would choose the
ITC over the PTC.

Offshore Wind Market and Economic Analysis Page 56 Document Number DE-EE0005360
Senate Finance Committee considered the option of offering an ITC for offshore wind that does not
expire until 3,000 MW are claimed. This option would take the place of approving short-term extensions
of the ITC, which would not support the multi-year development process of offshore wind. Although the
Finance Committee is still advocating this proposal as of 2014, no further action has been taken on it.
Another bill approved by the Senate Finance Committee would extend the PTC and ITC retroactively
through 2015, maintaining the same new definition of commencing construction, as part of a
comprehensive tax extenders bill covering 51 other industries. To date, the full Senate has not voted on
this proposal.
Other federal investment support schemes currently in effect include the DOE Loan Guarantee Program
and the Modified Accelerated Cost-Recovery System (MACRS) + Bonus Depreciation. Although the DOE
still has authority to issue loan guarantees under Section 1703 of Title XVII of the Energy Policy Act
(EPAct) of 2005, it has not solicited for new Loan Guarantee applications in several years. Rather, it is
only adjudicating applications that are already pending. The MACRS establishes five years as the time
over which certain renewable energy properties, including wind power, may be depreciated.

Offshore Wind Market and Economic Analysis Page 57 Document Number DE-EE0005360
2.3.2.2 State Policies
Figure 2-1 and Table 2-2 provide a summary of Renewable Portfolio Standards (RPS), policies, requests
for proposal (RFPs), and related activities to address the cost competitiveness of offshore wind energy in
selected U.S. states. Appendix B provides additional details of these activities.
Figure 2-1. Summary of Policies to Address Cost Competitiveness in Selected U.S. States
Source: Navigant analysis

Offshore Wind Market and Economic Analysis Page 58 Document Number DE-EE0005360
Table 2-2. Policies to Address Cost Competitiveness of Offshore Wind in Selected U.S. States
State RPS Offshore Wind RPS Mandatory PPAs RFPs and Other Activity
Delaware 25% by 2025-2026 350% multiplier for the
Renewable Energy Certificate
(REC) value of offshore wind
facilities sited on or before May
31, 2017.
Delmarva Power was directed to
negotiate a long-term PPA with
Bluewater Wind as winner of an all-
resources RFP. However, NRG-
Bluewater Wind failed to make a
substantial deposit to maintain the
PPA.
Projects receive a subsidy from the grid
operator for construction of the export cable.
Maine 40% by 2017
300 MW offshore wind by 2020;
5000 MW by 2030
Maine Wind Energy Act directed
PUC to hold competitive process to
award 20-year PPAs to offshore
pilot projects
Legislation passed in June 2013 re-opened the
bidding process for PPA for ratepayer
subsidies of offshore wind pilot projects.
U.Maine bid against the Statoil Hywind
Maine floating wind farm which had signed a
term sheet for 27 cents/kWh for 12 MW, but
Statoil withdrew its application in October
2013
Maryland 20% by 2022 The Maryland Offshore Wind
Energy Act of 2013 established
ORECs for up to 200 MW,
limiting ratepayer impacts while
broadening the cost-benefit
analysis, including consideration
of peak coincident price
suppression.
Maryland issued an RFP to conduct initial
marine surveys of the offshore WEA that
BOEM identified. Maryland plans to fund
additional surveys with state funds to
encourage development of the WEA by
private developers after the BOEM
competitive auction process.
Maryland is promulgating rules by July 1,
2014 to implement the OREC program.

Offshore Wind Market and Economic Analysis Page 59 Document Number DE-EE0005360
State RPS Offshore Wind RPS Mandatory PPAs RFPs and Other Activity
Massachusetts 15% by 2020,
increasing by 1%
each year
thereafter with no
stated expiration
date.
There is no carve-out or REC
multiplier for offshore wind.20
The governor has set a goal of
developing 2,000 MW of
offshore wind energy to help
achieve the RPS requirements.
The Green Communities Act
requires each electric distribution
company to sign PPAs for 7% of its
load with renewable energy
generators. The Department of
Public Utilities (DPU) has approved
contracts with National Grid and
NSTAR utilities for 363 MW or
77.5% of the full potential output of
the Cape Wind project.
New Jersey 20.38% Class I
and Class II
renewables by
2020-2021
The NJ RPS contains a carve-out
for offshore wind. The state’s
Board of Public Utilities will
define a percentage-based target
of 1,100 MW of OSW.
New York 29% by 2015 There is no carve-out or REC
multiplier for offshore wind.
NYPA, LIPA, and Consolidated Edison have
filed an unsolicited request for a lease in
federal waters off Long Island, but two
expressions of competitive interest by
Fishermen’s Energy and EMI have been filed,
and BOEM will launch competitive auction
process after finalizing the lease area borders.
BOEM will also issue a Call for Information
and Nominations for other lease areas off NY.
20 DOE 2013b

Offshore Wind Market and Economic Analysis Page 60 Document Number DE-EE0005360
State RPS Offshore Wind RPS Mandatory PPAs RFPs and Other Activity
Rhode Island 16% by 2019 There is no carve-out or REC
multiplier for offshore wind.
In 2008, Rhode Island issued an RFP for an
offshore wind project to produce 15% of the
state’s electricity demand and subsequently
signed a Joint Development Agreement with
Deepwater Wind. The Rhode Island Public
Utility Commission approved an initial 30
MW Pilot PPA for 24.4 cents/kWh
(OffshoreWind.net 2010).
Virginia Virginia is having the local transmission
system owner conduct interconnection
studies exploring a high-voltage submarine
cable that could interconnect to OSW farms
(Power Systems Consulting 2012). The VA
State Corporation Commission could extend
its current general policy to allow
“construction work in progress” costs of
offshore wind development to be collected
from ratepayers prior to completion of an
offshore wind farm.
Source: Navigant analysis

Offshore Wind Market and Economic Analysis Page 61 Document Number DE-EE0005360
2.3.2.3 Public Utility Commission Approval of Power Purchase Agreements
Ultimately, the state public utility commission (PUC) must approve all PPAs21 before the costs can be
passed through to ratepayers. Most states have legislation requiring the PUC to conduct some form of
cost-benefit analysis and determine that the PPA provides “least cost” energy to warrant ratepayer
funding. Lawmakers seeking to address the health and environmental costs of certain generation fuels
have broadened the cost-benefit analysis. This is because pollution costs are not internalized into the
price of the energy produced.
2.3.2.4 Maine
In 2009, the Maine legislature amended the Maine Wind Energy Act to set goals of installing 300 MW of
offshore wind by 2020 and 5,000 MW by 2030.22 The legislature also directed the PUC to hold a
competitive bid and approve PPAs for offshore renewable energy pilot projects that met certain
conditions. 23 Statoil was determined the winner of the auction process and the PUC approved a term
sheet for 12 MW in 2012 at 27 cents/kWh. In July 2013, the Maine legislature revised the statute to
authorize additional bidding and the University of Maine submitted a competing bid in September 2013.
PUC signed term sheet with U. Maine and is now negotiating a PPA.
2.3.2.5 Maryland
The Maryland Offshore Wind Energy Act of 2013 established ORECs and substantially broadened the
cost-benefit analysis for OREC eligibility. The applicant must submit a cost-benefit analysis addressing
employment, taxes, health and environmental benefits, supply chain opportunities, ratepayer impacts
and the long-term effect on the energy and capacity markets. The act requires the PUC to consider the
ratepayer impacts, potential reductions in transmission congestion costs, potential reductions in capacity
prices and locational marginal prices, potential long-term changes in capacity prices, and the extent to
which the cost-benefit analyses demonstrates positive net economic, environmental, and health benefits
when reviewing OREC applications. Therefore, the Maryland
act specifically requires a price suppression analysis for peak
coincident wind farm generation and evaluation of other
electricity market and ratepayer benefits. It is thus the most
comprehensive state legislation requiring consideration of all
significant economic benefits of a proposed wind farm. Some
of these real economic benefits will accrue directly to
ratepayers to offset a portion of the rate impacts based only
on the higher current capital costs of offshore wind in the
United States.
21 With the exception of federal procurements of PPAs. 22 Maine Revised Statutes Title 35-A §3404. 23 Maine Revised Statutes Title 35-A §3210-C.
The Maryland act is the most
comprehensive state
legislation requiring
consideration of all significant
economic benefits of a
proposed wind farm.

Offshore Wind Market and Economic Analysis Page 62 Document Number DE-EE0005360
2.3.2.6 Massachusetts
To promote renewable energy, the Commonwealth of Massachusetts enacted legislation authorizing the
state PUC to approve a renewable PPA if the PPA would achieve the following:
Provide enhanced electricity reliability within the Commonwealth
Contribute to moderating system peak load requirements
Be cost-effective to Massachusetts electric ratepayers over the term of the contract
Create additional employment in the Commonwealth, where feasible24
The PUC was directed to “take into consideration both the potential costs and benefits of such contracts,
and [to] approve a contract only upon a finding that it is a cost effective mechanism for procuring
renewable energy on a long-term basis.” After reviewing substantial written and oral testimony, the
PUC concluded the Cape Wind project offers unique benefits relative to other available, renewable
resources:
“In particular, the project’s combination of size, location, capacity factor, advanced stage of
permitting, and advanced stage of development is unmatched by any other renewable resource in
the region for the foreseeable future. This combination of benefits will significantly enhance the
ability of [the utility] to achieve renewables [RPS] and greenhouse gas emissions reduction
requirements.”
On appeal, the Massachusetts Supreme Judicial Court upheld the PUC, concluding, “In sum, our review
of the record indicates that there was clearly sufficient evidence of which the department could base its
conclusion that the special benefits of PPA-1 exceeded those of other renewable energy resources, and
we uphold the department’s conclusion that approval of the contract was in the public interest.” The
Court noted the project location near an area that uses high levels of electricity that would not require
long, new, onshore transmission to other generators and the greater capacity factor than generators run
on other types of renewable resources.25
The Court also noted the PUC’s finding that Cape Wind would
lower regional energy costs through “price suppression,”
described as “the reduction of wholesale energy market
clearing prices that results from the addition of low-cost
generation resources.”26 Cape Wind presented testimony based
on an independent economic analysis by Charles River
Associates (CRA) that, with zero fuel cost, Cape Wind energy
would be dispatched by the regional transmission operator during peak periods displacing fossil fuel
generators that are more expensive to operate after constructed. CRA concluded that the total savings
24 Green Communities Act, Section 83, Chapter 169 of the Acts of 2008. 25 Alliance to Protect Nantucket Sound, Inc. & others v Department of Public Utilities, 461 Mass. 166, December 28,
2011. 26 461 Mass. at 176-177.
Cape Wind could lower
regional energy costs
through price suppression
by $7 billion over 25 years.

Offshore Wind Market and Economic Analysis Page 63 Document Number DE-EE0005360
that would be spread among all New England ratepayers over the 25-year lifespan of the project could
exceed $7 billion.27 The PUC only recognized 50 percent of this benefit because the utility purchased 50
percent of the capacity. However, the benefit to the contracting utility customers was still significant and
the remaining benefit accrued to all other ratepayers in New England.28
2.3.2.7 New York
To help meet RPS goals, the New York Power Authority, Long Island Power Authority and
Consolidated Edison have teamed to develop an offshore wind farm south of Long Island. The utilities
have agreed to lease a site from BOEM and then hold a competitive bid to determine who will develop
the wind farm and sell the power to the utilities. The utilities also have agreed to own and develop the
transmission interconnection to Long Island.
2.3.2.8 Rhode Island
Rhode Island enacted legislation to promote long term contracts for renewable energy resources
including offshore wind.29 The law requires utilities to hold annual auctions to meet their RPS targets
and may sign 20-year contracts that are “commercially reasonable.” National Grid held an auction and
negotiated a 20-year contract with Deepwater Wind for the Block Island Wind Farm and interconnection
cable for 24.4 cents/kWh plus 3.5% annual escalation. The Rhode Island Public Utility Commission
reviewed the PPA and determined it was not “commercially reasonable” because it was substantially
higher priced than incumbent energy resources. The Rhode Island Legislature then passed another bill to
amend the statute to redefine “commercially reasonable” to mean terms and pricing that are reasonably
consistent with a project “of a similar size, technology and location” and likely to provide economic and
environmental benefits.30 The PUC then approved the same PPA and it was upheld by the Rhode Island
Supreme Court.31
2.3.2.9 Virginia
Dominion Virginia Power (Dominion) has decided to explore generation of OSW within its own
generation portfolio. Dominion has received $47 million from DOE to develop two 6 MW turbines at the
western edge of the VA WEA (Virginia Offshore Wind Technology Assessment Project – VOWTAP).
Dominion also won the BOEM competitive auction for the VA WEA and signed a lease in October 2013
to develop up to 2,000 MW of OSW. Dominion will observe the performance of the VOWTAP turbines
and foundations before final engineering and applications to develop the commercial wind farm in
phases.
27 “Update to the Analysis of the Impact of Cape Wind on Lowering New England Energy Prices,” CRA Project No.
D17583-00, Charles River Associates, March 29, 2012 28 461 Mass. at 176-177. 29 Public Law 2009, Chapter 53. 30 Public Law 2010, Chapter 32, amending Title 39 Section 26.1. 31 In re Review of Proposed Town of New Shoreham Project, Case No. 2010-273-M.P., July 1, 2011.
Offshore Wind Market and Economic Analysis Page 64 Document Number DE-EE0005360
2.3.3 Current Policies in Europe
This section provides an overview of European support schemes for renewable energy and offshore
wind. The European Union (EU) has set the following targets for 2020:
Reduce greenhouse gas emissions by 20 percent
Reduce primary energy use by 20 percent
Generate 20 percent of the electricity with renewable sources
All of the EU member states have committed themselves to these targets and have different support
schemes in place to achieve these ends.
Summary of State Policies that Promote Cost-Competitiveness of Offshore Wind
Renewable Portfolio Standards
ME, MA, RI, CT, NY, NJ, PA, DE, MD, NC, MI, WI, IL, IN, OH, CA, OR, WA
Set minimum acquisition requirements for all renewables despite current costs
Carve-outs such as ORECs required for OSW development if no long term PPA (NJ, MD)
Long Term Power Contracts (ME, MA, RI, DE)
Accommodate up-front capital costs of renewables and likely increase of fossil fuel prices
Provide revenue stream to enable financing of billion dollar offshore wind farms
Utility-Sponsored OSW Generation (VA, NY)
Utility decides to develop OSW generation within its own generation portfolio with fixed
long term costs.
Construction Work in Progress rate surcharges phase in costs to ratepayers during
construction and spreads total cost over greater period of time for reduced impact
Broad Definition of Benefits for Rate Recovery (ME, MA, RI, NJ, MD)
Incorporation of new jobs, economic and environmental benefits into cost benefit analysis
Inclusion of peak demand coincident wind energy price suppression into cost benefit
analysis recognizes simultaneous real savings to ratepayers from OSW ($7 billion price
suppression in New England for Cape Wind’s capital cost of ~$3 billion) (MA, MD)
Limits on monthly ratepayer impacts from OSW PPAs prevent excessive, currently over-market
prices being passed onto ratepayers and maintain balance with promoting clean new technologies
with economic development potential (ME, NJ, MD).

Offshore Wind Market and Economic Analysis Page 65 Document Number DE-EE0005360
2.3.3.1 Investment Support Schemes
Table 2-3 lists investment support schemes in various EU countries.
Table 2-3. Renewable Energy Investment Support Schemes in Europe
Country Investment Support
Schemes Comments
Belgium Grid subsidy Projects with a capacity of 216 MW or more receive a
support from the grid operator (€25 million) for
construction of the export cable. (Smaller projects
received a prorated amount).)
Denmark Tax break
Finland Cash grant Up to 40% of investment budget
France Accelerated depreciation
Research tax credit
Ireland Accelerated depreciation
Research tax credit
Italy Cash grant Up to 30% of investment budget
Netherlands Tax break Will not apply for SDE+
Sweden Accelerated depreciation
U.K. Tax break
Cash grant
Source: European Renewable Energy Council, 2009 and Taxes and Incentives for Renewable Energy, 2011 (KPMNG 2011)
2.3.3.2 Operating Support Schemes
Feed-in Tariffs
FiTs, which feature a guaranteed price per kWh, are the most frequently used support schemes for
renewable energy in Europe. In most countries, the FiT scheme has evolved into an “advanced tariff
scheme,” whereby the number of years when the FiT applies is limited, ensuring a natural phasing out of
the support scheme. In order to provide security for the investors, the support scheme normally has a
lifespan of between 10 and 15 years. In addition, in some countries the FiT is also limited to a number of
full load hours. Price differentiation between the multiple renewable energy sources takes place in most
countries.
Feed-in Premiums
Few European countries use feed-in premiums, which are guaranteed premiums per kWh, incremental
to the electricity market price. Belgium is probably the best example of feed-in premium use, although it
is technically a green certificate scheme with a floor price. A common criticism of the feed-in premium is

Offshore Wind Market and Economic Analysis Page 66 Document Number DE-EE0005360
that the feed-in premium regime is susceptible to lobbying, as large industrial power consumers will
lobby more aggressively against such a regime that imposes a surcharge on the price of electricity, which
is largely independent of the price of power.
Green Certificates
Green certificate (GC) regimes (where qualifying producers generate tradable certificates, which others
must purchase) have generally been seen as less stable, more complex, and less favorable to investment.
Countries with such regimes have seen investment lag behind countries with FiTs. The main difference
in impact between FiTs and green certificates is that FiTs provide price certainty (i.e., fixed $/kWh to the
wind generator), while green certificates provide volume
certainty (i.e., a fixed amount of wind kWh will be
generated). Furthermore, while green certificate regimes can
work for mature technologies like land-based wind, they do
not really promote diversification of renewable energy
sources without extensive tinkering, which increases
complexity and instability.
The risk profile for green certificates is steeper than for FiTs, due to twin price risk (in both electricity
markets and the green certificates market). For this reason, Belgium has set a minimum price for the
green certificates, creating a de facto feed-in premium. Similarly, Poland imposes the average market
price of the previous year, and Romania set a floor and cap price. Lithuania has committed to use green
certificates beyond 2020.
Tendering
With a tendering regime, regulators set volumes of renewable energy production and provide a specific
support regime for that volume over an agreed-upon period, typically via a fixed price or contracts for
differences (CfD) mechanism. Such volumes are offered to investors in a competitive process.
Renewable energy tenders have a bad track record in various European countries due to the
insufficiency of non-compliance penalties, the lack of competition in the bidding process, long project
lead times, and complex permitting procedures, which tend to be separate from the tender process.
2.3.3.3 Summary of Support Mechanisms Used in Europe
Table 2-4 shows offshore wind capacity that has been installed under various support schemes currently
in use across Europe. Note that a variety of operational schemes have resulted in significant MW
installations.
Green certificates do not really
promote diversification of
renewable energy sources
without extensive tinkering.

Offshore Wind Market and Economic Analysis Page 67 Document Number DE-EE0005360
Table 2-4. Offshore Wind Capacity Installed Under Support Schemes Used in Europe
Country Operational Schemes Operational Scheme Notes Installed MW
thru 2013
Consented MW
thru 2013
Belgium Green certificates with a floor
(de facto Feed-in premium)
OSW: the TSO has an obligation to buy at 107 €/MWh for the first 216
MW, then at 90 €/MWh (incremental to market prices)
571 660
Denmark FiT by tender OSW: Tender, fixed price for 50,000 full load hours, then market price 1,270 0
Finland FiT 12-year FiT set at 84 €/MWh. Until end-2015, “early bird” FiT set at
105 €/MWh
26 660
France Tender OSW: 1.9 GW allocated in tenders in 2012 with 170-200 €/MWh tariffs.
Applications for the second round of tenders submitted in late 2013 for
one more GW
0 1,92832
Germany FiT OSW: 150 €/MWh for 12+ years or 190 €/MWh for up to 8 years, then 35
€/MWh. 7%/yr digression starting ‘18
520 6,600
Ireland FiT OSW: 140 €/MWh (15 years) capped at 1.5 GW. Offshore wind was not
part of the technologies eligible to the FiT scheme
25 2,200
Italy Tender & floor price OSW floor price 165 €/MWh for 25 years for project >5 MW 0 30
Netherlands CfD, tender OSW: CfD allocated trough 6 rounds per year. Different strike prices,
depending on each round (from 88 €/MWh to 188 €/MWh); duration 15
years
247 2,860
Sweden Green certificates Market based GC, through a common GC system between Norway and
Sweden
212 880
U.K. (current
scheme)
Green certificates 2 ROCs/MWh for OSW through 2015, then 1.9 ROCs through 2016, then
1.8 3,681 4,840
U.K. (next
scheme)
CfD Strike prices from 190 €/MWh in 2016, to 170 €/MWh33 in 2019
Source: GGEB
32 An additional volume of 1,022 MW has been allocated under the tender in April 2014. 33 Converted to Euros for comparison purposes. The actual strike prices are 155 £/MWh and 140 £/MWh.

Offshore Wind Market and Economic Analysis Page 68 Document Number DE-EE0005360
The remainder of this section describes recent changes in operating support schemes for offshore wind
in key countries in Europe.
Belgium
Belgium has allocated zones for seven offshore wind parks, representing around 2.2 GW. Two of them
are already operational (C-Power and Belwind), one project is currently under construction (Northwind)
and the other projects are under development. In December 2013, Belgium approved the reform of an
offshore wind support mechanism moving from a GC system with a premium to a CfD system. The
reform aims to minimize costs to consumers while guaranteeing a decent return to investors. It will not
apply to parks that are already under construction or in operation. Each project will receive a total fixed
price of €138/MWh and will be reassessed on a project by project basis every three years and will be
subject to changes in the level of the contracted maintenance costs and the correction factor in the PPA.
Germany
Germany’s main issues in 2013 related to worries about the
potential expiration of the compressed FiT and grid connection
agreements. Offshore wind developers can choose between the
standard tariff of €150/MWh for 12 years and the compressed
tariff of €190/MWh for 8 years. The compressed model can be
very attractive for investors as it helps meet high upfront
investment costs. However, it was set to expire at the end of
2017. In late 2013, Germany’s coalition government proposed
extending the compressed FiT support scheme by 2 years. The
most recent proposals (still to be formally approved) would see a tariff of €185/MWh for projects
commissioned in 2018 and €180/MWh in 2019. Regardless of which mechanism developers choose
(compressed or not), they are entitled to a further FiT of €150/MWh, for a number of additional months
determined from the project’s water depth and distance to shore34.
In Germany, the grid operator (TenneT for the North Sea, 50Hertz for the Baltic Sea) is responsible for
connecting the projects to the onshore grid. As a result of substantial delays (more than a year) that
affected projects already in construction in 2011-2013 and some projects for which FID was supposed to
be taken in that period, the legislator has adopted a detailed liability regime which includes an
obligation for the TSOs to publish a grid plan each year.35 These plans must detail the completion date,
location and size of future grid connections, which will be subject to the review and approval of the
German federal energy regulator Bundesnetzagentur. Once the envisaged completion date for the grid
connection has been published, a realization plan will need to be agreed upon between the TSO and the
developer. Thirty months before the anticipated completion, the announced date of completion becomes
binding for both the grid operator and the developer. The wind farm operator is entitled to damages if
34 The period in which the increased initial remuneration is extended by 0.5 months for every full nautical mile of
distance between the system and the coast over twelve nautical miles and by 1.7 months for each full meter of water
depth exceeding a depth of 20 meters. 35 Section 17b of EnWG, the German Energy Act
Germany’s main issues in 2013
related to worries about the
potential expiration of the
compressed FiT and grid
connection agreements.

Offshore Wind Market and Economic Analysis Page 69 Document Number DE-EE0005360
completion of the grid connection is delayed by more than 11 days. The grid operator is also liable for
interruption (if above 18 days per calendar year during construction and above 10 days during the
operational phase). Damages claims amount to 90% (100% in case of wilful misconduct) of the feed-in
tariff must be paid by the grid operator. It is calculated daily, based on the average production of a
comparable wind turbine (Wind Power Monthly 2013).
France
No offshore wind farm exists in France to date. However, the
French government has begun to support the development of
offshore wind projects by organizing two rounds of tenders for
a total capacity of 3 GW. The government has identified six
areas for development, in which they have awarded 4 projects
(close to 2 GW) as part of the first tender, for which
construction is expected to start in 2017-2019. They have also
awarded projects in two further areas in April 2014, for an additional 1 GW, for which construction is
expected to start in the 2020-2021 period.
The government has allocated a tariff for 20 years to the tender winners, including a specific component
for the grid connection. RTE, the French TSO, builds and owns the grid connection assets, yet the
associated construction costs are borne by the project developer. The developer is compensated for this
investment through a specific component of the tariff, normatively sized on an expected return for such
investment of 7.25% before taxes. After being awarded, each project must negotiate the conditions of the
grid connection in a transmission agreement. In case of delays caused by RTE, the 20-year duration of
the tariff shall not be affected. In case of low availability of the offshore wind project (below 50%), the
grid component of the tariff is reduced.
Ireland
Ireland has one of the best wind regimes in Europe, but offshore wind has not benefited from the same
level of support as onshore wind. The government previously said that offshore wind support was too
expensive to consider. However, in February 2014 they finally decided to launch a dedicated plan for the
sustainable development of offshore renewable energy. This plan is due to be reviewed before end 2017.
Projects may also be built for exporting electricity to the U.K., without any cost for Irish consumers. As a
result, generators will hereby benefit from the U.K. support system. An inter-governmental agreement is
still being negotiated.
Italy
A decree dated July 6, 2012, introduced a competitive bidding mechanism for offshore wind in Italy until
2015, managed by Gestore dei Servizi Energetici (GSE), the state energy agency. Offshore wind projects
that have a license will win 25-year energy purchase contracts if they can offer the lowest FiT. The first
auction was open in late 2012 but did not lead to any conclusive results (only one bid for 30 MW was
higher than the floor price of € 165/MWh, far short of the 650 MW quota eligible for the FiT). During the
second auction, there were no bidders at all for offshore wind projects. With zero capacity currently
The French government has
organized two rounds of
tenders for a total capacity
of 3 GW.

Offshore Wind Market and Economic Analysis Page 70 Document Number DE-EE0005360
installed and no big projects in the pipeline, Italy is even looking to shift some of the allocated support
from offshore to onshore wind.
The Netherlands
The national agreement published in September 2013 sets up a target of 4.5 GW of offshore wind
capacity installed by 2023. Among other things, it plans to establish a proper legal framework for
offshore wind by 2015, facilitate grid connection and extend the Subsidie Duurzame Energy scheme
(SDE renamed SDE+). Under the SDE/SDE+, producers of renewable energy sell all generated electricity
to the grid at market prices. On top of these prices, they receive a premium payment, up to a maximum
predetermined strike price per kWh. This CfD support guarantees the generators of a relatively fixed
income per kWh. The fact that the SDE+ scheme has an annual budget ceiling is expected to encourage
competition, as all technologies have to compete against each other. The SDE+ is opened in phases (six in
2013). Table 11 below shows the maximum strike price per phase:
Table 2-5: SDE+ Phases for Offshore Wind in 2013
Phase Timing for Application Strike price
Phase 1 April 4 – May 13 € 87.5 /kWh
Phase 2 May 13 – June 17 € 100 /kWh
Phase 3 June 17 – Sept 2 € 112.5 /kWh
Phase 4 Sept 2 – Sept 30 € 137.5 /kWh
Phase 5 Sept 30 – Nov 4 € 162.5 /kWh
Phase 6 Nov 4 – Dec 19 € 187.5 /kWh
Source: GGEB analysis
Developers need to time their application for the SDE+ carefully: phase 1 applications may benefit from
lower support levels but the risk of the SDE+ pool of incentives being exhausted is also reduced. Those
developers who delay until phase 6 could benefit from a higher support level, but they will also have to
run the risk that the SDE+ scheme will have to close early if the pool of funding available for that year
has already been allocated (Norton Rose Fulbright 2013). For 2013, €3 billion has been made available
under the SDE incentive program, which is a major increase from the €1.7 billion that was available the
previous year. The government is also committed to dedicating €3.5 billion to the SDE+ 2014 budget.
Romania
Romania uses tradable green certificates with a floor price and ceiling price. In January, Romania cut its
support scheme for new wind, solar and hydro plants. Under the new scheme, wind energy producers
get 1.5 GC/MWh until 2017 and 0.75 afterwards, from a previous 2 and 1 respectively.
Spain
Spain has no offshore wind development to date, apart from a 5 MW demonstration turbine installed in
2013 in the archipelago of the Canary Islands. Even though Spain has 5,000 miles of coastline, offshore

Offshore Wind Market and Economic Analysis Page 71 Document Number DE-EE0005360
wind resources are not easily accessible because of deep-water surrounding seas. Development of
offshore wind has been further hampered by the ongoing pullback on support for renewable energies.
There have been several retroactive changes with the aim to bring down costs. For example, the
government abolished the right for developers to choose between a FiT and a premium paid on top of
the sale price (e.g. for offshore wind this premium amounted to €84 /MWh in 2007 as per Royal Decree).
This measure was expected to save an aggregate amount of €220-500 million per year but has almost
killed off new developments in the wind industry in the country.
In July 2013, the Spanish government replaced all renewable energy FiTs with a new scheme under
which it guarantees investors “reasonable profitability” of 7.5% over the lifetime of a project. The
government will determine the associated support on the basis of this level of return, assuming standard
construction costs and operational costs, regardless of the actual costs incurred by the developers. Any
renewable energy project that has already achieved this level of return through the previous applicable
FiT scheme will not be eligible for any additional support through the new scheme.
United Kingdom
The United Kingdom’s Energy Bill, published in December 2012, included a number of measures
necessary to reform the U.K. electricity market. These measures aim to guarantee the security of supply
and to ensure that carbon targets are met. The bill contains a plan to change the support scheme in 2017,
replacing the Renewable Obligation (RO) with a CfD. CfD is a type of FIT where generators will sell their
electricity on the market and receive a top-up payment from the government for the difference between
the strike price, which is set by the government, and that market price. When the market price increases
above the strike price, the difference must be paid to the government. The government will establish a
new entity, which will pay the eligible generators and will
also have the power to raise levies from suppliers. From 2015
to 2017, the Renewable Obligation Certificates (ROCs)
allocated per project will decrease from 2.0 ROC/MWh to
1.8 ROC/MWh. From mid-2014 to March 2017, generators can
choose between the ROC and CfD system. From April 2017
onwards, the only system will be the CfD.
Offshore wind CfD strike prices were announced in late 2013: £155/MWh through 2016, £150/MWh
in 2016-17 and £140/MWh though 2019. After this announcement, some players (e.g. utilities) decided to
exit the industry due to low expected returns. The overall industry feedback suggests that by removing
market risk, the move from ROCs to CfD is positive. In the short-term, however, investors will likely ask
the first projects using CfDs for a premium to cover the risks linked to any change in support policy.
From mid-2014 to March
2017, generators can choose
between the ROC and CfD
system.

Offshore Wind Market and Economic Analysis Page 72 Document Number DE-EE0005360
2.4 Examples of Policies for Addressing Infrastructure Challenges
2.4.1 General Discussion of Policy Examples
As mentioned in Section 2.2 and further described in Appendix A, the primary infrastructure challenges
faced by the U.S. offshore wind industry include a lack of purpose-built ports and vessels, a lack of
domestic manufacturing and experienced labor, and insufficient offshore transmission. Therefore, the
primary offshore wind infrastructure policies are related to transmission and port upgrades and
providing incentives for local manufacturing.
2.4.1.1 Transmission
Current transmission-related policies for offshore wind focus on the following:
Direct-connect design (land-based or offshore collector/converter) and system upgrades
Responsible parties who will plan, build, operate, and maintain the offshore transmission
system
Cost allocation and cost recovery for offshore transmission investments
Siting/permitting of transmission
Ratepayers eventually pay for all transmission and generation costs, whether their electric bills are
bundled or each cost is itemized and added to the local distribution cost. Under the current policy in
some parts of the U.S., including the Atlantic coast, any new generator must pay for the cost of the new
interconnection to the grid and any transmission system upgrades required to accommodate the new
generation reliably. These costs must then be incorporated into the cost of the energy produced by that
generator, thereby becoming part of the wholesale cost that is
ultimately passed through to the ratepayers. However,
offshore wind transmission is prohibitively expensive for
single projects to bear. Significant interconnection and grid
upgrade costs deter construction of new offshore wind
generation because developers must have an assurance of cost
recovery in order to obtain financing to build new transmission lines. This creates a “chicken and egg”
dilemma for the offshore wind industry. The policies described in this section have been used or
considered by various jurisdictions to help address this dilemma.
A substantial onshore wind resource exists in West Texas and the Panhandle, which are hundreds of
miles from the major demand centers in Central and Eastern Texas. Wind developers could not afford
the cost of single interconnection lines to Central Texas and thus did not pursue development in West
Texas. In response, the Texas legislature established Competitive Renewable Energy Zones in West
Texas and the Panhandle and decided that the cost of constructing multiple transmission lines from
West Texas to Central Texas would be shared by all Texas ratepayers (CREZ 2013). In 2008, in response
to legislative action, the Texas Public Utilities Commission established five CREZ lines to be connected
to load centers. Each of the five CREZ lines is to be funded by all Texas ratepayers. The PUC called for
$4.93 billion of CREZ transmission projects to be constructed by seven transmission and distribution
utilities and independent transmission development companies. Transmission lines to each of the five
Offshore wind transmission is
prohibitively expensive for
single projects to bear.

Offshore Wind Market and Economic Analysis Page 73 Document Number DE-EE0005360
CREZ areas, totaling 3,600 miles, are now projected to cost $6.8 billion. The initiative will eventually
facilitate the transmission of more than 18 GW of wind power from west Texas and the Panhandle to the
state’s highly populated areas (PUCT 2010).
Atlantic Wind Connection (AWC) recognized that the cost of interconnecting multiple offshore wind
farms to onshore substations could be reduced by constructing a major trunk cable offshore. Such a cable
could interconnect offshore wind farms with fewer onshore interconnections. AWC has been seeking
approval of the regional transmission operator, PJM, to pass the costs of this cable to all the PJM
ratepayers who will benefit from the wind power and associated peak-demand price suppression. PJM
has determined that AWC could be funded by NJ ratepayers if New Jersey agrees. Therefore, AWC has
recently phased its project and, with the New Jersey Board of Public Utilities, is exploring passing the
costs of the New Jersey Energy Link portion of the AWC cable
onto New Jersey ratepayers. An initial third party analysis of
the wholesale generation prices in south and north New
Jersey indicates that the New Jersey Energy Link could save
NJ ratepayers about $450 million per year just by connecting
the grid in southern and northern NJ even before
interconnecting offshore wind farms would produce further
savings.
Three New York utilities have teamed to proposed development of an offshore wind farm south of Long
Island. The New York Power Authority (NYPA), Long Island Power Authority (LIPA), and Consolidated
Edison (NYPA Collaborative) filed an unsolicited request for a lease in federal waters off Long Island for
a 350 MW offshore wind project, possibly expandable to 700 MW. The NYPA Collaborative proposes to
fund interconnections to the wind farm from both Long Island and New York City instead of require
developers to include the cost of the interconnections with the cost of the wind energy.
Massachusetts is funding an offshore wind transmission study to identify optimal interconnections to
the Massachusetts Wind Energy Area to be auctioned later in 2014. The Draft Final Report recommends
multiple HVDC cables of 1,000 to 3,000 MW capacity to interconnect to the 345 kV grid (ESS Group
2014).
In order to address the issue of planning transmission for offshore wind projects on a piecemeal basis,
federal and regional regulators have used comprehensive transmission system planning to optimize grid
investments necessary to interconnect offshore wind farms.
Policy description
o Transmission system planners identify offshore transmission upgrades or new transmission
required to develop an offshore wind project area (i.e., conceptual transmission expansion
plans).
o Developers and transmission system planners evaluate direct single interconnections to each
wind farm or joint interconnections to multiple wind farms (such as the proposed AWC
submarine cable off the mid-Atlantic coast).
Policy rationale
The New Jersey Energy Link
could save NJ ratepayers
$450 million per year just by
connecting the grid in
southern and northern NJ.
Offshore Wind Market and Economic Analysis Page 74 Document Number DE-EE0005360
o Optimizing the transmission infrastructure for consolidated wind farms reduces costs to the
customer and environmental impacts.
o FERC Order 100036 directs regional transmission organizations (RTOs) and independent
system operators (ISOs) to consider state and federal energy policies, which include RPSs,
when planning expansion of their respective transmission systems. More specifically, Order
1000 requires that each public utility transmission provider must participate in a regional
transmission planning process that satisfies the transmission planning principles of Order
No. 890 and produces a regional transmission plan.
o A single environmental review and permitting process can be conducted, which reduces
costs and timelines.
In order to address the issue of prohibitively high transmission
costs for a single project, jurisdictions have chosen to allocate
the costs of offshore transmission system upgrades to all
regional transmission system customers. RTOs or ISOs have
implemented this recommendation by planning and allocating
costs to ratepayers for grid upgrades to accept wind power
from offshore projects (as encouraged by FERC Order 1000).
AWC has asked PJM Interconnections to spread the cost of the
New Jersey Energy Link among all the PJM ratepayers who will
benefit from its operation. Texas provides a state model with its legislation to spread the costs of such
new grid upgrades to all ratepayers for access to wind energy. 2,600 miles of transmission have been
constructed to date out of a total of 3,600 miles, at a projected total cost of $6.8 billion (CREZ 2013).
To address both of the issues mentioned above, states and provinces in the Great Lakes area are
planning to establish a basis for inter-RTO and international cost allocation and transmission siting and
planning.
This strategy has enabled developers to send power to multiple load centers, thereby improving
project economics, enabling larger offshore wind farms, and minimizing the transmission
footprint per MW ratio.
Participating in the development of DOE’s congestion study and National Interest Electric
Transmission Corridor report encourages the designation of regions that are attractive for
offshore development as National Interest Electric Transmission Corridors. This provides federal
assistance for interstate siting that augments transmission planners working through existing
institutions like RTOs. However, it does not override state siting authorities that deny
construction authority.
To address the issue of a disjointed and unclear permitting process, many jurisdictions are planning to
establish clear permitting criteria/guidelines for transmission project siting and installation. Regional
36 See FERC website for summary and further information: http://www.ferc.gov/industries/electric/indus-act/trans-
plan.asp
FERC Order 1000
encourages RTOs and
ISOs to allocate costs of
offshore grid upgrades to
all ratepayers.

Offshore Wind Market and Economic Analysis Page 75 Document Number DE-EE0005360
organizations are developing model guidelines for individual states to consider. Such regional
organizations include RTO Stakeholder Committees and the New England Conference of Public Utility
Commissioners.
To address the transmission cost issue, some coastal states are planning to promote utilization of existing
transmission capacity reservations to integrate offshore wind. Some conventional generation facilities
that are aging and often operate consistently below full capacity may utilize less than their full
transmission capacity reservations. Many of these facilities are located in close proximity to the shoreline
and could serve as injection points for new offshore wind facilities, so long as a substantial portion of
corresponding transmission is not being used. Utilization of consistently unused transmission capacity
by new offshore wind facilities may preclude the need for substantial onshore transmission upgrades.37
Ultimately, this pattern of development could allow offshore wind to be scaled up to utilize the full
transmission capacity for conventional generating units, replacing those units as they are run at lower
capacities and ultimately retired.
To address the issue of a piecemeal transmission planning process, some states have proposed
establishing policies that support the development and implementation of Integrated Resource Planning.
State public utility commissions have engaged interested parties in identifying additional transmission
resources needed to meet state renewable energy obligations. Utilities could be required to objectively
analyze the potential of all available resources. The Eastern Interconnection States’ Planning Council has
the potential to be a forum for state discussions on this topic.
2.4.1.2 Ports
Maritime ports were not originally designed with the offshore
wind sector in mind. In many cases, quaysides, laydown
areas, and clearances must be upgraded to accommodate
ever-larger turbines and foundations, as well as an increasing
volume of offshore projects. Large ports in Europe are
undergoing major upgrades to support the development of
offshore wind. Massachusetts announced investment of $100 million to upgrade the New Bedford Port
for construction of the Cape Wind Farm.
The primary offshore wind policies related to port infrastructure focus on the following:
Overall port strategy and planning at the country level
Upgrades to ports (when ports are held by the state)
Incentives encouraging port upgrades (when ports are privately held)
37 This unused transmission capacity would remain “tagged” to the conventional generation unit for purposes of
most transmission capacity markets, but would still be available most of the time for energy transmission from wind
generation, including during most peak demand periods when the wind energy would be dispatched before these
more costly peaking generation units.
Ports must be upgraded to
accommodate ever-larger
turbines and foundations.

Offshore Wind Market and Economic Analysis Page 76 Document Number DE-EE0005360
The Navigant Consortium identified two policy examples, used in countries such as Germany, the
United Kingdom, and Denmark and discussed in detail in Appendix C, related to improving the port
infrastructure to better accommodate offshore wind:
Ports Policy Example 1: In order to address the challenge of funding upgrades to ports to accommodate
offshore wind, several European countries have chosen to upgrade state-held ports or provide incentives
for private port upgrades.
If a country’s ports are held by the state, the national government identifies and performs
upgrades needed by strategically positioned ports.
If a country’s ports are held by the private sector, the government provides incentives to
encourage the port upgrades. The government may have a vested interest in supporting the
private sector (e.g., meeting national renewable energy targets).
Ports Policy Example 2: In order to address the issue of a disjointed ports planning process, European
countries often develop a country-wide strategy focusing on a select number of locations spread around
the coast. A government agency commissions a study to assess the following:
Specific requirements of the offshore wind industry for ports
Current capabilities of the country’s ports
Potential port expansion or development to meet the needs of the offshore wind sector
Based on the study’s findings, the government agency develops a policy for long-term port
development.
2.4.1.3 Manufacturing
Manufacturing-related policies for offshore wind include the following categories:
Government support for offshore wind manufacturing at port sites
Favorable customs duties, export credit assistance, or quality certification
Manufacturing Policy Example 1: To address the challenge of promoting a domestic supply chain,
countries such as Germany have provided government support for offshore wind manufacturing at port
sites, including the following policy mechanisms:
Expedited permitting for prototype turbines (e.g., Bremerhaven – Multibrid)
Creation of wind-related training/degree programs at local universities
Tax credits
Loans
Manufacturing Policy Example 2: To further address the supply chain issue, European countries have
provided favorable customs duties, export credit assistance, and quality certification. A country’s export
credit agency provides loans or loan guarantees for the sale of domestically manufactured turbine or
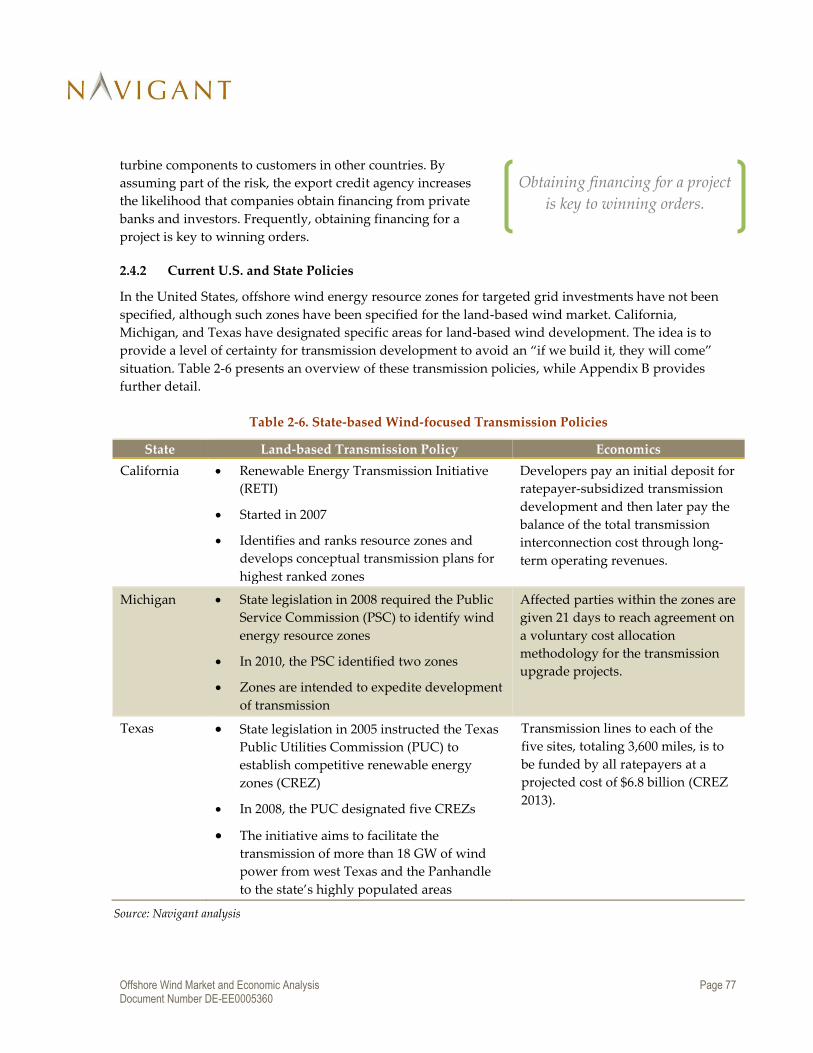
Offshore Wind Market and Economic Analysis Page 77 Document Number DE-EE0005360
turbine components to customers in other countries. By
assuming part of the risk, the export credit agency increases
the likelihood that companies obtain financing from private
banks and investors. Frequently, obtaining financing for a
project is key to winning orders.
2.4.2 Current U.S. and State Policies
In the United States, offshore wind energy resource zones for targeted grid investments have not been
specified, although such zones have been specified for the land-based wind market. California,
Michigan, and Texas have designated specific areas for land-based wind development. The idea is to
provide a level of certainty for transmission development to avoid an “if we build it, they will come”
situation. Table 2-6 presents an overview of these transmission policies, while Appendix B provides
further detail.
Table 2-6. State-based Wind-focused Transmission Policies
State Land-based Transmission Policy Economics
California Renewable Energy Transmission Initiative
(RETI)
Started in 2007
Identifies and ranks resource zones and
develops conceptual transmission plans for
highest ranked zones
Developers pay an initial deposit for
ratepayer-subsidized transmission
development and then later pay the
balance of the total transmission
interconnection cost through long-
term operating revenues.
Michigan State legislation in 2008 required the Public
Service Commission (PSC) to identify wind
energy resource zones
In 2010, the PSC identified two zones
Zones are intended to expedite development
of transmission
Affected parties within the zones are
given 21 days to reach agreement on
a voluntary cost allocation
methodology for the transmission
upgrade projects.
Texas State legislation in 2005 instructed the Texas
Public Utilities Commission (PUC) to
establish competitive renewable energy
zones (CREZ)
In 2008, the PUC designated five CREZs
The initiative aims to facilitate the
transmission of more than 18 GW of wind
power from west Texas and the Panhandle
to the state’s highly populated areas
Transmission lines to each of the
five sites, totaling 3,600 miles, is to
be funded by all ratepayers at a
projected cost of $6.8 billion (CREZ
2013).
Source: Navigant analysis
Obtaining financing for a project
is key to winning orders.

Offshore Wind Market and Economic Analysis Page 78 Document Number DE-EE0005360
2.4.3 Current Policies in Europe
Table 2-7 is a summary of infrastructure policies currently in place in selected countries in Europe.
Detailed descriptions of these policies are provided in Appendix C.
Table 2-7. Policies for Addressing Infrastructure Challenges in Europe
Country Transmission Policy Ports Policy
Belgium Current framework: TSO is
responsible for connecting wind
farms to the grid. TSO pays up to
€25 million of the connection costs,
the rest being covered by the project
developer
Future framework: TSO will build
and operate transmission assets.
The offshore wind terminal of the Port
of Oostende has been financed by both
public and private bodies
Denmark TSO is responsible for funding and
connecting wind farms to the grid
Costs recovered from all customers
No plans for inter-project
transmission
Ports funded by municipalities.
Investment of $186 million
through 2019 in the Port of Esberg
France TSO builds and owns the transmission
assets, but associated construction costs
are borne by the project developer. The
latter is compensated for this
investment through a specific
component of the FiT and recovered
from all ratepayers
Ports to be developed by developers
(members of the consortium)
Germany TSOs are responsible for building
and operating OSW transmission
connections
Costs recovered from all customers
New German Energy Act clarifies
liability for construction delays
State of Bremen supports
Bremerhaven with R&D and
investment support schemes
New Bremerhaven terminal will be
funded through a concession
contract expected to be awarded by
spring 2014
Lower Saxony government is
directly investing in three North Sea
ports

Offshore Wind Market and Economic Analysis Page 79 Document Number DE-EE0005360
Country Transmission Policy Ports Policy
Netherlands TSO is responsible for construction
and management of the grid
Offshore developers are responsible
for project-specific transmission
system costs
Developing HVDC interconnection
with Denmark. FID expected in
2016
Ports are all independent companies
and do not receive any funding or
direct support from the government
United Kingdom Projects cannot own their
transmission systems anymore once
built. Thus competitive tenders are
organized to become an OFTO and
collect 20 years of payments
Project developers can choose to
construct their own transmission
assets (which they will then need to
sell to an OFTO after completion) or
opt for an independent OFTO to do
it directly. In case of construction
delays by the OFTO, the latter is
liable to pay LDs to NGET, the UK
TSO, and thus is not directly liable
toward the project developer,
which is a major risk issue for
developers and suggests this
“OFTO-built” regime will not be
used.
The Crowne Estate is soliciting
applications from manufacturers
and ports
£60 million is available between
2011 and 2015
Source: Navigant analysis

Offshore Wind Market and Economic Analysis Page 80 Document Number DE-EE0005360
2.5 Examples of Policies That Address Regulatory Challenges
2.5.1 General Discussion of Policy Examples
As mentioned in Section 2.2 and further described in Appendix A, the primary regulatory challenges
that the U.S. offshore wind industry faces include uncertain site selection and leasing processes,
fragmented permitting processes, and public resistance due to uncertain environmental impacts. The
following sections include policy examples regarding leasing, permitting, or operations of offshore wind
projects that have been implemented or proposed:
2.5.1.1 General
The following policies have been used to address the issue of a disjointed planning process:
Global planning approach that includes offshore. In 2010, the U.S. Department of the Interior (DOI)
established its ”Smart from the Start” Initiative for Atlantic Ocean wind. This initiative identifies
priority WEAs for potential development; improves BOEM coordination with local, state, and
federal partners; and accelerates the leasing process. BOEM has established task forces with at
least 13 states to engage intergovernmental partners and help inform BOEM’s planning and
leasing processes.
Federal/state policy coordination. In June 2010, the DOI and a number of states created the Atlantic
Offshore Wind Energy Consortium and signed a memorandum of understanding (MOU) to
facilitate federal/state offshore wind development coordination. These states included Maine,
New Hampshire, Massachusetts, Rhode Island, New York, New Jersey, Delaware, Maryland,
Virginia, and North Carolina. In February 2012, five Great Lakes states and ten federal agencies
signed an MOU to establish a more coordinated approach to ensure efficient, expeditious,
orderly, and responsible evaluation of offshore wind power projects in the Great Lakes.
2.5.1.2 Leasing
The following policies have been used to address the issue of uncertain site selection and leasing
processes:
Regulatory framework for marine spatial planning. Marine spatial planning could promote national
objectives such as enhanced national energy security and trade, and provide specific economic
incentives (e.g., cost savings and more predictable and faster project implementation) for
commercial users.
Dedicated offshore wind areas. State regulators who identify environmental constraints and engage
in discussions with stakeholders with competing offshore uses lead the identification of WEAs.
This policy is the first phase of BOEM’s Smart from the Start initiative.
Phased access. Developers have a short-term right to evaluate a wind resource with a longer-term
right to develop. (i.e., the limited lease or site assessment terms under BOEM regulations)
Regulator selection of sites, followed by developer competitive bidding. This process is used in Texas,
New York, and Denmark.

Offshore Wind Market and Economic Analysis Page 81 Document Number DE-EE0005360
BOEM call for lease nominations. BOEM held its first
two competitive lease sales for offshore wind in
Rhode Island and Virginia in 2013 and announced
competitive auctions in Maryland, Massachusetts
and New Jersey for 2014.
2.5.1.3 Permitting
The initial challenge for offshore wind development was a lack of a specified leasing process. Cape Wind
filed its initial permit application with the U.S. Army Corps for its wind farm and transmission
interconnection in 2000. The Energy Policy Act of 2005 transferred jurisdiction and lead NEPA federal
agency status to the U.S. Minerals and Management Service, now the Bureau of Ocean Energy
Management. When BOEM issued its initial proposed draft leasing regulations, the process included
three Environmental Impact Statements, which could have taken up to 5 to 7 years to attain.
The main policy examples to address these permitting challenges differ primarily in the level of
centralization in producing Environmental Impact Statements (EISs). The following policies have been
used to address the issue of fragmented or unclear permitting processes:
Require site-specific EISs for every offshore wind project: Under this policy, developers produce
individual EISs for each wind farm, regardless of whether adjacent projects have addressed
similar issues.
Conduct a programmatic EIS (PEIS) over broad geographic areas to determine categorical exclusions,
followed by less-detailed environmental assessments for individual projects: The objective of this policy
is to gain economies of scale and scope in conducting
EISs, addressing common issues across multiple
projects in a common area and saving time and
expense. Issues that are unique to a certain project
are addressed in a less detailed, site-specific EIS.
Develop a PEIS for a broad geographic area followed by detailed EISs for selected individual projects: This
example is similar to the previous example, with the exception that the project-specific EISs are
more detailed. A PEIS evaluates the impacts and identifies appropriate mitigation for a range of
standard technologies to be installed in a relatively uniform environment. The completed PEIS
provides guidance to developers and regulators for subsequent specific development proposals.
In the United States, if the same technologies are proposed with the mitigation recommended by
the PEIS, the subsequent National Environmental Policy Act (NEPA) review can focus only on
unique aspects of the specific technologies or environment at the proposed wind farm site and
cable route. This can significantly reduce the NEPA review period. A PEIS will generally take a
couple of years to complete, but if initiated early - for example, during the initial WEA
identification and competitive auction processes - it can significantly expedite final review of the
winning leaseholder’s project. This is especially true if programmatic EISs or Environmental
Assessments (EAs) are conducted for WEAs simultaneously with the lengthy process to
determine the winning bidders in areas where competitive interest exists.
BOEM has announced
competitive auctions in MD,
MA, and NJ in 2014.
A programmatic EIS
addresses common issues
across multiple projects.

Offshore Wind Market and Economic Analysis Page 82 Document Number DE-EE0005360
2.5.1.4 Operations
There are multiple examples for the environmental and safety compliance monitoring of offshore wind
plants, which address the issues of public resistance and uncertain environmental impacts. These
examples differ primarily in the party responsible for conducting monitoring activities.
Environmental and safety compliance monitoring by the government: A government agency is
responsible for conducting monitoring activities prior to, during, and after construction of an
offshore wind farm to assess a baseline characterization of the local environment and any
subsequent changes.
Self-monitoring by developers or operators: The developer or operator of a wind farm monitors the
impact of its offshore wind farm on the environment and submits the monitoring data to a
government agency for verification.
Monitoring by third parties: A certified, independent third party monitors the impact of an
offshore wind farm on the environment and submits the monitoring data to a government
agency for verification.
In May 2014, the BSEE issued an RFP to conduct a study of OSW inspection procedures and recommend
a general approach and standards for OSW inspections. After review of the study, BSEE will propose
regulations.
2.5.2 Current U.S. and State Policies
2.5.2.1 Leasing
BOEM has taken an active role in conducting auctions for leases in federal waters.
On July 31, 2013, BOEM held the first-ever competitive
lease sale for renewable energy in federal waters south of
Rhode Island and Massachusetts. BOEM auctioned the
area as two leases: the 97,500-acre North Lease and the
67,250-acre South Lease, located about 9.2 nautical miles
south of Rhode Island. According to a recent NREL
report, the North Lease has the potential for installed
capacity of 1,955 MW and the South Lease for 1,440 MW.
Rhode Island-based Deepwater Wind was the winning
bidder, with a bid of $3.8 million for the two sites. Deepwater Wind plans to construct five 6-MW
turbines within 3 miles of Block Island, Rhode Island, in 2014 and monitor their performance while
seeking offtake agreements for the larger wind farm, including into New York.
On September 4, 2013, BOEM held the second competitive lease sale for a commercial lease area offshore
Virginia. Dominion Virginia Power was the winning bidder, with a winning bid of $1.6 million for the
single 112,800-acre site. The acreage is located 23.5 nautical miles from Virginia Beach, with a potential
for over 2,000 MW. Dominion first plans to construct two 6-MW Alstom turbines on the edge of the
WEA and monitor their performance before constructing the large wind farm in subsequent phases.
BOEM held the first two
competitive lease sales for
renewable energy in federal
waters offshore Rhode Island
and Virginia in 2013.

Offshore Wind Market and Economic Analysis Page 83 Document Number DE-EE0005360
BOEM held a competitive lease sale for Maryland’s Wind Energy Area on August 19th, 2014. Sixteen
companies were determined to be legally, technically and financially qualified to participate in the
auction. BOEM auctioned the area as two leases: the North Lease Area will include 32,737 acres and the
South Lease Area will include 46,970 acres. US Wind Inc. submitted the provisionally winning bid for
both lease areas, for a total bid of $8,701,098.38
In July 2014, BOEM announced a Proposed Sale Notice for the New Jersey Wind Energy Area. BOEM
proposes to auction the area as two leases: the South Lease Area (160,480 acres) and the North Lease
Area (183,353 acres), for a total of 344,000 acres.
In addition, BOEM has announced plans for a competitive auction in Massachusetts in 2014 and issued a
Call for Information after determining there is competitive interest for the NYPA lease area off New
York.39 The winning bidder must submit a site assessment and a construction and operations plan by
2014, complete surveys within three years after that, and then submit the work for federal review, which
could take another three years.
On Aug. 11, 2014, BOEM announced that it has identified three Wind Energy Areas (WEAs) offshore
North Carolina:
The Kitty Hawk WEA begins about 24 nautical miles (nm) from shore and extends
approximately 25.7 nm in a general southeast direction. Its seaward extent ranges from 13.5 nm
in the north to .6 nm in the south. It contains approximately 21.5 Outer Continental Shelf (OCS)
blocks (122,405 acres).
The Wilmington West WEA begins about 10 nm from shore and extends approximately 12.3 nm
in an east-west direction at its widest point. It contains just over 9 OCS blocks (approximately
51,595 acres).
The Wilmington East WEA begins about 15 nm from Bald Head Island at its closest point and
extends approximately 18 nm in the southeast direction at its widest point. It contains
approximately 25 OCS blocks (133,590 acres).40
38 BOEM (2013d) 39 79 Federal Register at p. 30649, May 28, 2014. 40 BOEM (2013i)

Offshore Wind Market and Economic Analysis Page 84 Document Number DE-EE0005360
U.S. states are taking a variety of approaches to offshore wind site selection and leasing. Common
themes include forming panels or task forces to engage local stakeholders and to coordinate state efforts
with BOEM and various regional consortia. Figure 2-2 provides a high-level summary of state-level
policies that are being employed, and further details are provided in Appendix B.
Figure 2-2. Site Selection and Leasing Policies in U.S. States
Source: Navigant analysis
2.5.2.2 Permitting
On February 3, 2012, BOEM issued a Notice of Availability for the final EA, and a Finding of No
Significant Impact (FONSI) for commercial wind lease issuance and site assessment activities on the
Atlantic OCS offshore New Jersey, Delaware, Maryland, and Virginia (BOEM 2013g). Instead of waiting
for the site assessment plan (SAP) to be filed to trigger the SAP NEPA review, BOEM initiated a
programmatic environmental assessment (PEA) for these four states simultaneously. By covering all
major site assessment and characterization technologies and their impacts, this PEA is expected to enable
more expeditious review of developers’ site assessment proposals in these four states. The PEA was
conducted during the nomination of lease sites in Maryland and Virginia and did not delay those calls
for information and leases. Winning bidders in Maryland and Virginia may seek expedited EAs and
departures from certain SAP requirements. To do so, they must use one of the standard wind

Offshore Wind Market and Economic Analysis Page 85 Document Number DE-EE0005360
measurement technologies that the PEA has already determined do not to cause significant impacts with
appropriate mitigation. Even if one or two issues must be addressed that were not covered in the PEA,
then only those issues need be addressed, and the EA can be reviewed and issued more promptly than
an EA covering all the site assessment issues.
Similarly, BOEM could eventually determine routine measurement activities as “categorical excluded,”
meaning they do not individually or cumulatively have a significant effect on the human environment
and would require no EA or EIS. The Council of Environmental Quality (CEQ) issued new guidance in
2011 on establishing and maintaining categorical exclusions for routine activities. Many oil and gas
exploration activities have been granted categorical exclusions. Over time, BOEM has acknowledged that
turbine construction may warrant an EA and that site assessment activities, such as installing a
meteorological tower, could become routine and may warrant categorical exclusions instead of EAs.41 As
BOEM and other federal agencies review more measurement technologies, they will be able to issue their
NEPA reviews more expeditiously and accelerate the permitting process.
States have a regulatory role when a wind energy project is
proposed for construction in federal or state waters. Under the
Submerged Lands Act, states have authority generally over the
first three nautical miles of a state’s coastal submerged lands, and
states have passed coastal management laws and developed
permitting and leasing programs for activities in state submerged
lands. Offshore wind energy projects proposed in state waters could be subject to a comprehensive
regulation that is managed by a single state agency or to permitting authorities managed by multiple
state and local agencies. For example, Massachusetts, Rhode Island, Ohio, and New York have state
siting boards that coordinate other state agencies and provide one-stop permitting for in-state generation
as well as the interconnection cables offshore and onshore.
States will have a regulatory role for projects in federal waters if a portion of the federal project (e.g., a
cable) is constructed in state submerged lands. Furthermore, the Coastal Zone Management Act (CZMA)
gives states the authority to require that projects in federal waters are consistent with that state’s coastal
zone policies and the federally-approved coastal zone management program. This state review process is
frequently referred to as a CZMA “consistency review.”
2.5.2.3 Operations
Federal and state authorities with jurisdiction currently approve energy facilities subject to conditions on
construction and operation, which protect the public and environment from new facilities. For offshore
wind farms, such conditions may include the following:
41 BOEM stated when issuing its Final Rule on offshore leasing: “After the impacts and related mitigation of
renewable energy activities on the OCS are better understood, it is possible that projects may require an EA. As the
program matures, MMS will review the impacts from the program and make a determination whether we can
recommend categorical exclusions for certain activities to the Council on Environmental Quality.” 74 Federal
Register 19,689.
States have authority
generally over the first three
nautical miles.

Offshore Wind Market and Economic Analysis Page 86 Document Number DE-EE0005360
Restrictions on public access to the facility for public safety
Restrictions on operation during extremely high winds that could cause catastrophic failure and
loss of the blades
Post-construction environmental monitoring surveys of birds, bats, and marine mammals
Seabed inspection of potential s scouring around the foundations to ensure ongoing protection
of the environment and mitigation of any significant effects that may arise
The U.S. Fish and Wildlife Service (USFWS) negotiates the survey protocols for avian and bat studies,
which include post-construction monitoring through their jurisdiction under the Endangered Species
Act and the Migratory Bird Treaty Act. BOEM has issued new guidelines for avian and bat surveys and
coordinates the review of such surveys in its role as Lead Federal Agency under NEPA. The USFWS has
issued new guidelines for avian and bat surveys for terrestrial wind farms and is beginning to consider
guidelines for surveys for offshore wind farms. Earlier studies identified flashing red lights as providing
a deterrent effect, unlike flashing white lights, which attract some species. Government-sponsored
studies may help identify additional technologies that may deter birds from flying through offshore
wind farms.
BOEM also has issued new guidelines for marine mammals and sea turtles and coordinates the review of
such surveys in its role as Lead Federal Agency under NEPA. 42
Cape Wind has agreed to conduct three years of post-
construction avian and bat aerial and boat-based surveys as a
condition of their BOEM lease. The cost of these post-
construction surveys will exceed $1 million per year.
While more limited post-construction monitoring of mammals is also required for the Cape Wind
project, the biggest concern about marine mammals is contact, or “allision,” with vessels. The
construction period requires the use of many large vessels and therefore requires mitigation measures to
protect endangered or threatened marine mammals, such as the following:
Reduced vessel operating speeds
Trained, independent protected species observers
Hydro-acoustic monitoring
Construction delays and shutdowns when certain mammals are within exclusion zones
In a first of its kind collaboration, a coalition of leading environmental organizations and offshore wind
developers has agreed to a series of voluntary measures that will protect critically endangered North
Atlantic right whales, while helping to expedite responsible offshore wind development, in the Mid-
Atlantic. Building upon proposed federally mandated protections, the Conservation Law Foundation
42 Guidelines for Providing Information on Marine Mammals and Sea Turtles for Renewable Energy Development
on the Atlantic Outer Continental Shelf Pursuant to 30 CFR Part 585 Subpart F
The cost of Cape Wind’s
avian and bat surveys will
exceed $3 million.
Offshore Wind Market and Economic Analysis Page 87 Document Number DE-EE0005360
(CLF), the National Wildlife Federation (NWF) and the Natural Resources Defense Council (NRDC),
working together with Deepwater Wind, Energy Management, Inc. (owner of Cape Wind in
Massachusetts) and NRG Bluewater Wind, drafted a set of protective measures that these developers
will voluntarily implement over the next four years in areas designated by the administration as Mid-
Atlantic Wind Energy Areas, which stretch from New Jersey to Virginia (map available at
http://on.doi.gov/UWoNPF).43
Small vessels make O&M visits to offshore turbines, but these visits occur only a couple of times per year
and are thus much less threatening to marine mammals.
Further government studies of the mating and calving grounds and migratory routes of endangered
whales may help to site wind farms safe distances from the whales and provide more protection during
construction and operation of wind farms (BOEM 2014).
43 The agreement reduces the threat to right whales by limiting meteorological tower construction and certain other
activities during the peak migration season, when whales travel through the mid-Atlantic region between southern
calving and northern feeding grounds. During other times of the year, when the whales frequent the area less, the
activities may take place with additional protective measures. These additional protective measures include
enhanced real-time human monitoring for whale activity in the site area and restriction of activities to daylight
hours when whales can be spotted, the use of noise-reducing tools and technologies, and a lower speed limit for
vessels in the area during migration times to avoid ship strikes. The full details of the agreement can be found at
http://docs.nrdc.org/oceans/files/oce_12121101a.pdf.

Offshore Wind Market and Economic Analysis Page 88 Document Number DE-EE0005360
Great Lakes States and Offshore Wind: Riding the Waves of State Leadership
The excellent to superb wind resources over the Great Lakes offer potential to generate over 700
GW of wind energy. This represents about one-fifth of the total offshore wind potential in the U.S.
Despite the great wind resource and the potential to power urban centers such as Milwaukee,
Chicago, Cleveland, Erie, or Buffalo, not one offshore wind project is under construction or
operating in the Great Lakes.
The reasons offshore wind has not yet become a reality lie partly in the ebb and flow of state policy
leadership for renewable energy generally and offshore wind in particular. This story played out in
slightly different ways across the region over the past half-decade. Following the U.S. financial
crisis of 2007 that triggered a recession leaving millions without jobs, U.S. state and federal policy
leaders looked toward the renewable energy industry to create green jobs and lead their states into
economic recovery. Starting in 2008, four Great Lakes states (WI, MI, OH and NY) – began to
investigate the feasibility and opportunities to develop offshore wind. Guided by state leadership
both in the executive and legislative branches, the prospects of offshore wind development in the
Great Lakes were explored through multi-stakeholder committees or task forces and agency-led
initiatives.
Under the Doyle administration, the Public Service Commission of Wisconsin (PSC) opened a
docket (5-EI-144) to explore offshore wind in 2008, which produced a report known as Wind on the
Waters (WOW). That report examined the feasibility of developing offshore wind in lakes
Michigan and Superior from technical, economic, environmental and legal standpoints. The WOW
report was released in 2009, but opposition in the state legislature prevented follow-up action. This
same opposition halted the expansion of the state’s Renewable Portfolio Standard (RPS) to 25
percent by 2025 which was a high priority for former Governor Doyle.
During the same time period, former Michigan Governor Jennifer Granholm made green job
creation a focus to her second term (2007-2011). Passage of a state RPS was part of a strategy to
promote renewable energy that included offshore wind. In 2009, Granholm issued an Executive
Order establishing the Great Lakes Offshore Wind Council (GLOW Council) to map the most and
least favorable areas for offshore wind in Michigan’s Great Lakes waters. The final GLOW Council
report identified five “most favorable” Wind Resource Areas that are: 45 meters or less in depth, at
least six miles offshore, and at least 20 contiguous square miles. The GLOW Council report also
proposed a state legislative framework that included permitting guidelines, leasing methods,
payment structures, and a public input process. Legislation was introduced into the Michigan
House of Representatives in 2010 (House Bill 6564) based on the GLOW Council recommendations,
but that legislation never received serious consideration by the legislature. Subsequent changes in
state leadership and changes in electric energy markets significantly slowed interest in moving
legislation and the development of an offshore wind regulatory framework in Michigan.

Offshore Wind Market and Economic Analysis Page 89 Document Number DE-EE0005360
Great Lakes States and Offshore Wind: Riding the Waves of State Leadership (cont.)
Similar attempts to make offshore wind a reality were made by Ohio state leadership. Around the
same time in 2008, former Ohio Governor Ted Strickland (2007 -2011) signed the state's RPS, calling
for 25 percent of the state's energy to be produced by renewable by 2025 and supported other
efforts to transform Ohio into a hub for the renewable energy industry. Riding on this wave of state
support, a local group in the Cleveland metropolitan area sought to be the first to develop an
offshore wind project in Lake Erie. See Section 1.2.3.5 for a description of the LEEDCo project. Since
2011, state leadership on renewables and wind energy has seen a noticeable decline. Ohio
Governor John Kasich (2011 to present) supports the 2014 Ohio Senate Bill 38 that would suspend
the state RPS for two years. Additionally, a GIS-based offshore wind favorability analysis mapping
tool that was released in 2009, was removed from the state’s web site in 2012.
New York has experienced similar moves away from interest in Great Lakes offshore wind. In
December 2009, New York Power Authority (NYPA) issued a Request for Proposals for offshore
wind projects in New York State waters of Lake Erie and/or Lake Ontario and proposals were
received in 2010. However, after reviewing the proposals, NYPA announced in 2011 that it was not
economically feasible to move forward with the offshore wind on New York’s portion of the Great
Lakes. Meanwhile, New York has continued and augmented its interest in offshore wind on the
state’s Atlantic coast.
Responding to earlier wave of interest in offshore wind coupled with regulatory uncertainty, five
Great Lakes Governors (IL, MI, MN, NY, and PA) and 10 federal agencies signed a bipartisan
federal-state Memorandum of Understanding (MOU) in March 2012 to support the efficient,
expeditious, orderly and responsible review of proposed offshore wind energy projects in the
Great Lakes. It was envisioned that this effort would produce a regulatory roadmap documenting
existing regulatory and review requirements for offshore wind at the federal and state levels.
Mirroring trends in individual states, however, interest in implementing the MOU has since waned
considerably.
In contrast to the other Great Lakes states, Illinois has continued to demonstrate serious interest in
offshore wind. The Illinois Department of Natural Resources (IDNR)-led Lake Michigan Offshore
Wind Energy Advisory Committee produced a report to the Governor and General Assembly in
June, 2012 which ultimately resulted in enactment of the Lake Michigan Wind Energy Act in
August, 2013. The law requires the IDNR to develop an offshore wind “siting matrix” to identify
preferred or prohibited development areas in the lake which would inform regulatory decisions
regarding leases or permits for offshore wind projects.
Presently, none of the Great Lakes states has a policy (e.g., laws or regulations) or permitting
program designed to address the permitting issues specific to offshore wind. Despite current weak
state leadership and related interest in offshore wind, institutional mechanisms (e.g., laws and
policies) to properly evaluate offshore wind such proposals—and a formal structure to engage the
public offshore wind decision-making—will equip state regulators and the public to make
informed decisions about the merits and disadvantages of a proposed project when project
proposals do arise.

Offshore Wind Market and Economic Analysis Page 90 Document Number DE-EE0005360
2.5.3 Current Policies in Europe
Table 2-8 summarizes the regulatory policies currently in place in selected countries in Europe. The first
row of Table 2-8 describes the challenges in each policy area that exist in the U.S. Detailed descriptions of
these policies are provided in Appendix C.
Table 2-8. Policies that Address Regulatory Challenges in Europe
Country Planning and Concessions Permitting Operations
Challenge for
the U.S.
Uncertain site selection
process and timeline Fragmented permitting
process
Environmental and
public resistance
Belgium Seven areas identified
and reserved for offshore
wind development,
totaling 2.2 GW
All areas have been
conceded, two are in
operation, one is under
construction
A public body, MUMM, is
responsible for carrying
out the EIA in
collaboration with the
project developer
Developers must
deploy environmental
monitoring programs
Denmark Centralized spatial
planning procedure
Developers can either
respond to tenders from
the DEA or apply to
develop a site
Six offshore wind areas
have been identified.
Tenders will be organized
this year for 1.5 GW of
projects: two offshore and
a combination of near-
shore projects
The Danish Energy
Agency (DEA) is a one
stop shop
The DEA is responsible
for providing an EIA
Developers must have
comprehensive
environmental
monitoring programs

Offshore Wind Market and Economic Analysis Page 91 Document Number DE-EE0005360
Country Planning and Concessions Permitting Operations
France Six areas identified for
offshore wind development,
totaling 3 GW and awarded
through two rounds of
tenders in 2012 and 2013
A concession from the
state on the maritime
domain will be
required but has not
been granted to any
project yet. The terms
of this concession
remain to be fully
negotiated, as there are
no relevant precedents
Projects must still
obtain separate
construction permits
and there is
uncertainty as to what
kind of legal recourses
may apply to both the
concession and these
permits
Tender document
include the fact that
each tenderer has to
design, build, operate
and dismantle the
assets with a view to
minimize the impact
on the environments in
terms of species,
landscape and
surrounding marine
environment
Germany Five priority areas for
offshore wind identified in
the German North and Baltic
Seas
Central position of BSH,
the sole licensing authority.
First come first served
principle.
Developers are
responsible for
baseline assessment
and annual monitoring
Netherlands OSW zones have been
identified
Plan to speed up offshore
wind deployment
published in 2013 (SDE
scheme extended, grid
connection facilitated)
MTPW is a one stop shop
with an integrated
assessment framework
Developers must
monitor the project’s
impact on the
environment
United
Kingdom
Extensive marine spatial
planning
Nine zones identified for
Round 3
80-year leases for
Round 3
One stop shop
approach
New Infrastructure
Planning process for
OSW permitting
Developers are
responsible for
monitoring
environmental impacts
Source: Navigant analysis

Offshore Wind Market and Economic Analysis Page 92 Document Number DE-EE0005360
2.6 Summary
Table 2-9 is a summary of policy examples that have been used or proposed to address the various
barriers to the U.S. offshore wind industry. The left column of the table lists the policies in each area that
have been successfully used by European or U.S. federal or state jurisdictions as described in Sections 2.3
to 2.5. The right column of the table provides a summary of U.S. and state offshore wind policy
developments in 2014.
Table 2-9. Offshore Wind Policy Examples and Developments
Barrier Policy Examples 2014 U.S. Developments
Co
st C
om
pet
itiv
enes
s
Long-term contracts for power
ORECs
ITC for developers
PTC for developers
Low-interest loans and
guarantees
Accelerated depreciation
State FiTs
The U.S. PTC and ITC expired for
projects that did not begin construction44
by year-end 2013. The 50% first-year
bonus depreciation allowance also
expired in 2013.
The DOE announced three projects that
will receive $47 M each to complete
engineering and construction as the
second phase of the Offshore Wind
Advanced Technology Demonstration
Program.
Maryland began promulgating rules for
ORECs for up to 200 MW.
The New Jersey Board of Public Utilities
rejected a proposal for ORECs by
Fishermen’s Energy for a five-turbine
project off Atlantic City, NJ.
The Maine Public Utility Commission
approved a term sheet with a team led
by the University of Maine for a pilot
floating wind turbine project.
44 More info on the IRS definitions are available at http://www.irs.gov/pub/irs-drop/n-13-29.pdf and
http://www.irs.gov/pub/irs-drop/n-13-60.pdf

Offshore Wind Market and Economic Analysis Page 93 Document Number DE-EE0005360
Barrier Policy Examples 2014 U.S. Developments
Infr
astr
uct
ure
Promote utilization of existing
transmission capacity
reservations to integrate
offshore wind
Target BOEM Wind Energy
Areas and consider public
policy mandates, such as RPS,
as required by FERC
Reg
ula
tory
Lea
sin
g
Similar to BOEM’s ”Smart from the
Start” model - 4 stage authorization
process: (1) planning & analysis; (2)
leasing; (3) site characterization &
assessment; and (4) commercial
development
BOEM announced additional competitive
lease sales for renewable energy off
Massachusetts, Maryland and New Jersey in
2014.
Per
mit
tin
g Expedite lease auction process and
set efficient schedule for NEPA
review of leasing and permitting
process in accordance with CEQ
NEPA regulations
BOEM continues to issue leasing guidelines,
conduct marine research, lead stakeholder
meetings to revise WEAs, and hold
educational seminars to facilitate leasing and
permitting.
Op
erat
ion
s Self-monitoring of environmental
and safety compliance by
developers/ operators
Government and stakeholder working
groups are developing standardized
equipment certifications and construction
and operations safety protocols.
Source: Navigant
A review of European policies that are designed to stimulate demand (i.e., policies that address cost
competitiveness) indicates that a variety of approaches have resulted in significant offshore wind
development. A portfolio approach that incorporates multiple policy elements has also proven effective,
as evidenced by the U.S. land-based wind market, which has been stimulated through a mix of PPAs
with PTCs, ITCs, and RPSs.
Infrastructure policies have shown to be effective in reducing costs and ensuring the demand can be
filled. These policies help to put critical infrastructure components in place such as transmission and
ports. Mid- to long-term policies help to instill confidence in the market. Manufacturers built portside
manufacturing capacity in the United Kingdom and Germany after those countries signaled that long-
term demand would exist.
Regulatory policies also help to streamline the siting and permitting processes and provide more
certainty to investors. Clear and stable processes such as one-stop permitting are in place in most
European countries that are active in offshore wind. In the U.S., BOEM and many state governments are

Offshore Wind Market and Economic Analysis Page 94 Document Number DE-EE0005360
developing and implementing similar policies to eliminate uncertainty, reduce the time required for
development, and ultimately reduce the cost of offshore wind.

Offshore Wind Market and Economic Analysis Page 95 Document Number DE-EE0005360
3. Economic Impacts
3.1 Introduction
This section identifies the potential economic impacts of the U.S. offshore wind industry. It also provides
an update of the expected installed cost for a 500 MW reference plant in the Mid-Atlantic.
3.2 Scope of Update
The original intent of this annual report on economic impacts of the U.S. offshore wind industry was to
benchmark our 2012 projections against actual results in 2013 and 2014. However, as shown in Figure
1-3, our 2012 forecasts did not show installations in 2013 and 2014. Because of this, we did not project
any employment or economic impacts in 2013 and 2014, as shown in Figure 3-1 and Figure 3-2,
respectively. But we know – through press releases, conference presentations and conversations with
industry stakeholders – that people are currently employed in the U.S. offshore wind industry. As a
result, we decided to use this year’s report to assess current employment and investment to use as a
baseline for future studies. We first describe our data collection efforts and then the resulting levels of
employment and investment.
However, we begin the chapter with an update of our installed cost assumptions. We provide an update
because of new assumptions about plant design, refined cost data and new information from European
projects.
Summary of Key Findings – Chapter 3
Expected installed costs are 6% lower than our 2011 report, due to new data from European
projects and more refined estimates for U.S. projects.
Expected installed cost is now $2.86 billion or $5,700/kW for a 500 MW farm using monopiles.
Current employment could be between 500 and 5,000 FTEs, depending on where equipment is
being sourced.
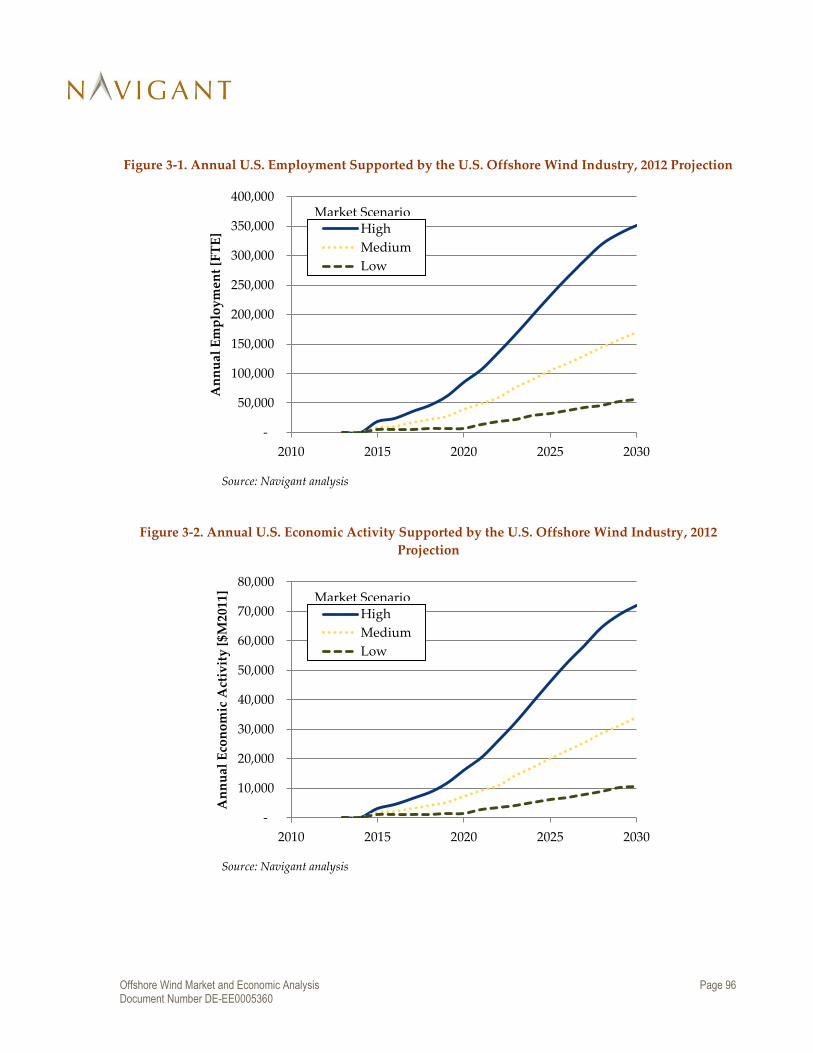
Offshore Wind Market and Economic Analysis Page 96 Document Number DE-EE0005360
Figure 3-1. Annual U.S. Employment Supported by the U.S. Offshore Wind Industry, 2012 Projection
Source: Navigant analysis
Figure 3-2. Annual U.S. Economic Activity Supported by the U.S. Offshore Wind Industry, 2012
Projection
Source: Navigant analysis
-
50,000
100,000
150,000
200,000
250,000
300,000
350,000
400,000
2010 2015 2020 2025 2030
An
nu
al E
mp
loy
men
t [F
TE
] High
Medium
Low
Market Scenario
-
10,000
20,000
30,000
40,000
50,000
60,000
70,000
80,000
2010 2015 2020 2025 2030
An
nu
al E
con
om
ic A
ctiv
ity
[$M
2011
]
High
Medium
Low
Market Scenario

Offshore Wind Market and Economic Analysis Page 97 Document Number DE-EE0005360
3.3 Installed Cost Update
3.3.1 Overview
Local employment and economic impacts are a function of the amount of spending and labor sourced
from the local economy. Before looking at local impacts, the Navigant Consortium collected information
on project-level costs at a higher level of detail than is typically reported in literature or project press
releases. Thus, the Navigant Consortium’s internal knowledge, expert interviews, and vendor quotes
were relied upon as sources of cost data. The remainder of Section 3.3 reviews data sources and findings
for each cost category.
3.3.2 Typical Project
Many project-specific variables such as water depth, foundation type, distance to shore, and turbine size
significantly impact costs for offshore wind farms. Thus, rather than collecting cost information for a
generic plant, the Navigant Consortium developed a reference project, summarized in Table 3-1, and
then collected cost data for this plant.
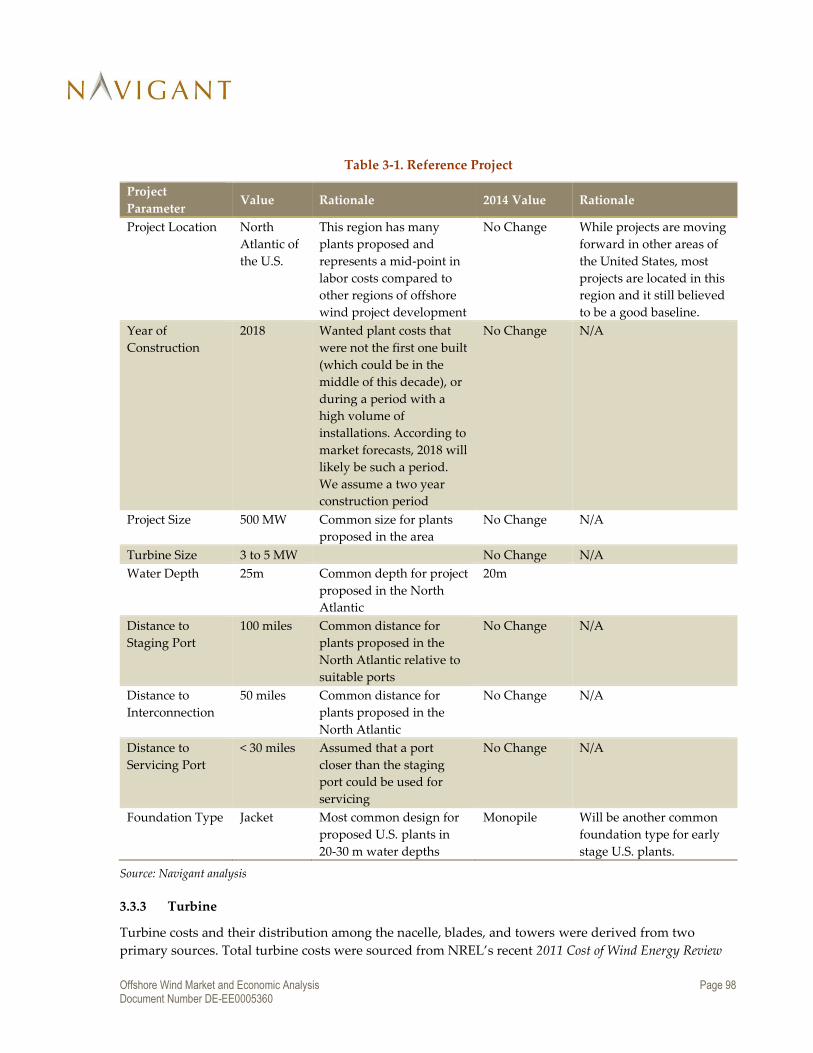
Offshore Wind Market and Economic Analysis Page 98 Document Number DE-EE0005360
Table 3-1. Reference Project
Project
Parameter Value Rationale 2014 Value Rationale
Project Location North
Atlantic of
the U.S.
This region has many
plants proposed and
represents a mid-point in
labor costs compared to
other regions of offshore
wind project development
No Change While projects are moving
forward in other areas of
the United States, most
projects are located in this
region and it still believed
to be a good baseline.
Year of
Construction
2018 Wanted plant costs that
were not the first one built
(which could be in the
middle of this decade), or
during a period with a
high volume of
installations. According to
market forecasts, 2018 will
likely be such a period.
We assume a two year
construction period
No Change N/A
Project Size 500 MW Common size for plants
proposed in the area
No Change N/A
Turbine Size 3 to 5 MW No Change N/A
Water Depth 25m Common depth for project
proposed in the North
Atlantic
20m
Distance to
Staging Port
100 miles Common distance for
plants proposed in the
North Atlantic relative to
suitable ports
No Change N/A
Distance to
Interconnection
50 miles Common distance for
plants proposed in the
North Atlantic
No Change N/A
Distance to
Servicing Port
< 30 miles Assumed that a port
closer than the staging
port could be used for
servicing
No Change N/A
Foundation Type Jacket Most common design for
proposed U.S. plants in
20-30 m water depths
Monopile Will be another common
foundation type for early
stage U.S. plants.
Source: Navigant analysis
3.3.3 Turbine
Turbine costs and their distribution among the nacelle, blades, and towers were derived from two
primary sources. Total turbine costs were sourced from NREL’s recent 2011 Cost of Wind Energy Review

Offshore Wind Market and Economic Analysis Page 99 Document Number DE-EE0005360
(Tegen et al. 2013), where pricing levels for offshore turbines between 3 MW and 5 MW exhibited a
relatively stable trend since 2011. Data reported suggest a representative turbine price of approximately
$1,800/kW for a 500 MW project (using 3.6 MW turbines), although the authors note a range between
from $1,600/kW and $2,400/kW. Evidence suggests pricing is driven by several factors including the
market power of turbine supplier, turbine technology (e.g., turbine rated power, drivetrain type), order
size, and contractual terms. Data reported by Tegen et al. (2013) were noted to have been sourced from
“recent publications (Douglas-Westwood 2010; BVG 2011; Deloitte 2011) and conversations with
offshore wind project developers in the United States.”
NREL’s Wind Turbine Cost and Scaling Model (Fingersh et al. 2006) was utilized to determine the requisite
allocation of costs among the three primary turbine components (i.e., the tower, blades, and nacelle) in a
land-based plant. This model suggested a general breakdown across an array of turbine sizes, both for
machines in production today as well as in prototype testing, of approximately 55% of turbine cost in the
nacelle/drivetrain, 25% in the blades, and 20% in the tower. It is recognized that these percentages could
vary based on significant differences in tower height, rotor diameter, or drivetrain design; however, in
the absence of a large sample of empirical data they were determined to be sufficient.
3.3.4 Foundation and Substructure
In 2011, initial input from a turbine manufacturer yielded jacket foundations as the preferred foundation
type for early offshore wind development in the U.S. Therefore, the initial analysis focused primarily on
jacket foundations.
For 2014, the Navigant Consortium considered updating the costs to fabricate jacket foundations for U.S.
projects. However, due to the hypothetical nature of the project, it was determined that updates to costs
were relatively insignificant to the range of cost values obtained by this study. Therefore, rather than
updating the jacket costs, the Navigant Consortium evaluated a second foundation and substructure
scenario. The 2014 scenario models a monopile foundation installed in 20m of water depth, in lieu of the
initial jacket foundation in 25m water depth.
Model and cost inputs assume that the steel required to monopile and transition piece would be sourced
within the U.S. Fabrication production rates are consistent with rates observed in the existing Gulf of
Mexico oil and gas fabrication industry. These rates are likely consistent with a semi-mature U.S.
offshore wind (OSW) fabrication industry as newly developed North Atlantic (the location of our typical
project) fabrication yards will have gained some experience from the first OSW projects, but not likely to
have invested fully in automated machinery, which will reduce the labor hours required and associated
costs. Labor rates were determined using a combination of Davis-Bacon prevailing wage rates and
construction labor rates published by the R.S. Means series for the state of Maryland, consistent with the
Mid-Atlantic project location. Open-shop (e.g., non-union) fabrication yards will cause a lowering of
costs. Therefore, the assumed labor costs are conservative.
Costs input to the JEDI model assume that fabrication and installation are two separate contracts.
Though it is possible to issue one RFP for the fabrication and installation of the foundation, the work
tasks are fundamentally different and costs are anticipated to be more competitive if bid independently
in order to prevent a supply chain bottleneck of qualified companies.

Offshore Wind Market and Economic Analysis Page 100 Document Number DE-EE0005360
Because jackets are assumed to be fabricated in the North Atlantic, it is reasonable to assume that the
fabrication yard will also serve as the foundation installation port; foundation and substructure
components will be shipped directly offshore on material barges.
Future projects will consider alternative foundation types, including monopile and gravity base
foundations. These two will be selected based on their proven track record in Europe for shallow and
transitional water (up to 40m or 130 ft.) depths.
3.3.5 Electrical System
Project Collection System
Our analysis assumes that a representative 3 or 5 MW turbine would be used. We used the 3 MW design
for costing - therefore, cost estimates plan for the material and installation of 167 (e.g., a 500 MW array
with 3 MW turbines) medium-voltage alternating current (MVAC) inter-array cables. These cables
would be laid on the seafloor, pulled into each respective turbine foundation and post-lay buried by a
tracked Remotely Operated Vehicle (ROV). Following best practices as recently evidenced in the
European market, the model treats inter-array cabling and export cabling as separate contracts. Costs
were compiled based on installation rates and costs observed in Europe.
HV Platforms
In 2011, based on industry knowledge available at the time, it appeared most projects built in 2018
would implement high voltage direct current (HVDC) export cable systems. For the 2011 analysis, power
was collected at two transformer stations, which stepped up the voltage. From the transformer stations,
the power was then moved by HVAC cables to a converter station, which converted the power from
HVAC to HVDC for the transit to shore. Upon arriving at the shoreline, another converter station
converted the power back to HVAC, which was assumed to tie in at the voltage of the existing network.
However, the offshore wind industry has not launched as
rapidly as predicted in 2011. Additionally, technology
advances have been made increasing the capability of
longer distance HVAC transmission networks. For the 2014
modeling effort, the Navigant consortium elected to use
two HVAC transformer stations, similar to the 2011 model.
However, for 2014, the power is then exported directly to
shore via two HVAC cables, rather than being converted to HVDC. This results in the addition of two
HVAC export cables. However; the savings from removing the costly HVDC converter station and
HVDC cable results in a net cost reduction for electrical system components.
Export cable
Current cost projections for the 2014 representative project update provide for two HVAC cables to
export power from the transformer stations to shore. Unlike the inter-array cables, long-distance export
cables will be laid and buried in place simultaneously by a plow towed behind the export cable vessel.
Technology advances have been
made increasing the capability of
longer distance HVAC
transmission networks.

Offshore Wind Market and Economic Analysis Page 101 Document Number DE-EE0005360
Following best practices, as recently evidenced in the European market, the model treats inter-array
cabling and export cabling as separate contracts, though cables may be installed by a single contractor.
Costs were extrapolated from contractors' cost estimates for U.S. projects with similar export cable
design parameters. Equipment, cost, and staffing data for the electrical system was collected from
interviews with existing cable manufacturers and installation contractors, proposal data from projects in
the United States, and from other in-house data. Projected costs were compared to numbers published
by reports commissioned by the U.S. Department of the Interior and Bureau of Offshore Energy
Management and case studies from European projects.
3.3.6 Development Services
Engineering (project and interconnection facility design)
Engineering costs were compiled based on an average of engineering costs observed for recently
completed projects in Europe. We assume the European experience will translate to U.S. projects. Costs
were converted to U.S. currency using an approximate exchange rate as observed on July 1, 2011.
Ports and staging
Costs provided for ports and staging were evaluated from
publicly reported development costs for ports in Europe
and one port in the U.S. that have been specifically
developed for the OSW industry. Costs for each port were
divided by the number of immediate projects they were
anticipated to serve. In practice, a significant amount of the
port development costs may be borne by the initial
projects. Once ports have been developed, use costs to future projects may be expected to decrease.
Investment in ports and waterways is one way that public investment could greatly support offshore
wind development, as well as other industries relying on water-based transportation. Therefore,
investment in port and navigation projects will have a compounding effect and the cost/benefit ratio will
be very favorable.
Air transportation (personnel or materials)
Air transportation for construction was based on 30 months of a quoted rate for a monthly charter of an
offshore-certified helicopter, capable of transporting up to six personnel or 1,000 lbs of equipment per
transit. The helicopter provider was located in the North Atlantic region and the quoted price is based
on establishing a temporary base of operations adjacent to the installation port.
Marine transportation (personnel or materials, including vessel mobilization)
For the 2011 model, jackets were transported by barge to the offshore site and installed by a jack-up
barge. For 2014, the monopiles are transported from the staging port to the offshore site by Self-
Propelled Installation Vessels (SPIV); that cost is considered in the Erection/Installation line.
Investment in ports and
waterways is one way that public
investment could greatly support
offshore wind development.

Offshore Wind Market and Economic Analysis Page 102 Document Number DE-EE0005360
For the 2011 model, it was assumed jackets would be fabricated in the Mid-Atlantic and deployed
directly from the fabrication facility and therefore did not require transportation to a staging port. For
the 2014 monopile scenario, it is assumed the monopiles are fabricated in the U.S. Gulf Coast area. Cost
to transport monopiles and transition pieces from the Gulf Coast to the Mid Atlantic is accounted for in
this line item. Marine transportation costs were obtained from U.S. offshore contractors as well as
reports prepared for BOEM and DOE.
Erection/installation (equipment services only, excludes labor)
For the JEDI model, the turbines will be installed by an independent turbine installation contract. The
2014 model update assumes that monopiles, transition pieces and turbines will all be installed by an
SPIV, as opposed to just turbines in the 2011 model. In this case, the U.S. is assumed to benefit from
European vessel experience and will have current "next generation" turbine installation vessels available.
Primary characteristics of the SPIV selected for this model include:
Cargo capacity: six complete turbines per trip
Steaming speed (when not restricted by navigation concerns): 10-14 knots
Installation rate: 3 days per turbine (inclusive of load, travel times, and weather delay)
Operating hours: (2) 12 hour shifts per day, work schedule 24/7/365
Workers are housed on vessel
Vessel support spread: two crew vessels, full time
Despite the relative complexity of the SPIV type vessels, they are likely to be available in a semi-mature
U.S. market due to the turbine OEMs’ prohibition of transferring sensitive turbine equipment between
floating vessels at sea. Though jack-up barges are another technically viable solution to transport and
install turbines, the faster steaming speed of the SPIV vessels relative to the jack-up barges is a strong
advantage given the anticipated 100-nautical-mile steaming distance for the representative project.
For both the turbine and foundation installation, the large installation vessels may be chartered with or
without installation crew. There has been a trend in Europe for installation vessel charter durations to
span multiple seasons and for vessels to work on multiple projects for one developer, reducing
mobilization costs to the developer. The long-term contracting arrangements are also preferred by
developers and vessel operators because the pipeline of projects allows the vessel standby times (and
therefore costs) to be reduced. The JEDI model input considers a vessel mobilization cost for each vessel
plus a monthly charter rate over the anticipated installation duration of the project. The smaller support
crew vessel day rates typically include the vessel master and crew.
3.3.7 Financing
Financing costs for an offshore wind farm include bank fees, insurance, due diligence costs, interest
payments during construction, and several other items. See the 2012 report’s appendix for a thorough
discussion of these items. The total cost for the typical project comes to $329M.
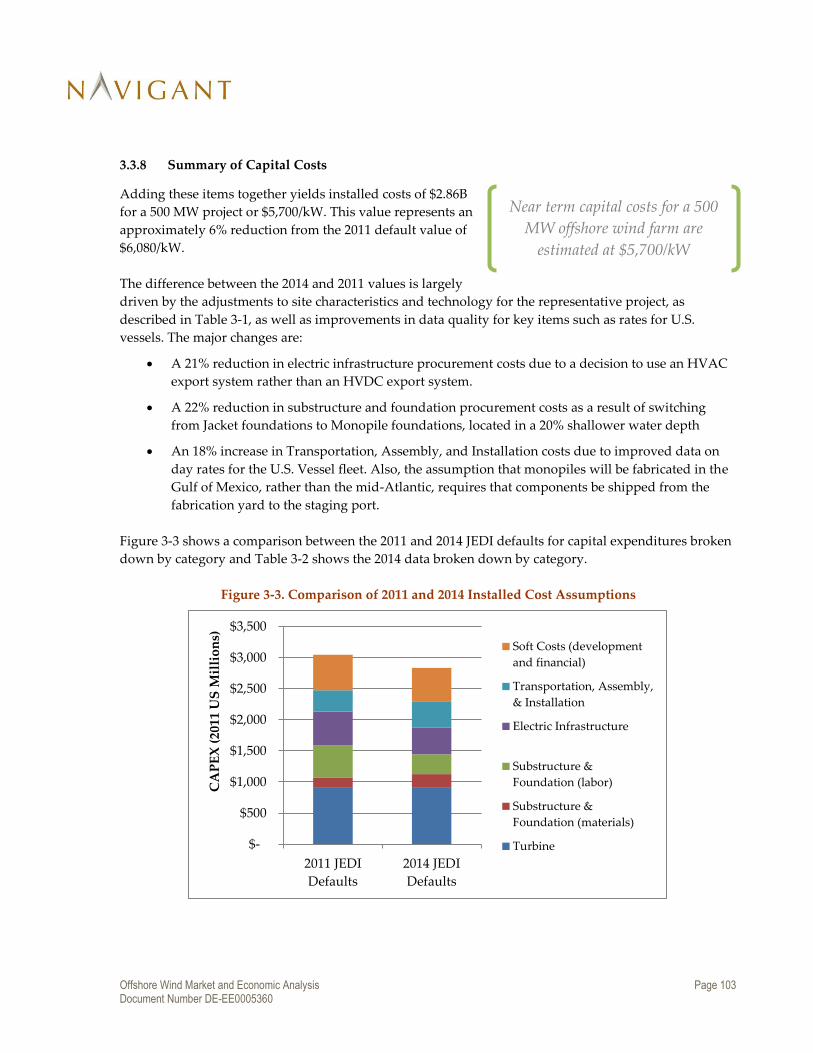
Offshore Wind Market and Economic Analysis Page 103 Document Number DE-EE0005360
3.3.8 Summary of Capital Costs
Adding these items together yields installed costs of $2.86B
for a 500 MW project or $5,700/kW. This value represents an
approximately 6% reduction from the 2011 default value of
$6,080/kW.
The difference between the 2014 and 2011 values is largely
driven by the adjustments to site characteristics and technology for the representative project, as
described in Table 3-1, as well as improvements in data quality for key items such as rates for U.S.
vessels. The major changes are:
A 21% reduction in electric infrastructure procurement costs due to a decision to use an HVAC
export system rather than an HVDC export system.
A 22% reduction in substructure and foundation procurement costs as a result of switching
from Jacket foundations to Monopile foundations, located in a 20% shallower water depth
An 18% increase in Transportation, Assembly, and Installation costs due to improved data on
day rates for the U.S. Vessel fleet. Also, the assumption that monopiles will be fabricated in the
Gulf of Mexico, rather than the mid-Atlantic, requires that components be shipped from the
fabrication yard to the staging port.
Figure 3-3 shows a comparison between the 2011 and 2014 JEDI defaults for capital expenditures broken
down by category and Table 3-2 shows the 2014 data broken down by category.
Figure 3-3. Comparison of 2011 and 2014 Installed Cost Assumptions
$-
$500
$1,000
$1,500
$2,000
$2,500
$3,000
$3,500
2011 JEDI
Defaults
2014 JEDI
Defaults
CA
PE
X (
2011
US
Mil
lio
ns)
Soft Costs (development
and financial)
Transportation, Assembly,
& Installation
Electric Infrastructure
Substructure &
Foundation (labor)
Substructure &
Foundation (materials)
Turbine
Near term capital costs for a 500
MW offshore wind farm are
estimated at $5,700/kW

Offshore Wind Market and Economic Analysis Page 104 Document Number DE-EE0005360
Table 3-2. 2014 Detailed Cost Breakdown
Cost
(2011$)
Cost
(2011$ per
kW
% of Total
Capital
Cost
Equipment Costs
Turbine Costs $917,500,000 $1,835 32%
Foundation & Substructure $206,545,000 $413 7%
Collection System $78,490,000 $157 3%
HV Cable, Converter, & Substations $349,109,000 $698 12%
Labor Costs1
Foundation & Substructure Installation Labor $309,828,000 $620 11%
Project Management (Developer/owners
management costs)
$8,500,00 $17 0%
Development Costs
Insurance During Construction $67,000,000 $134 2%
Development Services (Engineering, Legal, PR,
Permitting)
$28,900,000 $58 1%
Ports & Staging $45,000,000 $90 2%
Erection/Installation (equipment services only) $301,337,000 $603 11%
Air & Marine Transportation $79,890,000 $142 2%
Other Costs
Decommissioning Bonding $100,000,000 $200 3%
Interest During Construction $165,843,000 $332 6%
Due diligence, Reserve Accounts, Bank Fees $163,331,000 $327 6%
Miscellaneous $17,394,000 $35 1%
Total Construction Cost2 $2,860,701,000 $5,721
Source: Navigant analysis
3.4 Baseline Employment Estimate Update
Our data collection efforts consisted of an online survey sent to offshore wind industry stakeholders. We
then followed up via phone calls with key stakeholders (e.g. large developers or construction firms that
likely have significant employment in 2013) that did not respond to the online survey.
Finally, as shown in Table 1-2, several projects have reached an advanced stage and components are
likely being manufactured for those projects. However, many companies manufacture equipment for
both the onshore and offshore markets and do not track employment between the two. Also, we do not
have information on what components are being sourced domestically or purchased from countries with

Offshore Wind Market and Economic Analysis Page 105 Document Number DE-EE0005360
lots of offshore wind manufacturing. Given these uncertainties, we looked a range of possibilities on
what could be under fabrication now and how much is domestically sourced. We used our JEDI model
created in 2012 to assess potential levels of employment.
3.4.1 Online Survey
As discussed above, the Navigant Consortium sent out an online survey to offshore wind industry
stakeholders in early 2014. The survey included several questions on employment and investment, as
shown below.
How many full time U.S. employees do you currently have in each of these areas?
- Component or Subsystem Supplier
- Wind Turbine OEM
- Developer
- OEM
- EPC
- O&M
- Other
What % of total labor hours in each area are designated exclusively to offshore wind?
If you have employees dedicated to offshore wind, in what states are they located?
Has your company made any offshore wind specific investments this year? If so, what was the
amount and what category: (a) manufacturing, (b) construction, or (c) other?
107 people viewed the survey, 28 started it and 21 completed it. We received the most information for
the Developer and Other categories. To protect the privacy of individual respondents, we will only
report on totals, not individual industries or states. The total number of full time equivalents (FTEs) and
investment is shown in Table 3-3.
3.4.2 JEDI Estimates
We looked at the projects in [cite advanced stage projects table] and used the offshore wind JEDI model
to simulate the manufacturing related employment to support the projects that have 2015 and 2016
install dates. Items that could be in process include blade assemblies, processing of raw materials,
forgings and castings, turbine components, electrical sub components and cabling. We then picked a
range of possibilities for domestic sourcing and analyzed those using JEDI. The range of results is shown
in Table 3-3. The low end assumes no domestic sourcing and the high end assumes 100% domestic
sourcing.

Offshore Wind Market and Economic Analysis Page 106 Document Number DE-EE0005360
3.5 Results
Current employment levels could be between 550 and 5,150 FTE’s and investment could be between
$146 million and $1.1 billion. The range is driven by our uncertainty about where advanced stage
projects are sourcing components from. However, these numbers are several times higher than our 2013
estimates of 150 and 590 FTE’s and investment of between $21 and $159 million. Since our 2013 report,
more projects are at an advanced stage of development, driving more employment and investment of
2013.
Table 3-3. Estimated Employment in the U.S. Offshore Wind Industry
Data Source Total FTE’s Total Investment
Online Survey 550 $146M
Modeled Estimates 0 to 4600 0 to $968M
Total 546 to 5150 $146M to $1.1B
Source: Navigant analysis

Offshore Wind Market and Economic Analysis Page 107 Document Number DE-EE0005360
4. Developments in Relevant Sectors of the Economy
4.1 Introduction
The development of an offshore wind industry in the United States will depend on the evolution of other
sectors in the economy. This section identifies and evaluates the related economic sectors and their
potential impact on an offshore wind industry.
Summary of Key Findings – Chapter 4
The development of an offshore wind industry in the U.S. will depend on the evolution of
other sectors in the economy.
Two factors in the power sector will have the largest impact: the change in the price of natural
gas and the change in coal-based generation capacity.
Natural gas prices have remained less than $5/MMbtu for most of 2013 and 2014, aside from a
period over $6/MMbtu in early 2014.
Navigant analysis reveals actual and announced coal retirements of nearly 40 GW through
2020, not including implications associated with the Clean Air Act Section 111 carbon
standards proposed under the Obama Administration’s Climate Action Plan.
In 2013, about 50% of U.S. installed electricity generating capacity came from natural gas, and
nearly 30% came from solar.
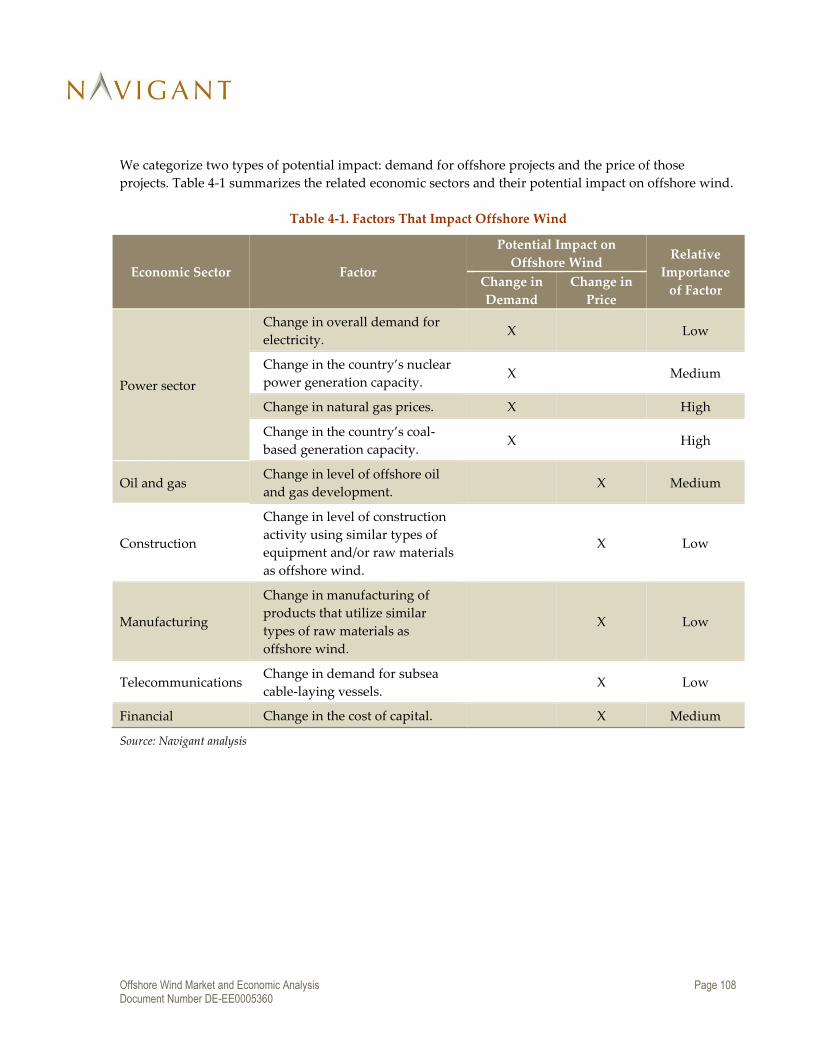
Offshore Wind Market and Economic Analysis Page 108 Document Number DE-EE0005360
We categorize two types of potential impact: demand for offshore projects and the price of those
projects. Table 4-1 summarizes the related economic sectors and their potential impact on offshore wind.
Table 4-1. Factors That Impact Offshore Wind
Economic Sector Factor
Potential Impact on
Offshore Wind Relative
Importance
of Factor Change in
Demand
Change in
Price
Power sector
Change in overall demand for
electricity. X Low
Change in the country’s nuclear
power generation capacity. X Medium
Change in natural gas prices. X High
Change in the country’s coal-
based generation capacity. X High
Oil and gas Change in level of offshore oil
and gas development. X Medium
Construction
Change in level of construction
activity using similar types of
equipment and/or raw materials
as offshore wind.
X Low
Manufacturing
Change in manufacturing of
products that utilize similar
types of raw materials as
offshore wind.
X Low
Telecommunications Change in demand for subsea
cable-laying vessels. X Low
Financial Change in the cost of capital. X Medium
Source: Navigant analysis

Offshore Wind Market and Economic Analysis Page 109 Document Number DE-EE0005360
4.2 Power Sector
4.2.1 Change in Overall Demand for Electricity
Factors such as population growth, changes in the level of economic activity, adoption of energy
efficiency and demand response measures, and changes in climate could impact the overall demand for
electricity in the United States. This, in turn, could impact the demand for offshore wind projects in the
United States. That said, electricity consumption in the United States has increased, on average, less than
1 percent per year over the last decade (see Figure 4-1). Significant increases in electricity consumption
are unlikely in the foreseeable future, due to moderate levels of economic growth and population
growth, as well as increasing levels of energy efficiency. An early release of the Energy Information
Administration’s 2014 Annual Energy Outlook report shows a 6 percent decrease in projected 2040 U.S.
population when compared to the 2013 report (EIA 2013a). A report by the American Council for an
Energy-Efficient Economy released in March of 2014 found that energy efficiency remains the least
expensive electric resource (Molina 2014).
Figure 4-1. U.S. Retail Electricity Sales: 2002-2013 (million kWh)
Source: EIA
4.2.2 Change in the Country’s Nuclear Power Generation Capacity
After the Fukushima nuclear accident in Japan in 2011, Germany decided to abandon over 20 GW of
nuclear power, closing eight plants immediately, with the remaining nine plants set to close by 2022.
Realizing the additional power generation capacity needed to avoid a supply shortfall, the country has
developed and begun to execute plans to install a significant number of large offshore wind farms in the
North and Baltic Seas. Through 2013, Germany’s installed capacity of offshore wind was 520 MW.
Navigant expects this to grow to greater than 10 GW by 2020. If another incident like Fukushima were to
0
500,000
1,000,000
1,500,000
2,000,000
2,500,000
3,000,000
3,500,000
4,000,000
2001 2002 2003 2004 2005 2006 2007 2008 2009 2010 2011 2012 2013

Offshore Wind Market and Economic Analysis Page 110 Document Number DE-EE0005360
occur somewhere in the world, it is at least feasible that the United States could contemplate a similar
retreat from nuclear power. The subsequent push to make up for the shortfall could increase offshore
wind development in the United States.
Similarly, an increased pro-nuclear attitude in the United States, potentially as a way to meet CO2-
reduction targets, could reduce offshore wind activity in the United States if the levelized cost of new
nuclear plants were to be more attractive than that of offshore wind. In early 2012, the United States
Nuclear Regulatory Commission approved the construction license for four new nuclear reactors, two in
South Carolina and two in Georgia. A fifth reactor is under construction in Tennessee. These would be
the first nuclear reactors built from scratch in the last 30 years. If these reactors are successfully
completed and become operational, their impact on the future of offshore wind in the United States is
unclear. There is also uncertainty around the expected LCOE from these new nuclear plants, as the
nuclear industry has not had a strong track record of meeting projected costs and schedules.
4.2.3 Change in Natural Gas Prices
Since 2000, most new power generation capacity in the United States has come from natural gas and
onshore wind (see Figure 4-2), partly in response to the environmental impacts of coal-fired electricity
generation. The early release of the EIA’s 2014 Annual Energy Outlook predicts that total electricity
generated by natural gas will surpass that of coal in the U.S. by 2035 (EIA 2013a).
Figure 4-2. U.S. Power Generation Capacity Additions by Fuel Type
Source: EIA
-
10
20
30
40
50
60
70
1985 1995 2005 2011 2020 2030 2040
GW
Other Renewables
Solar
Wind
Oil and Gas
Nuclear
Hydro/other
Coal

Offshore Wind Market and Economic Analysis Page 111 Document Number DE-EE0005360
In addition to having a lower carbon intensity than coal, natural gas prices have remained relatively low,
in large part to the supply of low-cost gas from the Marcellus Shale. Natural gas prices surpassed
$6/MMbtu in January 2010, but since then have largely remained below $5/MMbtu, including a low of
less than $2/MMbtu in April 2012 and a brief period above $6/MMbtu in early 2014 (see Figure 4-3).
Figure 4-3. Henry Hub Gulf Coast Natural Gas Spot Price 2007-2014
Source: EIA
This decline has reduced wholesale electricity prices and has made natural gas-fired generation sources
even more attractive than wind, in many cases. Continued low natural gas prices could greatly constrain
demand for offshore wind farms in the United States. However, if natural gas prices were to rise
significantly—for example, due to increased liquefied natural gas (LNG) exports—the attractiveness of
offshore wind as an electricity generation source in the U.S. could increase.
4.2.4 Change in the Country’s Coal-Based Generation Capacity
In recent years, some electric utilities in the U.S. have announced plans to retire coal-fired power plants
or to convert them to natural gas. There are multiple factors involved in these retirement decisions.
Many of the U.S.’s coal-fired power plants are over 50 years old and expensive to continue to operate
and maintain. Complying with environmental requirements, such as the U.S. Environmental Protection
Agency’s (EPA’s) mercury and air toxics standards can also be costly. Additionally, the rule submitted
by the Environmental Protection Agency in June of 2014 to require a 30% reduction in CO2 emissions
from existing power plants from 2005 emission levels by 2030 will likely impact retirement plans for
existing coal generators. Navigant analysis reveals actual and announced retirements of nearly 40 GW
through 2020. There is significant uncertainty in the projection of planned retirements before 2030 due to
Section 111 regulations proposed under the Obama Administration’s Climate Action Plan. While the
0
2
4
6
8
10
12
14
Jul-07 Jan-08 Jul-08 Jan-09 Jul-09 Jan-10 Jul-10 Jan-11 Jul-11 Jan-12 Jul-12 Jan-13 Jul-13 Jan-14
$/M
MB
tu

Offshore Wind Market and Economic Analysis Page 112 Document Number DE-EE0005360
reduction in generation capacity created through coal plant retirements will certainly not be filled
entirely by a variable-output resource such as wind, continued coal plant retirements could play a role in
increasing the demand for offshore wind plants in the U.S.
4.2.5 Change in the Country’s Renewable Generation Capacity
Under the scenarios of existing or future renewable energy policy in the U.S., it follows that the demand
for offshore wind could be influenced by market trends from other sources of renewable generation. U.S.
solar installations reached record levels in 2013, accounting for nearly 30 percent of all new electricity
generating capacity installations (SEIA 2014). U.S. onshore wind installations fell during 2013 due to the
uncertainties in federal tax incentives at the end of 2012. However, record levels of onshore wind
capacity were under construction in the U.S. at the end of 2013, and Navigant projects the installed
capacity to reach nearly 94 GW by the end of 2016.
4.3 Oil and Gas
4.3.1 Change in Level of Offshore Oil and Gas Development
Many of the initial installation vessels used in the offshore
wind sector were retrofitted from the offshore oil and gas
sector. While certain shipbuilders are designing and
building custom vessels for offshore wind development, it
can still be economical in some markets to upgrade vessels
from the oil and gas sector. An increase in offshore oil and
gas activity could limit the availability and/or increase the cost of these vessels for use in wind
applications, as they may be returned to service in the oil and gas sector. Indeed, Seajacks, a vessel
operator, indicates on its website that its “self-propelled vessels are suitable for installation and
maintenance of offshore wind turbines, and are also able to perform maintenance work on offshore oil
and gas platforms” (Seajacks 2013). Another potential issue is that the availability of laydown area and
cranes at key maritime ports could be constrained by offshore oil and gas activity. This issue, however, is
not expected to be as significant in the North and Mid-Atlantic as it is in the North Sea.
It can still be economical in some
markets to upgrade vessels from
the oil and gas sector.

Offshore Wind Market and Economic Analysis Page 113 Document Number DE-EE0005360
4.4 Construction
4.4.1 Change in Level of Construction Activity Using Similar Types of Equipment and/or Raw
Materials as Offshore Wind
The construction sector and the offshore wind sector use many of the same types of equipment and raw
materials. Construction projects such as roads, bridges, buildings, and sports stadiums require
equipment such as tall cranes and materials such as concrete and steel. Cranes are needed to lift wind
turbine tower segments and foundations and to preassemble rotors onshore. Wind turbine towers
require significant quantities of steel, while foundations may require concrete and/or steel. Since towers
represent about 7-8 percent of the cost of an offshore wind farm and the foundations and substructures
represent about 22-25 percent (Navigant 2012), the level of construction activity in the United States
outside of the offshore wind sector could impact the price of offshore wind power. Figure 4-4 shows the
evolution of commodity prices since 2002, which is a trend of generally increasing (and volatile in the
case of steel) prices.
Figure 4-4. Producer Price Index for Selected Commodities (2003-2013)
Base Year (100) = 1982
Source: United States Department of Labor, Bureau of Labor Statistics
100
120
140
160
180
200
220
240
2002 2003 2004 2005 2006 2007 2008 2009 2010 2011 2012 2013
Steel mill products Concrete products Construction machinery and equipment

Offshore Wind Market and Economic Analysis Page 114 Document Number DE-EE0005360
4.5 Manufacturing
4.5.1 Change in Manufacturing of Products That Utilize Similar Types of Raw Materials as
Offshore Wind
The manufacturing sector similarly uses many of the same raw materials as offshore wind. The
manufacture of automobiles, heavy equipment, and appliances, for example, requires significant
amounts of steel, a material used in wind turbine towers and offshore foundations. Manufacturing
sectors such as aerospace, automotive, and marine vessels use composite materials similar to those used
in wind turbine blades. Finally, rare earth materials such as neodymium are used in applications such as
the permanent magnets that are used in certain types of electric motors and electrical generators,
including those in many direct drive wind turbine generators.
The DOE (DOE 2010) estimates that supply situation for rare earth oxides of neodymium and
dysprosium will be “critical” not only over the short term (2010-2015) but also over the medium term
(2015-2025). The supply risk for praseodymium was characterized as “not critical”. Criticality matrices
from this report are shown in Figure 4-5.
Figure 4-5. Rare Earth Criticality Matrices
Sources: U.S. Department of Energy, Navigant
A 2012 report from the Massachusetts Institute of Technology’s Materials Systems Laboratory agrees
that neodymium and dysprosium will face supply challenges in the coming years (Alonso et al. 2012).
If the supply situation for rare earth metals remains tight and prices rise, so could the cost of offshore
wind production.
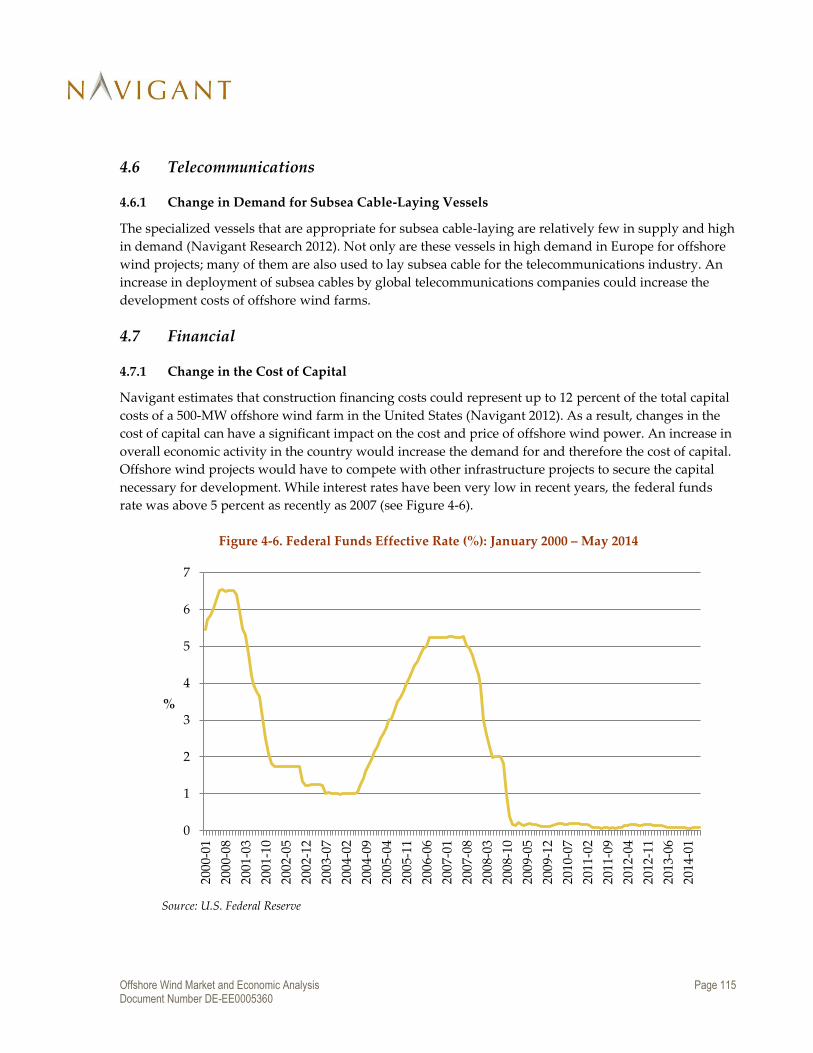
Offshore Wind Market and Economic Analysis Page 115 Document Number DE-EE0005360
4.6 Telecommunications
4.6.1 Change in Demand for Subsea Cable-Laying Vessels
The specialized vessels that are appropriate for subsea cable-laying are relatively few in supply and high
in demand (Navigant Research 2012). Not only are these vessels in high demand in Europe for offshore
wind projects; many of them are also used to lay subsea cable for the telecommunications industry. An
increase in deployment of subsea cables by global telecommunications companies could increase the
development costs of offshore wind farms.
4.7 Financial
4.7.1 Change in the Cost of Capital
Navigant estimates that construction financing costs could represent up to 12 percent of the total capital
costs of a 500-MW offshore wind farm in the United States (Navigant 2012). As a result, changes in the
cost of capital can have a significant impact on the cost and price of offshore wind power. An increase in
overall economic activity in the country would increase the demand for and therefore the cost of capital.
Offshore wind projects would have to compete with other infrastructure projects to secure the capital
necessary for development. While interest rates have been very low in recent years, the federal funds
rate was above 5 percent as recently as 2007 (see Figure 4-6).
Figure 4-6. Federal Funds Effective Rate (%): January 2000 – May 2014
Source: U.S. Federal Reserve
0
1
2
3
4
5
6
7
2000
-01
2000
-08
2001
-03
2001
-10
2002
-05
2002
-12
2003
-07
2004
-02
2004
-09
2005
-04
2005
-11
2006
-06
2007
-01
2007
-08
2008
-03
2008
-10
2009
-05
2009
-12
2010
-07
2011
-02
2011
-09
2012
-04
2012
-11
2013
-06
2014
-01
%

Offshore Wind Market and Economic Analysis Page 116 Document Number DE-EE0005360
5. Conclusion
The development of a comprehensive annual market report is an important step for the U.S. offshore
wind industry for two reasons. First, market assessments, especially those produced for government
agencies, provide stakeholders with a trusted data source. Second, the production of a comprehensive
assessment covering technical, regulatory, financial, economic development, and workforce issues will
annually inform the creation of policy to remove barriers facing the U.S. offshore wind industry.
This report provides readers with a foundation of information to guide U.S. offshore wind energy
development. As discussed in this report, significant technological advances are already unfolding
within the offshore wind industry, but more could be accomplished to direct needed improvements to
further reduce offshore wind costs and to stimulate needed infrastructure development. Policy examples
from Europe have shown that policy designs can stimulate offshore wind markets, but need to be
structured correctly to avoid high costs to rate payers. Although current U.S. offshore wind employment
levels and investment are modest, employment could be between 550 and 5,150 FTEs, and current
investment could be between 146 million and $1.1 billion.
The Navigant Consortium appreciates the important input and cooperation that participants in our
offshore wind survey, interviews, and workshops provided. It is hoped that the information provided
will prove to be a valuable resource for manufacturers, policymakers, developers, and regulatory
agencies to move the market toward a high-growth scenario for the offshore wind industry.

Offshore Wind Market and Economic Analysis Page 117 Document Number DE-EE0005360
References
A2SEA. (2014). Big foundations, big challenges. A2SEA News. November 11, 2013.
http://a2seanews.editionmanager.com/2013/11/11/big-foundations-big-challenges/
Aagaard, J. (2012). “An Ocean of Wind Turbines – Green Offshore.” Denmark.dk. ed no. 1.
http://denmark.dk/en/green-living/wind-energy/an-ocean-of-wind-turbines/
ABB Power Systems Consulting. (2012). Dominion Virginia Power Offshore Wind Interconnection Study.
https://www.dom.com/news/2012/pdf/dominion_offshore_public_report_3-13-2012.pdf
Alonso, Elisa, Andrew M. Sherman, Timothy J. Wallington, Mark P. Everson, Frank R. Field, Richard
Roth, and Randolph E. Kirchain. (2012). “Evaluating Rare Earth Element Availability: A Case with
Revolutionary Demand from Clean Technologies.” Environmental Science and Technology, 46 (6), pp
3406–3414. http://www.rareearthassociation.org/MIT-Ford%20Study.pdf
Alstom. (2014). Alstom signed its first export contract with Deepwater Wind in the US to supply the Haliade™
150-6 MW, the world’s largest installed offshore wind turbine. http://www.alstom.com/press-
centre/2014/2/alstom-signed-its-first-export-contract-with-deepwater-wind-in-the-us-to-supply-the-
haliade-150-6-mw-the-worlds-largest-installed-offshore-wind-turbine
Andresen, T. and Nicola, S. (2012). RWE Sees German Climate Goals Threatened by Grid Delays: Energy.
Bloomberg Online. July, 2012. http://www.bloomberg.com/news/2012-07-03/rwe-sees-german-
climate-goals-threatened-by-grid-delays-energy.html
Aubrey, C. (2009). “Europe’s Ports Compete for New Offshore Wind Business.” European Wind Energy
Association.
http://www.ewea.org/fileadmin/ewea_documents/documents/publications/WD/2009_september/Mi
ni_Focus_September_2009.pdf
Backwell, Ben. (2013). MHI to supply 700 7MW turbines to UK R3 projects – official. Recharge News.
February 28, 2013.
Blade Dynamics. (2013). ETI invests £15.5 million in new turbine blade design with blade dynamics to enable the
building of the world’s largest wind turbine blades. http://www.bladedynamics.com/news.html#tab4-
news
Bossler, A. (2013). “Floating Offshore Wind Foundations: Industry Consortia and Projects in the United
States, Europe, and Japan, An Overview.” Main(e) International Consulting. Accessed June 2013:
http://maine-intl-
consulting.com/resources/Floating+Offshore+Wind+Platforms+Consortia+for+web.pdf.

Offshore Wind Market and Economic Analysis Page 118 Document Number DE-EE0005360
Bremenports. (2011). “Offshore Terminal Bremenhaven: Information for Infrastructure Investors.”
file:///C:/Users/kmidura/Downloads/Offshore_Broschuere_eng.pdf
Bremenports. “Evolving into a Wind Energy Center: Offshore Terminal Bremerhaven.”
http://www.bremenports.de/en/company/our-skills/offshore-terminal-bremerhaven
British Broadcasting Company (BBC). (2012a). “Green Port Hull £210m turbine factory plans approved.”
9 May 2012. http://www.bbc.com/news/uk-england-humber-17993593
British Broadcasting Company (BBC). (2012b). “Vestas pulls out of plans for Sheerness wind turbine
factory.” 22 June 2012. http://www.bbc.com/news/uk-england-kent-18550638
Bureau of Offshore Energy Management (BOEM). (2013a). Commercial Lease for Wind Energy Offshore
Virginia. http://www.boem.gov/Renewable-Energy-Program/State-Activities/VA/Commercial-Lease-
for-Wind-Energy-Offshore-Virginia.aspx
Bureau of Ocean Energy Management (BOEM) (2013b). “Smart from the Start Wind Energy Areas.” Map
ID: PACB-2012-1060. Accessed September 25, 2013. Available at:
http://www.boem.gov/uploadedFiles/BOEM/Renewable_Energy_Program/Smart_from_the_Start/W
ind_Energy_Areas0607.pdf.
Bureau of Offshore Energy Management (BOEM). (2013c). “Delaware Activities.”
http://www.boem.gov/Renewable-Energy-Program/State-Activities/VA/Commercial-Lease-for-
Wind-Energy-Offshore-Virginia.aspx
Bureau of Offshore Energy Management (BOEM). (2013d). “Maryland Activities.”
http://boem.gov/Renewable-Energy-Program/State-Activities/Maryland.aspx
Bureau of Offshore Energy Management (BOEM). (2013e). “New Jersey Activities.”
http://boem.gov/Renewable-Energy-Program/State-Activities/New-Jersey.aspx
Bureau of Offshore Energy Management (BOEM). (2013f). “Rhode Island Activities.”
http://boem.gov/Renewable-Energy-Program/State-Activities/Rhode-Island.aspx
Bureau of Offshore Energy Management (BOEM). (2013g). “Virginia Activities.”
http://boem.gov/Renewable-Energy-Program/State-Activities/Virginia.aspx
Bureau of Offshore Energy Management (BOEM). (2013h). “Massachusetts Activities.”
http://boem.gov/Renewable-Energy-Program/State-Activities/Massachusetts.aspx
Bureau of Offshore Energy Management (BOEM). (2013i). “North Carolina Activities.”
http://boem.gov/Renewable-Energy-Program/State-Activities/North-Carolina.aspx
Bureau of Offshore Energy Management (BOEM). (2014). “Environmental Studies Program: Ongoing
Studies.”

Offshore Wind Market and Economic Analysis Page 119 Document Number DE-EE0005360
http://www.boem.gov/uploadedFiles/BOEM/Environmental_Stewardship/Environmental_Studies/G
ulf_of_Mexico_Region/Ongoing_Studies/AT-10-x11.pdf
Business Wire. (2013). “Cape Wind and Siemens Sign Major Offshore Wind Turbine Supply Agreement.”
The Wall Street Journal. http://online.wsj.com/article/PR-CO-20131223-903255.html
BVG Associates. (2009). UK Ports for the Offshore Wind Industry: Time to Act. Department of Energy and
Climate Change. URN 09/511X. www.berr.gov.uk/files/file49871.pdf
BVG Associates. (2012). Offshore Wind Cost Reduction Pathways Technology Work Stream. The Crown Estate.
London. Available at:
http://www.thecrownestate.co.uk/media/305086/BVG%20OWCRP%20technology%20work%20strea
m.pdf
California Energy Commission (CEC). (2014). “Renewable Energy Transmission Initiative: Frequently
Asked Questions.” http://www.energy.ca.gov/reti/RETI_FAQ.PDF
Campbell, Shaun. (2013). “Setback for Deepwater Wind's Block Island project.” WindPower Offshore.
August 6, 2013. Accessed September 16, 2013. Available at:
http://www.windpoweroffshore.com/article/1194228/setback-deepwater-winds-block-island-project.
Carbon Trust. (2012). Foundation innovators. The Carbon Trust. London
http://www.carbontrust.com/media/105314/foundation_innovators_29may2012.pdf
Carbon Trust. (2014). DONG Energy and Carbon Trust team up to cut the costs of offshore wind.
http://www.carbontrust.com/about-us/press/2014/01/dong-energy-and-carbon-trust-team-up-to-cut-
the-costs-of-offshore-wind
Chapman, J.; Lantz, E.; Denholm, P.; Felker, F.; Heath, G.; Mai, T.; Tegen, S. (2012). "Wind Energy
Technologies," Chapter 11. National Renewable Energy Laboratory. Renewable Electricity Futures
Study, Vol. 2, Golden, CO: National Renewable Energy Laboratory; pp. 11-1–11-63.
Competitive Renewable Energy Zone (CREZ). (2013). Progress Report No.12, prepared by RS&H for the
Public Utility Commission of Texas, July 2013.
http://www.texascrezprojects.com/quarterly_reports.aspx
Composite World. (2013). DIAB core going into 83.5m long wind turbine blade. June 9, 2013.
Copley, M. (2014). “Cape Wind scores legal victories in environmental lawsuit.” 14 March 2014.
http://www.snl.com/Interactivex/article.aspx?CdId=A-27280521-14635
Copley, Michael. (2014). Fishermen’s Energy eyes appeal, litigation after NJ regulators reject offshore proposal.
SNL Financial. March 21, 2014.

Offshore Wind Market and Economic Analysis Page 120 Document Number DE-EE0005360
Crown Estate. (2013). “Lease agreement secures landmark floating wind project for UK.”
http://www.thecrownestate.co.uk/news-and-media/news/2013/lease-agreement-secures-landmark-
floating-wind-project-for-uk/
Danish Energy Agency. (2013). New Offshore Wind Tenders in Denmark.
http://www.ens.dk/sites/ens.dk/files/supply/renewable-energy/wind-power/offshore-wind-
power/new-offshore-wind-tenders/ewea_offshore_2013_all.pdf
Danish Energy Agency. (2014). “Large-Scale Offshore Wind Tenders.”
http://www.ens.dk/en/supply/renewable-energy/wind-power/offshore-wind-power/large-scale-
offshore-wind-tenders
Daubney, Katie. (2013). “IN DEPTH: Cost imperative drives monopiles to new depths.” Wind Power
Offshore. http://www.windpoweroffshore.com/article/1210058/depth-cost-imperative-drives-
monopiles-new-depths
de Vries, E. (2011). Close up - LM's 73.5-metre blade. Wind Power Monthly.
http://www.windpowermonthly.com/article/1109760/close---lms-735-metre-blade
de Vries, E. (2013a). Close up - Mitsubishi's 81-metre SeaAngel blade. Wind Power Monthly.
http://www.windpowermonthly.com/article/1184566/close---mitsubishis-81-metre-seaangel-blade
de Vries, E. (2013b). Close up - Testing the V164 80-metre blade. Wind Power Monthly.
http://www.windpowermonthly.com/article/1166174/close---testing-v164-80-metre-blade
DECC. (2010). Extension of the enduring offshore transmission regime to include the option of a generator
building assets, with a competitive tender transferring assets to OFTO. Department of Energy and Climate
Change. December 2010.
https://www.gov.uk/government/uploads/system/uploads/attachment_data/file/42574/1032-ia-
extension-offshore-transmission.pdf
Deepwater Wind, LLC (Deepwater Wind). (2014). “Deepwater Wind Selects Turbine Installation Vessel
for Block Island Wind Farm.” http://dwwind.com/news/deepwater-wind-selects-turbine-installation-
vessel-for-block-island-wind-farm
Degraer, S., Brabant, R. and Rumes, B., eds. (2012). Offshore Wind Farms in the Belgian Part of the North
Sea: Heading for an Understanding of Environmental Impacts. Royal Belgian Institute of the Natural
Sciences. http://www.mumm.ac.be/Downloads/News/winmon_report%202012_cor.pdf
Dodd, J. (2013). “1.5GW in Belgian capacity waiting for grid upgrade.” Wind Power Offshore. 26 March
2013. http://www.windpoweroffshore.com/article/1189499/15gw-belgian-capacity-waiting-grid-
upgrade
Dodd, J. (2014). “Iberdrola looks at Areva 8MW for St-Brieuc.” Wind Power Offshore.
http://www.windpoweroffshore.com/article/1297234/iberdrola-looks-areva-8mw-st-brieuc

Offshore Wind Market and Economic Analysis Page 121 Document Number DE-EE0005360
Douglas-Westwood. (2013). The World Offshore Wind Market Forecast 2013-2022. June 2013.
Elkinton, C., A. Blatiak, and H. Ameen. (2013). U.S. Offshore Wind Port Readiness. Garrad Hassan
America, Inc. Document No. 700694-USPO-R-03. Washington, DC: U.S. Department of Energy.
http://www1.eere.energy.gov/wind/pdfs/wind_offshore_port_readiness.pdf
Energi Styrelsen. (2013). “Procedures and Permits for Offshore Wind Parks.”
http://www.ens.dk/node/3206/procedures-permits-offshore-wind-parks
Energy Business Review. (2014). Bold Tern wins offshore wind turbine installation contract in US.
February 14, 2014.
Engblom, Andrew. (2014). Cape Wind lines up additional lenders, with $1B in debt financing now expected.
SNL Financial. March 26, 2014.
Esbjerg Kommune. New Energy: Esberj – A Natural Hub for the Offshore and Energy Technology Industries.
file:///C:/Users/kmidura/Downloads/New_Energy_Esbjerg.pdf
ESS Group, Inc. (2014). Offshore Wind Transmission Project DRAFT FINAL Report, May 28, 2014.
European Commission (EC). (2013). “Offshore Wind: Cobra Cable.”
http://ec.europa.eu/energy/eepr/projects/files/offshore-wind-energy/cobra-cable_en.pdf
European Investment Bank (EIB). (2011). “EIB supports key Dutch grid project to connect offshore wind
farms.” Reference: 2011-013-EN. 31 January 2011. http://www.eib.org/projects/press/2011/2011-013-
eib-supports-key-dutch-grid-project-to-connect-offshore-wind-farms.htm
EWEA. (2009a). Economics of Wind Energy. Brussels, Belgium: European Wind Energy Association.
EWEA. (2011). UpWind – Design limits and solutions for very large wind turbines. March 2011. Accessed
September 16, 2013. Available at:
http://www.ewea.org/fileadmin/ewea_documents/documents/upwind/21895_UpWind_Report_low_
web.pdf.
EWEA. (2012a). The European offshore wind industry key 2011 trends and statistics. Brussels, Belgium:
European Wind Energy Association.
Federal Maritime and Hydrographic Agency (BSH). (2013). Standard: Investigation of the Impacts of
Offshore Wind Turbines on the Marine Environment (StUK4). BSH-Nr. 7003.
http://www.bsh.de/en/Products/Books/Standard/7003eng.pdf
FERC. (2011). FERC approves transmission rate incentives for Atlantic Wind Connection. May, 2011.
http://www.ferc.gov/media/news-releases/2011/2011-2/05-19-11-E-1.asp
Offshore Wind Market and Economic Analysis Page 122 Document Number DE-EE0005360
Fornahl, D. (2011). From the old path of shipbuilding onto the new path of offshore wind energy? The
case of northern Germany. Druid Society.
http://druid8.sit.aau.dk/acc_papers/16vikj17dhdajdhyxsi7vymf446q.pdf
Foster, Martin. (2014). “Fukushima 7MW platform complete.” Wind Power Offshore.
http://www.windpoweroffshore.com/article/1298310/fukushima-7mw-platform-complete
Fraunhofer Institute for Wind Energy and Energy System Technology. (2012). Alpha Ventus: Research
and Industry Present Common Achievements. 08 May 2012.
Gamesa. (2010). Eleven Spanish companies join forces on the Azimut Project to develop a 15-MW
offshore wind turbine using 100% Spanish technology. Press Release
http://www.gamesacorp.com/en/communication/news/eleven-spanish-companies-join-forces-on-
the-azimut-project-to-develop-a-15-mw-offshore-wind-turbine-using-100-spanish-
technology.html?idCategoria=70
Global Wind Energy Council (GWEC). (2014). Global Wind Report – Annual Market Update 2013. April
2014.
Glosten Associates. (2013). The Glosten Associates Announces Floating Offshore Wind Turbine Demonstrator
Contract Award. March 2013. http://www.glosten.com/press.html
Goossens, Ehren. (2013). Google-backed Atlantic Cable Shifts to New Jersey as Wind Stalls. Bloomberg News.
October 24, 2013. http://www.businessweek.com/news/2013-10-24/google-backed-atlantic-cable-
shifts-to-new-jersey-as-wind-stalls
Great Lakes Wind Collaborative, Transmission-Related Policy Options to Facilitate Offshore Wind in the
Great Lakes, April 2011 http://www.glc.org/energy/wind/publications/pdfs/Transmission-Policies-
for-GL-Offshore-Wind_FINAL.pdf
Hamilton, B. (2011). “Offshore Wind O&M Costs, Trends, and Strategies.” EWEA Offshore 2011.
Amsterdam, The Netherlands, 7 pp.
Hashem, Heba. (2014). Offshore vessels: Fit for purpose? Wind Energy Update. May 19, 2014.
IHC Merwede (2012). IHC Hydrohammer to supply largest piling hammer for Seaway Heavy Lifting. Press
release. Sliedrecht, Netherlands. 31 August 2012. http://www.ihcmerwede.com/about-ihc-
merwede/media/news/article/ihc-hydrohammer-to-supply-largest-piling-hammer-for-seaway-
heavy-lifting/
IHS Emerging Energy Research. (2012). Global Offshore Wind Energy Markets and Strategies: 2012-2025.
June 2012.
Johnson, Tom. (2013). “At $200M, Fishermen's Energy Pilot Wind Farm Still Too Pricey for Rate
Counsel.” NJ Spotlight. March 15, 2013. Accessed September 16, 2013. Available at:

Offshore Wind Market and Economic Analysis Page 123 Document Number DE-EE0005360
http://www.njspotlight.com/stories/13/03/14/at-200m-fishermen-s-energy-pilot-wind-farm-still-too-
pricey-for-rate-counsel/.
Keystone Engineering, Inc. (Keystone). (2014). Inward Battered Guide Structure, the “Twisted Jacket.”
Mandeville, LA: Keystone Engineering, Inc. http://issuu.com/lahdesigns/docs/ibgs_e-brochure/1
KPMG. (2011). Taxes and Incentives for Renewable Energy.
http://www.kpmg.com/Global/en/IssuesAndInsights/ArticlesPublications/Documents/Taxes-
Incentives-Renewable-Energy-2011.pdf
Kuffner, Alex. (2013). “Deepwater changes plan, wants to run underwater cable to Scarborough State
Beach.” Providence Journal. September 24, 2013. Accessed September 27, 2013. Available at:
http://www.providencejournal.com/breaking-news/content/20130924-deepwater-changes-plan-
wants-to-run-underwater-cable-to-scarborough-state-beach.ece.
Kuffner, Alex. (2014). Offshore wind farm developer agrees to steps to protect endangered whales. Providence
Journal. May 7, 2014. http://www.providencejournal.com/business/content/20140507-offshore-wind-
farm-developer-agrees-to-steps-to-protect-endangered-whales.ece
LaMonica, Martin. (2013). Offshore Wind “Backbone” Project Moves Ahead. MIT Technology Review.
January 17, 2013. http://www.technologyreview.com/view/510026/offshore-wind-backbone-project-
moves-ahead/
Lantz, E.; Wiser, R.; Hand, M. (2012). The Past and Future Cost of Wind Energy. NREL/TP-6A20-53510.
Golden, CO: National Renewable Energy Laboratory.
Lindsay, Jay. (2013). “Cape Wind gets $200 M investment from Danish fund.” Associated Press. July 16,
2013. Accessed September 16, 2013. Available at: http://www.rdmag.com/news/2013/07/cape-wind-
gets-200-m-investment-danish-fund.
LORC. (2011). The Gravity Based Structure – Weight Matters. Lindoe Offshore Renewables Center.
Munkebo, DK. http://www.lorc.dk/offshore-wind/foundations/gravity-based.
Malone, Scott. “Google joins $5 billion U.S. offshore wind grid project.” Reuters. Thomson Reuters, 12
October 2010. Web. 15 April 2011. <http://www.reuters.com/article/2010/10/12/us-marubeni-google-
idUSTRE69B0ZA20101012>.
Marine Log. (2014). “Drydocks World completes massive offshore wind platform.”
http://marinelog.com/index.php?option=com_k2&view=item&id=6849:drydocks-world-completes-
massive-offshore-wind-platform&Itemid=224
Maryland Energy Administration (MEA). (2014). “Offshore Wind Operations & Maintenance Center of
Excellence Port Infrastructure Assessment.” Maryland.gov.
http://energy.maryland.gov/documents/OffshoreWindandMainenenceAnnounrment_BidRFP.pdf

Offshore Wind Market and Economic Analysis Page 124 Document Number DE-EE0005360
McKenna, John. (2013). “Cape Wind faces end-of-year race to secure $200 million.” Windpower Monthly.
July 5, 2013. Accessed September 16, 2013. Available at:
http://www.windpowermonthly.com/article/1189310/cape-wind-faces-end-of-year-race-secure-200-
million.
Merecicky, Andrew. (2014). “Game-changing offshore wind foundation to be demonstrated in English
Channel.” Windpower Engineering and Development.
http://www.windpowerengineering.com/construction/game-changing-offshore-wind-foundation-
demonstrated-english-channel/
Michigan Department of Licensing and Regulatory Affairs (LARA). (2010). “AMENDED: MPSC
Identifies Two Michigan Wind Resource Zones to Spur Transmission Development.” LARA Public
Service Commission. http://www.michigan.gov/mpsc/0,4639,7-159-16400_17280-230708--,00.html
Milford, Lewis. (2013). “New Jersey Offshore Wind: Dead or Alive?” Huffington Post. July 23, 2013.
Accessed September 16, 2013. Available at: http://www.huffingtonpost.com/lewis-milford/new-
jersey-offshore-wind_b_3635312.html.
Miller, Ben. (2014). “Siemens wins Dudgeon contract.” Wind Power Offshore.
http://www.windpoweroffshore.com/article/1226938/siemens-wins-dudgeon-contract
Ministry of Foreign Affairs of Denmark. (2009). “Offshore Wind Farms Mean Big Business for the Port of
Esbjerg.” http://www.investindk.com/News-and-events/News/2009/Offshore-wind-farms-mean-big-
business-for-the-Port-of-Esbjerg
Mitsubishi. (2013). MHI Begins Test Operation of Large-Scale Wind Power Generation System Adopting a
Hydraulic Drive Train. http://www.mhips.com/news/2013012401
Molina, Maggie. (2014). The Best Value for America’s Energy Dollar: A National Review of the Cost of Utility
Energy Efficiency Programs. Research Report U1402. Washington, DC: American Council for an
Energy-Efficient Economy. http://aceee.org/research-report/u1402
Montco, Inc. (Montco). (2014). “Montco Offshore Liftboats.” http://www.montco.com/MO/
Musial, W., D. Elliott, J. Fields, Z. Parker, G. Scott, and C. Draxl. (2013a). Assessment of Offshore Wind
Energy Leasing Areas for the BOEM Maryland Wind Energy Area. NREL/TP-5000-58562. Golden, CO:
National Renewable Energy Laboratory. http://www.nrel.gov/docs/fy13osti/58562.pdf
Musial, W., D. Elliott, J. Fields, Z. Parker, G. Scott, and C. Draxl. (2013b). Assessment of Offshore Wind
Energy Leasing Areas for the BOEM New Jersey Wind Energy Area. NREL/TP-5000-60403. Golden, CO:
National Renewable Energy Laboratory. http://www.nrel.gov/docs/fy13osti/60403.pdf
National Renewable Energy Laboratory. (2012). Renewable Electricity Futures Study,
http://www.nrel.gov/docs/fy12osti/52409-2.pdf
Offshore Wind Market and Economic Analysis Page 125 Document Number DE-EE0005360
Navigant, U.S. Offshore Wind Manufacturing and Supply Chain Development, prepared for the U.S.
Department of Energy, 2013.
Navigant Research (formerly BTM Consult). International Wind Energy Development: Offshore Report 2013.
November 2012.
Navigant Research (formerly BTM Consult). International Wind Energy Development: Supply Chain
Assessment 2012-2015. November 2011.
Navigant Research (formerly BTM Consult). International Wind Energy Development: World Market Update
2013. March 2014.
North American Windpower (NAW). (2013). Cape Wind, Siemens Sign Offshore Wind Turbine Supply
Agreement. December 23, 2013.
http://www.nawindpower.com/e107_plugins/content/content.php?content.12433
North American Windpower (NAW). (2014). Fishermen’s Energy Not Giving Up on Offshore Wind Demo,
Eyes Turbine Test Facility.
Norton Rose Fulbright. (2013). European renewable energy incentive guide - The Netherlands. February 2013.
http://www.nortonrosefulbright.com/knowledge/publications/66148/european-renewable-energy-
incentive-guide-the-netherlands
OceanWind. (2010). Offshore Wind Experiences: A Bottom-Up Review of 16 Projects. 08 April 2010.
http://www.nve.no/Global/Energi/Havvind/Vedlegg/Offshore%20wind%20experiences%20-
%20A%20bottom-up%20review%20of%2016%20projects%20(Ocean%20Wind).pdf
OffshoreWind.biz. (2012). Weeks Marine Builds First U.S. Offshore Wind Installation Vessel. September 3,
2012. http://www.offshorewind.biz/2012/09/03/weeks-marine-builds-first-u-s-offshore-wind-
installation-vessel/
OffshoreWind.biz. (2013a). “OWS Takes Over BARD Offshore 1 Wind Farm.”
http://www.offshorewind.biz/2013/11/20/ows-takes-over-bard-offshore-1-wind-farm/
OffshoreWind.biz. (2013b). “TenneT Gets EUR 500 Mln Loan for Connection of OWFs to German Grid,”
9 December 2013. http://www.offshorewind.biz/2013/12/09/tennet-gets-eur-500-mln-loan-for-
connection-of-owfs-to-german-grid/
OffshoreWind.biz. (2013c). “The Netherlands: TenneT Opens New ‘Renewable Energy Highway.”
OffshoreWind.biz. (2014a). EEW, Bladt to Supply Foundations for Cape Wind. February 5, 2014.
http://www.offshorewind.biz/2014/02/05/eew-bladt-to-supply-foundations-for-cape-wind/

Offshore Wind Market and Economic Analysis Page 126 Document Number DE-EE0005360
OffshoreWind.biz. (2014b). Bladt, EEW SPC to Build Foundations for Gode Offshore Wind Farms. March 13,
2014. http://www.offshorewind.biz/2014/03/13/bladt-eew-spc-to-build-foundations-for-gode-
offshore-wind-farms/
OffshoreWind.net. (2010). “Rhode Island.” http://offshorewind.net/OffshoreProjects/Rhode_Island.html
Offshore-WindEnergieNet.com. “Rest of the World.” Federal Ministry for Economic Affairs and Energy.
http://www.offshore-windenergie.net/en/politics/international/rest-of-the-world
PE. (2013). “Giant 7MW Fife offshore turbine completed.” Institution of Mechanical Engineers.
http://www.imeche.org/news/engineering/giant-7mw-fife-offshore-turbine-completed
Peire, K.; Nonnneman, H.; Bosschem, E. (2009) Gravity Base Foundations for the Thornton Bank Offshore
Wind Farm. IADC Dredging. Terra et Aqua, No. 115. The Hague. Netherlands. June 2009.
http://www.iadc-dredging.com/ul/cms/terraetaqua/document/2/5/8/258/258/1/terra115-3.pdf
Port of Oostende. (2013). “Welcome to the Port of Oostende.”
http://www.portofoostende.be/agho/default.htm
Power and Energy Solutions (PES) Wind. “Built to Serve.”
http://www.pes.eu.com/assets/misc_new/pp52-55seaportspdf-202124705931.pdf
Power Cluster. (2008). “BIS - Bremerhaven Economic Development Company.” Offshore Wind Energy.
http://www.power-
cluster.net/AboutPOWERcluster/ProjectPartners/BremerhavenEconomicDevelopmentCompany/tabi
d/624/Default.aspx
Public Utility Commission of Texas (PUCT). (2010). PUCT – CREZ Home Page.
http://www.texascrezprojects.com/Riffgat Ofshore Windpark. (2013). Technology: within the windfarm
cabling. EWE, Enova. Website. http://www.riffgat.de/technik/innerparkverkabelung/
ReNews. (2014). “Baryonyx quits US offshore.” http://renews.biz/67568/baryonyx-quits-us-offshore/
Seajacks. (2013). “Who We Are.” http://www.seajacks.com/who_we_are.php
SeeNews Renewables. (2011). “Germany's ports in Cuxhaven, Bremerhaven bet on offshore wind
power.” 6 April 2011. http://renewables.seenews.com/news/germanys-ports-in-cuxhaven-
bremerhaven-bet-on-offshore-wind-power-23354
Shankleman, J. (2012). “Updated: Gamesa selects Leith for £125m offshore wind factory investment.” 23
March 2012. http://www.businessgreen.com/bg/news/2163217/gamesa-splashes-gbp125m-leith-
offshore-wind-factory-investment
Siemens (2012). “Siemens unveils 75 m wind turbine blade.” Reinforced Plastics. Available at:
http://csmres.co.uk/cs.public.upd/article-downloads/REPL_2012_04_Siemens_feature%5B1%5D.pdf

Offshore Wind Market and Economic Analysis Page 127 Document Number DE-EE0005360
Simon, Charlotte. (2014). “The HVAC/HVDC Debate.” Marine Renewables News. http://www.marine-
renewables-news.com/offshore-wind-turbines/the-hvac/hvdc-debate-0101
Smith, Patrick. (2014). First Order for Vestas V164 Turbine. Wind Power Offshore. February 18, 2014.
Snieckus, D. (2013a). Hunterston delay for Mitsubishi 7MW. Recharge News. September 25, 2013.
Snieckus, D. (2013b). Fab claims 'XL monopile' advance. Recharge News. Bristol, U.K.
http://www.rechargenews.com/wind/offshore/article1331628.ece
Snieckus, D. (2013c). EEW SPC ships monster monopile. Recharge News. Bristol, U.K.
http://www.rechargenews.com/wind/offshore/article1339749.ece
Solar Energy Industries Association (SEIA). (2014). “Solar Industry Data.” http://www.seia.org/research-
resources/solar-industry-data
SSE. (2014). Construction is underway at the UK's first offshore wind turbine test facility at Hunterston in North
Ayrshire. http://sse.com/whatwedo/ourprojectsandassets/renewables/Hunterston/
SSP Technology. (2013). World's longest rotor blade for wind turbine - core materials.
http://www.ssptech.dk/nyheder.aspx?Action=1&NewsId=116&PID=357&World's+longest+rotor+bla
de+for+wind+turbine+-+core+materials
Statoil. (2014). “Hywind Scotland, status and further plans.” Norwegian Centre for Offshore Wind Energy.
http://www.norcowe.no/doc//Meetings%202014/SMI%20Stavanger/Presentasjoner/T%20Nakken%20
Statoil%20-%20Hywind%20Scotland%20status%20and%20further%20plans.pdf
Tegen, S.; Hand, M.; Maples, B.; Lantz, E.; Schwabe, P.; Smith, A. (2012). 2010 Cost of Wind Energy
Review. NREL TP-5000-52920. Golden, CO: National Renewable Energy Laboratory.
Tetra Tech EC, Inc. (Tetra Tech). (2012). “Executive Summary.” Block Island Wind Farm and Block Island
Transmission System Environmental Report/Construction and Operations Plan. Providence, RI:
Deepwater Wind, LLC.
http://dwwind.com/docs/Environmental%20Report%20Exec%20Summary.pdf
The Committee for Future Offshore Wind Power Sites. (2007). Future Offshore Wind Power Sites – 2025.
Danish Energy Authority. April 2007. http://ec.europa.eu/ourcoast/download.cfm?fileID=983
The Guardian. (2012). “Gamesa announces plans to build £125m offshore windfarm facility.” 23 March
2012. http://www.guardian.co.uk/environment/2012/mar/23/gamesa-offshore-windfarm
U.K. Department for Transport. (2011). National Policy Statement for Ports. Presented to Parliament by the
Secretary of State for Transport. http://assets.dft.gov.uk/publications/national-policy-statement-for-
ports/111018-ports-nps-for-das.pdf

Offshore Wind Market and Economic Analysis Page 128 Document Number DE-EE0005360
U.K. Department of Energy and Climate Change (DECC). (2010). “Offshore manufacturing sets sail for
UK ports.” Gov.UK. 25 October 2010. https://www.gov.uk/government/news/offshore-
manufacturing-sets-sail-for-uk-ports
U.S. Congress. (1920). Merchant Marine Act of 1920 (Jones Act). 46 App. U.S.C. 883. http://facit.be/text-
of-the-jones-act-1920
U.S. Department of Energy (DOE). (2010). Critical Materials Strategy. Washington, DC: U.S. Department
of Energy. http://energy.gov/sites/prod/files/edg/news/documents/criticalmaterialsstrategy.pdf
U.S. Department of Energy. (2012a). Final Environmental Impact Statement for the Proposed Cape Wind
Energy Project, Nantucket Sound, Massachusetts (Adopted). DOE/EIS-0470. Washington, DC: U.S.
Department of Energy. http://energy.gov/sites/prod/files/DOE-EIS-0470-Cape_Wind_FEIS_2012.pdf
U.S. Department of Energy. (2012b). U.S. Department of Energy Wind and Water Power Technologies Office
Funding in the United States: Offshore Wind Projects 2006-2012. DOE/EE-0792. December 2012.
U.S. Department of Energy. (2013a). “Delaware Incentives/Policies for Renewables & Efficiency.”
Database of State Incentives for Renewables & Efficiency (DSIRE).
http://www.dsireusa.org/incentives/index.cfm?re=1&ee=1&spv=0&st=0&srp=1&state=DE
U.S. Department of Energy. (2013b). “Massachusetts Incentives/Policies for Renewables & Efficiency.”
Database of State Incentives for Renewables & Efficiency (DSIRE).
http://www.dsireusa.org/incentives/incentive.cfm?Incentive_Code=MA05R&re=1&ee=1
U.S. Department of Energy. (2014). “Offshore Wind Advanced Technology Demonstration Projects.”
Office of Energy Efficiency and Renewable Energy. http://energy.gov/eere/wind/offshore-wind-
advanced-technology-demonstration-projects
U.S. Energy Information Administration (EIA). (2013a). AEO2014 Early Release Overview. Washington,
DC: U.S. Department of Energy. http://www.eia.gov/forecasts/aeo/er/pdf/0383er(2014).pdf
U.S. Energy Information Administration. (2013b). Daily Energy Prices. October 16, 2013.
(http://www.eia.gov/todayinenergy/prices.cfm).
U.S. Offshore Wind Collaborative. (2010). “Delaware.” http://www.usowc.org/states/de.html
Van Bussel, G.; Bierbooms, W. (2003). “The DOWEC Offshore Reference Windfarm: Analysis of
Transportation for Operation and Maintenance.” Wind Engineering (27:5); pp. 381–392.
Walker, R. (2010). Strategic Review of Offshore Wind Farm Monitoring Data Associated with FEPA
Licence Conditions.” Center for Environment, Fisheries, and Aquaculture Science (CEFAS).
http://cefas.defra.gov.uk/media/393490/strategic-review-of-offshore-wind-farm-monitoring-version-
final-19-august-2010-sir.pdf

Offshore Wind Market and Economic Analysis Page 129 Document Number DE-EE0005360
Webb, Alex. (2014). Siemens Inks $2.1 Billion Deal for 600-MW Dutch Offshore Wind Project. Renewable
Energy World. May 15, 2014.
http://www.renewableenergyworld.com/rea/news/article/2014/05/siemens-inks-2-1-billion-deal-for-
600-mw-dutch-offshore-wind-project
Wiersma, F., Grassin, J., Crockford, A., et. al. (2011). State of the Offshore Wind Industry in Northern
Europe: Lessons Learnt in the First Decade.” Ecofys Netherlands BV.
http://www.northsearegion.eu/files/repository/20120320110429_PC-
StateoftheOffshoreWindIndustryinNorthernEurope-Lessonslearntinthefirstdecade.pdf
Wind Power Monthly. (2013). “Clearer path ahead under new grid connection rules.” April 13, 2013.
http://www.mannheimerswartling.se/Publikationer/WindPowerOffshore%20Germany%20April%20
2013.pdf
Wind Power Offshore. (2013). “European Offshore 2020: Netherlands - Moving the Goalpost.” 1
November 2013. http://www.windpoweroffshore.com/article/1217174/european-offshore-2020-
netherlands---moving-goalpost?HAYILC=RELATED&HAYILC=INLINE
Wind Power Offshore. (2014). “Netherlands to Offer New Offshore Development Zones.” 6 February
2014. http://www.windpoweroffshore.com/article/1230279/netherlands-offer-new-offshore-
development-zones
Windkraft-Journal. (2012). ThyssenKrupp Mannex to market innovative offshore foundation. July 2013.
http://www.windkraft-journal.de/2012/05/07/offshore-fundamente-stellen-eine-grose-technische-
herausforderung-dar/
Wiser, R.; Bolinger, M. (2013). 2012 Wind Technologies Market Report. DE-AC02-05CH11231.
Washington, DC: U.S. Department of Energy Office of Energy Efficiency and Renewable Energy.
World Maritime News. (2013). “Denmark: Port of Esbjerg’s New Østhavn Opened.” 24 June 2013.
http://worldmaritimenews.com/archives/87317/denmark-port-of-esbjergs-new-osthavn-opened/

Offshore Wind Market and Economic Analysis Page 130 Document Number DE-EE0005360
Appendix A. Potential Barriers to Offshore Wind Development in the U.S.
A.1 Cost-Competitiveness of Offshore Wind Energy
Capital costs for the first generation of U.S. offshore wind projects are expected to be approximately
$6,000 per installed kW, compared with approximately $1,940 per installed kW for U.S. land-based wind
projects in 2012 (Wiser and Bollinger 2013). Offshore projects have higher capital costs for a number of
reasons, including turbine upgrades required for operation at sea, turbine foundations, balance-of-
system (BOS) infrastructure, the high cost of building at sea, and O&M warranty risk adjustments. These
costs remain high because the offshore wind industry is immature and learning curve effects have not
yet been fully realized. There are also a number of one-time costs incurred with the development of an
offshore wind project, such as vessels for turbine installation, port and harbor upgrades, manufacturing
facilities, and workforce training.
Offshore wind energy also has a higher LCOE than
comparable technologies. In addition to higher capital costs,
offshore wind has higher O&M costs as a result of its
location at sea. Higher permitting, transmission, and grid
integration costs contribute to this higher cost of energy,
which can be somewhat balanced by an improved wind
regime offshore.
Another economic benefit is the wholesale market price
suppression of peak-coincident offshore wind energy,
especially during the summer. Charles River Associates
projects price suppression to be over $7 billion for Cape
Wind over 25 years; the Massachusetts public utility
commission and Supreme Judicial Court recognized this
when approving the Cape Wind PPA.
Offshore wind has higher financing costs, due to the
heightened perceived risk. Since it is not yet a mature
industry, investors still perceive offshore wind as risky, due to regulatory and permitting issues,
construction and installation risk, and long-term reliability of energy production. As a result, insurance
and warranty premiums remain high. There are also extremely high risks to early-stage capital, given
the uncertainty around the price and availability of future off-take agreements for offshore wind.
A.2 Infrastructure Challenges
Offshore wind turbines are currently not manufactured in the United States. Domestic manufacturing
needs to be in place in the United States in order for the industry to fully develop. The absence of a
mature industry results in a lack of experienced labor for manufacturing, construction, and operations.
Workforce training must therefore be part of the upfront costs for U.S. projects.
The Jones Act
Section 27 of the Merchant Marine Act
of 1920, better known as the Jones Act,
requires that all goods transported by
water between U.S. ports be carried in
U.S.-flag ships with U.S. crews. Once
a wind farm foundation is in place in
U.S. federal waters, the structure may
be considered a port and thus require
servicing by U.S. vessels. Currently,
the only existing specialist vessels
capable of offshore foundation and
turbine installation are mostly
European-owned and are in high
demand for European projects.

Offshore Wind Market and Economic Analysis Page 131 Document Number DE-EE0005360
The infrastructure required to install offshore wind farms, such as purpose-built ports and vessels, does
not currently exist in the United States. There is also insufficient capability for domestic operation and
maintenance. While turbine installation and maintenance vessels exist in other countries, legislation such
as the Jones Act may limit the ability of these foreign vessels to operate in U.S. waters. These issues also
apply to transmission infrastructure for offshore wind.
The absence of strong demand for offshore wind in the United States makes it difficult to overcome these
technical and infrastructure challenges. In order to develop the required infrastructure and technical
expertise, there must first be sufficient demand for offshore wind, and that is not expected in the near
term due to the high cost of offshore wind and the low cost of competing power generation resources,
such as natural gas.
A.3 Regulatory Challenges
A.3.1 Permitting
Offshore wind projects in the United States are facing new permitting processes. After issuing the Final
Rule governing offshore wind leasing on the Outer Continental Shelf (OCS) in 2009, the Minerals
Management Service (MMS)—now BOEM—staff estimated that the lease process might require three
EISs and may extend seven to nine years. Secretary of the Interior Ken Salazar announced his Smart from
the Start Program initiative in 2010. One aspect of the initiative was the concept of preparing an EA,
which would evaluate the potential environmental impacts of commercial wind lease issuance,
associated site characterization surveys, and subsequent site assessment activities (i.e., installation and
operation of meteorological towers and buoys) prior to lease issuance, as opposed to preparing an EIS,
which likely would be required under NEPA to analyze construction and operation of a wind facility
prior to lease issuance. Construction and operations plans proposing the installation of renewable
energy generation facilities would be subject to additional project specific environmental reviews. BOEM
responded with a regional Mid-Atlantic Environmental Assessment covering typical site assessment
activities in New Jersey, Delaware, Maryland, and Virginia, which should expedite review of site
assessment plans off those state coasts by eliminating further NEPA review if the same technologies
were proposed. This approach seeks to expedite BOEM reviews and establish some certainty for
developers and financiers.
A number of state and federal entities have authority over the siting, permitting, and installation of
offshore wind facilities. Cognizant federal agencies include BOEM, the U.S. Army Corps of Engineers
(USACE), the EPA, the FWS, the National Oceanic and Atmospheric Administration (NOAA) National
Marine Fisheries Service, and others. BOEM is preparing to sign a MOU with USACE to facilitate
coordination of federal approvals of offshore wind facilities and is negotiating MOUs with other federal
agencies.
In March 2012, five Great Lakes states (Illinois, Michigan, Minnesota, New York, and Pennsylvania) and
ten federal agencies signed a bipartisan federal-state MOU to support efficient, expeditious, orderly, and
responsible review of proposed offshore wind energy projects in the Great Lakes. This consortium will
help ensure that efforts to meet America’s domestic energy demands in an environmentally responsible

Offshore Wind Market and Economic Analysis Page 132 Document Number DE-EE0005360
manner through the use of excellent Great Lakes offshore wind resources occurs in an efficient and
effective manner that protects the health and safety of our environment and communities while
supporting vital economic growth.
A.3.2 Environmental & Competing Uses
Environmental concerns and public resistance present challenges to the industry. Regulatory agencies
must consider a range of environmental concerns related to offshore wind, including bird and bat
species, marine mammals, sea turtles, and pelagic and benthic species at risk, as well as potential
impacts to water quality. At this point, the environmental impacts of offshore wind in the United States
are not well understood. Several environmental organizations worked together with four offshore wind
developers to agree on survey vessel protocol to protect endangered whales during site assessment
activities.45 Cultural resources, such as historic preservation sites and tribal resources, must also be
considered. In addition, public opposition may arise, especially with offshore wind sites near the shore
that could impact viewsheds and environmental resources. In addition, competing human uses such as
fishing, shipping and military practice activities must be addressed under BOEM regulations and NEPA.
45 “Proposed Mitigation Measures to Protect North Atlantic Right Whales from Site Assessment and
Characterization Activities of Offshore Wind Energy Development in the Mid-Atlantic Wind Energy Areas,” Letter
to BOEM, December 12, 2012.
Offshore Wind Market and Economic Analysis Page 133 Document Number DE-EE0005360
Appendix B. Offshore Wind Policies in Selected U.S. States
This appendix includes details on offshore wind policies and related activities in selected U.S. states. The
categories of policies to address cost competitiveness and site selection and leasing are included. A
summary of policies that address cost competitiveness is provided in tabular form in Section 2.3.2.
B.1 California
B.1.1 Infrastructure Policies
California has designated specific areas for land-based wind development to provide a level of certainty
for transmission development. California started its Renewable Energy Transmission Initiative (RETI) in
2007. The purpose of RETI is to engage the state’s renewable energy generation and transmission to
participate in a collaborative process to facilitate the designation of transmission corridors and the siting
and permitting for renewable energy generation and transmission projects.
The main components of RETI are as follows:
Identifying CREZ with sufficient energy resource densities to justify building transmission lines
to them
Ranking CREZ on the basis of environmental impacts, the certainty and schedule of project
development, and the cost and value to California consumers
Developing conceptual transmission plans to the highest-ranking CREZ
Supporting the California Independent System Operator (California ISO), investor-owned
utilities (IOUs), and publicly owned utilities (POUs) in developing detailed plans of service for
commercially viable transmission projects
Providing detailed costs and benefit analyses to help establish the basis for regulatory approvals
of specific transmission projects46
In California, developers pay an initial deposit for ratepayer-subsidized transmission development and
then later pay the balance of the total transmission interconnection cost through long-term operating
revenues.
46 CEC 2014
Offshore Wind Market and Economic Analysis Page 134 Document Number DE-EE0005360
B.2 Delaware
B.2.1 Policies to Address Cost Competitiveness
In 2005, Delaware Senate Bill (S.B.) 74 established a RPS of 10 percent by 2019-2020. Two years later, S.B.
19 increased the target to 20 percent. In July 2010, the target was revised again by S.S. 1 for S.B. 119 to 25
percent by 2025-2026.47
While Delaware does not have a carve-out for offshore wind, in 2008, S.B. 328 set a 350 percent
multiplier for the REC value of offshore wind facilities sited on or before May 31, 2017.48
In 2007, an all-resource competitive bidding process was conducted in Delaware. Four state agencies,
including the Delaware Public Services Commission, the Office of Management and Budget, the State
Controller, and the Department of Natural Resources & Environmental Control, directed Delmarva
Power to negotiate a long-term PPA with the company then known as Bluewater Wind. The company,
which became a subsidiary of NRG Energy and was later known as NRG-Bluewater Wind, proposed to
build a 450 MW offshore wind farm approximately 12 miles from the coast.49
In December 2011, NRG-Bluewater Wind failed to make a substantial deposit to maintain the PPA.
B.2.2 Site Selection and Leasing Policies
BOEM issued a Call for Information for Delaware projects and received two lease nominations. BOEM
subsequently determined that only one bidder was qualified and thus issued a Determination of No
Competitive Interest to NRG-Bluewater Wind on April 12, 2011. NRG Energy negotiated lease terms
with BOEM in December 2012. The lease terms provide a schedule requiring NRG to file a SAP and COP
within a maximum period of time.50 NRG filed its Site Assessment Plan in February 2014. NRG is
exploring a new development partner or sale of the lease and whoever pursues development of the site
will now have to obtain a new PPA. See http://www.nrgenergy.com/nrgbluewaterwind/index.html for
more details.
B.3 Illinois
B.3.1 Site Selection and Leasing Policies
On August 19, 2013, Illinois governor Pat Quinn signed the Lake Michigan Wind Energy Act, which
requires the Illinois Department of Natural Resources (DNR) to develop a detailed offshore wind energy
siting matrix for the public trust lands of Lake Michigan. The Act also authorizes the DNR to grant
offshore wind energy development site assessment permits and leases and to convert site assessment
leases to construction and operation leases and grants other rulemaking powers. Additionally, the Act
creates the Offshore Wind Energy Economic Development Policy Task Force, which is charged with
47 DOE 2013a 48 DOE 2013a 49 U.S. Offshore Wind Collaborative (2010) 50 BOEM 2013c

Offshore Wind Market and Economic Analysis Page 135 Document Number DE-EE0005360
analyzing and evaluating policy and economic options to facilitate the development of offshore wind
energy and proposing an appropriate Illinois mechanism for purchasing and selling power from
offshore wind energy projects. This law is an outgrowth of a 2012 Lake Michigan Offshore Wind Energy
Advisory Report, which addressed the following issues:
Appropriate criteria for the DNR to use to review applications for offshore wind development of
Lake Michigan lakebed leases
Criteria for identifying areas that are favorable, acceptable, and unacceptable for offshore wind
development
A recommended process for ensuring public engagement in the DNR’s process for leasing Lake
Michigan lakebed for offshore wind energy projects
Options for how Illinois shall be compensated for Lake Michigan lakebed leasing
A summary of the lessons learned from other domestic and international offshore wind
development experiences, including, but not limited to, those related to public policy,
regulatory, and siting concerns for offshore wind development
Identification of local, state, and federal authorities with permitting, siting, or other approval
authority for wind power development in Lake Michigan
Recommendations for needed state legislation and regulations governing offshore wind farm
development
Figure B-1. Illinois Offshore Wind Leasing Areas

Offshore Wind Market and Economic Analysis Page 136 Document Number DE-EE0005360
B.4 Maine
B.4.1 Policies to Address Cost Competitiveness
In January 2013, the Maine PUC voted to support the Hywind Maine project’s pursuit of a long-term
PPA with Central Maine Power Company. However, the project was placed on hold in July 2013 after
new legislation created uncertainty regarding the state's prior approval of the project. That approval had
included the Maine PUC’s agreement for the project to receive ratepayer-funded subsidies after Statoil
submitted the only bid in the state’s competitive process. In late June, the Maine legislature passed a bill
that re-opened the bidding process for the ratepayer subsidies in order to allow the University of Maine
to submit a similar proposal for the Aqua Ventus project.
On May 31, 2013, a team led by the University of Maine installed a 65-foot 1/8 scale pilot floating turbine
anchored to the bottom of Penobscot Bay, Maine. The VolturnUS is the first grid-connected offshore
wind turbine in the U.S. It has survived 7 foot waves and continues to operate successfully as the team
designs a 6-MW floating turbine.
Figure B-2. VolturnUS Floating Turbine
Source: University of Maine

Offshore Wind Market and Economic Analysis Page 137 Document Number DE-EE0005360
B.5 Maryland
B.5.1 Policies to Address Cost Competitiveness
Maryland has an RPS of 20 percent by 2022. The Maryland Offshore Wind Energy Act of 2013
established ORECs for up to 200 MW. The act addresses the cost of offshore wind by broadening the
cost-benefit analysis, including consideration of peak coincident price suppression and also capping the
impact on ratepayers at $1.50 per month. The Maryland Public Utilities Commission is establishing final
OREC regulations by July 1, 2014.
Maryland has completed geophysical, geotechnical and ecological surveys with state funds in the WEA
that BOEM identified. Maryland also issued an RFI in April 2014 for information related on the design,
manufacture and deployment of an offshore meteorological (MET) tower or buoy(s) to encourage
development of the WEA by private developers after the BOEM competitive auction process.
B.5.2 Site Selection and Leasing Policies
BOEM convened a Task Force and, in November 2010, issued a Request for Interest in offshore
development off the coast of Maryland. BOEM received several favorable responses and numerous
comments on environmental concerns. In February 2012, BOEM issued a Call for Information for a
reduced WEA of just a few lease blocks and received ten lease nominations. BOEM has established two
WEAs which total about 9 lease blocks to reduce conflicts with shipping and other constraints (see
below). BOEM issued a Proposed Sale Notice on December 17, 2013, and completed a competitive lease
sale for Maryland’s Wind Energy Area on August 19th, 2014. Sixteen companies were determined to be
legally, technically and financially qualified to participate in the auction. The WEA covers approximately
80,000 acres and is located about 10 nautical miles off the coast of Ocean City, MD. There will be a North
Lease Area (32,737 acres) and a South Lease Area (46,970 acres). US Wind Inc. submitted the
provisionally winning bid for both lease areas, for a total bid of $8,701,098.51
51 BOEM 2013d

Offshore Wind Market and Economic Analysis Page 138 Document Number DE-EE0005360
Figure B-3. Maryland Offshore Wind Leasing Areas
B.6 Massachusetts
B.6.1 Policies to Address Cost Competitiveness
The Massachusetts Department of Energy Resources (DOER) has set an RPS for new renewables of 15
percent by 2020. The RPS increases by 1 percent each year thereafter with no stated expiration date.
There is no carve-out or REC multiplier for offshore wind.52 Governor Deval Patrick has set a separate
goal of developing 2,000 MW of offshore wind energy to help achieve the RPS requirements.
In 2008, the governor signed the Green Communities Act, which authorized distribution utilities to sign
PPAs with renewable energy developers. The Act, as amended, requires each electric distribution
company to conduct two solicitations within five years and sign PPAs for 7 percent of its load with
renewable energy generators.
The Massachusetts Department of Public Utilities (DPU) has approved a 15-year PPA between the
developers of the Cape Wind project and National Grid for half of the project’s output. The PPA would
start in 2013 (or later, since the project is delayed) at $0.187/kWh, with a 3.5 percent annual increase. The
52 DOE 2013b

Offshore Wind Market and Economic Analysis Page 139 Document Number DE-EE0005360
DPU concluded that the contract is cost-effective because its benefits well exceed its costs. It also found
that approving the PPA is in the public interest, because no other renewable resource in the region
matches Cape Wind in terms of size, proximity to large electricity load, capacity factor, and advanced
stage of permitting, and because its bill impacts are in the range of only 1 to 2 percent.
The contract allows for upward and downward price adjustments based on a variety of contingencies. If
Cape Wind is unable to tap certain federal subsidies, the price would go up, but under other
circumstances the prices could go down, to the benefit of ratepayers. Specifically, should debt financing
costs be reduced as a result of a DOE loan guarantee, 75 percent of the savings would be passed along to
customers in lower rates. Similarly, if actual project costs, as verified by an independent audit, fall to
such an extent that the developer’s rate of return on debt and equity exceeds 10.75 percent, the contract
price of electricity will be reduced to give ratepayers 60 percent of the benefit of the lower costs; if actual
project costs are higher than anticipated and reduce this rate of return, the developer absorbs those
losses without impact on rates paid by consumers. This mechanism in the contract assures that the
developers of the project will not reap windfall profits.
The order concluded that the contract met the DPU’s standard for long-term contracts under Section 83
of the Green Communities Act, as well as the DPU’s standard for the public interest. In terms of cost-
effectiveness, the DPU concluded that the costs would be outweighed by the benefits provided by the
contract, namely assisting National Grid and the Commonwealth to comply with the state’s renewable
energy and greenhouse gas emissions reduction requirements; providing National Grid the option to
extend the contract beyond 15 years at a price that covers the remaining costs of operating the facility
plus a reasonable rate of return; enhancing electricity reliability in the state; moderating system peak
load; and creating additional employment. The DPU observed that wind data show that Cape Wind’s
capacity factor would have averaged an impressive 76 percent during the region’s top ten historic peak
hours. It concluded further that the project will create an average of 162 jobs per year for the 15 years of
the contract—but many more than that during the two-plus-year construction period.
In terms of the public interest, the DPU found that the Cape Wind project offers “unique benefits relative
to the other renewable resources available.” In addition, the DPU found that the contract price was
reasonable for offshore wind, which the Department determined to be needed to meet state renewable
energy and greenhouse gas requirements. The bill impacts that could occur as a result of the contract
“are small relative to the volatility that electric customers regularly experience due to the fluctuations in
wholesale electricity prices, and the contract will mitigate that volatility.”53
The Massachusetts Supreme Judicial Court has upheld this contract on appeal, ruling that the DPU
reasonably determined the PPA was cost-effective, based on the administrative record based on non-
quantitative benefits of offshore wind moderating peak demand, suppressing wholesale generation
prices and the proximity of such large renewable generation to load centers.
53 The 300-plus-page DPU order is located at http://www.env.state.ma.us/dpu/docs/electric/10-
54/112210dpufnord.pdf.

Offshore Wind Market and Economic Analysis Page 140 Document Number DE-EE0005360
As a condition of approving the merger between Northeast Utilities and NStar, the DPU required the
merged entity to purchase 27.5 percent of the output of the Cape Wind project.
After the DPU approved the subsequent contract, opponents challenged the contract under the U.S.
Commerce Clause but lost that case in May 2014, the 26th legal victory for Cape Wind. In January, a
federal appeals court upheld a finding by the Federal Aviation Administration that the wind farm would
pose no significant hazard to nearby aviation. In March, a federal district court ruled in Cape Wind’s
favor on several environment issues, but did require the National Marine Fisheries Service to issue an
incidental take permit regarding potential impacts to Northern Right Whales and the U.S. Fish &
Wildlife Service to independently determine certain construction mitigation measures were reasonable
and prudent. Cape Wind officials have expressed their confidence in successful resolution of these
“compliance measures.”54
Cape Wind has conducted final geophysical and geotechnical surveys, is negotiating construction
contracts, and planning to proceed with construction over the next couple of years. Cape Wind has
attracted $1.3 billion of debt financing and continues to seek equity financing for the $2.6 billion project.
54 Copley 2014

Offshore Wind Market and Economic Analysis Page 141 Document Number DE-EE0005360
B.6.2 Site Selection and Leasing Policies
BOEM convened a Task Force and in March 2011 issued a Request for Interest in a 2,000 square mile area
south of Nantucket and Martha’s Vineyard. After extensive negotiations with commercial fishermen,
Massachusetts requested, and BOEM agreed, to cut the WEA approximately in half. On February 6, 2012,
BOEM issued a Call for Information and received ten lease nominations. On the same date, BOEM
issued a Notice of Intent to Prepare an Environmental Assessment with another opportunity for public
comment. Because the Massachusetts WEA is so large, BOEM asked NREL to determine how best to
divide the WEA into multiple areas for the auction of capacity for approximately 1000 MW each. NREL
proposed dividing the WEA into 4 or 5 areas for further comment and evaluation. BOEM held public
hearings in June in advance of a Proposed Sale Notice for a lease auction for the Massachusetts WEA
later in 2014.55
Figure B-4. Rhode Island and Massachusetts Offshore Wind Leasing Areas
55 BOEM 2013h

Offshore Wind Market and Economic Analysis Page 142 Document Number DE-EE0005360
B.7 Michigan
B.7.1 Site Selection and Leasing Policies
An October 2010 report of the Michigan Great Lakes Wind (GLOW) Council identified 13,339 square
miles that are considered most favorable to the sustainable development of offshore wind energy. Five
priority areas, known as wind resource areas (WRAs), were identified. The GLOW Council completed its
tasks and disbanded in 2010. The current governor is re-evaluating offshore wind development. Similar
re-evaluation scenarios are taking place in Ohio and Wisconsin, where political leadership and
associated renewable energy policy shifts occurred in 2010.
B.7.2 Infrastructure Policies
Michigan has designated specific areas for land-based wind development to provide a level of certainty
for transmission development. State legislation passed in 2008 (PA 295, Part 4) requires the Michigan
Public Service Commission to designate a primary wind energy resource zone and provides authority
for the designation of additional zones. On January 27, 2010, the Michigan Public Service Commission
(MPSC) issued a final order designating two Michigan regions as wind energy resource zones. The
primary wind energy resource zone is an area known as “Region 4”, which includes parts of Bay, Huron,
Saginaw, Sanilac, and Tuscola counties. A second area, known as “Region 1” has been identified by the
MPSC as an additional wind energy resource zone. Region 1 includes parts of Allegan County,
Michigan.
The MPSC based its decision on the findings of the Wind Energy Resource Zone Board, which submitted
its final report in 2009. Wind Energy Resource Zones are intended to expedite siting of the transmission
projects needed to move the wind energy onto the electric grid. The designation means that the MPSC
will facilitate the planning, siting, and construction of electricity transmission lines in order to facilitate
wind energy development in the area. Affected parties within the WREZ are given 21 days to reach
agreement on a voluntary cost allocation methodology for the transmission upgrade projects needed to
develop wind generation. If an agreement is reached, then the necessary actions will be taken by the
parties at the Midcontinent Independent Transmission System Operator, Inc. (MISO). If the parties are
unable to reach a cost allocation treatment amongst themselves, the MPSC will pursue another process
to resolve the matter.56
56 Michigan LARA 2010

Offshore Wind Market and Economic Analysis Page 143 Document Number DE-EE0005360
B.8 New Jersey
B.8.1 Policies to Address Cost Competitiveness
New Jersey has an RPS of 20.38 percent Class I and Class II renewables (which include wind) by
compliance year 2020-2021. The standard also includes an additional 5,316 GWh of solar-electric energy
by compliance year 2025-2026. New Jersey has established a carve-out in its RPS for offshore wind based
on offshore wind ORECs. However, a timeline has not been established for the OREC targets. The state’s
Board of Public Utilities (BPU) must define a percentage-based target to reach 1,100 MW of offshore
wind capacity. Projects seeking ORECs must present a price proposal for the credits as well as a
comprehensive net benefits analysis. The BPU issued initial rules in 2012 and continues to develop final
rules in 2014.
In July 2013, the BPU denied Fishermen’s Energy’s initial proposed settlement with the New Jersey
Division of Rate Counsel (DRC) involving the use of ORECs for its 25 MW project because the project
would not result in net economic benefits for the state at $266/MWh. Fishermen’s Energy submitted a
second proposed settlement to the BPU with a price of $199/MWh contingent on receipt of the second
DOE award of $47 million. The BPU rejected the request before DOE selected Fishermen’s for the $47
million award. In August, 2014, the Superior Court of New Jersey ordered the BPU to reconsider their
decision and to take into account Fishermen’s $199/MWh estimate.
Figure B-5. New Jersey Offshore Wind Leasing Areas

Offshore Wind Market and Economic Analysis Page 144 Document Number DE-EE0005360
B.8.2 Site Selection and Leasing Policies
In July 2014, BOEM announced a Proposed Sale Notice for the New Jersey Wind Energy Area. BOEM
proposes to auction the area as two leases: the South Lease Area (160,480 acres) and the North Lease
Area (183,353 acres), for a total of 344,000 acres.
The announcement also initiated a 60-day public comment period that ends on September 19th.
After the public comment period ends, the next step is the issuance of a Final Sale Notice, which will
announce the time and date of the lease sale as well as other important details.
B.9 New York
B.9.1 Policies to Address Cost Competitiveness
The New York Public Service Commission (PSC) has adopted an RPS of 29 percent by 2015. New York’s
RPS does not have a carve-out or a REC multiplier for offshore wind. However, New York will be hard-
pressed to generate an additional 3000 MW of renewables to meet their RPS goal without offshore wind.
In 2005, the Long Island Power Authority (LIPA) conducted a competitive bid for offshore wind but
cancelled the process in 2008 due to high costs, which were projected to reach 29 cents/kWh.
In 2009, the New York Power Authority (NYPA) conducted a competitive bid for offshore wind in the
Great Lakes but ended the process in 2011 due to high costs.
NYPA, LIPA, and Consolidated Edison (NYPA Collaborative) filed an unsolicited request for a lease in
federal waters off Long Island for a 350-MW offshore wind project, possibly expandable to 700 MW. If
NYPA obtains the lease, then NYPA plans to issue an RFP for private project developers to bid to
construct the wind farm. The NYPA Collaborative has conducted the interconnection studies and plans
to fund the interconnection and purchase the power from the wind farm, which will provide the basis
for the project financing.
The New York State Energy Research and Development Authority (NYSERDA) is planning to issue a
report on addressing the cost of offshore wind and has also commissioned an offshore wind policy
study.

Offshore Wind Market and Economic Analysis Page 145 Document Number DE-EE0005360
B.9.2 Site Selection and Leasing Policies
In 2010, New York requested that BOEM establish a task force to facilitate intergovernmental
communications regarding OCS renewable energy activities and development. This task force is
planning to identify a WEA for lease by private developers in addition to the site that the NYPA
Collaborative identified.
BOEM issued a Request for Competitive Interest inviting other developers for the NYPA site to indicate
their interest and inviting public comments on environmental concerns. Fishermen’s Energy and EMI
(Cape Wind developer) expressed interest in developing the same site. Therefore, BOEM determined
that competitive interest exists and issued a Call for Information and Nominations for the site on May
28, 2014. After determining the final WEA boundaries, BOEM will initiate a competitive auction process
for this site.
Figure B-6. New York Offshore Wind Leasing Areas
B.10 North Carolina
B.10.1 Site Selection and Leasing Policies
On Aug. 11, 2014, BOEM announced that it has identified three Wind Energy Areas (WEAs) offshore
North Carolina:
The Kitty Hawk WEA begins about 24 nautical miles (nm) from shore and extends
approximately 25.7 nm in a general southeast direction. Its seaward extent ranges from 13.5 nm
in the north to .6 nm in the south. It contains approximately 21.5 Outer Continental Shelf (OCS)
blocks (122,405 acres).

Offshore Wind Market and Economic Analysis Page 146 Document Number DE-EE0005360
The Wilmington West WEA begins about 10 nm from shore and extends approximately 12.3 nm
in an east-west direction at its widest point. It contains just over 9 OCS blocks (approximately
51,595 acres).
The Wilmington East WEA begins about 15 nm from Bald Head Island at its closest point and extends
approximately 18 nm in the southeast direction at its widest point. It contains approximately 25 OCS
blocks (133,590 acreas).57
B.11 Ohio
B.11.1 Site Selection and Leasing Policies
Ohio developed an Offshore Wind Turbine Placement Favorability Interactive Map Viewer to evaluate
sites. This tool is no longer publicly available, although some individual maps are available online.
Although Ohio does not have specific offshore wind siting rules, the existing Public Utilities
Commission certification process and coastal management and submerged lands leasing policies and
rules are being used to perform a regulatory review of the offshore wind demonstration project in Lake
Erie.
B.12 Rhode Island
B.12.1 Policies to Address Cost Competitiveness
In 2004, Rhode Island established an RPS of 16 percent by 2019. There is no carve-out or REC multiplier
for offshore wind.
In 2008, Rhode Island issued an RFP for an offshore wind project to produce 15 percent of the state’s
electricity demand and subsequently signed a Joint Development Agreement with Deepwater Wind. The
Rhode Island Public Utility Commission approved an initial 30-MW Pilot PPA for 24.4 cents/kWh, which
was eventually upheld by the Rhode Island Supreme Court. Rhode Island legislative advocates hope
that lessons learned from construction and operation of the pilot project will help reduce the cost of
constructing and operating a much larger wind farm of 500 to 1,000 MW with the same 6-MW wind
turbines.58
B.12.2 Site Selection and Leasing Policies
Rhode Island held a competitive bid process in 2008 to select a preferred developer for an offshore wind
farm off the coast of Rhode Island. Deepwater Wind LLC was selected as the winner and first negotiated
the contract to sell 30 MW of wind energy from a pilot wind farm in state waters off Block Island, Rhode
Island. BOEM issued a Request for Competitive Interest for the transmission route through 6 miles of
federal waters and then issued a Determination of No Competitive Interest. Deepwater Wind conducted
marine surveys, bird and bat surveys, and filed a General Actwith project permitting taking place in
2012 and construction projected for 2015.
57 BOEM (2013i) 58 OffshoreWind.net 2010

Offshore Wind Market and Economic Analysis Page 147 Document Number DE-EE0005360
On August 18, 2011, BOEM issued a Call for Information and received nine lease nominations for a
larger offshore wind farm or farms on the OCS. On July 2, BOEM issued a Notice of Availability of a
draft EA for the WEA off Rhode Island and Massachusetts and scheduled two public hearings during
the public comment period.
In 2012, BOEM issued a Pre-Sale Notice of Lease Sale and a Final Notice of Lease Sale scheduling the
auction for July 31, 2013. Six developers qualified to bid in the auction. Deepwater Wind has been
designated the preliminary winner of both leases for the auction.59
B.13 Texas
B.13.1 Site Selection and Leasing Policies
The Texas General Land Office stipulates which areas are available for lease, the minimum MW size, and
the minimum royalty rates. Winning bidders are granted phased access, first given research rights, and
then construction and operation rights.
B.13.2 Infrastructure Policies
Texas has designated specific areas for land-based wind development to provide a level of certainty for
transmission development. In 2008, in response to legislative action, the Texas Public Utilities
Commission established five CREZ lines to be connected to load centers. Each of the five CREZ lines is to
be funded by all Texas ratepayers. The PUC called for $4.93 billion of CREZ transmission projects to be
constructed by seven transmission and distribution utilities and independent transmission development
companies. Transmission lines to each of the five CREZ areas, totaling 3,600 miles, are now projected to
cost $6.8 billion. The initiative will eventually facilitate the transmission of more than 18 GW of wind
power from west Texas and the Panhandle to the state’s highly populated areas.60
B.14 Virginia
B.14.1 Policies to Address Cost Competitiveness
Virginia is seeking to reduce the cost of offshore wind by developing a pilot offshore wind farm and
having the local transmission system owner, Dominion Virginia Power, conduct interconnection studies
exploring a high-voltage offshore submarine cable that could interconnect to a few wind farms.61 The
Virginia Department of Mines Minerals and Energy submitted an unsolicited request for a research lease
for two 6-MW turbines on a twisted lattice foundation at the western edge of the Virginia WEA known
as the Virginia Offshore Wind Technology Assessment Project. BOEM determined no competitive
interest after an opportunity for comment and the VOWTAP team submitted a Research Activities Plan
to BOEM in February 2014.
59 BOEM 2013f 60 CREZ 2013 61 ABB Power Systems 2012

Offshore Wind Market and Economic Analysis Page 148 Document Number DE-EE0005360
B.13.2 Site Selection and Leasing Policies
In February 2012, BOEM convened a Renewable Energy Task Force and issued a Call for Information
and Nominations, and received several nominations and comments. BOEM issued a Pre-Sale Notice and
Final Notice of Lease Sale, conducted an auction on September 4, 2013, and determined that Dominion
won the bidding for the entire WEA.62
Figure B-7. Virginia Offshore Wind Leasing Areas
62 BOEM 2013g

Offshore Wind Market and Economic Analysis Page 149 Document Number DE-EE0005360
Appendix C. Offshore Wind Policies in Selected European Countries
This appendix includes details on offshore wind policies and related activities in selected European
countries. The categories of policies to address cost competitiveness and site selection and leasing are
included. A summary of policies that address cost competitiveness is provided in tabular form in Section
2.3.3.
C.1 Belgium
C.1.1 Transmission
In Belgium, offshore wind projects are responsible for building the electricity generating asset offshore,
converting it to high voltage as the case may be and transporting it to the connection point agreed with
Elia, the Belgian transmission system operator. Elia is responsible for connecting the wind farms and
ensuring that there is sufficient grid capacity. For the existing wind farms, the connection point was
onshore and Elia has participated up to € 25 million of the electrical export costs for projects of 216 MW
or greater. In 2013, financial close for 1.5 GW of projects has been delayed due to pending approval of
network expansion. Grid capacity was insufficient to host any of the upcoming four projects: Norther
(350-450 MW), Rentel (288 MW), Seastar (246 MW) and Mermaid (449-490 MW). Elia has therefore
developed the Stevin project which consists in expanding the actual network from Zeebrugge to
Zomergem and constructing a new high voltage substation in Zeebrugge. Another high voltage
substation will be built near Zomergen connecting the northern interconnection between France,
Belgium and the Netherlands with the Coastal region. Financial close for any of these four projects
cannot be reached until (i) all permits for the Stevin project are secured and free of legal challenges and
(ii) there is visibility on a credible timing on completion of the works, which is not expected to occur
before mid-2014.63
For the upcoming wind farms, there are plans by Elia to build an offshore grid “hub”, allowing
mutualising the grid connection effort between projects and reducing the overall cost of connection for
these projects. This Belgian Offshore Grid (BOG) project will consist of two high voltage stations,
“Alpha” and “Beta”, a submarine interconnection cable and four submarine cables to the onshore grid
connection point in the Steven Location. The transmission assets will be built and operated by Elia
resulting in: (i) a lower total investment budget for the project developer given that the grid connection
would then be offshore, closer to the generating assets of the project, (ii) new operational expenses for
the project in the form of a grid fee to be paid to Elia and (iii) the disappearance of the € 25 million
subsidy from Elia. From a risk perspective, this is a major change as the project developer will no longer
control the construction timing of the transmission assets. It could lead to situations similar to those
observed in Germany where delays in construction of transmission assets by the TSOs occurred on a
large scale and affected the expansion of the sector.
63 Dodd 2013

Offshore Wind Market and Economic Analysis Page 150 Document Number DE-EE0005360
C.1.2 Ports
Port of Oostende is the major port for offshore wind in Belgium. Since 2010, a project called “Renewable
Energy Base Oostende” (REBO) has been developed to make the existing port infrastructure usable for
offshore wind activity.64 It is funded by both public and private partners. Main players in offshore wind
are present there. For example, in late 2013, the Alstom 6 MW Haliade turbine, the largest turbine
currently on the market, was loaded on the installation vessel at Oostende. 65
C.1.3 Planning
With the Royal Decree of 17 May 2004, Belgium reserved a zone in the Belgian part of the North Sea for
the production of electricity. Between 2004 and 2012, this area has been divided and conceded to
seven offshore wind parks, for around 2.2 GW. Two of them are already operational: Belwind (165 MW
operational of the total capacity of 330 MW) and C-Power (325 MW). One project is currently under
construction (Northwind) which should become operational in the next few months, and the other
projects are under development.
C.1.4 Permitting
Each project developer must obtain a domain concession and an environmental permit. The
environmental permitting process includes a public hearing during which the public can express any
objections. The Management Unit of the North Sea Mathematical Models (MUMM) of the Royal Belgian
Institute of Natural Sciences renders advice on the possible environmental impact of the future project to
the Minister responsible for the marine environment. MUMM’s advice includes an environmental
impact assessment, based on an environmental impact study that is set up by the project developer. The
Minister then grants or denies the environmental permit. 66
The permits include a decommissioning obligation including specific amounts to be provisioned to
perform the decommissioning.
C.1.5 Operations
As part of the environmental permit obligations, a monitoring program has to be implemented in order
to assess the effects of the project on the marine environment. The environmental monitoring is a legal
obligation and is a competency of the federal government. The monitoring has two goals: (i) to enable
the authorities to mitigate or even halt the activities in case of extreme damage to the marine ecosystem,
and (ii) to understand and evaluate the impact of offshore wind farms on the different aspects of the
marine environment and consequently support the future policy regarding offshore wind farms.
The monitoring is led by MUMM, but MUMM collaborates with several other institutes that each has a
specific expertise of the marine environment. The costs of the monitoring program are paid by the
permit holders.67
64 Port of Oostende 2013 65 http://www.alstom.com/press-centre/2013/9/alstoms-6mw-haliade-offshore-wind-turbine-loaded-at-ostend/ 66 Degraer 2012 67 Degraer 2012

Offshore Wind Market and Economic Analysis Page 151 Document Number DE-EE0005360
C.2 Denmark
C.2.1 Transmission
Offshore wind sites in Denmark are granted through the Danish Energy Agency’s (DEA’s) competitive
tender process. The Danish TSO,), Energinet.dk, is responsible for funding and connecting the wind
farms to the onshore grid. The TSO recovers the costs through the transmission tariff collected from all
electricity customers. The offshore wind farm and the offshore transmission system development
timelines set out in a call for tender are very challenging. However, project termination or delays after
tender award are subject to substantial penalties. This is one of the reasons for there being only one
bidder during the tendering process of the Anholt wind farm organized in 2009. Due to the design of the
tendering process, all projects are connected individually (i.e., point-to-point connections), and there are
no plans for inter-project transmission.
C.2.2 Ports
Ports in Denmark are owned by their respective municipalities. Any upgrades made to them are
approved by the municipality.
Denmark’s primary offshore wind port is the Port of Esbjerg. The port was once one of Denmark's
largest fishing ports but had faced a decline in recent decades. It was largely revitalized with the
installation of the Horns Rev 2 offshore wind project. Now, 65 percent of wind turbine exports pass
through the port.68 The Port has also been used to ship components to several offshore wind farms
outside Denmark including the UK’s Lincs, Gunfleet Sands and London Array. 69 The Port of Esbjerg's
board of directors has developed a strategic plan through 2019 that includes DKK 1 billion ($ 186
million) of investment.70 In June last year, the Port of Esbjerg inaugurated the new East Harbour,
a 650,000 square meter expansion of the harbour, which represented an investment of more than
DKK 500 million. The new section is big enough for hosting the largest existing wind turbines.71
C.2.3 Planning
In 1997, the Danish government published Denmark’s Action Plan for Offshore Wind. This plan
recognized the difficulty in finding sufficient suitable land-based sites for wind power to reach the
government’s long-term wind targets. The action plan identified five potential large-scale offshore
demonstration projects to be funded by a Public Service Obligation and built by public utilities.
Subsequently, the government opted to use a tender process for the development of two projects over
160 MW each. The wind farms Horns Rev and Nysted were eventually constructed, the former in 2002
and the latter in 2003. In the 1997 Action Plan, the government also outlined a centralized spatial
planning procedure for offshore wind in Denmark, identifying appropriate sites for development while
taking into account the potential environmental impacts.
68 Esbjerg Kommune 69 Aagaard 2012 70 Ministry of Foreign Affairs of Denmark 2009 71 World Maritime News 2013

Offshore Wind Market and Economic Analysis Page 152 Document Number DE-EE0005360
In 2004, the DEA called for tenders for two 200-MW offshore wind farms, one at Horns Rev II and one at
Rødsand. The former was completed in 2009, while the latter was completed in 2010. In 2007, the Action
Plan was updated to reassess selected sites for offshore wind development. The updated plan identified
areas with favorable wind resources totaling 4,600 MW of potential capacity, corresponding to 50
percent of Danish electricity consumption.72
C.2.4 Concessions
The Danish government controls economic activity within
territorial waters, the Contiguous Zone, and the Exclusive
Economic Zone (EEZ). It can award offshore wind farm
concessions based on the Electricity Supply Act.
Developers can apply for an offshore license in two ways:
1. Based on the Danish government’s action plan for
offshore wind development, the DEA invites developers to bid on tenders for pre-specified sites.
2. Through the “open-door principle,” developers, at any time, can apply to develop a site. The
DEA assesses the site and, if it approves the project, grants development rights on a “first come,
first served” basis.73
Under the first procedure, the TSO performs and funds the transmission connection to shore. In the
second procedure, the developer must perform the grid connection. Cost recovery in this case is based
on the onshore rules. Projects following the “open-door principle” must also offer 20 percent ownership
to the local population, as is the case with land-based wind. Due to the lack of financial incentives, no
major commercial offshore project has been developed through the open-door route.
Six areas in Denmark have been identified for the offshore wind turbines at: Bornholm,
Smålandsfarvandet, Sejero Bay, Sæby, and the southern and northern areas of the Danish North Sea.
Tenders will be organized this year for the following projects: (i) the 400 MW Horns Rev 3 wind farm,
(ii) the 600 MW Krieger’s Falk wind farm and (iii) a combination of near-shore wind farms totaling
450 MW. Finally, demonstration projects with a capacity of 50 MW will also be deployed by 2020.
Prequalification and final outcomes of the tenders are respectively expected for Q4 2014 and Q3 2015. 74
C.2.5 Permitting
In Denmark, Chapter 3 of the Promotion of Renewable Energy Act indicates that the right to exploit
energy from water and wind within the territorial waters and the EEZ (up to 200 nautical miles) around
Denmark belongs to the Danish State. To establish an offshore wind project in Denmark, a developer
must obtain three licenses from the DEA. In terms of permitting, this agency serves as a "one-stop shop.”
72 The Committee for Future Offshore Wind Power Sites 2007 73 Energi Styrelsen 2013 74 Danish Energy Agency 2013
The Danish government has a
centralized offshore wind spatial
planning procedure and awards
all offshore wind concessions.

Offshore Wind Market and Economic Analysis Page 153 Document Number DE-EE0005360
It streamlines the project developer’s relationship with all of the offshore wind power stakeholders. The
Promotion of Renewable Energy Act mentions three licenses:
License to carry out preliminary investigations
License to establish the offshore wind turbines (only
given if preliminary investigations show that the project
is compatible with the relevant interests at sea)
License to exploit wind power for a given number of
years and—in the case of wind farms of more than 25
MW—an approval for electricity production (given if conditions in license to establish project
are kept)
The DEA grants the three licenses for a specific project. If a given project can be expected to have an
environmental impact, the developer must perform an EIA. The specific regulations regarding EIAs for
offshore wind farms are described in Executive Order no. 815 of August 28, 2000.
C.2.6 Operations
In granting the building permits for Horns Rev and Nysted, Denmark’s first two large-scale (i.e., over
100 MW) wind farms, the DEA included an obligation for the project developers to carry out
comprehensive environmental monitoring programs. The DEA specified that these programs should
include detailed measurements of the environmental conditions before, during, and after construction.
Between 2001 and 2006, the program had a budget of DKK 84 million (approximately €11 million). The
program was financed as a public service obligation by electricity consumers. The monitoring work has
been coordinated by a group consisting of the Danish Forest and Nature Agency, the DEA, and the
projects’ developers, Vattenfall and DONG Energy. The results of the monitoring programs have been
evaluated by the International Advisory Panel of Experts on Marine Ecology (IAPEME).75
As part of the preparation of the offshore wind tenders, the DEA is now responsible for preparing site
investigations and the EIA –if the project is likely to have an environmental impact, which has been the
case for all the existing offshore wind farms– and provide them to the parties considering bidding.76
C.3 France
Despite the existence of a feed-in tariff for offshore wind energy in France, no offshore wind farm has
been built to date, due to the low level of this existing support scheme. In addition to the existing
unsuccessful support scheme, 4 offshore wind sites in France have been granted through competitive
tender processes, and two further sites are to be granted in the coming months.
75http://193.88.185.141/Graphics/Publikationer/Havvindmoeller/Offshore_wind_farms_nov06/pdf/havvindm_korr_1
6nov_UK.pdf 76 Danish Energy Agency 2014
The Danish Energy
Agency serves as a “one-
stop shop” for permitting.

Offshore Wind Market and Economic Analysis Page 154 Document Number DE-EE0005360
Candidates have been tendered on the basis of:
(i) the level of the feed-in tariff that they will receive during the first 20 years of operation of the
projects,
(ii) the quality of their industrial project, including supply chain aspects, and
(iii) compliance with the environment.
C.3.1 Transmission
The French TSO, Réseau de transport d’électricité (RTE), an independent subsidiary of EDF is the owner
of the transmission assets and is responsible for the permitting and the construction and the operation
and maintenance of the grid connection assets (high voltage export cables and onshore substation). The
offshore wind projects are responsible for the building of the offshore substation; the grid connection
point is immediately after the substation.
The construction costs of the grid connection assets owned by RTE are to be borne by the developer. The
developer is compensated for this investment through a specific component of the tariff, normatively
sized on an expected return for such investment of 7.25% before taxes. The level of the grid component is
not part of the tender criteria. The grid component of the tariff shall be adapted if construction costs
evolve compared to the estimate, according after signing to a pre-agreed formula included in the tender.
After being awarded, each project shall negotiate the conditions of the grid connection in a transmission
agreement. In case of delays caused by RTE, the 20-year duration of the tariff shall not be affected. In
case of low availability of the offshore wind project (below 50%), the grid component of the tariff is
reduced.
C.3.2 Ports
As mentioned in preamble of this paragraph C3, under the tendering process, each candidate is to
describe its industrial project. The supply chain, in this case the ports used and the factories to be built
are an integral part of the candidate selection.
So far the winning consortia and candidates have announced that they would develop a number of ports
that are either close to the offshore sites contemplated or are otherwise located in a place where there is
an existing infrastructure for the members of the consortium.
Announcements have been made for facilities to be built in Saint-Nazaire (Alstom), Cherbourg (Alstom),
Le Havre (Areva), and Dieppe (Areva).
C.3.3 Planning
No offshore wind farm has been built to date in France. However, the French Government has begun to
support the development of offshore wind projects by organizing two rounds of tenders for a cumulated
capacity of 3 GW. Six areas had thus been identified of which 4 have been awarded as part of the first
tender and two further areas are to be awarded in the coming months, and construction is expected to
start in the 2016-2018 period.

Offshore Wind Market and Economic Analysis Page 155 Document Number DE-EE0005360
The tenders include a deadline for completion of the offshore wind projects set:
in 2020 for the tender 1 projects, and
in 2023 for the tender 2 project.
These deadlines may be extended under certain circumstances, but will otherwise lead to a reduction in
the duration of the feed-in tariff.
C.3.4 Permitting
The offshore wind projects tendering process does not require any conditions on advancement of
permitting. The offshore wind project should benefit from an accelerated permitting procedures once
awarded, supported by the prefecture.
There is legal uncertainty on the legal framework for offshore wind in France. Offshore wind projects
will require a concession from the state on the maritime domain which has never been done so far. The
terms of this concession remain to be fully negotiated, as there are no relevant precedents in this respect
in France.
C.3.5 Operations
There are currently no operational offshore wind farms in France.
C.4 Germany
C.4.1 Transmission
Two of the four German TSOs, TenneT and 50Hertz, are legally responsible, in their respective areas, for
planning, consenting, designing, building, and operating offshore transmission connections for all
offshore wind projects whose construction has begun prior to 2015. The TSOs incur investments in
offshore transmission assets and recover costs through transmission tariffs from the customers of all four
German TSOs.
The main challenge for offshore wind in 2012 was related to the grid, as TenneT, the TSO of the North
Sea area, has delayed construction of some of the export cables. The New German Energy Act (EnWG),
enacted on January 1, 2013, clarifies the compensation to which projects impacted by such delays are
entitled and how the funds can be raised for such purpose. This law is expected to unlock the situation
with TenneT. One direct result of the EnWG is a partnership between Mitsubishi and TenneT to invest in
four high-voltage cable projects, enabling connection to shore for an estimated 2.8 GW of offshore wind
farms. In December 2013, the European Invesment Bank provided a € 500 million corporate loan to
TenneT to help finance three high-voltage cable projects (HelWin1, SylWin1 and DolWin1). A total of
6.2 GW connection capacity has been installed by TenneT or is currently under construction. 77
77 OffshoreWind.biz 2013
Offshore Wind Market and Economic Analysis Page 156 Document Number DE-EE0005360
C.4.2 Ports
C.4.2.1 Bremerhaven
The Federal State of Bremen has stated a goal of making Bremerhaven and Bremen into the leading
competence center and production area for offshore wind energy in northwest Germany.78 In 2002,
having recognized the emerging potential of offshore wind, the state government of Bremen decided to
invest €20 million on infrastructure upgrades and other incentives to help the port of Bremerhaven
benefit from the significant wind development already approved for in the German North Sea.79 The
state of Bremen was the first in northern Germany to implement such a policy for offshore wind.80 Policy
actions have included R&D and investment support schemes, as well as support for networks and
offshore-oriented infrastructure. The state’s policy reserved certain areas for offshore activities and
invested in port upgrades to accommodate these activities. Regional policymakers in Bremen strongly
recruited companies to relocate or set up their offshore activities in the state. In subsequent years,
AREVA (Multibrid), Repower, Powerblade, and Weser Wind established manufacturing facilities at the
port of Bremerhaven.
In January 2010, the Bremen Senate decided to commission a new heavy load, assembly, and
transshipment facility for the offshore industry at Bremerhaven beginning in 2014. The €180 million
facility will be called Offshore Terminal Bremerhaven (OTB). Government officials in Bremen have
stated the goal of developing Bremerhaven into the European center for offshore wind energy. The
construction, financing, and operation of the OTB will be conducted through a concession model. The
state government has selected Bremenports, which has managed the port infrastructure in Bremen and
Bremerhaven since 2002, to conduct a European-wide public tender for the project. The operating
contractor is expected to be awarded by spring 2014. 81 The Bremen government will grant the concession
to the private investor who will recover its costs through user fees. The investor will receive no
government startup financing.82
C.4.2.2 Cuxhaven
The government of Lower Saxony, having identified the port and logistics needs of the offshore wind
energy in the region, is investing to upgrade the North Sea ports of Cuxhaven, Emden, and Brake.83 This
is in contrast to Bremen’s concession model that provides no public funds. To shift its focus to offshore
wind power, the port of Cuxhaven is investing €450 million to construct two new offshore terminals.84
This is in addition to storage and laydown areas already completed. Cuxport, the port operator in
Cuxhaven, has designed a heavy load berth to accommodate the extreme stresses from foundation
sections and generators. In addition, it is planning a new berth for ships of up to 290 meters in length.85
78 Power Cluster 2008 79 Aubrey 2009 80 Fornahl 2011 81 Bremenports 82 Bremenports 2011 83 PES 84 SeeNews Renewables 2011 85 http://www.cuxport.de/en/rhenus-cuxport/services/offshorebase-cuxhaven/

Offshore Wind Market and Economic Analysis Page 157 Document Number DE-EE0005360
C.4.3 Planning
Given the lack of a standardized permitting process, the first few proposed offshore wind farms in
Germany had to define their own site investigations plan. More recently, however, the German
government has sought to develop a more government-led spatial planning system and regulatory
process for offshore wind. Still, the government has not yet implemented a centralized tender or bidding
process like those used in the United Kingdom and Denmark.86 In 2004, Germany’s Federal Spatial
Planning Act was expanded to the EEZ, which extends 200 nautical miles from the German shore.87 This
enabled the development of a spatial plan for offshore wind led by the permitting agency, the Federal
Maritime and Hydrographic Authority (BSH). The first draft of this spatial plan, released in 2008,
identified five priority areas (1,100 square kilometers) for offshore wind energy, meaning that wind
energy in these zones takes priority over other regional activities. They are located in the North Sea
(North of Borkum, East of Austerngrund and South of Amrumbank) and in the Baltic Sea (Kriegers Flak,
West of Adlergrund).88 The draft plan was subsequently revised multiple times based on industry
feedback. Offshore wind farm development outside the priority areas is allowed, but it is subject to the
results of comprehensive environmental impact assessments.
C.4.4 Permitting
As mentioned in Section 2.5.3, in 2004, Germany’s Federal Spatial Planning Act was expanded to the
EEZ.89 This enabled the development of a spatial plan for offshore wind led by the permitting agency,
the BSH. The first draft of this spatial plan, released in 2008, identified five priority areas (1,100 square
kilometers) for offshore wind energy in the German North and Baltic Seas. The draft plan was
subsequently revised multiple times based on industry feedback. Offshore wind farm development
outside the priority areas is allowed but is subject to the results of comprehensive EIAs.
In Germany, permits for offshore wind farms are allocated through an open-door procedure. The first
candidate to submit a proposal for a project that meets all of the BSH’s stated criteria is given priority to
develop the site. The principal component of the German regulatory procedure for offshore wind is
obtaining the permit from the BSH. The permit provides a developer with exclusive rights to a site. Once
the project is fully consented, the developer can submit an application for grid connection. Under
German law, an offer for grid connection and the purchase of the electricity generated from the wind
farm are mandatory. This last step has been the source of many delays; financial responsibility for these
delays has finally been clarified as a result of the EnWG legislation in January 2013.
C.4.5 Operations
In February 2007, the BSH published the third edition of the “Standard for Investigation of the Impacts
of Offshore Wind Turbines on the Marine Environment (StUK3).”90
86 Wiersma 2011 87 OceanWind 2010 88 Offshore-WindEnergieNet 89 OceanWind 2010 90 Federal Maritime and Hydrographic Agency 2013

Offshore Wind Market and Economic Analysis Page 158 Document Number DE-EE0005360
In Germany, the approval holder for an offshore wind farm is responsible for conducting the baseline
assessment, as well as assessments during the construction and operational phase. Monitoring data must
be submitted annually to the approval authority. The monitoring data must include the status prior to
construction, as well as any change during and subsequent to construction.
As part of Alpha Ventus (RAVE), Germany’s first offshore wind farm, the Federal Ministry for the
Environment, Nature Conservation, and Nuclear Safety (BMU) initiated and financed the research at
RAVE project. The BMU has allocated €50 million for the initiative. The initiative encompasses
approximately 25 research projects, some of which are focused on the interdependency of environmental
and technological impacts of offshore wind energy generation. Fraunhofer IWES coordinates the
initiative.91
C.5 The Netherlands
C.5.1 Transmission
In 2010, the Dutch government approved a proposal to make TenneT, the Dutch TSO, responsible for the
construction and management of the country’s offshore transmission grid.92
Currently, offshore wind developers in the Netherlands are responsible for incurring offshore
transmission system costs. The TSO bears the costs for reinforcements to the onshore transmission
system and recovers them through transmission tariffs collected from all electricity customers. However,
due to growth in the Dutch offshore market, there are calls to change this in the near future.
In early 2011, the EIB announced that it would provide €450 million in loans to TenneT to complete the
380kV Randstad transmission ring between The Hague and Rotterdam.93 The transmission cable would
enable the connection of offshore wind farms. The transmission ring is expected to be completed in 2018.
TenneT’s investments in the Dutch transmission network during the next ten years will account for
€ 5 billion. 94
TenneT and the Danish TSO, Energinet.dk, are developing an undersea HVDC interconnector between
the two countries’ electricity grids. The project is called the COBRAcable. The proposed connection
would have a capacity of approximately 700 MW and would be around 275 kilometers in length. The
project incorporates the possibility of interconnecting offshore wind farms.95 Total project cost amount to
€ 449 million. Final investment decision is expected in 2016 once planning consents and approvals are
obtained from the Danish, Dutch and German authorities. 96
91 Fraunhofer Institute 2012] 92 http://www.tennet.org/english/images/100552%20TEN%20Offshorebroch%20%20EN_tcm43-19468.pdf 93 EIB 2011 94 OffshoreWindBiz 2013 95 http://www.tennet.org/english/projects/Internationaalenoffshore/index.aspx 96 EC 2013

Offshore Wind Market and Economic Analysis Page 159 Document Number DE-EE0005360
C.5.2 Planning
The Dutch Ministry of Transport, Public Works and Water Management (MTPW) is the agency
authorized to issue the final site approval and permits for offshore wind projects off the Dutch coast. The
MTPW is now part of the Ministry of Infrastructure and Environment. The clear responsibilities and
procedures administered by this single agency will help to increase developments, as they reduce the
developer’s risks at an early stage in the project.
An Integrated Management Plan for the Netherlands Economic Zone in the North Sea in 2015 introduces
an integrated assessment framework for all activities requiring a permit. One of the key motivators for
this plan is the need to plan for offshore wind energy. Specific zones have been identified where future
offshore wind development should be concentrated. Specific site locations and delivery schedules are
determined by developers in their consent applications.
Dutch Round 2 consisted of 12 projects developed by six consortia who were awarded the right to tender
for 950 MW of subsidies. Only three out of these 12 projects succeeded in granting the subsidy scheme,
called the Stimulation of Sustainable Energy Production “Stimulering Duurzame Energie” (SDE). Neither
government nor industry was satisfied with the planning and organization of the Dutch Round 2. As a
result, no offshore wind farm has been completed in the Netherlands in the last five years, the only two
operational parks being Egmond aan Zee (108 MW, 2006) and Princess Amalia (120 MW, 2008). 97 In
February 2014, the Dutch government proposed two new offshore development zones: Hollandse Kust
(maximum capacity of 7.3 GW) and the Noorden van de Waddeneilanden block (maximum capacity of
1.2 GW). A public consultation started in January this year. The draft bill has been approved by the
council of ministers and will go through the parliament in mid-2014. 98
C.5.3 Concessions
The rights for development are granted through a competitive tendering process. To take part in this
tendering process, the developer has to obtain a planning consent for the site. The winning bidders
receive the SDE tariff. To date, two tendering rounds have been held. The third and most significant
round was planned, but it did not commence due to political uncertainty and changes recently
introduced to the FiT structure. Developers would have looked to obtain consent in anticipation of the
third tendering round, thus accounting for the number of projects in the “approved” stage in the
Netherlands.
In July 2011, the FiT system was changed, and the first call to tender was launched for renewable energy
generation under this new tariff SDE+. The SDE+ scheme is expected to be consumed by other renewable
technologies. This is because the tariff is not deemed to provide sufficient returns compared to the high
capital costs of offshore wind power. The economic crisis and the unsatisfactory tender results for the
previous OWF tender rounds, including several objections and procedures in court, have reduced
interest in offshore wind development. But in September 2013, the Dutch government published a plan
to speed offshore wind deployment. The national agreement sets a target of 4.5 GW offshore wind
97 Wind Power Offshore 2013 98 Wind Power Offshore 2014

Offshore Wind Market and Economic Analysis Page 160 Document Number DE-EE0005360
capacity installed by 2023. Among other things, it plans to establish a proper legal framework for
offshore wind by 2015, facilitate grid connection and extend the SDE scheme. For 2013, € 3 billion have
been made available under the SDE, which is a major increase from the € 1.7 billion that was available
the previous year. The government is also committed to dedicating € 3.5 billion to the SDE 2014 budget.
C.5.4 Permitting
As mentioned in Section 2.5.3, the OWEZ project in the Netherlands required consents from numerous
authorities, but the process is now managed by a single ministry. A clear procedure is critical to increase
developments, as it reduces the developer’s risks at an early stage in the project.
An Integrated Management Plan for the Netherlands Economic Zone in the North Sea in 2015 introduces
an integrated assessment framework for all activities requiring a permit. One of the key motivators for
this plan is the need to plan for offshore wind energy. Specific zones have been identified where future
offshore wind development should be concentrated.
C.5.5 Operations
In 2001, the Dutch government decided to support the OWEZ offshore wind energy farm demonstration
project. Prior to the project’s construction, the Dutch government called for baseline studies on ecology
and environmental factors. From 2002-2004, several consultancies conducted the baseline studies. After
the wind farm began operation in late 2006, the project developer, NoordzeeWind, continued to monitor
the project’s impact on the environment, as required in the tender agreement. NoordzeeWind conducted
this NSW-MEP Monitoring and Evaluation Programme in cooperation with leading research institutes.
The research program began in 2006 and continued until 2012.99 The Dutch government designated NL
Agency, Energy and Climate Change as the responsible party for overseeing the monitoring program on
behalf of the Dutch Ministry of Economic Affairs. NL Agency received the data and verified the
consistency, integrity, validity, and plausibility of the data. Moreover, NL Agency was instructed to
store and distribute the data to third parties.100
C.6 United Kingdom
C.6.1 Transmission
The OFTO regime was introduced by Ofgem in response to the 'third energy package' implemented by
The European Union in June 2009 to promote competition. Generators of offshore electricity projects
were previously responsible for consenting, licensing, constructing and maintaining all of the grid
connection assets. This system was however considered to be incapable of delivering cost-effective
connections. Therefore, as of 2009, generators of offshore electricity have not been allowed to own the
offshore transmission infrastructure (consisting out of the offshore substation and high voltage
transmission cable (the so called ‘export cable’)). Qualifying companies now bid through a competitive
tender process to become an OFTO. The OFTOs will receive, via the TSO, National Grid, a 20-year
stream of revenue payments. These payments are determined according to the OFTO’s bid during the
99 http://www.agentschapnl.nl/programmas-regelingen/ecology-and-environment 100 http://www.agentschapnl.nl/programmas-regelingen/monitoring-and-evaluation-windpark-egmond-aan-zee

Offshore Wind Market and Economic Analysis Page 161 Document Number DE-EE0005360
tender process. Under this regime, offshore wind farm operators can choose to construct their own
transmission connections or opt for the OFTO to do so. This approach is unique, as most other European
countries have directly tasked their TSOs with construction and maintenance of offshore wind grid
connections. To be sure that the OFTO will be able to transmit power produced by the generator, the
OFTO is subject to a system of incentives which rewards or penalises it depending on its availability
performance against the annual target set at 98%. It can result in penalties of up to 50% of its annual
revenue, and conversely, it can reward the OFTO by up to 5% of its annual revenue.
C.6.2 Ports
In 2007, the U.K. government conducted a review of national port policy. The government
recommended that the country’s major ports, most of which are privately owned and operated, produce
master plans.
The Planning Act 2008 was enacted to speed up the approval process for new nationally significant
infrastructure projects (NSIPs) in various economic sectors. National Policy Statements (NPSs) were
developed for 12 infrastructure sectors, one of which was ports.
In 2008, the DECC commissioned an independent study by BVG Associates entitled U.K. Ports for the
Offshore Wind Industry: Time to Act.101 The findings of the report contributed to the Department for
Transport’s NPS for ports. The NPS on ports was published in October 2011 and presents the
government’s conclusions regarding the need for new port infrastructure.102 The statement considers the
current role of ports in the country’s economy, the ports’ forecasted future demand, and the options for
meeting future needs. The NPS provides decision-makers with the approach they should use to evaluate
port development proposals.
In October 2010, the United Kingdom launched its first National Infrastructure Plan (NIP).103 Whereas
the NPS focus more on infrastructure planning, the NIP focuses on investment in infrastructure. The
scope of the sectors covered in the NIP is also greater than that of the NPSs.
In October 2010, to support the achievement of its renewable energy targets for 2020, the United
Kingdom’s DECC and The Crown Estate (TCE) announced a £60 million investment to establish world-
class offshore wind manufacturing at port sites.104 On publication of its country’s first NIP, Prime
Minister David Cameron said, “We need thousands of offshore turbines in the next decade and beyond
yet neither the factories nor these large port sites currently exist. And that, understandably, is putting off
private investors. So we’re stepping in.” 105
The government has stated that it will accept applications from manufacturers or joint applications from
manufacturers and ports. However, the funding is not available for port-only applications. Applicants
101 BVG 2009 102 U.K. Department for Transport 2011 103 http://www.hm-treasury.gov.uk/d/nationalinfrastructureplan251010.pdf 104 UK DECC 2010 105 UK DECC 2010

Offshore Wind Market and Economic Analysis Page 162 Document Number DE-EE0005360
apply for support under the Grants for Business Investment scheme, the United Kingdom’s national
business support scheme that supports sustainable investment and job creation in the Assisted Areas of
England. Assisted Areas are locations where regional economic development aid may be granted under
EU legislation. Funding commenced in April 2011 and is available through March 2015.
Shortly upon the announcement of this funding, turbine manufacturers Siemens, Gamesa, and Vestas
committed building portside manufacturing facilities in the United Kingdom. Siemens has committed to
produce its 6-MW offshore turbines at the Port of Hull in East Yorkshire,106 and Gamesa has chosen to
manufacture offshore turbines at the Port of Leith near Edinburgh.107 Gamesa will invest up to
€ 150 million in this new hub. 108 Vestas eventually abandoned its project to build its V164-7.0 MW
turbines at the Port of Sheerness in Kent due to lack of orders.109
The United Kingdom has had three rounds of offshore wind concessions, which are discussed in the
following three sections.
C.6.3 Round 1
In 2001, developers seeking sites for offshore wind projects
initiated Round 1. The relatively quick consenting process for
some of the projects in this round, such as North Hoyle and
Scroby Sands, reflects the well-established consenting regime
for electricity projects in place at the time. This demonstrated
the value and importance of a strong permitting framework
for offshore wind. The incremental approach used in Round
1—namely, smaller projects that were relatively close to
shore, delivered viable projects while also providing
significant experience and lessons learned for all stakeholders
(i.e., developers, contractors, and government).
C.6.4 Round 2
Whereas Round 1 was developer-led, Round 2, launched in 2003, was government-led. The U.K.
government recognized the importance of spatial planning and the need to streamline the consenting
process. A “one-stop shop” approach was created for permitting. For Round 2, the government
commissioned Strategic Environmental Assessments (SEAs) for three regions deemed attractive for
offshore wind development, the Thames Estuary, the Greater Wash, and the North West. In July 2003,
TCE issued a formal Invitation to Tender. Round 2 was designed to be significantly more ambitious than
Round 1. No limit was placed on size and no restriction to territorial waters was made. Fifteen of the 70
proposed projects were granted leases.
106 BBC 2012b 107 The Guardian 2012 108 Shankleman 2012 109 BBC 2012a
The U.K. government
recognized the need to
streamline the consenting
process and created a “one-
stop shop” approach for
permitting.
Offshore Wind Market and Economic Analysis Page 163 Document Number DE-EE0005360
In Round 2, TCE charged successful applicants a one-time fee based on the spatial area of their
respective sites. This ranged from £25,000 to £0.5M. Once operational, owners of Round 2 projects will be
required to make lease payments on the order of £0.88/MWh (indexed to inflation). The lease payments
are projected to be approximately 1 percent of gross power sales, including incentives. In July 2009, TCE
announced an offer to operators of Round 1 and Round 2 wind farms to extend their site leases to 50
years, affording developers greater certainty when considering life-extension and re-powering of their
projects. This move was also designed to instill greater confidence in the supply chain, addressing a
perceived gap in the project pipeline between Rounds 2 and 3.
C.6.5 Round 3
For Round 3, initiated in 2008, TCE, the seabed owner and manager, established a strategic spatial
planning process and identified nine Round 3 Zones in U.K. waters prior to running an extensive tender
process to identify credibility and financial robustness. Additionally, the U.K. government has
implemented a new Infrastructure Planning process for the permitting of offshore projects, providing an
improved, more efficient, and timelier consenting regime.
U.K. Round 3 exemplifies the importance and benefits of “zonation,” SEAs, and proactive spatial
planning. This framework approach, commencing in 2007 with a national Strategic Environmental
Assessment, concluded with an extensive marine spatial planning constraint mapping process
undertaken by TCE, with extensive consultation with stakeholders.
In U.K. Round 3, the advantages of zonation have been further extended by providing a collaborative
framework with TCE to develop the zones to maximize capacities. The principle of proactive spatial
planning has been taken a stage further in Round 3 through the ongoing technical and environmental
zone appraisal within the zone by the developer and TCE to utilize regional environmental assessment
tools to best locate projects according to environmental and permitting constraints. For Round 3, TCE
has granted exclusive development rights for nine zones. New Infrastructure Planning Commission will
be a one-stop permitting shop. Permits from local authorities will still have to be obtained.
In December 2007, the Department for Business, Enterprise and Regulatory Reform (BERR) announced
the commencement of an SEA, aimed at facilitating significant further expansion for offshore wind. A
target of 25 GW of additional capacity by 2020 was also announced. In January 2009, the U.K. Offshore
Energy SEA Environmental Report was issued for public consultation. The SEA indicates that the
preferred approach of DECC is to apply spatial and operational limitations to offshore wind
development zones, where required, to mitigate unacceptable environmental impacts, while supporting
the overall use of the U.K. marine environment for achievement of the U.K. government’s energy policy
objectives.
TCE has published a generic version of a Round 3 pro forma leasing agreement; however, the specifics of
individual agreements are negotiated on a project-by-project basis. The pro forma states that leases are
offered on an 80-year basis (as opposed to 50-year leases for Round One and Round Two projects). Once
awarded a site, developers pay a non-refundable Lease Premium of an amount agreed upon with TCE.
Rent from date of lease agreement to commissioning is a notional £500 per annum per leasing
agreement. Following wind farm commissioning, the rent payable is a factor of generated electricity.

Offshore Wind Market and Economic Analysis Page 164 Document Number DE-EE0005360
The 2009 Marine and Coastal Access Act, together with the 2010 Marine (Scotland) Act and upcoming
Northern Ireland Marine Bill, have set up a maritime planning system for all U.K. waters. Suitable areas
for offshore wind development have been identified through SEAs.
C.6.6 Permitting
Whereas the U.K.’s Round 1 was developer-led, Round 2, launched in 2003, was government-led. The
U.K. government recognized the importance of spatial planning and the need to streamline the
consenting process. A “one-stop shop” approach was created for permitting. For Round 2, the
government commissioned SEAs for three regions deemed attractive for offshore wind development: the
Thames Estuary; the Greater Wash; and the North West.
For Round 3 initiated in 2008, TCE, the seabed owner and manager, established a strategic spatial
planning process and identified nine Round 3 Zones in U.K. waters, prior to running an extensive tender
process to identify credibility and financial robustness. Additionally, the U.K. government has
implemented a new Infrastructure Planning process for the permitting of offshore projects, providing an
improved, more efficient, and timelier consenting regime.
C.6.7 Operations
In the U.K., offshore wind farm license holders are responsible
for monitoring the environmental impacts of their facilities.
Licenses under the Food and Environment Protection Act 1985
(FEPA) are required for any construction activity within the
marine environment. The FEPA licensing process includes a
thorough assessment of the likely impacts of the offshore wind
farm on the marine environment and the need for measures to
mitigate impacts and/or plans for marine environmental
monitoring.
In 2010, the Centre for Environment, Fisheries & Aquaculture Science (Cefas), with support from FEPA
and the Sea Mammal Research Unit (SMRU), conducted a study entitled “Strategic Review of Offshore
Wind Farm Monitoring Data Associated with FEPA Licence Conditions.”110 The report concluded the
following:
It is vital to have clearer objectives within license conditions to ensure the developer knows why
and what monitoring is required
It is important to incorporate datasets from national or even international monitoring programs
to utilize all available data
There is a need to develop novel techniques to assess the issues identified in the Environmental
Statements
110 Walker 2010
In the U.K., offshore wind
farm license holders are
responsible for monitoring
the environmental impacts
of their facilities.

Offshore Wind Market and Economic Analysis Page 165 Document Number DE-EE0005360
Few conditions can be removed from licenses
License conditions need to better reflect current scientific understanding and need to be more
explicit in their wording to aid enforcement
More work is required within monitoring reports to assess interactions between different
receptors
All topic areas stressed the need to have a standardization of survey and analytical
methodologies wherever possible to aid in future comparison and assessment
Related Documents