Offshore Wind in Europe Key trends and statistics 2018

Welcome message from author
This document is posted to help you gain knowledge. Please leave a comment to let me know what you think about it! Share it to your friends and learn new things together.
Transcript

Subtittle if needed. If not MONTH 2018Published in Month 2018
Offshore Wind in Europe
Key trends and statistics 2018


Offshore Windin Europe
windeurope.org
Key trends and statistics 2018Published in February 2019

TEXT AND ANALYSIS: WindEurope Business IntelligenceFlorian SelotDaniel FraileGuy Brindley
EDITORS:
Colin Walsh, WindEurope
DESIGN:
Laia Miró, WindEurope
FINANCE DATA:
Clean Energy Pipeline.All currency conversions made at EUR/ GBP 0.8774 and EUR/USD 1.1330Figures include estimates for undisclosed values
PHOTO COVER:
Courtesy of MHI Vestas Offshore Wind
MORE INFORMATION:
[email protected]+32 2 213 18 68
This report summarises construction and financing activity in European offshore wind farms from 1 January to 31 December 2018.
WindEurope regularly surveys the industry to determine the level of installations of foundations and turbines, and the subsequent dispatch of first power to the grid. The data includes demonstration sites and factors in decommissioning where it has occurred. Annual installations are expressed in gross figures while cumulative capacity represents net installations per site and country. Rounding of figures is at the discretion of the author.
DISCLAIMER
This publication contains information collected on a regular basis throughout the year and then verified with relevant members of the industry ahead of publication. Neither WindEurope, nor its members, nor their related entities are, by means of this publication, rendering professional advice or services. Neither WindEurope nor its members shall be responsible for any loss whatsoever sustained by any person who relies on this publication.

CO
NTE
NTS
EXECUTIVE SUMMARY ..................................................................................................... 7
1. OFFSHORE WIND INSTALLATIONS ........................................................................... 11
1.1 Overview ......................................................................................................................... 11
1.2 National breakdown of 2018 installations ....................................................... 14
1.3 Cumulative installations ........................................................................................... 18
2. TRENDS: TURBINE SIZE, WIND FARM LOCATION ............................................. 20
2.1 Wind turbine rated capacity ................................................................................... 20
2.2 Wind farm size .............................................................................................................. 21
2.3 Water depth and distance to shore .................................................................... 22
3. INDUSTRY ACTIVITY AND SUPPLY CHAIN ............................................................ 25
3.1 Wind turbine manufacturers ................................................................................. 25
3.2 Wind farm owners ...................................................................................................... 27
3.3 Substructures and foundations ............................................................................ 29
3.4 Cables .............................................................................................................................. 31
4. INVESTMENTS ...................................................................................................................... 33
4.1 Financing activity in 2018 ........................................................................................ 33
4.2 Offshore wind debt finance .................................................................................... 36
4.3 Acquisition activity ...................................................................................................... 37

7Offshore Wind in Europe - Key trends and statistics 2018WindEurope
EXECUTIVE SUMMARY
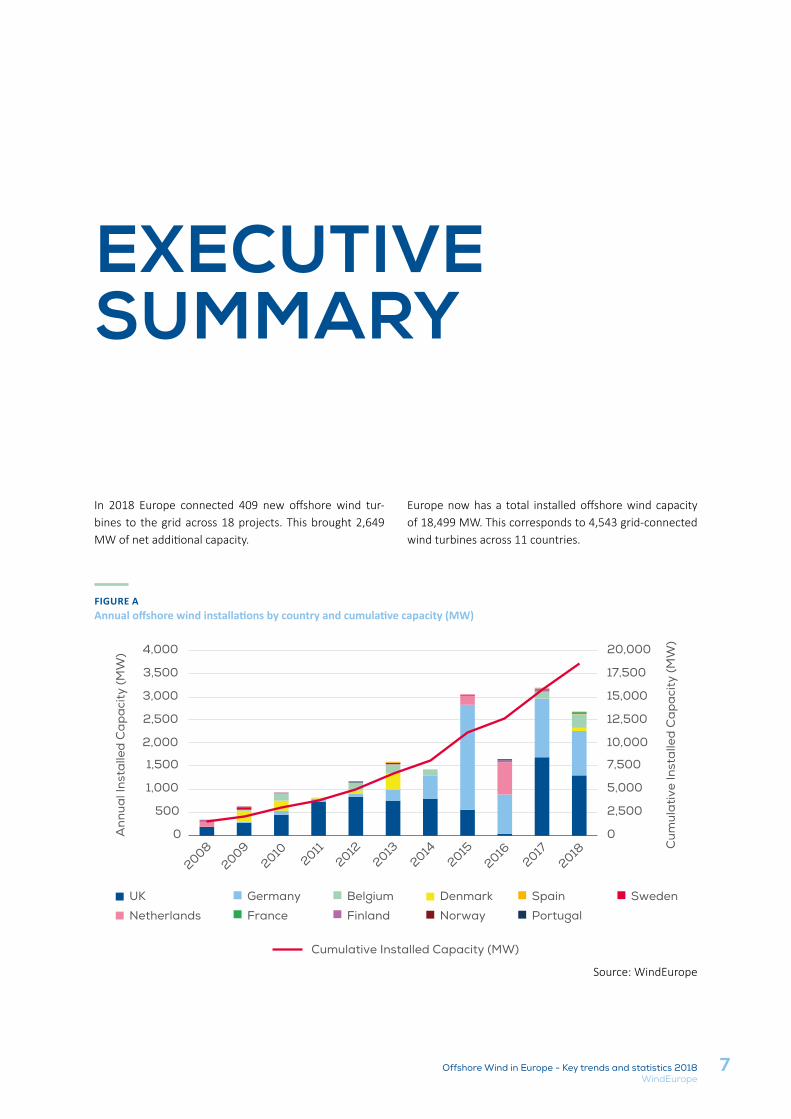
FIGURE A Annual offshore wind installations by country and cumulative capacity (MW)
Source: WindEurope
In 2018 Europe connected 409 new offshore wind tur-bines to the grid across 18 projects. This brought 2,649 MW of net additional capacity.
Europe now has a total installed offshore wind capacity of 18,499 MW. This corresponds to 4,543 grid-connected wind turbines across 11 countries.
UK Germany Belgium Denmark Spain Sweden
Netherlands France Finland Norway Portugal
0
2,500
5,000
7,500
10,000
12,500
15,000
17,500
20,000
0
500
1,000
1,500
2,000
2,500
3,000
3,500
4,000
Cum
ula
tive
Inst
alle
d C
ap
aci
ty (M
W)
Ann
ual I
nsta
lled
Ca
pa
city
(MW
)
20082009
20102011
20122013
20142015
20162017
2018
Cumulative Installed Capacity (MW)

8 Offshore Wind in Europe - Key trends and statistics 2018WindEurope
Executive summary
Separately, twelve new offshore wind projects reached Final Decision Investment (FID) in 2018. Investments in new assets amounted to €10.3bn. This financed 4.2 GW
of additional capacity, which will come on line in the next couple of years.
FIGURE B New offshore wind investments and capacity financed: 2010-2018 (€bn)
Source: WindEurope
Installations in 2018
• Europe added 2,649 MW of net offshore capacity. This is 15.8% lower than in 2017, which was a record year.
• The 2,649 GW represent 409 grid-connected offshore wind turbines across 18 wind farms.
• 15 wind farms were completed (fully grid-connected). Another 3 got partial grid connection and will continue to connect turbines in 2019. Construction work started on other 6 wind farms where no turbines have yet been grid-connected.
• Installations in the UK and Germany accounted for 85% of all new additions.
• Siemens Gamesa Renewable Energy and MHI Vestas Offshore Wind accounted for 95% of all the connected turbines in 2018 (62% and 33% respectively).
• For the first time in Europe, GE Renewable Energy connected their latest turbine: the Haliade 150-6 MW. 20 of these turbines were grid-connected at the Merkur wind farm, Germany.
Cumulative installations
• 4,543 offshore turbines are now installed and grid-connected, making a cumulative total of 18,499 MW.
• Including sites with partial grid-connected turbines, there are now 105 offshore wind farms in 11 European countries.
• The UK has the largest amount of offshore wind capacity in Europe with 44% of all installations in MW. Second is Germany with 34%, followed by Denmark (7%), Belgium (6.4%) and the Netherlands (6%).
8.4
6.15.0
7.28.8
13.1
18.2
7.5
10.3
0
2
4
6
8
10
12
14
16
18
20
0
2
4
6
8
10
12
14
16
18
20
2010 2011 2012 2013 2014 2015 2016 2017 2018
GW€b
n
Total investments (€bn) New capacity financed (GW)

9Offshore Wind in Europe - Key trends and statistics 2018WindEurope
Executive summary
Trends: turbine and wind farm size, depth, distance from shore
• The average size of newly-installed offshore wind turbines in 2018 was 6.8 MW, a 15% increase on 2017. The UK connected the largest turbine in the world (the V164-8.8 MW from MHI Vestas Offshore Wind).
• The average size of wind farms in construction in 2018 was 561 MW. In the UK, construction work started on the largest wind farm in the world: the 1,200 MW Hornsea One project.
• The world’s current largest operational wind farm – Walney 3 extension (657 MW) – was fully connected in the UK.
• The largest wind farm in Germany – Borkum Riffgrund II (465 MW) – was fully commissioned.
• The largest wind farm in Belgium – Rentel 309 MW – was fully connected.
Financing highlights
• Investments in new offshore wind amounted to €10.3bn, a 37% increase from 2017.
• Twelve projects reached FID, totalling 4.2 GW of additional capacity.
• The 37% increase in investments generated an 86% increase in capacity financed.
• Refinancing of offshore wind farms hit a record level of €8.5bn, bringing total investments including transmission lines (€0.7bn) to €19.6bn.
• Non-recourse debt for new and operational wind farms raised €16.5bn.
• There were 3.8 GW of project acquisition activity and 2.3 GW of potential projects acquired at the pre-development stage.

Photo: Ørsted

11Offshore Wind in Europe - Key trends and statistics 2018WindEurope
1. Separately, 2.75 MW were boosted into 3.3 MW due to rotor and blade upgrades in 5 turbines. See page 14 for more info.2. WindEurope Market Outlook, September 2017.3. WindEurope Market Outlook, September 2017.
1.1 OVERVIEW
Europe connected 2,649 MW of net offshore wind power capacity in 2018. This is 15.8 % lower than in 2017, which was a record year. It added 2,660 MW of new (gross) ca-pacity. 7 turbines were fully decommissioned at the Ut-grunden I wind farm in Sweden, which was commissioned back in 2000. This accounts for the decommission of 10.5 MW in 20181. Installations were in line with previously forecasted scenarios2.
The UK and Germany connected slightly less capacity than in 2017, with 1,312 MW and 969 MW respectively. Den-mark had new connections for the first time since 2013
(61 MW), and Belgium doubled its annual installations in comparison to 2017 (309 MW). The Netherlands did not grid-connect any offshore wind, but is set to have a record year in 2019 with about 1 GW of new offshore installations3.
Europe’s cumulative offshore wind capacity reached 18,499 MW at the end of 2018. Including sites with partial grid connection, there are now 105 offshore wind farms in 11 European countries and 4,543 grid-connected wind turbines.
OFFSHORE WIND INSTALLATIONS
1.

12 Offshore Wind in Europe - Key trends and statistics 2018WindEurope
Offshore wind installations
FIGURE 1 Annual offshore wind installations by country and cumulative capacity (MW)
Source: WindEurope
UK Germany Belgium Denmark Spain Sweden
Netherlands France Finland Norway Portugal
0
2,500
5,000
7,500
10,000
12,500
15,000
17,500
20,000
0
500
1,000
1,500
2,000
2,500
3,000
3,500
4,000
Cum
ula
tive
Inst
alle
d C
ap
aci
ty (M
W)
Ann
ual I
nsta
lled
Ca
pa
city
(MW
)
20082009
20102011
20122013
20142015
20162017
2018
Cumulative Installed Capacity (MW)
TABLE 1 Overview of grid-connected offshore wind power projects at the end of 2018
COUNTRYNO. OF WIND
FARMS CONNECTED
CUMULATIVE CAPACITY
(MW)
NO. OF TURBINES
CONNECTED
NET CAPACITY CONNECTED
IN 2018
NO. OF TURBINES
CONNECTED IN 2018
TOTAL 105 18,499 4,543 2,649 409
United Kingdom 39 8,183 1,975 1,312 222
Germany 25 6,380 1,305 969 136
Denmark 14 1,329 514 61 42
Belgium 7 1,186 274 309 8
Netherlands 6 1,118 365 0 1
Sweden 4 192 79 -10 -7
Finland 3 71 19 0 0
Ireland 1 25 7 0 0
Spain 2 10 2 5 1
France 2 2 2 2 2
Norway 1 2 1 0 0

-
3
GW
GWGross installations in 2017
Cumulativeinstalled capacity
at the end of 2018
8.2
1.3
6.4
1
1.3
0.06
1.20.3
1.1
0.2
0.003
0.01
0.005
0.002
0.002
0.05
0.07
0.002
18.5 GWTOTAL EUROPE
OF NEW OFFSHOREWIND POWER IN EUROPE
2.6 GW
13Offshore Wind in Europe - Key trends and statistics 2018WindEurope
Source: WindEurope
14 Offshore Wind in Europe - Key trends and statistics 2018WindEurope
Offshore wind installations
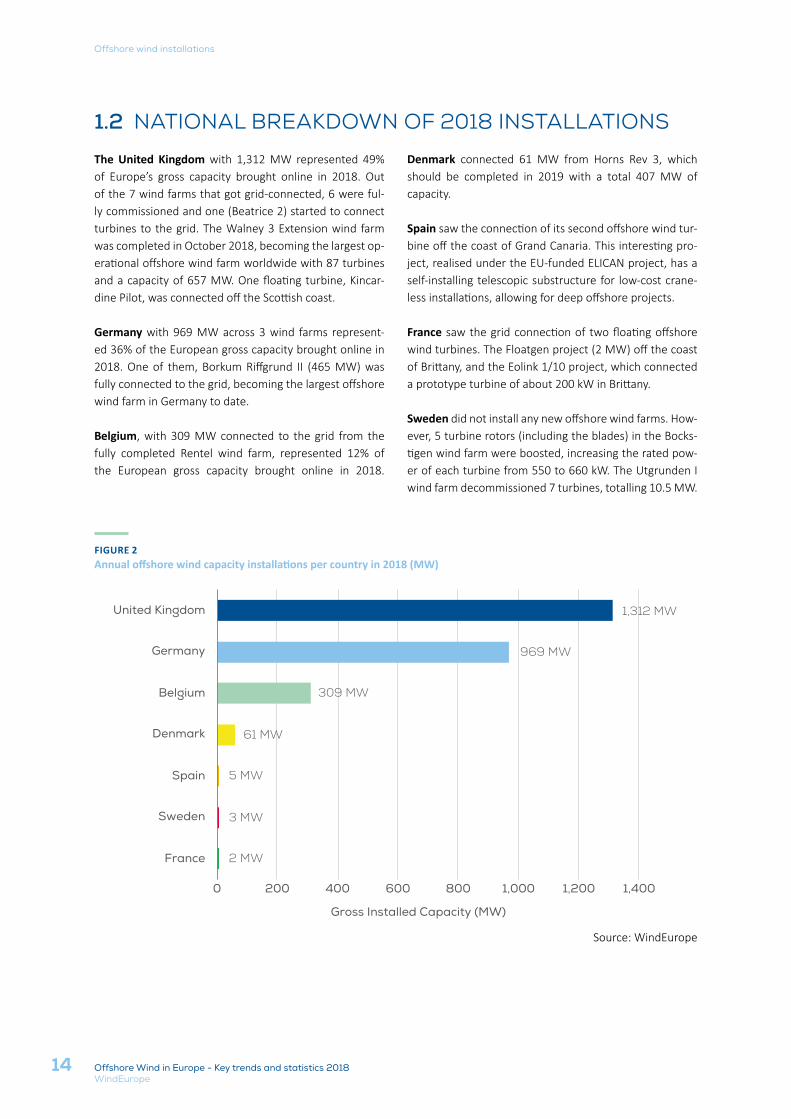
1.2 NATIONAL BREAKDOWN OF 2018 INSTALLATIONS
The United Kingdom with 1,312 MW represented 49% of Europe’s gross capacity brought online in 2018. Out of the 7 wind farms that got grid-connected, 6 were ful-ly commissioned and one (Beatrice 2) started to connect turbines to the grid. The Walney 3 Extension wind farm was completed in October 2018, becoming the largest op-erational offshore wind farm worldwide with 87 turbines and a capacity of 657 MW. One floating turbine, Kincar-dine Pilot, was connected off the Scottish coast.
Germany with 969 MW across 3 wind farms represent-ed 36% of the European gross capacity brought online in 2018. One of them, Borkum Riffgrund II (465 MW) was fully connected to the grid, becoming the largest offshore wind farm in Germany to date.
Belgium, with 309 MW connected to the grid from the fully completed Rentel wind farm, represented 12% of the European gross capacity brought online in 2018.
Denmark connected 61 MW from Horns Rev 3, which should be completed in 2019 with a total 407 MW of capacity.
Spain saw the connection of its second offshore wind tur-bine off the coast of Grand Canaria. This interesting pro-ject, realised under the EU-funded ELICAN project, has a self-installing telescopic substructure for low-cost crane-less installations, allowing for deep offshore projects.
France saw the grid connection of two floating offshore wind turbines. The Floatgen project (2 MW) off the coast of Brittany, and the Eolink 1/10 project, which connected a prototype turbine of about 200 kW in Brittany.
Sweden did not install any new offshore wind farms. How-ever, 5 turbine rotors (including the blades) in the Bocks-tigen wind farm were boosted, increasing the rated pow-er of each turbine from 550 to 660 kW. The Utgrunden I wind farm decommissioned 7 turbines, totalling 10.5 MW.
FIGURE 2 Annual offshore wind capacity installations per country in 2018 (MW)
Source: WindEurope
2 MW
3 MW
5 MW
61 MW
309 MW
969 MW
1,312 MW
0 200 400 600 800 1,000 1,200 1,400
France
Sweden
Spain
Denmark
Belgium
Germany
United Kingdom
Gross Installed Capacity (MW)
15Offshore Wind in Europe - Key trends and statistics 2018WindEurope
Offshore wind installations
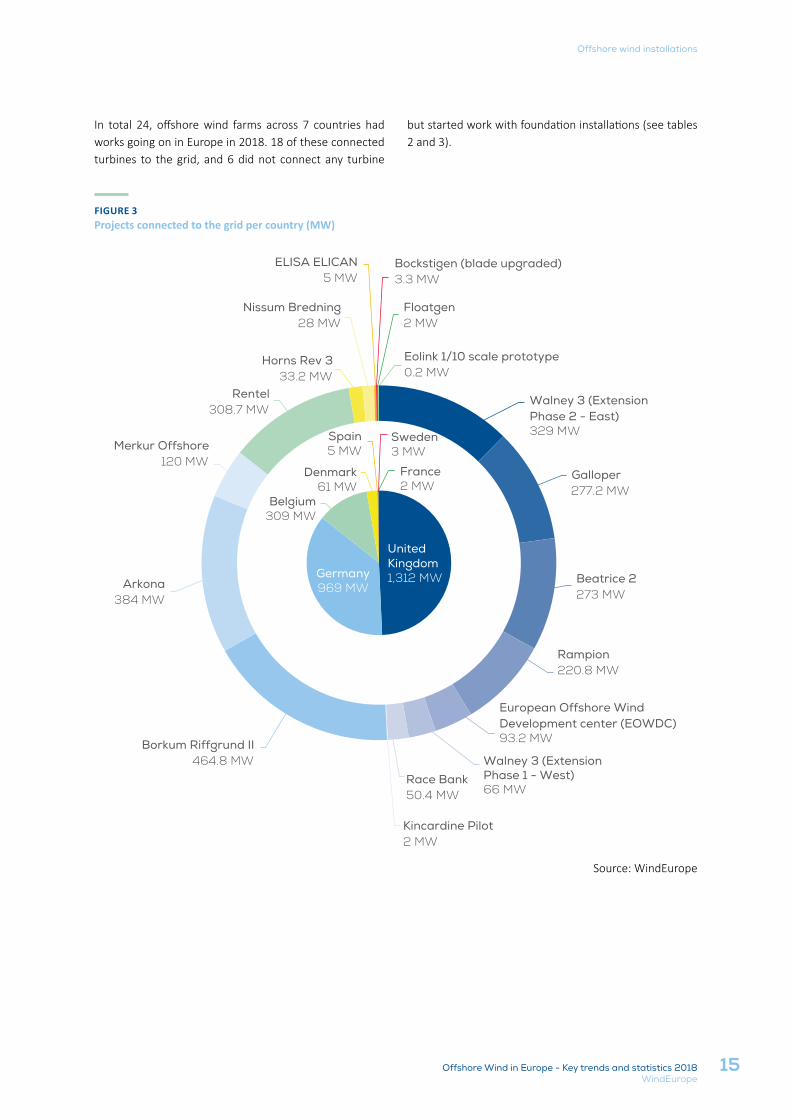
FIGURE 3 Projects connected to the grid per country (MW)
Source: WindEurope
In total 24, offshore wind farms across 7 countries had works going on in Europe in 2018. 18 of these connected turbines to the grid, and 6 did not connect any turbine
but started work with foundation installations (see tables 2 and 3).
Walney 3 (Extension Phase 2 - East) 329 MW
Galloper277.2 MW
Beatrice 2273 MW
Rampion220.8 MW
European Offshore Wind Development center (EOWDC)93.2 MW
Walney 3 (ExtensionPhase 1 - West)66 MW
Race Bank50.4 MW
Kincardine Pilot2 MW
Borkum Riffgrund II464.8 MW
Arkona384 MW
Merkur Offshore120 MW
Rentel308.7 MW
Horns Rev 333.2 MW
Nissum Bredning28 MW
ELISA ELICAN5 MW
Bockstigen (blade upgraded) 3.3 MW
Floatgen2 MW
Eolink 1/10 scale prototype 0.2 MW
Belgium309 MW
Denmark61 MW
Spain5 MW
Sweden3 MW
France2 MW
United Kingdom1,312 MWGermany
969 MW
16 Offshore Wind in Europe - Key trends and statistics 2018WindEurope
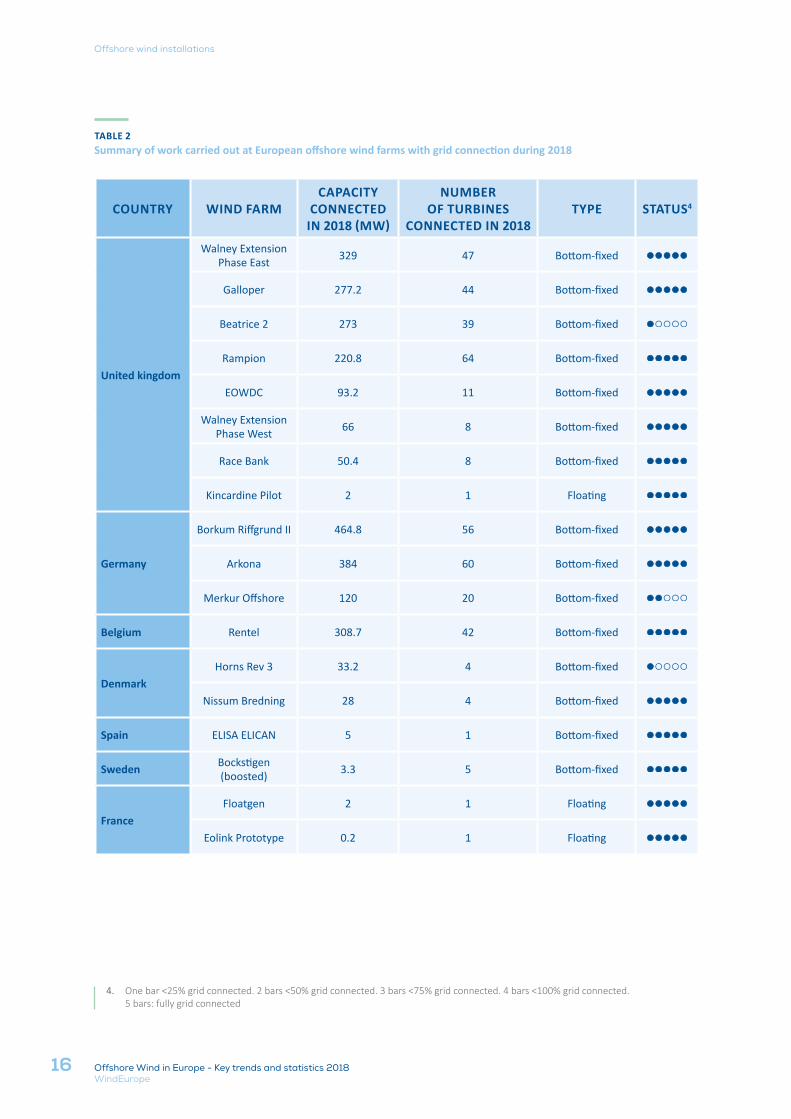
4. One bar <25% grid connected. 2 bars <50% grid connected. 3 bars <75% grid connected. 4 bars <100% grid connected. 5 bars: fully grid connected
TABLE 2Summary of work carried out at European offshore wind farms with grid connection during 2018
COUNTRY WIND FARMCAPACITY
CONNECTED IN 2018 (MW)
NUMBER OF TURBINES
CONNECTED IN 2018TYPE STATUS4
United kingdom
Walney Extension Phase East 329 47 Bottom-fixed
Galloper 277.2 44 Bottom-fixed
Beatrice 2 273 39 Bottom-fixed
Rampion 220.8 64 Bottom-fixed
EOWDC 93.2 11 Bottom-fixed
Walney Extension Phase West 66 8 Bottom-fixed
Race Bank 50.4 8 Bottom-fixed
Kincardine Pilot 2 1 Floating
Germany
Borkum Riffgrund II 464.8 56 Bottom-fixed
Arkona 384 60 Bottom-fixed
Merkur Offshore 120 20 Bottom-fixed
Belgium Rentel 308.7 42 Bottom-fixed
DenmarkHorns Rev 3 33.2 4 Bottom-fixed
Nissum Bredning 28 4 Bottom-fixed
Spain ELISA ELICAN 5 1 Bottom-fixed
Sweden Bockstigen (boosted) 3.3 5 Bottom-fixed
FranceFloatgen 2 1 Floating
Eolink Prototype 0.2 1 Floating
Offshore wind installations

17Offshore Wind in Europe - Key trends and statistics 2018WindEurope
TABLE 3Summary of work carried out at European offshore wind farms without grid connection during 2018
COUNTRY WIND FARMFOUNDATIONS
INSTALLED IN 2018
TOTAL NUMBER OF
FOUNDATIONS
TYPE OF FOUNDATIONS
United KingdomEast Anglia 1 37 102 Jacket
Hornsea One 156 174 Monopile
Germany
Deutsche Bucht 29 31 Monopile
Hohe See 63 71 Monopile
Trianel Windpark Borkum 2 32 32 Monopile
Belgium Norther 44 44 Monopile
The North Sea registered the largest amount of grid con-nections (1,651 MW), representing 62% of the installa-tions. This was followed by the Irish Sea (15%), with the Walney 3 extension Phase 2 - East and Walney 3 exten-sion Phase 1 - West. The Baltic Sea saw 14% of the instal-
lations, driven by connections in the Arkona wind farm. The Atlantic Ocean registered 9% of the new installations, driven by the work in Rampion wind farm.
FIGURE 4 Gross annual installations by sea basin in 2018 (MW)
Source: WindEurope
229 MW
387 MW
395 MW
1,651 MW
0 500 1,000 1,500 2,000
Atlantic Ocean
Baltic Sea
Irish Sea
North Sea
Net Installed Capacity in 2018 (MW)
Offshore wind installations
18 Offshore Wind in Europe - Key trends and statistics 2018WindEurope
FIGURE 5Cumulative Installed capacity (MW) and number of turbines by country
Source: WindEurope
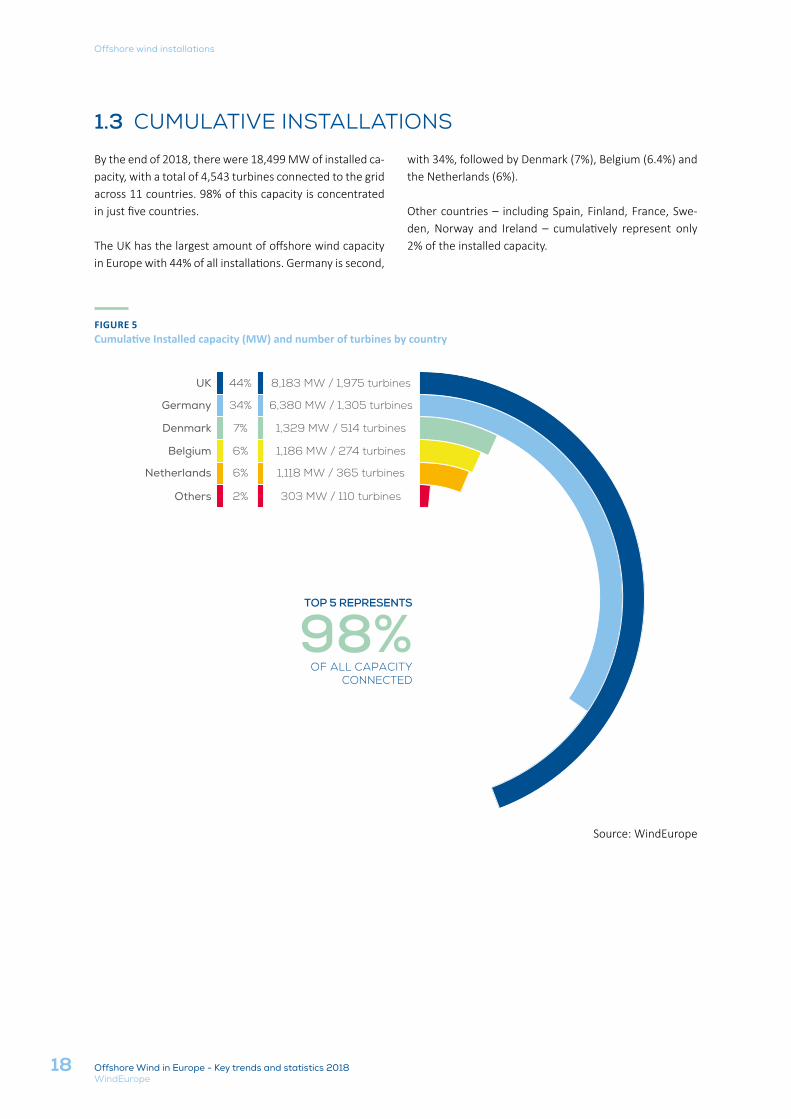
1.3 CUMULATIVE INSTALLATIONS
By the end of 2018, there were 18,499 MW of installed ca-pacity, with a total of 4,543 turbines connected to the grid across 11 countries. 98% of this capacity is concentrated in just five countries.
The UK has the largest amount of offshore wind capacity in Europe with 44% of all installations. Germany is second,
with 34%, followed by Denmark (7%), Belgium (6.4%) and the Netherlands (6%).
Other countries – including Spain, Finland, France, Swe-den, Norway and Ireland – cumulatively represent only 2% of the installed capacity.
TOP 5 REPRESENTS
98%OF ALL CAPACITY
CONNECTED
6,380 MW / 1,305 turbines
1,186 MW / 274 turbines
1,329 MW / 514 turbines
1,118 MW / 365 turbines
UK
Germany
Denmark
Belgium
Netherlands
Others 303 MW / 110 turbines
8,183 MW / 1,975 turbines44%
34%
7%
6%
6%
2%
Offshore wind installations

19Offshore Wind in Europe - Key trends and statistics 2018WindEurope
The North Sea accounts for 70% of all offshore wind capacity in Europe, followed by the Irish Sea with 16%, the Baltic Sea with 12%, and the Atlantic Ocean with 2%.
FIGURE 6Cumulative Installed capacity by sea basin (MW)
Source: WindEurope
413 MW
2,218 MW
2,928 MW
12,938 MW
0 2,000 4,000 6,000 8,000 10,000 12,000 14,000
Atlantic Ocean
Baltic Sea
Irish Sea
North Sea
Net Installed Capacity (MW)
Offshore wind installations
20 Offshore Wind in Europe - Key trends and statistics 2018WindEurope
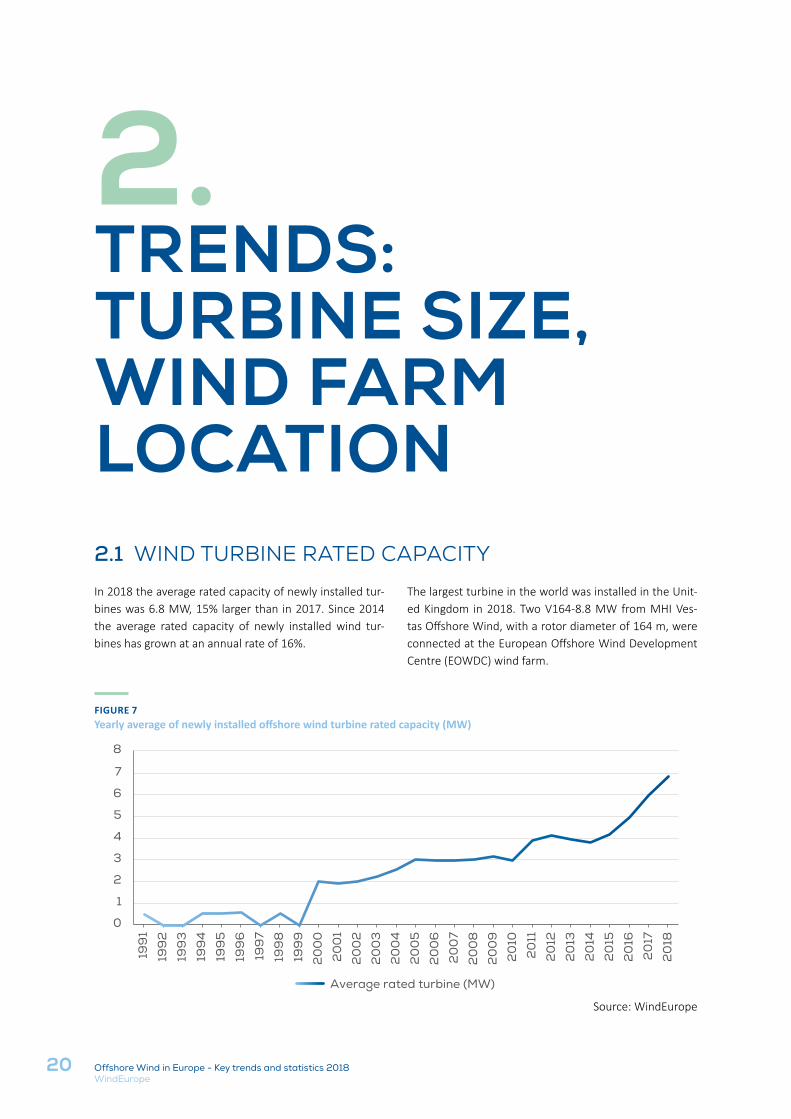
FIGURE 7Yearly average of newly installed offshore wind turbine rated capacity (MW)
Source: WindEurope
2.1 WIND TURBINE RATED CAPACITY
In 2018 the average rated capacity of newly installed tur-bines was 6.8 MW, 15% larger than in 2017. Since 2014 the average rated capacity of newly installed wind tur-bines has grown at an annual rate of 16%.
The largest turbine in the world was installed in the Unit-ed Kingdom in 2018. Two V164-8.8 MW from MHI Ves-tas Offshore Wind, with a rotor diameter of 164 m, were connected at the European Offshore Wind Development Centre (EOWDC) wind farm.
TRENDS: TURBINE SIZE, WIND FARM LOCATION
2.
0
1
2
3
4
5
6
7
8
199
1
199
2
199
3
199
4
199
5
199
6
199
7
199
8
199
9
20
00
20
01
20
02
20
03
20
04
20
05
20
06
20
07
20
08
20
09
20
10
20
11
20
12
20
13
20
14
20
15
20
16
20
17
20
18
Average rated turbine (MW)

21Offshore Wind in Europe - Key trends and statistics 2018WindEurope
Trends: turbine size, wind farm location
FIGURE 8Average size of commercial offshore wind farms in construction and grid-connected in the given year
Source: WindEurope
2.2 WIND FARM SIZE
In the last ten years, the average offshore wind farm has increased in size from 79.6 MW in 2007 to 561 MW in 2018. The 1,200 MW Hornsea One project (174 turbines) is the largest offshore wind farm to reach Final Investment
Decision (FID) to date. Its construction started in 2018, with 156 foundations already installed by the end of the year. So far, no turbines have been installed.
Average wind farm size (MW)
0
100
200
300
400
500
600
199
1
199
2
199
3
199
4
199
5
199
6
199
7
199
8
199
9
20
00
20
01
20
02
20
03
20
04
20
05
20
06
20
07
20
08
20
09
20
10
20
11
20
12
20
13
20
14
20
15
20
16
20
17
20
18
Most of the wind farms in construction are using turbines above 6 MW (the average rated power for the turbines is 6.8 MW, indicated by the red line in figure 9). The only
wind farms using turbines below 6 MW are Rampion in the United Kingdom and a few demonstration projects (mostly floating).
FIGURE 9Average turbine rated capacity and number of turbines of wind farms under construction in 2018
Source: WindEurope
Num
ber
of
turb
ines
per
win
d f
arm
Turbine Rated Capacity (MW)
United Kingdom Germany Belgium Denmark France Spain Sweden
0
100
200
0 1 2 3 4 5 6 7 8 9
Turbine average rated power in 2018
22 Offshore Wind in Europe - Key trends and statistics 2018WindEurope
Trends: turbine size, wind farm location
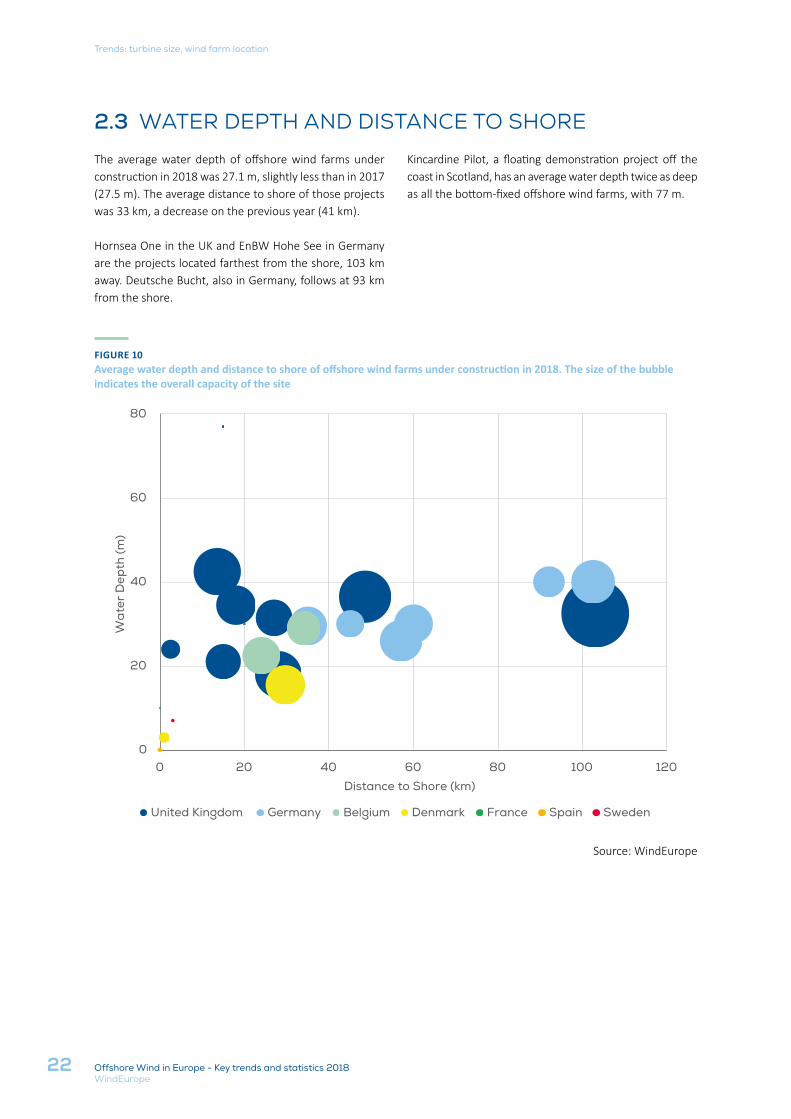
FIGURE 10Average water depth and distance to shore of offshore wind farms under construction in 2018. The size of the bubble indicates the overall capacity of the site
Source: WindEurope
2.3 WATER DEPTH AND DISTANCE TO SHORE
The average water depth of offshore wind farms under construction in 2018 was 27.1 m, slightly less than in 2017 (27.5 m). The average distance to shore of those projects was 33 km, a decrease on the previous year (41 km).
Hornsea One in the UK and EnBW Hohe See in Germany are the projects located farthest from the shore, 103 km away. Deutsche Bucht, also in Germany, follows at 93 km from the shore.
Kincardine Pilot, a floating demonstration project off the coast in Scotland, has an average water depth twice as deep as all the bottom-fixed offshore wind farms, with 77 m.
0
20
40
60
80
0 20 40 60 80 100 120
Wa
ter
Dep
th (m
)
Distance to Shore (km)
United Kingdom Germany Belgium Denmark France Spain Sweden
23Offshore Wind in Europe - Key trends and statistics 2018WindEurope
Trends: turbine size, wind farm location
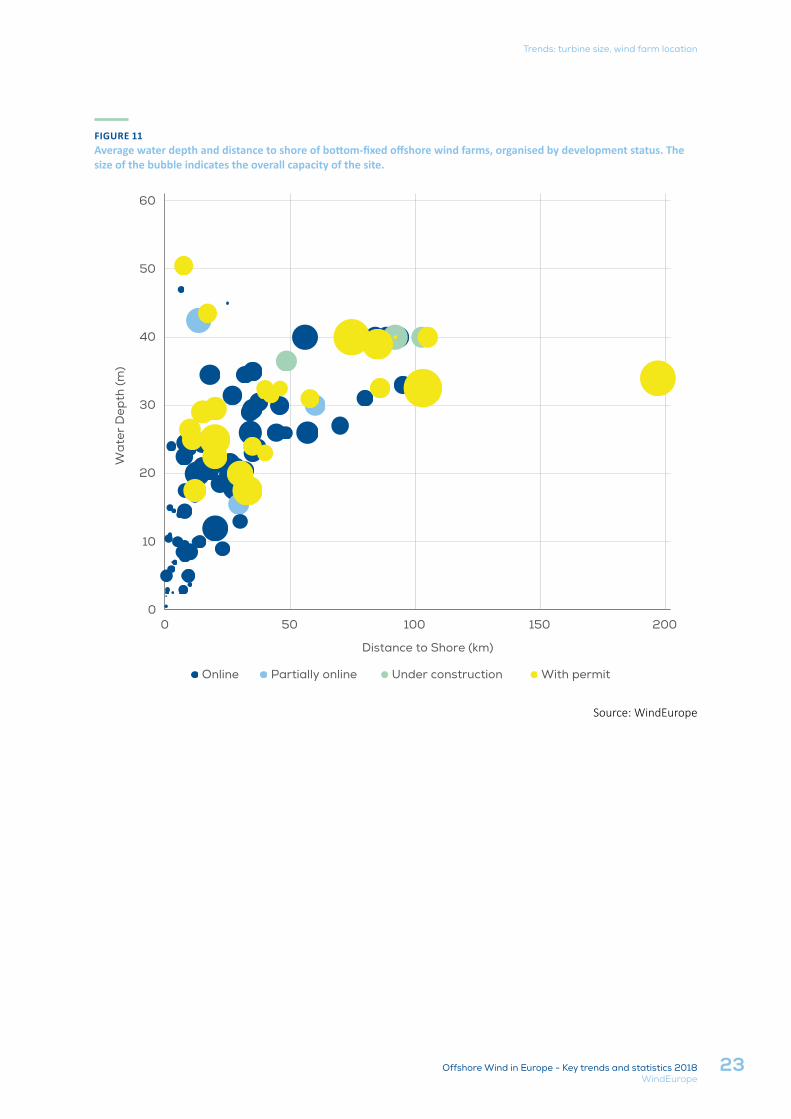
FIGURE 11Average water depth and distance to shore of bottom-fixed offshore wind farms, organised by development status. The size of the bubble indicates the overall capacity of the site.
Source: WindEurope
0
10
20
30
40
50
60
0 50 100 150 200
Wa
ter
Dep
th (m
)
Distance to Shore (km)
Online Partially online Under construction With permit
Photo: GE Renewable Energy

25Offshore Wind in Europe - Key trends and statistics 2018WindEurope
5. Adwen offshore company has been merged with Siemens Gamesa.
3.1 WIND TURBINE MANUFACTURERS
Siemens Gamesa Renewable Energy5 supplied 62.2% of all the new capacity in 2018. MHI Vestas Offshore Wind followed with 33.3%. Other turbine suppliers include GE renewable Energy and Eolink (prototype).
GE Renewable Energy connected its Haliade 150-6 MW turbine for the first time in Europe. In 2018, 20 of these turbines were connected at the Merkur offshore wind farm in Germany (another 44 will be connected in 2019).
INDUSTRY ACTIVITY AND SUPPLY CHAIN
3.
FIGURE 12
Wind turbine manufacturers’ share of the 2018 annual capacity (MW) and number of turbines connected to the grid
Source: WindEurope
Siemens Gamesa62%245 Turbines1,655 MW Connected
MHI Vestas Offshore Wind33%150 Turbines885 MW Connected
GE Renewable Energy5%20 Turbines120 MW Connected
Eolink1 Turbine<1 MW Connected

26 Offshore Wind in Europe - Key trends and statistics 2018WindEurope
Industry activity and supply chain
Siemens Gamesa Renewable Energy has the most off-shore wind turbines in Europe with 69% of the total in-stalled capacity (see figure 13). MHI Vestas Offshore Wind is the second largest turbine supplier with 24%, followed
by Senvion (5%). These 3 manufacturers represent 98% of the total number of turbines connected in Europe at the end of 2018.
FIGURE 13
Wind turbine manufacturers’ share at the end of 2018
Source: WindEurope
TOP 3 REPRESENT
98%OF ALL TURBINES
CONNECTED
Siemes Gamesa
MHI Vestas
Senvion
Bard Engineering
Others
GE Renewable Energy
69%
24%
5%
2%
1%
1%
12.8 GW / 3,115 turbines
3.8 GW / 1,068 turbines
1.2 GW / 206 turbines
0.4 GW / 80 turbines
0.07 GW / 46 turbines
0.15 GW / 28 turbines

27Offshore Wind in Europe - Key trends and statistics 2018WindEurope
Industry activity and supply chain
6. Grid-connected market shares are indicative only. Projects owned or developed by several companies have been split according to their respective shares. Where the shares are not known, they have been split in equal parts between the partners.
3.2 WIND FARM OWNERS
Ørsted connected the largest amount of wind capacity in 2018, representing 17%6, followed by E.ON with 11%. Global Infrastructure Partners with 9%, Equinor with 7%,
and Macquarie Capital with 6% complete the top five owners with new capacity last year. Together they account for 51% of all new capacity in 2018.
FIGURE 14
Owners’ share of 2018 annual installations (MW)
Source: WindEurope
0 50 100 150 200 250 300 350 400 450 500
Others (below 50 MW)
Enbridge
DEME NV
Partners Group
SDIC Power
Siemens
Innogy
CopenhagenInfrastructure Partners
PFA
PKA
SSE
Vattenfall
Macquarie Capital
Equinor
Global InfrastructurePartners
E.ON
Ørsted
Capacity owned in MW
17%
11%
9%
7%
7%
5%
4%
4%
4%
4%
3%
3%
3%
2%
2%
2%
15%
28 Offshore Wind in Europe - Key trends and statistics 2018WindEurope
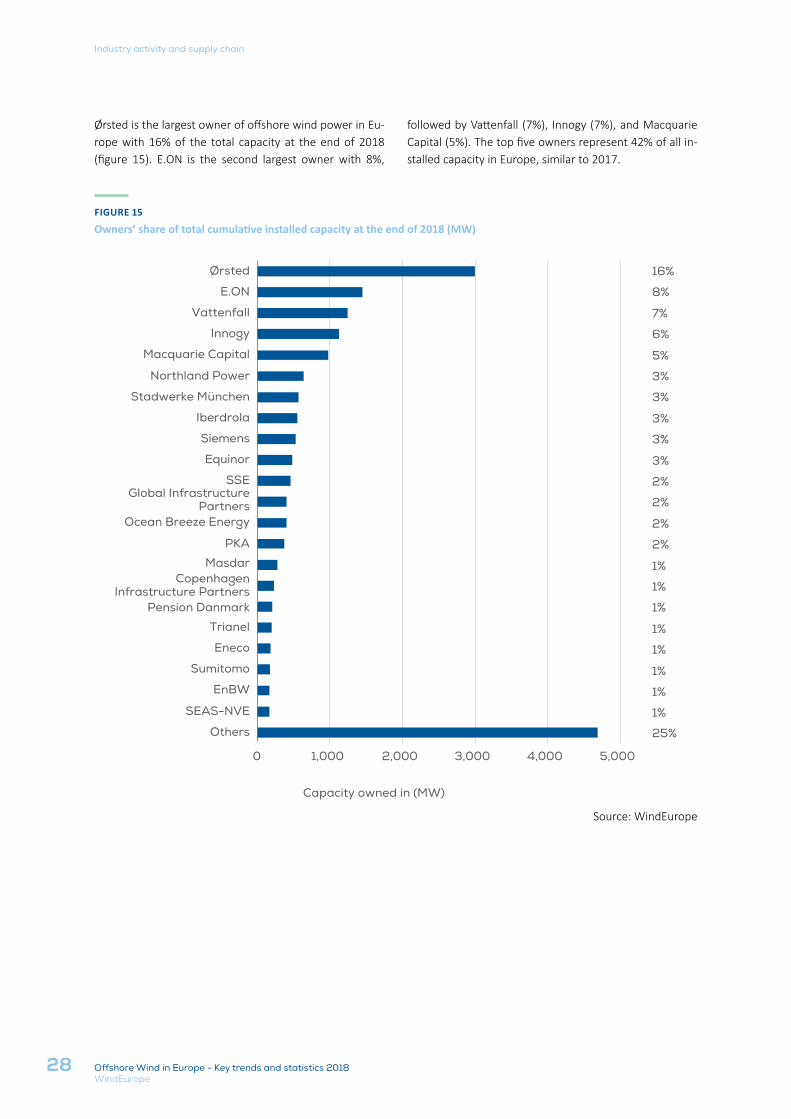
FIGURE 15
Owners’ share of total cumulative installed capacity at the end of 2018 (MW)
Source: WindEurope
0 1,000 2,000 3,000 4,000 5,000
Others
SEAS-NVE
EnBW
Sumitomo
Eneco
Trianel
Pension Danmark
CopenhagenInfrastructure Partners
Masdar
PKA
Ocean Breeze Energy
Global InfrastructurePartners
SSE
Equinor
Siemens
Iberdrola
Stadwerke München
Northland Power
Macquarie Capital
Innogy
Vattenfall
E.ON
Ørsted
Capacity owned in (MW)
16%
8%
7%
6%
5%
3%
3%
3%
3%
3%
2%
2%
2%
2%
1%
1%
1%
1%
1%
1%
1%
1%
25%
Ørsted is the largest owner of offshore wind power in Eu-rope with 16% of the total capacity at the end of 2018 (figure 15). E.ON is the second largest owner with 8%,
followed by Vattenfall (7%), Innogy (7%), and Macquarie Capital (5%). The top five owners represent 42% of all in-stalled capacity in Europe, similar to 2017.
Industry activity and supply chain

29Offshore Wind in Europe - Key trends and statistics 2018WindEurope
7. Shares are calculated according to the actual number of individual foundations installed in 2018. Where the project developer con-tracted more than one company to manufacture the foundations, and where the respective shares (in case of consortia/joint venture) were not specified, foundations installed were split in equal parts between the partners.
3.3 SUBSTRUCTURES AND FOUNDATIONS
Monopiles remained the most popular substructure type in 2018, representing 74.5% of all installed foundations, a decrease compared to 2017 (86%). Jackets were the sec-ond most used substructure, with 119 jackets installed in 2018, representing 24.5% of all foundations installed.
One floating barge was commissioned for the Floatgen project and 2 floating semi-sub structures were commis-
sioned respectively for the Eolink Prototype and the Kin-cardine project.
On the supplier side, EEW installed 49% of all foundations in 2018, followed by Sif (29%) and Steelwind Nordenham (7%).
FIGURE 16Foundations installed in 2018 by manufacturing company7
Source: WindEurope
EEW
Sif
Steelwind Nordenham
Lamprell
ST3 Offshore
Navantia-Windar Consortium
Smulders
Esteyco
Bouygues Travaux Publics
ASM Industries
Chouteaux Metalform
0 50 100 150 200 250
Monopile Jacket Semi-Sub Gravity Base Barge
Industry activity and supply chain
30 Offshore Wind in Europe - Key trends and statistics 2018WindEurope
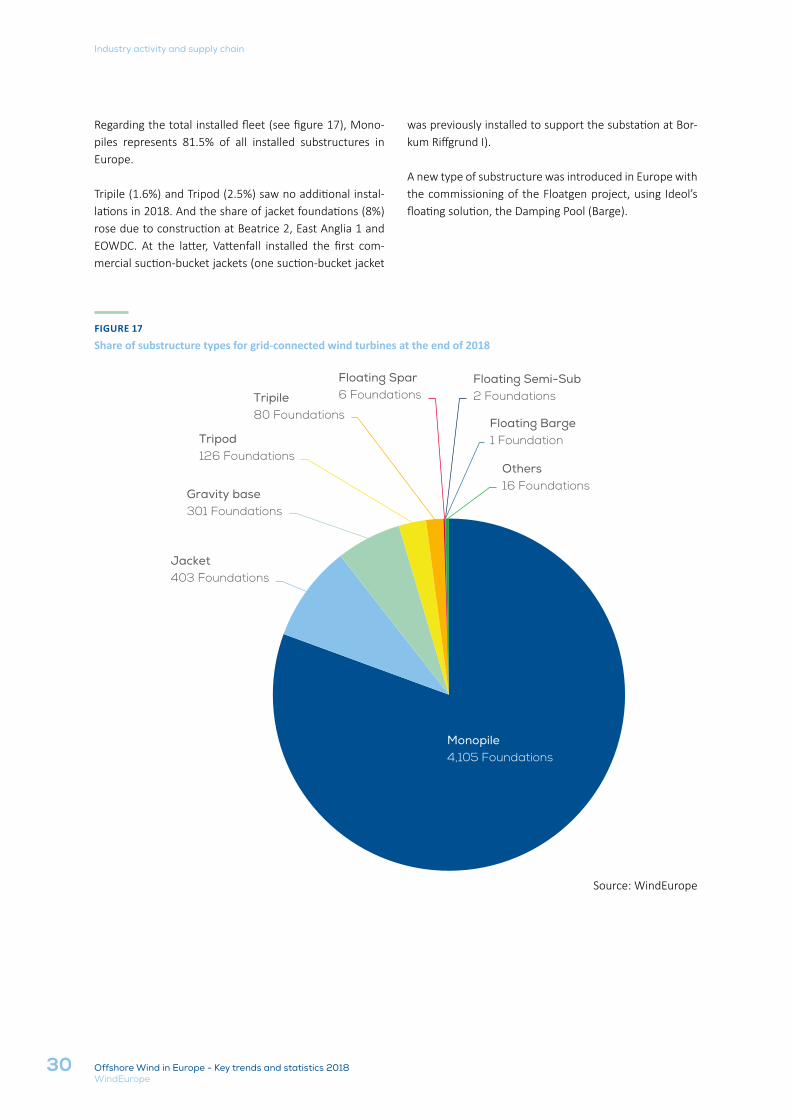
Regarding the total installed fleet (see figure 17), Mono-piles represents 81.5% of all installed substructures in Europe.
Tripile (1.6%) and Tripod (2.5%) saw no additional instal-lations in 2018. And the share of jacket foundations (8%) rose due to construction at Beatrice 2, East Anglia 1 and EOWDC. At the latter, Vattenfall installed the first com-mercial suction-bucket jackets (one suction-bucket jacket
was previously installed to support the substation at Bor-kum Riffgrund I).
A new type of substructure was introduced in Europe with the commissioning of the Floatgen project, using Ideol’s floating solution, the Damping Pool (Barge).
FIGURE 17
Share of substructure types for grid-connected wind turbines at the end of 2018
Source: WindEurope
Monopile4,105 Foundations
Jacket403 Foundations
Gravity base301 Foundations
Tripod126 Foundations
Tripile80 Foundations
Floating Spar 6 Foundations
Floating Semi-Sub 2 Foundations
Floating Barge1 Foundation
Others16 Foundations
Industry activity and supply chain

31Offshore Wind in Europe - Key trends and statistics 2018WindEurope
FIGURE 19Share of energised export cable by supplier in 201810
Source: WindEurope
In terms of export cables9 in 2018 (figure 19), 8 export cables manufactured by NKT Group were energised, rep-resenting 53.3% of the annual market.
Prysmian, Ls Cable & System, and JDR Cable Systems each had a 13.3% share, and Nexans represented the remain-ing 6.7%.
8. Shares are calculated taking into account the number of grid-connected turbines in each wind farm during 2018.9. In Germany, the export cable is the cable connecting the offshore HVDC substation to the land. In other countries the export cable is
understood as the cable connecting the wind farm to land.10. Shares are calculated by taking into account the number of export cables in fully completed new wind farms.
FIGURE 18Share of energised intra-array cables by supplier in 2018
Source: WindEurope
42% of new intra-array cables8 energised in 2018 were from Nexans. JDR Cable Systems (32.1%) and Prysmian (16.1%) were the other suppliers with energised intra-ar-ray cables.
With the commissioning of the Blyth offshore wind farm last year, Nexans has now supplied 2 new wind farms with its new 66 kV cable technology.
3.4 CABLES
Nexans175 Cables
JDR Cable Systems166 Cables
PRYSMIAN Powerlink67 cables
NKT Group8 cables
PRYSMIAN Powerlink2 cables
Ls Cable & System2 cables
JDR Cable Systems2 cables
Nexans1 cable
Industry activity and supply chain
32
Chapter name
Offshore Wind in Europe - Key trends and statistics 2018WindEurope
Photo: Ørsted

33Offshore Wind in Europe - Key trends and statistics 2018WindEurope
4.
4.1 FINANCING ACTIVITY IN 2018
New offshore wind investments in Europe increased to €10.3bn, up 37% from 2017. After the drop in Final Invest-ment Decisions (FID) in 2017 as the market transitioned to auctions, investments in offshore wind recovered to the
third highest level on record. Project costs in 2018 were lower than in the previous three years, allowing 4.2 GW of additional capacity to be financed. This is the second highest amount after a record year in 2016.
FIGURE 20New offshore wind investments and capacity financed: 2010 – 2018 (€bn)
Source: WindEurope
8.4
6.15.0
7.28.8
13.1
18.2
7.5
10.3
0
2
4
6
8
10
12
14
16
18
20
0
2
4
6
8
10
12
14
16
18
20
2010 2011 2012 2013 2014 2015 2016 2017 2018
GW€b
n
Total investments (€bn) New capacity financed (GW)
INVESTMENTS

34 Offshore Wind in Europe - Key trends and statistics 2018WindEurope
Investments
TABLE 4Investment in European offshore wind farms in 2018
TOTAL INVESTMENTS (€BN)
NEW CAPACITY FINANCED (MW)
NUMBER OF PROJECTS
United Kingdom 5.4 1,858 3
Netherlands 1.4 732 1
Denmark 1.1 605 1
Belgium 1.8 706 2
Germany 0.4 258 2
Italy 0.1 30 1
Portugal 0.1 25 1
Norway 0.0 4 1
Total 10.3 4,217 12
Since 2010 the UK has attracted 48% of new investments, worth €40bn, making it the biggest offshore wind market over the last nine years. Germany follows with 34% or €28bn invested over the same period.
12 projects reached Final Investment Decision (FID) in 2018, 95% of which were concentrated in four countries: the UK, Belgium, Denmark and the Netherlands. The ma-jority of the new capacity financed – a total of 52% – was
in the UK, including Triton Knoll and Moray East, totalling 1.8 GW of capacity between them. Other significant pro-jects were Kriegers Flak (606 MW) in Denmark and Seam-ade (487 MW) in Belgium.

35Offshore Wind in Europe - Key trends and statistics 2018WindEurope
Investments
FIGURE 22Investments in the offshore wind sector in 2018 (€bn)
Source: WindEurope
FIGURE 21Offshore wind investments by country since 2010
Source: WindEurope
82%OF OFFSHORE WIND INVESTMENTS SINCE
2010 HAVE BEEN IN THE UK AND GERMANY
18 % 34 % 48 % UK
GermanyOther countries
€7.5bn
€4.6bn
€0bn
€10.3bn
€8.5bn
€0.7bn
Construction of newoffshore wind projects
Refinancing offshore wind projects
2017
2018
Investments in transmission lines:construction and refinancing
In addition to the investments in new wind farms, 2018 also saw €8.5bn in refinancing transactions, an 85% in-crease over 2017. With the addition of new investments
in transmission assets of €0.7bn, offshore wind generated a total financing activity of €19.6bn.
36 Offshore Wind in Europe - Key trends and statistics 2018WindEurope
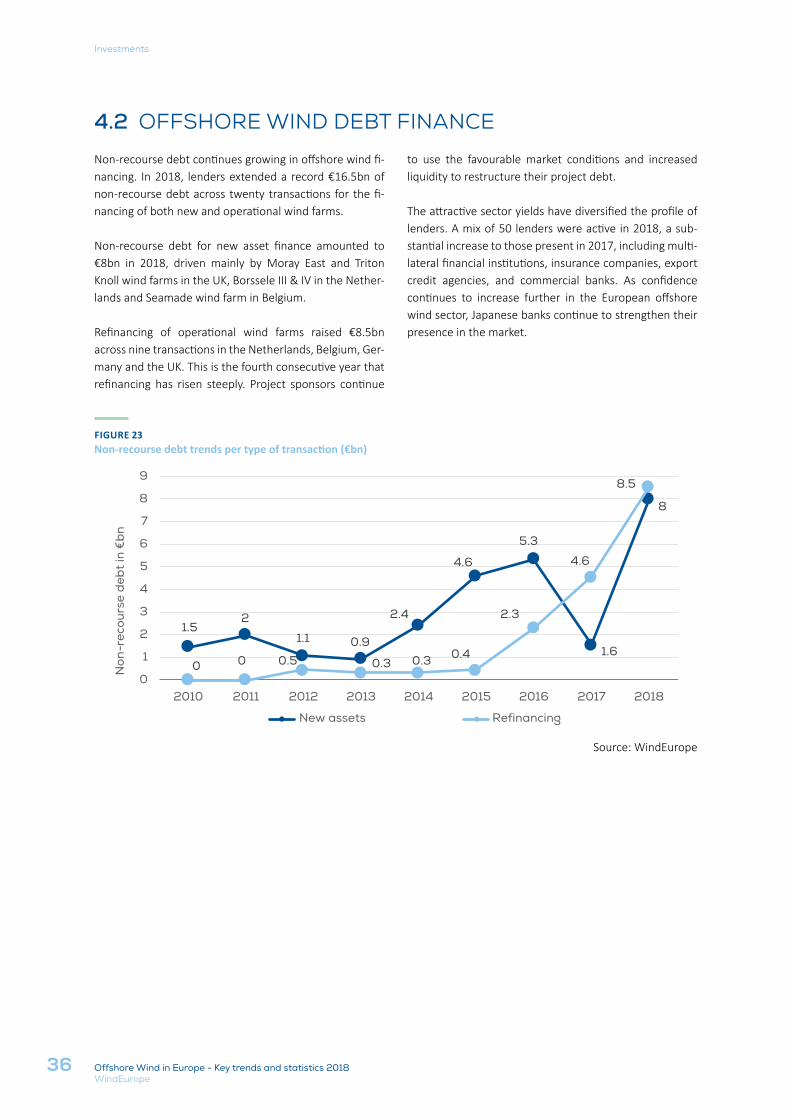
FIGURE 23Non-recourse debt trends per type of transaction (€bn)
Source: WindEurope
4.2 OFFSHORE WIND DEBT FINANCE
Non-recourse debt continues growing in offshore wind fi-nancing. In 2018, lenders extended a record €16.5bn of non-recourse debt across twenty transactions for the fi-nancing of both new and operational wind farms.
Non-recourse debt for new asset finance amounted to €8bn in 2018, driven mainly by Moray East and Triton Knoll wind farms in the UK, Borssele III & IV in the Nether-lands and Seamade wind farm in Belgium.
Refinancing of operational wind farms raised €8.5bn across nine transactions in the Netherlands, Belgium, Ger-many and the UK. This is the fourth consecutive year that refinancing has risen steeply. Project sponsors continue
to use the favourable market conditions and increased liquidity to restructure their project debt.
The attractive sector yields have diversified the profile of lenders. A mix of 50 lenders were active in 2018, a sub-stantial increase to those present in 2017, including multi-lateral financial institutions, insurance companies, export credit agencies, and commercial banks. As confidence continues to increase further in the European offshore wind sector, Japanese banks continue to strengthen their presence in the market.
1.52
1.1 0.9
2.4
4.6
5.3
1.6
8
0 0 0.5 0.3 0.3 0.4
2.3
4.6
8.5
0
1
2
3
4
5
6
7
8
9
2010 2011 2012 2013 2014 2015 2016 2017 2018
Non
-rec
ours
e d
ebt
in €
bn
New assets Refinancing
Investments

37Offshore Wind in Europe - Key trends and statistics 2018WindEurope
11. Excluding pre-development phase of projects.
4.3 ACQUISITION ACTIVITY
Project acquisition activity11 increased 30% compared to 2017, totalling 3.8 GW. The equity mix continues to be approx-imately one third coming from financial investors, and two thirds from power producers.
FIGURE 24Project acquisition activity in 2018 by type of investor
Source: WindEurope
Financial services1,255 MW
33%
Power producers2,537 MW 67%
Infrastructurefunds647 MW 17%
Assetmanagers
173 MW 5%
Diversifiedfinancial services435 MW 11%
3.8 GWACQUISITION ACTIVITY
The majority of transactions happened at the pre-con-struction stage, the most critical phase for a project’s fundraising, with a record of 2.7 GW acquired. Mean-while, 2018 bucked the trend of previous years, where
transactions at the construction and operation phase had increased significantly. There were 630 MW acquired at the construction phase and 425 MW at the operational phase, a 2% increase and a 4% decrease, respectively.
Investments

38 Offshore Wind in Europe - Key trends and statistics 2018WindEurope
Investments
FIGURE 25Acquisition activity per project stage 2015-2018
Source: WindEurope
In addition to those listed above, acquisitions in the pre-development stage amounted to the equivalent of 2.3 GW of potential projects.
Pre-construction Construction In operation
2015 2016 2017 2018
0
500
1,000
1,500
2,000
2,500
3,000

windeurope.org
Rue Belliard 40, 1040 Brussels, Belgium T +32 2 213 1811 · F +32 2 213 1890
WindEurope is the voice of the wind industry, active-ly promoting wind power in Europe and worldwide. It has over 400 members with headquarters in more than 35 countries, including the leading wind turbine manufacturers, component suppliers, research insti-tutes, national wind energy associations, developers, contractors, electricity providers, financial institutions, insurance companies and consultants. This combined strength makes WindEurope Europe’s largest and most powerful wind energy network.
53520-1903-1004www.artoosgroup.eu
PRINTED BY ARTOOSGROUP
53520-1903-1004www.artoosgroup.eu
PRINTED BY ARTOOSGROUP
Related Documents