FILED STATE OF INDIANA APRIL 20, 2017 INDIANA UTILITY REGULATORY COMMISSION INDIANA UTILITYREGULATORY COMMISSION JOINT PETITION OF OHIO VALLEY GAS ) CORPORATION AND omo v ALLEY GAS, INC. FOR ) (1) AUTHORITY TO INCREASE THEIR RATES AND ) CHARGES FOR GAS UTILITY SERVICE; (2) ) APPROVAL OF NEW SCHEDULES OF RATES AND ) CHARGES; AND (3) APPROVAL OF CHANGES TO ) THEIR GENERAL RULES AND REGULATIONS ) APPLICABLE TO GAS UTILITY SERVICE ) CAUSE NO. 44891 INDIANA OFFICE OF UTILITY CONSUMER COUNSELOR PUBLIC'S EXHIBIT NO. 4 TESTIMONY OF BRADLEY E. LORTON APRIL 20, 2017 IURC 't I PUBLIC'S 7 Ep_HIBIT NO. 0 DATE REPORTER OFFICIAL EXHIBITS Respectfully submitted, Attorney No. 27839-49 Deputy Consumer Counselor

Welcome message from author
This document is posted to help you gain knowledge. Please leave a comment to let me know what you think about it! Share it to your friends and learn new things together.
Transcript
FILED
STATE OF INDIANA
APRIL 20, 2017
INDIANA UTILITY
REGULATORY COMMISSION
INDIANA UTILITYREGULATORY COMMISSION
JOINT PETITION OF OHIO VALLEY GAS ) CORPORATION AND omo v ALLEY GAS, INC. FOR ) (1) AUTHORITY TO INCREASE THEIR RATES AND ) CHARGES FOR GAS UTILITY SERVICE; (2) ) APPROVAL OF NEW SCHEDULES OF RATES AND ) CHARGES; AND (3) APPROVAL OF CHANGES TO ) THEIR GENERAL RULES AND REGULATIONS ) APPLICABLE TO GAS UTILITY SERVICE )
CAUSE NO. 44891
INDIANA OFFICE OF UTILITY CONSUMER COUNSELOR
PUBLIC'S EXHIBIT NO. 4
TESTIMONY OF BRADLEY E. LORTON
APRIL 20, 2017
IURC 't I PUBLIC'S 7
Ep_HIBIT NO. 0 ~-,,,,,--:>---hue DATE REPORTER
OFFICIAL EXHIBITS
Respectfully submitted,
Attorney No. 27839-49 Deputy Consumer Counselor
1 Q: 2 A:
3
4 Q: 5 A:
6
7
8
9 Q: 10 A:
11
12
13
14
15
16
TESTIMONY OF OUCC WITNESS BRADLEY E. LORTON, CRRA
CAUSE NO. 44891
Public's Exhibit No. 4 Cause No. 44891
Page 1 of39
omo v ALLEY GAS CORPORATION AND OHIO v ALLEY GAS, INC.
I. INTRODUCTION
Please state your name and business address.
My name is Bradley E. Lorton, and my business address is 115 W. Washington
Street, Suite 1500 South, Indianapolis, Indiana, 46204.
By whom are you currently employed and in what capacity?
I am a Utility Analyst in the Natural Gas Division of the Indiana Office of Utility
Consumer Counselor ("OUCC"). For a summary of my education and
professional experience, and general preparation for this case, please see
Appendix BEL-1 attached to my testimony.
What is the purpose of your testimony?
I testify on the cost of common equity capital, sometimes referred to as the
authorized return on equity ("ROE"). Ohio Valley Gas Corporation and Ohio
Valley Gas, Inc., Qointly "OVG" or "Petitioner") have recommended an 11.1 %
cost of equity. Based on the results of the Discounted Cash Flow ("DCF")
method, Capital Asset Pricing Model ("CAPM"), and macroeconomic analysis, I
conclude that a cost of equity of 9.0% would be a reasonable and appropriate
ROEforOVG.

1 Q:
2 A:
3
4 Q:
5 A:
6
7 Q:
8 A:
9 Q:
10 A:
11 Q:
12 A:
13
14
15
16
17
18
19
20
21
22
Public's Exhibit No. 4 Cause No. 44891
Page 2 of39
II. PETITIONER'S PROPOSED COST OF EQUITY IS TOO IDGH
What is Petitioner's current authorized ROE?
Petitioner's current ROE of 10.1 % was approved by the Commission's Order in
Cause No. 44147 on December 5, 2012.
What is Petitioner's proposed ROE?
Petitioner's witness Mr. Adrien M. McKenzie recommends a return on equity of
11.1%.
Do you agree with Mr. McKenzie's recommendation?
No.
What level of ROE do you recommend?
I recommend an ROE of 9.0%.
Why do you recommend a lower authorized ROE at this time?
Neither my DCF nor my CAPM analyses yield a return as high as OVG's current
10 .1 %, let alone Mr. McKenzie's proposed 11.1 % cost of equity. The current
economic condition, both nationally and in the State of Indiana, is best described
as a maturing recovery. Data on bond yields, dividend yields, inflation and
economic growth do not support projections of double-digit rates of return.
Moreover, regulated public utilities tend to be less risky than the market as a
whole.
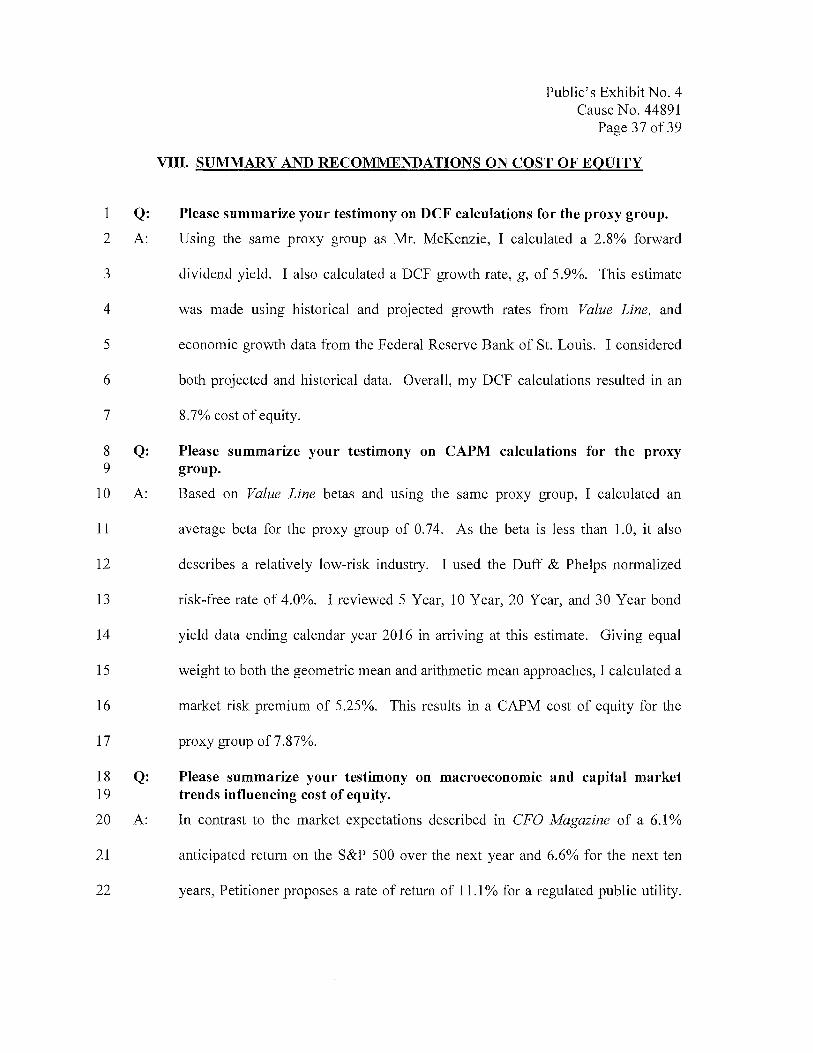
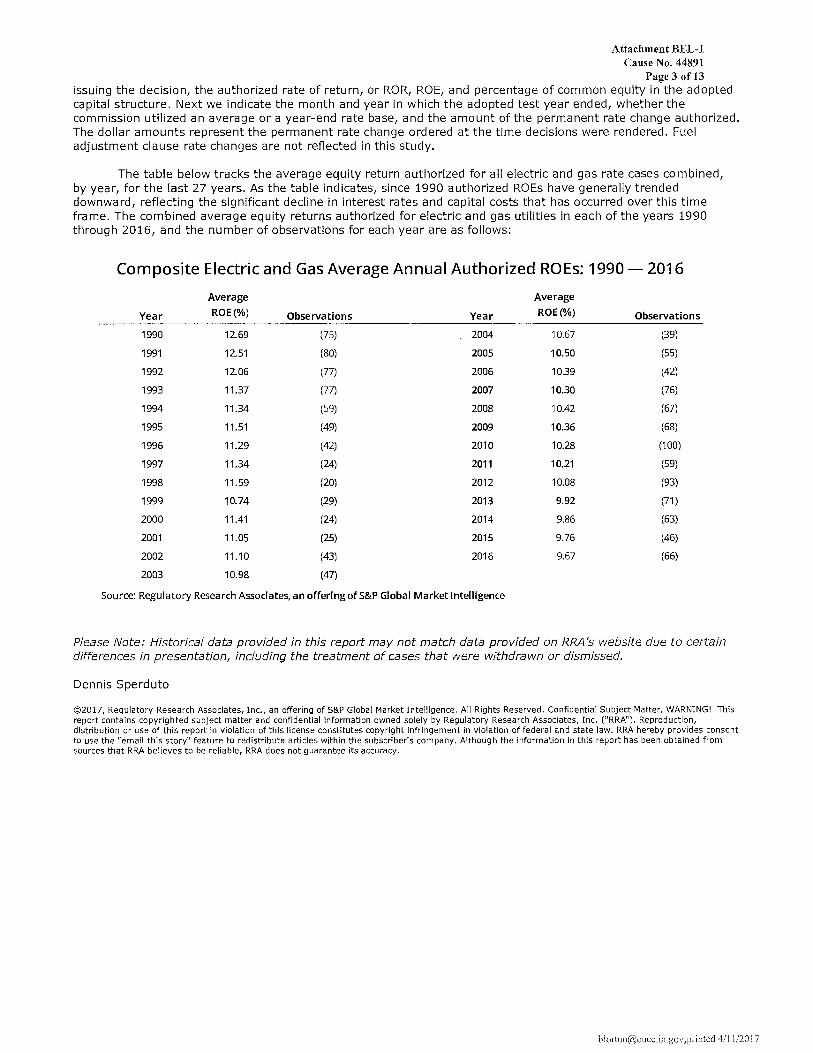
Lower ROEs have become more common, and less threatening to public
utilities, over the past decades. Graph 1 clearly illustrates the long term
downward trend of ROE. Each bar represents the average of authorized ROE
from each calendar year between 1990 and 2016, as published by Regulatory
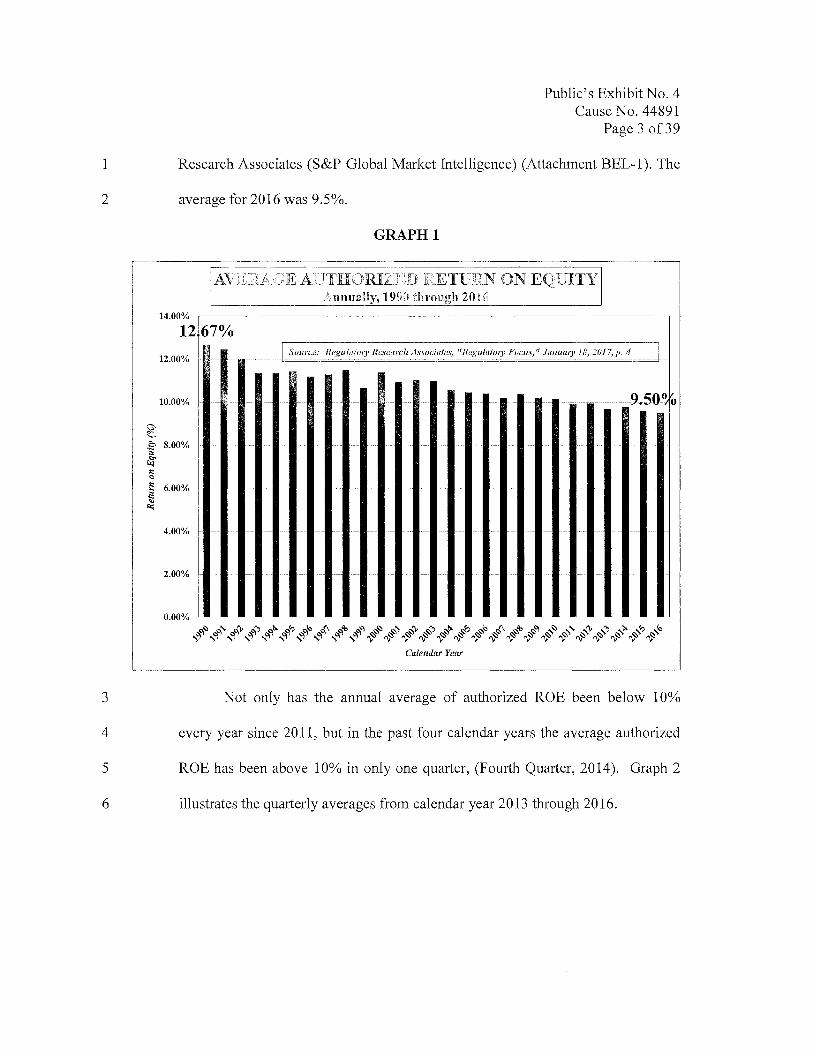
1
2
3
4
5
6
Public's Exhibit No. 4 Cause No. 44891
Page 3of39
Research Associates (S&P Global Market Intelligence) (Attachment BEL-1 ). The
average for 2016 was 9.5%.
GRAPHl
AVERAGE AUTHORIZED :RETURN ON .EQUITY .. Annually,1990through2016 · .......... •
1267% .. : . .. .·• ·· ... ·: :
.. -.. : : . •···. : :
:
.·: ;
10.!)0% .. r-.-___ _.....,,,.!--m ""llP•-·';m--c.,_...., •• '"r.t-la-J-·~~-----:ctl&:ll....:.J-~'9---ci.';;:c'""'=~ ·--,-,-c,~··,,-•--9.. .. ~··~ l:'A•-;~···~·.~ .•·: ·' .
... · : · .. ..
. ·· ·. . ·. · .
: : ·-
.··
: .. .
••••••
. -· ·, . ,,.....:..~
!' :
·- :
· . ..... . -.
·---------~~1-'dll+ll--~---·.··.---··-·,..--~-..... ·~·~-··· - .. -·
: .. · . .: ;
. : . ·• ... I• :
!·· -
.• .-,.:·
. '· _: . ...
I •.· .
. .. 2.00% .----r-1-·--------·~---- -.--.1-1~:.:-.-..,-•f-llt-1~m-I-"9"+-m--.r--•~la-JR-'I-..._---_, . _
.· --
0.00% .. - -· : ·:··: ···-····--·······-··· - .... ~----"-···-·····-··:·-·--· ---·-·-·-:
~~~~~~~~~~~~~~~~~~~~~~~~~~~ ~~~~~~~~~~~~~~~~~~~~~~~~~~~
Calendar Year
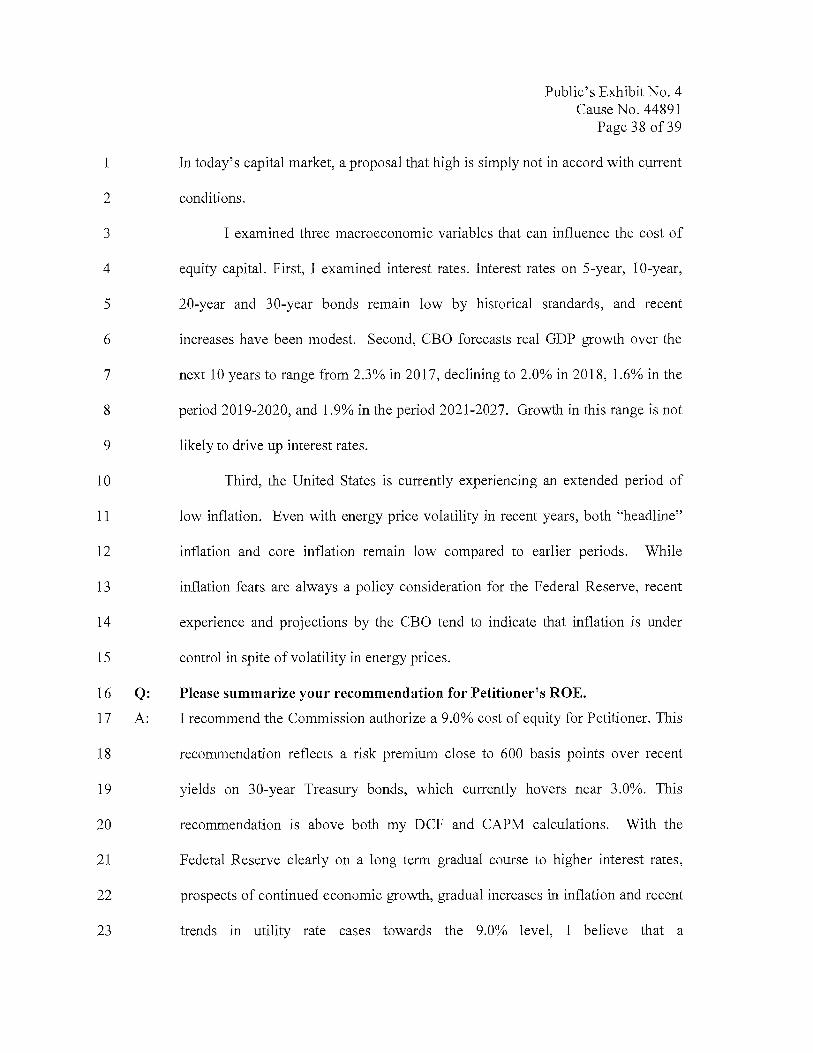
Not only has the annual average of authorized ROE been below 10%
every year since 2011, but in the past four calendar years the average authorized
ROE has been above 10% in only one quarter, (Fourth Quarter, 2014). Graph 2
illustrates the quarterly averages from calendar year 2013 through 2016.
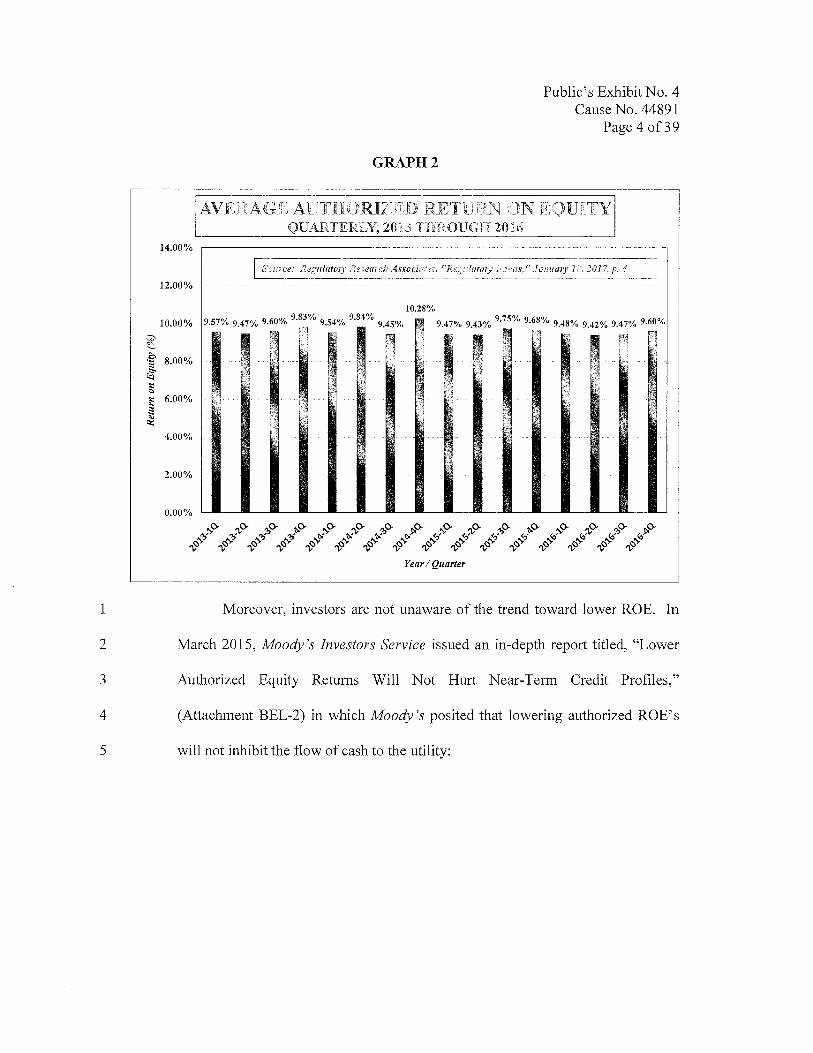
1
2
3
4
5
GRAPH2
Public's Exhibit No. 4 Cause No. 44891
Page 4of39
AVERAGE AUTIIORIZED RETURN ON EQUITY . QUARTERLY, 2013 THROUGH 2016
So.urce: JUgulatory Research.Associates, "Regulatory Focus," JanualJ'.18, 2017, p. 4
1-0.28% 10.00% 9:$7%-.9,'1'1%·'9,;V.0$.2~~~.9 • .WA.2::~~!-~:45% ~. ·~-9:~% !1'43%1:!~/0.c.~M.~~:.g;Wb;9;4l%.<J;4'7,o/.,..9~6:0%
Moreover, investors are not unaware of the trend toward lower ROE. In
March 2015, Moody's Investors Service issued an in-depth report titled, "Lower
Authorized Equity Returns Will Not Hurt Near-Term Credit Profiles,"
(Attachment BEL-2) in which Moody's posited that lowering authorized ROE's
will not inhibit the flow of cash to the utility:
1 2 3 4 5 6 7 8 9
10 11 12 13 14 15
16 17 18
19
20
21 22 23 24 25 26
27
28
29
30
31 Q: 32 33
34 A:
35
Public's Exhibit No. 4 Cause No. 44891
Page 5of39
The credit profiles of US regulated utilities will remain intact over the next few years despite our expectation that regulators will continue to trim the sector's profitability by lowering its authorized returns on equity (ROE). Persistently low interest rates and a comprehensive suite of cost recovery mechanisms ensure a low business risk profile for utilities, prompting regulators to scrutinize their profitability, which is defined as the ratio of net income to book equity. We view cash flow measures as a more important rating driver than authorized ROEs, and we note that regulators can lower authorized ROEs without hurting cash flow, for instance by targeting depreciation, or through special rate structures. Regulators can also adjust a utility's equity capitalization in its rate base. All else being equal, we think most utilities would prefer a thicker equity base and a lower authorized ROE over a small equity layer and a high authorized ROE.
(Moody's Investors Service, "Lower Authorized Equity Returns Will Not Hurt Near-Term Credit Profiles," Sector In-Depth, March 10, 2015, p. 1.) (Emphasis added.)
Moody's goes on to point out that local distribution companies' financial
performance has remained stable, even with declining authorized RO Es:
Utilities' actual financial performance remains stable. Earned ROEs, which typically lag authorized ROEs, have not fallen as much as authorized returns in recent years. Since 2007, vertically integrated utilities, transmission and distribution only utilities, and natural gas local distribution companies have maintained steady earned RO Es in the 9% - 10% range.
(Id.) (Emphasis added.)
With my DCF and CAPM results for OVG both below 9%, and with OVG
carrying no long term debt, I recommend 9.0% as a reasonable cost of common
equity in OVG's capital structure.
Do you agree with Mr. McKenzie's observation that if ROE is too low, "investors will become unwilling to supply capital to the utility on reasonable terms"?
Yes. However, I do not believe that my recommendation would have that result.
As I have noted, the long term trend, nationally, has been toward lower ROEs,
1
2
3
4
5
6
7 Q:
8 A:
9
10
Public's Exhibit No. 4 Cause No. 44891
Page 6 of39
and specifically ROEs below 10%. OVG's lack of debt financing in its capital
structure pre-empts any fmancial risk to the company. As I elaborate in Section
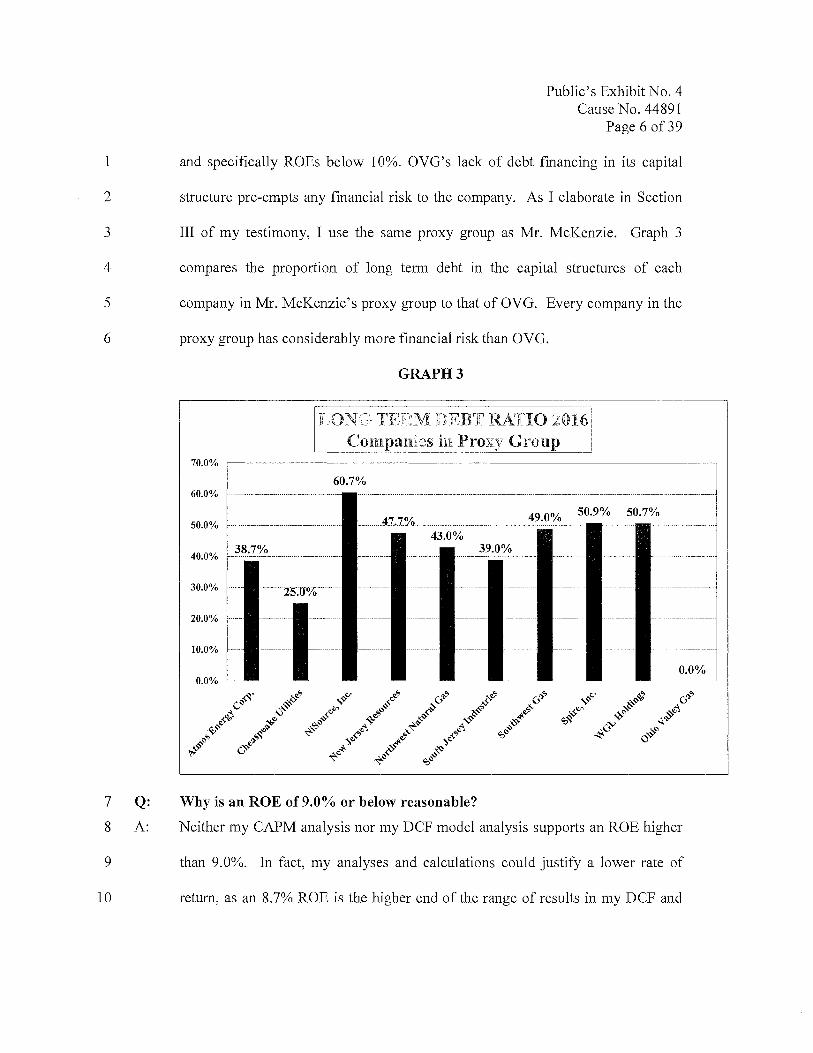
III of my testimony, I use the same proxy group as Mr. McKenzie. Graph 3
compares the proportion of long term debt in the capital structures of each
company in Mr. McKenzie's proxy group to that of OVG. Every company in the
proxy group has considerably more financial risk than OVG.
GRAPH3
LONG TERM DEBT Ml'IO 2016
50.0%
20.0%
10.0%
0.0%
Why is an ROE of 9.0% or below reasonable?
Neither my CAPM analysis nor my DCF model analysis supports an ROE higher
than 9.0%. In fact, my analyses and calculations could justify a lower rate of
return, as an 8. 7% ROE is the higher end of the range of results in my DCF and
1
2
3
4
5
6
7
8
9
10
11
12
13
14
15
16
17
18
19
20
21
22
23
Public's Exhibit No. 4 Cause No. 44891
Page 7of39
CAPM analyses. While my DCF model indicated an ROE of 8. 7%, my CAPM
results indicated an ROE of 7 .87%.
As bond yields have remained in a historically low range, my review of 5-
year, 10-year, 20-year and 30-year constant maturity Treasury bonds to arrive at a
CAPM risk free rate produced nothing above 3.0%. Therefore, I am using the
same 4.0% normalized risk free rate that Mr. McKenzie used, based on
calculations by Duff & Phelps. In my DCF analysis, I use a growth rate
considerably above Value Line's forecasted growth rates in Earnings Per Share,
Dividends Per Share and Book Value Per Share. To do this, I considered long
term growth rates in the U.S. economy, in order to produce as reasonable a
growth rate as possible for the company. Even with these considerations,
economic and financial trends do not justify a higher ROE.
Considerations in the macro-economy, in Federal Reserve policy, and in
utility regulation suggest a gradual increase of important variables in the DCF and
CAPM calculations. However, with the Federal Reserve committed to gradual
increases in interest rates and a target of 2% inflation, with the broader economy
still sluggish, and with regulatory commissions consistently averaging ROE
decisions in the 9.0% range for the past four years, only a small increment above
my 8.7% DCF result appears to be justified.
While the stock market has made significant gains in the recent short term,
other macroeconomic variables do not support the return of an inflationary
economy. The Consumer Price Index rose only 4.9 index points during calendar
year 2016, a 2.1 % increase. (https://data.bls.gov/cgi-bin/surveymost) Even with
1
2
3
4
5
6
7
8
9
10
11
12
13
Public's Exhibit No. 4 Cause No. 44891
Page 8of39
some tightening by the Federal Reserve, interest rates remain well below those of
previous inflationary periods. Expectations of significantly higher rates of return
have not accelerated. The Duke University CFO Magazine Business Outlook
Survey for the first quarter of 2017 reveals expectations of an average 6.1 % return
on S&P 500 stocks over the next year and 6.6% over the next ten years. The
survey revealed only a 1-in-10 chance that the return to S&P 500 stocks would be
greater than 9.8% over the same period. (Attachment BEL-3.)
Finally, I would point out that 9.0% is much more in line with recent
ROEs authorized for investor owned companies around the nation than Mr.
McKenzie's 11.1 %. According to Regulatory Research Associates (RRA ), four
companies whose rate cases they track were authorized 9.0% cost of equity in
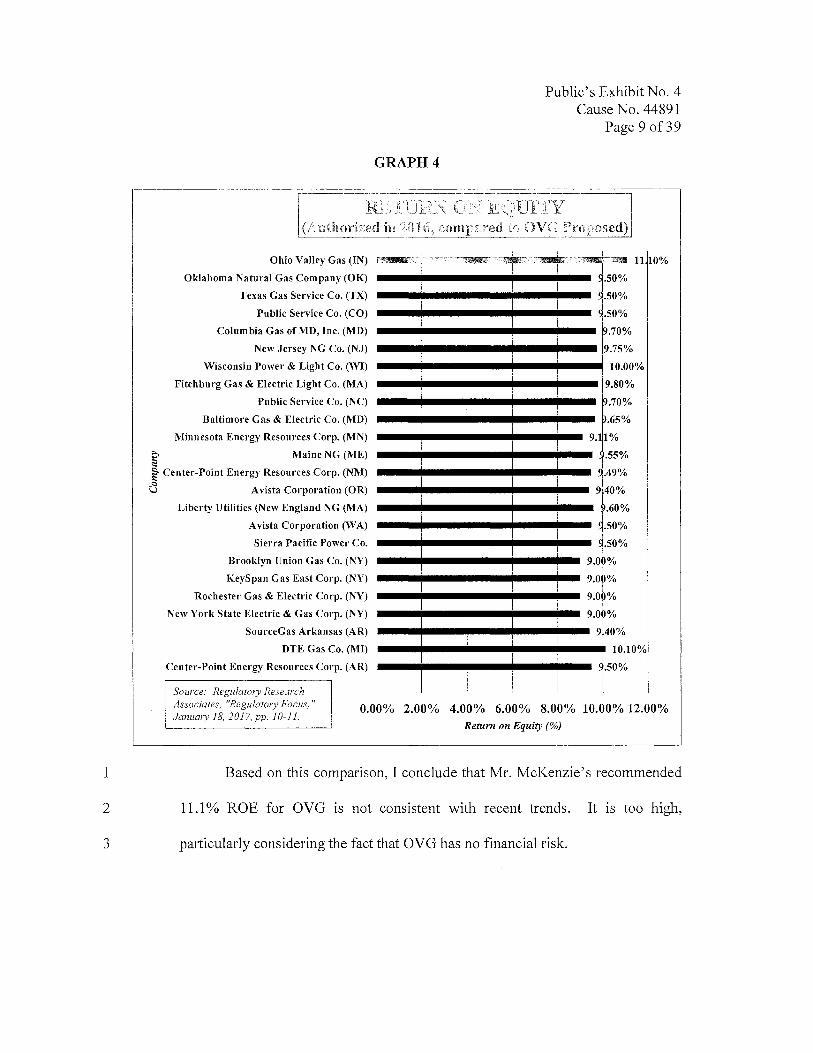
calendar 2016. Only two were authorized 10% or above. Graph 4 illustrates the
results of all the cases reported by RRA for 2016 to the ROE proposed by OVG.
1
2
3
Public's Exhibit No. 4 Cause No. 44891
Page 9of39
GRAPH4
'.Q.ETURN ON EQUITY (Authorized in 2016, comparedtoOVGProposed)
O'hio Valley G!!.s (IN)
Ok~b'om3 Natur.al Gas Company (OK)
Te~11cs Gas Sertice Co. (TX)
]>ublic Seryice Co. (CO)
C'olumbia Gas of MD• Inc. (!\'ID) .N!lW ..l;ersey NG Co. (N'.J) ........ jliil ...... jlill ....... jlill ..............
Wfseonsi.D. J>ower & Ligbt Co. (WI)
.ll'it~ltbTirg Gas & Electric Light .Co. ~)
Public Service Co. (NC)
B'llltnvo~eGas & Eleetfic Co •. (MD) ........ ..,. .......................... ....
Nt:1:ITTiesli)ta $ner~y Res(mrces Cor:p. (~N)
0%
~ Maine.NG~) <:!'
~.Clflltcl"-~-Ob:tt Energy ~e~,011rces Corp, (NM)
C3 .. .A.Vista Corporation (01\)
Lille~ Utilities (New England NG ~) Ayista Corporation (WA)
Sierra P.acific J>ow!lr Co.
Brooklyn Unio.n Gas Co. (NY)
KeySpan Gas East Corp. (NY)
Rochester Gas & Electric Cocy. (NY)
New York State Electric & Gas Corp. (NY)
SourceGas Arkansas (AR)
DTE Gas Co. (Ml)
Cent!ll'.·l'oint Energy Re.sources Corp. (AR) •--•-11111•--•--•11111• .. Source: Regulatory Research Associates, ''Regulatory Focus," January 18, 2017,pp. 10-11. ·.·
0.00% 2.00% 4;00% 6.00% 8.00% 10.00% 12.00% Return on Equity (%)
Based on this comparison, I conclude that Mr. McKenzie's recommended
11.l % ROE for OVG is not consistent with recent trends. It is too high,
particularly considering the fact that OVG has no financial risk.
1 Q: 2
3 A:
4
5 Q:
6 A:
7
8
9
10
11 Q: 12
13 A:
14
15
16 Q:
17 A:
18
19
20
21
Public's Exhibit No. 4 Cause No. 44891
Page 10of39
III. THE PROXY GROUP USED FOR DCF AND CAPM ANALYSES
Please describe your approach to establish a cost of equity estimate for Petitioner.
I relied primarily on the DCF model and CAPM to estimate Petitioner's cost of
equity.
Can you apply the DCF model and CAPM directly to Petitioner?
No. Petitioner is not publicly traded. Consequently, much of the data that would
be available for publicly traded companies is not available for Petitioner. This
fact makes it impractical to apply the DCF and CAPM directly to Petitioner.
Therefore, I calculated cost of equity for Petitioner based on a proxy group of
publicly traded companies.
Please describe how you derived the proxy group for your DCF and CAPM studies.
I used the same proxy group as Mr. McKenzie. These companies are included
among natural gas utility companies listed in the latest Standard Edition of the
Value Line Investment Survey (March 3, 2017).
What companies are in this proxy group?
There are nine companies in Mr. McKenzie's proxy group. They are: Atmos
Energy Corporation, Chesapeake Utilities, NiSource, Incorporated, New Jersey
Resources Corporation; Northwest Natural Gas Company; South Jersey
Industries, Incorporated; Southwest Gas Corporation; Spire, Incorporated; and
WGL Holdings, Incorporated. (Attachment BEL-4.)

1 Q:
2 A:
3
4
5
6
7
8
9 Q:
10 A:
11
12
13
14
15
16
17
18
19
20
Public's Exhibit No. 4 Cause No. 44891
Page 11of39
IV. DISCOUNTED CASH FLOW ANALYSIS
Please describe DCF Analysis.
DCF analysis helps investors determine the appropriate price to pay for particular
assets, such as utility stocks. The model has been adapted for regulatory
proceedings in order to determine the cost of utility equity capital. The DCF
model holds that the price of an asset today should equal the sum of all the cash
flows that the asset will generate, discounted by the appropriate rate back to the
present. This discount rate equals the cost of capital. With utility stocks,
dividends are the relevant cash flows.
Please describe the "Constant Growth" DCF Model.
The underlying principle of the "Constant Growth" DCF Model is that the price
of a film's stock reflects the expected cash flows (i.e., dividends) associated with
that stock, discounted at a rate equal to the cost of equity capital. This can be
expressed mathematically with the following equation:
Po = D1/(K- g)
In this equation, the current price, Po, can be calculated by dividing the expected
annual dividend for the next year, D1, by the term K - g, where K represents the
cost of equity capital and g equals the expected, long-run annual growth rate in
dividends per share ("DPS"). This model relies on the assumption that investors
expect earnings per share ("EPS"), book value per share ("BPS"), and stock price
per share to also grow at a constant long-run rate (g).
1
2
3
4
5
6
7
8
9 Q: 10
11 A:
12
13
14
15
16
17
18
19
20
21
22
23
24
Public's Exhibit No. 4 Cause No. 44891
Page 12of39
By rearranging the algebraic terms, it becomes possible to solve for the
cost of equity capital. The resulting formula is the DCF model most familiar in
utility regulation:
K = (D1/Po) + g
Here, the cost of equity capital, K, equals the "forward dividend yield,"
D1/Po, plus the expected growth rate in dividends per share, g. The DCF model,
therefore, requires estimates of the forward dividend yield and the expected
growth rate.
Is the "Constant Growth" DCF Model considered a reliable method for estimating cost of equity for public utilities?
Yes. When combined with reasonable judgment, this model provides a realistic
and reliable method of estimating a utility's cost of equity. It also formulates the
cost of equity as "yield plus growth," which accurately defines the incentive for
investors to purchase stocks.
The DCF model is also relatively simple in that it states cost of equity in
terms of just two components; and only one of these involves any significant
controversy. The calculation of dividend yield generally involves few disputes.
Most of the controversy in DCF calculations focuses on the growth rate, g. This
should not be surprising since the growth rate projects into the future, and
disagreements will always arise regarding such projections. However, a
reasonable estimate for g can be developed by evaluating variables such as
dividends, earnings, and book value per share. (Note: for the balance of my
testimony, the "Constant Growth DCF Model" will simply be referred to as the
"DCF model.")
1 Q:
2 A:
3
4
5
6
7
8
9
10
11
12
13
14
15
16
17 Q:
18 A:
19
20
21
22
Public's Exhibit No. 4 Cause No. 44891
Page 13of39
What is the difference between current and forward dividend yields?
The current yield, Do/Po, equals the current annual dividend rate, Do, divided by
the current stock price, Po. The current annual dividend rate, Do, equals the most
recent quarterly dividend multiplied by four -- it does not include any projection
into the next year. Dividend yields published by The Wall Street Journal are
current dividend yields, Do/Po.
The forward yield, D1/Po, adjusts the current yield Do/Po to reflect likely
dividend growth in the subsequent year. The forward yield replaces the current
dividend rate, Do, with a prospective dividend rate, DJ. DI is the rate expected
during the following year, and the forward yield will then be calculated by
dividing D1 by the current price, Po. This adjustment is frequently accomplished
by increasing the current dividend yield for one-half of a year's growth in
dividends. This method is often referred to as the "half-year method," and is
recognized as valid and reasonable by the Commission. I use this method in my
DCF analysis to convert current dividend yields (Do/Po) into forward dividend
yields (D1/Po).
What is the result of your forward dividend yield calculation?
My calculation resulted in a 2.8% forward dividend yield for the Gas Utility
Proxy Group. This calculation applies the "half year method" to the data from
Value Line. Attachment BEL-5 p. 2 shows my calculation. In Petitioner's Exhibit
AMM-4 Mr. McKenzie also arrived at an average 2.8% dividend yield for the
proxy group.
Q: 2
3 A:
4
5
6
7
8
9
10
11
12 Q:
13 A:
14
15 Q:
16 A:
17
18
19
20
21
22 Q: 23
24 A:
25
Public's Exhibit No. 4 Cause No. 44891
Page 14of39
Did you compare your forward dividend yield calculation with any other published data?
Yes. I compared the results to an average of the Value Line dividend yields for
the Gas Utility Proxy Group. Value Line publishes forward dividend yield
estimates that reflect anticipated dividend growth in the coming year. My
calculations and the Value Line forward yields are shown in Attachment BEL-5,
p. 2. In the past I have also used A US Utility Reports data to arrive at my
dividend yield estimate. However, A US Utility Reports ceased publication in the
Fall of 2016. Therefore, I added dividend yield data from Market Watch,
NASDAQ, Yahoo Finance and Zack's to supplement Value Line data. In each
case, the average dividend yield was the same.
What did you conclude with respect to the Dividend Yield of the DCF model?
I concluded that a 2.8% dividend yield is reasonable for my DCF calculations.
This is equal to the Value Line average dividend yields for the proxy group.
Please describe the results of your growth calculations.
I concluded that 5.9% is a reasonable growth rate for the Gas Utility Proxy Group.
(See page 3 of Attachment BEL-5 for Value Line Growth Rate data and averages).
This rate results from analyzing both historical and projected EPS, DPS, and BPS
growth rates for the proxy group. My projected growth rate of 5.9% is well above
the projected growth rates for the proxy group companies of 5 .1 % for EPS and
4.3% for DPS. It is also above the 5.4% projected BPS for the proxy group.
Do you agree with Mr. McKenzie's elimination of low growth rates from his DCF analysis?
No. I have eliminated negative growth rates from my analysis. However, I do not
agree with Mr. McKenzie's elimination oflow end estimates based on a 100 basis
1
2
3
4 Q: 5
6 A:
7
8
9
10 11 12 13 14 15 16 17 18 19 20 21 22 23 24
25
26
27
28
29
30
31
Public's Exhibit No. 4 Cause No. 44891
Page 15of39
point premium over Baa utility bond yields. Investors do not ign9re low growth
rates. Low historical or forecasted growth rates are relevant to investors when
considering a company's future growth.
Do you agree with Mr. McKenzie's reliance on forecasted growth rates in EPS in his DCF analysis?
No. Mr. McKenzie's reliance on forecasted EPS growth rates does not conform
to the long standing and well established practice in Indiana of considering both
historical and projected growth rates in the DCF Model. Consideration of growth
in EPS, DPS, and BPS has also long been standard in Indiana.
Although we agree that historical and projected dividend data are important considerations when estimating future rates of growth for use in the DCF model, we do not believe that book value and earnings data should be ignored. It is clear that dividend growth cannot exceed earnings or book value growth in the long run. To derive growth rate estimates in the past, this Commission has sanctioned the use of per share data for dividends, earnings, and book values. We continue to view the use of these data as a legitimate method for estimating future growth when judiciously employed. See generally In re Indiana Gas Co Inc. (Ind. URC September 18, 1987) Cause No. 38080, 86 P.U.R. 4th 241 at 285-286. In re Indiana Michigan Power Co., (Ind. URC August 24, 1990) Cause No. 38728, 116 P.U.R. 4th 1 at 19-20. We conclude that Public's use of all available per share data was appropriate for estimatmg Petitioner's growth rate.
Northern Indiana Fuel and Light, Cause No. 39145, Final Order at 25.
Mr. McKenzie further contends that the accuracy and bias of analysts'
forecast are irrelevant so long as investors share the expectations of those
analysts. (Pet. Exh. AMM, p. 38, lines 3 to 17). While I agree that projections
should not be held up to hindsight review, I believe that analysis of historical data
is an important check on analysts' projections. Moreover, the upward bias in
securities analysts' forecasts is very high.
1 2 3 4 5 6 7
8 9
10
11
12
Public's Exhibit No. 4 Cause No. 44891
Page 16of39
The other problem with using analyst forecasts at the long-term growth rate in the DCF model is such forecasts are biased to the upside. The evidence on this issue is overwhelming. The forecast bias persists year after year in large part due to the incentive structures in place at many Wall Street firms that tend to reward more optimistic projections and to discourage the incorporation of potential negative views in analysts' forecasts. (Emphasis by author).
Steven G. Kihm, How Improper Risk Assessment Leads To Overstated Required Returns for Utility Stocks, NRRI Journal of Applied Regulation, Volume 1, June 2003, p. 98.
Further observations of the upside bias of analysts' forecasts come from
several sources. For example, an article in the Wall Street Journal in 2003
13 observed:
14 Those overly optimistic growth estimates also show that, even with 15 all regulatory forces on too-bullish analysts allegedly influenced by 16 their firms' investment-banking relationships, a lot of things haven't 1 7 changed: Research remains rosy and many believe it always will.
18 The Wall Street Journal, Analysts: Still Coming Up Rosy, January 27, 2003
19 Also:
20 No executive would dispute that analysts' forecasts serve as an 21 important benchmark of the current and future health of companies. 22 To better understand their accuracy, we undertook research nearly a 23 decade ago that produced sobering results. Analysts we found, were 24 typical overoptimistic, slow to revise their forecasts to reflect new 25 economic conditions, and prone to making increasingly inaccurate 26 forecasts when economic growth declined.
27 Alas, a recently completed update of our work only reinforces this 28 view - despite a series of rules and regulations, dating to the last 29 decade, that were intended to improve the quality of the analysts' 30 long-term earnings forecasts, restore investor confidence in them and 31 prevent conflicts of interest. For executives, many of whom go to 32 great lengths to satisfy Wall Street's expectation in their financial 33 reporting and long-term strategic moves, this is a cautionary tale 34 worth remembering.
35 Marc H. Goedhart, Rishi Raj and Abhishek Saxena, Equity Analysts: Still Too 3 6 Bullish, McKinsey Quarterly - April 2010
1
2
3
4
5
6
7 Q:
8 A:
9
10 Q:
11 A:
12
13
14
15
16
17
18
19
20
21
22
Public's Exhibit No. 4 Cause No. 44891
Page 17of39
While I do not contend that analysts' forecasts are not important
considerations, I believe that historical benchmarks and analyses are not to be
excluded. A reasonable rate of return that allows the utility to meet its obligations
and attract capital is not exclusively defined by the forecasts of Wall Street
analysts with incentives for upward bias. Nor should rate payers be required to
pay rates ofreturn based on exaggerated projections.
What have you concluded based on your DCF analysis?
My DCF calculations result in a cost of equity of 8.7%. This combines the 2.8%
forward yield and the 5 .9% growth rate. (Attachment BEL-5, p. 1 ).
V. CAPITAL ASSET PRICING MODEL
Please describe the CAPM.
The underlying assumption of CAPM is that the stock market compensates
investors for risk that cannot be eliminated by means of a diversified stock
portfolio. In CAPM, the required return on a stock equals the sum of a risk free
rate of returri (Rf) plus a risk premium [f3*(Rm- Rf)], which is proportional to the
level of market risk. Market risk cannot be eliminated through diversification.
The CAPM formula is:
K =Rf+ ~*(Rm-Rf)
where,
~ = Beta, a measure of risk for the company,
K =Required return (i.e., cost of equity) on the stock of the company,
Rf= Risk-free rate ofreturn,
Rm = Market equity return, and
1
2
3
4
5
6
7
8 Q:
9 A:
10
11
12 Q:
13 A:
14
15
16 Q:
17 A:
18 Q:
19 A:
20
21
22
23
24
(Rm - Rt) = Market equity risk premium.
Public's Exhibit No. 4 Cause No. 44891
Page 18of39
The "beta" is considered the measure of risk most relevant in CAPM. A
stock with a beta below 1.0 is considered less volatile and less risky than the stock
.market. If beta exceeds 1.0, the stock is considered more volatile and more risky
than the stock market as a whole. By definition, the stock market has a beta of
1.0. The market is usually represented by a large and highly diversified portfolio
of stocks such as the Standard & Poor's 500.
Were you able to perform a CAPM analysis directly for Petitioner?
No. Petitioner is not a publicly traded company. Consequently, the necessary
data does not exist to perform a CAPM analysis directly for Petitioner. Therefore,
I have used Mr. McKenzie's proxy group to perform a CAPM analysis.
How did you determine beta for purpose of your analysis?
I used betas from the Value Line Investment Survey. (Attachment BEL-6, p. 3.)
For this analysis I used the average of the Value Line adjusted betas for the proxy
group, 0.74, as the beta estimate in my CAPM analysis.
What risk free rate (Rr) did you use for your CAPM calculations?
I used 4.0% for my risk free rate.
Please describe how you determined the risk free rate of 4.0%.
I used the Duff & Phelps normalized risk free rate, as described in a Client Alert
on March 16, 2016. (See Attachment BEL-7 .) I reviewed bond yield performance
for calendar year 2016, and could justify a risk free rate no higher than 2.82%
based on the average 30 year bond yields of the last quarter of 2016. I examined
recent term trends in yields on 5-year, 10-year, 20-year, and 30-year Treasury
Bonds from data available from the Federal Reserve (www.federalreserve.gov). I
Public's Exhibit No. 4 Cause No. 44891
Page 19of39
1 calculated averages for the 3 month, 6 month and 12 month periods ending in
2 February 2017.
3 Twenty-year treasury yields averaged 2.76% in February 2017, slightly
4 below 2.84% in December 2016, the month of the Fed's previous rate action. Since
5 the Fed's latest action of March 15, 2017, the yield on the 20 year bond has declined
6 from 2.87% to 2.79% on March 21, 2017. The 30 year Treasury stood at 3.04% on
7 March 21, 2017 as compared to its March 15, 2017 level of 3.11 %. As in the
8 December 2016 rate action, the increase in the Federal Funds rate was followed by
9 some retrenchment in the long term constant maturity Treasury bond yields. While
10 trends show improvement over the past year, these yields remain well below
11 historical normal. I believe that it is fair and reasonable to adopt the 4.0%
12 normalized risk free rate recommend by Duff & Phelps.
13 I also examined the economic projections from the Congressional Budget
14 Office ("CBO") in The Budget and Economic Outlook: Fiscal Years 2017-2027,
15 published in January, 2017. The latest CBO projection for 10-year Treasuries in
16 2017 is 2.3%, and 2.5% in 2018. (Congressional Budget Office, The Budget and
17 Economic Outlook: Fiscal Years 2017-2027, January, 2017. www.cbo.gov.)
18 (Attachment BEL-8.)
19 The above research and analysis leads me to conclude that 4.0% is a
20 reasonable risk-free rate to use in my CAPM analysis, considering both recent
21 experience and future projections.

1 Q:
2 A:
3
4
5
6
7
8
9
10
11
12
13
14
15
16
17
18
19
20
21
Public's Exhibit No. 4 Cause No. 44891
Page 20of39
How did you estimate the Market Risk Premium (Rm -Rr)?
I calculated long-term market risk premiums based on historical data from the
Preview Version of Stocks, Bonds, Bills and Inflation (SBBI), 2017 Yearbook, by
Duff & Phelps I John Wiley and Sons. Previously published by Morningstar, Inc.
(Attachment BEL-9.) These data points are directly comparable with previous
Morningstar and Ibbotson Associates publications. With the hard bound version
not yet available, Duff & Phelps issued the preview for current subscribers. The
SBBI database covers the period between 1926 and 2016.
There are two methods of calculating historical holding period returns:
the geometric mean (or compound annual return) and the arithmetic mean, which
is a simple average of one year holding period returns. The geometric mean
return measures the average compound annual rate of return from an investment
over a period of more than one year. The arithmetic mean measures the average
of one year holding period returns. Unless the investment provides a constant
return year after year, the arithmetic mean rate of return always exceeds the
geometric mean rate of return. The arithmetic mean approach also produces
higher estimates of the market risk premium, and higher overall CAPM results.
The Commission has consistently expressed its preference for considering
both the geometric mean and arithmetic mean approaches. For instance, in its
final order in the Indiana-American Water rate case (Cause No. 42520), the
Commission once again expressed this preference:
I 2 3 4 5 6 7 8 9
10 11 12 13
14 15 16 17
18
19
20
21
22
23 Q:
24 A:
25
26
27
28
29
Public's Exhibit No. 4 Cause No. 44891
Page 21of39
In past rate cases this Commission has given weight to both the arithmetic and the geometric mean risk premiums. This position was reaffirmed in our 1996 Rate Order, when we stated "[t]he debate over the proper use of the arithmetic and geometric means is one we consider resolved. As we stated in Indianapolis Water Company, Cause No. 39713-39843 [sic], each method has its strengths and weaknesses, and neither is so clearly appropriate as to exclude consideration of the other." (1996 Rate Order, Cause No. 40103, p. 41.) Also, in the 2002 Rate Order, we stated ". . . that, while the debate over the proposed use of the arithmetic and geometric means continues, however, each method has its strengths and weaknesses, neither is so clearly appropriate as to exclude consideration of the other. (2002 Rate Order, Cause No. 42029, p. 32.) ...
... We will continue to give both the geometric and arithmetic mean risk premiums substantial weight. Neither the arithmetic nor geometric mean risk premiums should be excluded in favor of the other.
(November 18, 2004 Order, Cause No. 42520, p. 59.)
Following this well-established directive, I calculated market risk
premmms givmg equal weight to both the geometric and arithmetic mean
approaches. I used the resulting market risk premium of 5 .25% in my CAPM
calculations. (See Attachment BEL-6, p. 4.)
Please describe the results of your CAPM analysis.
Here again, I emphasize that my CAPM analysis results in an estimate that is
higher than it might otherwise be. I used the Duff & Phelps normalized risk free
rate of 4.0%, which is almost 100 basis points above the average ofrecent 30-year
bond yields. I used only the adjusted betas from Value Line, and balanced the
weight given to the geometric mean and arithmetic mean approaches. This results
in a CAPM estimate of 7.87%. (Attachment BEL-6, p. 1.)
1 2 3
4
5
6
7
8
9 10 11 12 13 14 15 16 17 18
19 20 21 22 23 24 25
26 27 28
29
30
31
32
Q:
A:
Public's Exhibit No. 4 Cause No. 44891
Page 22of39
Mr. McKenzie states that size adjustment in the range of 170 to 360 basis points to ROE is needed to reflect OVG's risk. Do you believe that a small stock adjustment is justified?
No. The applicability of a small stock adjustment to regulated public utilities is
questionable. Regulation reduces the financial risks faced by Petitioner. Annie
Wong of Western Connecticut State University writes that business and financial
risks are very similar among utilities regardless of size in Utility Stock and the
Size Effect: An Empirical Analysis:
The fact that the two samples show different, though weak results indicates that utility and industrial stocks do not share the same characteristics. First, given firm size, utility stocks are consistently less risky than industrial stocks. Second, industrial betas tend to decrease with firm size, but utility betas do not. These findings may be attributed to the fact that all public utilities operate in an environment with regional monopolistic power and regulated financial structure. As a result, the business and financial risks are very similar among the utilities regardless of their size. Therefore, utility betas would not necessarily be related to firm size.
The object of this study is to examine if the size effect exists in the utility industry. After controlling for equity values, there is some weak evidence that firm size is a missing factor from the CAPM for industrial but not utility stocks. This implies that although the size phenomenon has been strongly documented for industrials, findings suggest that there is no need to adjust for the firm size in utility regulation. (Emphasis added.)
(Annie Wong, "Utility Stock and the Size Effect: An Empirical Analysis," Journal of the Midwest Finance Association, 1993, p. 98.)
Further, Michael Paschall and George B. Hawkins, authors of Do Smaller
Companies Warrant a Higher Discount Rate for Risk?: The "Size Effect" Debate,
state that privately held companies should be analyzed individually to determine
if a size premium is appropriate:
1 2 3 4 5 6 7 8 9
10
11
12
13
14 15 16 17 18 19 20 21 22
23
24
25
26 27 28 29 30
31
32
33
Public's Exhibit No. 4 Cause No. 44891
Page 23of39
A size premium does not automatically apply in every case. Each privately held company should be analyzed to determine if a size premium is appropriate in its particular case. There can be unusual circumstances where a small company has risk characteristics that make it far less risky than the average company, warranting the use of a very low risk premium. One possible example of this is a private water utility (monopoly situation, very low risk, nearguarantee of payments). (Paschall and Hawkins, Do Smaller Companies Warrant a Higher Discount Rate for Risk?: The "Size Effect" Debate, CCH Business Valuation Alert, December, 1999.)
Moreover, the Commission has found that a blind application of
Ibbotson's small company adjustment ignores the fact that the risk of regulated
utilities is not as great as small companies:
We are familiar with the Ibbotson-derived 400 basis point small company risk premium used by Dr. Beatty. The rationale behind this approach is that, all other things being equal, the smaller the company, the greater the risk. However, to blindly apply this risk premium to Petitioner is to ignore the fact that Petitioner is a regulated utility. The risks from small size for a regulated water utility are not as great as those small companies facing competition in the open market. (South Haven Sewer, Cause No. 40398, Final Order May 28, 1997, pp. 30-31.)
Also, more recently in an Indiana-American rate case Order, Cause No.
43680, on April 30, 2010, the Commission stated that the regulated utilities have
different risk than other small companies:
The Commission rejects Petitioner's equity size premmm adjustment because it cannot be directly applied to regulated water utilities. Regulated water utilities do not experience the same risks as other small companies. (Indiana-American Water, Cause No. 43680, Order, p. 47.)
The same principle can be applied to regulated natural gas companies,
particularly those with no long term debt in the capital structure and no financial
risk.
VI.
1 Q:
2 A:
3
4
5 Q:
6 A:
7
8
9
10
11
12
13
14
15 Q: 16
17 A:
18
19
20
21
22
23
Public's Exhibit No. 4 Cause No. 44891
Page 24 of39
PROBLEMS ARE INHERENT IN MR. MCKENZIE'S OTHER MODELS
Does Mr. McKenzie use any models that you do not?
Yes. In addition to his DCF and CAPM analyses, Mr. McKenzie developed a Gas
Utility Risk Premium Model ("RP"), an Expected Earnings Model ("EE"), and an
Empirical Capital Asset Pricing Model ("ECAPM").
Please describe Mr. McKenzie's RP approach.
Mr. McKenzie calculates two RP estimates of cost of equity. One estimate uses a
current bond yield for his first risk premium model and a second estimate uses
forecasted bond yields. His RP model is based on calculating the historical spread
(risk premium) between authorized costs of equity and average utility bond yields
from the first quarter of 1980 through the second quarter of 2016. Mr.
McKenzie's RP relies on the assumption that the risk premium tends to be lower
when interest rates are high and higher when interest rates are low. His RP
produces estimated costs of equity of 9.28% when using current bond yields, and
10.30%, w:hen he incorporates forecasted bond yields.
Please explain how Mr. McKenzie derived an estimated cost of equity for Risk Premium Models.
When estimating based on current bond yields, Mr. McKenzie used an average
yield for single-A rated public utility bonds for the six month period ending
October 2016. Adding this average of 3.72% to his implied risk premium of
5.56% resulted in a 9.28% cost of equity. When using forecasted bond yields, he
averaged Blue Chip forecasts for the years 2017-2021 to arrive at 5.63% which,
when added to his implied equity risk premium of 4.67%, resulted in a 10.30%
cost of equity. In both calculations, Mr. McKenzie estimated an implied risk

1
2
3 Q: 4 A:
5
6
7
8
9
10 Q: 11 A:
12
13
14
15
16
17 Q: 18 A:
19
20
21
22
23
Public's Exhibit No. 4 Cause No. 44891
Page 25of39
premium based on the difference between historical average of authorized ROEs
and single-A utility bond yields.
Do you agree with Mr. McKenzie's Risk Premium approach.
No. Mr. McKenzie's direct use of previously authorized costs of equity creates
circularity in his model. His implied risk premiums are not appropriate to
estimate a required rate of return. Authorized returns are the results of a cost of
equity analysis, not inputs. Moreover, he is not consistent in his forecasted bond
yields estimate, as he used an implied risk premium based on current bond yields,
rather than on forecasted yields.
Please describe Mr. McKenzie's Expected Earnings ("EE") Approach.
Mr. McKenzie's EE approach estimated costs of equity at 11.0% (average) and
11.1 % (midpoint). His EE approach averaged 3-5 year estimated returns on
common equity of nine gas utility companies from his proxy group. In a footnote
at the bottom of AMM Attachment 9, Mr. McKenzie noted he adjusted Value
Line's Expected Return on Common Equity to convert year-end returns to
average rates of return.
Do you agree with Mr. McKenzie's EE approach.
No. His EE approach amounts to a compilation of Value Line's 3-5 year
estimated returns on common equity. Value Line's 3-5 year forecasted return on
common equity is an intermediate forecast, not a required return nor a cost of
equity. Forecasts of companies over-earning or under-earning can distort and
skew expectations and future rates if used in determining an authorized return.
Moreover, as many companies also have unregulated operations, Mr. McKenzie's
1
2
3
4
5
6
7
8
9
10
11
12
13 14
15
16
17
18 19 20 21 22 23 24 25 26 27 28 29
Q:
A:
Q:
A:
Public's Exhibit No. 4 Cause No. 44891
Page 26of39
EE approach would include forecasted returns on those operations. Value Line's
intermediate forecasted returns should not be used to estimate cost of equity.
Do you agree with Mr. McKenzie's Empirical CAPM ("ECAPM") estimate?
No. Mr. McKenzie's ECAPM produced an estimated cost of equity of 11.1%,
with a midpoint of 11.2%. The ECAPM is designed to address a theoretical
downward bias in risk by increasing the risk factor, called "beta." This is
accomplished by giving a 25% weight to the Market Risk Premium, and a 75%
weight to a traditional CAPM risk premium for the proxy group. It essentially
limits the impact of the beta calculated for the proxy group. However, Mr.
McKenzie also uses betas which have already been upwardly adjusted. His
ECAPM estimate includes an additional upward adjustment, and produces an
artificially inflated result.
Has the Commission expressed an opinion on the use and results of an ECAPM approach?
Yes. The Commission has rejected the use of ECAPM in at least two previous
Causes (Cause Nos. 40003 and 42359). In its Final Order in Cause No. 42359 the
Commission stated:
With respect to the ECAPM analysis performed by Dr. Morin we note that the Commission rejected this model in Cause No. 40003, and found that: "the Empirical CAPM is not sufficiently reliable for ratemaking purposes." Cause No. 40003 at 32. We went on to conclude that the ECAPM ". . . would adjust, in essence, future expectations with regard to investor perceptions of relative risks for further change which may occur years hence." The Commission concluded that ". . . we do not believe exercises in approximating future cost of capital are conducive to such precise estimation as the Empirical CAPM would suggest." Id. We find that nothing presented in this Cause has changed our prior determination that ECAPM is not sufficiently reliable for
Public's Exhibit No. 4 Cause No. 44891
Page 27of39
1 ratemaking purposes and hereby reject the model in this 2 proceeding.
3 PSI Energy, Cause No. 42359, p. 56 (Ind. Util. Regulatory Comm'n May 18, 2004.)
4 Q:
5 A:
6
7 Q: 8
9 A:
10
11
12
13
14
15
16
17
18
19
20
21
VII. MACROECONOMIC TRENDS
Do macroeconomic factors and trends influence the cost of equity?
Yes. The most noteworthy of these factors are interest rates, economic growth,
and inflation.
Do you have economic forecast data to support 9.0% as a reasonable ROE for Petitioner?
Yes. The CFO Magazine Business Outlook Survey, published by Duke
University in the First Quarter 2017 (http://www.dosurvev.org/J (the "CFO
Survey") states that "[o]n February 20, 2017 the annual yield on 10-yr treasury
bonds was 2.41 %,'' and asked respondents for their expectations on the rate of
return for S&P 500 companies in the future. Their responses revealed an average
expected return of 6.1 % over the next year and 6.6% over the next 10 years. My
recommended ROE of 9.0% for Petitioner is 290 basis points above the
expectations of respondents to the CFO Survey for next year, and 240 basis points
above expectations for the next ten years. Survey respondents expect only a 1-in-
10 chance of the annual S&P 500 return being greater than 9.8%. (Attachment
BEL-3.) I emphasize that these return estimates apply to companies in the S&P
500, which includes many industrial companies considered more risky than
regulated utilities.

Q:
2 A:
3
4
5
6 Q:
7 A:
8
9
10
11
12
13
14
15
16
17
18
19
Public's Exhibit No. 4 Cause No. 44891
Page 28of39
Please discuss bond yields as an influencing factor on the cost of equity.
Bond yields are extremely important factors influencing cost of equity. Yields on
U.S. Treasury Bonds are commonly used to establish the risk-free rate of return in
CAPM and other risk premium analyses. Moreover, changes in bond yields and
interest rates affect investor expectations.
Please compare current and historical trends in bond yields.
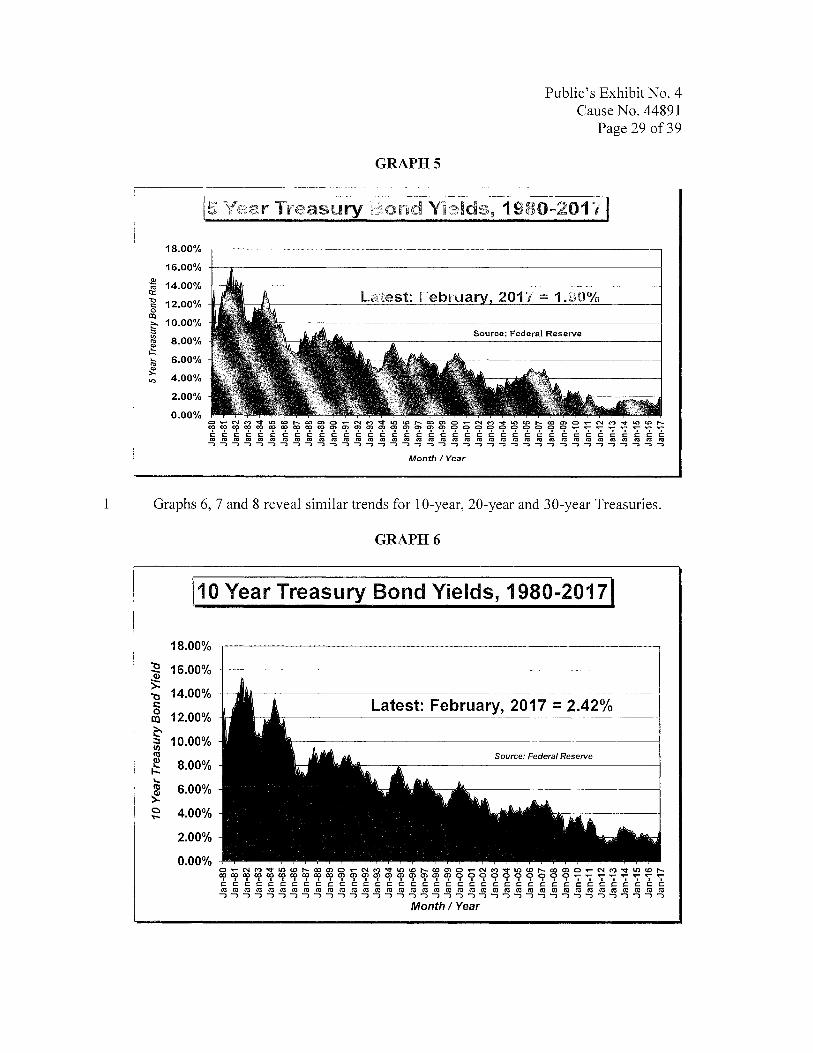
The long period of low cost capital has been unchanged in recent years. Lower
interest rates and bond yields have been the main indicator of this trend. The
trend toward low cost capital has taken place over two decades; it is a long run
phenomenon, and not simply a result of the recent recession. Graph 5 below
shows the monthly interest rate trend on 5-year Constant Maturity Treasury
Bonds, reported by the Federal Reserve. Graphs 5 through 8 indicate the
American economy is in a period with rates well below those of the 1980s and
1990s.
In March, 2017, long term bond yields remained low in comparison to
earlier periods. On March 21, 2017, the spot yield on the bellwether 10 Year
Treasury bond stood at 2.43%, and the 5 Year Treasury stood at 1.96%. The 20
Year Treasury closed at 2.79%, and the 30 Year Treasury stood at 3.04%.
(https://vv\v'vv.federaln::serve.gov/datadov:nload/Choose.aspx?rel=Hl 5)
~
"' ci:: ..,, c: 0
CXl ;:-. ::. "' "' ~ I-' .... "' ~ "'
18.00%
16.00%
14.00%
12.00%
10.00%
8.00%
6.00%
4.00%
2.00%
0.00%
GRAPHS
Month/Year
Public's Exhibit No. 4 Cause No. 44891
Page 29of39
Source: Federal Reserve
1 Graphs 6, 7 and 8 reveal similar trends for 10-year, 20-year and 30-year Treasuries.
GRAPH6
,-~-~- . -----. ------. --~. . --------
! 110 Year Treasury Bond Yields, ·1980-20171 I
18.00%
'tl 16.00% di >:
14.00% 'tl t: 0 12.00% co ~
10.00% ::J
~ Source: Federal Reserve e 8.00% i-.; ..... Ill 6.00% ~ c 4.00% ~
2.00%
0.00%
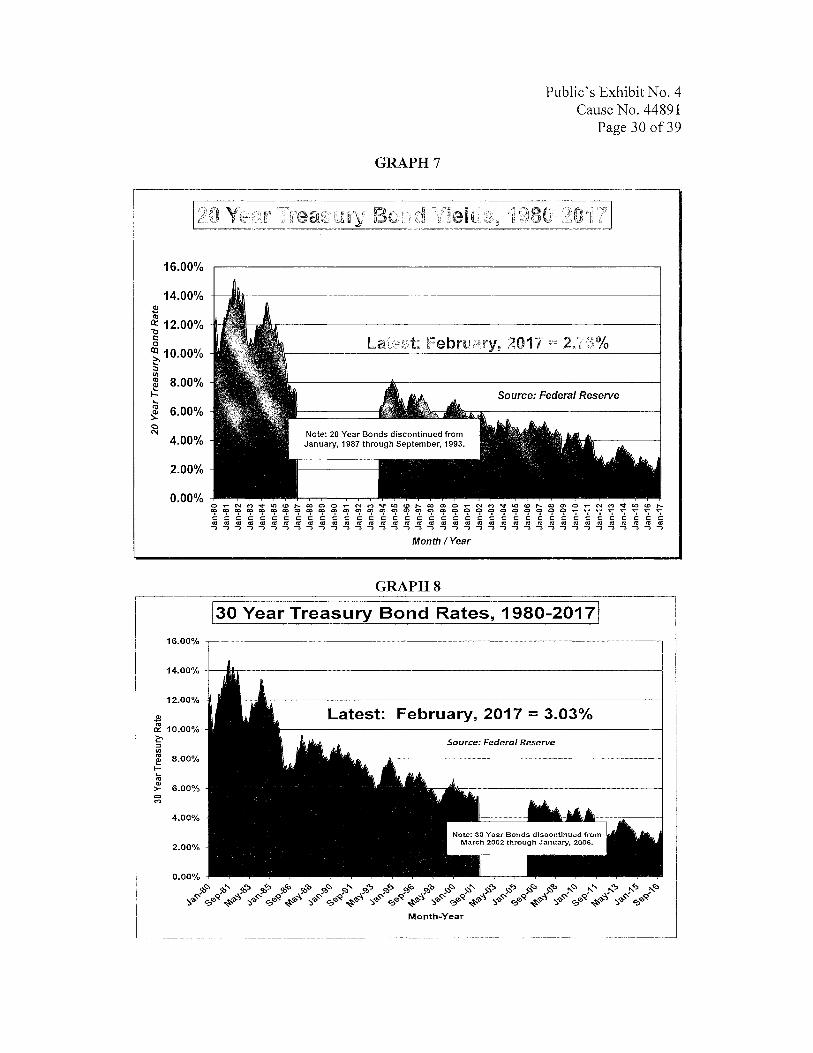
GRAPH7
Public's Exhibit No. 4 Cause No. 44891
Page 30 of39
20 Year Treasury Bond Yields, 1980-2017
16.00%
14.00%
~ ~ 12.00% § ~ 10.00%
~ ~ 8.00% i-;;
~ ~ 6.00%
4.00%
2.00%
0.00%
12.00%
.s {!}_ 10.00% i::' ::s
= I!! 8.00% I-~ .. ~ 6.00% C> <?
4.00%
2.00%
0.00%
Latest: February, 2017 = 2.76%
Source: Federal Reserve
Month/Year
GRAPHS
l3o Year Treasury Bond Rates, 1980-20171
Latest: February, 2017 = 3.03%
Source: Federt# Reserve
~~~~~~~~~~~~~~~~~~~~~~~ #~~#~~#~~#~~#~~#~~#####
Month-Year
1 Q:
2 A:
3
4
5
6
7
8
9
10
11
12
13
14
15
16
How does econ.omic growth influence cost of equity?
Public's Exhibit No. 4 Cause No. 44891
Page 31of39
Economic growth primarily influences cost of equity through interest rates and
investor expectations. A booming, high-growth economy tends to put upward
pressure on interest rates. A lackluster or recessionary economy tends to lead to
stagnant or falling interest rates.
Data from the U.S. Department of Commerce, Bureau of Economic
Analysis ("BEA") (www.bea.gov) and from the CBO, provides historical
perspectives. The CBO, using BEA data, projects 4.1 % nominal growth (growth
measure in current dollars - not adjusted for inflation) in 2017, and 3.8% nominal
growth in 2018. CBO projections indicate a 3.5% rate of nominal growth in the
period 2019-2020 and 4.0% in the period 2021-2027 (Attachment BEL-8).
Real economic growth is growth measured in constant (i.e., inflation
adjusted) dollars. Moreover, CBO forecasts 2.3% real growth in 2017, 2.0% in
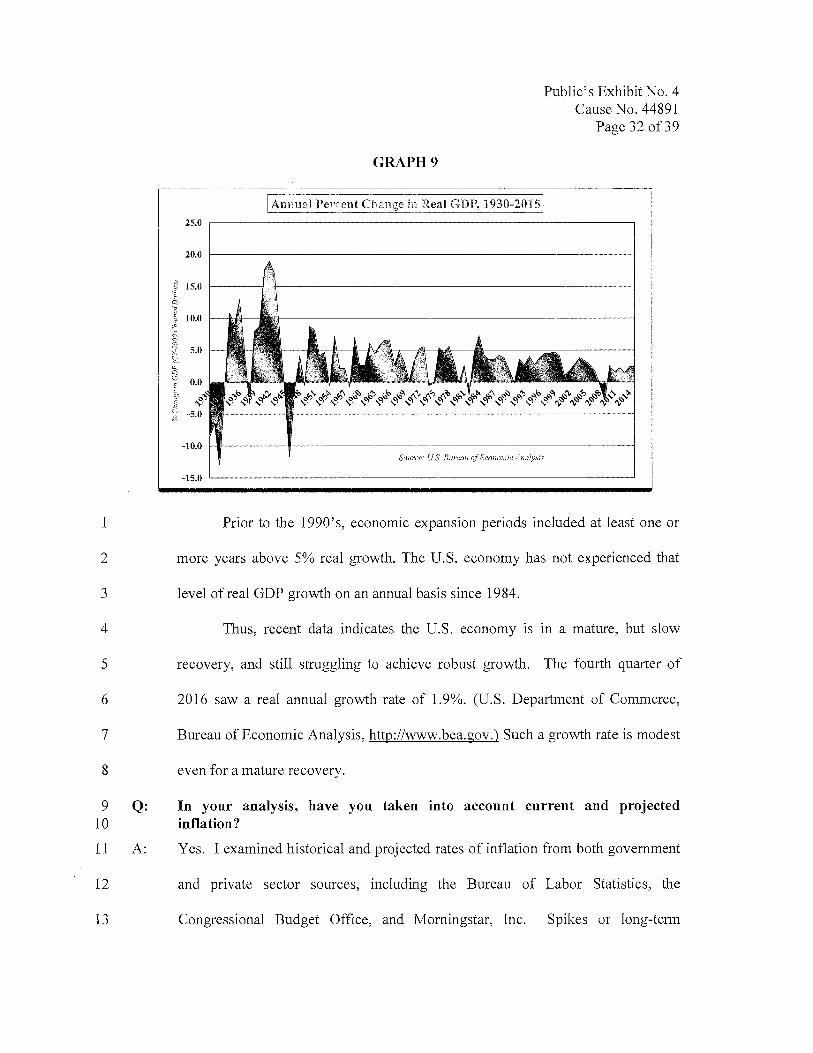
2018, 1.6% in the period 2019-2020, and 1.9% in 2021-2027. (Id.) Graph 9
shows annual percent changes in real GDP in the period 1930 through 2015, as
published by BEA. (https://www.bea.gov/national/index.htm#gdp)
1
2
3
4
5
6
7
8
9 Q: 10
11 A:
12
13
GRAPH9
Public's Exhibit No. 4 Cause No. 44891
Page 32of39
!Annual Percent Change in Real GDP, 1930-2015j 25.0 -------------------~------~
20.0 ,....._ _________________________ _.,..,
Prior to the 1990's, economic expansion periods included at least one or
more years above 5% real growth. The U.S. economy has not experienced that
level ofreal GDP growth on an annual basis since 1984.
Thus, recent data indicates the U.S. economy is in a mature, but slow
recovery, and still struggling to achieve robust growth. The fourth quarter of
2016 saw a real annual growth rate of 1.9%. (U.S. Department of Commerce,
Bureau of Economic Analysis, http://www.bea.gov.) Such a growth rate is modest
even for a mature recovery.
In your analysis, have you taken into account current and projected inflation?
Yes. I examined historical and projected rates of inflation from both government
and private sector sources, including the Bureau of Labor Statistics, the
Congressional Budget Office, and Morningstar, Inc. Spikes or long-term
1
2
3
4
5
6
7
8
9
10 11 12 13 14 15 16
17 18 19 20 21 22 23 24 25 26 27 28
29 30 31 32 33
Q:
A:
Public's Exhibit No. 4 Cause No. 44891
Page 33of39
increases in inflation can affect the prospective real return, but I found no reason
to believe that inflation will experience such increases in the near term.
Please describe the trends in the rate of inflation.
The U.S. economy remains in a relatively low inflation period. In her February
15, 2017 testimony on the outlook of the economy before the U.S. Congressional
Joint Economic Committee, Federal Reserve Chairperson Janet L. Yellen
explained that inflation is moving consistent with the Federal Open Market
Committee's ("FOMC") expectations. She also indicated that the FOMC expects
only gradual increases in future interest rates:
Incoming data suggest that labor market conditions continue to strengthen and inflation is moving up to 2 percent, consistent with the Committee's expectations. At our upcoming meetings, the Committee will evaluate whether employment and inflation are continuing to evolve in line with these expectations, in which case a further adjustment of the federal funds rate would likely be appropriate.
The Committee's view that gradual increases in the federal funds rate will likely be appropriate reflects the expectation that the neutral federal funds rate--that is, the interest rate that is neither expansionary nor contractionary and that keeps the economy operating on an even keel--will rise somewhat over time. Current estimates of the neutral rate are well below pre-crisis levels--a phenomenon that may reflect slow productivity growth, subdued economic growth abroad, strong demand for safe longer-term assets, and other factors. The Committee anticipates that the depressing effect of these factors will diminish somewhat over time, raising the neutral funds rate, albeit to levels that are still low by historical standards.
That said, the economic outlook is uncertain, and monetary policy is not on a preset course. FOMC participants will adjust their assessments of the appropriate path for the federal funds rate in response to changes to the economic outlook and associated risks as informed by incoming data.
1 2
3
4
5
6
7
8
9
10
11
12
13
14
15
16
17
18
19
20
Public's Exhibit No. 4 Cause No. 44891
Page 34 of 39
https:/iwww.federalreserve.gov/newsevents/testimonv/yel!en20170 214a.htm
The overall (also called "headline") Consumer Price Index ("CPI") has
fluctuated over the past two years, but has remained relatively low in spite of the
high volatility of energy prices. (CPI data from U.S. Department of Labor, Bureau
of Labor Statistics, www.bls.gov.) As of the end of December 2016, the
unadjusted CPI for "All Urban Consumers" was 2.1 % higher than its December
2015 level (https://www.bls.gov/news.release/cpi.tOl.htm). Core inflation, which
removes the impact of energy and food price volatility, remains low. The CBO
estimates core inflation in 2017 at 2.2% and 2.3% in 2018 (Attachment BEL-8).
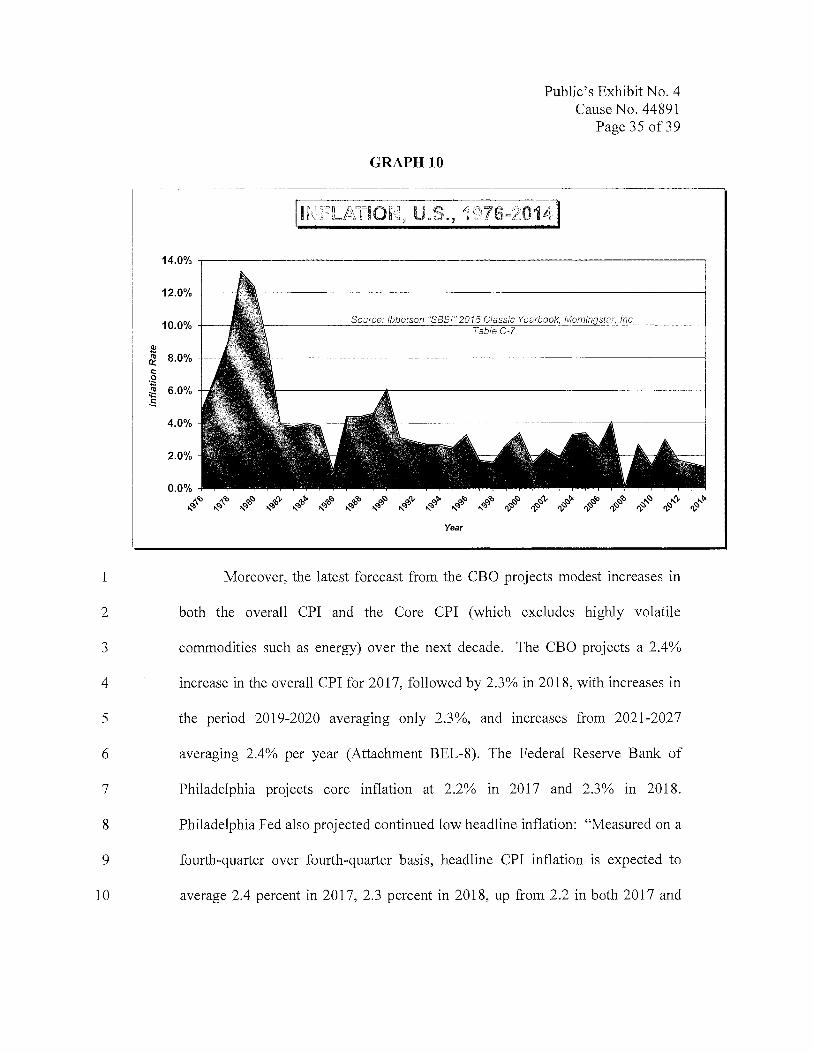
Annual inflation rates from 1976 through 2014 indicate that the United
States remains subject to low inflation, despite recent volatile energy costs.
Current inflation is nowhere near levels experienced in earlier decades. Data
from Morningstar, Inc., which I have recreated below in Graph 10, indicates that
inflation evaporated in 2008, falling from 4.1 % in 2007 to 0.1 %. Inflation
rebounded slightly in 2009 to 2.7%, retreated to 1.4% in 2010, and was 3.0% in
2011. However, inflation fell to 1.7% in 2012, 1.5% in 2013 and 1.3% in 2014.
This compares to an annual average of 3.0% between 1990 and 2000, and 5.2%
between 1980 and 1990. (Morningstar Inc., 2015 Classic Ibbotson SBBI
Yearbook, Table C-7.) (Attachment BEL-10.)
J!l i! ;: ~ illl .!;;
1
2
3
4
5
6
7
8
9
10
14.0%
12.0%
10.0%
S.0%
6.0%
4.0%
2.0%
.0.0% ~IQ
ie> ~ ~ @;,~
.{!I
GRAPHlO
Public's Exhibit No. 4 Cause No. 44891
Page 35 of39
jlNFLATION, U.S., 1976-2014)
Souroe: lbbot$0n "BBf3f'! 2015 Cfassir:1 Yearbook, Marni star, !no.
Year
Moreover, the latest forecast from the CBO projects modest increases in
both the overall CPI and the Core CPI (which excludes highly volatile
commodities such as energy) over the next decade. The CBO projects a 2.4%
increase in the overall CPI for 2017, followed by 2.3% in 2018, with increases in
the period 2019-2020 averaging only 2.3%, and increases from 2021-2027
averaging 2.4% per year (Attachment BEL-8). The Federal Reserve Bank of
Philadelphia projects core inflation at 2.2% in 2017 and 2.3% in 2018.
Philadelphia Fed also projected continued low headline inflation: "Measured on a
fourth-quarter over fourth-quarter basis, headline CPI inflation is expected to
average 2.4 percent in 2017, 2.3 percent in 2018, up from 2.2 in both 2017 and
1
2
3
4
5
6
7 Q: 8
9 A:
10
11
12 Q: 13
14 A:
15
16
17
18
19
20
21
Public's Exhibit No. 4 Cause No. 44891
Page 36of39
2018 in the last survey." (Federal Reserve Bank of Philadelphia, Survey of
Professional Forecasters, First Quarter 2017, February 10, 2017, p. 4).
Even with the slight increase in core inflation, my research and analysis
shows inflation remains low by historical standards. Low inflation rates tend to
support lower interest rates and lower costs of financing capital investment,
including investments in utility plant.
Are you arguing there should be a decrease to ROE because of low levels of headline and core inflation?
No. I have made no reduction to my ROE recommendation due to inflation. I use
inflation data projections merely to illustrate that inflation, which remains low and
stable, is not likely to put pressure on interest rates and ROE in the near future.
What conclusions have you reached about the macroeconomic trends that influence cost of equity?
Recent trends in interest rates, inflation, and economic growth do not reveal an
inflationary economy. Instead, recent trends point to a continuing, but maturing,
recovery from the financial crisis and recession that started in 2008. There is no
indication that macroeconomic trends are fueling any significant increase in
capital costs. Petitioner's proposed 11.1 % cost of equity far exceeds market
expectations, even for a more risky stock portfolio like the S&P 500 containing
many industrial companies. Consequently, my recommended ROE of 9.0% is
much more in line with current economic conditions.
1 Q:
2 A:
3
4
5
6
7
8 Q: 9
10 A:
11
12
13
14
15
16
17
18 Q: 19
20 A:
21
22
Public's Exhibit No. 4 Cause No. 44891
Page 37of39
VIII. SUMMARY AND RECOMMENDATIONS ON COST OF EQUITY
Please summarize your testimony on DCF calculations for the proxy group.
Using the same proxy group as Mr. McKenzie, I calculated a 2.8% forward
dividend yield. I also calculated a DCF growth rate, g, of 5 .9%. This estimate
was made using historical and projected growth rates from Value Line, and
economic growth data from the Federal Reserve Bank of St. Louis. I considered
both projected and historical data. Overall, my DCF calculations resulted in an
8.7% cost of equity.
Please summarize your testimony on CAPM calculations for the proxy group.
Based on Value Line betas and using the same proxy group, I calculated an
average beta for the proxy group of 0.74. As the beta is less than 1.0, it also
describes a relatively low-risk industry. I used the Duff & Phelps normalized
risk-free rate of 4.0%. I reviewed 5 Year, 10 Year, 20 Year, and 30 Year bond
yield data ending calendar year 2016 in arriving at this estimate. Giving equal
weight to both the geometric mean and arithmetic mean approaches, I calculated a
market risk premium of 5 .25%. This results in a CAPM cost of equity for the
proxy group of 7 .87%.
Please summarize your testimony on macroeconomic and capital market trends influencing cost of equity.
In contrast to the market expectations described in CFO Magazine of a 6.1 %
anticipated return on the S&P 500 over the next year and 6.6% for the next ten
years, Petitioner proposes a rate of return of 11.1 % for a regulated public utility.
1
2
3
4
5
6
7
8
9
10
11
12
13
14
15
16 Q:
17 A:
18
19
20
21
22
23
Public's Exhibit No. 4 Cause No. 44891
Page 38of39
In today's capital market, a proposal that high is simply not in accord with current
conditions.
I examined three macroeconomic variables that can influence the cost of
equity capital. First, I examined interest rates. Interest rates on 5-year, 10-year,
20-year and 30-year bonds remain low by historical standards, and recent
increases have been modest. Second, CBO forecasts real GDP growth over the
next 10 years to range from 2.3% in 2017, declining to 2.0% in 2018, 1.6% in the
period 2019-2020, and 1.9% in the period 2021-2027. Growth in this range is not
likely to drive up interest rates.
Third, the United States is currently experiencing an extended period of
low inflation. Even with energy price volatility in recent years, both "headline"
inflation and core inflation remain low compared to earlier periods. While
inflation fears are always a policy consideration for the Federal Reserve, recent
experience and projections by the CBO tend to indicate that inflation is under
control in spite of volatility in energy prices.
Please summarize your recommendation for Petitioner's ROE.
I recommend the Commission authorize a 9.0% cost of equity for Petitioner. This
recommendation reflects a risk premium close to 600 basis points over recent
yields on 30-year Treasury bonds, which currently hovers near 3.0%. This
recommendation is above both my DCF and CAPM calculations. With the
Federal Reserve clearly on a long term gradual course to higher interest rates,
prospects of continued economic growth, gradual increases in inflation and recent
trends in utility rate cases towards the 9.0% level, I believe that a
1
2
3
4
5
6
7 Q:
8 A:
Public's Exhibit No. 4 Cause No. 44891
Page 39 of39
recommendation above th~ results of my DCF m9del and CAPM are justified.
However, I have found no evidence that would lead me to believe that dramatic
changes in economic trends are likely in the foreseeable future. Therefore, I do
not believe a larger adjustment to my ROE recommendation is justified. Given
these economic conditions, and my DCF and CAPM calculations, I believe that
my recommendation is both fair and reasonable.
Does this conclude your testimony?
Yes.
AFFIRMATION
I afflflll, under the penalties for perjury, that the foregoing representati~---
Bradley Utility alyst II Indiana Office of Utility Consumer Counselor Cause No. 44891 Ohio Valley Gas Corporation and Ohio Valley Gas, Inc.
20, 2017 I

1 Q:
2 A:
3
4
5
6
7
8
9
10
11
12
13
14
15
16
17
18
19
20
APPENDIXBEL-1 TO THE TESTIMONY OF OUCC WITNESS BRADLEY E. LORTON
Appendix BEL-1 Cause No. 44891
Page 1 of 2
Please describe your educational background and experience.
My expertise is in economics and public utility regulation. I hold Bachelor of
Science and Master of Science degrees in Economics from Indiana State
University. I also completed additional courses in Economics, Mathematics and
Labor Studies at Indiana University-Purdue University at Indianapolis. I have
completed the Regulatory Studies Program sponsored by the National Association
of Regulatory Utility Commissioners ("NARUC") at Michigan State University.
I also completed NARUC's Advanced Regulatory Studies Program: Ratemaking,
Accounting and Economics.
I have over thirty-five years of experience in government and private
industry. My career in public utility regulation began in 2001 when I accepted
my current position with the OUCC. Prior to that, I served in management and
business analyst positions with the U.S. Department of the Navy at the Naval Air
Warfare Center in Indianapolis, and its privatized successor organizations. I also
served as an Economist at the Bureau of Labor Statistics, United States
Department of Labor, and as a Statistician for the Indiana Division of Labor.
I have been awarded the professional designation Certified Rate of Return
Analyst ("CRRA") by the Society of Utility and Regulatory Financial Analysts.
This designation is awarded based upon experience and successful completion of
a written examination.
1 Q: 2
3 A:
4
5
6 Q: 7
8 A:
9
10
11
12
13
Appendix BEL-I Cause No. 44891
Page 2 of2
Have you previously testified before the Indiana Utility Regulatory Commission?
Yes. I have previously testified before this Commission addressing economic and
financial issues over the past fifteen years, including rate cases in which I testified
on cost of common equity.
Please describe the review and analysis you conducted in order to prepare your testimony.
I reviewed OVG's Petition, Case-in-Chief and exhibits, prepared data requests,
and reviewed Petitioner's responses. I researched Petitioner's previous rate case
from 2012. I participated in several meetings of the OUCC Case Team in this
Cause. I also researched economic data and analysis from government and
authoritative private sector sources. I used the results of this research to run my
cost of equity models and support my analyses.
Regulatory Research Associates
RRA is an offering of S&P Global Market Intelligence
Attachment BEL-1 Cause No. 44891
Page 1 of13
January 18, 2017
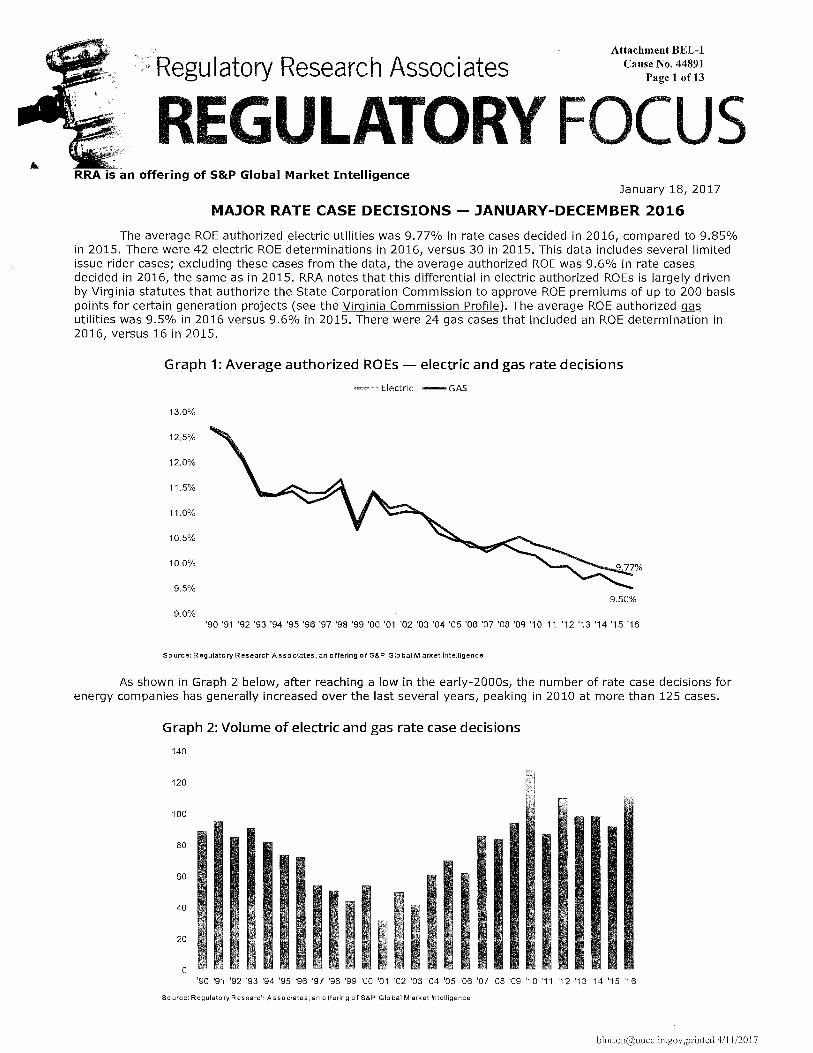
MAJOR RATE CASE DECISIONS - JANUARY-DECEMBER 2016
The average ROE authorized electric utilities was 9.77% in rate cases decided in 2016, compared to 9.85% in 2015. There were 42 electric ROE determinations in 2016, versus 30 in 2015. This data includes several limited issue rider cases; excluding these cases from the data, the average authorized ROE was 9.6% in rate cases decided in 2016, the same as in 2015. RRA notes that this differential in electric authorized ROEs is largely driven by Virginia statutes that authorize the State Corporation Commission to approve ROE premiums of up to 200 basis points for certain generation projects (see the Virginia Commission Profile). The average ROE authorized~ utilities was 9.5% in 2016 versus 9.6% in 2015. There were 24 gas cases that included an ROE determination in 2016, versus 16 in 2015.
Graph 1: Average authorized RO Es - electric and gas rate decisions
.~,•M Electric -GAS
13.0%
12.5%
12.0%
11.5%
11.0%
10.5%
10.0%
9.5% 9.50%
9.0% '90 '91 '92 '93 '94 '95 '96 '97 '98 '99 '00 '01 '02 '03 '04 '05 '06 '07 '08 '09 '10 11 '12 '13 '14 '15 '16
Source: Regulatory Research Associates, an offering of S&P Global Mark et Intelligence
As shown in Graph 2 below, after reaching a low in the early-2000s, the number of rate case decisions for energy companies has generally increased over the last several years, peaking in 2010 at more than 125 cases.
Graph 2: Volume of electric and gas rate case decisions
140
120
100
80
60
·1· ¥ "
I 11.••.1. I 1·~. I••· ~, I~
40
20
0 '90 '91 '92 '93 '94 '95 '96 '97 '98 '99 '00 '01 '02 '03 '04 '05 '06 '07 '08 '09 '10 '11 '12 '13 '14 '15 '16
Source: Regulatory Research Associates, an offering of S&P Gia bal Mark et Intelligence
[email protected];piinted 4/11/2017
Attachment BEL-1 Cause No. 44891
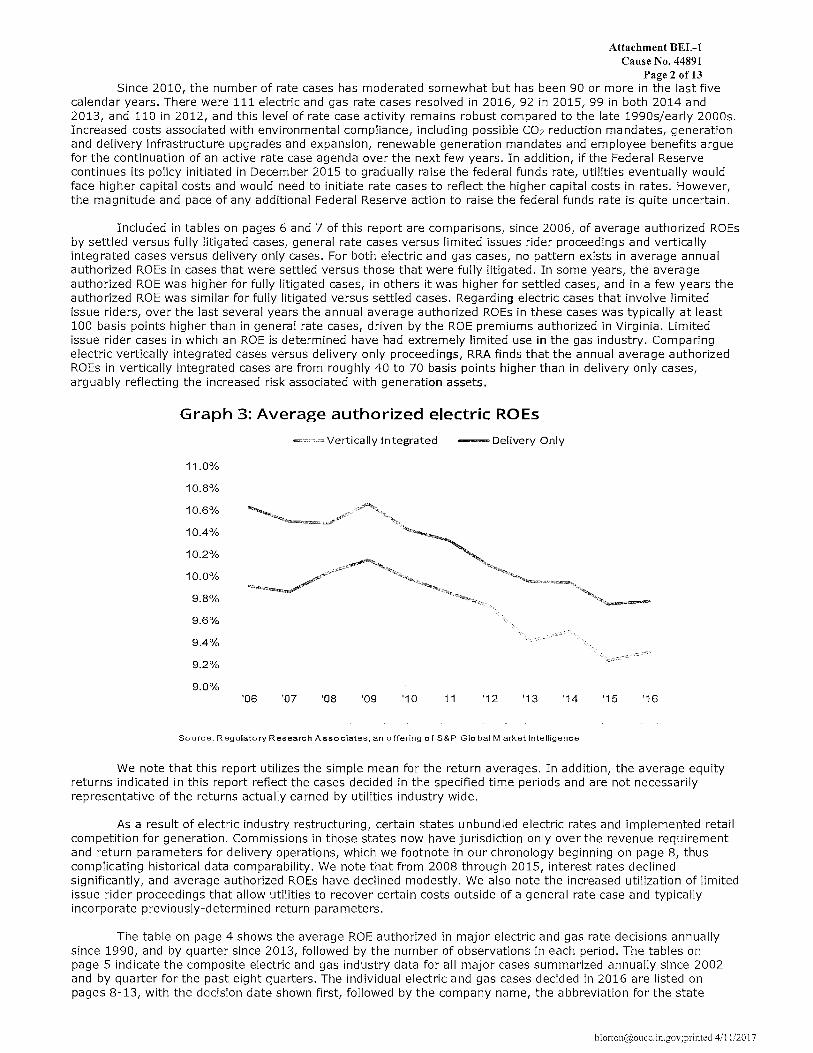
Page 2 of13 Since 2010, the number of rate cases has moderated somewhat but has been 90 or more in the last five
calendar years. There were 111 electric and gas rate cases resolved in 2016, 92 in 2015, 99 in both 2014 and 2013, and 110 in 2012, and this level of rate case activity remains robust compared to the late 1990s/early 2000s. Increased costs associated with environmental compliance, including possible C02 reduction mandates, generation and delivery infrastructure upgrades and expansion, renewable generation mandates and employee benefits argue for the continuation of an active rate case agenda over the next few years. In addition, if the Federal Reserve continues its policy initiated in December 2015 to gradually raise the federal funds rafo, utilities eventually would face higher capital costs and would need to initiate rate cases to reflect the higher capital costs in rates. However, the magnitude and pace of any additional Federal Reserve action to raise the federal funds rate is quite uncertain.
Included in tables on pages 6 and 7 of this report are comparisons, since 2006, of average authorized ROEs by settled versus fully litigated cases, general rate cases versus limited issues rider proceedings and vertically integrated cases versus delivery only cases. For both electric and gas cases, no pattern exists in average annual authorized ROEs in cases that were settled versus those that were fully litigated. In some years, the average authorized ROE was higher for fully litigated cases, in others it was higher for settled cases, and in a few years the authorized ROE was similar for fully litigated versus settled cases. Regarding electric cases that involve limited issue riders, over the last several years the annual average authorized ROEs in these cases was typically at least 100 basis points higher than in general rate cases, driven by the ROE premiums authorized in Virginia. Limited issue rider cases in which an ROE is determined have had extremely limited use in the gas industry. Comparing electric vertically integrated cases versus delivery only proceedings, RRA finds that the annual average authorized ROEs in vertically integrated cases are from roughly 40 to 70 basis points higher than in delivery only cases, arguably reflecting the increased risk associated with generation assets.
Graph 3: Average,auth()rized e,!e,~!r!c RO Es
11.0%
;10.8%
' 110.6%
.10.4%
.10.2%
!10.0%
9.8%
9.6%
9.4%
9.2%
9.0% '06
-Vertically Integrated -Delivery Only
'07 '08 '09 '10 11 '12 '13 '14
Source: Regulatory Research A~~~·biates, an offering of S&P Gia bal Mark et Intelligence
'15 '16
We note that this report utilizes the simple mean for the return averages. In addition, the average equity returns indicated in this report reflect the cases decided in the specified time periods and are not necessarily representative of the returns actually earned by utilities industry wide.
As a result of electric industry restructuring, certain states unbundled electric rates and implemented retail competition for generation. Commissions in those states now have jurisdiction only over the revenue requirement and return parameters for delivery operations, which we footnote in our chronology beginning on page 8, thus complicating historical data comparability. We note that from 2008 through 2015, interest rates declined significantly, and average authorized ROEs have declined modestly. We also note the increased utilization of limited issue rider proceedings that allow utilities to recover certain costs outside of a general rate case and typically incorporate previously-determined return parameters.
The table on page 4 shows the average ROE authorized in major electric and gas rate decisions annually since 1990, and by quarter since 2013, followed by the number of observations in each period. The tables on page 5 indicate the composite electric and gas industry data for all major cases summarized annually since 2002 and by quarter for the past eight quarters. The individual electric and gas cases decided in 2016 are listed on pages 8-13, with the decision date shown first, followed by the company name, the abbreviation for the state
[email protected];p1inted 4/11/2017
Attachment BEL-1 Cause No. 44891
Page 3 of13 issuing the decision, the authorized rate of return, or ROR, ROE, and percentage of common equity in the adopted capital structure. Next we indicate the month and year in which the adopted test year ended, whether the commission utilized an average or a year-end rate base, and the amount of the permanent rate change authorized. The dollar amounts represent the permanent rate change ordered at the time decisions were rendered. Fuel adjustment clause rate changes are not reflected in this study.
The table below tracks tlie average equity return authorized for all electric and gas rate cases combined, by year, for the last 27 years. As the table indicates, since 1990 authorized ROEs have generally trended downward, reflecting the significant decline in interest rates and capital costs that has occurred over this time frame. The combined average equity returns authorized for electric and gas utilities in each of the years 1990 through 2016, and the number of observations for each year are as follows:
Composite Electric and Gas Average Annual Authorized ROEs: 1990-2016
Average Average
Year ROE(%) Observations Year ROE(%) Observations
1990 12.69 (75) 2004 10.67 (39)
1991 12.51 (80) 2005 10.50 (55)
1992 12.06 (77) 2006 10.39 (42)
1993 11.37 (77) 2007 10.30 (76)
1994 11.34 (59) 2008 10.42 (67)
1995 11.51 (49) 2009 10.36 (68)
1996 11.29 (42) 10;;i8 (100)
1997 11.34 (24) 2011 10.21 (59)
2011·, "'"·"-''
1998 11.59 (20) ·•··> .10.08 (93)
1999 10.74 (29) 2013 9.92 (71)
2000 11.41 (24) 2!)14 :9.86 (63)
2001 11.05 (25) 2015 9.76 (46)
2002 11.10 (43) .. <'2<l16 9.67 (66)
2003 10.98 (47)
Source: Regulatory Research Associates, ah offering of S&P Global Market lnteniience
Please Note: Historical data provided in this report may not match data provided on RRA 's website due to certain differences in presentation, including the treatment of cases that were withdrawn or dismissed.
Dennis Sperduto
©2017, Regulatory Research Associates, Inc., an offering of S&P Global Market Intelligence. All Rights Reserved. Confidential Subject Matter. WARNING! This report contains copyrighted subject matter and confidential information owned solely by Regulatory Research Associates, Inc. ("RRA"). Reproduction, distribution or use of this report in violation of this license constitutes copyright infringement in violation of federal and state law. RRA hereby provides consent to use the "email this story" feature to redistribute articles within the subscriber's company. Although the information in this report has been obtained from sources that RRA believes to be reliable, RRA does not guarantee its accuracy.
[email protected];printed 411112017
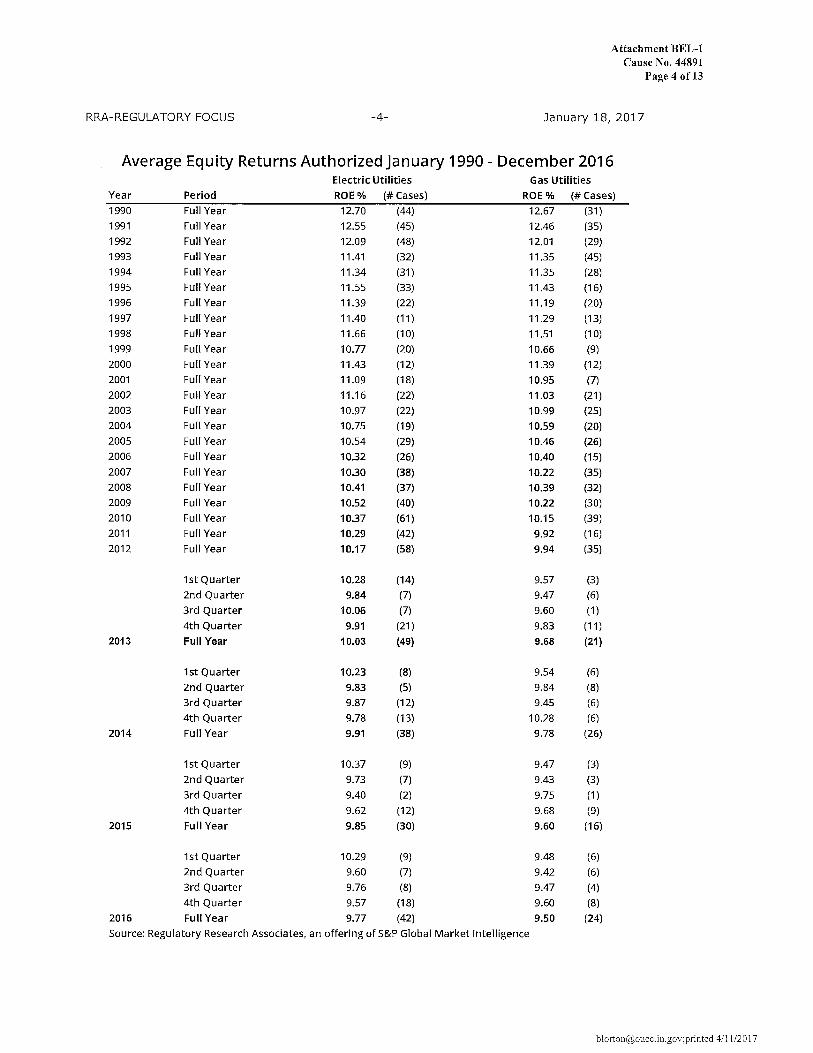
Attachment BEL-1 Cause No. 44891
Page 4 of13
RRA-REGULATORY FOCUS -4- January 18, 2017
__ Aver.age EquityReturns AuthorizedJanuary 1990- December 2016 Electric Utilities Gas Utilities
Year Period ROE% (#Cases) ROE% (#Cases)
1990 Full Year 12.70 (44) 12.67 (31)
1991 Full Year 12.55 (45) 12.46 (35)
1992 Full Year 12.09 (48) 12.01 (29)
1993 Full Year 11.41 (32) 11.35 (45)
1994 Full Year 11.34 (31) 11.35 (28)
1995 Full Year 11.55 (33) 11.43 (16)
1996 Full Year 11.39 (22) 11.19 (20)
1997 Full Year 11.40 (11) 11.29 (13)
1998 Full Year 11.66 (10) 11.51 (10)
1999 Full Year 10.77 (20) 10.66 (9)
2000 Full Year 11.43 (12) 11.39 (12)
2001 Full Year 11.09 (18) 10.95 (7)
2002 Full Year 11.16 (22) 11.03 (21)
2003 Full Year 10.97 (22) 10.99 (25)
2004 Full Year 10.75 (19) 10.59 ; J20)
2005 Full Year 10.54 (29) 10.46 (26)
2006 Full Year 10.32 (~6,~ . 10.4oc:i' (15), .,,.:\'
·2007 Full Year 10.30 (38) 10.22 (35)
2008 Full Year 10.41 .,:(32) 2009 Full Year 10.52 (40) 10.22 (30)
2010 Full Year tg,~'7 ... .J~1) 10.15c (39) 1 ~-~,
2011 Full Year 10.29 (42) 9.92 (16)
2012 Full Year 'foj9 css) 9.94 (35)
1st Quarter 10.28 (14) 9.57 (3)
2nd Quarter 9.84 (7) 9.47 (6)
3rd Quarter 10.06 (7) 9.60 (1)
4th Quarter 9.91 (21) 9.83 (11)
2013 Full Year 10.03 (49) 9.68 (21)
1st Quarter 10.23 (8) 9.54 (6)
2nd Quarter 9.83 (5) 9.84 (8)
3rd Quarter 9.87 (12) 9.45 (6)
4th Quarter 9.78 (13) 10.28 (6)
2014 Full Year 9.91 (38) 9.78 (26)
1st Quarter 10.37 (9) 9.47 (3)
2nd Quarter 9.73 (7) 9.43 (3)
3rd Quarter 9.40 (2) 9.75 (1)
4th Quarter 9.62 (12) 9.68 (9)
2015 Full Year 9.85 (30) 9.60 (16)
1st Quarter 10.29 (9) 9.48 (6)
2nd Quarter 9.60 (7) 9.42 (6)
3rd Quarter 9.76 (8) 9.47 (4)
4th Quarter 9.57 (18) 9.60 (8)
2016 Full Year 9.77 (42) 9.50 (24)
Source: Regulatory Research Associates, an offering of S&P Global Market Intelligence
[email protected];printed 4/11/2017
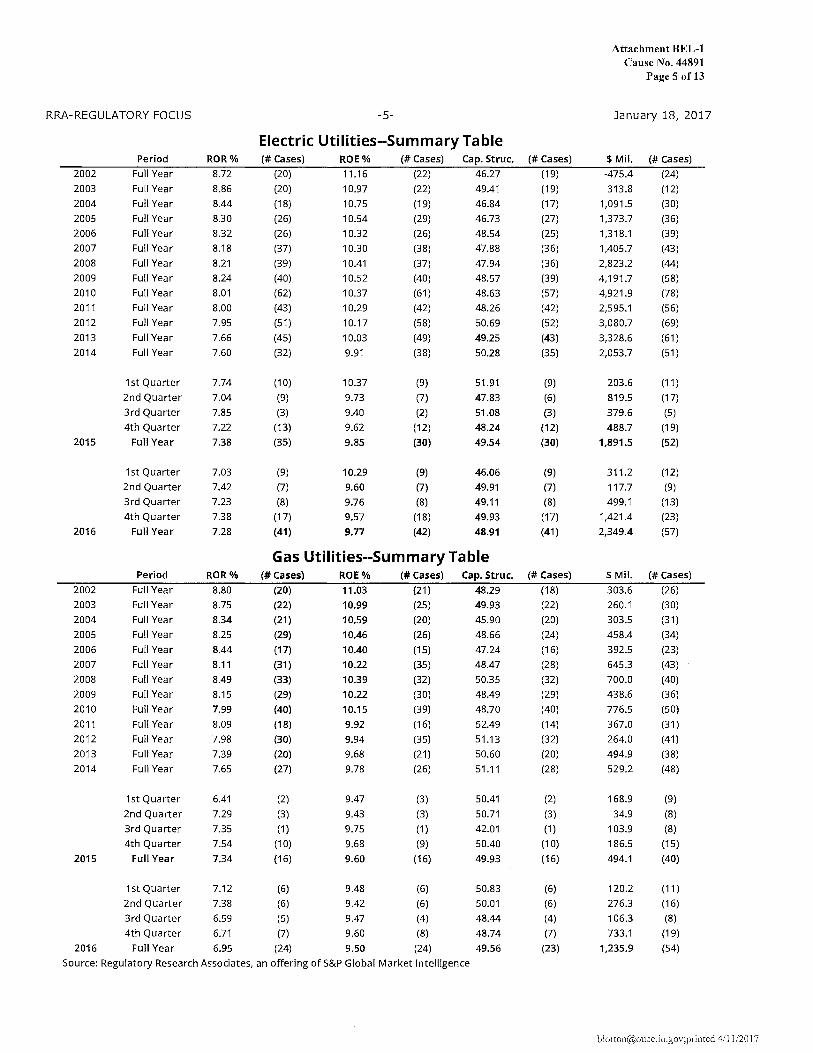
RRA-REGULATORY FOCUS
2002
2003
2004
2005
2006
2007
2008
2009
2010
2011
2012
2013
2014
2015
2016
2002
2003
2004
2005
2006
2007
2008
2009
2010
2011
2012
2013
2014
2015
2016
Period
Full Year
Full Year
Full Year
Full Year
Full Year
Full Year
Full Year
Full Year
Full Year
Full Year
Full Year
Full Year
Full Year
1st Quarter
2nd Quarter
3rd Quarter
4th Quarter
Full Year
1st Quarter
2nd Quarter
3rd Quarter
4th Quarter
Full Year
Period
Full Year
Full Year
Full Year
Full Year
Full Year
Full Year
Full Year
Full Year
Full Year
Full Year
Full Year
Full Year
Full Year
1st Quarter
2nd Quarter
3rd Quarter
4th Quarter
Full Year
1st Quarter
2nd Quarter
3rd Quarter
4th Quarter
Full Year
ROR%
8.72
8.86
8.44
8.30
8.32
8.18
8.21
8.24
8.01
8.00
7.95
7.66
7.60
7.74
7.04
7.85
7.22
7.38
7.03
7.42
7.23
7.38
7.28
ROR%
8.80
8.75
8.34
8.25
8.44
8.11
8.49
8.15
7.99
8.09
7.98
7.39
7.65
6.41
7.29
7.35
7.54
7.34
7.12
7.38
6.59
6.71
6.95
-S-
Eiectric Utilities--Summary Table (#Cases)
(20)
(20)
(18)
(26)
(26)
(37)
(39)
(40)
(62)
(43)
(51)
(45)
(32)
(10)
(9)
(3)
(13)
(35)
(9)
(7)
(8)
(17)
(41)
ROE%
11.16
10.97
10.75
10.54
10.32
10.30
10.41
10.52
10.37
10.29
10.17
10.03
9.91
10.37
9.73
9.40
9.62
9.85
10.29
9.60
9.76
9.57
9.77
(#Cases)
(22)
(22)
(19)
(29)
(26)
(38)
(37)
(40)
(61)
(42)
(58)
(49)
(38)
(9)
(7)
(2)
(12)
(30)
(9)
(7)
(8)
(18)
(42)
Cap. Struc.
46.27
49.41
46.84
46.73
48.54
47.88
47.94
48.57
48.63
48.26
50.69
49.25
50.28
51.91
47.83
51.08
48.24
49.54
46.06
49.91
49.11
49.93
48.91
Gas Utilitie~~~um~~ryf~:gfa .~ (#Cases) ROE" . > (# Cases) Cap: ~t~t'.
(20) 11.03 . (21) /11[29
(22) 10.99 (25) 49.93
(21)
(29)
(p)· .. (31)
(33)
(29)
(40j
(18)
(30)
(20)
(27)
(2)
(3)
(1)
(10)
(16)
(6)
(6)
(5)
(7)
(24)
io:s9 10.46
10.~0 10.22
··.10539 10.22
10.15
9.92 ·:··9.94
9.68
9.78
9.47
9.43
9.75
9.68
9.60
9.48
9.42
9.47
9.60
9.50
(20)
(26)
(1S)
(35)
(32)
(30)
(39)
(16)
(35)
(21)
(26)
(3)
(3)
(1)
(9)
(16)
(6)
(6)
(4)
(8)
(24)
45.90
48.66
47.24
48.47
50.35
48.49
48.70
52.49
51.13
50.60
51.11
50.41
50.71
42.01
50.40
49.93
50.83
50.01
48.44
48.74
49.56
Source: Regulatory Research Associates, an offering of S&P Global Market Intelligence
(#Cases)
(19)
(19)
(17)
(27)
(25)
(36)
(36)
(39)
(57)
(42)
(52)
(43)
(35)
(9)
(6)
(3)
(12)
(30)
(9)
(7)
(8)
(17)
(41)
(#Cases)
(18)
(22)
(20)
(24)
(16)
(28)
(32)
(29)
(40)
(14)
(32)
(20)
(28)
(2)
(3)
(1)
(10)
(16)
(6)
(6)
(4)
(7)
(23)
Attachment BEL-1 Cause No. 44891
Page 5 of13
January 18, 2017
$Mil. -475.4
313.8
1,091.5
1,373.7
1,318.1
1,405.7
2,823.2
4,191.7
4,921.9
2,595.1
3,080.7
3,328.6
2,053.7
203.6
819.5
379.6
488.7
1,891.5
311.2
117.7
499.1
1,421.4
2,349.4
$Mil.
303.6
260.1
303.5
458.4
392.5
645.3
700.0
438.6
776.5
367.0
264.0
494.9
529.2
168.9
34.9
103.9
186.5
494.1
120.2
276.3
106.3
733.1
1,235.9
(#Cases)
(24)
(12)
(30)
(36)
(39)
(43)
(44)
(58)
(78)
(56)
(69)
(61)
(51)
(11)
(17)
(5)
(19)
(52)
(12)
(9)
(13)
(23)
(57)
(#Cases)
(26)
(30)
(31)
(34)
(23)
(43)
(40)
(36)
(50)
(31)
(41)
(38)
(48)
(9)
(8)
(8)
(15)
(40)
(11)
(16)
(8)
(19)
(54)
[email protected];p1inted 4/11/2017
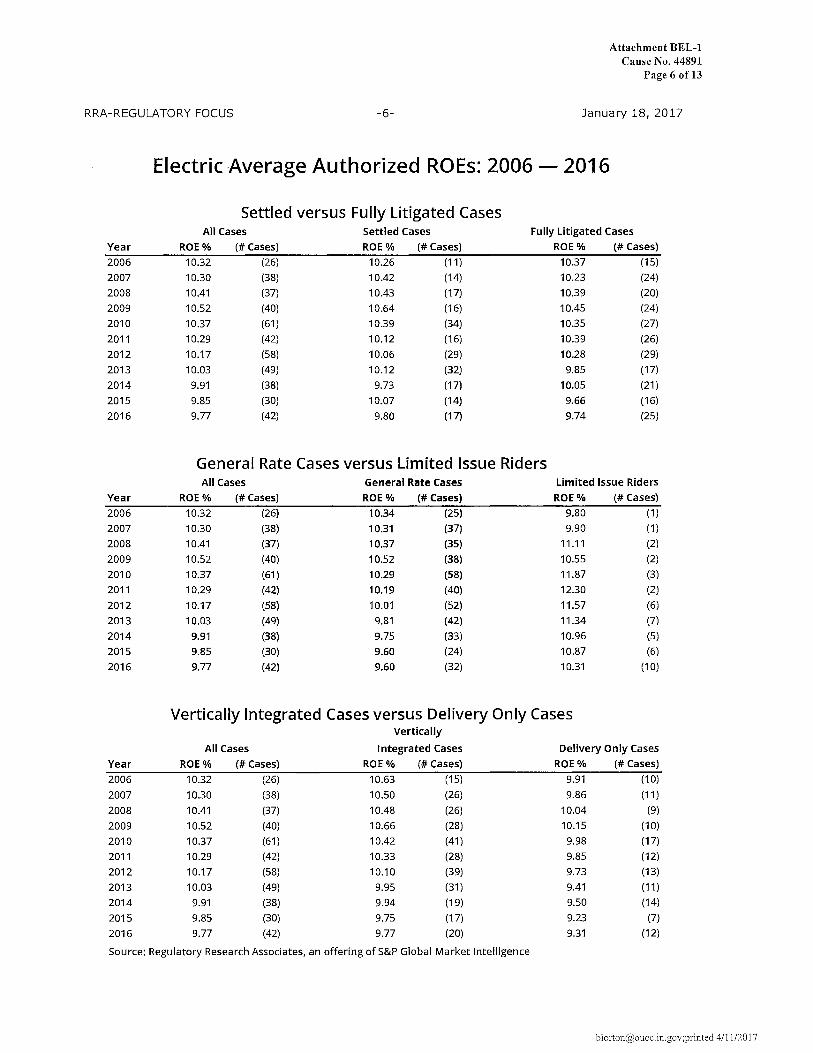
Attachment BEL-1 Cause No. 44891
Page 6 of13
RRA-REGULATORY FOCUS -6- January 18, 2017
Electric-Average Authorized ROEs: 2006-- 2016
Settled versus Fully Litigated Cases All Cases Settled Cases Fully Litigated Cases
Year ROE% (#Cases) ROE% (#Cases) ROE% (#Cases)
2006 10.32 (26) 10.26 (11) 10.37 (15)
2007 10.30 (38) 10.42 (14) 10.23 (24)
2008 10.41 (37) 10.43 (17) 10.39 (20)
2009 10.52 (40) 10.64 (16) 10.45 (24)
2010 10.37 (61) 10.39 (34) 10.35 (27)
2011 10.29 (42) 10.12 (16) 10.39 (26)
2012 10.17 (58) 10.06 (29) 10.28 (29)
2013 10.03 (49) 10.12 (32) 9.85 (17)
2014 9.91 (38) 9.73 (17) 10.05 (21)
2015 9.85 (30) 10.07 (14) 9.66 (16)
2016 9.77 (42) 9.80 .cit) .. 9.74 (25)
General Rate Cases versus ite:Ji~6~·RidersP ;{c ,' - ~~\i'.:;'1>1' '~<$
•< .. '· All Cases Genera , ' --~~:,~i:~~~f ,;y:;::'./'.;:~ •·· Limj!ti"d Issue Riders di*'
Year ROE% (#Cases) ROE% RQl;1% (#Cases) 2006 10.32 (26) 10.34
"---- -->~-''~J3§~;5 .. ···'9.80 (1)
2007 10.30 (38) 10.31 (37) 9.90 (1)
2008 10.41 (37) ···10:31 iC~)C 11.11 (2)
2009 10.52 (40) 10.52 (38) 10.55 (2)
2010 10.37 (61) to:29 (58) 11.87 (3)
2011 10.29 (42) 10.19 (40) 12.30 (2)
2012 10.17 (58) 10.01 (5~) 11.57 (6)
2013 10.03 (49) 9.81 (42) 11.34 (7)
2014 9.91 (38) 9.75 (33) 10.96 (5)
2015 9.85 (30) 9.60 (24) 10.87 (6)
2016 9.77 •J4t)· 9.60 (32) 10.31 (10)
Vertically Integrated Ca.ses versus Delivery Only Cases :_~---_\<;,
,~-"-" Vertically
All Cases v-
Integrated Cases Delivery Only Cases ,c;;t:;,''
Year ROE% (#Cases) ROE% (#Cases) ROE% (#Cases)
2006 10.32 (26) 10.63 (15) 9.91 (10)
2007 10.30 (38) 10.50 (26) 9.86 (11)
2008 10.41 (37) 10.48 (26) 10.04 (9)
2009 10.52 (40) 10.66 (28) 10.15 (10)
2010 10.37 (61) 10.42 (41) 9.98 (17)
2011 10.29 (42) 10.33 (28) 9.85 (12)
2012 10.17 (58) 10.10 (39) 9.73 (13)
2013 10.03 (49) 9.95 (31) 9.41 (11)
2014 9.91 (38) 9.94 (19) 9.50 (14)
2015 9.85 (30) 9.75 (17) 9.23 (7)
2016 9.77 (42) 9.77 (20) 9.31 (12)
Source: Regulatory Research Associates, an offering of S&P Global Market Intelligence
[email protected];printed 4/11/2017
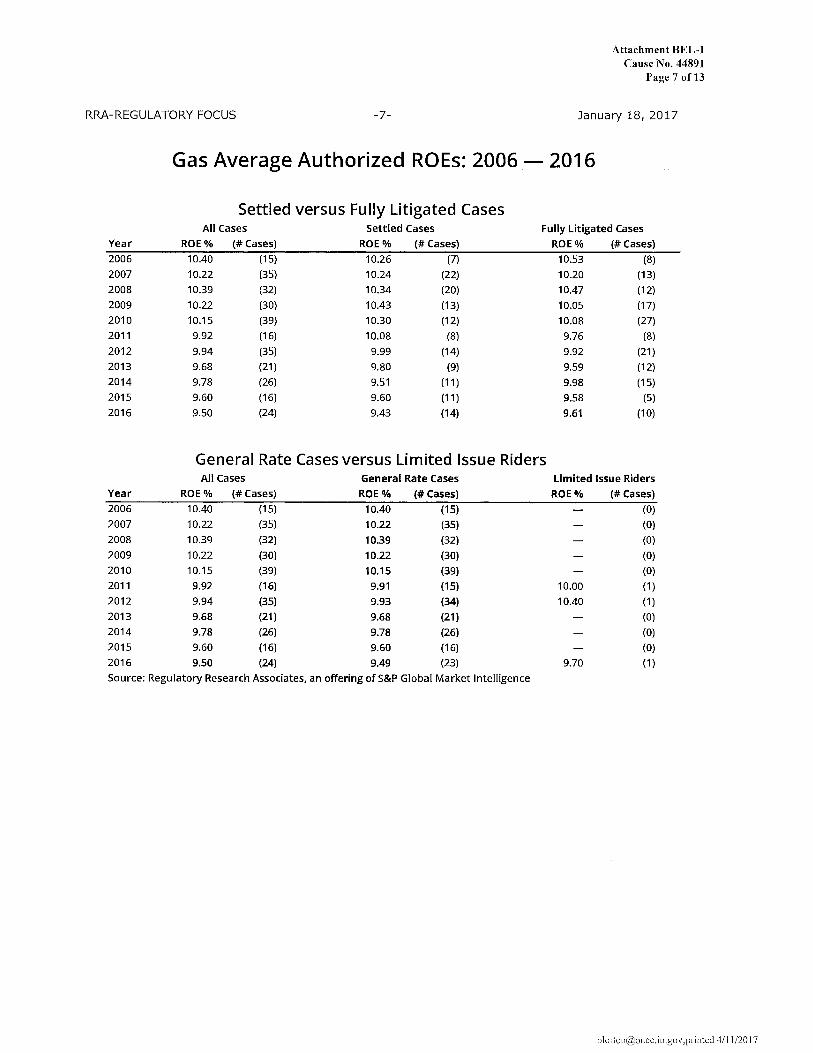
RRA-REGULATORY FOCUS -7-
Attachment BEL-1 Cause No. 44891
Page 7 of13
January 18, 2017
Gas Average Authorized ROEs: 2006 .- 2016
Settled versus Fully Litigated Cases All Cases Settled Cases Fully Litigated Cases
Year ROE% (#Cases) ROE% (#Cases) ROE% (#Cases) 2006 10.40 (15) 10.26 (7) 10.53 (8)
2007 10.22 (35) 10.24 (22) 10.20 (13)
2008 10.39 (32) 10.34 (20) 10.47 (12)
2009 10.22 (30) 10.43 (13) 10.05 (17)
2010 10.15 (39) 10.30 (12) 10.08 (27)
2011 9.92 (16) 10.08 (8) 9.76 (8)
2012 9.94 (35) 9.99 (14) 9.92 (21)
2013 9.68 (21) 9.80 (9) 9.59 (12)
2014 9.78 (26) 9.51 (11) 9.98 (15)
2015 9.60 (16) 9.60 (11) 9.58 (5)
2016 9.50 (24) 9.43 (14) 9.61 (10)
General Rate Cases versus Limited Issue Riders All Cases General Rate Cases Limited Issue Riders
Year ROE o/o (#Cases) ROE o/o (#Cases) ROE% (#Cases)
2006 10.40 (15) 10.40 (15) (0)
2007 10.22 (35) 10.22 (35) (0)
2008 10.39 (32) 10.39 (32) (0)
2009 10.22 (30) 10.22 (30) (0)
2010 10.15 (39) 10.15 (39) (0)
2011 9.92 (16) 9.91 (15) 10.00 (1)
2012 9.94 (35) 9.93 (34) 10.40 (1)
2013 9.68 (21) 9.68 (21) (0)
2014 9.78 (26) 9.78 (26) (0)
2015 9.60 (16) 9.60 (16) (0)
2016 9.50 (24) 9.49 (23) 9.70 (1)
Source: Regulatory Research Associates, an offering of S&P Global Market Intelligence
[email protected];p1inted 4/11/2017
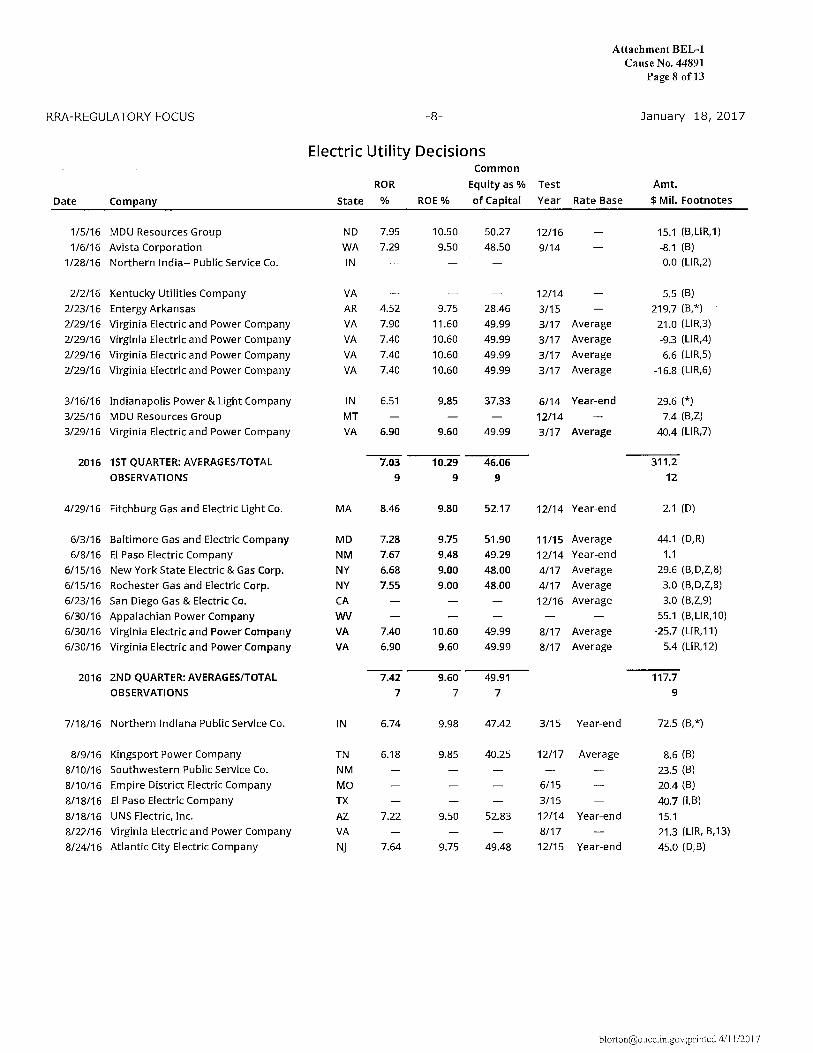
Attachment BEL-1 Cause No. 44891
Page 8 ofl3
RRA-REGULATORY FOCUS -8- January 18, 2017
Electric Utility Decisions Common·
ROR Equity as o/o Test Amt.
Date Company State o/o ROE o/o of Capital Year Rate Base $Mil. Footnotes
1/5/16 MDU Resources Group ND 7.95 10.50 50.27 12116 15.1 (B,LIR,1)
1/6/16 Avista Corporation WA 7.29 9.50 48.50 9/14 -8.1 (B)
1/28/16 Northern India-- Public Service Co. IN 0.0 (LIR,2)
2/2/16 Kentucky Utilities Company VA 12/14 5.5 (B)
2123/16 Entergy Arkansas AR 4.52 9.75 28.46 3/15 219.7 (B,*)
2129/16 Virginia Electric and Power Company VA 7.90 11.60 49.99 3/17 Average 21.0 (LIR,3)
2/29/16 Virginia Electric and Power Company VA 7.40 10.60 49.99 3/17 Average -9.3 (LIR,4)
2129/16 Virginia Electric and Power Company VA 7.40 10.60 49.99 3/17 Average 6.6 (LIR,5)
2129/16 Virginia Electric and Power Company VA 7.40 10.60 49.99 3/17 Average -16.8 (LI R,6)
3/16/16 Indianapolis Power & Light Company IN 6.51 6/14 Year-end 29.6 (*)
3/25116 MDU Resources Group MT 12/14 7.4 (B,Z)
3/29/16 Virginia Electric and Power Company VA 6.90 3/17 Av~rage ,o:::,;; 40.4 (LIR,7) ,';i;:,:>:'"'1:_
.•''<
2016 1ST QUARTER: AVERAGES/TOTAL 7.03 10.29 46.06 311.2
OBSERVATIONS 9 g g 12
4/29/16 Fitchburg Gas and Electric Light Co. MA 8.46 9.80 52.17 12/14 Year-end 2.1 (D)
6/3/16 Baltimore Gas and Electric Company MP 'J,f/;2.if "9~75 . ,''51;90 J1115 Average 44.1 (D,R)
6/8/16 El Paso Electric Company r;i~.\ ':7.'li' ··•·;~.Ai '49.2~ 12/14 Year-end 1.1
6/15/16 New York State Electric & Gas Corp. NY \g;6s 9.00 4S;<iif 4/17 Average 29.6 (B,D,Z,8) ')~-- f".'./C .;:- B ,_ '
6/15/16 Rochester Gas and Electric Corp. NY 7~55 9.00 48.00 4/17 Average 3.0 (B,D,Z,8)
6/23/16 San Diego Gas & Electric Co. CA 12/16 Average 3.0 (B,Z,9)
6/30/16 Appalachian Power Company WV 55.1 (B,LIR,10)
6/30/16 Virginia Electric and Power ~~rJlpany ·vA· 7.40 10.60 49.99 8/17 Average -25.7 (LIR,11)
6/30/16 Virginia Electric and Power<;cili1pa~y VA 6.90 9.60 49.99 8117 Average 5.4 (LI R, 12)
" .. ---2016 2ND QUARTER: AVERAGES/TOTAL 7.42 9.60 49.91 117.7
OBSERVATIONS 7 7 7 9
7/18/16 Northern Indiana Public Service Co. IN 6.74 9.98 47.42 3/15 Year-end 72.5 (B,*)
8/9/16 Kingsport Power Company TN 6.18 9.85 40.25 12/17 Average 8.6 (B)
8/10/16 Southwestern Public Service Co. NM 23.5 (B)
8/10/16 Empire District Electric Company MO 6/15 20.4 (B)
8/18/16 El Paso Electric Company TX 3/15 40.7 (l,B)
8/18/16 UNS Electric, Inc. AZ 7.22 9.50 52.83 12/14 Year-end 15.1
8/22/16 Virginia Electric and Power Company VA 8/17 21.3 (LIR, B,13)
8/24/16 Atlantic City Electric Company NJ 7.64 9.75 49.48 12/15 Year-end 45.0 (D,B)
[email protected];piinted 4/11/2017
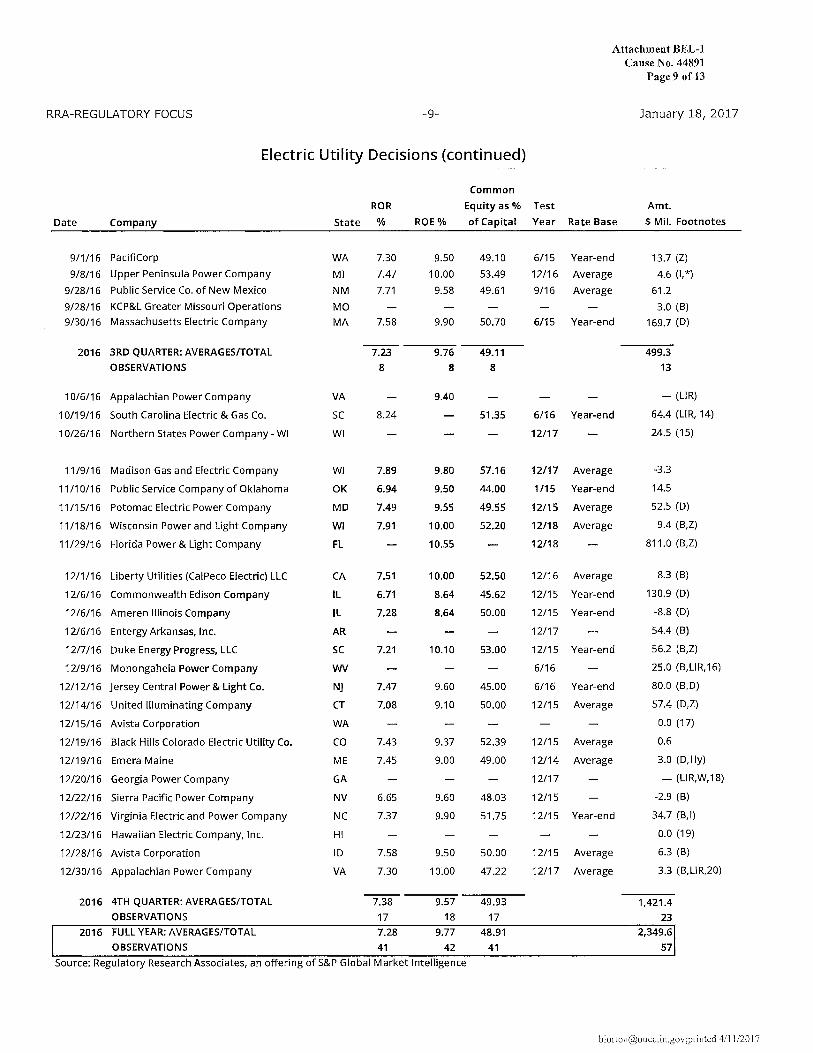
Attachment BEL-1 Cause No. 44891
Page 9 of13
RRA-REGULATORY FOCUS -9- January 18, 2017
Electric Utility Decisions (continued)
Common
ROR Equity as% Test Amt.
Date Company State % ROE o/o of Capital Year Rate Base $ Mil. Footnotes
9/1/16 PacifiCorp WA 7.30 9.50 49.10 6/15 Year-end 13.7 (Z)
9/8/16 Upper Peninsula Power Company Ml 7.47 10.00 53.49 12/16 Average 4.6 (I,*)
9/28/16 Public Service Co. of New Mexico NM 7.71 9.58 49.61 9/16 Average 61.2
9/28/16 KCP&L Greater Missouri Operations MO 3.0 (B)
9/30/16 Massachusetts Electric Company MA 7.58 9.90 50.70 6/15 Year-end 169.7 (D)
2016 3RD QUARTER: AVERAGES/TOTAL 7.23 9.76 49.11 499.3
OBSERVATIONS 8 8 8 13
10/6/16 Appalachian Power Company VA 9.40 - (LIR)
10/19/16 South Carolina Electric & Gas Co. SC 8.24 6/16 Year-end 64.4 (LIR, 14)
10/26116 Northern States Power Company - WI WI 24.5 (15)
11/9/16 Madison Gas and Electric Company WI 7.89 9.80 57.16 12117 Average -3.3
11/10/16 Public Service Company of Oklahoma OK 6.94 9.50 44.00 1/15 Year-end 14.5
11/15/16 Potomac Electric Power Company MD 7.49 9.55 49.55 12/15 Average 52.5 (D)
11/18/16 Wisconsin Power and Light Company WI 7.91 10.00 52.20 12/18 Average 9.4 (B,Z)
11/29/16 Florida Power & Light Company FL 10.55 12/18 811.0 (B,Z)
',,,
~2:'6ri 12/1/16 Liberty Utilities (CalPeco Electric) LLC CA ···.1~~1 10.00 12/16 Average 8.3 (B) '>'<:-?,,/'"
'45.62 12/6/16 Commonwealth Edison Company IL 5;71 8.64 12/15 Year-end 130.9 (D)
12/6/16 Ameren Illinois Company IL 7.28 8.64" 50.00 12115 Year-end -8.8 (D)
12/6/16 Entergy Arkansas, Inc. 'AR' 12/17 54.4 (B)
1217116 Duke Energy Progress, LLC SC 53.00 12/15 Year-end 56.2 (B,Z)
12/9/16 Monongahela Power Comparlf)f'. ~',;, 6/16 25.0 (B,LIR, 16)
12/12/16 Jersey Central Power & Light Co. NJ 7..47 9.60 45.00 6/16 Year-end 80.0 (B,D)
12/14/16 United Illuminating Company CT ·. 7.08 9.10 50.00 12/15 Average 57.4 (D,Z)
12/15/16 Avista Corporation Wlfi 0.0 (17) :itJ{
12/19/16 Black Hills Colorado Electric Utility Co. ;'.CO 7.43 9.37 52.39 12/15 Average 0.6
12/19/16 Emera Maine ME 7.45 9.00 49.00 12/14 Average 3.0 (D,Hy)
12/20/16 Georgia Power Company GA 12/17 - (LIR,W,18)
12122/16 Sierra Pacific Power Company NV 6.65 9.60 48.03 12/15 -2.9 (B)
12/22116 Virginia Electric and Power Company NC 7.37 9.90 51.75 12/15 Year-end 34.7 (B,I)
12/23/16 Hawaiian Electric Company, Inc. HI 0.0 (19)
12/28/16 Avista Corporation ID 7.58 9.50 50.00 12/15 Average 6.3 (B)
12/30/16 Appalachian Power Company VA 7.30 10~00 47.22 12/17 Average 3.3 (B,LIR,20)
2016 4TH QUARTER: AVERAGES/TOTAL 7.38 9.57 49.93 1,421.4 OBSERVATIONS 17 18 17 23
2016 FULL YEAR: AVERAGES/TOTAL 7.28 9.77 48.91 2,349.6
OBSERVATIONS 41 42 41 57
Source: Regulatory Research Associates, an offering of S&P Global Market Intelligence
[email protected];p1inted 4/11/2017
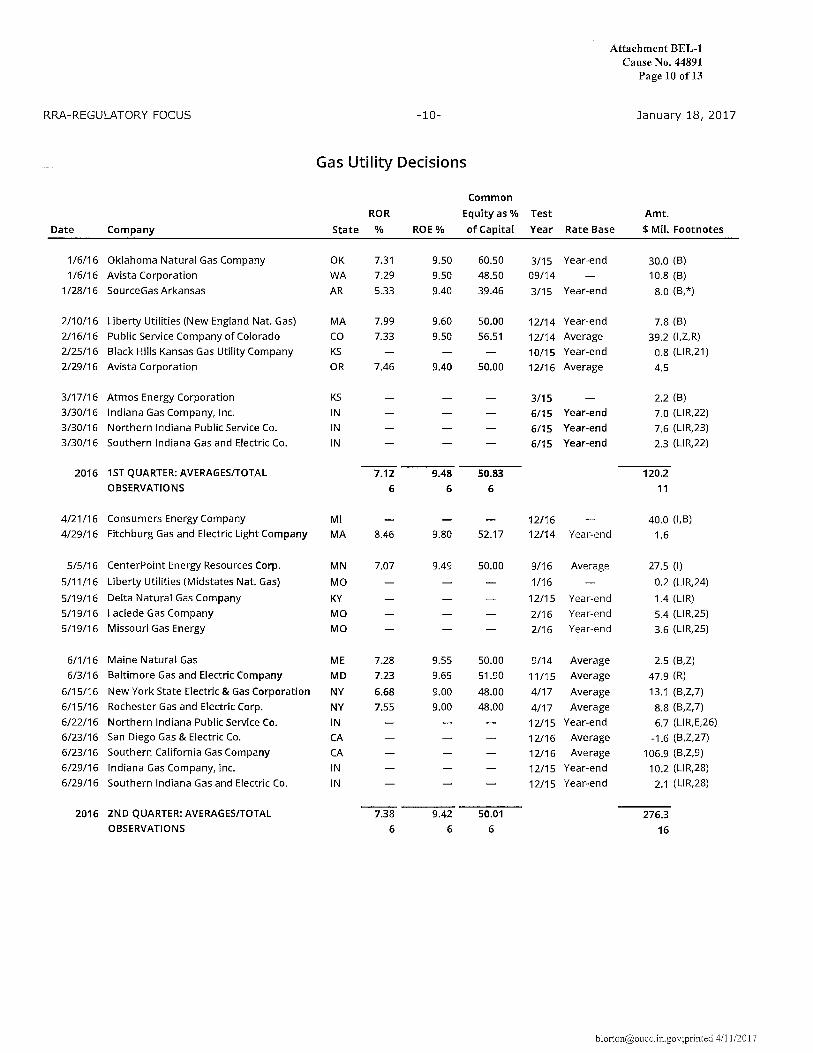
Attachment BEL-1 Cause No. 44891
Page 10 of13
RRA-REGULATORY FOCUS -10- January 18, 2017
Gas Utility Decisions ___
Common
ROR Equity as% Test Amt.
Date Company State % ROE% of Capital Year Rate Base $ Mil. Footnotes
1/6/16 Oklahoma Natural Gas Company OK 7.31 9.50 60.50 3/15 Year-end 30.0 (8) 1/6/16 Avista Corporation WA 7.29 9.50 48.50 09/14 10.8 (8)
1/28/16 SourceGas Arkansas AR 5.33 9.40 39.46 3/15 Year-end 8.0 (8,*)
2/10/16 Liberty Utilities (New England Nat. Gas) MA 7.99 9.60 50.00 12/14 Year-end 7.8 (8) 2/16/16 Public Service Company of Colorado co 7.33 9.50 56.51 12/14 Average 39.2 (l,Z,R) 2/25/16 Black Hills Kansas Gas Utility Company KS 10/15 Year-end 0.8 (LIR,21)
2/29/16 Avista Corporation OR 7.46 9.40 50.00 12/16 Average 4.5
3/17/16 Atmos Energy Corporation KS 3/15 2.2 (B) 3/30/16 Indiana Gas Company, Inc. IN 6115 Year-end 7.0 (LIR,22)
3/30/16 Northern Indiana Public Service Co. IN 6/15 Y~ar-end 7.6 (LIR,23)
3/30/16 Southern Indiana Gas and Electric Co. IN 6/15 2.3 (LIR,22) /~c' '" :' <',:: ---· 2016 1ST QUARTER: AVERAGES/TOTAL 7.12 9.48 120.2
OBSERVATIONS 6 6 6 11
4/21/16 Consumers Energy Company Ml···· '"-' 12116 40.0 (1,8)
4/29/16 Fitchburg Gas and Electric Light Company rVIA\ ·.~~;~tj·· 1?11'4 Year-end 1.6
5/5/16 CenterPoint Energy Resources Corp. MN 7.07 9.49 50.00 9/16 Average 27.5 (I)
5/11/16 Liberty Utilities (Midstates Nat. Gas) MO 1/16 0.2 (LIR,24)
5/19/16 Delta Natural Gas Company KY 12/15 Year-end 1.4 (LIR)
5/19/16 Laclede Gas Company MO 2/16 Year-end 5.4 (LIR,25)
5/19/16 Missouri Gas Energy MO 2/16 Year-end 3.6 (LIR,25)
6/1/16 Maine Natural Gas ME 7.28 9.55 50.00 9114 Average 2.5 (8,Z)
6/3/16 Baltimore Gas and Electric c~hl~~~y MD··· 7.23 . 9.65 51.90 11/15 Average 47.9 (R) ,'':','""''
6/15/16 New York State Electric & Gas Corporation ·~Y 6 .• 68 9.00 48.00 4/17 Average 13.1 (B,Z, 7)
6/15116 Rochester Gas and Electric Corp. NY 7.55 9.00 48.00 4/17 Average 8.8 (B,Z,7)
6/22116 Northern Indiana Public Service Co. IN ~>
12/15 Year-end 6. 7 (LI R, E,26)
6/23/16 San Diego Gas & Electric Co. Al( 12/16 Average -1.6 (8,Z,27)
6/23/16 Southern California Gas Company '~ ,i:::;, 'CA 12/16 Average 106.9 (8,Z,9)
6/29/16 Indiana Gas Company, Inc. IN 12/15 Year-end 10.2 (LIR,28)
6/29/16 Southern Indiana Gas and Electric Co. IN 12/15 Year-end 2.1 (LI R,28)
2016 2ND QUARTER: AVERAGES/TOTAL 7.38 9.42 50.01 276.3 OBSERVATIONS 6 6 6 16
[email protected];printed 4/11/2017
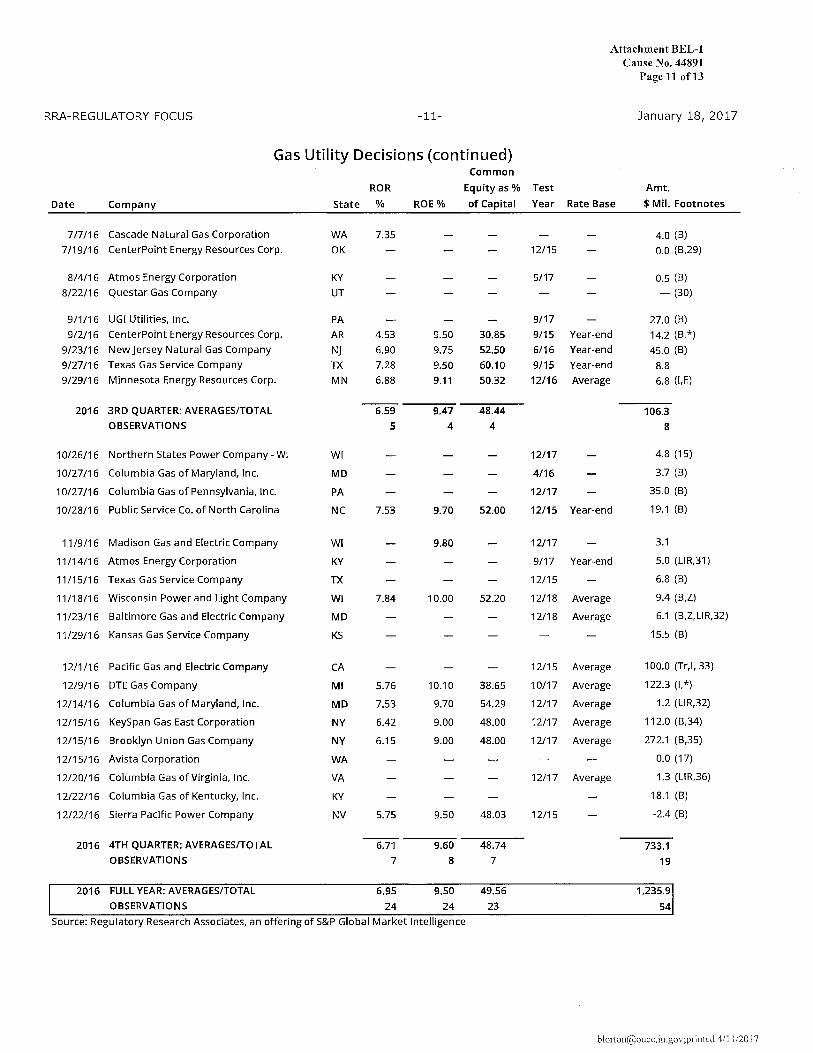
Attachment BEL-1 Cause No. 44891
Page 11 of13
RRA-REGULATORY FOCUS -11- January 18, 2017
Gas Utility Decisions (continued) Common
ROR Equity as% Test Amt.
Date Company .State % ROE o/o of Capital Year Rate Base $ Mil. Footnotes
1n116 Cascade Natural Gas Corporation WA 7.35 4.0 (B)
7/19/16 CenterPoint Energy Resources Corp. OK 12/15 0.0 (B,29)
8/4/16 Atmos Energy Corporation KY 5/17 0.5 (B)
8/22/16 Questar Gas Company UT - (30)
9/1/16 UGI Utilities, Inc. PA 9117 27.0 (B)
9/2/16 CenterPoint Energy Resources Corp. AR 4.53 9.50 30.85 9/15 Year-end 14.2 (B,*)
9/23/16 New jersey Natural Gas Company NJ 6.90 9.75 52.50 6/16 Year-end 45.0 (B)
9/27/16 Texas Gas Service Company TX 7.28 9.50 60.10 9115 Year-end 8.8 9/29/16 Minnesota Energy Resources Corp. MN 6.88 9.11 50.32 12/16 Average 6.8 (l,E)
2016 3RD QUARTER: AVERAGES/TOTAL 6.59 9.47 48.44 106.3 OBSERVATIONS 5 4 4 8
10/26/16 Northern States Power Company- WI 4.8 (15)
10/27/16 Columbia Gas of Maryland, Inc. 3.7 (B)
10/27/16 Columbia Gas of Pennsylvania, Inc. 35.0 (B)
10/28116 Public Service Co. of North Carolina 19.1 (B)
11/9/16 Madison Gas and Electric Company WI 9.80 12/17 3.1
11/14/16 Atmos Energy Corporation KY 9/17 Year-end 5.0 (LIR,31)
11/15/16 Texas Gas Service Company TX 12/15 6.8 (B)
11/18/16 Wisconsin Power and Light Company WI 7.84 10.00 52.20 12/18 Average 9.4 (B,Z)
11/23/16 Baltimore Gas and Electric Company MD 12/18 Average 6.1 (B,Z,LIR,32)
11/29/16 Kansas Gas Service Company KS 15.5 (B)
.. 12/1/16 Pacific Gas and Electric Compa~y i · c~.'1' 12/15 Average 100.0 (Tr,I, 33)
12/9/16 DTE Gas Company Mi 5,/7.6 10.10 38.65 10/17 Average 122.3 (I,*)
12/14/16 Columbia Gas of Maryland, Inc. MD 7.53 9.70 54.29 12/17 Average 1.2 (LIR,32)
12/15/16 KeySpan Gas East Corporation NY• 6.42 9.00 48.00 12/17 Average 112.0 (B,34)
12/15/16 Brooklyn Union Gas Company z•tiv 6.15 9.00 48.00 12/17 Average 272.1 (B,35)
12/15/16 Avista Corporation ·::/'WA 0.0 (17)
12/20/16 Columbia Gas of Virginia, Inc. VA 12/17 Average 1.3 (LI R,36)
12/22/16 Columbia Gas of Kentucky, Inc. KY 18.1 (B)
12/22/16 Sierra Pacific Power Company NV 5.75 9.50 48.03 12/15 -2.4 (B)
2016 4TH QUARTER: AVERAGES/TOTAL 6.71 9.60 48.74 733.1 OBSERVATIONS 7 8 7 19
2016 FULL YEAR: AVERAGES/TOTAL 6.95 9.50 49.56 1,235.9
OBSERVATIONS 24 24 23 54
Source: Regulatory Research Associates, an offering of S&P Global Market Intelligence
[email protected];piinted 4/11/2017
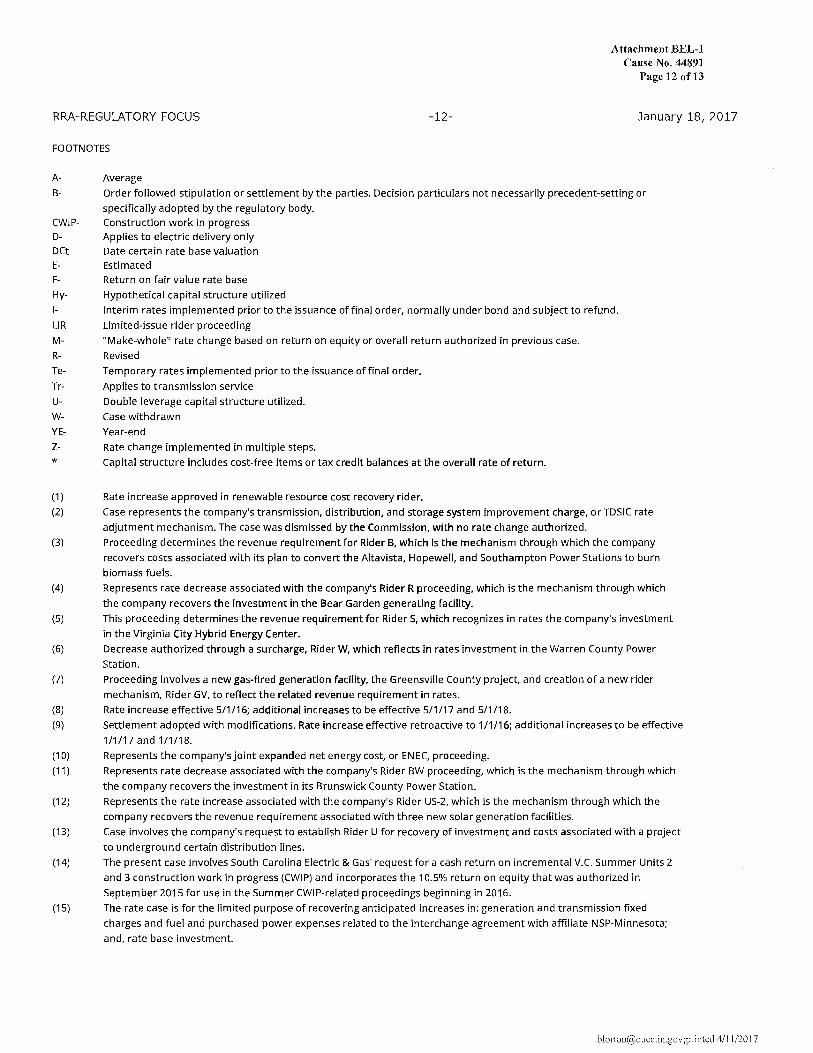
Attachment BEL-1 Cause No. 44891
Page 12 of13
RRA-REGULATORY FOCUS -12- January 18, 2017
FOOTNOTES
A
B-
CWIPD
DCt E-F-
Hy-1-
LIR M-
R-
Te
Tr-
U-
W
YE-Z-
*
(1)
(2)
(3)
Average
Order followed stipulation or settlement by the parties. Decision particulars not necessarily precedent-setting or
specifically adopted by the regulatory body. Construction work in progress Applies to electric delivery only Date certain rate base valuation Estimated Return on fair value rate base
Hypothetical capital structure utilized
Interim rates implemented prior to the issuance of final order, normally under bond and subject to refund.
Limited-issue rider proceeding
"Make-whole" rate change based on return on equity or overall return authorized in previous case.
Revised
Temporary rates implemented prior to the issuance of final order.
Applies to transmission service
Double leverage capital structure utilized.
Case withdrawn
Year-end
Rate change implemented in multiple steps.
Capital structure includes cost-free items or tax credit balances at the overall rate of return.
Rate increase approved in renewable resource cost recovery rider.
Case represents the company's transmission, distribution, and storage system improvement charge, or TDSIC rate
adjutment mechanism. The case was dismissed by the Commission, with no rate change authorized.
Proceeding determines the revenue requirement for Rider B, which is the mechanism through which the company
recovers costs associated with its plan to convert the Altavista, Hopewell, and Southampton Power Stations to burn
biomass fuels.
(4) Represents rate decrease associated with the company's Rider R proceeding, which is the mechanism through which
the company recovers the investment in the Bear Garden generating facility.
(5) This proceeding determines the revenue requirement for Rider S, which recognizes in rates the company's investment
in the Virginia City Hybrid Energy Center.
(6) Decrease authorized through a surcharge, Rider W, which reflects in rates investment in the Warren County Power
Station.
(7) Proceeding involves a new gas-fired generation facility, the Greensville County project, and creation of a new rider
mechanism, Rider GV, to reflect the related revenue requirement in rates.
(8) Rate increase effective 5/1/16; additional increases to be effective 5/1/17 and 5/1 /18.
(9) Settlement adopted with modifications. Rate increase effective retroactive to 1 /1 /16; additional increases to be effective
1/1/17 and 111/18.
(10) Represents the company's joint expanded net energy cost, or ENEC, proceeding.
(11) Represents rate decrease associated with the company's Rider BW proceeding, which· is the mechanism through which
the company recovers the investment in its Brunswick County Power Station.
(12) Represents the rate increase associated with the company's Rider US-2, which is the mechanism through which the
company recovers the revenue requirement associated with three new solar generation facilities.
(13) Case involves the company's request to establish Rider U for recovery of investment and costs associated with a project
to underground certain distribution lines.
(14) The present case involves South Carolina Electric & Gas' request for a cash return on incremental V.C. Summer Units 2
and 3 construction work in progress (CWI P) and incorporates the 10.5% return on equity that was authorized in
September 2015 for use in the Summer CWIP-related proceedings beginning in 2016.
(15) The rate case is for the limited purpose of recovering anticipated increases in: generation and transmission fixed
charges and fuel and purchased power expenses related to the interchange agreement with affiliate NSP-Minnesota;
and, rate base investment.
[email protected];piinted 4/11/2017

RRA-REGULATORY FOCUS -13-
FOOTNOTES (continued)
Attachment BEL-1 Cause No. 44891
Page 13 ofl3
January 18, 2017
(16) Case is a consolidated expanded net energy cost proceeding for Monongahela Power and affiliate Potomac Edison.
(17) Rate increase rejected by commission.
(18) As a result of the commission's adoption of a settlement in another proceeding, the companywithrew its rate increase
request in this proceeding, and no rate change was implemented. (19) No change in base rates was sought by the company, and on 12/23/16, the commission issued an order closing this
docket. (20) Case involves the company's G-RAC rider mechanism that addresses its investment in the Dresden Generating Plant,
and establishes the revenue requirement for the rider to become effective 1/1/17.
(21) Case involves the company's gas system reliabillity surcharge, or GSRS, rider and reflects investments made from July 1, 2014through Oct. 31, 2015.
(22) Case involves company's "compliance and system improvement adjustment" mechanism, and includes compliance
related investments made between Jan. 1 and June 30, 2015, and certain other investments made between July 1, 2014
and June 30, 2015. (23) Case establishes the rates to be charged to customers under the company's transmission, distribution and storage
system improvement charge rate adjustment mechanism, and reflects investments made between July 1, 2014 and
June 30, 2015. (24) Case involves the company's infrastructure system replacement surcharge rider and reflects incremental
investments made from 6/1/15 through 1/31/16.
(25) Case involves the company's infrastructure system replacement surcharge rider and reflects incremental investments made from 9/1 /15 through 2/29/16.
(26) Case establishes the rates to be charged to customers under the company's transmission, distribution and storage
system improvement charge rate adjustment mechanism, and reflects investments made between 7 /1 /15 and 12/31 /15.
(27) Settlement adopted with modifications. Rate decrease effective retroactive to 1/1/16; rate increases to be effective 1/1/17 and 111118.
(28) Case involves company's "compliance and system improvement adjustment" mechanism, and includes compliance
related investments made between 7/1/15 and 12/31/15. (29) Case involves the company's performance based ratemaking plan.
(30) On 8/22/16, the PSC approved the company's petition to withdraw the rate increase request, effectively closing the case.
The request to withdraw the filing comported with provisions of a settlement filed in the Questar/Dominion Resources merger proceeding.
(31) Case is an annual update to the company's pipe replacement program rider. (32) Case involves the company's strategic infrastrucure development and enhancement, or STRIDE, rider.
(33) Case involves the company's gas transmission and storage operations. The decision also authorized attrition rate increases of $246 million for 2016, $64 million for 2017 and $105 million for 2018.
(34) Adopted joint proposal provides for the company to implement a $112 million rate increase effective 1/1/17, a $19.6 million rate increase effective 1/1/18, and a $27 million rate increase effective 1/1/19.
(35) Adopted joint proposal provides for the company to implement a $272.1 million rate increase effective 111/17, a
$41 million rate increase effective 1/1/18, and a $48.9 million rate increase effective 1/1/19. (36) Case involves the company's investments under the Steps to Advance Virginia's Energy Plan.
Dennis Sperduto
[email protected];p1inted 4/11/2017

SECTOR IN-DEPTH 10 MARCH 2015
ANALYST CONT ACTS
Jim Hempstead 212-553-4318 Associate fvtanaging Director [email protected]
Ryan Wobbrock 212-553-7104 A VP-Analyst [email protected]
Jeffrey F. Cassella 212-553-1665 A VP-Analyst [email protected]
Lesley Ritter 212-553-1607 Analyst [email protected]
jairo Chung 212-553-5123 Analyst [email protected]
Natividad Martel 212-553-4561 VP-Senior Analyst [email protected]
Susana Vivares 212-553-4694 VP-Senior Analyst [email protected]
Toby Shea 212-553-1779 VP-Senior Analyst [email protected]
Swami Venkataraman, CFA 212-553-7950 VP-Sr Credit Officer [email protected]
US Regulated Utilities
Lower Authorized Equity Returns Will Not Hurt Near-Term Credit Profiles The credit profiles of US regulated utilities will remain intact over the next few years despite our expectation that regulators will continue to trim the sector's profitability by lowering its authorized returns on equity (ROE). Persistently low interest rates and a comprehensive suite of cost recovery mechanisms ensure a low business risk profile for utilities, prompting regulators to scrutinise their profitability, which is defined as the ratio of net income to book equity. We view cash flow measures as a more important rating driver than authorized ROEs, and we note that regulators can lower authorized ROEs without hurting cash flow, for instance by targeting depreciation, or through special rate structures. Regulators can also adjust a utility's equity capitalization in its rate base. All else being equal, we think most utilities would prefer a thicker equity base and a lower authorized ROE over a small equity layer and a high authorized ROE.
» More timely cost recovery helps offset falling RO Es. Regulators continue to permit a robust suite of mechanisms that enable utilities to recoup prudently incurred operating costs, including capital investments such as environment related or infrastructure hardening expenditures. Strong cost recovery is credit positive because it ensures a stable financial profile. Despite lower authorized ROEs, we see the sector maintaining a ratio of Funds From Operations (FFO) to debt near 20%, a level that continues to support strong investment-grade ratings.
» Utilities' cash flow is somewhat insulated from Lower ROEs. Net income represents about 30% - 40% of utilities' cash flow, so lower authorized returns won't necessarily affect cash flow or key financial credit ratios, especially when the denominator (equity) is rising. Regulators set the equity layer when capitalizing rate base, and the equity layer multiplied by the authorized ROE drives the annual revenue requirements. Across the sector, the ratio of equity to total assets has remained flat in the 30% range since 2007.
» Utilities' actual financial performance remains stable. Earned RO Es, which typically lag authorized ROEs, have not fallen as much as authorized returns in recent years. Since 2007, vertically integrated utilities, transmission and distribution only utilities, and natural gas local distribution companies have maintained steady earned ROE's in the 9% -10% range. Holding companies with primarily regulated businesses also earned ROEs of around 9% -10%, while returns for holding companies with diversified operations, namely unregulated generation, have fallen from 11% (over the past seven year average) to around 9% today.
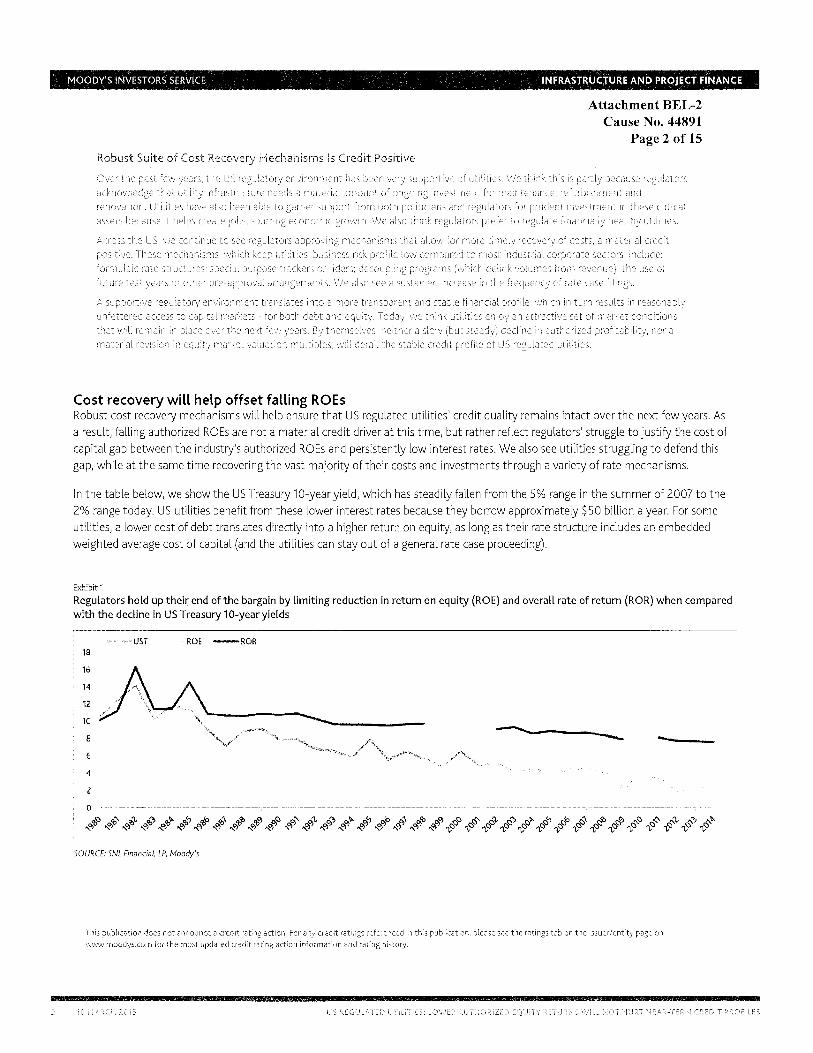
2
MOODY'S INVESTORS SERVICE INFRASTRUCTURE AND PROJECT FINANCE
Robust Suite of Cost Recovery Mechanisms Is Credit Positive
Attachment BEL-2 Cause No. 44891
Page2 of15
Over the past few years, the US regulatory environment has been very supportive of utilities. We think this is partly because regulators acknowledge that utility infrastructure needs a material amount of ongoing investment for maintenance, refurbishment and renovation. Utilities have also been able to garner support from both. politicians and regulators for prudent investment in these critical assets because it helps create jobs, spurring economic growth. We also think regulators prefer to regulate financially healthy utilities.
Across the US, we continue to see regulators approving mechanisms that allow for more timely recovery of costs, a material credit positive. These mechanisms, which keep utilities' business risk profile low compared to most industrial corporate sectors, include: formulaic rate structures; special purpose trackers orriders; decoupling programs (which delink volumes from revenue); the use of future test years or o.ther pre:-approval arrangements. We also see a sustained increase in the frequency Of rate case filings.
A supportive regulatpry environment translates into a more transparent and stable financial profile, which in turn results in reasonably unfettered access to capital markets ~for both debt and equity. Today, we think utilities enjoy an attractive set of market conditions that will remain in ~lace over the next few years. By themselves, neither a. slow (but steady) decline in authorized profitability, nor a material revision in equity market valuation multiples, will d~rail the stable credit profile of US regulated utltities.
Cost recovery will help offset falling RO Es Robust cost recovery mechanisms will help ensure that US regulated utilities' credit quality remains intact over the next few years. As a result, falling authorized ROEs are not a material credit driver at this time, but rather reflect regulators' struggle to justify the cost of capital gap between the industry's authorized RO Es and persistently low interest rates. We also see utilities struggling to defend this gap, while at the same time recovering the vast majority of their costs and investments through a variety of rate mechanisms.
In the table below, we show the US Treasury 10-year yield, which has steadily fallen from the 5% range in the summer of 2007 to the 2% range today. US utilities benefit from these lower interest rates because they borrow approximately $50 billion a year. For some utilities, a lower cost of debt translates directly into a higher return on equity, as long as their rate structure includes an embedded weighted average cost of capital (and the utilities can stay out of a general rate case proceeding).
Exhibit1
Regulators hold up their end of the bargain by limiting reduction in return on equity (ROE} and overall rate of return (ROR} when compared with the decline in US Treasury 10-year yields
18
!,I: 10
8
I 6 ' i 4 ! ! 2
0
-usr ROE -ROR
SOURCE: SNL Financial, LP, Moody's
-----··-,---
This publication does not announce a credit rating action. For any credit ratings referenced in this publication, please see the ratings tab on the issuer/entity page on www.moodys.com for the most updated credit rating action information and rating history.
10 MARCH 2015 US REGULATED UTILITIES: LOWER AUTHORIZED EQUITY RETURNS WILL NOT HURT NEAR-TERM CREDIT PROFILES
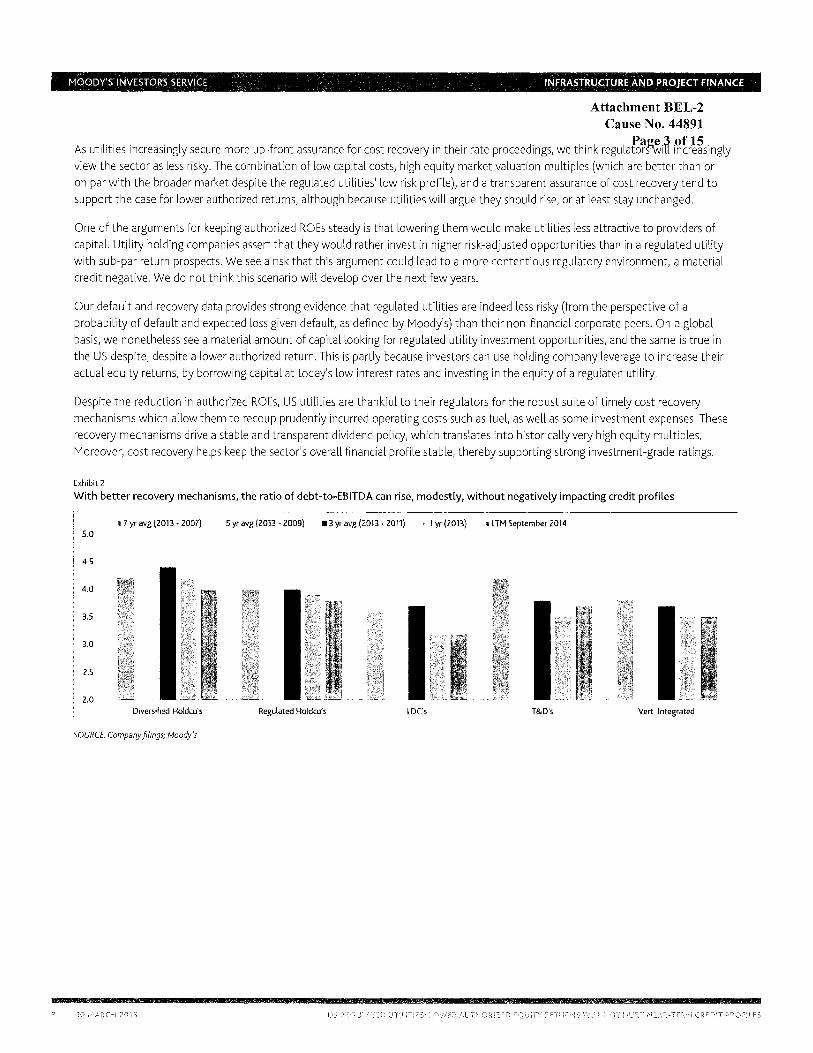
Attachment BEL-2 Cause No. 44891
A .l. . . . l f f . h . d" h" k l Pa!!e.3.of15 . l s ut1 1t1es 1ncreas1ng y secure more up- ront assurance or cost recovery in t e1r rate procee ings, wet in regu ators-w1n increasing y view the sector as less risky. The combination of low capital costs, high equity market valuation multiples (which are better than or on par with the broader market despite the regulated utilities' low risk profile), and a transparent assurance of cost recovery tend to support the case for lower authorized returns, although because utilities will argue they should rise, or at least stay unchanged.
One of the arguments for keeping authorized RO Es steady is that lowering them would make utilities less attractive to providers of capital. Utility holding companies assert that they would rather invest in higher risk-adjusted opportunities than in a regulated utility with sub-par return prospects. We see a risk that this argument could lead to a more contentious regulatory environment, a material credit negative. We do not think this scenario will develop over the next few years.
Our default and recovery data provides strong evidence that regulated utilities are indeed less risky (from the perspective of a probability of default and expected loss given default, as defined by Moody's) than their non-financial corporate peers. On a global basis, we nonetheless see a material amount of capital looking for regulated utility investment opportunities, and the same is true in the US despite, despite a lower authorized return. This is partly because investors can use holding company leverage to increase their actual equity returns, by borrowing capital at today's low interest rates and investing in the equity of a regulated utility.
Despite the reduction in authorized ROEs, US utilities are thankful to their regulators for the robust suite of timely cost recovery mechanisms which allow them to recoup prudently incurred operating costs such as fuel, as well as some investment expenses. These recovery mechanisms drive a stable and transparent dividend policy, which translates into historically very high equity multiples. Moreover, cost recovery helps keep the sector's overall financial profile stable, thereby supporting strong investment-grade ratings.
Exhibit 2
With better recovery mechanisms, the ratio of debt-to-EBITDA can rise, modestly, without negatively impacting credit profiles
'%7yr avg (2013- 2007) 7 5 yr avg {2013 -2009) 113 yr avg (2013 • 2011) "' 1 yr (2013) »LTM September 2014 5.0
4.5
2.0 Diversified Holdm's Regulated Hotdrn's LDC's T&D's Vert. Integrated
SOURCE: Company filings; Moody's
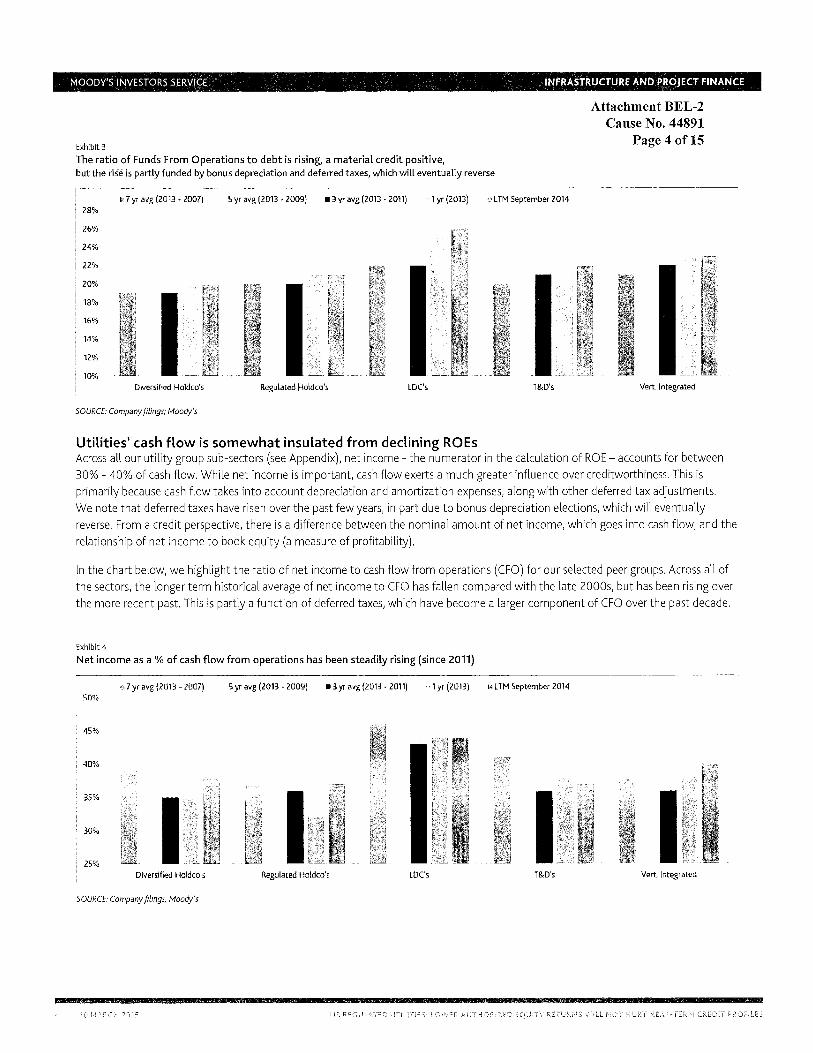
Exhibit 3
The ratio of Funds From Operations to debt is rising, a material credit positive, but the rise is partly funded by bonus depreciation and deferred taxes, which will eventually reverse
'fJ;7 yr avg (2013 - 2007) "S yr avg (2013 - 2009) 113 yr avg {2013 · 2011) ,_,, yr{2013) '"LTM September 2014 28%
26%
24%
22%
20%
18%
16%
14%
12%
10% Diversified Holdco's
SOURCE: Company filings; Moody's
Regulated Holdco's LDC's
Utilities' cash flow is somewhat insulated from declining RO Es
T&D's
Attachment BEL-2 Cause No. 44891
Page 4 ofl5
V~ Integrated
Across all our utility group sub-sectors (see Appendix), net income - the numerator in the calculation of ROE - accounts for between 30% - 40% of cash flow. While net income is important, cash flow exerts a much greater influence over creditworthiness. This is primarily because cash flow takes into account depreciation and amortization expenses, along with other deferred tax adjustments. We note that deferred taxes have risen over the past few years, in part due to bonus depreciation elections, which will eventually reverse. From a credit perspective, there is a difference between the nominal amount of net income, which goes into cash flow, and the relationship of net income to book equity (a measure of profitability).
In the chart below, we highlight the ratio of net income to cash flow from operations (CFO) for our selected peer groups. Across all of the sectors, the longer term historical average of net income to CFO has fallen compared with the late 2000s, but has been rising over the more recent past. This is partly a function of deferred taxes, which have become a larger component of CFO over the past decade.
Exhibit 4
Net income as a% of cash flow from operations has been steadily rising (since 2011)
"'7 yr avg {2013 - 2007) ~ 5 yr avg (2013 - 2009) • 3 yr avg (2013 - 2011) ii 1 yr (2013) Ii! LTM Sept~mber 2014
30%
25% Diversified Holdco's Regulated Holdco's LDC's T&D's V~rt Integrated
SOURCE: Company filings, Moody's
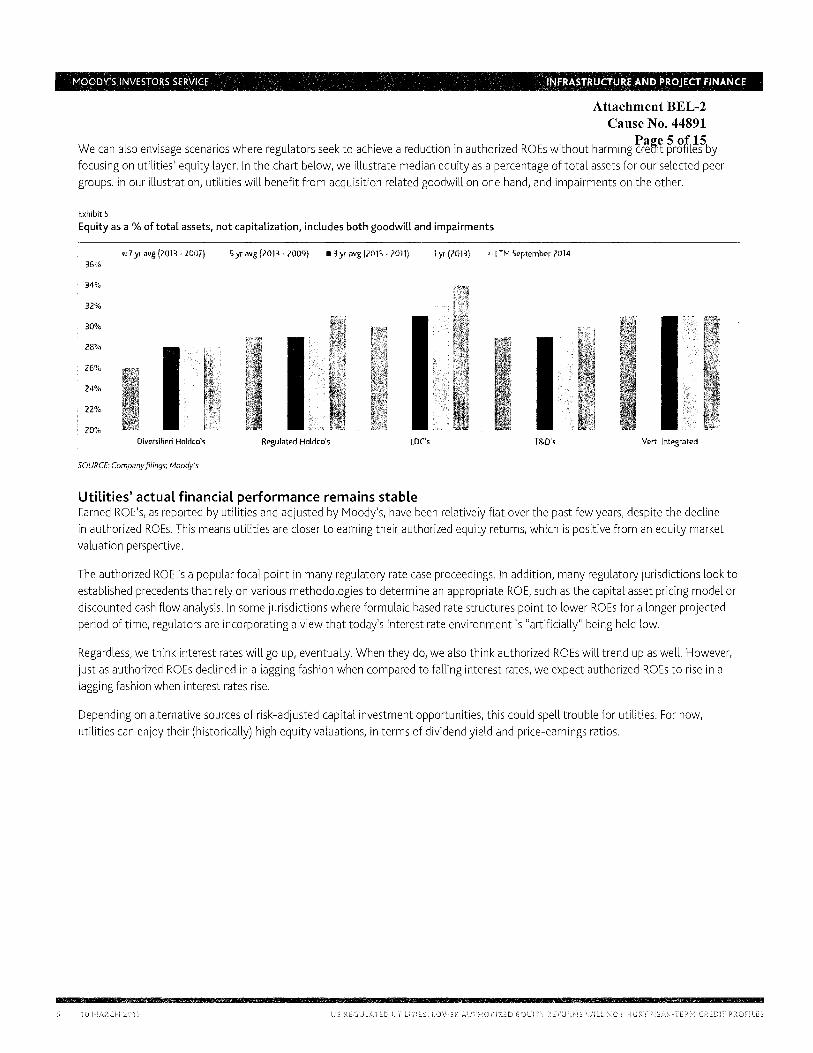
Attachment BEL-2 Cause No. 44891
We can also envisage scenarios where regulators seek to achieve a reduction in authorized RO Es without harming rr~a~ ~rgfili~by focusing on utilities' equity layer. In the chart below, we illustrate median equity as a percentage of total assets for our selected peer groups. In our illustration, utilities will benefit from acquisition related goodwill on one hand, and impairments on the other.
Exhibit 5
Equity as a % of total assets, not capitalization, includes both goodwill and impairments
'li. 7 yr avg \2013 • 2007) ' 5 yr avg (2013 - 2009) 113 yr avg (2013 • 2011) t· 1 yr (2013) !.? LTM September 2014
34%
32%
i 30%
28%
26%
24%
22%
20% Diversified Holdco's Regulated Haldco's LDC's TS.D's Vert Integrated
SOURCE: Company filings; Moody's
Utilities' actual financial performance remains stable Earned ROE's, as reported by utilities and adjusted by Moody's, have been relatively flat over the past few years, despite the decline in authorized RO Es. This means utilities are closer to earning their authorized equity returns, which is positive from an equity market valuation perspective.
The authorized ROE is a popular focal point in many regulatory rate case proceedings. In addition, many regulatory jurisdictions look to established precedents that rely on various methodologies to determine an appropriate ROE, such as the capital asset pricing model or discounted cash flow analysis. In some jurisdictions where formulaic based rate structures point to lower RO Es for a longer projected period of time, regulators are incorporating a view that today's interest rate environment is "artificially" being held low.
Regardless, we think interest rates will go up, eventually. When they do, we also think authorized RO Es will trend up as well. However, just as authorized ROEs declined in a lagging fashion when compared to falling interest rates, we expect authorized ROEs to rise in a lagging fashion when interest rates rise.
Depending on alternative sources of risk-adjusted capital investment opportunities, this could spell trouble for utilities. For now, utilities can enjoy their (historically) high equity valuations, in terms of dividend yield and price-earnings ratios.
10
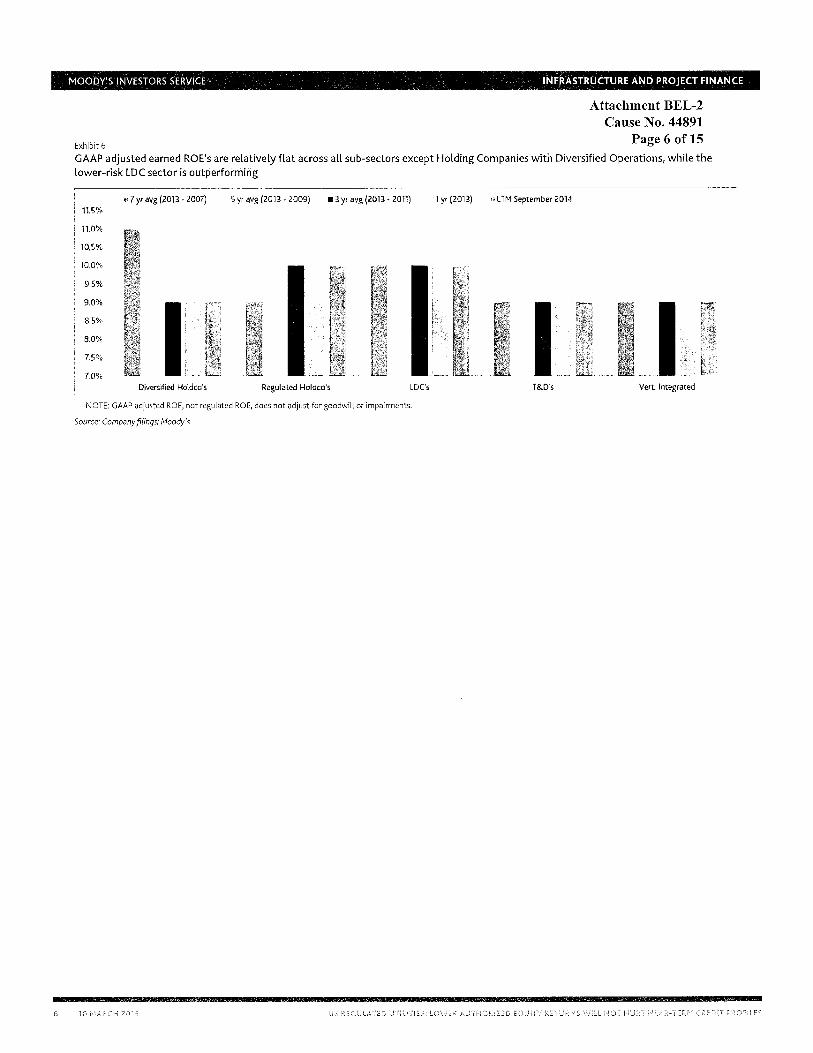
6
MOODY'S INVESTORS SERVICE INFRASTRUCTURE AND PROJECT FINANCE
Exhibit 6
Attachment BEL-2 Cause No. 44891
Page 6 of15 GAAP adjusted earned RO E's are relatively flat across all sub-sectors except Holding Companies with Diversified Operations, while the lower~risk LDC sector is outperforming
•7 y1 avg (2013 • 2007) "5 yr avg (2013 • 2009) • 3 yr avg (2013 • 2011) • 1 yr (2013) • l TM September 2014 11.5%
11.0%
10.5%
10.0%
9.5%
9.0%
8.5%
8.0%
7.5%
7.0% -· _lllll_lllll
DiveJSilied Holdco's Regulated Holdco's LDC's T&O's Vert. Integrated
NOTE: GAAP adjusted ROE, not regulated ROE, does not adjust for goodwill or impairments.
Source: Company filings; Moody's
10 MARCH 2015 US REGULATED UTILITIES: LOWER AUTHORIZED EQUITY RETURNS Will NOT HURT NEAR-TERM CREDIT PROFILES
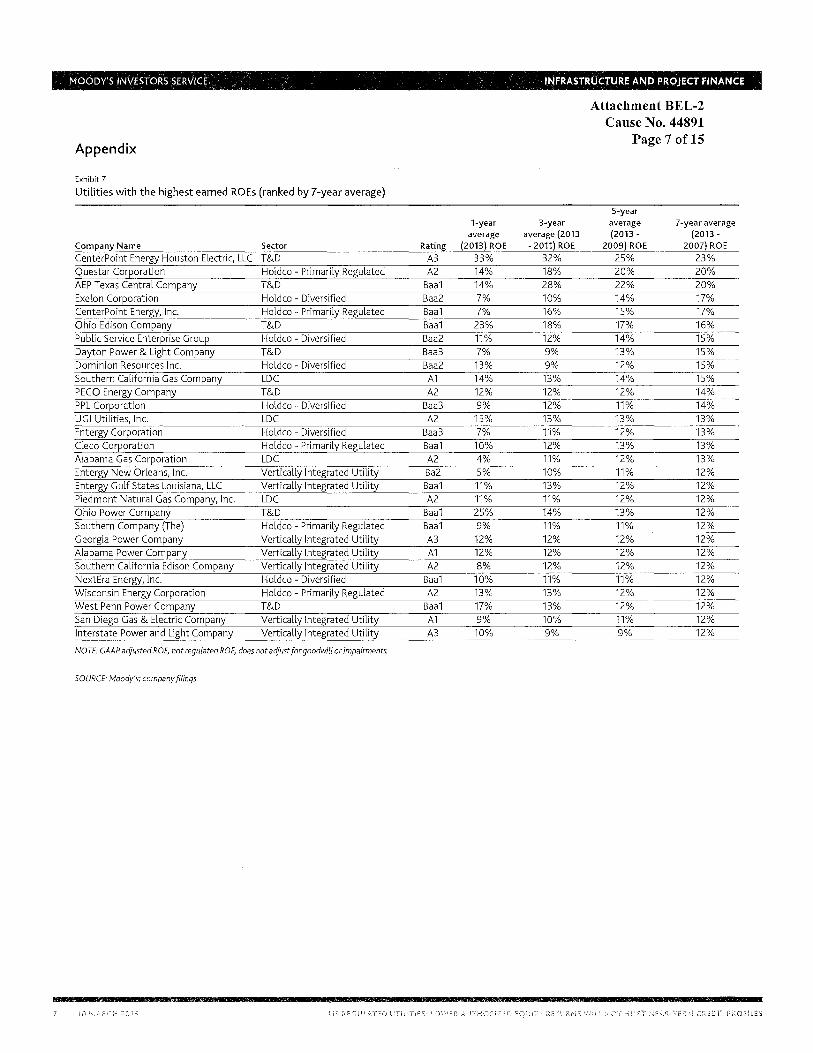
MOODY'S INVESTORS SERVICE INFRASTRUCTURE AND PROJECT FINANCE
Attachment BEL-2 Cause No. 44891
Appendix Page 7 of15
Exhibit?
Utilities with the highest earned RO Es (ranked by 7-year average)
5-year 1-year 3-year average 7-year average
average average (2013 (2013 - (2013 -Company Name Sector Rating (2013) ROE -2011) ROE 2009) ROE 2007) ROE CenterPoint Energy Houston Electric, LLC T&D A3 33% 3Z% Z5% Z3% Questar Corporation Holdco - Primarily Regulated AZ 14% 18% ZO% ZO% AEP Texas Central Company T&D Baa1 14% Z8% ZZ% ZO% Exelon Corporation Holdco - Diversified BaaZ 7% 10% 14% 17% CenterPoint Energy, Inc. Holdco - Primarily Regulated Baal 7% 16% 15% 17% Ohio Edison Company T&D Baal Z3% 18% 17% 16% Public Service Enterprise Group Holdco - Diversified BaaZ 11% 1Z% 14% 15% Dayton Power & Light Company T&D Baa3 7% 9% 13% 15% Dominion Resources Inc. Holdco - Diversified BaaZ 13% 9% 1Z% 15% Southern California Gas Company LDC Al 14% 13% 14% 15% PECO Energy Company T&D AZ 1Z% 1Z% 1Z% 14% PPL Corporation Holdco - Diversified Baa3 9% 1Z% 11% 14% UGI Utilities, Inc. LDC AZ 15% 13% 13% 13% Entergy Corporation Holdco - Diversified Baa3 7% 11% 1Z% 13% Cleco Corporation Holdco - Primarily Regulated Baa1 10% 1Z% 13% 13% Alabama Gas Corporation LDC AZ 4% 11% 1Z% 13% Entergy New Orleans, Inc. Vertically Integrated Utility BaZ 5% 10% 11% 1Z% Entergy Gulf States Louisiana, LLC Vertically Integrated Utility Baa1 11% 13% 1Z% 1Z% Piedmont Natural Gas Company, Inc. LDC AZ 11% 11% 1Z% 1Z% Ohio Power Company T&D Baa1 Z5% 14% 13% 1Z% Southern Company (The) Holdco - Primarily Regulated Baa1 9% 11% 11% 1Z% Georgia Power Company Vertically Integrated Utility A3 1Z% 1Z% 1Z% 1Z% Alabama Power Company Vertically Integrated Utility A1 1Z% 1Z% 1Z% 1Z% Southern California Edison Company Vertically Integrated Utility AZ 8% 1Z% 1Z% 1Z% NextEra Energy, Inc. Holdco - Diversified Baa1 10% 11% 11% 1Z% Wisconsin Energy Corporation Holdco - Primarily Regulated AZ 13% 13% 1Z% 1Z% West Penn Power Company T&D Baa1 17% 13% 1Z% 1Z% San Diego Gas & Electric Company Vertically Integrated Utility A1 9% 10% 11% 1Z% Interstate Power and Light Company Vertically Integrated Utility A3 10% 9% 9% 1Z%
NOTE: GAAP adjusted ROE, not regulated ROE, does not adjust for goodwill or impairments.
SOURCE: Moody's; company filings
7 10 MARCH 201S US REGULATED UTILITIES: LOWER AUTHORIZED EQUITY RETURNS Will NOT HURT NEAR-TERM CREDIT PROFILES
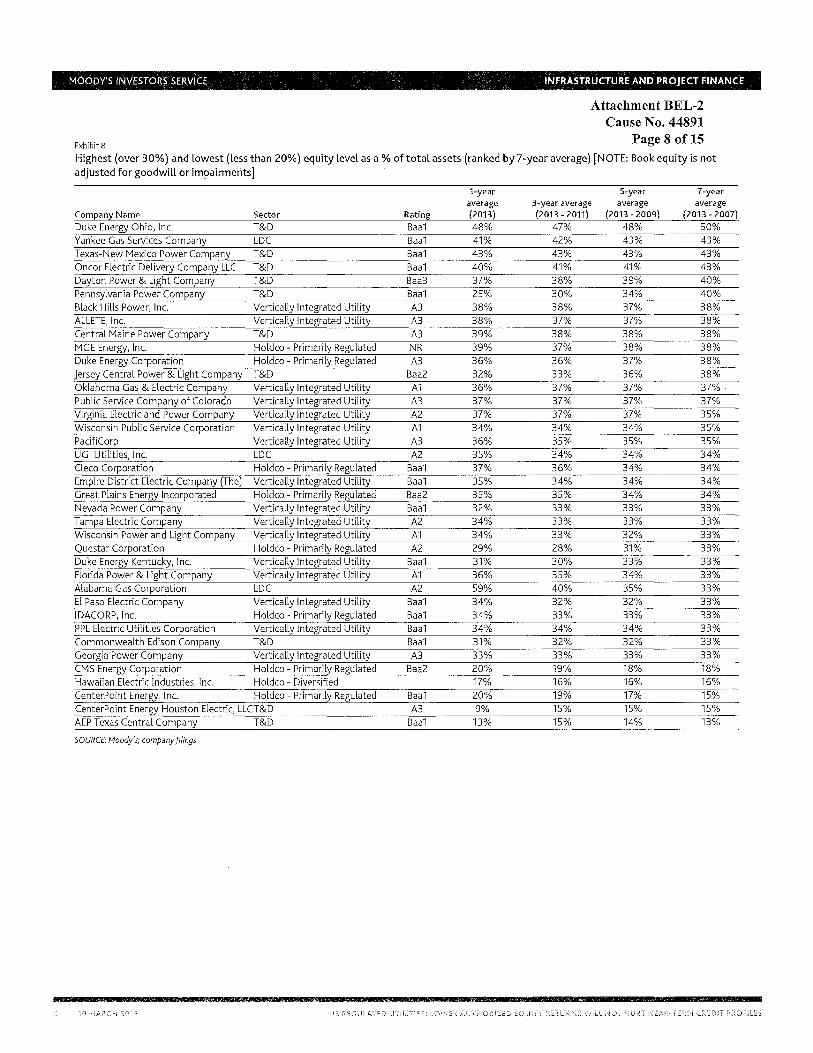
MOODY'S INVESTORS SERVICE INFRASTRUCTURE AND PROJECT FINANCE
Attachment BEL-2 Cause No. 44891
Exhibit 8 Page 8 of15 Highest (over 30%) and lowest (less than 20%) equity level as a% of total assets (ranked by 7-year average) [NOTE: Book equity is not aaji.Jsted for goodwill or impair'merits]
1-year 5-year 7-year average 3-year average average average
Company Name Sector Rating (2013) (2013 - 2011) (2013 - 2009) (2013 - 2007) Duke Energy Ohio, Inc. T&D Baal 48% 47% 48% 50% Yankee Gas Services Company LDC Baal 41% 4Z% 43% 43% Texas-New Mexico Power Company T&D Baal 43% 43% 43% 43% Oncer Electric Delivery Company LLC T&D Baal 40% 41% 41% 43% Dayton Power & Light Company T&D Baa3 37% 38% 39% 40% Pennsylvania Power Company T&D Baal Z5% 30% 34% 40% Black Hills Power, Inc. Vertically Integrated Utility A3 38% 38% 37% 38% ALLETE, Inc. Vertically Integrated Utility A3 38% 37% 37% 38% Central Maine Power Company T&D A3 39% 38% 38% 38% MGE Energy, Inc. Holdco - Primarily Regulated NR 39% 37% 38% 38% Duke Energy Corporation Holdco - Primarily Regulated A3 36% 36% 37% 38% jersey Central Power & Light Company T&D BaaZ 3Z% 33% 36% 38% Oklahoma Gas & Electric Company Vertically Integrated Utility Al 36% 37% 37% 37%' Public Service Company of Colorado Vertically Integrated Utility A3 37% 37% 37% 37% Virginia Electric and Power Company Vertically Integrated Utility AZ 37% 37% 37% 35% Wisconsin Public Service Corporation Vertically Integrated Utility Al 34% 34% 34% 35% PacifiCorp Vertically Integrated Utility A3 36% 35% 35% 35% UGI Utilities, Inc. LDC A2 35% 34% 34% 34% Cleco Corporation Holdco - Primarily Regulated Baal 37% 36% 34% 34% Empire District Electric Company (The) Vertically Integrated Utility Baal 35% 34% 34% 34% Great Plains Energy Incorporated Holdco - Primarily Regulated BaaZ 35% 35% 34% 34% Nevada Power Company Vertically Integrated Utility Baal 3Z% 33% 33% 33% Tampa Electric Company Vertically Integrated Utility AZ 34% 33% 33% 33% Wisconsin Power and Light Company Vertically Integrated Utility Al 34% 33% 3Z% 33% Questar Corporation Holdco - Primarily Regulated AZ Z9% Z8% 31% 33% Duke Energy Kentucky, Inc. Vertically Integrated Utility Baal 31% 30% 33% 33% Florida Power & Light Company Vertically Integrated Utility Al 36% 35% 34% 33% Alabama Gas Corporation LDC AZ 59% 40% 35% 33% EL Paso Electric Company Vertically Integrated Utility Baa1 34% 3Z% 3Z% 33% IDACORP, Inc. Holdco - Primarily Regulated Baal 34% 33% 33% 33% PPL Electric Utilities Corporation Vertically Integrated Utility Baal 34% 34% 34% 33% Commonwealth Edison Company T&D Baa1 31% 3Z% 3Z% 33% Georgia Power Company Vertically Integrated Utility A3 33% 33% 33% 33% CMS Energy Corporation Holdco - Primarily Regulated BaaZ ZO% 19% 18% 18% Hawaiian Electric Industries, Inc. Holdco - Diversified 17% 16% 16% 16% CenterPoint Energy, Inc. Holdco - Primarily Regulated Baal ZO% 19% 17% 15% CenterPoint Energy Houston Electric, LLCT&D A3 9% 15% 15% 15% AEP Texas Central Company T&D Baal 13% 15% 14% 13%
SOURCE: Moody's; company filings
8 10 MARCH 2015 US REGULATED UTILITIES: LOWER AUTHORIZED EQUITY RETURNS WILL NOT HURT NEAR-TERM CREDIT PROFILES
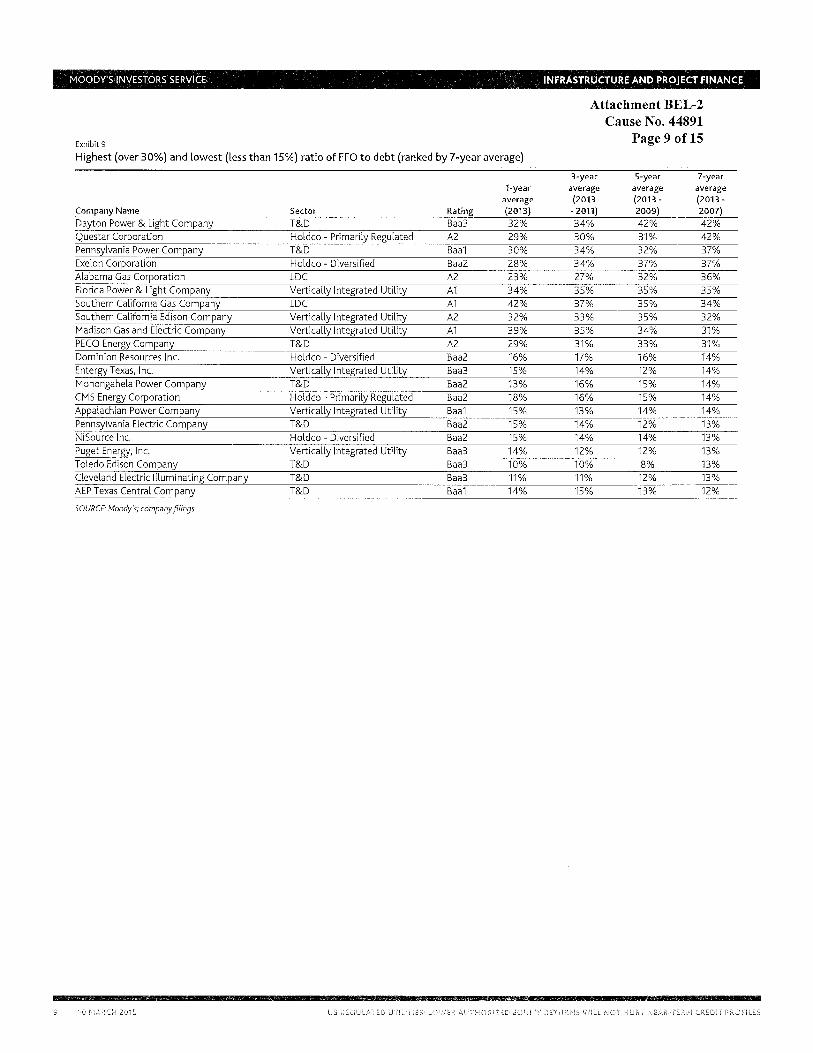
MOODY'S INVESTORS SERVICE INFRASTRUCTURE AND PROJECT FINANCE
Attachment BEL-2 Cause No. 44891
Exhibit 9 Page 9 of15 Highest (over 30%) and lowest (less than 15%) ratio of FFO to debt (ranked by 7-year average)
3-year 5-year 7-year 1-year average average average
average (2013 (2013 - (2013 -Company Name Sector Rating (2013) - 2011) 2009) 2007) Dayton Power & Light Company T&D Baa3 3Z% 34% 4Z% 4Z% Questar Corporation Holdco - Primarily Regulated AZ Z9% 30% 31% 4Z% Pennsylvania Power Company T&D Baa1 30% 34% 3Z% 37% Exelon Corporation Holdco - Diversified BaaZ Z8% 34% 37% 37% Alabama Gas Corporation LDC AZ Z3% Z7% 3Z% 36% Florida Power & Light Company Vertically Integrated Utility A1 34% 35% 35% 35% Southern California Gas Company LDC A1 4Z% 37% 35% 34% Southern California Edison Company Vertically Integrated Utility AZ 3Z% 33% 35% 3Z% Madison Gas and Electric Company Vertically Integrated Utility A1 39% 35% 34% 31% PECO Energy Company T&D AZ Z9% 31% 33% 31% Dominion Resources Inc. Holdco - Diversified BaaZ 16% 17% 16% 14% Entergy Texas, Inc. Vertically Integrated Utility Baa3 15% 14% 1Z% 14% Monongahela Power Company T&D BaaZ 13% 16% 15% 14% CMS Energy Corporation Holdco - Primarily Regulated BaaZ 18% 16% 15% 14% Appalachian Power Company Vertically Integrated Utility Baa1 15% 13% 14% 14% Pennsylvania Electric Company T&D BaaZ 15% 14% 1Z% 13% NiSource Inc. Holdco - Diversified BaaZ 15% 14% 14% 13% Puget Energy, Inc. Vertically Integrated Utility Baa3 14% 1Z% 1Z% 13% Toledo Edison Company T&D Baa3 10% 10% 8% 13% Cleveland Electric Illuminating Company T&D Baa3 11% 11% 1Z% 13% AEP Texas Central Company T&D Baa1 14% 15% 13% 1Z%
SOURCE: Moody's; company filings
9 10 MARCH 2015 US REGULATED UTILITIES: LOWER AUTHORIZED EQUITY RETURNS WILL NOT HURT NEAR-TERM CREDIT PROFILES
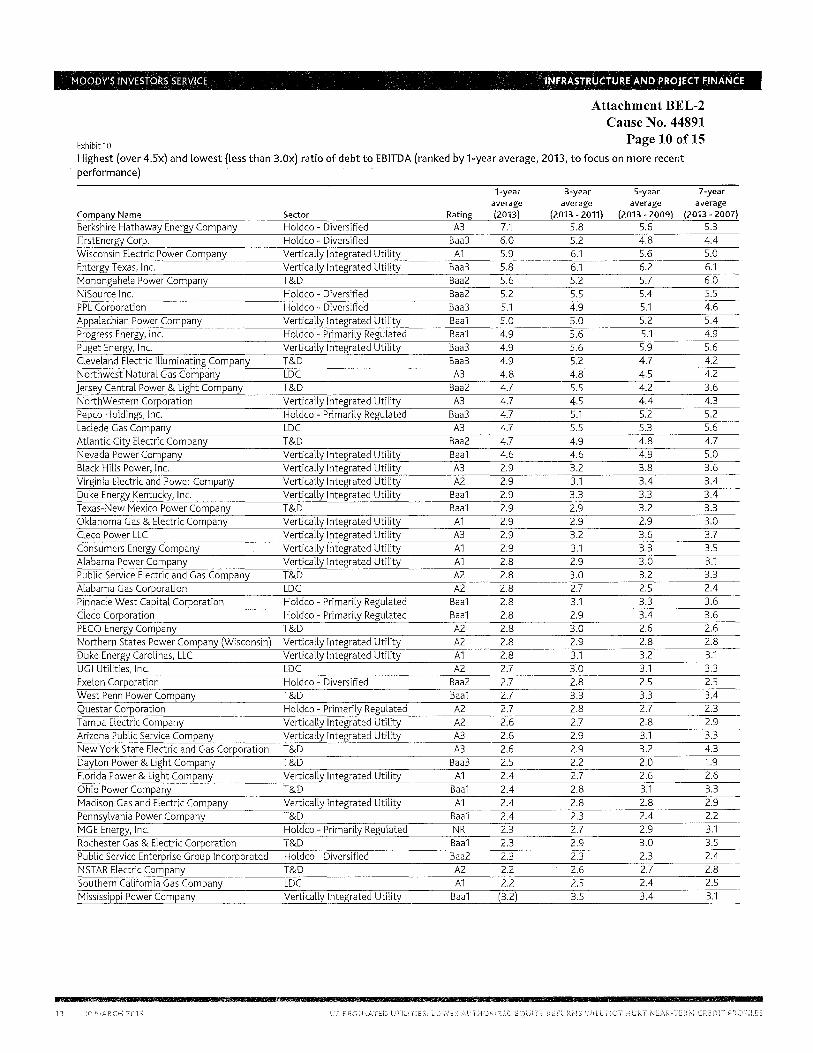
MOODY'S INVESTORS SERVICE INFRASTRUCTURE AND PROJECT FINANCE
Attachment BEL-2 Cause No. 44891
Exhibit10 Page 10 of15 Highest (over 4.5x) and lowest (less than 3.0x) ratio of debt to EBITDA (ranked by 1-year average, 2013, to focus on more recent
- performance)
1-year 3-year 5-year 7-year average average average average
Company Name Sector Rating (2013) (2013 - 2011) (2013 - 2009) (2013 - 2007) Berkshire Hathaway Energy Company Holdco - Diversified A3 7.1 5.8 5.6 5.3 FirstEnergy Corp. Holdco - Diversified Baa3 6.0 5.2 4.8 4.4 Wisconsin Electric Power Company Vertically Integrated Utility Al 5.9 6.1 5.6 5.0 Entergy Texas, Inc. Vertically Integrated Utility Baa3 5.8 6.1 6.Z 6.1 Monongahela Power Company T&D BaaZ 5.6 5.Z 5.7 6.0 NiSource Inc. Holdco - Diversified Baa2 5.2 5.5 5.4 5.5 PPL Corporation Holdco - Diversified Baa3 5.1 4.9 5.1 4.6 Appalachian Power Company Vertically Integrated Utility Baal 5.0 5.0 5.Z 5.4 Progress Energy, Inc. Holdco - Primarily Regulated Baal 4.9 5.6 5.1 4.9 Puget Energy, Inc. Vertically Integrated Utility Baa3 4.9 5.6 5.9 5.6 Cleveland Electric Illuminating Company T&D Baa3 4.9 5.2 4.7 4.2 Northwest Natural Gas Company LDC A3 4.8 4.8 4.5 4.2 Jersey Central Power & Light Company T&D BaaZ 4.7 5.5 4.2 3.6 NorthWestern Corporation Vertically Integrated Utility A3 4.7 4.5 4.4 4.3 Pepco Holdings, Inc. Holdco - Primarily Regulated Baa3 4.7 5.1 5.Z 5.2 Laclede Gas Company LDC A3 4.7 5.5 5.3 5.6 Atlantic City Electric Company T&D Baa2 4.7 4.9 4.8 4.7 Nevada Power Company Vertically Integrated Utility Baal 4.6 4.6 4.9 5.0 Black Hills Power, Inc. Vertically Integrated Utility A3 2.9 3.2 3.8 3.6 Virginia Electric and Power Company Vertically Integrated Utility A2 2.9 3.1 3.4 3.4 Duke Energy Kentucky, Inc. Vertically Integrated Utility Baal 2.9 3.3 3.3 3.4 Texas-New Mexico Power Company T&D Baal 2.9 2.9 3.2 3.3 Oklahoma Gas & Electric Company Vertically Integrated Utility Al 2.9 2.9 2.9 3.0 Cleco Power LLC Vertically Integrated Utility A3 2.9 3.2 3.6 3.7 Consumers Energy Company Vertically Integrated Utility Al 2.9 3.1 3.3 3.5 Alabama Power Company Vertically Integrated Utility Al 2.8 2.9 3.0 3.1 Public Service Electric and Gas Company T&D A2 2.8 3.0 3.2 3.3 Alabama Gas Corporation LDC A2 2.8 2.7 2.5 2.4 Pinnacle West Capital Corporation Holdco - Primarily Regulated Baal 2.8 3.1 3.3 3.6 Cleco Corporation Holdco - Primarily Regulated Baal 2.8 2.9 3.4 3.6 PECO Energy Company T&D AZ 2.8 3.0 2.6 2.6 Northern States Power Company (Wisconsin) Vertically Integrated Utility A2 2.8 2.9 2.8 2.8 Duke Energy Carolinas, LLC Vertically Integrated Utility Al 2.8 3.1 3.2 3.1 UGI Utilities, Inc. LDC AZ 2.7 3·.o 3.1 3.3 Exelon Corporation Holdco - Diversified Baa2 2.7 2.8 2.5 2.5 West Penn Power Company T&D Baal 2.7 3.3 3.3 3.4 Questar Corporation Holdco - Primarily Regulated A2 2.7 2.8 2.7 2.3 Tampa Electric Company Vertically Integrated Utility A2 2.6 2.7 2.8 2.9 Arizona Public Service Company Vertically Integrated Utility A3 2.6 2.9 3.1 3.3 New York State Electric and Gas Corporation T&D A3 Z.6 2.9 3.Z 4.3 Dayton Power & Light Company T&D Baa3 2.5 2.2 2.0 1.9 Florida Power & Light Company Vertically Integrated Utility Al 2.4 2.7 2.6 2.6 Ohio Power Company T&D Baal Z.4 2.8 3.1 3.3 Madison Gas and Electric Company Vertically Integrated Utility Al 2.4 2.8 Z.8 2.9 Pennsylvania Power Company T&D Baal 2.4 2.3 2.4 2.2 MGE Energy, Inc. Holdco - Primarily Regulated NR 2.3 2.7 2.9 3.1 Rochester Gas & Electric Corporation T&D Baal 2.3 2.9 3.0 3.5 Public Service Enterprise Group Incorporated Holdco - Diversified Baa2 2.3 2.3 2.3 2.4 NSTAR Electric Company T&D AZ 2.2 2.6 2.7 2.8 Southern California Gas Company LDC Al 2.2 2.5 2.4 2.5 Mississippi Power Company Vertically Integrated Utility Baal (3.2) 3.5 3.4 3.1
10 10 MARCH 2015 US REGULATED UTILITIES: LOWER AUTHORIZED EQUITY RETURNS WILL NOT HURT NEAR-TERM CREDIT PROFILES
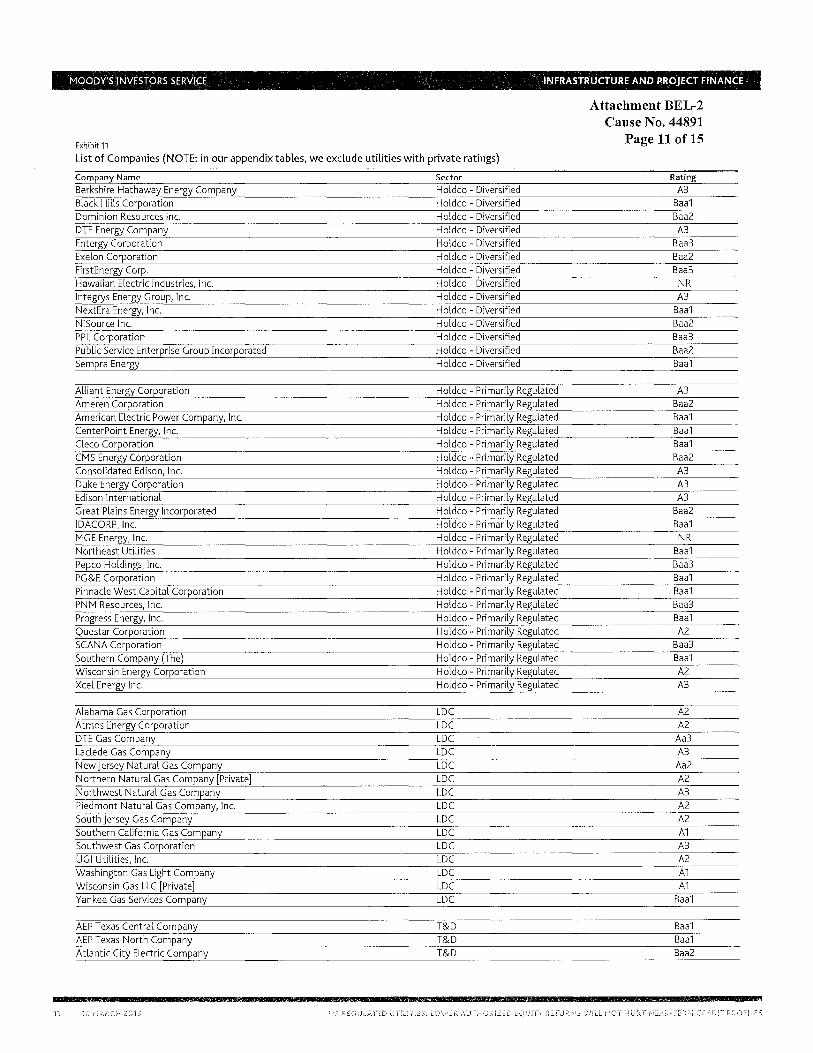
11
MOODY'S INVESTORS SERVICE INFRASTRUCTURE AND PROJECT FINANCE
Exhibit 11
Attachment BEL-2 Cause No. 44891
Page 11 of15 List of Companies (NOTE: in our appendix tables, we exclude utilities with private ratings)
Company Name Sector Rating
Berkshire Hathaway Energy Company Holdco - Diversified A3 Black Hills Corporation Holdco - Diversified Baa1 Dominion Resources Inc. Holdco - Diversified BaaZ DTE Energy Company Holdco - Diversified A3 Entergy Corporation Holdco - Diversified Baa3 Exelon Corporation Holdco - Diversified BaaZ FirstEnergy Corp. Holdco - Diversified Baa3 Hawaiian Electric Industries, Inc. Holdco - Diversified NR Integrys Energy Group, Inc. Holdco - Diversified A3 NextEra Energy, Inc. Holdco - Diversified Baa1 NiSource Inc. Holdco - Diversified BaaZ PPL Corporation Holdco - Diversified Baa3 Public Service Enterprise Group Incorporated Holdco - Diversified BaaZ Sempra Energy Holdco - Diversified Baa1
Alliant Energy Corporation Holdco - Primarily Regulated A3 Ameren Corporation Holdco - Primarily Regulated BaaZ American Electric Power Company, Inc. Holdco - Primarily Regulated Baa1 CenterPoint Energy, Inc. Holdco - Primarily Regulated Baa1 Cleco Corporation Holdco - Primarily Regulated Baa1 CMS Energy Corporation Holdco - Primarily Regulated BaaZ Consolidated Edison, Inc. Holdco - Primarily Regulated A3 Duke Energy Corporation Holdco - Primarily Regulated A3 Edison International Holdco - Primarily Regulated A3 Great Plains Energy Incorporated Holdco - Primarily Regulated BaaZ IDACORP, Inc. Holdco - Primarily Regulated Baa1 MGE Energy, Inc. Holdco - Primarily Regulated NR Northeast Utilities Holdco - Primarily Regulated Baa1 Pepco Holdings, Inc. Holdco - Primarily Regulated Baa3 PG&E Corporation Holdco - Primarily Regulated Baa1 Pinnacle West Capital Corporation Holdco - Primarily Regulated Baa1 PNM Resources, Inc. Holdco - Primarily Regulated Baa3 Progress Energy, Inc. Holdco - Primarily Regulated Baa1 Questar Corporation Holdco - Primarily Regulated AZ SCANA Corporation Holdco - Primarily Regulated Baa3 Southern Company {The) Holdco - Primarily Regulated Baa1 Wisconsin Energy Corporation Holdco - Primarily Regulated AZ Xcel Energy Inc. Holdco - Primarily Regulated A3
Alabama Gas Corporation LDC AZ Atmos Energy Corporation LDC AZ DTE Gas Company LDC Aa3 Laclede Gas Company LDC A3 New Jersey Natural Gas Company LDC AaZ Northern Natural Gas Company [Private] LDC AZ Northwest Natural Gas Company LDC A3 Piedmont Natural Gas Company, Inc. LDC AZ South Jersey Gas Company LDC AZ Southern California Gas Company LDC A1 Southwest Gas Corporation LDC A3 UGI Utilities, Inc. LDC AZ Washington Gas Light Company LDC A1 Wisconsin Gas LLC [Private] LDC A1 Yankee Gas Services Company LDC Baa1
AEP Texas Central Company T&D Baa1 AEP Texas North Company T&D Baa1 Atlantic City Electric Company T&D BaaZ
10 MARCH 2015 US REGULATED UTILITIES: LOWER AUTHORIZED EQUITY RETURNS WILL NOT HURT NEAR-TERM CREDIT PROFILES
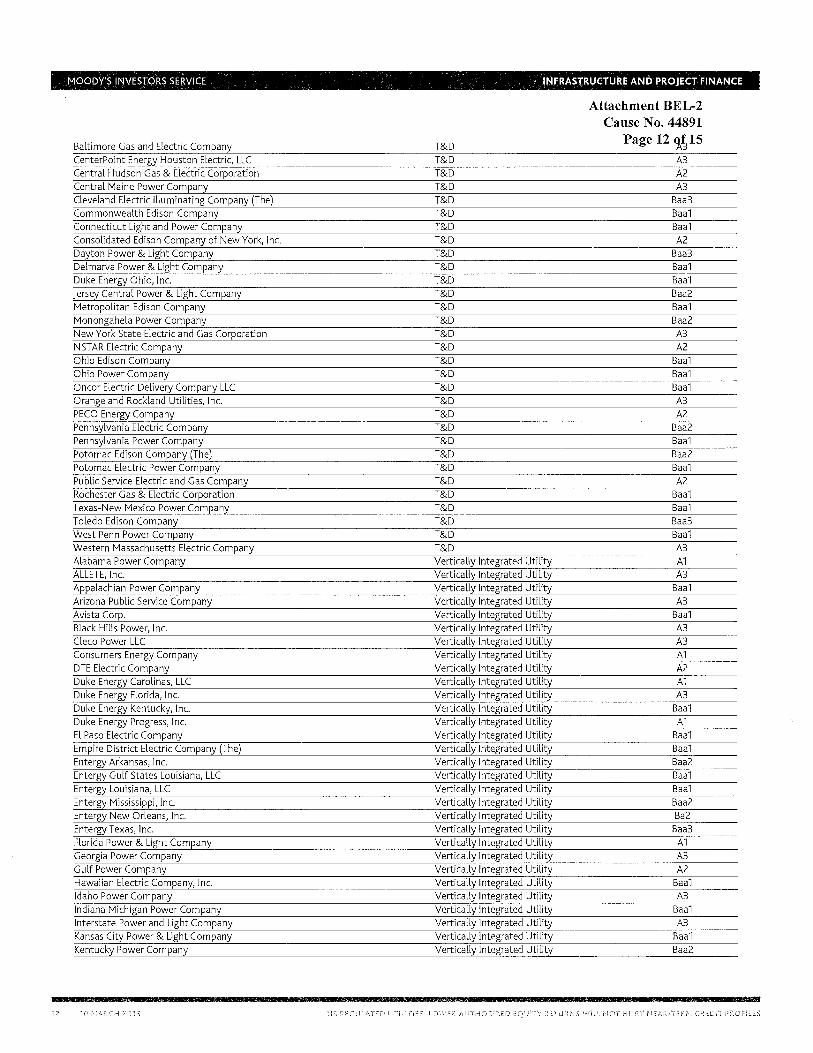
12
MOODY'S INVESTORS SERVICE INFRASTRUCTURE AND PROJECT FINANCE
Baltimore Gas and Electric Company CenterPoint Energy Houston Electric, LLC Central Hudson Gas & Electric Corporation Central Maine Power Company Cleveland Electric Illuminating Company (The) Commonwealth Edison Company Connecticut Light and Power Company Consolidated Edison Company of New York, Inc. Dayton Power & Light Company Delmarva Power & Light Company Duke Energy Ohio, Inc. jersey Central Power & Light Company Metropolitan Edison Company Monongahela Power Company New York State Electric and Gas Corporation NSTAR Electric Company Ohio Edison Company Ohio Power Company Oncor Electric Delivery Company LLC Orange and Rockland Utilities, Inc. PECO Energy Company Pennsylvania Electric Company Pennsylvania Power Company Potomac Edison Company (The) Potomac Electric Power Company Public Service Electric and Gas Company Rochester Gas & Electric Corporation Texas-New Mexico Power Company Toledo Edison Company West Penn Power Company Western Massachusetts Electric Company Alabama Power Company ALLETE, Inc. Appalachian Power Company Arizona Public Service Company Avista Corp. Black Hills Power, Inc. Cleco Power LLC Consumers Energy Company DTE Electric Company Duke Energy Carolinas, LLC Duke Energy Florida, Inc. Duke Energy Kentucky, Inc. Duke Energy Progress, Inc. El Paso Electric Company Empire District Electric Company (The) Entergy Arkansas, Inc. Entergy Gulf States Louisiana, LLC Entergy Louisiana, LLC Entergy Mississippi, Inc. Entergy New Orleans, Inc. Entergy Texas, Inc. Florida Power & Light Company Georgia Power Company Gulf Power Company Hawaiian Electric Company, Inc. Idaho Power Company Indiana Michigan Power Company Interstate Power and Light Company Kansas City Power & Light Company Kentucky Power Company
10 MARCH 2015
T&D T&D T&D T&D T&D T&D T&D T&D T&D T&D T&D T&D T&D T&D T&D T&D T&D T&D T&D T&D T&D T&D T&D T&D T&D T&D T&D T&D T&D T&D T&D Vertically Integrated Utility Vertically Integrated Utility Vertically Integrated Utility Vertically Integrated Utility Vertically Integrated Utility Vertically Integrated Utility Vertically Integrated Utility Vertically Integrated Utility Vertically Integrated Utility Vertically Integrated Utility Vertically Integrated Utility Vertically Integrated Utility Vertically Integrated Utility Vertically Integrated Utility Vertically Integrated Utility Vertically Integrated Utility Vertically Integrated Utility Vertically Integrated Utility Vertically Integrated Utility Vertically Integrated Utility Vertically Integrated Utility Vertically Integrated Utility Vertically Integrated Utility Vertically Integrated Utility Vertically Integrated Utility Vertically Integrated Utility Vertically Integrated Utility Vertically Integrated Utility Vertically Integrated Utility Vertically Integrated Utility
Attachment BEL-2 Cause No. 44891
Page 12 9..~ 15 A3 A2 A3
Baa3 Baa1 Baa1 A2
Baa3 Baa1 Baa1 Baa2 Baa1 Baa2 A3 A2
Baa1 Baa1 Baa1 A3 A2
Baa2 Baa1 Baa2 Baa1 A2
Baa1 Baa1 Baa3 Baa1 A3 A1 A3
Baa1 A3
Baa1 A3 A3 A1 A2 A1 A3
Baa1 A1
Baa1 Baa1 Baa2 Baa1 Baa1 Baa2 Ba2 Baa3
A1 A3 A2
Baa1 A3
Baa1 A3
Baa1 Baa2
US REGULATED UTILITIES: LOWER AUTHORIZED EQUITY RETURNS WILL NOT HURT NEAR-TERM CREDIT PROFILES
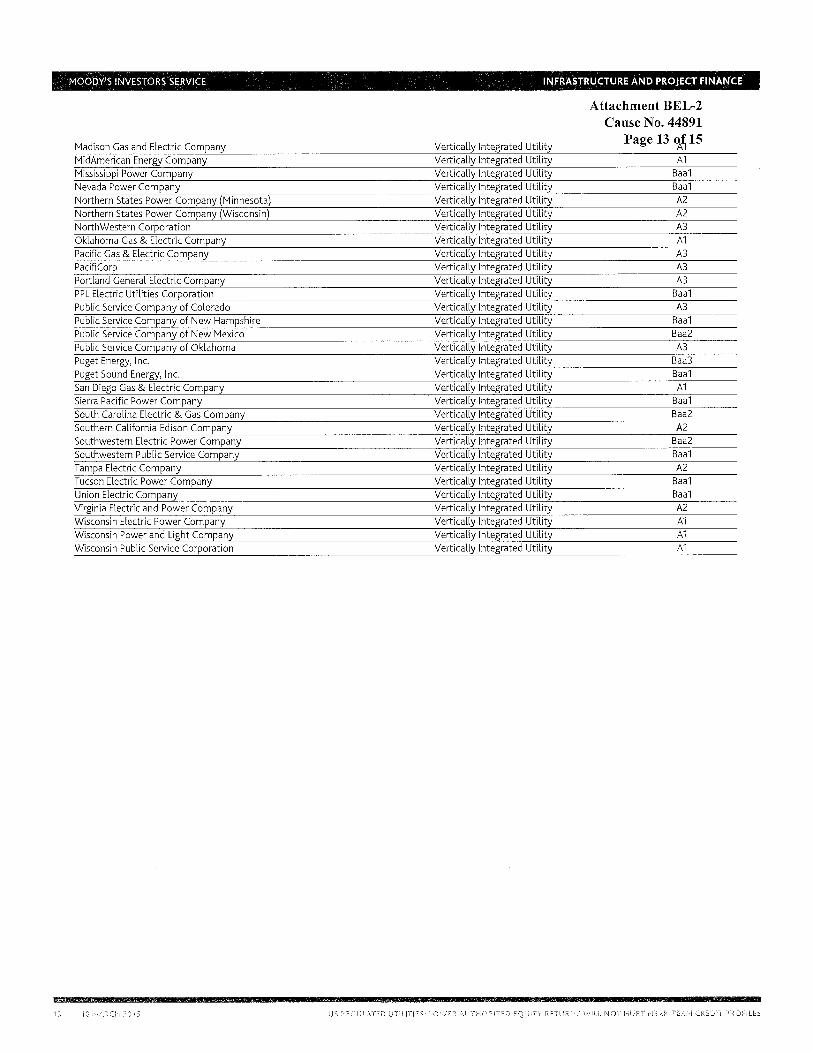
13
MOODY'S INVESTORS SERVICE INFRASTRUCTURE AND PROJECT FINANCE
Madison Gas and Electric Company MidAmerican Energy Company Mississippi Power Company Nevada Power Company Northern States Power Company (Minnesota) Northern States Power Company (Wisconsin) NorthWestern Corporation Oklahoma Gas & Electric Company Pacific Gas & Electric Company PacifiCorp Portland General Electric Company PPL Electric Utilities Corporation Public Service Company of Colorado Public Service Company of New Hampshire Public Service Company of New Mexico Public Service Company of Oklahoma Puget Energy, Inc. Puget Sound Energy, Inc. San Diego Gas & Electric Company Sierra Pacific Power Company South Carolina Electric & Gas Company Southern California Edison Company Southwestern Electric Power Company Southwestern Public Service Company Tampa Electric Company Tucson Electric Power Company Union Electric Company Virginia Electric and Power Company Wisconsin Electric Power Company Wisconsin Power and Light Company Wisconsin Public Service Corporation
10 MARCH 2015
Vertically Integrated Utility Vertically Integrated Utility Vertically Integrated Utility Vertically Integrated Utility Vertically Integrated Utility Vertically Integrated Utility Vertically Integrated Utility Vertically Integrated Utility Vertically Integrated Utility Vertically Integrated Utility Vertically Integrated Utility Vertically Integrated Utility Vertically Integrated Utility Vertically Integrated Utility Vertically Integrated Utility Vertically Integrated Utility Vertically Integrated Utility Vertically Integrated Utility Vertically Integrated Utility Vertically Integrated Utility Vertically Integrated Utility Vertically Integrated Utility Vertically Integrated Utility Vertically Integrated Utility Vertically Integrated Utility Vertically Integrated Utility Vertically Integrated Utility Vertically Integrated Utility Vertically Integrated Utility Vertically Integrated Utility Vertically Integrated Utility
Attachment BEL-2 Cause No. 44891
Page 13 q,_~ 15 A1
Baa1 Baa1 A2 A2 A3 A1 A3 A3 A3
Baa1 A3
Baa1 Baa2 A3
Baa3 Baa1
A1 Baa1 Baa2 A2
Baa2 Baa1 A2
Baa1 Baa1 A2 A1 A1 A1
US REGULATED UTILITIES: LOWER AUTHORIZED EQUITY RETURNS WILL NOT HURT NEAR-TERM CREDIT PROFILES
Attachment BEL-2 Cause No. 44891
Page 14 of15 © 2015 Moody's Corporation, Moody's Investors Service, Inc, Moody's Analytics, Inc and/or their licensors and affiliates (collectively, "MOODY'S") All rights reserved.
CREDIT RATINGS ISSUED BY NOODY'S INVESTORS SERVICE, INCAFlu ITS RATINGS AFFILIATES ("MIS") AlffHOODY'S CURRENT OPINIONS OF THEREIATIVE FUTURE CREDIT RISK OF ENTITIES, CREDIT COMMITMEl~TS, OR DEBT OR DEBT-LIKE SECURITIES, AND CREDIT RATINGS Ai~D RESEARCH PUBLICATIONS PUBLISHED BY MOODY'S ("lv!OODY'S PUBLICATIONS") MAY l~ICLUDE MOODY'S CURRENT OPINIONS OF THE RELATIVE FUTURE CREDIT RISK OF ENTITIES, CREDIT COMMITMENTS, OR DEBT OR DEBTLIKE SECURITIES. MOODY'S DEFINES CREDIT RISK AS THE RISK THAT A~~ El~TITY MAY NOT MEET ITS CONTRACTUAL, FINANCIAL OBLIGATIONS AS THEY COME DUE 1\~ID ANY ESTIMATED FINANCIAL LOSS IN THE EVENT OF DEFAULT. CREDIT RATINGS DO NOT ADDRESS Ar,IY OTHER RISK, INCLUDll~G BUT NOT LIMITED TO: LIQUIDITY RISK, MARKET VALUE RISK, OR PRICE VOLATILITY. CREDIT RATINGS mo MOODY'S OPINIONS INCLUDED IN MOODY'S PUBUCATIO~IS ARE NOT STATEMENTS OF CURRENT OR HISTORICAL FACT MOODY'S PUBLICATIONS MAY ALSO INCLUDE QUANTITATIVE MODEL-BASED ESTIMATES OF CREDIT RISK AND RELATED OPINIONS OR COMMENTARY PUBLISHED BY HOOD Y'S ANALYTICS, INC. CREDIT RATINGS AND MOODY'S PUBLICATIONS DO t··IOT CONSTITUTE OR PROVIDE INVESTMENT OR FINANCIAL ADVICE, AND CREDIT RATINGS A~ID MOODY'S PUBLICATIONS ARE NOT AND DO NOT PROVIDE RECOHMENDATIONS TO PURCHASE, SELL, OR HOLD PARTICULAR SECURITIES. ~I EITHER CREDIT RATl~·IGS NOR MOODY'S PUBLICATIONS COMMENT ON THE SUITABILITY OF AN i"IVESTMENT FOR ANY PARTICULAR INVESTOR. MOODY'S ISSUES ITS CREDIT RATINGS Al~D PUBLISHES MOODY'S PUBLIC.ATIOl'lS WITH THE E)(PECTATlmJ AND UNDERSTANDING THATEACH INVESTOR WILL, WITH DUE CARE, MAKE ITS OWN STUDY AND EVALUATIOi>J OF EACH SECURITY THAT IS uemER CONSIDERATION FOR PURCHASE, HOLDING, OR SALE.
MOODY'S CREDIT RATl1\IGS A~ID MOODY'S PUBLICATIONS ARE NOT INTENDED FOR USE BY RETAIL INVESTORS AND IT WOULD BE RECKLESS FOR RETAIL INVESTORS TO CONSIDER MOODY'S CREDIT RATINGS OR MOODY'S PUBLICATIONS IN MA!<lr>JG A~IY INVESH1ENT DECISION. IF IN DOUBT YOU SHOULD CONTACT YOUR FINANCIAL OR OTHER PROFESSIONAL ADVISER.
ALL INFORMATION CONTAli~ED HEREl~J IS PROTECTED BY LAW, INCLUDING BUT NOT LIMITED TO, COPYRIGHT LAW, AND l~ONE OF SUCH INFORMATION MAY BE COPIED OR OTHERWISE REPRODUCED, REPACKAGED, FURTHER TRANSMITTED, TRANSFERRED, DISSEMINATED, REDISTRIBUTED OR RESOLD, OR STORED FOR SUBSEQUENT USE FOR ANY SUCH PURPOSE, II~ WHOLE OR IN PART, IN A~N FORM OR MM,f\IER OR BY ANY MEANS WHATSOEVER, BY ANY PERSON WITHOUT MOODY'S PRIOR WRITTEN CONSEl~T.
All information contained herein is obtained by MOODY'S from sources believed by it to be accurate and reliable. Because of the possibility of human or mechanical error as well as other factors, however, all information contained herein is provided "AS IS" without warranty of any kind. MOODY'S adopts all necessary measures so that the information it uses in assigning a credit rating is of sufficient quality and from sources MOODY'S considers to be reliable including, when appropriate, independent third-party sources. However,
MOODY'S is not an auditor and cannot in every instance independently verify or validate information received in the rating process or in preparing the Moody's Publications.
To the extent permitted by law, MOODY'S and its directors, officers, employees, agents, representatives, licensors and suppliers disclaim liability to any person or entity for any indirect1 special, consequential, or incidental losses or damages whatsoever arising from or in connection with the information contained herein or the use of or Inability to use any such information, even if MOODY'S or any of its directors, officers, employees, agents, representatives, ti censors or suppliers is advised in .advance of the possibility of such losses or damages, including but not limited to: (a) any loss of present or prospective profits or (b) any loss or damage arising where the relevant financial instrument is not the subject of a particular credit rating assigned by MOODY'S.
To the extent permitted by law, MOODY'S and its directors, officers, employees, agents, representatives, licensors and suppliers disclaim liability for any direct or compensatoro; losses or damages caused to any person or entity, including but not limited to by any negligence (but excluding fraud, willful misconduct or any other type of liability that, for the avoidance of doubt, by law cannot be excluded) on the part of, or any contingency within or beyond the control of, MOODY'S many of its directors, officers, employees. agents, representatives, Ucensors or suppliers, arising from or in connection \1vith the information contained herein or the use of or inability to use any such information
NO WARR,ANTY, EXPRESS OR IMPLIED, AS TO THE ACCURACY, TIMELINESS, COMPLETENESS, MERCHANTABILITY OR FITNESS FOR ANY PARTICULAR PURPOSE OF ANY SUCH RATING OR OTHER OPINION OR INFORMATION IS GIVEI~ OR MADE BY MOODY'S ll>J ANY FORM OR MANNER WHATSOEVER.
Moody's Investors Service, Inc., a wholly-owned credit rating agency subsidiary of Hoody's Corporation ("t,ICO"), hereby discloses that most issuers of debt securities (including
corporate and municipal bonds, debentures, notes and commercial paper) and preferred stock rated by Moody's Investors Service, Inc. have, prior to assignment of any rating, agreed to pay to Moody's Investors Service, Inc. for appraisal and rating services rendered by it fees ranging from $1,500 to approximately $2,500.000. MCO and MIS also maintain policies and procedu1es to address the independence of MIS's ratings and rating processes. Information regarding certain affiliations that may e'ist between directors cf MCO and rated entities, and between entities who hold ratings from MIS and have also publicly reported to the SEC an ownership interest in MCO of more than 5%, is posted annually at www.moodys.com underthe heading "Investor Relations- Corporate Governance - Director and Shareholder Affiliation Policy."
For Australia only: Any publication into Australia of this document is pursuant to the Australian Financial Services License of MOODY'S affiliate, Moody's Investors Service Pty Limited ABN 61 003 399 657.~FSL 336969 and/or Moody's Analytics Australia Pty Ltd ABN 94105 136 972 AFSL 383569 (as applicable). This document is intended to be provided only to "wholesale clients" within the meaning of section 761G of the Corporations Act 2001. By continuing to access this document from within Australia, you represent to MOODY'S that you are, or are accessing the document as a representative of, a "wholesale client" and that neither you nor the entity you represent will directly or indirectly disseminate this document or its contents to (lretail clients" 1..vithin the meaning of section 761G of the Corporations Act 2001. MOODY'S credit rating is an opinion as to the
creditworthiness of a debt obligation of the issuer, not on the equity securities of the issuer or any form of security that is available to retail clients. lt would be dangerous for "retail clients" to make any investment decision based on MOODY'S credit rating. If in doubt you should contact your financial or other professional adviser.
for Japan only: Moody's Japan K.K. ("MJKK") is a wholly-owned credit rating agency subsidiary of Moody's Group Japan G.K., which is wholly-owned by Moody's Overseas Holdings Inc., a wholly-owned subsidiary of MCO. Moody's SF Japan K.K. ("MSFJ") is a wholly-owned credit rating agency subsidiary of HJKK. MSFJ is not a Nationally Recognized Statistical Rating Organization (''IVIRSRO"). Therefore, credit ratings assigned by i'ISFJ are Non-NRSRO Credit Ratings. Non-NRSRO Credit Ratings are assigned by an entity that is not a NRSRO and, consequently, the rated obligation will not qualify for certain types of treatment under U.S. laws. MJKK and MSFJ are credit rating agencies registered with the Japan Financial Services _Agency and their registration numbers are FSA Commissioner (Ratings) l\Jo, 2 and 3 respectively.
MJKK or MSFJ (as applicable) hereby disclose that most issuers of debt securities (including corporate and municipal bonds, debentures. notes and commercial paper) and preferred
stock rated by MJKK or HSFJ (as applicable) have, prior to assignment of any rating, agreed to pay to Mjt~I< or MSFJ (as applicable) for appraisal and rating services rendered by it fees ranging from JPYZ00,000 to approximately JPY350,000,000.
MJKK and MSFJ also maintain policies and procedures to address Japanese regulatOf'f req'Jirements.
MOODY'S INVESTORS SERVICE INFRASTRUCTURE AND PROJECT FINANCE
ANALYST CONTACTS
NEW YORK
Mihoko Manabe Senior Vice President [email protected]
Michael Haggarty Associate Managing Director [email protected]
William L. Hess Managing Director - Utilities [email protected]
Moony's INVESTORS SERVICE
15 10 MARCH 2015
212-553-1653
212-553-1942
212-553-7172
212-553-3837
Attachment BEL-2 Cause No. 44891
Page 15 of15
US REGULATED UTILITIES: LOWER AUTHORIZED EQUITY RETURNS WILL NOT HURT NEAR-TERM CREDIT PROFILES
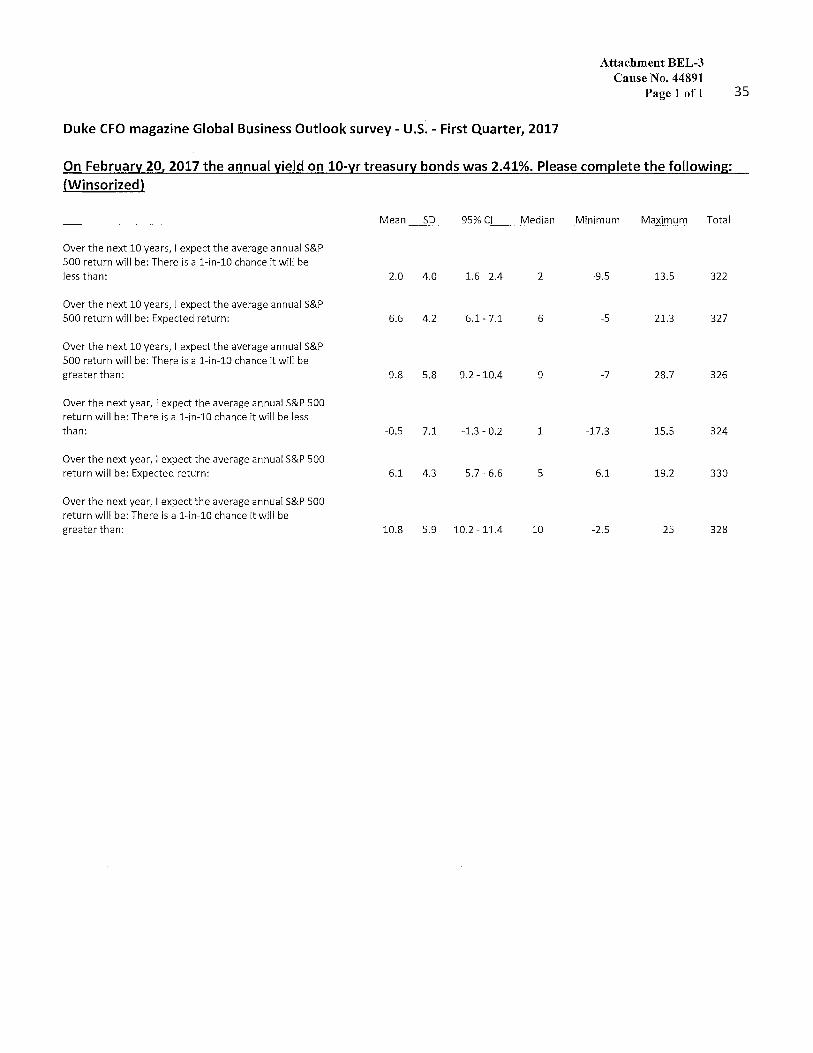
Attachment BEL-3 Cause No. 44891
Page 1 ofl 35
Duke CFO magazine Global Business Outlook survey - U.S. - First Quarter, 2017
On February 201 2017 the annual yield on 10-yr treasury bonds was 2.41%. Please comRlete the following: (Winsorized)
Mean SD 95%CI Median Minimum Maximum Total
Over the next 10 years, I expect the average annual S&P 500 return will be: There is a 1-in-10 chance it will be less than: 2.0 4.0 1.6- 2.4 2 -9.5 13.5 322
Over the next 10 years, I expect the average annual S&P 500 return will be: Expected return: 6.6 4.2 6.1- 7.1 6 -5 21.3 327
Over the next 10 years, I expect the average annual S&P 500 return will be: There is a 1-in-10 chance it will be greater than: 9.8 5.8 9.2 -10.4 9 -7 28.7 326
Over the next year, I expect the average annual S&P 500 return will be: There is a 1-in-10 chance it will be less than: -0.5 7.1 -1.3 - 0.2 1 -17.3 15.5 324
Over the next year, I expect the average annual S&P 500 return will be: Expected return: 6.1 4.3 5.7- 6.6 5 -6.1 19.2 330
Over the next year, I expect the average annual S&P 500 return will be: There is a 1-in-10 chance it will be greater than: 10.8 5.9 10.2 -11.4 10 -2.5 25 328
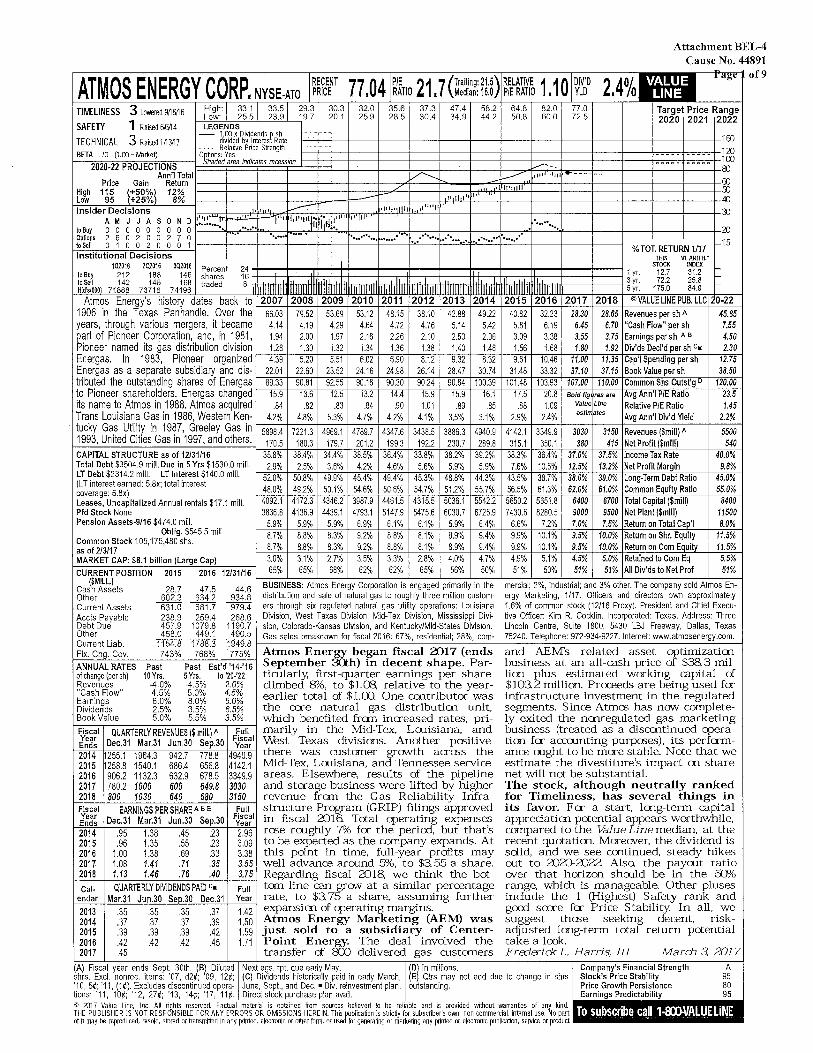
TllllELINESS
SAFETY
TECHNICAL
3 Lowered9J16/16
1 Raised IW/14
3 Raised 1A3/17 BETA . 70 (1.00 = Muke~
2020-22 PROJECTIONS Ann'I Total
High: 33.1 33.5 29.3 f--=L"'ow'-":'-'--'2""5"'.5'-'--=2'-"3"'.9-'-..;19. 7
LEGENDS - 1.00 x Dividends ~ sh
• • . • ~i~j~~e b~~g~~":.n~~m O~~~~~/:~a indicams recession
Price Gain Return 1---+----1--High 11955 (+50%) 12% Low (+25%) 8%
Insider Decisions '"'ii"i=i't;:;;:!!~''~"~''b;';r. A M J J A s 0 N D 1•" 11 I' '" 1' I
toBuy 0 0 0 0 0 0 0 0 0 .......... , ••• "••"'•·· Options 260200270 .... to Sell 0 1 0 0 2 0 O O 1 1----1----1--
30.3 20.1
32.0 25.9
35.6 28.5
37.3 30.4
47.4 34.9
58.2 44.2
64.8 50.8
82.0 60.0
77.0 72.5
Attachment BEL-4 Cause No. 44891
Target Price Range 2020 2021 2022
-+----+---+----+----+--+---+----lf----t---+--+---+----1-160 ----- 120
-+----+---+----+----+--+---+-_..,-.--lf----t---+--~-=-~-~--=-'"=-~-~--=-,..+-100 -+---t---J--:;:;::-+----+--+-""":::::>..-f:::r'rr.--':1...iF=::-::-:1::-::--+---t---t----t-lll v ............... t..--""' 1Jlf •111 - - - - - -
-+---t--/-7"-F----P-~-+---... ~.m11"-1•~.,"'11jl.IJ'----1t----t---t--t----+---1-~ ~-i==~--==-+----1-----1~11·~11 ·• 14'_''_··--l-·--+----+----+--+---l---i----l-40 ..,,,,-n-,.r,m,.o'f-'-'"~··~·"~'·~·~··-•"_"'-tl'---t---+--+----+----t--+----t---t----+-:Il 1'' I ,1·111· ······ .... "'-*.-._-.. 7 •• -".~ •• - •• -... ~.~ •• 1--.~ ••• -•• ~ •• -•• ~ ••• -•• -•• 4.-•• -•• -••• -•. + .. -... -..•.. ..:r--...::.i~-+----+---+---t----l-20
% TOT. RETURN 1/17 - 15 Institutional Decisions THIS VLARITH.'
1Q2016 2Q2016 3Q2016 Percent 24 • -+I +---+--,........1----+----+H--+-.---++---1+----+----1 1 yr. s~~ ·~~: : toBuy 212 188 146 shares 16- 1 " 1 1.1. 1 11 11 3 722 258 m:.::1001 11J:~ 73m 74~~g traded 8 Ill .. 5~;: 175:0 84:9 -
Atmos Energy's history dates back to l-'2""'0"""0-'-1+'2"'0'""0-'-8+2=0'""'0-'-9-+=20'--1'"'"0-+=20-'-1'""'1-+"2-'-01-'--'2"-+"2=0-'-13'-+'2""'0"""14-'-+2""'0'""'1"""5-+=20'--1'""6-+=2-'-01'""'7-+"2-'-01~8-+-_©~VAL~U~E~Ll~NE~P~UB_.L_Lc,~:o_-2_2-; 1906 in the Texas Panhandle. Over the 66.03 79.52 53.69 53.12 48.15 38.10 42.88 49.22 40.82 32.23 28.30 28.65 Revenues per sh A 45.85 years, through various mergers, it became 4.14 4.19 4.29 4.64 4.72 4.76 5.14 5.42 5.81 6.19 6.45 6.70 "Cash Flow" per sh 7.55 part of Pioneer Corporation, and, in 1981, 1.94 2.00 1.97 2.16 2.26 2.10 2.50 2.96 3.09 3.38 3.55 3.75 Earnings per sh A e 4.50 Pioneer named its gas distribution division 1.28 1.30 1.32 1.34 1.36 1.38 1.40 1.48 1.56 1.68 1.80 1.92 Div'dsDecl'dpershc• 2.30 Energas. In 1983, Pioneer organized +--.,...4.3=9-+--.5~.2.,,..o +--~5.=51-+--.6,....0.,,..2 +--.,,..6.9=0+---.8~.1~2 +--~9.=32c-t-.... 8~.3=2+-~9~.6.,...1 i---.1.,,..0.47"6-+-.,.,11'"".o"""o r-,1,,..1.3=5rl=ca-p'""'J s.-p-en .... d'"'ing~p-e-r s..,.h--+--,,12 ..... 1,...,5 Energas as a separate subsidiary and dis- 22.01 22.60 23.52 24.16 24.98 26.14 28.47 30.74 31.48 33.32 37.10 37.15 Book Value per sh 38.50 tributed the outstanding shares of Energas i----.8.,,..9.3=3-+-=90'"".8.,...1 ,._..,9"""2.5=5rl-=90'"".1"""6 ,._..,9"""0.3=0+--=90'"'1.,...4 +....9=0.~54.+c1=00~.3=9+->10"'1-..48,,-+-1'""0.,,..3.9""3-+-.1"'07'"".o"""o +--=11"'"0.=oorl=co_m_m-on .... s""h~s """ou-.ts...,t'-g "'"0 -1-o1""20'""'.oc.-10 to Pioneer shareholders. Energas changed 15.9 13.6 12.5 13.2 14.4 15.9 15.9 16.1 17.5 20.8 Boldf/g resare AvgAnn'IP/ERatio 23.5 its name to Atmos in 1988. Atmos acquired .84 .82 .83 .84 .90 1.01 .89 .85 .88 1.09 va1ueune Relative PIE Ratio 1.45 Trans Louisiana Gas in 1986, Western Ken- 4.2% 4.8% 5.3% 4.7% 4.2% 4.1% 3.5% 3.1% 2.9% 2.4% esunates AvgAnn'IDiv'dYield 2.2% lucky Gas Utility in 1987, Greeley Gas in ,_5_8-98-.4+-72-21-.3-+-4-96-9.-1 +-4-78-9-.7-43-47-.6-+-3-43-8.5-+-3-88-6-.3-+-49-40-.9-+-4-14-2.-1 .... 3_3-49-.9-+--30-30-+--3-15-0 .... R-ev-en-u-es-($_m_ill_) A--+-55-0--<0 1993, United Cities Gas in 1997, and others. 170.5 180.3 179.7 2011 199.3 192.2 230.7 289.8 315.1 350.1 380 415 NetProfit!$mill) 540 CAPITAL STRUCTURE as of 12/31/16 35.8% 38.4% 34.4% 38.5% 36.4% 33.8% 38.2% 39.2% 38.3% 36.4% 37.0% 37.5% Income Tax Rate 40.0% Total Debt $3504.9 mill.Due in 5 Yrs $1530.0 mill. 2.9% 2.5% 3.6% 4.2% 4.6% 5.6% 5.9% 5.9% 7.6% 10.5% 12.5% 13.2% Net Profrt Margin 9.8% LT Debt $2314.2 mill. LT Interest $140.0 mill. 1-=-52"'.0""3'+-5=0""'.8""%-t-4""9.°"9'/ic-, +..,.45"".4'°'"%~4~9"'.4""'%-+-4~5..,..3""%+--4""8.°"8'/ic-, rl-44°".3""'/i""", +....4"'3.5,,.;%""", f-.,.38"'.7""%'+-3=8 ..... 0.;.-,%-t-3=9.~0%07,+.L-o-ng-.-l~erm--coDc"e~bt~R-,ati"""·o-f--c45'"'.o""%,.-; (LT interest earned: 5·8x; total interest 48.0% 49.2% 50.1% 54.6% 50.6% 54.7% 51.2% 55.7% 56.5% 61.3% 62.0% 61.0% Common Eauitv Ratio 55.0% coverage: 5.8x) Leases, Uncapitalized Annual rentals $17.1 mill. 4092.1 4172.3 4346.2 3987.9 4461.5 4315.5 5036.1 55421 5650.2 5651.8 6400 6700 Total Capital ($mill) 8400 Pfd Stock None 3836.8 4136.9 4439.1 4793.1 5147.9 5475.6 6030.7 6725.9 7430.6 8280.5 9000 9500 Net Plant ($mill) 11500 PenslonAssets-9/16$474.0mill. 5.9% 5.9% 5.9% 6.9% 6.1% 6.1% 5.9% 6.4% 6.6% 71% 7.0% 7.5% ReturnonTotalCap'l 8.0%
Obllg. $545.5 mill. 8.7% 8.8% 8.3% 9.2% 8.8% 8.1% 8.9% 9.4% 9.9% 10.1% 9.5% 10.0% Return on Shr. Equity 11.5% Common Stock 105,175,480 shs. as of 2/3/17 8.7% 8.8% 8.3% 9.2% 8.8% 8.1% 8.9% 9.4% 9.9% 10.1% 9.5% 10.0% Return on Com Equity 11.5% MARKET CAP: $8.1 billion (Large Cap) 3.0% 3.1% 2.7% 3.5% 3.3% 2.8% 4.0% 4.7% 4.9% 5.1% 4.5% 5.0% Retained to Com Eq 5.5% CURRENT POSITION 2015 2016 12/31/16 1---65_%...1..._6_5_%_,___6_8'1i_o ..___62_%-'-_6_2_%....1..._6_5_%...1..._5_6'1i_o _,___50_%_, ..___5_1'1i_o ...__50_%...1..._5_1_%_,___5_1%_0_,_Al_l_D_iv_'d_s t_o_N_et_P_ro_f _.___51_%--l
($MILL.) BUSINESS: Atmos Energy Corporation is engaged primartly in the mercial; 2%, industrtal; and 3% other. The company sold Atmos En· 8r~~/ssets 6B~:~ 6~X:~ 9~~:g distribution and sale of natural gas to roughly three million custom· ergy Marketing, 1/17. Officers and directors own approximately Current Assets 631.0 681.7 979.4 ers through six regulated natural gas utility operations: Louisiana 1.6% of common stock (12/16 Proxy). President and Chief Execu-Accts Payable 238.9 259.4 268.6 Division, West Texas Division, Mid-Tex Division, Mississippi Divi- live Officer: Kim R. Cocklin. Incorporated: Texas. Address: Three Debt Due 457.9 1079.8 1190.7 sion, Colorado-Kansas Division, and Kentucky/Mid-States Division. Lincoln Centre, Suite 1800, 5430 LBJ Freeway, Dallas, Texas Other 458.0 449.1 490.5 Gas sales breakdown for fiscal 2016: 67%, residential; 28%, com· 75240. Telephone: 972-934-9227. Internet: www.atmosenergy.com. Current Liab. 1154.8 1788.3 1949.8 1------------------------'---------------'-'----l Fix. Chg. cov. 743% 768% 775% Atmos Energy began fiscal 2017 (ends and AEM's related asset optimization ANNUAL RATES Past Past Est'd '14-'16 September Dh) in decent shape. Par- business at an all-cash price of $38.3 mil-ofchange (persh) 10Yrs. 5Yrs. to'20-'22 tirularly; first-quarter earnings per share lion plus estimated working capital of Revenues -4.0% -4.5% 2.0% climbed ff'/o, to $1.08 relative to the year- $103.2 million. Proceeds are being used for "Cash Flow" 4.5% 5.0% 4.5% earlier total of $1.CD. One ccntributor was infrastructure investment in the regulated Earnings 6.0% 8.0% 6.0% Dividends 2.5% 3.5% 6.5% the core natural gas distribution unit, segments. Since Atmos has novv complete-Book Value 5.0% 5.5% 3.5% which benefited from increased rates, pri- ly exited the nonregulated gas marketing ~~~~I QUARTERLYREVENUES($miJl.)A ~~~~1 marily in the Mid-Tex, La.iisiana, and business (treated as a discontinued opera-Ends Dec.31 Mar.31 Jun.30 Sep.30 Year West Texas divisions. Another positive tion for acccunting purposes), its perform-2014 255.1 1964.3 942.7 778.8 4940.9 there was rustomer grovvth across the ance a.ight to be more stable. Note that we 2015 258.8 1540.1 686.4 656.8 4142.1 Mid-Tex, Looisiana, and Tennessee service estimate the divestiture's impact on share 2016 906.2 1132.3 632.9 678.5 3349.9 areas. Elsewhere, results of the pipeline net will not be substantial. 2017 780.2 1000 600 649.8 3030 and storage business were lifted by higher The stock, although neutrally ranked 2018 800 1030 640 680 3150 revenue from the Gas Reliability Infra- for Timeliness, has several things in Fiscal EARNINGSPERSHAREABE Full structure Program (GRIP) filings approved its favor. Fer a start, long-term capital l~J~ Dec.31 Mar.31 Jun.30 Sep.30 F~~~~J in fiscal 2016. Total operating expenses appreciation potential appears wcrthwhile,
'""2~0~14.,..-+-.9~5-~1~.3~8--.~45~~.2~3-+-~2~.9..,..,6 rose ra.ighly 7% for the pericxi, but that's compared to the Value Line median, at the 2015 .96 1.35 .55 .23 3.09 to be expected as the company expands. At recent quotation. Moreover, the dividend is 2016 1.00 1.38 .69 .33 3.38 this point in time, full-year profits may solid, and we see continued, steady hikes 2011 1.08 1.41 .71 .35 3.55 well advance ara.ind !Pia, to $3.55 a share. a.it to 20ID2022 Also the paya.it ratio
,_2_0_18-+_1_.1_3 __ 1.4_6 __ .7_6 __ .4_0-+-_3_.7_,5 Regarding fiscal 2018, we think the bot- over that horizon shoold be in the EIJ>la Cal· QUARTERLY DIVIDENDS PAID c. Full tom line can grO\l\T at a similar percentage range, which is manageable. Other pluses
endar Mar.31 Jun.30 Seo.30 Dec.31 Year rate, to $3. 75 a share, assuming further include the 1 (Highest) Safety rank and '""2-0-13--+~.3~5~~.3~5~~.-35--.3-7-+--1-.4-<2 expansion of operating margins. gocd score for Price Stability. In all, we
2014 .37 .37 .37 .39 1.50 Atmos Energy Marketing (AEM) was suggest those seeking decent, risk-2015 .39 .39 .39 .42 1.59 just sold to a subsidiary of Center- adjusted long-term total return potential 2016 .42 .42 .42 .45 1.71 Point Energy. The deal involved the take a look. 2017 .45 transfer of 8'.D delivered gas rustomers Fre:Jerick L. Harris, III March 3 2017
(A) Fiscal year ends Sept. 30th. (B) Diluted I Next egs. rpt. due early May. I (D) In millions. Company's Financial Strength A shrs. Exel. nonrec. Items: '07, d2¢; '09, 12¢; (C) Dividends historically paid in early March, (E) Qtrs may not add due to change in shrs Stock's Price Stability 95 '10, 5¢; '11, (1¢). Excludes discontinued opera- June, Sept., and Dec.• Div. reinvestment plan. outstanding. Price Growth Persistence 80 lions: '11, 10¢; '12, 27¢; '13, 14¢; '17, 11¢. Direct stock purchase plan avail. Earnings Predictability 95 © am Value Line, Inc. All ligh1s reserved. F ac1!Jal mamrial is obtiined from sources believed 1D be reliable and Is provided without warranties of any kind.111111 THE PUBLISHER IS NOT RESPONSIBLE FOR ANY ERRORS OR OMSSIONS HEREIN. Thisdublication is strictly for subscribers own, non-commercial, inmmal use. No part • ,.,,.,, I ' :-1 I 1
of it may be reproduced, resold, s1Dred or transmitlEd in any plinmd, electronic or other form, or use for generating or marl<eting any plinmd or electronic publication, service or product
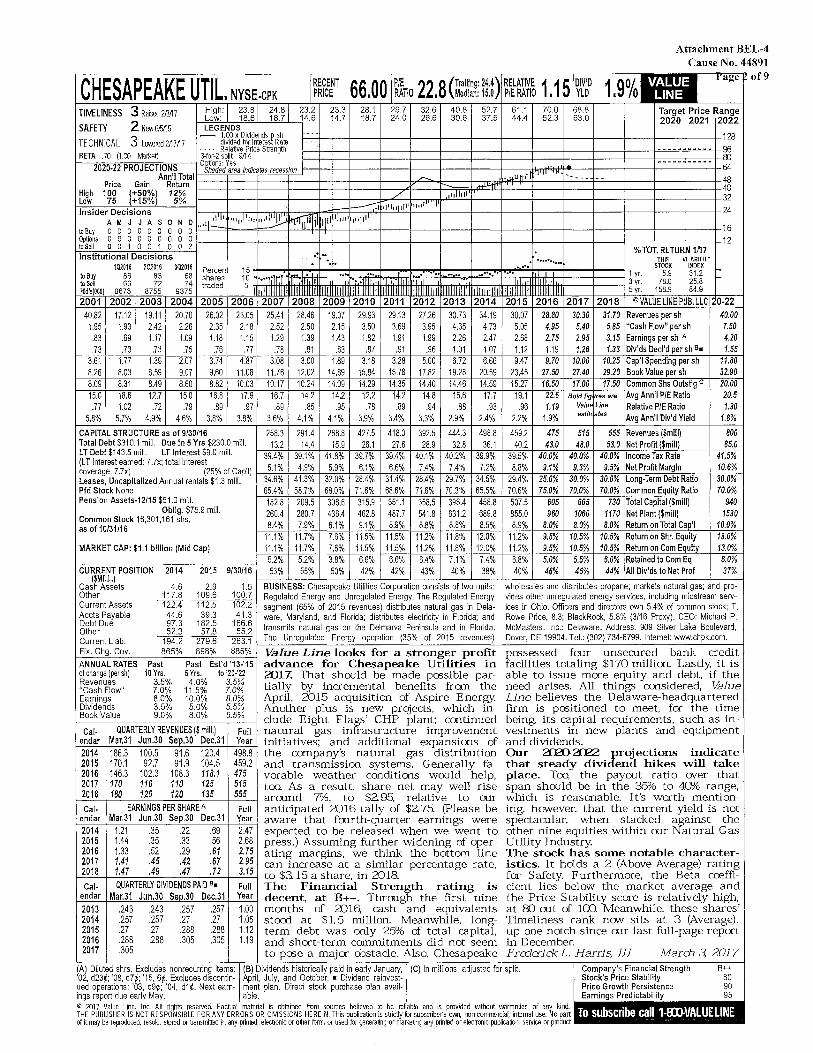
Attachment BEL-4 Cause No. 44891
.C ._H_E~Ae_E_A_K_f__;UJlL~~~-lRE_ce_NT_6_6_0Q..__IP/E_1g_!(_Tra-iling-:24_.4)+-RE-LAT-IVE_1_1i..__DIV-'D _1~9~0'0 ~ rage ~ of 9 ~ 1 NYSE-CPK PRICE , RATIO , Median: 15.0 P/E RATIO , YLD /( ~
TllVE LINESS
SAFETY
TECHNICAL
3 Raised2/3/17
2 New61.ii15
High: 23.8 24.8 23.2 23.3 28.1 29.7 32.6 40.8 52.7 61.1 70.0 68.8 Target Price Range 2020 2021 2022 l-'-L~ow~=~-1~8~.6~~1~8~.7~~14.6
LEGENDS 14.7 18.7 24.0 26.6 30.6 37.5 44.4 52.3 63.0
3 L01'.ered2i1W - a~exl~~~~sme -+----t--+---+--+----t--+----1---1----11----1----11----1-128 • • • • Relative Price Streng1h
f-B_E_TA=. 7=0~(1.=00==~Ma=nre=~~~---1 t~~~s~~~ 9M 2020-22 PROJECTIONS ~haded area indicatBs recession
.......... 96. -+----1--+----1--+----1--+----1---1----11----+-.~.~--~--1-.~.~-~ •• -+-oo -+----t--+---+--+----t---,H,ont'l+rl'f~-,__--1---1----11----1----1r64
Ann'I Total Price Gain Return 1---+----t--
,,..__ U11ii ·1·1 '"· ..... ___ --
==lt==t==:;::t~js~~~~~~=t~~~:::t:==::t===t==:t~ High 10705 !+50%1 12% Low +15% 5% Insider Decisions
AMJJASON toBuy 0 0 0 0 0 0 0 0 Options 09000000 toSeD 0 0 1 0 0 1 0 0 Institutional Decisions
D u••l~11.11111,111i11111Jhjl 0
-+---:1,......,,,,1--+--=TTiTl'"""'''-'''-''1+----t--+----t---+----tr---+----tl----+-32 ~~::::+----::;_.,.,,..~1~·'~''1~11~'''4'-'''_''_""11+----+--+----+--+----+--+----1f----1----ir24 il1J1'1I•llJI -+----+--+----+--+----+--+----t---1----t1----1----t1----1-16
,..12 ~ 1---1----1--% TOT. RETURN 1117
1Q2016 2Q2016 3Q2016 to Buy 86 83 68 to Sell 66 72 74 Hld's(OOO 8673 8755 9375
Percent shares traded
. ·········· .... THIS Vl.ARITH." STOCK INDEX
~tt;;;w··~· i· tit:lmilii:~· ;;;·::;··t,;·;···~-~~-~···::'.··~·t;·~· lliHUllir!hlltttt==+==11 yr. 5.9 31.2 '" •.n "rllll!Jlhlk--: 3 yr. 78.0 25.8 ....
11111 1111111111 111111~ 111111111 11111111111 1111111111 1111111111 5yr. 158.9 84.9 2005 2006 2007 2010 2011 2012 2013 2014 2015 2016 2017 2018 ©VALUELINEPUB.LLC 0-22 2008 2009 2001 2002 2003 2004
40.82 17.12 19.11 20.70 26.02 23.05 28.46 19.07 29.93 29.13 27.26 30.73 34.19 30.07 28.80 25.41 30.30 31.70 Revenues per sh 40.00 1.95 1.93 2.42 2.26 2.35 2.18 2.50 2.15 3.50 3.69 3.95 4.35 4.73 5.05 4.95 2.52 5.40 5.85 "Cash Flow" per sh 7.50
.83 .69 1.17 1.09 1.18 1.15 1.39 1.43 1.82 1.91 1.99 2.26 2.47 2.68 2.75 1.29 2.95 3.15 Earnings per sh A 4.20
.73 .73 .73 .75 .76 .77 .81 .83 .87 .91 .96 1.01 1.07 1.12 1.19 .78 1.26 1.33 Div'ds Decl'd per she. 1.55 3.61 1.77 1.39 2.07 3.74 4.87 3.00 1.89 3.18 3.28 5.00 6.72 6.66 9.47 9.70 3.08 10.00 10.25 Cap'I Spending per sh 11.80 8.26 8.03 8.59 9.07 9.60 11.08 12.02 14.89 15.84 16.78 17.82 19.28 20.59 23.45 27.50 11.76 27.40 29.20 Book Value per sh 32.90 8.09 8.31 8.49 8.60 8.82 10.03 10.24 14.09 14.29 14.35 14.40 14.46 14.59 15.27 16.50 10.17 17.00 17.50 Common Shs Outst'g c 20.00 15.0 18.6 12.7 15.0 16.8 17.9 14.2 14.2 12.2 14.2 14.8 15.6 17.7 19.1 22.6 16.7 Bold fig res are Avg Ann'I PIE Ratio 20.5 .77 1.02 .72 .79 .89 .97 .85 .95 .78 .89 .94 .88 .93 .96 1.19 .89 Value Line Relative P/E Ratio 1.30
4.1% 4.1% 3.9% 3.4% 3.3% 2.9% 2.4% 2.2% 1.9% 5.8% 5.7% 4.9% 4.6% 3.8% 3.8% 3.6% estin ates Avg Ann'I Div'd Yield 1.8%
MARKET CAP: $1.1 billion (Mid Cap)
CURRENT POSITION ($MILL.)
Cash Assets Other Current Assets Accts Payable Debt Due Other Current Liab. Fix. Chg. Gov.
2014
4.6 117.8 122.4 44.6 97.3 52.3
194.2 865%
2015
2.9 109.6 112.5 39.3
182.5 57.8
279.6 898%
9/30/16
1.5 100.7 102.2 41.3
166.6 55.2
263.1 885%
ANNUAL RATES of change (per sh) Revenues "Cash Flow" Earnings Dividends
Past 10Yrs.
3.5% 7.0% 8.0% 3.5% 9.0%
Past Est'd '13·'15 5 Yrs. to '20·'22 4.0% 3.5%
11.5% 7.0% 10.0% 8.0% 5.0% 5.5%
Book Value 8.0% 6.5%
Cal· QUARTERLY REVENUES($ mill.) Full endar Mar.31 Jun.30 Sep.30 Dec.31 Year 2014 186.3 100.5 91.6 120.4 498.8 2015 170.1 92.7 91.9 104.5 459.2 2016 146.3 102.3 108.3 118.1 475 2017 170 110 110 125 515 2018 180 120 120 135 555
Cal· EARNINGS PER SHARE A Full endar Mar.31 Jun.30 Sep.30 Dec.31 Year 2014 1.21 .35 .22 .69 2.47 2015 1.44 .35 .33 .56 2.68 2016 1.33 .52 .29 .61 2.75 2017 1.41 .45 .42 .67 2.95 2018 1.47 .49 .47 .72 3.15
Cal· QUARTERLY DIVIDENDS PAID e. Full endar Mar.31 Jun.30 Seo.30 Dec.31 Year 2013 .243 .243 .257 .257 1.00 2014 .257 .257 .27 .27 1.05 2015 .27 .27 .288 .288 1.12 2016 .288 .288 .305 .305 1.19 2017 .305
291.4 268.8 427.5 418.0 392.5 444.3 498.8 14.4 15.9 26.1 27.6 28.9 32.8 36.1
39.1% 41.8% 39.7% 39.4% 40.1% 40.2% 39.9% 4.9% 5.9% 6.1% 6.6% 7.4% 7.4% 7.2%
41.3% 32.0% 28.4% 31.4% 28.4% 29.7% 34.5% 58.7% 68.0% 71.6% 68.6% 71.6% 70.3% 65.5% 209.5 308.6 315.9 351.1 358.5 396.4 458.8 280.7 436.4 462.8 487.7 541.8 631.2 689.8 7.9% 6.1% 9.1% 8.9% 8.8% 8.8% 8.5%
11.7% 7.6% 11.5% 11.5% 11.2% 11.8% 12.0% 11.7% 7.6% 11.5% 11.5% 11.2% 11.8% 12.0% 5.2% 3.8% 6.6% 6.6% 6.4% 7.1% 7.4% 55% 50% 42% 42% 43% 40% 38%
BUSINESS: Chesapeake Utilities Corporation consists of two units: Regulated Energy and Unregulated Energy. The Regulated Energy segment (65% of 2015 revenues) distributes natural gas in Delaware, Maryland, and Florida; distributes electricity in Florida; and transmits natural gas on the Delmarva Peninsula and in Florida. The Unregulated Energy operation (35% of 2015 revenues)
Value Line looks for a stronger profit advance for Chesapeake Utilities in 2017. That should be made possible partially by incremental benefits from the April, 2015 acquisition of Aspire Energy. Another plus is new prqjects, which include Eight Flags' CHP plant; ccntinued natural gas infrastructure improvement initiatives; and additional expansions of the company's natural gas distribution and transmission systems. Generally favorable weather conditions would help, too. As a result, share net may well rise aroond 7%, to $2.95, relative to our anticipated 2016 tally of $2. 75. (Please be aware that fourth-quarter earnings were expected to be released when we went to press.) Assuming further widening of operating margins, we think the bottom line can increase at a similar percentage rate, to $3 15 a share, in 2018. The Financial Strength rating is decent, at B++. Through the first nine months of 2016, cash and equivalents stood at $1.5 million. Meanwhile, longterm debt was only 25"/o of total capital, and short-term commitments did not seem to pose a major obstacle. Also, Chesapeake
459.2 475 40.2 43.0
39.5% 40.0% 8.8% 9.1%
29.4% 25.0% 70.6% 75.0% 507.5 605 855.0 960 8.9% 8.0%
11.2% 9.5% 11.2% 9.5% 6.8% 5.0% 40% 46%
wholesales and distributes propane; markets natural gas; and pro· vides other unregulated energy services, including midstream services in Ohio. Officers and directors own 5.4% of common stock; T. Rowe Price, 8.3; BlackRock, 5.8% (3/16 Proxy). CEO: Michael P. McMasters. Inc.: Delaware. Address: 909 Silver Lake Boulevard, Dover, DE 19904. Tel.: (302) 734-6799. Internet: www.chpk.com.
possessed four unsecured bank credit facilities totaling $170 million. Lastly, it is able to issue more equity and debt, if the need arises. All things considered, Value Line believes the Delaware-headquartered firm is positioned to meet, for the time being, its capital requirements, such as investments in new plants and equipment and dividends. Our a:B).3)22 projections indicate that steady dividend hikes will take place. Too, the payout ratio over that span should be in the 35"/o to 40"/o range, which is reasonable. It's worth mentioning, however, that the current yield is not spectacular, when stacked against the other nine equities within our Natural Gas Utility Industry. The stock has some notable characteristics. It holds a 2 (Above Average) rating for Safety Furthermore, the Beta coefficient lies below the market average and the Price Stability score is relatively high, at 00 out of 100. Meanwhile, these shares' Timeliness rank now sits at 3 (Average), up one notch since oor last full-page report in December. Fre:iff'i de L. Harris, III Mardi 3 2017
(A) Diluted shrs. Excludes nonrecurring Items: I (B) Dividends historically paid in early January, I (C) In millions, adjusted for split. Company's Financial Strength B++ '02, d23¢; '08, d7¢; '15, 6¢. Excludes discontin- April, July, and October. • Dividend reinvest- Stock's Price Stability 80 ued operations: '03, d9¢; '04, d1¢. Next earn- men! plan. Direct stock purchase plan avail- Price Growth Persistence 90 ings report due early May. able. Earnings Predictability 95 © 2017 Vallie Line, Inc. All rights reserved. Factual mateoal is ob1Bined lium sowces believed tn be reliable and is provided >M111out warranties of any kind.1111111 THE PUBLISHER JS NOT RESPONSIBLE FOR ANY ERRORS OR OMSSIONS HEREIN. This publication is strictly 1ilrsubscribel's O'M\ non..:ommeJCial, internal use. No palt 111-..,1111..,•111 ' , II ~U•lllHll:Hlll of it may be reproduced, resold, slllred or transmitled in any ponied, electronic or olher 1illTI\ or used fur generating or malketing any ponied or electronic publication, seivice or product
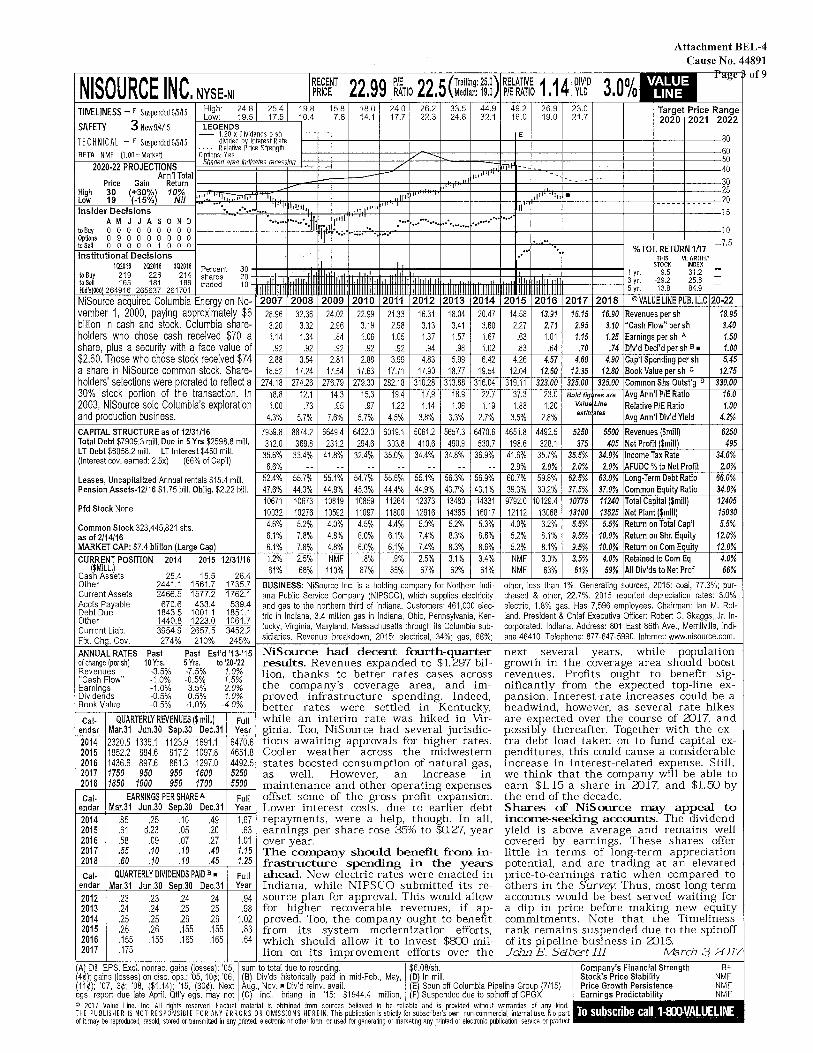
TllllELINESS - F Suspended 61M 5
SAFETY 3 New9/4h5
High: 24.8 25.4 Low: 19.5 17.5
TECHNICAL - F Suspended6!.ih5 BETA NMF (1.00 =Marke~
2020·22 PROJECTIONS Ann'I Total
Price Gain Return 1----t---t--High 30 (+30%l 10% 1 -;;;,.,,,,..,li:f::::::;;;~""f.:-""' Low 19 (·15% Nil "" • •• 11 ••• ,.... "··
Insider Decisions • •••••• ••• A M J J A S 0 N D ......
toBuy 0 0 0 0 0 0 0 0 0 1---+----+--0ptions 090000000 toSell 0 0 0 0 0 1 O O O •---+----+--
Common Stock 323,445,821 shs. as of 2/14/16 MARKET CAP: $7.4 billion (Large Cap)
2015 12/31/16
15.5 26.4 1561.7 1735.7 1577.2 1762.1 433.4 539.4
1001.1 1851.1 1223.0 1061.7 2657.5 3452.2 210% 245%
2007 28.96 3.20 1.14 .92
2.88 18.52
274.18 18.8 1.00
4.3%
7939.8 312.0
35.6% 6.6%
52.4% 47.6% 10671 10032 4.6% 6.1% 6.1% 1.2% 81%
2 2009 32.36 24.02
3.32 2.96 1.34 .84
.92 .92 3.54 2.81
17.24 17.54 274.26 276.79
12.1 14.3 .73 .95
5.7% 7.6%
8874.2 6649.4 369.8 231.2
33.4% 41.8% .. ..
55.7% 55.1% 44.3% 44.9% 10673 10819 10276 10592 5.2% 4.0% 7.8% 4.8% 7.8% 4.8% 2.5% NMF 68% 110%
22.99 21.33 16.31 18.04 20.47 3.19 2.98 3.13 3.41 3.60 1.06 1.05 1.37 1.57 1.67
.92 .92 .94 .98 1.02 2.88 3.99 4.83 5.99 6.42
17.63 17.71 17.90 18.77 19.54 279.30 282.18 310.28 313.68 316.04
15.3 19.4 17.9 18.9 22.7 .97 122 1.14 1.06 1.19
5.7% 4.5% 3.8% 3.3% 2.7%
6422.0 6019.1 5061.2 5657.3 6470.6 294.6 303.8 410.6 490.9 530.7
32.4% 35.0% 34.4% 34.8% 36.9% -- -- -- -- --
54.7% 55.6% 55.1% 56.3% 56.9% 45.3% 44.4% 44.9% 43.7% 43.1% 10859 11264 12373 13480 14331 11097 11800 12916 14365 16017 4.5% 4.4% 5.0% 5.2% 5.3% 6.0% 6.1% 7.4% 8.3% 8.6% 6.0% 6.1% 7.4% 8.3% 8.6%
.8% .9% 2.5% 3.1% 3.4% 87% 85% 67% 62% 61%
ANNUAL RATES Past Past Est'd '13-'15 NiSource had decent fourth-quarter ofchange(persh) 10Yrs. 5Yrs. to'2Q.'22 results. Revenues expanded to $1.297 bil-~~~;~~1~w" :~:g~ :6:~~ J:g~ lion, thanks to better rates cases across Earnings -1.0% 3.5% 2.0% the company's coverage area, and im-Dividends -0.5% 0.5% 1.0% proved infrastructure spending. Indeed,
,_B_o_o_k_V~al_ue ___ -_o._5'_Y0 __ -1_.o_o/c_0 __ ·4~.0_%_0 --1 better rates were settled in Kentucky, while an interim rate was hiked in Virginia. Too, NiSource had several jurisdictions awaiting approvals for higher rates. Cooler weather across the midwestern states boosted consumption of natural gas, as well. However, an increase in maintenance and other operating expenses offset some of the gross profit expansion. Lower interest costs, due to earlier debt repayments, were a help, though. In all, earnings per share rose 35% to $0.27, year over year .
Cal- QUARTERLY REVENUES($ mill.) endar Mar.31 Jun.30 Sep.30 Dec.31 2014 2320.5 1335.1 1123.9 1691.1 2015 1852.2 884.6 817.2 1097.8 2016 1436.6 897.6 861.3 1297.0 2017 1750 950 950 1600 2018 1850 1000 950 1700 Cal- EARNINGS PER SHARE A
endar Mar.31 Jun.30 Sep.30 Dec.31 2014 .85 .25 .10 .49 2015 .61 d.23 .05 .20 2016 .58 .09 .07 .27 2017 .55 . 10 .10 .40 2018 .60 .10 .10 .45
Cal· QUARTERLY DMDENDS PAID e • endar Mar.31 Jun.30 Sec.30 Dec.31 2012 .23 .23 .24 .24 2013 .24 .24 .25 .25 2014 .25 .25 .26 .26 2015 .26 .26 .155 .155 2016 .155 .155 .165 .165 2017 . 175
Full Year
6470.6 4651.8 4492.5 5250 5500
Full Year 1.67
.63 1.01 1.15 1.25 Full Year
.94
.98 1.02
.83
.64
The company should benefit from infrastructure spending in the years ahead. New electric rates were enacted in Indiana, while NIPSCO submitted its resource plan for approval. This would allow for higher recoverable revenues, if approved. Too, the company ought to benefit from its system modernization efforts, which should allow it to invest $8Xl million on its improvement efforts over the
-
14.58 13.91 2.27 2.71
.63 1.01
.83 .64 4.26 4.57
12.04 12.60 319.11 323.00
37.3 23.0 1.88 1.20
3.5% 2.8%
4651.8 4492.5 198.6 328.1
41.6% 35.7% 2.9% 2.0%
60.7% 59.8% 39.3% 30.2% 9792.0 10129.4 12112 13068 4.0% 3.2% 52% 8.1% 5.2% 8.1% NMF 3.0% 3.5% 4.0% Retained to Com Eq 4.0% NMF 63% 61% 59% All Div'ds to Net Prof 66%
other, less than 1%. Generating sources, 2015: coal, 77.3%; purchased & other, 22.7%. 2015 reported depreciation rates: 3.0% electric, 1.8% gas. Has 7,596 employees. Chairman: Ian M. Rolland. President & Chief Executive Officer: Robert C. Skaggs, Jr. Incorporated: Indiana. Address: 801 East 86th Ave., Merrillville, Indiana 46410. Telephone: 877-647-5990. Internet: www.nisource.com.
next several years, while population growth in the coverage area should boost revenues. Profits ought to benefit significantly from the expected top-line expansion. Interest-rate increases could be a headwind, however, as several rate hikes are expected over the course of a::n 7, and possibly thereafter. Together with the extra debt load taken on to fund capital expenditures, this could cause a considerable increase in interest-related expense. Still, we think that the company will be able to earn $1.15 a share in 21J17, and $1.50 by the end of the decade. Shares of NiSource may appeal to income-seeking accounts. The dividend yield is above average and remains well covered by earnings. These shares offer little in terms of long-term appreciation potential, and are trading at an elevated price-to-earnings ratio when compared to others in the Survf!Y. Thus, most long-term accounts would be best served waiting for a dip in price before making new equity commitments. Note that the Timeliness rank remains suspended due to the spinoff of its pipeline business in 21J15 . John E. SEibert III !vlarch 3 2:J17
(4¢); gains (losses) on disc. ops.: '05, 10¢; '06, (B) Div'ds historically paid in mid-Feb., May, (D) In mill. Stock's Price Stability NMF (A) Dil. EPS. Exel. nonrec. gains (losses): '05, , sum to total due to rounding. 1$6.08/sh. Company's Financial Strength B+
(11¢); '07, 3¢; '08, ($1.14); '15, (30¢). Next Aug., Nov.• Div'd reinv. avail. (EJ Spun off Columbia Pipeline Group (7/15) Price Growth Persistence NMF egs. report due late April. Qtl'y egs. may not (C) Incl. intang in '15: $1944.4 million, (F Suspended due to spinoff of CPGX Earnings Predictability NMF e 2017 Value line, In~ A 11 righ1S reseived. f acl!Jal material is obtained tram sources believed to be reliable and is provided v.;111out warranties of any kind.11111111 , THE PUBLISHER IS NOT RESPffNSIBLE FOR ANY ERRORS OR OMISSIONS HERE IN. This publication is strictly for subscriber's own, non-commercia~ internal use. No part orta.,111.,~ I ' • 11!!-:,-f pllllllll=il of it may be reproduced, resold, stored or transmitted in any printed, electronic or other fonn, or used for generating or marketing any printed or electronic publication, seivice or product
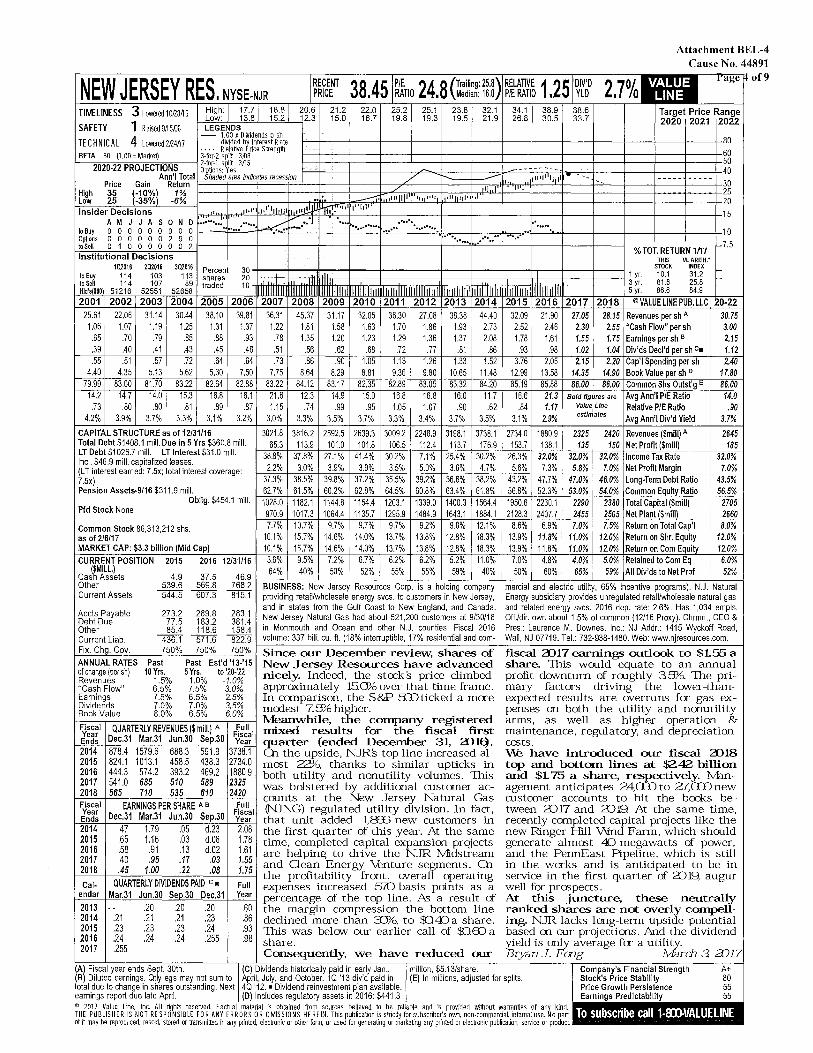
Attachment BEL-4
Tll\/ELINESS
SAFETY
TECHNICAL
3 Lowered 10/Z8~ 6
1 Raised 9h 5i06
4 Lowered2/ZW
High: 17.7 18.8 Low: 13.8 15.2
High Low
Price 35 25
THIS VLARITH."
Percent 30 - ~,,=-.-1--+--+---+--+---+--+-r--+--+--~ 1 yr. s;~K 1~~Ei ~ shares 20 .1 .I ifl. ·"•11111111 ... I .I. 3 yr. 81.6 25.8 ~ traded 10 : 11111111111111111111111111111111 11111111111 lllrllrlll llllll1l11l lll1lll '' 1111111 11111111111 5 yr. 86.6 84.9
2001 2002 2003 2004 2005 2006 2007 2008 2009 2010 2011 2012 2013 2014 2015 2016 2017 2018 ©VALUELINEPUB.LLC 0-22 25.61 22.06 31.14 30.44 38.10 39.81
1.06 1.07 1.19 1.25 1.31 1.37 .65 .70 .79 .85 .88 .93 .39 .40 .41 .43 .45 .48 .55 .51 .57 .72 .64 .64
4.40 4.35 5.13 5.62 5.30 7.50 79.99 83.00 81.70 83.22 82.64 82.88
14.2 14.7 14.0 15.3 16.8 16.1 .73 .80 .80 .81 .89 .87
4.2% 3.9% 3.7% 3.3% 3.1% 3.2%
CAPITAL STRUCTURE as of 12/31/16 Total Debt $1408.1 mill. Due in 5 Yrs $360.8 mill. LT Debt $1026.7 mill. LT Interest $31.0 mill. Incl. $46.9 mill. capitalized leases. (LT interest earned: 7.5x; total interest coverage: 7.5x) Pension Assets-9/16 $311.9 mill.
Oblig. $454.1 mill. Pfd Stock None
Common Stock 86,313,212 shs. as of 2/6/17 MARKET CAP: $3.3 billion (Mid Cap) CURRENT POSITION 2015 2016 12/31/16
36.31 45.37 31.17 32.05 1.22 1.81 1.58 1.63
.78 1.35 1.20 1.23
.51 .56 .62 .68
.73 .86 .90 1.05 7.75 8.64 8.29 8.81
83.22 84.12 83.17 82.35 21.6 12.3 14.9 15.0 1.15 .74 .99 .95
3.0% 3.3% 3.5% 3.7%
3021.8 3816.2 2592.5 2639.3 65.3 113.9 101.0 101.8
38.8% 37.8% 27.1% 41.4% 2.2% 3.0% 3.9% 3.9%
37.3% 38.5% 39.8% 37.2% 62.7% 61.5% 60.2% 62.8% 1028.0 1182.1 1144.8 1154.4
970.9 1017.3 1064.4 1135.7 7.7% 10.7% 9.7% 9.7%
10.1% 15.7% 14.6% 14.0% 10.1% 15.7% 14.6% 14.0% 3.6% 9.5% 7.2% 6.7%
36.30 27.08 38.38 44.40 27.05 28.15 Revenues per sh A 30.75 32.09 21.90 1.70 1.86 1.93 2.73 2.30 2.55 "Cash Flow" per sh 3.00 2.52 2.46 1.29 1.36 1.37 2.08 1.55 1.75 Earnings per sh 8 2.15 1.78 1.61
.72 .77 .81 .86 1.02 1.04 Div'ds Decl'd per sh c. 1.12 .93 .98 1.13 1.26 1.33 3.76 2.05 1.52 2.15 2.20 Cap' I Spending per sh 2.40 9.36 9.80 10.65 12.99 13.58 11.48 14.35 14.90 Book Value per sh o 17.80
82.89 83.05 83.32 85.19 85.88 84.20 86.00 86.00 Common Shs Outst'g E 86.00 16.8 16.8 16.0 16.6 21.3 11. 7 Bold fig res are Avg Ann' I P/E Ratio 14.0 1.05 1.07 .90 .84 1.17 .62 Value Line Relative PIE Ratio .90
3.3% 3.4% 3.7% 3.1% 2.9% 3.5% estin ates Avg Ann' I Div'd Yield 3.7%
3009.2 2248.9 3198.1 2734.0 1880.9 2325 2420 Revenues ($mill) A 3738.1 2645 106.5 112.4 113.7 153.7 138.1 135 150 Net Profit ($mill) 176.9 185
30.2% 7.1% 25.4% 26.3% 32.0% 32.0% 32.0% Income Tax Rate 30.2% 32.0% 3.5% 5.0% 3.6% 5.6% 7.3% 5.8% 7.0% Net Profit Margin 4.7% 7.0%
35.5% 39.2% 36.6% 43.2% 47.7% 47.0% 46.0% Long-Term Debt Ratio 38.2% 43.5% 64.5% 60.8% 63.4% 56.8% 52.3% 53.0% 54.0% Common Equity Ratio ~8 ft~
1203.1 1339.0 1400.3 1950.6 2230.1 2290 2380 Total Capital ($mill) 1564.4 2705 1295.9 1484.9 1643.1 2128.3 2407.7 2455 2505 Net Plant 1$milll 1884.1 2660
9.7% 9.2% 9.0% 8.6% 6.9% 7.0% 7.5% Return on Total Cap'I 12.1% 8.0% 13.7% 13.8% 12.8% 13.9% 11.8% 11.0% 12.0% Return on Shr. Equity 18.3% 12.0% 13.7% 13.8% 12.8% 13.9% 11.8% 11.0% 12.0% Return on Com Equity 18.3% 12.0% 6.2% 6.2% 5.2% 11.0% 6.0% 7.0% 4.8% 4.0% 5.0% Retained to Com Eq
($MILL) Cash Assets Other Current Assets
~% ~% 53~:~ 5~~:~ 7t~:~ f-8-U_S_IN-'-E-SS_:_N_e-'-w-Je-rs_e_._y_R_e-so_u...crc-es_C_or""'p.-i-s_a_h-'o-ld-in_g_c""'om_p_a_n_y ~m-e-rc-ia""'1 a_n_d_e-le""'ct-ri-c -ut-ili""'ty-, -65-'X-, ""'in-ce-n-tiv_e_p_r-og_ra_m_s_).-N-.J-.~N-a-tu-ra__,I 544.5 607.3 815.1 providing retail/wholesale energy svcs. to customers in New Jersey, Energy subsidiary provides unregulated retail/wholesale natural gas
64% 40% 50% 52% 55% 55% 59% 50% 60% 65% 59% All Div'ds to Net Prof
Accts Payable 273.2 269.8 283.1 Debt Due 77.5 183.2 381.4 Other 85.4 118.6 158.4 Current Liab. 436.1 571.6 822.9 Fix. Chg. Gov. 750% 750% 750% ANNUAL RATES Past Past Est'd '13-'15 of change (per sh) 10Yrs. 5Yrs. to '20-'22 Revenues 1.5% 1.0% -1.0% "Cash Flow" 6.5% 7.5% 3.0% Earnings 7.5% 6.5% 2.5% Dividends 7.0% 7.0% 3.5% Book Value 8.0% 6.5% 6.0%
Fiscal QUARTERLY REVENUES($ mill.) A Full Year Fiscal Ends Dec.31 Mar.31 Jun.30 Sep.30 Year 2014 878.4 1579.6 688.3 591.9 3738.1 2015 824.1 1013.1 458.5 438.3 2734.0 2016 444.3 574.2 393.2 469.2 1880.9 2017 541.0 685 510 589 2325 2018 565 710 535 610 2420 Fiscal EARNINGS PER SHARE A e Full Year Dec.31 Mar.31 Jun.30 Sep.30 Fiscal Ends Year 2014 .47 1.79 .05 d.23 2.08 2015 .65 1.16 .03 d.06 1.78 2016 .58 .91 .13 d.02 1.61 2017 .40 .95 .17 .03 1.55 2018 .45 1.00 .22 .08 1.75
Cal- QUARTERLY DNIDENDS PAID c • Full endar Mar.31 Jun.30 Seo.30 Dec.31 Year 2013 -- .20 .20 .20 .60 2014 .21 .21 .21 .23 .86 2015 .23 .23 .23 .24 .93 2016 .24 .24 .24 .255 .98 2017 .255
and in states from the Gulf Coast to New England, and Canada. and related energy svcs. 2016 dep. rate: 2.6%. Has 1,034 empls. New Jersey Natural Gas had about 521,200 customers at 9/30/16 Off./dir. own about 1.5% of common (12/16 Proxy). Chrmn., CEO & in Monmouth and Ocean and other N.J. counties. Fiscal 2016 Pres.: Laurence .M. Downes. Inc.: NJ Addr.: 1415 Wyckoff Road, volume: 337 bill. cu. ft. (18% interruptible, 17% residential and com- Wall, NJ 07719. Tel.: 732-938-1480. Web: www.njresources.com.
Since our December review, shares of fiscal 3J17 earnings outlook to $1.55 a New Jersey Resources have advanced share. This would equate to an annual nicely. Indeed, the stocks price climbed profit downturn of rooghly 35'/o. The priapproximately 150'/o over that time frame. mary factors driving the lower-thanIn comparison, the S&P s:Dticked a more expected results are overruns for gas exmcx:lest 7.5'/o higher. penses on both the utility and nonutility Meanwhile, the company registered arms, as well as higher operation & mixed results for the fiscal first maintenance, regulatory, and depreciation quarter (ended December 31, all~. cc:sts. OJ. the upside, NJRs top line increased al- \i\e have intrcx:luced our fiscal <DIS mc:st 22"/o, thanks to similar upticks in top and bottom lines at $2.42 billion both utility and nonutility volumes. This and $1. 75 a share, respectively. :tvhnwas bolstered by additional customer ac- agement anticipates 24,Cffi to 27,Cffi new counts at the New Jersey Natural Gas customer accounts to hit the books be(1\fJNG) regulated utility division. In fact, tween 3J17 and 3Jl9. At the same time, that unit added 1,833 new customers in recently completed capital projects like the the first quarter of this year. At the same new Ringer Hill Wnd Farm, which should time, completed capital expansion projects generate almc:st 40 megawatts of power, are helping to drive the NJR J\/lidstream and the PennEast Pipeline, which is still and Oean Energy venture segments. OJ. in the works and is anticipated to be in the profitability front, overall operating service in the first quarter of 3:)19, augur expenses increased 570 basis points as a well for prospects. percentage of the top line. fas a result of At this juncture, these neutrally the margin compression the bottom line ranked shares are not overly compelldeclined more than 3Y/o, to $:)40 a share. ing. NJR lacks long-term upside potential This was below our earlier call of SOED a based on our projections. And the dividend share. yield is only average for a utility. Consequently, we have reduced our Bryan J. Fmg lvfarch 3 aJ17
(A) Fiscal year ends Sept. 30th. (C) Dividends historically paid in early Jan., million, $5.13/share. Company's Financial Strength A+ (B) Diluted earnings. Olly egs may not sum to April, July, and October. 10 '13 div'd paid in (E) In millions, adjusted for splits. Stock's Price Stability 80 total due to change in shares outstanding. Next 40 '12. •Dividend reinvestment plan available. Price Growth Persistence 55 earnings report due late April. (D) Includes regulatory assets in 2016: $441.3 Earnings Predictability 55 © 2017 Value Line, Inc. All rights reserved. Factual material is obtained from sources believed to be reliable and is provided without warranties of any kind. • a THE PUBLISHER IS NOT RESPONSIBLE FOR ANY ERRORS OR OMISSIONS HEREIN. This publication is strictly for subscriber's o1Ml, non-commercial, internal use. No part •11a.i h.,.I I '-'lit:illli~,11\lllHll!l~I of it may be reproduced, resold, stored or transmitted in any printed, electronic or other form, or used for generating or marketing any printed or electronic publication, service or product
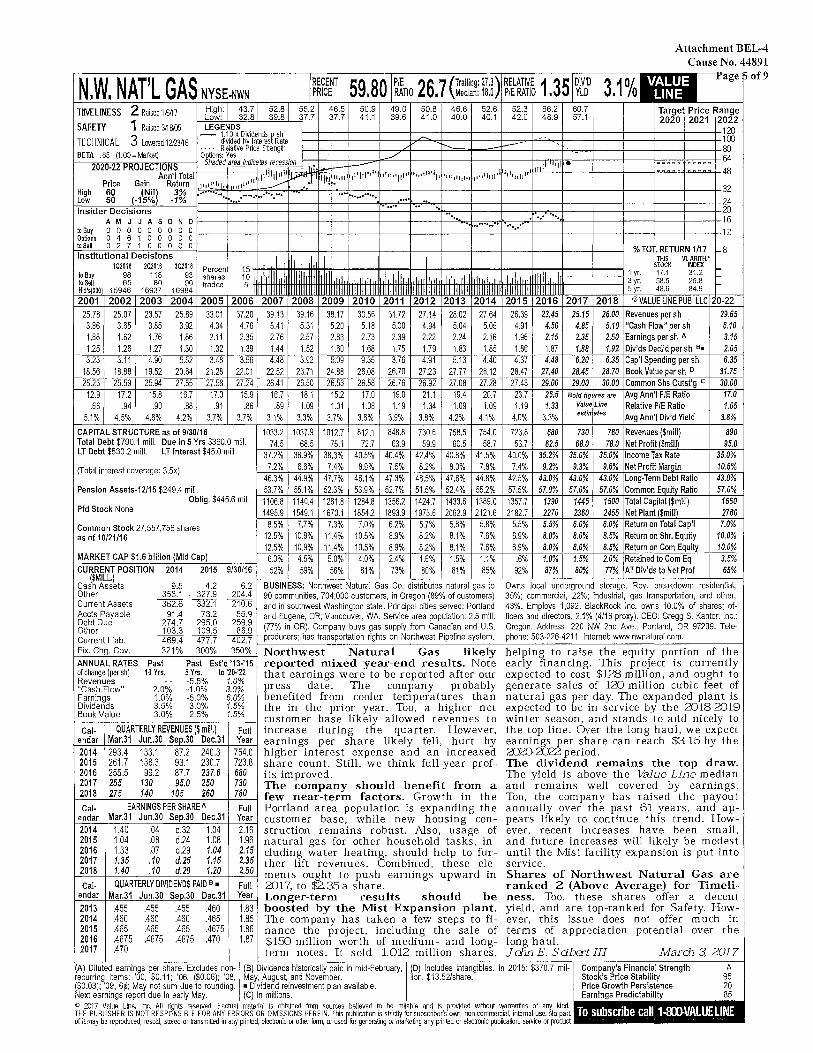
Attachment BEL-4 Cause No. 44891
,__N_Vj__tf_AJ1 _'L_G_At-.----.----.,---'-rlREC-EN_T ~~!~'~P/E-,.-l~L(_Tra--,-iling_:21_.3)+-RE-LAT--,IVE_1_3~~DIV-'Dr-!·10~/---r-ag--le 'of9 , _ 1 1 I'\ NYSE-NWN PRICE , RATIO , Median: 18.0 P/E RATIO , YLD /(
2 Raised1,6/!7 TllVELINESS High: 43.7 52.8 Low: 32.8 39.8
SAFETY LEGENDS
55.2 37.7
46.5 50.9 37.7 41.1
49.0 50.8 46.6 52.6 39.6 41.0 40.0 40.1
52.3 42.0
66.2 60.7 48.9 57.1
1 Raised 3/18Al5
TECHNICAL 3 LOllered 12123116 - 1.10 x Dividends~ sh
divided b~ lnteres Rate
Target Price Range 2020 2021 2022
--J----!---+----!l----+----ll----+----!l----+--~1----+---1----+-120
==j====j===~/jv:~-~~jr-....t;::~~==~~t--=~--=jt·~-~· :j-t,::::t====t====t====t====t)gl BETA .65 ~.00= Marke~
... · Relative rice Strength O ~~~:r./a'ia indicates recession --t---=:=---l'"""'/'=---t-----11----t-----11----t--,.,n:;;l-.-------,l----t---l-;-;-;;-;;-;;f;;-;::-;;--;;-;;-j--64
2020·22 PROJECTIONS .. Ann'I Total
1111 111111 11"11
Price Gain Return 111tl'h1 .. High 60 ~·11 3% .. ... .····•··· Low 50 (-1 % -1% ... ·-···
- . --- 11111 "Ill. ::::: ::::: 48. Ii.1111 111 1 111 ' 1 11 11 ' l•'llliJJil•1i1" Ill 11111
....,.,,,,..___,--1---+----!l----t----!l----t----it----1--~1----t---1----+-32 . ........ ····· -+--_..,,,~.~ ••• ~·-"·fo= .. ~··--.. 1----t---+--+---t----i--+---+--+---t-~
Insider Decisions A M J J A S 0 N D 1---1---1--- --1----i---1----i1--"=·-..o:ir=:::--."'17.,..-....rir'~"-·-.. ~·r---1---1----t---1----+-16 --··-······· · ..... ·· toBuy 0 0 0 0 0 0 0 0 0
Options 0 4 6 1 0 0 O O O l---t---1--- -+---+--+---1----+--+---+--l---+---+--+---+--~12 toSeU 0 2 7 1 0 0 0 0 0 Institutional Decisions
1Q2016 2Q20t6 3Q2016 to Buy 98 118 93
I . I 1, Percent 15 -shares 10
to Sell 65 80 90 Hld'slOOOl 15946 16937 16984
• , .... ,, ...... 111111. 1111'1 I 1111111
traded 5 lllHt1111tHtH11111tt1111 1tt
2001 2002 2003 2004 2005 2006 2007 2008 2009 2010 2011 2012 2013 2014 25.78 25.07 23.57 25.69 33.01 37.20 3.86 3.65 3.85 3.92 4.34 4.76 1.88 1.62 1.76 1.86 2.11 2.35 1.25 1.26 1.27 1.30 1.32 1.39 3.23 3.11 4.90 5.52 3.48 3.56
18.56 18.88 19.52 20.64 21.28 22.01 25.23 25.59 25.94 27.55 27.58 27.24
12.9 17.2 15.8 16.7 17.0 15.9 .66 .94 .90 .88 .91 .86
5.1% 4.5% 4.6% 4.2% 3.7% 3.7%
CAPITAL STRUCTURE as of 9/30/16 Total Debt $790.1 mill. Due in 5 Yrs $360.0 mill. LT Debt $530.2 mill. LT Interest $45.0 mill.
(Total interest coverage: 3.5x)
Pension Assets-12/15 $249.4 mill. Oblig. $445.6 mill.
Pfd Stock None
Common Stock 27,557,756 shares as of 10/21/16
MARKET CAP $1.6 billion (Mid Cap) CURRENT POSITION 2014 2015 9/30/16
($MILL.) Cash Assets 9.5 4.2 6.2 Other 353.1 327.9 204.4 Current Assets 362.6 332.1 210.6 Accts Payable 91.4 73.2 55.9 Debt Due 274.7 295.0 259.9 Other 103.3 109.5 86.9 Current Liab. 469.4 477.7 402.7 Fix. Chg. Gov. 321% 300% 350% ANNUAL RATES Past Past Est'd '13-'15 of change (per sh) 10Yrs. 5Yrs. to '20·'22 Revenues -- -5.5% 1.0% "Cash Flow" 2.0% -1.0% 3.0% Earnings 1.0% -5.0% 6.0% Dividends 3.5% 3.0% 1.5% Book Value 3.0% 2.5% 1.5%
Cal- QUARTERLY REVENUES ($ mill.) Full endar Mar.31 Jun.30 Sep.30 Dec.31 Year 2014 293.4 133.1 87.2 240.3 754.0 2015 261.7 138.3 93.1 230.7 723.8 2016 255.5 99.2 87.7 237.6 680 2017 255 130 95.0 250 730 2018 275 140 105 260 780 Cal- EARNINGS PER SHARE A Full
endar Mar.31 Jun.30 Sep.30 Dec.31 Year 2014 1.40 .04 d.32 1.04 2.16 2015 1.04 .08 d.24 1.08 1.96 2016 1.33 .07 d.29 1.04 2.15 2017 1.35 .10 d.25 1.15 2.35 2018 1.40 .10 d.20 1.20 2.50
Cal- QUARTERLY DIVIDENDS PAID e • Full endar Mar.31 Jun.30 Seo.30 Dec.31 Year 2013 .455 .455 .455 .460 1.83 2014 .460 .460 .460 .465 1.85 2015 .465 .465 .465 .4675 1.86 2016 .4675 .4675 .4675 .470 1.87 2017 .470
39.13 39.16 38.17 30.56 31.72 27.14 28.02 27.64 5.41 5.31 5.20 5.18 5.00 4.94 5.04 5.05 2.76 2.57 2.83 2.73 2.39 2.22 2.24 2.16 1.44 1.52 1.60 1.68 1.75 1.79 1.83 1.85 4.48 3.92 5.09 9.35 3.76 4.91 5.13 4.40
22.52 23.71 24.88 26.08 26.70 27.23 27.77 28.12 26.41 26.50 26.53 26.58 26.76 26.92 27.08 27.28 16.7 18.1 15.2 17.0 19.0 21.1 19.4 20.7 .89 1.09 1.01 1.08 1.19 1.34 1.09 1.09
3.1% 3.3% 3.7% 3.6% 3.9% 3.8% 4.2% 4.1%
1033.2 1037.9 1012.7 812.1 848.8 730.6 758.5 754.0 74.5 68.5 75.1 72.7 63.9 59.9 60.5 58.7
37.2% 36.9% 38.3% 40.5% 40.4% 42.4% 40.8% 41.5% 7.2% 6.6% 7.4% 8.9% 7.5% 8.2% 8.0% 7.8%
46.3% 44.9% 47.7% 46.1% 47.3% 48.5% 47.6% 44.8% 53.7% 55.1% 52.3% 53.9% 52.7% 51.5% 52.4% 55.2% 1106.8 1140.4 1261.8 1284.8 13562 1424.7 1433.6 1389.0 1495.9 1549.1 1670.1 1854.2 1893.9 1973.6 2062.9 2121.6
8.5% 7.7% 7.3% 7.0% 62% 5.7% 5.8% 5.8% 12.5% 10.9% 11.4% 10.5% 8.9% 8.2% 8.1% 7.6% 12.5% 10.9% 11.4% 10.5% 8.9% 8.2% 8.1% 7.6% 6.0% 4.5% 5.0% 4.0% 2.4% 1.6% 1.5% 1.1% 52% 59% 56% 61% 73% 80% 81% 85%
BUSINESS: Northwest Natural Gas Co. distributes natural gas to 90 communities, 704,000 customers, in Oregon (89% of customers) and in southwest Washington state. Principal cities served: Portland and Eugene, OR; Vancouver, WA. Service area population: 2.5 mill. (77% in OR). Company buys gas supply from Canadian and U.S. producers; has transportation rights on Northwest Pipeline system.
Northwest Natural Gas likely reported mixed year-end results. Note that earnings were to be reported after our press date. The company probably benefited from cooler temperatures than the in the prior year. Too, a higher net customer base likely allowed revenues to increase during the quarter. However, earnings per share likely fell, hurt by higher interest expense and an increased share count. Still, we think full-year profits improved. The company should benefit from a few near-term factors. Growth in the Portland area population is expanding the customer base, while new housing construction remains robust. Also, usage of natural gas for other household tasks, including water heating, should help to further lift revenues. Combined, these elements ought to push earnings upward in 2017, to $2.35 a share. Longer-term results should be boosted by the l.\.:fist Expansion plant. The company has taken a few steps to finance the project, including the sale of $150 million worth of medium- and longterm notes. It sold 1.012 million shares,
% TOT. RETURN 1117 -8 THIS VLARITH.'
STOCK INDEX -I ,,,Ji I 1 yr. 17.1 31.2 -1.1111111 llJll.I 3yr . 58.5 25.8 -11111111111 111111111111 5yr. 48.6 84.9 2015 2016 2017 2018 ©VALUE LINE PUB. LLC .0.22
26.39 23.45 25.15 26.00 Revenues per sh 29.65 4.91 4.50 4.85 5.10 "Cash Flow" per sh 6.10 1.96 2.15 2.35 2.50 Earnings per sh A 3.15 1.86 1.87 1.88 1.92 Div'ds Decl'd per sh s. 2.05 4.37 4.48 6.20 6.35 Cap'I Spending per sh 6.35
28.47 27.40 28.45 28.70 Book Value per sh o 31.75 27.43 29.00 29.00 30.00 Common Shs Outst'g c 30.00 23.7 26.5 Bold fig ros are Avg Ann'I P/E Ratio 17.0 1.19 1.33 Value Line Relative P/E Ratio 1.05
4.0% 3.3% estln ates Avg Ann'I Div'd Yield 3.8%
723.8 680 730 780 Revenues ($mill) 890 53.7 62.5 68.0 78.0 Net Profit ($mill) 95.0
40.0% 35.2% 35.0% 35.0% Income Tax Rate 35.0% 7.4% 9.2% 9.3% 9.6% Net Profit Margin 10.6%
42.5% 43.0% 43.0% 43.0% Long-Term Debt Ratio 43.0% 57.5% 57.0% 57.0% 57.0% Common Equity Ratio 57.0% 1357.7 1390 1445 1500 Total Capital ($mill) 1660 2182.7 2270 2360 2455 Net Plant ($mill) 2760
5.5% 5.5% 6.0% 6.0% Return on Total Cap'I 7.0% 6.9% 8.0% 8.0% 8.5% Return on Shr. Equity 10.0% 6.9% 8.0% 8.0% 8.5% Return on Com Equity 10.0%
.6% 1.0% 1.5% 2.0% Retained to Com Eq 3.5% 92% 87% 80% 77% All Div'ds to Net Prof 65%
Owns local underground storage. Rev. breakdown: residential, 35%; commercial, 22%; industrial, gas transportation, and other, 43%. Employs 1,092. BlackRock Inc. owns 10.0% of shares; officers and directors, 2.1% (4/16 proxy). CEO: Gregg S. Kantor. Inc.: Oregon. Address: 220 NW 2nd Ave., Portland, OR 97209. Telephone: 503-226-4211. Internet: www.nwnatural.com.
helping to raise the equity portion of the early financing. This project is currently expected to cost $12.8 million, and ought to generate sales of 120 million cubic feet of natural gas per day. The expanded plant is expected to be in service by the 2018-2019 winter season, and stands to add nicely to the top line. Over the long haul, we expect earnings per share can reach $3. 15 by the ZCID-2022 period. The dividend remains the top draw. The yield is above the Value Line median and remains well covered by earnings. Too, the company has raised the payout annually over the past 61 years, and appears likely to continue this trend. However, recent increases have been small, and future increases will likely be modest until the Mist facility expansion is put into service. Shares of Northwest Natural Gas are ranked 2 (Above Average) for Timeliness. Too, these shares offer a decent yield, and are top-ranked for Safety. However, this issue does not offer much in terms of appreciation potential over the long haul. J dm E. S Ei.bert III Mardi 3 2017
(A) Diluted earnings per share. Excludes non- (B) Dividends historically paid in mid-February, (D) Includes intangibles. In 2015: $370.7 mil- Company's Financial Strength A recurring items: '00, $0.11; '06, ($0.06); '08, May, August, and November. lion, $13.52/share. Stock's Price Stability 95 ($0.03); '09, 6¢; May not sum due to rounding. •Dividend reinvestment plan available. Price Gr-0wth Persistence 20 Next earnings report due in earty May. (C) In millions. Earnings Predictability 85 © 2017 Value Line, Inc. All righ1s rese1Ved. Factual material is obtained from soun:es believed tD be reliable and is provided >Mthout warranties of any kind. Ill , II THE PUBLISHER IS NOT RESPONSIBLE FOR ANY ERRORS OR OMSSIONS HEREIN. This publication is strictly fur subscribers OI'.!\ non-rommertial, internal use. No part: I fl'fifi I ' • ol l~ll!lll Ill of it may be reproduced, resold, slored or transmillBd in any prinled, electronic or other fonn, or used for generating or marketing any printed or electronic publication, service or product
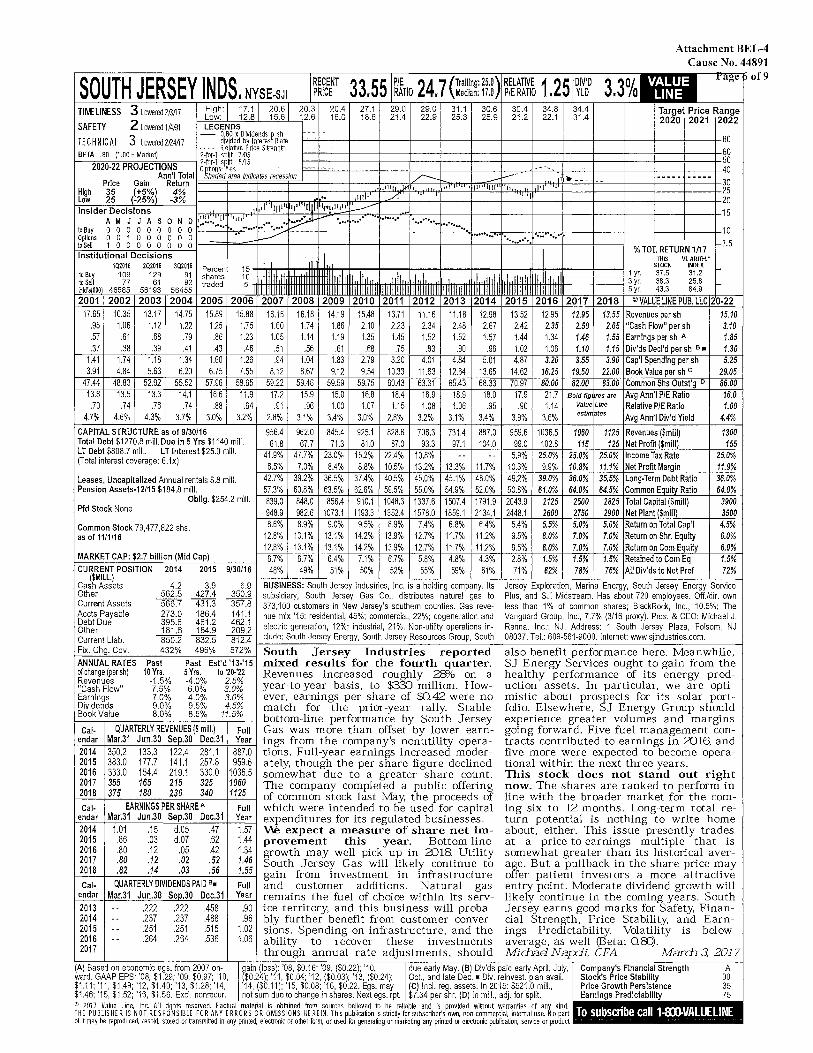
Attachment BEL-4 Cause No. 44891
SOUTH JERSEY INDS. NYSE-SJI 'RECENT 33 55 jP1E 24 7 eramng:2s.o) RELATIVE 1 25 DIV1D 3.3%-
rage~
PRICE , RATIO , Median: 17 .0 P/E RATIO I YLD
TllVELINESS 3 Lowered 21.M 7 High: 17.1 20.6 20.3 20.4 27.1 29.0 29.0 31.1 30.6 30.4 34.8 34.4 Target Price Range Low: 12.8 15.6 12.6 16.0 18.6 21.4 22.9 25.3 25.9 21.2 22.1 31.4 2020 2021 2022
SAFETY 2 Lowered 1 /4i91 LEGENDS
TECHNICAL 3 Lowered 2J24M - ~i~i~:dDi)"i~~~~:Jt~m 80
BETA .BO (1.0D =Marke~ . . • . Relative ~rice S treng1h 60 2-for-1 spflt 7i!J5 50
2020-22 PROJECTIONS ~-foJ~~s~~1!s 5n5 - ...... -'- ... ----- . -40 Ann'I Total ~haded area indicams recession ,,,,.._ v··
1• •--- -- .......... .......... 30 Price Gain Return
High 35 (+5%l 4% 1 1llh1 lJ' I .. 1 111•·1111 "· ,pl 25
Low 25 (-25% -3% 1111 1 .A' ... I 20 Insider Decisions ,11''11111• 11,11 ~ 15
AMJJASON o 11!!! •• II •111 111 ... ..... ········· · ... ······· to Buy 0 0 0 0 0 0 0 0 0 • .. •• ..... .···• .. -·· ·········- 10 Options 0 0 1 0 0 0 0 0 0 __,.., ······· .. ···-···· 1-••••.•••••
to Sell 1 0 0 0 0 0 0 0 0 % TOT. RETURN 1117 1--7.5
Institutional Decisions THIS Vl.ARITH."
of9
1Q2016 2Q2016 3Q2016 Percent 15. STOCK INDEX .... to Buy 109 129 91 shares 10 - 1. I 1 yr. 37.5 31.2
~
to Sell 77 61 92 traded 5 .11111 .11111 I .I 11111. d .111111 11, lllLI 3 yr . 38.3 25.8 ~
H~'slOOOI 46585 56193 56455 111111 1111 1111111111 11111111111 1111111111 1111111111 111111111 5yr. 43.3 84.9 2001 2002 2003 2004 2005 2006 2007 2008 2009 2010 2011 2012 2013 2014 2015 2016 2017 2018 ©VALUE LINE PUB. LLC 20-22
17.65 10.35 13.17 14.75 15.89 15.88 16.15 16.18 14.19 15.48 13.71 11.16 11.18 12.98 13.52 12.95 12.95 13.55 Revenues per sh 15.10 .95 1.06 1.12 1.22 1.25 1.75 1.60 1.74 1.86 2.10 2.23 2.34 2.48 2.67 2.42 2.35 2.50 2.65 "Cash Flow" per sh 3.10 .57 .61 .68 .79 .86 1.23 1.05 1.14 1.19 1.35 1.45 1.52 1.52 1.57 1.44 1.34 1.46 1.55 Earnings per sh A 1.85 .37 .38 .39 .41 .43 .46 .51 .56 .61 .68 .75 .83 .90 .96 1.02 1.06 1.10 1.15 Div'ds Decl'd per sh e • 1.30
1.41 1.74 1.18 1.34 1.60 1.26 .94 1.04 1.83 2.79 320 4.01 4.84 5.01 4.87 3.20 3.55 3.90 Cap'I Spending per sh 5.25 3.91 4.84 5.63 6.20 6.75 7.55 8.12 8.67 9.12 9.54 10.33 11.63 12.64 13.65 14.62 16.25 19.50 22.00 Book Value per sh c 29.05
47.44 48.83 52.92 55.52 57.96 58.65 59.22 59.46 59.59 59.75 60.43 63.31 65.43 68.33 70.97 80.00 82.00 83.00 Common Shs Outst'g o 86.00 13.6 13.5 13.3 14.1 16.6 11.9 17.2 15.9 15.0 16.8 18.4 16.9 18.9 18.0 17.9 21.7 Bold fig res are Avg Ann'l PIE Ratio 16.0 .70 .74 .76 .74 .88 .64 .91 .96 1.00 1.07 1.15 1.08 1.06 .95 .90 1.14 Value Line Relative P/E Ratio 1.00
4.7% 4.6% 4.3% 3.7% 3.0% 3.2% 2.8% 3.1% 3.4% 3.0% 2.8% 3.2% 3.1% 3.4% 3.9% 3.6% estin ates Avg Ann1l Div1d Yield 4.4% CAPITAL STRUCTURE as of 9/30/16 956.4 962.0 845.4 925.1 828.6 706.3 731.4 887.0 959.6 1036.5 1060 1125 Revenues ($mill) 1300 Total Debt $1270.8 mill. Due in 5 Yrs $1140 mill. 61.8 67.7 71.3 81.0 87.0 93.3 97.1 104.0 99.0 102.8 115 125 Net Profit ($mill) 155 LT Debt $808.7 mill. LT Interest $25.0 mill. 41.9% 47.7% 23.0% 15.2% 22.4% 10.8% -- -- 5.9% 25.0% 25.0% 25.0% Income Tax Rate 25.0% (Total interest coverage: 6.1x)
6.5% 7.0% 8.4% 8.8% 10.5% 13.2% 13.3% 11.7% 10.3% 9.9% 10.8% 11.1% Net Profit Margin 11.9% Leases, Uncapitalized Annual rentals $.8 mill. 42.7% 39.2% 36.5% 37.4% 40.5% 45.0% 45.1% 48.0% 49.2% 39.0% 36.0% 35.5% Long-Term Debt Ratio 36.0% Pension Assets-12115 $184.8 mill. 57.3% 60.8% 63.5% 62.6% 59.5% 55.0% 54.9% 52.0% 50.8% 61.0% 64.0% 64.5% Common Equity Ratio 64.0%
Oblig. $254.2 mill. 839.0 848.0 856.4 910.1 1048.3 1337.6 1507.4 1791.9 2043.9 2125 2500 2825 Total Capital ($mill) 3900 Pfd Stock None 948.9 982.6 1073.1 1193.3 1352.4 1578.0 1859.1 2134.1 2448.1 2600 2750 2900 Net Plant 1$milll 3500 Common Stock 79,477,822 shs. 8.6% 8.9% 9.0% 9.5% 8.9% 7.4% 6.8% 6.4% 5.4% 5.5% 5.0% 5.0% Return on Total Cap1I 4.5% as of 11/1/16 12.8% 13.1% 13.1% 14.2% 13.9% 12.7% 11.7% 11.2% 9.5% 8.0% 7.0% 7.0% Return on Shr. Equity 6.0%
12.8% 13.1% 13.1% 14.2% 13.9% 12.7% 11.7% 11.2% 9.5% 8.0% 7.0% 7.0% Return on Com Equitv 6.0% MARKET CAP: $2.7 billion (Mid Cap) 6.7% 6.7% 6.4% 7.1% 6.7% 5.8% 4.8% 4.3% 2.8% 1.5% 1.5% 1.5% Retained to Com Eq 1.5% CURRENT POSITION 2014 2015 9/30/16 48% 49% 51% 50% 52% 55% 59% 61% 71% 82% 78% 76% All Div'ds to Net Prof 72%
($MILL.) 4.2 BUSINESS: South Jersey Industries, Inc. is a holding company. Its Jersey Exploration, Marina Energy, South Jersey Energy Service Cash Assets 3.9 6.9
Other 562.5 427.4 350.9 subsidiary, South Jersey Gas Co., distributes natural gas to Plus, and SJI Midstream. Has about 720 employees. Off./dir. own Current Assets 566.7 431.3 357.8 373, 100 customers in New Jersey's southern counties. Gas reve- less than 1 % of common shares; BlackRock, Inc., 10.5%; The Accts Payable 273.0 186.4 141.1 nue mix '15: residential, 45%; commercial, 22%; cogeneration and Vanguard Group, Inc., 7.7% (3/16 proxy). Pres. & CEO: Michael J. Debt Due 395.6 461.2 462.1 electric generation, 12%; industrial, 21%. Non-utility operations in· Renna. Inc.: NJ. Address: 1 South Jersey Plaza, Folsom, NJ other 181.6 184.9 209.2 Current Liab. 850.2 832.5 812.4 elude: South Jersey Energy, South Jersey Resources Group, South 08037. Tel.: 609-561-9000. Internet: www.sjindustries.com. Fix. Chg. Gov. 432% 496% 572% South Jersey Industries reported also benefit performance here. Meanwhile, ANNUAL RATES Past Past Est'd '13·'15 mixed results for the fourt~uarter. SJ Energy Services ought to gain from the of change (per sh) 10Yrs. 5Yrs. to '20·'22 Revenues increased roughly Yo on a healthy performance of its energy prod-Revenues -1.5% -4.0% 2.5% year-to-year basis, to $33) million. How- uction assets. In particular, we are opti-"Cash Flow" 7.5% 6.0% 3.0% Earnings 7.0% 4.0% 3.0% ever, earnings per share of $0.42 were no mistic about prospects for its solar port-Dividends 9.0% 9.5% 4.5% match for the prior-year tally. Stable folio. Elsewhere, SJ Energy Group should Book Value 8.0% 8.5% 11.5% bottom-line performance by South Jersey experience greater volumes and margins Cal- QUARTERLY REVENUES($ mill.) Full Gas was more than offset by lower earn- going forward. Five fuel management con-
endar Mar.31 Jun.30 Sep.30 Dec.31 Year ings from the company's nonutility opera- tracts contributed to earnings in a:ll6, and 2014 350.2 133.3 122.4 281.1 887.0 tions. Full-year earnings increased moder- five more were expected to become opera-2015 383.0 177.7 141.1 257.8 959.6 ately, though the per share figure declined tional within the next three years. 2016 333.0 154.4 219.1 330.0 1036.5 somewhat due to a greater share count. This stock does not stand out right 2017 355 165 215 325 1060 The company completed a public offering now. The shares are ranked to perform in 2018 375 180 230 340 1125 of common stock last May, the proceeds of line with the broader market for the com-Cal· EARNINGS PER SHARE A Full which were intended to be used for capital ing six to 12 months. Long-term total re-
endar Mar.31 Jun.30 Sep.30 Dec.31 Year expenditures for its regulated businesses. turn potential is nothing to write home 2014 1.01 .15 d.05 .47 1.57 W expect a measure of share net im- about, either. This issue presently trades 2015 .86 .03 d.07 .62 1.44 provement this year. Bottom-line at a price-to-earnings multiple that is 2016 .80 .12 .05 .42 1.34 growth may well pick up in a:>18 Utility somewhat greater than its historical aver-2017 .80 .12 .02 .52 1.46 South Jersey Gas .will likely continue to age. But a pullback in the share price may 2018 .82 .14 .03 .56 1.55 gain from investment in infrastructure offer patient investors a more attractive Cal- QUARTERLY DIVIDENDS PAID s. Full and customer additions. Natural gas entry point. Moderate dividend growth will
endar Mar.31 Jun.30 Seo.30 Dec.31 Year remains the fuel of choice within its serv- likely continue in the coming years. South 2013 -- .222 .222 .458 .90 ice territory, and this business will proba- Jersey earns good marks for Safety, Finan-2014 ·- .237 .237 .488 .96 bly further benefit from customer conver- dal Strength, Price Stability, and Earn-2015 ·- .251 .251 .515 1.02 sions. Spending on infrastructure, and the ings Predictability. Volatility is below 2016 -- .264 .264 .536 1.06 ability to recover these investments average, as well (Beta: 08]. 2017 through annual rate adjustments, should Micha.a Nap:ii, CFA Mardi 3 2017
(A) Based on economic egs. from 2007 on- gain (loss): '08, $0.16; '09, ($0.22); '10, due early May. (B) Div'ds paid early April, July, Company's Financial Strength A ward. GAAP EPS: '08, $1.29; '09, $0.97; '10, ($0.24); '11, $0.04; '12, ($0.03); '13, ($0.24); Oct., and late Dec. • Div. reinvest. plan avail. Stock's Price Stability 90 $1.11; '11, $1.49; '12, $1.49; '13, $1.28; '14, '14, ($0.11); '15, $0.08; '16, $0.22. Egs. may ~C) Incl. reg. assets. In 2015: $521.0 mill., Price Growth Persistence 35 $1.46; '15, $1.52; '16, $1.56. Exel. nonrecur. not sum due to change in shares. Next egs. rpt. 7.34 per shr. (D) In mill., adj. for split. Earnings Predictability 75 e 2017 Value line, Inc. All righ1S reserved. Faciual ma1erial is obtained rrom souri:es believed 1D be reliable and is provided wilhout warranties of an~ kind.
:·t1•llllHl::l•h1 THE PUBLISHER IS NOT RESPONSIBLE FOR ANY ERRORS OR OMISSIONS HERE IN. This J"blication Is strictly for subscriber's 01M1, non-commeri:ial inmmal use. o part •11a.i111·,~111 '---• of it may be reproduced, resold, stnred or transmitted in any prinmd, electronic or other form, or use for generating or marketing any printed or electronic publication. service or product
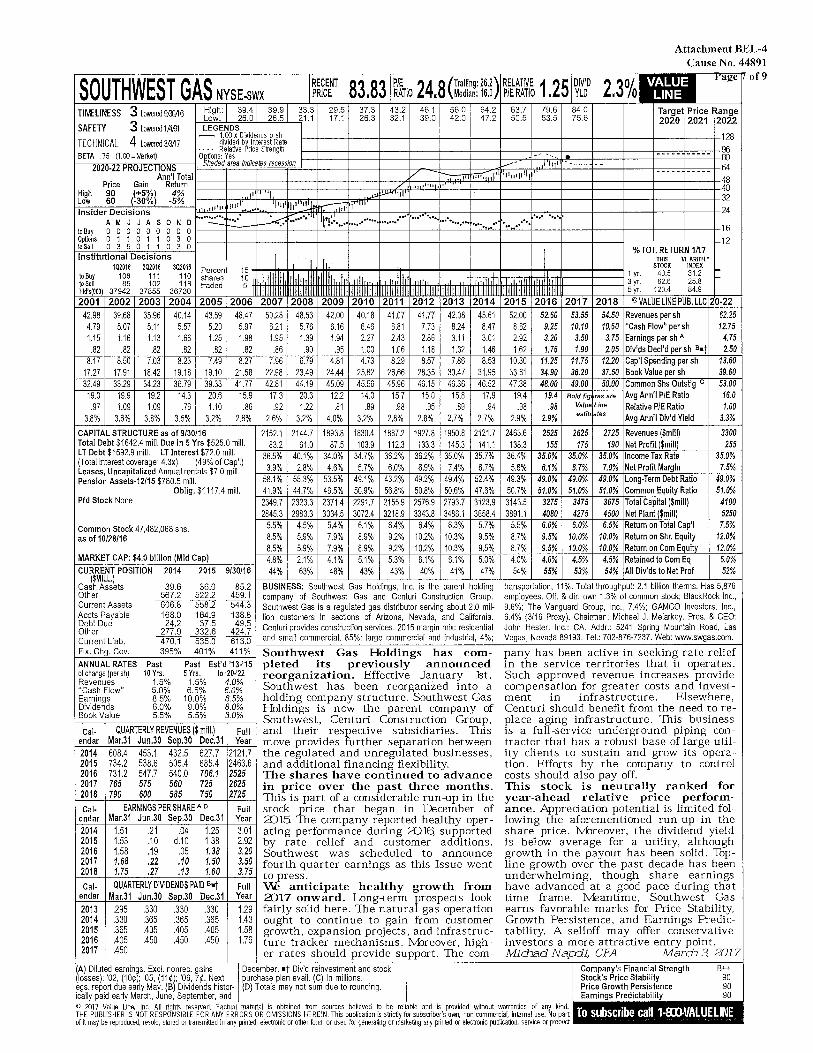
Attachment BEL-4 Cause No. 44891
SOUTHWEST GAS NYSE-swx I RECENT 83 83 IP/E 24 8(Trailing:26.2) RELATIVE 1 25 DIV'D
2.3%-
rage
PRICE , RATIO , Median: 16.0 P/E RATIO I YLD of9
TllVELINESS 3 Lowered 9.00/16 High: 39.4 39.9 33.3 29.5 37.3 43.2 46.1 56.0 64.2 63.7 79.6 84.0 Target Price Range Low: 26.0 26.5 21.1 17.1 26.3 32.1 39.0 42.0 47.2 50.5 53.5 75.6 2020 2021 2022
SAFETY 3 Lowered 11491 LEGENDS
4 Lowered 'W.7 - ai~ .. d~ivi~~~sr~~te 128 TECHNICAL · . . . Relative ~nee Strength 96 BETA .75 (1.00= N'erke~ O~~~~~~y:ia indicatEs recession
......... - .... .. .. - .. -...... 00
2020·22 PROJECTIONS --- .• 11,,1 --- - - -- 64 / 'l11u111111' .... .... .. .. -......
Ann'I Total I' 1111,; .. 1· 48 Price Gain Return / 11111ll1•1i' 40 High 90 (+5%l 4% ••• 111 I I .... ~ ·111' 32 Low 60 (·30% ·5%
111111· ••• 1111 , .,,, Insider Decisions
1JllJl1 .• 111 24 .......... .... . .... ·········· .... ····· AMJJASON D ... ·· .. ·· ..... ······ . ...... .......... ···· .... ···· . ...... ···. Jo Buy 00000000 0 16 Options 0 1 1 0 1 1 0 3 0 ,...12 Jo Sell 0 3 5 0 1 1 0 3 0 % TOT. RETURN 1117 Institutional Decisions THIS VLARlfH.'
1Q2016 2Q2016 3Q2016 Percent 15- STOCK INDEX
"" to Buy 108 111 110 shares 10 I ' 1 yr. 40.5 31.2 ~
to Sell 85 102 118 traded 5 lldlll '"" ·' .. ".II.I 1.1.1111 Ill 11111 3yr. 62.6 25.8 ~
Hld'slOOO 37942 37855 36730 1111111 1111 Ill 1111111111 Ill 11111 5yr. 120.4 84.9 2001 2002 2003 2004 2005 2006 2007 2008 2009 2010 2011 2012 2013 2014 2015 2016 2017 2018 ©VALUE LINE PUB. LLC ·0-22
42.98 39.68 35.96 40.14 43.59 48.47 50.28 48.53 42.00 40.18 41.07 41.77 42.08 45.61 52.00 52.60 53.55 54.50 Revenues per sh 62.25 4.79 5.07 5.11 5.57 5.20 5.97 6.21 5.76 6.16 6.46 6.81 7.73 8.24 8.47 8.62 9.25 10.10 10.60 "Cash Flow" per sh 12.75 1.15 1.16 1.13 1.66 1.25 1.98 1.95 1.39 1.94 2.27 2.43 2.86 3.11 3.01 2.92 3.20 3.50 3.75 Earnings per sh A 4.75 .82 .82 .82 .82 .82 .82 .86 .90 .95 1.00 1.06 1.18 1.32 1.46 1.62 1.76 1.90 2.05 Div'ds Decl'd per sh Birt 2.50
8.17 8.50 7.03 8.23 7.49 827 7.96 6.79 4.81 4.73 8.29 8.57 7.86 8.53 10.30 11.25 11.75 12.20 Cap'I Spending per sh 13.60 17.27 17.91 18.42 19.18 19.10 21.58 22.98 23.49 24.44 25.62 26.66 28.35 30.47 31.95 33.61 34.90 36.20 37.50 Book Value per sh 39.60 32.49 33.29 34.23 36.79 39.33 41.77 42.81 44.19 45.09 45.56 45.96 46.15 46.36 46.52 47.38 48.00 49.00 50.00 Common Shs Outst'g c 53.00
19.0 19.9 19.2 14.3 20.6 15.9 17.3 20.3 12.2 14.0 15.7 15.0 15.8 17.9 19.4 19.4 Bold fig res are Avg Ann'I PIE Ratio 16.0 .97 1.09 1.09 .76 1.10 .86 .92 1.22 .81 .89 .98 .95 .89 .94 .98 .98 Value Line Relative P/E Ratio 1.00
3.8% 3.6% 3.8% 3.5% 3.2% 2.6% 2.6% 3.2% 4.0% 32% 2.8% 2.8% 2.7% 2.7% 2.9% 2.9% estin ates Avg Ann'I Div'd Yield 3.3%
CAPITAL STRUCTURE as of 9/30/16 2152.1 2144.7 1893.8 1830.4 1887.2 1927.8 1950.8 2121.7 2463.6 2525 2625 2725 Revenues ($mill) 3300 Total Debt $1642.4 mill. Due in 5 Yrs $525.0 mill. 83.2 61.0 87.5 103.9 112.3 133.3 145.3 141.1 138.3 155 175 190 Net Profit ($mill) 255 LT Debt $1592.9 mill. LT Interest $72.0 mill. 36.5% 40.1% 34.0% 34.7% 362% 362% 35.0% 35.7% 36.4% 35.0% 35.0% 35.0% Income Tax Rate 35.0% (Total interest coverage: 4.3x) (49% of Cap'I)
3.9% 2.8% 4.6% 5.7% 6.0% 6.9% 7.4% 6.7% 5.6% 6.1% 6.7% 7.0% Net Profit Margin 7.5% Leases, Uncapitalized Annual rentals $7.0 mill. Pension Assets-12/15 $780.5 mill. 58.1% 55.3% 53.5% 49.1% 432% 492% 49.4% 52.4% 49.3% 49.0% 49.0% 49.0% Long-Term Debt Ratio 49.0%
Obllg. $1117.4 mill. 41.9% 44.7% 46.5% 50.9% 56.8% 50.8% 50.6% 47.6% 50.7% 51.0% 51.0% 51.0% Common Equity Ratio 51.0% Pfd Stock None 2349.7 2323.3 2371.4 2291.7 2155.9 2576.9 2793.7 3123.9 3143.5 3275 3475 3675 Total Capital ($mill) 4100
2845.3 2983.3 3034.5 3072.4 3218.9 3343.8 3486.1 3658.4 3891.1 4080 4275 4500 Net Plant ($mill) 5250
Common Stock 47,482,068 shs. 5.5% 4.5% 5.4% 6.1% 6.4% 6.4% 6.3% 5.7% 5.5% 6.0% 6.0% 6.5% Return on Total Cap'I 7.5% as of 10/28/16 8.5% 5.9% 7.9% 8.9% 9.2% 10.2% 10.3% 9.5% 8.7% 9.5% 10.0% 10.0% Return on Shr. Equity 12.0%
8.5% 5.9% 7.9% 8.9% 9.2% 10.2% 10.3% 9.5% 8.7% 9.5% 10.0% 10.0% Return on Com Equity 12.0% MARKET CAP: $4.0 billion (Mid Cap) 4.8% 2.1% 4.1% 5.1% 5.3% 6.1% 6.1% 5.0% 4.0% 4.0% 4.5% 4.5% Retained to Com Eq 6.0% CURRENT POSITION 2014 2015 9/30/16 44% 63% 48% 43% 43% 40% 41% 47% 54% 55% 53% 54% All Div'ds to Net Prof 52%
($MILL.I BUSINESS: Southwest Gas Holdings, Inc. is the parent holding transportation, 11%. Total throughput: 2.1 billion therms. Has 5,876 Cash Assets 39.6 36.0 85.2
Other 567.2 522.2 459.1 company of Southwest Gas and Centuri Construction Group. employees. Off. & dir. own 1.3% of common stock; BlackRock Inc., Current Assets 606.8 558.2 544.3 Southwest Gas is a regulated gas distributor serving about 2.0 mil- 9.6%; The Vanguard Group, Inc., 7.4%; GAMCO Investors, Inc., Accts Payable 168.0 164.9 138.8 lion customers in sections of Arizona, Nevada, and California. 6.4% (3/16 Proxy). Chairman: Michael J. Melarkey. Pres. & CEO: Debt Due 24.2 37.5 49.5 Centuri provides construction services. 2015 margin mix: residential John Hester. Inc.: CA. Addr.: 5241 Spring Mountain Road, Las Other 277.9 332.6 424.7 Current Liab. 470.1 535.0 613.0 and small commercial, 85%; large commercial and industrial, 4%; Vegas, Nevada 89193. Tel.: 702-876-7237. Web: www.swgas.com.
Fix. Chg. Gov. 395% 401% 411% Southwest Gas Holdings has com- pany has been active in seeking rate relief ANNUAL RATES Past Past Est'd '13·'15 pleted its previously announced in the service territories that it operates. of change (per sh) 10Yrs. 5Yrs. to '20-'22 reorganization. Effective January Jst, Such approved revenue increases provide Revenues 1.5% 1.5% 4.0% Southwest has been reorganized into a compensation for greater costs and invest-"Cash Flow" 5.0% 6.5% 6.0% Earnings 8.5% 10.0% 6.5% holding company structure. Southwest Gas ment in infrastructure. Elsewhere, Dividends 6.0% 9.0% 8.0% Holdings is now the parent company of Centuri should benefit from the need to re-Book Value 5.5% 5.5% 3.0% Southwest, Centuri Construction Group, place aging infrastructure. This business Cal· QUARTERLY REVENUES($ mill.) Full and their respective subsidiaries. This is a full-service underground piping con-
endar Mar.31 Jun.30 Sep.30 Dec.31 Year move provides further separation between tractor that has a robust base of large util-2014 608.4 453.1 432.5 627.7 2121.7 the regulated and unregulated businesses, ity clients to sustain and grow its opera-2015 734.2 538.6 505.4 685.4 2463.6 and additional financing flexibility. tion. Efforts by the company to control 2016 731.2 547.7 540.0 706.1 2525 The shares have continued to advance costs should also pay off. 2017 765 575 560 725 2625 in price over the past three months. This stock is neutrally ranked for 2018 790 600 585 750 2725 This is part of a considerable run-up in the year-ahead relative price perform-Cal· EARNINGS PER SHARE A o Full stock price that began in December of ance. Appreciation potential is limited fol-
endar Mar.31 Jun.30 Sep.30 Dec.31 Year 3J15 The company reported healthy oper- lowing the aforementioned run-up in the 2014 1.51 .21 .04 1.25 3.01 ating performance during 3J16 supported share price. l\/breover, the dividend yield 2015 1.53 .10 d.10 1.38 2.92 by rate relief and customer additions. is below average for a utility, although 2016 1.58 .19 .05 1.38 3.20 Southwest was scheduled to announce growth in the payout has been solid. Top-2017 1.68 .22 .10 1.50 3.50 fourth-quarter earnings as this Issue went line growth over the past decade has been 2018 1.75 .27 .13 1.60 3.75 to press. underwhelming, though share earnings Cal· QUARTERLY DIVIDENDS PAID e•t Full W anticipate healthy growth from have advanced at a good pace during that
endar Mar.31 Jun.30 Seo.30 Dec.31 Year ID17 onward. Long-term prospects look time frame. Man time, Southwest Gas 2013 .295 .330 .330 .330 1.29 fairly solid here. The natural gas operation earns favorable marks for Price Stability, 2014 .330 .365 .365 .365 1.43 ought to continue to gain from customer Growth Persistence, and Earnings Predic-2015 .365 .405 .405 .405 1.58 growth, expansion projects, and infrastruc- tability. A selloff may offer conservative 2016 .405 .450 .450 .450 1.76 ture tracker mechanisms. l\/breover, high- investors a more attractive entry point . 2017 . 450 er rates should provide support. The com- Micha.a Nap:ii, CFA March.3 2017
(A) Diluted earnings. Exel. nonrec. gains I December. •t Div'd reinvestment and stock
I
Company's Financial Strength B++ (losses): '02, (10¢); '05, (11¢); '06, 7¢. Next purchase plan avail. (C) In millions. Stock's Price Stability 90 egs. report due early May. (B) Dividends histor· (D) Totals may not sum due to rounding. Price Growth Persistence 90 ically paid early March, June, September, and Earnings Predictability 90 © 2ITl7 Value Line, Inc. All lights reseived. FaciUa\ mamlia\ is obtained Jfom sources believed 1D be reliable and is provided without warranties of an~ kind. , THE PUBLISHER IS NOT RESPONSIBLE FOR ANY ERRORS OR OMSSIONS HEREIN. This fublication is s11ictly forsubscliber's 01111, non-<:ommercia~ internal use. o part •11-,. ,.,~I I :."tt:lla~:.-U~l/ll of it may be reproduced, resold, stnred or transmitted in any pnnlBd, electronic or other form, or use for generating or marketing any pnnted or electronic publication, service or product
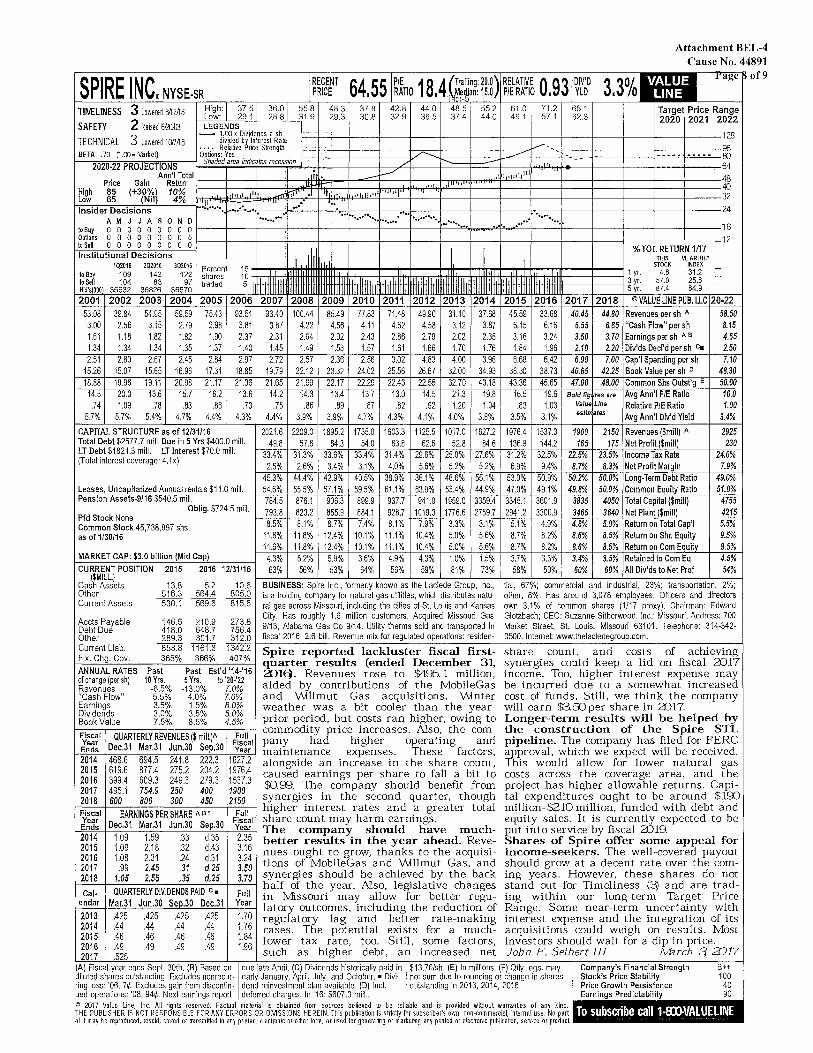
Attachment BEL-4 Cause No. 44891
SPIRE INC. NYSE-SR 'RECENT
64 55 IP/E 18 4,Q;n!ng: 20·0) RELATIVE 0 93 DIV'D 3.3%1ti1 rage!)
PRICE , RATIO , . e_~ an: 15.0 PIE RATIO I YLD of9
TllVELINESS 3 LoweredB/12116 High: 37.5 36.0 55.B 48.3 37.8 42.8 44.0 48.5 55.2 61.0 71.2 66.1 Target Price Range Low: 29.1 28.8 31.9 29.3 30.8 32.9 36.5 37.4 44.0 49.1 57.1 62.3 2020 2021 2022
SAFETY 2 Raised 62103 LEGENDS
3 Lowered 1MM - Ji~ .. d~ivi1:;~~~s!~~IB 128 TECHNICAL . . • . Relative Price Strenglh ~- 96 BETA .70 (1.CXl=IV'arket) O~~~~/i~a indicalils recession - - - .......... .......... 8'.l
/ ' 2020·22 PROJECTIONS 64 Ann'! Total
_ _...,. .11,.111•1 111
.. 48 Price Gain Return
"' "' •·· 40 High 85 (+30%l 10% l.1l111J_1ll 111.11,11 1 1111•1 .. 32 Low 65 (Nil 4% '''II ..
Insider Decisions .......... .. 24 ... AMJJASON D ······ ... .. ..... ··· ········· ·········· . ····· .....
to Buy 0 0 0 0 0 0 0 0 0 .......... ... . .. ·· 16
Options 00000000 5 -12 to Sell 0 0 0 0 0 0 0 0 0
I % TOT. RETURN 1/17
Institutional Decisions THIS VLARITH.• 1Q2016 2Q2016 3Q2016 Percent 15- I STOCK INDEX -to Buy 109 142 122 shares 10- i
2j~lil~1~ti~I 1111111.
1 yr. 4.8 31.2 -to Sell 104 83 97 traded 5 3 yr. 57.0 25.8 -Hld's(OD-0 35632 36826 36570 1111111111 1111111111 5yr. 87.4 84.9 2001 2002 2003 2004 2005 2006 2007 2008 2009 2010 2013 2014 2015 2016 2017 2018 ©VALUE LINE PUB. LLC 0-22
53.08 39.84 54.95 59.59 75.43 93.51 93.40 100.44 85.49 77.83 71.48 49.90 31.10 37.68 45.59 33.68 40.45 44.80 Revenues per sh A 58.50 3.00 2.56 3.15 2.79 2.98 3.81 3.87 4.22 4.56 4.11 4.62 4.58 3.12 3.87 6.15 6.16 6.55 6.85 "Cash Flow" per sh 8.15 1.61 1.18 1.82 1.82 1.90 2.37 2.31 2.64 2.92 2.43 2.86 2.79 2.02 2.35 3.16 3.24 3.50 3.70 Earnings per sh A B 4.65 1.34 1.34 1.34 1.35 1.37 1.40 1.45 1.49 1.53 1.57 1.61 1.66 1.70 1.76 1.84 1.96 2.10 2.20 Div'ds Decl'd per sh c. 2.50 2.51 2.80 2.67 2.45 2.84 2.97 2.72 2.57 2.36 2.56 3.02 4.83 4.00 3.96 6.68 6.42 6.90 7.00 Cap'I Spending per sh 7.10
15.26 15.07 15.65 16.96 17.31 18.85 19.79 22.12 23.32 24.02 25.56 26.67 32.00 34.93 36.30 38.73 40.65 42.25 Book Value per sh o 48.30 18.88 18.96 19.11 20.98 21.17 21.36 21.65 21.99 22.17 22.29 22.43 22.55 32.70 43.18 43.36 45.65 47.00 48.00 Common Shs Outst'g E 50.00 14.5 20.0 13.6 15.7 16.2 13.6 14.2 14.3 13.4 13.7 13.0 14.5 21.3 19.8 16.5 19.6 Bold fig res are Avg Ann'I PJE Ratio 16.0 .74 1.09 .78 .83 .86 .73 .75 .86 .89 .87 .82 .92 1.20 1.04 .83 1.03 Value Line Relative P/E Ratio 1.00
5.7% 5.7% 5.4% 4.7% 4.4% 4.3% 4.4% 3.9% 3.9% 4.7% 4.3% 4.1% 4.0% 3.8% 3.5% 3.1% estln ates Avg Ann'I Div'd Yield 3.4%
CAPITAL STRUCTURE as of 12131/16 2021.6 2209.0 1895.2 1735.0 1603.3 1125.5 1017.0 1627.2 1976.4 1537.3 1900 2150 Revenues ($mill) A 2925 Total Debt $2577.7 mill. Due in 5 Yrs $400.0 mill. 49.8 57.6 64.3 54.0 63.8 62.6 52.8 84.6 136.9 144.2 165 175 Net Profit ($mill) 230 LT Debt $1821.3 mill. LT Interest $70.0 mill. 33.4% 31.3% 33.6% 33.4% 31.4% 29.6% 25.0% 27.6% 31.2% 32.5% 22.5% 23.5% Income Tax Rate 24.0% (Total interest coverage: 4.1x)
2.5% 2.6% 3.4% 3.1% 4.0% 5.6% 5.2% 5.2% 6.9% 9.4% 8.7% 8.3% Net Profit Margin 7.9% 45.3% 44.4% 42.9% 40.5% 38.9% 36.1% 46.6% 55.1% 53.0% 50.9% 50.2% 50.0% Long-Term Debt Ratio 49.0%
Leases, Uncapitalized Annual rentals $11.0 mill. 54.6% 55.5% 57.1% 59.5% 61.1% 63.9% 53.4% 44.9% 47.0% 49.1% 49.8% 50.0% Common Equity Ratio 51.0% Pension Assets-9/16 $540.5 mill. 784.5 876.1 906.3 899.9 937.7 941.0 1959.0 3359.4 3345.1 3601.9 3835 4050 Total Capital ($mill) 4755
Oblig. $724.5 mill. 793.8 823.2 855.9 884.1 928.7 1019.3 1776.6 2759.7 2941.2 3300.9 3465 3640 Net Plant ($mill) 4215 Pfd Stock None
8.5% 8.1% 8.7% 7.4% 8.1% 7.9% 3.3% 3.1% 5.1% 4.9% 4.8% 5.0% Return on Total Cap'I 5.5% Common Stock 45,738,897 shs. as of 1/30/16 11.6% 11.8% 12.4% 10.1% 11.1% 10.4% 5.0% 5.6% 8.7% 8.2% 8.6% 8.5% Return on Shr. Equity 9.5%
11.6% 11.8% 12.4% 10.1% 11.1% 10.4% 5.0% 5.6% 8.7% 8.2% 8.6% 8.5% Return on Com Equity 9.5% MARKET CAP: $3.0 billion (Mid Cap) 4.3% 5.2% 5.9% 3.6% 4.9% 4.3% 1.0% 1.5% 3.7% 3.3% 3.4% 3.5% Retained to Com Eq 4.5% CURRENT POSITION 2015 2016 12/31/16 63% 56% 53% 64% 56% 59% 81% 73% 58% 59% 60% 60% All Div'ds to Net Prof 54%
($MILL.) Cash Assets 13.8 5.2 10.6 BUSINESS: Spire Inc., formerly known as the Laclede Group, Inc., tial, 67%; commercial and industrial, 23%; transportation, 2%; Other 516.3 564.4 805.0 is a holding company for natural gas utilities, which distributes natu- other, 8%. Has around 3,078 employees. Officers and directors Current Assets 530.1 569.6 815.6 ral gas across Missouri, including the cities of St. Louis and Kansas own 3.1% of common shares (1/17 proxy). Chairman: Edward
Accts Payable 146.5 210.9 273.8 City. Has roughly 1.6 million customers. Acquired Missouri Gas Glo1zbach; CEO: Suzanne Sitherwood. Inc.: Missouri. Address: 700
Debt Due 418.0 648.7 756.4 9/13, Alabama Gas Co 9/14. Utility therms sold and transported in Market Street, St. Louis, Missouri 63101. Telephone: 314-342· Other 289.3 301.7 312.0 fiscal 2016: 2.6 bill. Revenue mix for regulated operations: residen- 0500. Internet: www.thelacledegroup.com. Current Liab. 853.8 1161.3 1342.2 Spire reported lackluster fiscal first- share count, and costs of achieving Fix. Chg. Gov. 365% 366% 407% quarter results (ended December 31, synergies could keep a lid on fiscal 3J17 ANNUAL RATES Past Past Est'd '14·'16 IDl~. Revenues rose to $495.1 million, income. Too, higher interest expense may of change (per sh) 10Yrs. 5Yrs. to '20-'22 aided by contributions of the MobileGas be incurred due to a somewhat increased Revenues -6.5% -13.0% 7.0% "Cash Flow" 5.5% 4.0% 7.0% and Wllmut Gas acquisitions. Wnter cost of funds. Still, we think the company Earnings 3.5% 1.5% 8.0% weather was a bit cooler than the year- will earn $3.50per share in 3'.)17. Dividends 3.0% 3.5% 5.0% prior period, but costs ran higher, owing to Longer-term results will be helped by Book Value 7.5% 8.5% 4.5%
Fiscal QUARTERLY REVENUES($ mill.)A Full commodity price increases. Also, the com- the construction of the Spire STL
Year Fiscal pany had higher operating and pipeline. The company has filed for FERC Ends Dec.31 Mar.31 Jun.30 Sep.30 Year maintenance expenses. These factors, approval, which we expect will be received. 2014 468.6 694.5 241.8 222.3 1627.2 alongside an increase in the share count, This would allow for lower natural gas 2015 619.6 877.4 275.2 204.2 1976.4 caused earnings per share to fall a bit to costs across the coverage area, and the 2016 399.4 609.3 249.3 279.3 1537.3 2017 495.1 754.9 250 400 1900 $0.99. The company should benefit from project has higher allowable returns. Capi-
2018 600 800 300 450 2150 synergies in the second quarter, though tal expenditures ought to be around $100
Fiscal EARNINGS PER SHARE A e F Full higher interest rates and a greater total million-$210 million, funded with debt and
Year Dec.31 Mar.31 Jun.30 Sep.30 Fiscal share count may harm earnings. equity sales. It is currently expected to be Ends Year The company should have much- put into service by fiscal 3J19. 2014 1.09 1.59 .33 d.35 2.35 better results in the year ahead. Reve- Shares of Spire offer some appeal for 2015 1.09 2.18 .32 d.43 3.16 nues ought to grow, thanks to the acquisi- income-seekers. The well-covered payout 2016 1.08 2.31 .24 d.31 3.24 2017 .99 2.45 .31 d.25 3.50 tions of MobileGas and Wllmut Gas, and should grow at a decent rate over the com-2018 1.05 2.55 .35 d.25 3.70 synergies should be achieved by the back ing years. However, these shares do not
Cal· QUARTERLY DIVIDENDS PAID c • Full half of the year. Also, legislative changes stand out for Timeliness (3) and are trad-
endar Mar.31 Jun.30 Sen.30 Dec.31 Year in Missouri may allow for better regu- ing within our long-term Target Price
2013 .425 .425 .425 .425 1.70 latory outcomes, including the reduction of Range . Some near-term uncertainty with regulatory lag and better rate-making interest expense and the integration of its
2014 .44 .44 .44 .44 1.76 cases. The potential exists for a much- acquisitions could weigh on results. Most 2015 .46 .46 .46 .46 1.84 lower tax rate, too. Still, some factors, investors should wait for a dip in price. 2016 .49 .49 .49 .49 1.96 2017 .525 such as higher debt, an increased net John E. Seibert III Mrch 3 aJ17
(A) Fiscal year ends Sept. 30th. (B) Based on I due late April. (C) Dividends historically paid in I $13.70/sh. (E) In millions. (F) Qtly. egs. may Company's Financial Strength B++ diluted shares outstanding. Excludes nonrecur- early January, April, July, and October. • Divi- not sum due to rounding or change in shares Stock's Price Stability 100 ring loss: '06, 7¢. Excludes gain from discontin· dend reinvestment plan available. (D) Incl. outstanding in 2013, 2014, 2016. Price Growth Persistence 40 ued operations: '08, 94¢. Next earnings report deferred charges. In '16: $607.3 mill., Earnings Predictability 90 © 2017 Value Line, Inc. All r~h~ reserved. Facl!Jal mamrtal is obtained from sources believed to be reliable and is provided wilhout warranties of anN kind.
110..w;11•&arnn-THE PUBLISHER IS NOT RESP NSIBLE FOR ANY ERRORS OR OMSSIONS HEREIN. This f"bflcation is stricdy forsubscriber's own, non-oommercial, inmmal use. o part 111-..~ 11 1 of it may be reproduced, resold, slored or lransrnitted in any printed, electronic or other form, or use for generaHng or marketing any printed or electronic publication, service or product
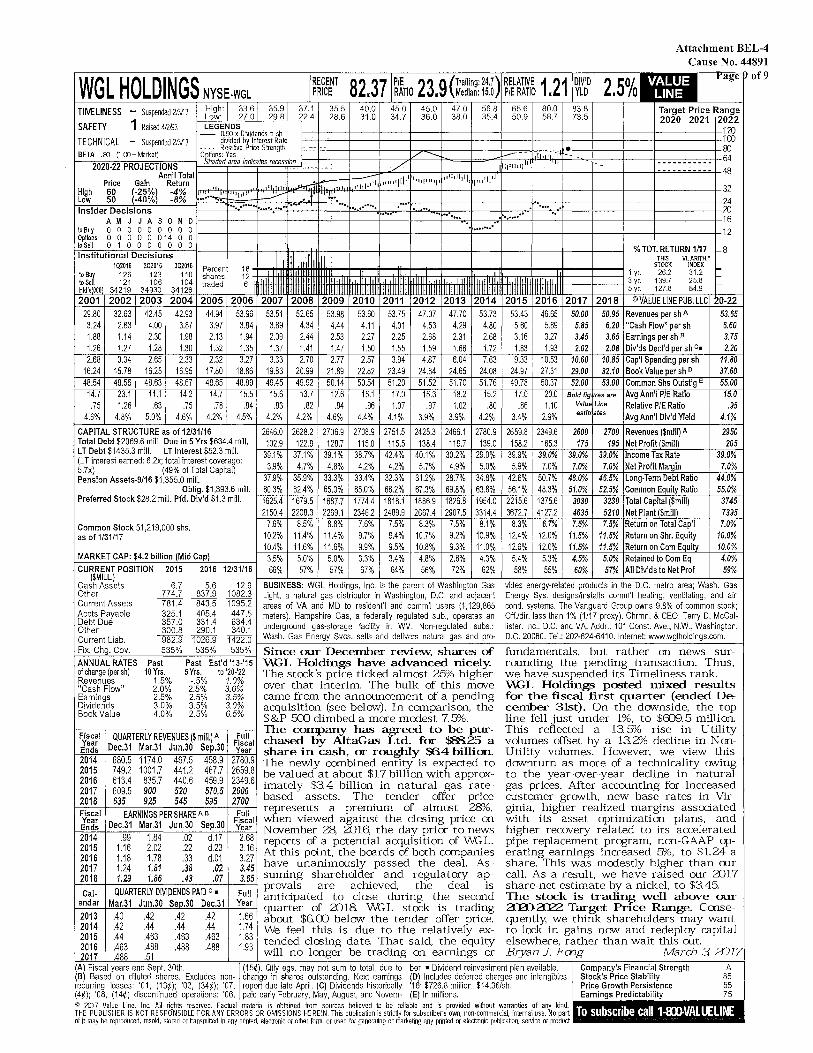
Attachment BEL-4 Cause No. 44891
JJG_L_fiQ_lD_l~G_~-~~~~l"--r-REC-EN_T ~~~7~1-P/E-~3-~(_Tra~lling-:24_.7)+-RE-LAT~IVE-1_21~DIV~'D _2_.5~0/0 ~--rag---<e ~ of9 NYSE-WGL PRICE , RATIO , Median: 15.0 P/E RATIO , YLD /( ~
TllVELINESS - Suspended 213/17
SAFETY 1 Raised 4/lf.f3
High: 33.6 35.9 37.1 35.5 40.0 45.0 45.0 47.0 56.8 65.6 80.0 83.8 Target Price Range 2020 2021 2022 ,__L~ow~: ~-27~·~0 ~-29~.8~~22.4 28.6 31.0 34.7 36.0 38.0 35.4 50.9 58.7 73.5
LEGENDS
TECHNICAL - Suspended 213/17 BETA .80 (1.00= Mlrke~
- ~T.l:d~"i~;~~~sr~~te . . . . Relative ~nee Strength
-+---+--+---+---J--+---r---r----r---t--+---t---rj/il ~+-~+-~-+-"""'::--t~--!~~l---::::-=-=--.!=:---.:~.._-~t--~+-~-t-~-+~-t-00
2020·22 PROJECTIONS O~~~~/iiiia indicalBs recession -+-----!-----: /'~l./c.._ ____ -'P"-====i"== ....... "'f------.,~~1~1~1 .. ·~~1 .. H----~-........,1----+--~-~-~-7-~-~-~-~-7-~.+-64
- -y-- lplhll- ----- ..... _ ........ ,:-:;-;;;;,,.. 48
High Low
Price 60 50
Gain (-25%l (-40%
Insider Decisions
Ann'I Total Return 4% .... 11.11111111JI
-8% ····-. .......... ...... ~Jllll'l'p11ill)ll11pllll1ll1ll,p11'll''
tlllllll+''~·ll~l'-'~·--+----11----+---ll----+---l---+--l----+--+---+32
~=·~·~ .. : .. :~:··.~::::~:~.:.~~~~==~~===~~==~~~=··=··~~====~~====~====~====~====!::~ A M J J A S 0 N D 1----+----+-- --r----f·-··_··--r----f00r0·-·~_ •• '";1.r---..~·r··~··-~·-·-+---··-+----fr---t---r---r---r-16 .........
-..+----1---1----11----1----11----1----1---1---1-----1---1----+-12 to Buy O O O 0 0 0 O O O •---+----+--Options 0 0 0 0 0 0 14 0 0 toSeD 0 1 0 0 0 0 0 0 0 Institutional Decisions
102016 202016 302016 to Buy 126 123 110 to Seit 121 106 104 Hld's(OOO 34219 34930 34126 2001 2002 2003 2004
29.80 3.24 1.88 1.26 2.68
16.24 48.54
14.7 .75
32.63 2.63 1.14 1.27 3.34
15.78 48.56 23.1 1.26
42.45 4.00 2.30 1.28 2.65
16.25 48.63
11.1 .63
42.93 3.87 1.98 1.30 2.33
16.95 48.67 142
.75
Common Stock 51,219,000 shs. as of 1/31/17
Percent 18 • shares 12 -traded 6 j 2005 2006
44.94 3.97 2.13 1.32 2.32
17.80 48.65
14.7 .78
53.96 3.84 1.94 1.35 3.27
18.86 48.89
15.5 .84
MARKET CAP: $4.2 billion (Mid Cap) CURRENT POSITION 2015 2016 12/31/16
% TOT. RETURN 1/17 ,... 8 THIS VLARITH."
1111 111111111
STOCK INDEX
-:c-ttt---t----i 1 yr. 26.2 31.2 ::: tlhttt---t----i 3 yr. 139.7 25.8
5 yr. 127.8 84.9 2008 2009 2010 2011 2012 2013 2014 2015 2016 2007 2017 2018 ©VALUE LINE PUB. LLC 20-22
52.65 53.98 53.60 53.75 47.07 47.70 53.73 53.43 46.65 53.51 50.00 50.95 Revenues per sh A 53.65 4.34 4.44 4.11 4.01 4.53 4.29 4.80 5.60 5.89 3.89 5.85 6.20 "Cash Flow" per sh 6.60 2.44 2.53 2.27 2.25 2.68 2.31 2.68 3.16 3.27 2.09 3.45 3.65 Earnings per sh B 3.75 1.41 1.47 1.50 1.55 1.59 1.66 1.72 1.83 1.93 1.37 2.02 2.08 Div'ds Decl'd per sh c. 2.20 2.70 2.77 2.57 3.94 4.87 6.04 7.63 9.33 10.53 3.33 10.60 10.85 Cap'! Spending per sh 11.80
20.99 21.89 22.82 23.49 24.64 24.65 24.08 24.97 27.31 19.83 29.00 32.10 Book Value per sh o 37.60 49.92 50.14 50.54 51.20 51.52 51.70 51.76 49.78 50.37 49.45 52.00 53.00 Common Shs Outst'g E 55.00
13.7 12.6 15.1 17.0 15.3 18.2 15.2 17.0 20.0 .82 .84 .96 1.07 .97 1.02 .80 .86 1.10
4.2% 4.6% 4.4% 4.1% 3.9% 3.9% 4.2% 3.4% 2.9%
2628.2 2706.9 2708.9 2751.5 2425.3 2466.1 2780.9 2659.8 2349.6 122.9 128.7 115.0 115.5 138.4 119.7 139.0 158.2 165.3
37.1% 39.1% 38.7% 42.4% 40.1% 302% 29.0% 39.9% 39.0% 4.7% 4.8% 4.2% 42% 5.7% 4.9% 5.0% 5.9% 7.0%
35.9% 33.3% 33.4% 32.3% 312% 28.7% 34.8% 42.6% 50.7% 62.4% 65.0% 65.0% 66.2% 67.3% 69.8% 63.8% 56.1% 48.3% 1679.5 1687.7 1774.4 1818.1 1886.9 1826.8 1954.0 2215.6 1375.6 2208.3 2269.1 23462 2489.9 2667.4 2907.5 3314.4 3672.7 4127.2
8.5% 8.8% 7.6% 7.5% 8.3% 7.5% 8.1% 8.3% 6.7% 7.6% 7.5% 7.5% Return on Total Cap'I 7.0% 11.4% 11.4% 9.7% 9.4% 10.7% 9.2% 10.9% 12.4% 12.0% 10.2% 11.5% 11.5% Return on Shr. Equity 10.0% 11.6% 11.6% 9.9% 9.5% 10.8% 9.3% 11.0% 12.6% 12.0% 10.4% 11.5% 11.5% Return on Com Equity 10.0% 5.0% 5.0% 3.3% 3.4% 4.8% 2.6% 4.3% 5.4% 5.3% 3.5% 4.5% 5.0% Retained to Com Eq 4.0% 57% 57% 67% 64% 56% 72% 62% 58% 55% 66% 60% 57% All Div'ds to Net Prof 59%
($MILL.) Cash Assets 6.7 5.6 12.9 BUSINESS: WGL Holdings, Inc. is the parent of Washington Gas vides energy-related products in the D.C. metro area; Wash. Gas Other 774.7 837.9 1082.3 Light, a natural gas distributor in Washington, D.C. and adjacent Energy Sys. designsfJnstalls comm'I heating, ventilating, and air Current Assets 781.4 843.5 1095.2 areas of VA and MD to resident'! and comm'I users (1,129,865 cond. systems. The Vanguard Group owns 9.8% of common stock; ~~~\sJ'u8lable 325.1 405.4 447.5 meters). Hampshire Gas, a federally regulated sub., operates an OffJdir. less than 1% (1/17 proxy). Chrmn. & CEO: Terry D. McCal-Other ~5b:g ~~6:t g~6:t underground gas-storage facility in WV. Non-regulated subs.: lister. Inc.: D.C. and VA. Addr.: 101 Const. Ave., N.W., Washington, Current Liab. 982_9 1026.9 1422.0 ,__w_a_sh_. _G_a_s _E_ne_rg_y_s_v_cs_._s_e_lls_a_n_d_d_el_iv_ers_n_at_u_ra_I _ga_s_a_n_d _p_ro_-_o_.c_. _20_0_80_._T_el_.: _20_2_-6_2_4-_64_1_0_. l_nt_em_et_: www __ .w_g_lh_o_ld_in_gs_.c_o_m_. ---<
.... F_ix_._C_h""g._C_o_v_. ___ 5_3_5';....Y. __ 53_5-'o/._, __ 53_5...;.%-1 Since our December review, shares of fundamentals, but rather on news sur-ANNUAL RATES Past Past Est'd '13-'15 \i\G-L Holdings have advanced nicely. rounding the pending transaction. Thus, ofchange(persh) 10Yrs. 5Yrs. to'20-'22 The stock's price ticked almost 25% higher we have suspended its Timeliness rank. ~~~;~~1~w" J:5~ 2:~~ J:g~ over that interim. The bulk of this move \i\G-L Holdings posted mixed results Earnings 2.5% 2.5% 3.5% came from the announcement of a pending for the fiscal first quarter (ended De-Dividends 3.0% 3.5% 3.0% acquisition (see below). In comparison, the cetnber 31st). On the downside, the top Book Value 4.0% 2·5% 6·5% S&P 5Xl climbed a more mcxiest 7.fP/o. line fell just under 1%, to $ED9.5 million. 1---~--------~--l The company has agreed to be pur- This reflected a 13.fP/o rise in Utility
Fiscal QUARTERLY REVENUES($ mill.) A Full Year Dec.31 Mar.31 Jun.30 Sep.30 Fiscal Ends Year 2014 680.5 1174.0 467.5 458.9 2780.9 2015 749.2 1001.7 441.2 467.7 2659.8 2016 613.4 835.7 440.6 459.9 2349.6 2017 609.5 900 520 570.5 2600 2018 635 925 545 595 2700 Fiscal EARNINGS PER SHARE AB Full Year Dec.31 Mar.31 Jun.30 Sep.30 Fiscal Ends Year 2014 .99 1.84 .02 d.17 2.68 2015 1.16 2.02 .22 d.23 3.16 2016 1.18 1.78 .33 d.01 3.27 2017 1.24 1.81 .38 .02 3.45
chased by AltaGas Ltd. for $:B25 a volumes offset by a 13.2% decline in Nonshare in cash, or roughly $64 billion. Utility volumes. However, we view this The newly combined entity is expected to downturn as more of a technicality owing be valued at about $17billion with approx- to the year-over-year decline in natural imately $3.4 billion in natural gas rate- gas prices. After accounting for increased based assets. The tender offer price customer growth, new base rates in Virrepresents a premium of almost 28'/o, ginia, higher realized margins associated when viewed against the closing price on with its asset optimization plans, and November 28, 2016, the day prior to news higher recovery related to its accelerated reports of a potential acquisition of WGL. pipe replacement pr~am, non-GAAP opAt this point, the boards of both companies erating earnings increased fP/o, to $1.24 a have unanimously passed the deal. As- share. This was mcxiestly higher than our suming shareholder and regulatory ap- call. As a result, we have raised our 2017
i-=c...;.al'-· +--'-Qu"'A'-RT_E_R['-'-y""oiv-1-0E-N""os.:..P_i\l_D""'c.'-'--'f--'F""ul'-'-ll provals are achieved, the deal is share-net estimate by a nickel, to $3.45. endar Mar.31 Jun.30 Sen.30 Dec.31 Year anticipated to close during the second The stock is trading well above our
2018 1.29 1.86 .43 .07 3.65
quarter of 2018. WGL stock is trading a:ID-a:E2 Target Price Range. Conse-2013 .40 .42 .42 .42 1.66 about $6.00 below the tender offer price. quently; we think shareholders may want 2014 .42 .44 .44 .44 1.74 'We feel this is due to the relatively ex- to lock in gains now and redeploy capital 2015 .44 .463 .463 .463 1.83 tended closing date. That said, the equity elsewhere, rather than wait this out. 2016 .463 .488 .488 .488 1.93 will no longer be trading on earnings or Bryan J. Feng March 3 aJ17 2017 .488 .51
(A) Fiscal years end Sept. 30th. (15¢). Qtly egs. may not sum to total, due to I ber. • Dividend reinvestment plan available. Company's Financial Strength A (B) Based on diluted shares. Excludes non- change in shares outstanding. Next earnings (D) Includes deferred charges and intangibles. Stock's Price Stability 85 recurring losses: '01, (13¢); '02, (34¢); '07, report due late April. (C) Dividends historically '16: $726.8 million, $14.36/sh. Price Growth Persistence 55 (4¢); '08, (14¢) discontinued operations: '06, paid early February, May, August, and Novem- (E) In millions. Earnings Predictability 75 ., 2017 Value Line, Inc. Alt lights reserved. Factual material is obtained from sources believed 1D be reliable and is provided without warranties of any kind. .R.!ll!l!!llllJ!lllll!I~ THE PUBLISHER IS NOT RESPONSIBLE FOR ANY ERRORS OR OMSSIONS HEREIN. This publication is s1rictly forsubsclibers o\Ml, non-oommercia~ internal use. No part •II.._, l•,~I I ' • 11!':.-ll•"lllll l!ll of it may be reproduced, resold, stnred or transmitted in any printed, electronic or other form, or used for generating or mart<eting any printed or electronic publication, service or product
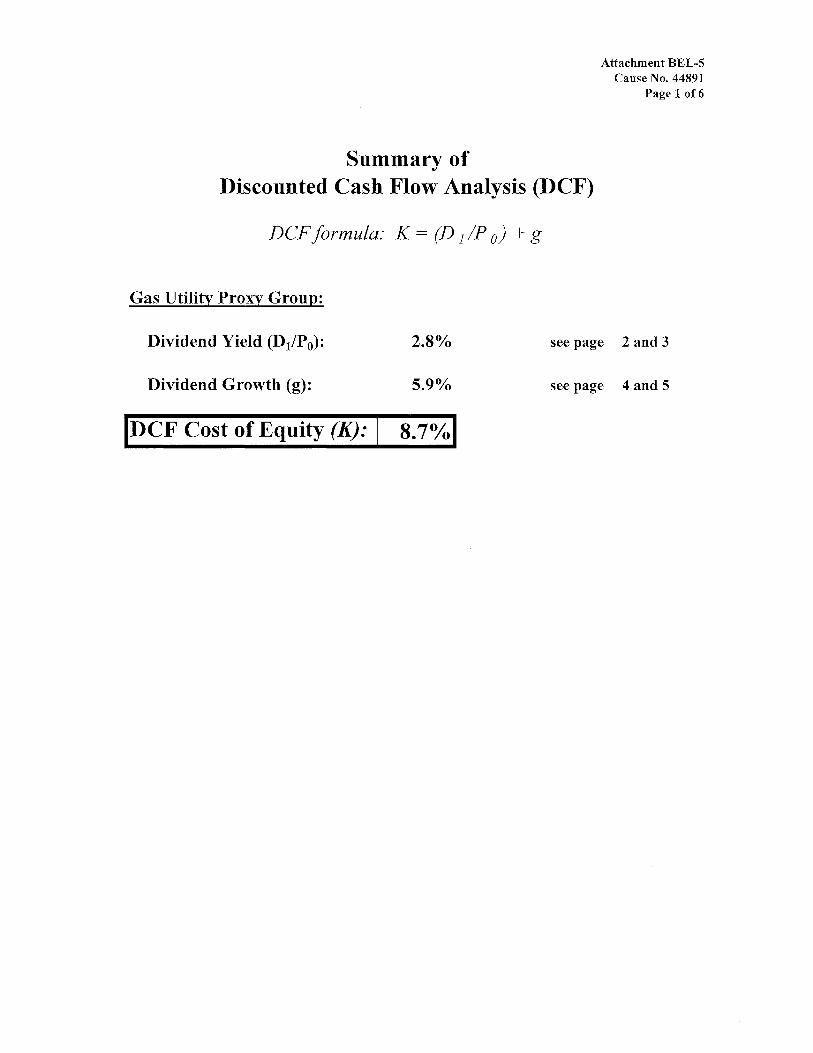
Summary of
Attachment BEL-5 Cause No. 44891
Page 1 of6
Discounted Cash Flow Analysis (DCF)
DCF formula: K = (D 1 IP 0) + g
Gas Utility Proxy Group:
Dividend Yield (D1/P 0): see page 2 and 3
Dividend Growth (g): 5.9°/o see page 4 and 5
IDCF Cost of Equity (K): I 8.7°/ol
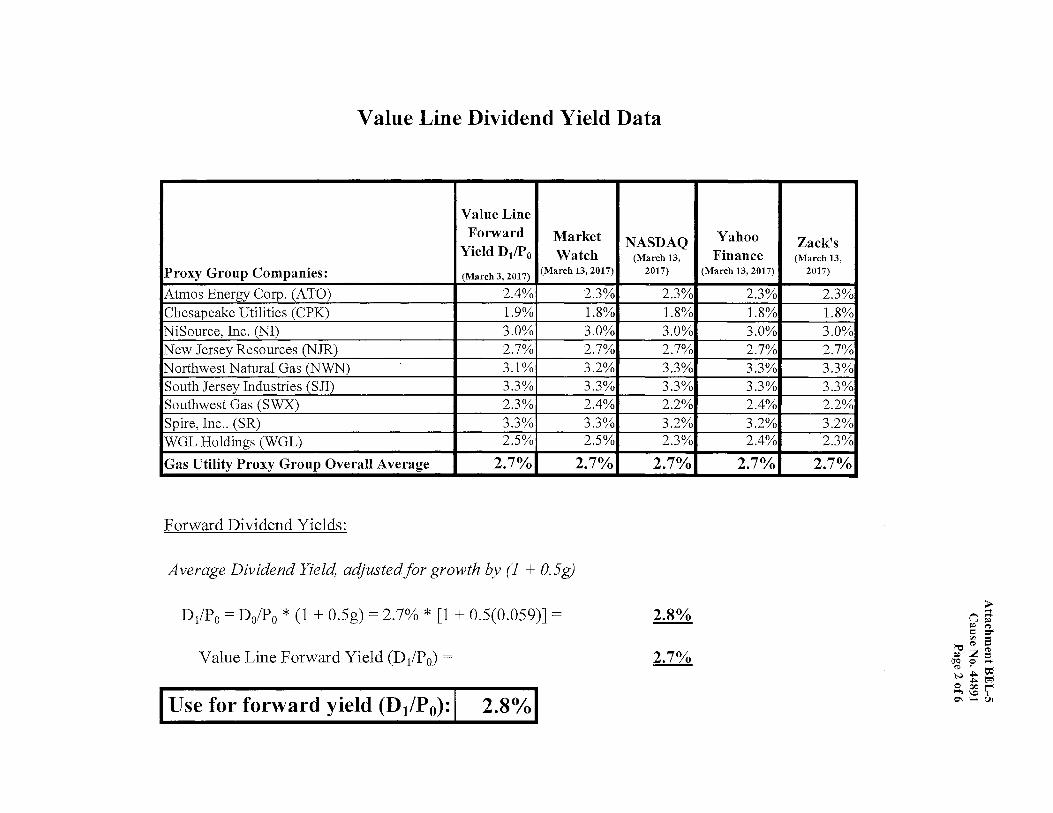
Value Line Dividend Yield Data
Value Line Forward Market NASDAQ
Yield D1/P0 Watch (March 13,
Proxy Group Companies: (March 3, 2017) (March 13, 2017) 2017)
Atmos Energy Corp. (ATO) 2.4% 2.3% 2.3% Chesapeake Utilities (CPK) 1.9% 1.8% 1.8% NiSource, Inc. (NI) 3.0% 3.0% 3.0% New Jersey Resources (NJR) 2.7% 2.7% 2.7% Northwest Natural Gas (NWN) 3.1% 3.2% 3.3% South Jersey Industries (Sll) 3.3% 3.3% 3.3% Southwest Gas (SWX) 2.3% 2.4% 2.2% Spire, Inc .. (SR) 3.3% 3.3% 3.2% WGL Holdings (WGL) 2.5% 2.5% 2.3%
Gas Utility Proxy Group Overall Average 2. 7°/o 2.7°10 2.7%
Forward Dividend Yields:
Average Dividend Yield, adjusted for growth by (1 + 0.5g)
D1/P0 = D0/P0 * (1 + 0.5g) = 2.7% * [1 + 0.5(0.059)] = 2.8%
Value Line Forward Yield (Di/P0) = 2.7°10
Use for forward yield (D1/P0): 2.8°/o
Yahoo Finance
(March 13, 2017)
2.3% 1.8% 3.0% 2.7% 3.3% 3.3% 2.4% 3.2% 2.4%
2.7%
Zack's (March 13,
2017)
2.3% 1.8% 3.0% 2.7% 3.3% 3.3% 2.2% 3.2% 2.3%
2.7°10
> (1 ;: I» ..,
= =--"'d ~ 9 I» 'Z g ~ 0 ..... .,, • l:ii N t i:"j 0 00 t"' -. \,C I
0\ ...... Ul
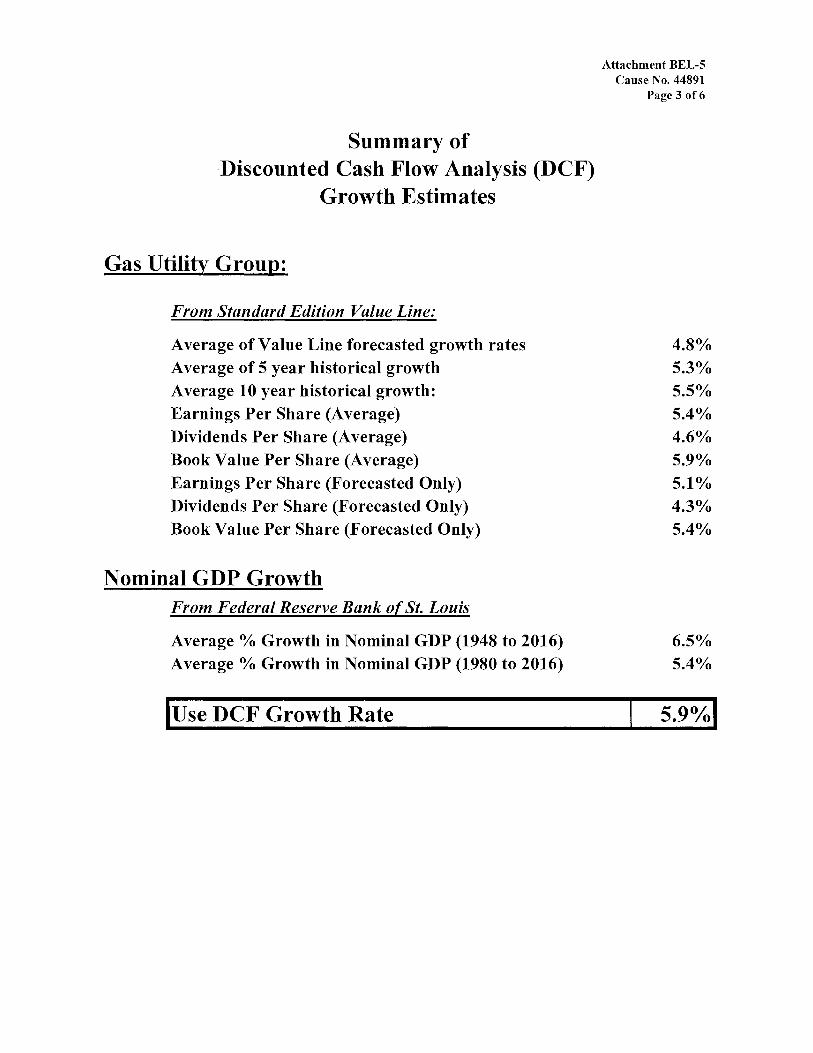
Summary of Discounted Cash Flow Analysis (DCF)
Growth Estimates
Gas Utility Group:
From Standard Edition Value Line:
Average of Value Line forecasted growth rates Average of 5 year historical growth Average 10 year historical growth: Earnings Per Share (Average) Dividends Per Share (Average) Book Value Per Share (Average) Earnings Per Share (Forecasted Only) Dividends Per Share (Forecasted Only) Book Value Per Share (Forecasted Only)
Nominal GDP Growth From Federal Reserve Bank o(St. Louis
Average 0/o Growth in Nominal GDP (1948 to 2016) Average 0/o Growth in Nominal GDP (1980 to 2016)
luse DCF Growth Rate
Attachment BEL-5 Cause No. 44891
Page 3 of6
4.8°/o 5.3°/o 5.5°/o 5.4o/o 4.6% 5.9% 5.1°/o 4.3°/o 5.4%
6.5°/o 5.4%
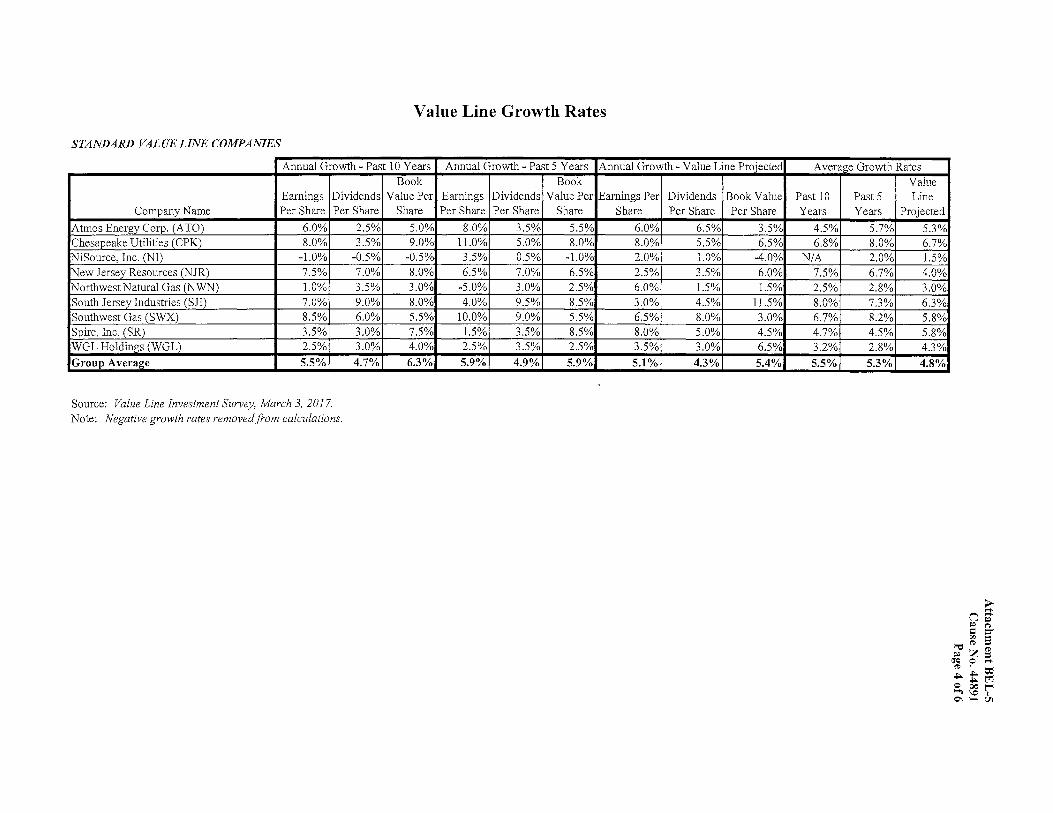
Value Line Growth Rates
STANDARD VALUE LINE COMPANIES
Annual Growth - Past 10 Years
Earnings Dividends Company Name Per Share Per Share
Atmos Energy Corp. (ATO) 6.0% 2.5% Chesapeake Utilities (CPK) 8.0% 3.5% NiSource, Inc. (NI) -1.0% -0.5%
New Jersey Resources (NJR) 7.5% 7.0% Northwest Natural Gas (NWN) 1.0% 3.5% South J ersev Industries (SJI) 7.0% 9.0% Southwest Gas (SWX) 8.5% 6.0% Spire, Inc. (SR) 3.5% 3.0% WGL Holdings (WGL) 2.5% 3.0%
Group Average 5.5% 4.7%
Source: Value Line Investment Survey, March 3, 2017. Note: Negative growth rates removed from calculations.
Book Value Per
Share
5.0% 9.0%
-0.5% 8.0% 3.0% 8.0% 5.5% 7.5% 4.0%
6.3%
Annual Growth - Past 5 Years Annual Growth - Value Line Projected Book
Earnings Dividends Value Per Earnings Per Dividends Book Value Per Share Per Share Share Share Per Share Per Share
8.0% 3.5% 5.5% 6.0% 6.5% 3.5% 11.0% 5.0% 8.0% 8.0% 5.5% 6.5% 3.5% 0.5% -1.0% 2.0% 1.0% -4.0% 6.5% 7.0% 6.5% 2.5% 3.5% 6.0%
-5.0% 3.0% 2.5% 6.0% 1.5% 1.5% 4.0% 9.5% 8.5% 3.0% 4.5% 11.5%
10.0% 9.0% 5.5% 6.5% 8.0% 3.0% 1.5% 3.5% 8.5% 8.0% 5.0% 4.5% 2.5% 3.5% 2.5% 3.5% 3.0% 6.5% 5.9% 4.9% 5.9% 5.1% 4.3% 5.4%
Average Growth Rates Value
Past 10 Past 5 Line Years Years Projected
4.5% 5.7% 5.3% 6.8% 8.0% 6.7%
NIA 2.0% 1.5% 7.5% 6.7% 4.0% 2.5% 2.8% 3.0% 8.0% 7.3% 6.3% 6.7% 8.2% 5.8% 4.7% 4.5% 5.8% 3.2% 2.8% 4.3%
5.5% 5.3% 4.8%
> (j ~ :::.0 (':)
= =--""d ~ = :::.0 :;z g
(fCl 0 ~ ~ • ei::l ""' t trj 0 QO t"" ...., \,:) I
0\ >-' Ul
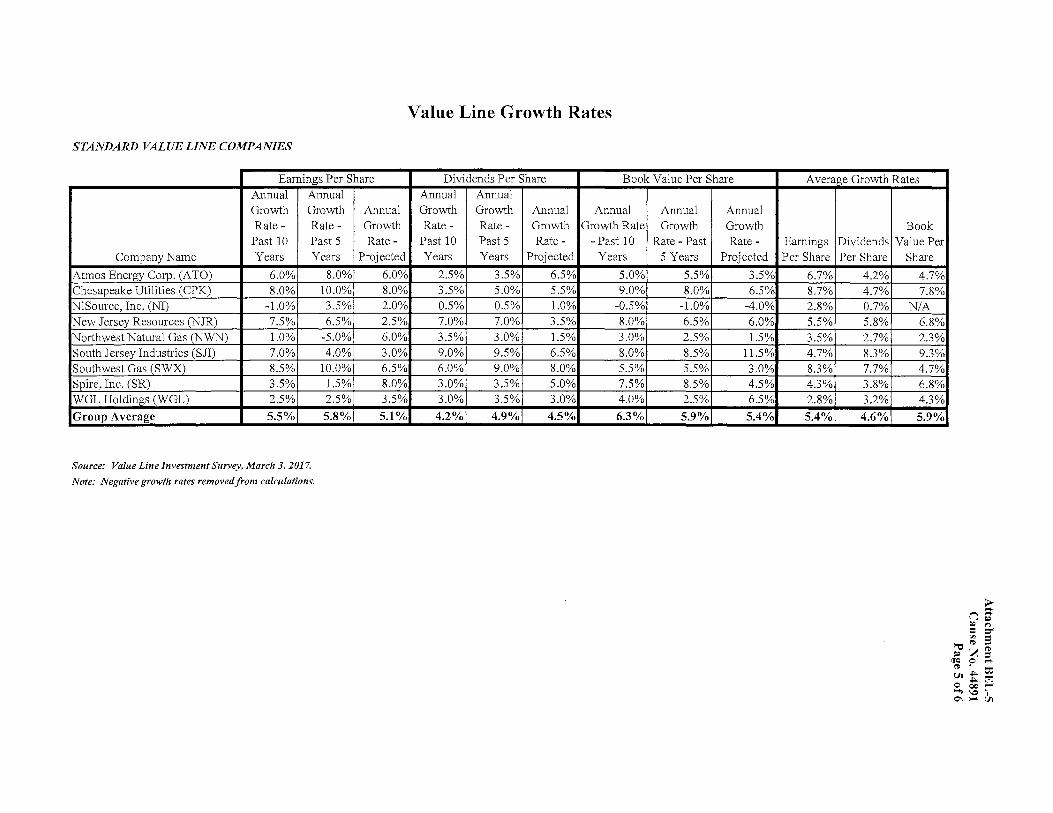
Value Line Growth Rates
STANDARD VALUE LINE COMPANIES
Earnings Per Share Annual Annual Growth Growth Rate- Rate -
Past 10 Past 5 Company Name Years Years
Atmos Energy Corp. (ATO) 6.0% 8.0% Chesapeake Utilities (CPK) 8.0% 10.0% NiSource, Inc. (NI) -1.0% 3.5% New Jersey Resources (NJR) 7.5% 6.5% Northwest Natural Gas (NWN) 1.0% -5.0% South Jersey Industries (SJI) 7.0% 4.0% Southwest Gas (SWX) 8.5% 10.0% Spire, Inc. (SR) 3.5% 1.5% WGL Holdings (WGL) 2.5% 2.5%
Group Average 5.5% 5.8%
Source: Value Line Investment Survey, March 3, 2017.
Note: Negative growth rates removed from calculations.
Annual Growth Rate -
Projected
6.0% 8.0% 2.0% 2.5% 6.0% 3.0% 6.5% 8.0% 3.5%
5.1%
Dividends Per Share Book Value Per Share Annual Annual Growth Growth Annual Annual Annual Annual Rate- Rate- Growth Growth Rate Growth Growth
Past 10 Past 5 Rate- - Past 10 Rate - Past Rate -Years Years Projected Years 5 Years Projected
2.5% 3.5% 6.5% 5.0% 5.5% 3.5% 3.5% 5.0% 5.5% 9.0% 8.0% 6.5% 0.5% 0.5% 1.0% -0.5% -1.0% -4.0% 7.0% 7.0% 3.5% 8.0% 6.5% 6.0% 3.5% 3.0% 1.5% 3.0% 2.5% 1.5% 9.0% 9.5% 6.5% 8.0% 8.5% 11.5% 6.0% 9.0% 8.0% 5.5% 5.5% 3.0% 3.0% 3.5% 5.0% 7.5% 8.5% 4.5% 3.0% 3.5% 3.0% 4.0% 2.5% 6.5% 4.2% 4.9% 4.5% 6.3% 5.9% 5.4%
Average Growth Rates
Book Earnings Dividends Value Per Per Share Per Share Share
6.7% 4.2% 4.7% 8.7% 4.7% 7.8% 2.8% 0.7% NIA 5.5% 5.8% 6.8% 3.5% 2.7% 2.3% 4.7% 8.3% 9.3% 8.3% 7.7% 4.7% 4.3% 3.8% 6.8% 2.8% 3.2% 4.3% 5.4% 4.6% 5.9%
> (j ~ I» ~ = =-
""O ~ s I» :z ~
IJCi 0 ...... (0 • to Ult l:zj 0 00 t"' ...., \0 I
0\ ...... Ul
Growth in Nominal Gross Domestic Product, 1948 to 2016
% Change °lo Change in Nominal in Nominal
Year GDP Year GDP
1948 7.90% 1980 9.90% 1949 -3.40% 1981 9.90% 1950 18.30% 1982 3.80% 1951 11.50% 1983 11.40% 1952 7.10% 1984 9.30% 1953 1.50% 1985 7.40% 1954 3.60% 1986 4.90% 1955 9.40% 1987 7.60% 1956 5.40% 1988 7.80% 1957 3.20% 1989 6.50% 1958 5.50% 1990 4.60% 1959 5.90% 1991 4.30% 1960 2.40% 1992 6.70% 1961 7.60% 1993 5.00% 1962 5.50% 1994 6.30% 1963 6.80% 1995 4.30% 1964 6.70% 1996 6.30% 1965 10.70% 1997 6.10% 1966 8.00% 1998 6.10% 1967 5.80% 1999 6.50% 1968 9.90% 2000 5.50% 1969 7.30% 2001 2.20% 1970 4.90% 2002 3.80% 1971 9.50% 2003 6.50% 1972 11.60% 2004 6.30% 1973 11.10% 2005 6.50% 1974 8.40% 2006 5.10% 1975 10.20% 2007 4.40% 1976 9.80% 2008 -0.90% 1977 11.90% 2009 0.20% 1978 . 14.60% 2010 4.60% 1979 10.00% 2011 3.70%
2012 3.30% 2013 4.30% 2014 4.10% 2015 3.00% 2016 3.50%
Avg.% Change 1948
to 2016 6.51% Avg.%
Change 1980 to 2016 5.43%
Source: Federal Reserve Economic Data, https:/lfred.stlouisfed.org, Federal Reserve Bank of St. Louis, Economic Research Division
Attachment BEL-5 Cause No. 44891
Page 6 of6
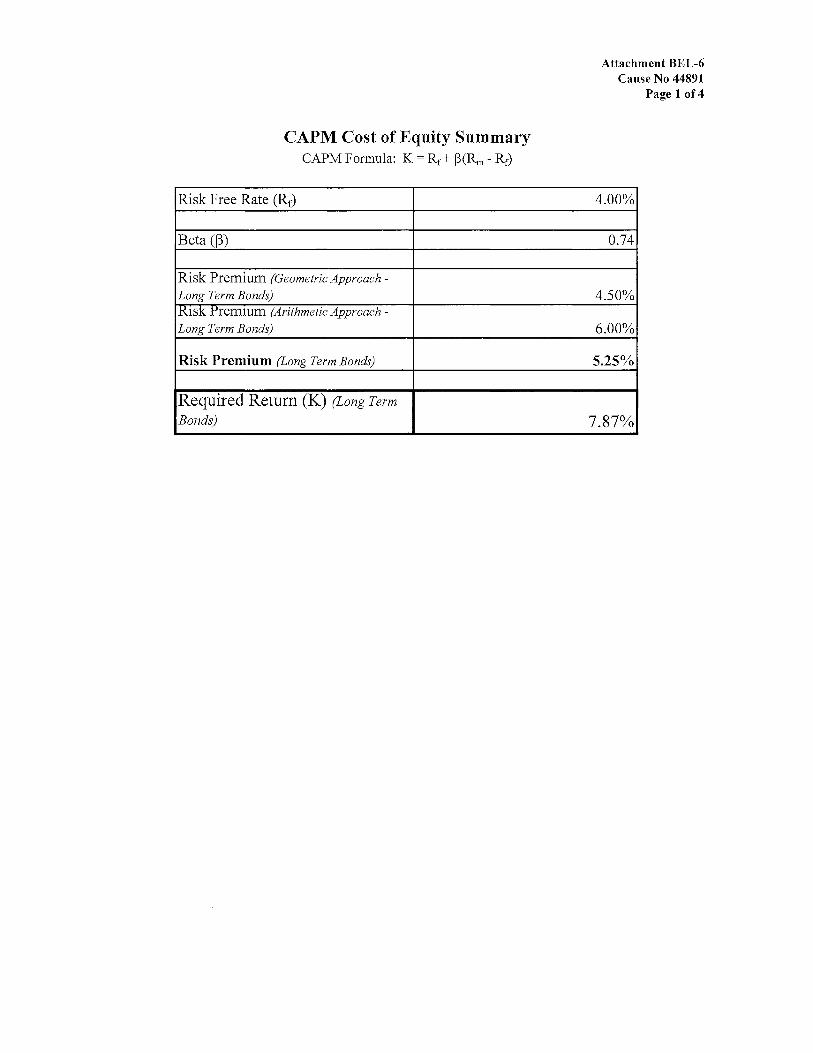
CAPM Cost of Equity Summary CAPM Formula: K = Rr+ j3(Rm - Rr)
Risk Free Rate (Rf)
Beta (f3)
Risk Premium (Geometric Approach -Long Term Bonds) Klsk Premium (Arithmetic Approach -Long Term Bonds)
Risk Premium (Long Term Bonds)
Required Return (K) (Long Term
Bonds)
Attachment BEL-6 Cause No 44891
Page 1of4
4.00%
0.74
4.50%
6.00%
5.25%
7.87%
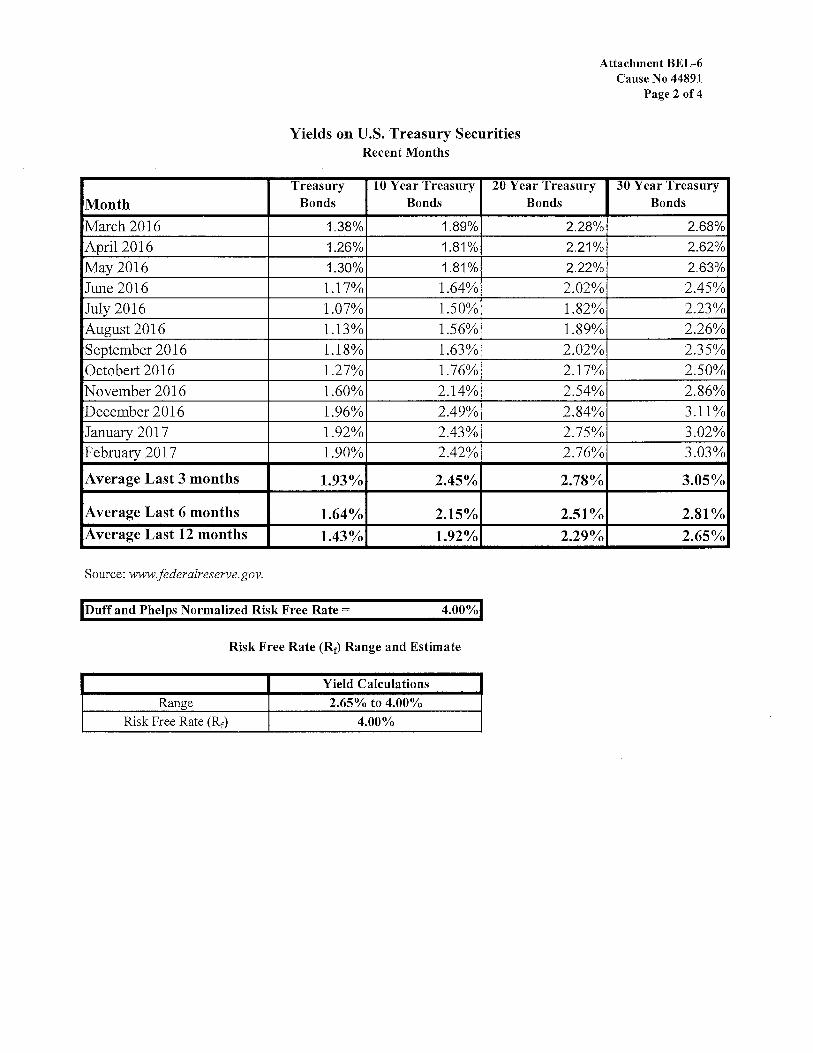
Yields on U.S. Treasury Securities Recent Months
Attachment BEL-6 Cause No 44891
Page 2 of 4
Treasury 1 u Year Treasury 2U Year Treasury ,jU Year ·1 reasury
Month Bonds Bonds Bonds Bonds
March2016 1.38% 1.89% 2.28% 2.68%
April 2016 1.26% 1.81% 2.21% 2.62%
May 2016 1.30% 1.81% 2.22% 2.63%
June 2016 1.17% 1.64% 2.02% 2.45% July 2016 1.07% 1.50% 1.82% 2.23% August2016 1.13% 1.56% 1.89% 2.26% September 2016 1.18% 1.63% 2.02% 2.35% Octobert 2016 1.27% 1.76% 2.17% 2.50% November 2016 1.60% 2.14% 2.54% 2.86% December 2016 1.96% 2.49% 2.84% 3.11% January 2017 1.92% 2.43% 2.75% 3.02% February 2017 1.90% 2.42% 2.76% 3.03%
Average Last 3 months 1.93% 2.45% 2.78% 3.05%
Average Last 6 months 1.64% 2.15% 2.51% 2.81% Average Last 12 months 1.43% 1.92% 2.29% 2.65%
Source: wwwfederalreserve.gov.
lnuff and Phelps Normalized Risk Free Rate=
Risk Free Rate (Rr) Range and Estimate
Yield Calculations
Range 2.65% to 4.00%
Risk Free Rate (Rr) 4.00%
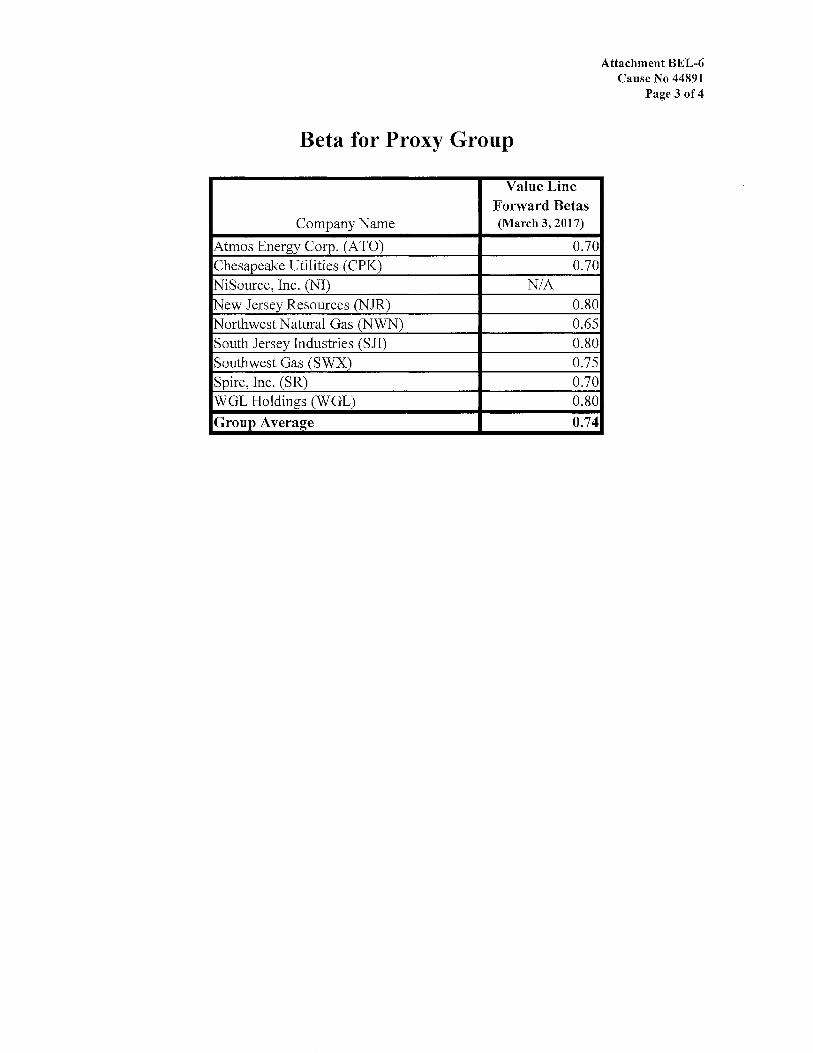
Beta for Proxy Group
Value Line Forward Betas
Company Name (March 3, 2017)
Atmos Energy Corp. (ATO) 0.70 Chesapeake Utilities (CPK) 0.70 NiSource, Inc. (NI) NIA New Jersey Resources (NJR) 0.80 Northwest Natural Gas (NWN) 0.65 South Jersey Industries (SJI) 0.80 Southwest Gas (SWX) 0.75 Spire, Inc. (SR) 0.70 WGL Holdings (WGL) 0.80
Group Average 0.74
Attachment BEL-6 Cause No 44891
Page 3 of 4
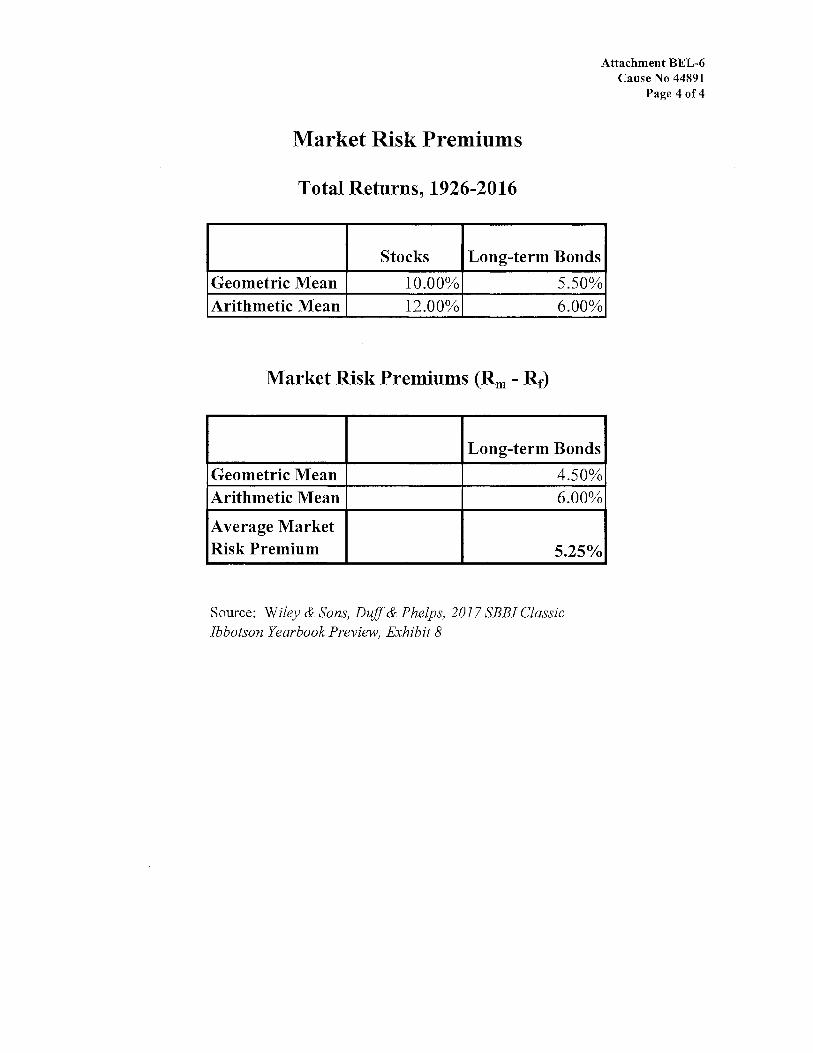
Market Risk Premiums
Total Returns, 1926-2016
Attachment BEL-6 Cause No 44891
Page 4 of4
Stocks Long-term Bonds
Geometric Mean 10.00% 5.50% Arithmetic Mean 12.00% 6.00%
Market Risk Premiums (Rm - Rr)
Long-term Bonds
Geometric Mean 4.50% Arithmetic Mean 6.00%
Average Market Risk Premium 5.25%,
Source: Wiley & Sons, Duff & Phelps, 2017 SBBI Classic Ibbotson Yearbook Preview, Exhibit 8
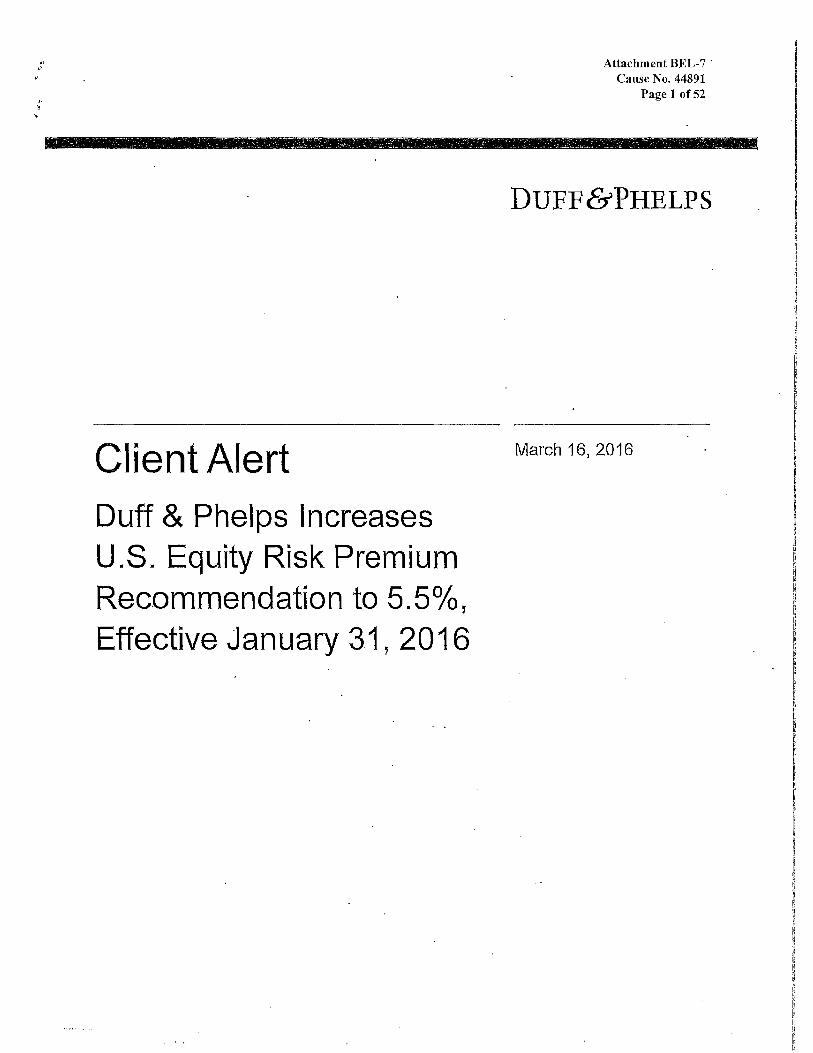
" ,, . I• ~
'
Attachment BEL-7 · Cause No. 44891
Page 1 of52
- - - - - - -- - - - - -- - - - - -- "\ - - - - , -- - . - -- - - - --- - -· ~ - - - '
Client Alert Duff & Phelps Increases U.S. Equity Risk Premium Rec.ommendation to 5.5%, Effective January 31, 2016
DUFF&PHELPS
March 16, 2016
Contents 01
02
03
04
05
06
Duff & Phelps I Client Alert
Executive Summary
Overview of Duff & Phelps ERP Methodology
E;stimating the Risk-Free Rate
. Attachment BEL-7 Cause No. 44891
Page2 of52
3
7
9
Basis for U.S. ERP Recommendation as of January 31, 2016 34
Concluslon 46
Appendices 49 Appendix A - Damodaran Implied ERP Model 50 Appendix 8 - Default Spread Model 51
March 16, 2016 2
. .
Section 01
Duff & Phelps ! Client Alert
Executive Summary
March 16, 2016
Attachment BEL-7 Cause No. 44891
Page3 of52
3
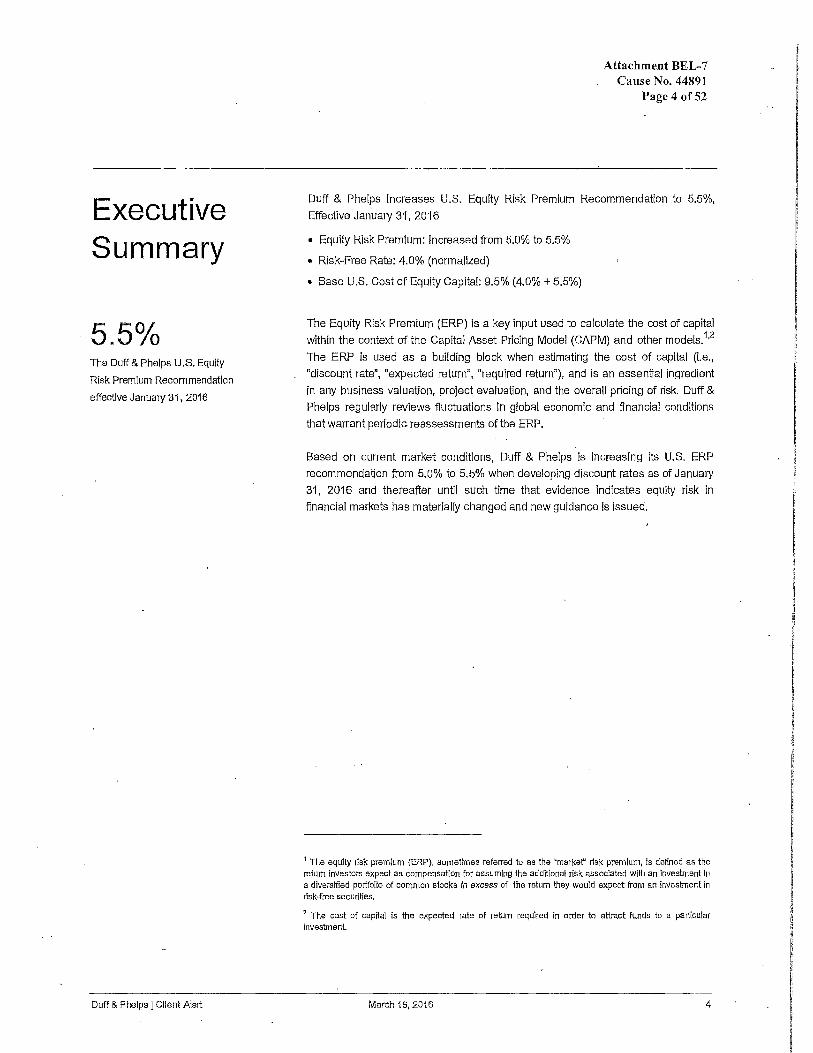
Executive Summary
5.5% The Duff & Phelps U.S. Equity
Risk Premium Recommendation
effective January 31, 2016
Duff & Phelps I Client Alert
Attachment BEL-7 Cause No. 44891
Page 4 of52
Duff & Phelps Increases U.S. Equity Risk Premium Recommendation to 5.5%,
Effective January 31, 2016
• Equity Risk Premium: Increased from 5.0% to 5.5%
• Risk-Free Rate: 4.0% (normalized)
• Base U.S. Cost of Equity Capital: 9.5% (4.0% + 5.5%)
The Equity Risk Premium (ERP) is a key input used to calculate the cost of capital
within the context of the Capital Asset Pricing Model (CAPM) and other models.1•2
The ERP is used as a building block when estimating the cost of capital (I.e.,
"discount rate", "expected return", "required return"), and is an essential ingredient
in any business valuation, project evaluation, and the overall pricing of risk. Duff &
Phelps regularly reviews fluctuations in global economic and financial conditions
that warrant periodic reassessments of the ERP.
Based on current market conditions, Duff & Phelps is increasing Its U.S. ERP
recommendation from 5.0% to 5.5% when developing discount rates as of January
31, 2016 and thereafter until such time that evidence Indicates equity risk in
financial markets has materially changed and new guidance is issued.
1 The equity rtsk premium (ERP), sometimes referred to as the 'markef' risk premium, Is defined as the return investors expect as compensation for assuming the additional risk assoclated with an investment in a diversified portfolio of common stocks in excess of the return they would expect from an investment in risk-free securities,
2 The cast of capital is the expected rate of return required in order to attract funds to a particular investmenl
March 16, 2016 4
.I
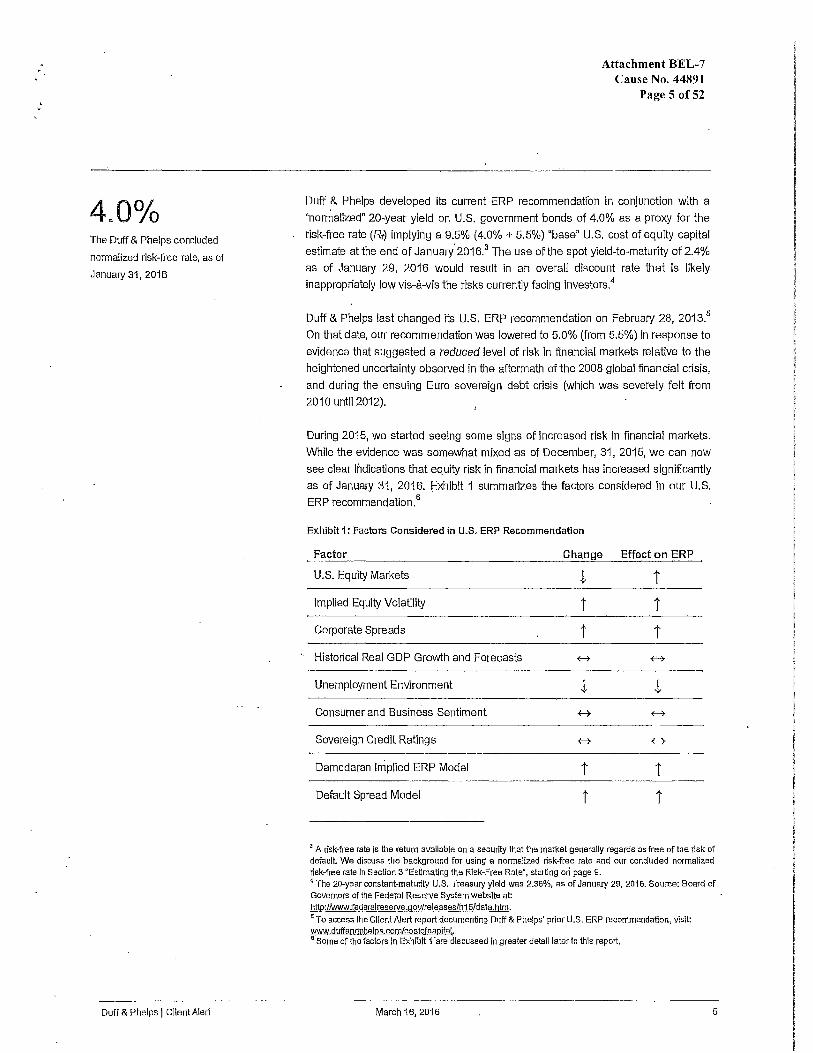
4.0o/o The Duff & Phelps concluded
nonnalized risk-free rate, as of
January 31, 2016
Duff & Phelps I Client Alert
Attachment BEL-7 Cause No. 44891
Page 5 of52
Duff & Phelps developed its current ERP recommendation in conjunction with a
"normalized" 20-year yield on U.S. government bonds of 4.0% as a proxy for the
risk-free rate (Rt) implying a 9.5% (4.0% + 5.5%) "base" U.S. cost of equity capital
estimate at the end of January· 2016.3 The use of the spot yield-to-maturity of 2.4%
as of January 29, 2016 would result in an overall discount rate that is llkely
inappropriately low vis-a-vis the risks currently facing investors.4
Duff & Phelps last changed its U.S. ERP recommendation on February 28, 2013.5
On that date, our recommendation was lowered to 5.0% (from 5.5%) in response to
evidence that suggested a reduced level of risk in financial markets relative to the
heightened uncertainty observed in the aftermath of the 2008 global financial crisis,
and during the ensuing Euro sovereign debt crisis (which was severely felt from
201ountil2012).
During 2015, we started seeing some signs of Increased risk in financial markets.
While the evidence was somewhat mixed as of December, 31, 2015, we can now
see clear indications that equity risk in financial markets has increased significantly
as of January 31, 2016. Exhibit 1 summarizes the factors considered in our U.S.
ERP recommendation. 6
Exhibit 1: Factors Considered in U.S. ERP Recommendation
Factor Change Effect on ERP
U.S. Equity Markets t t Implied Equity Vol<?tility t t Corporate Spreads t t Historical Real GDP Growth and Forecasts f-7 ~
Unemployment Environment t j,
Consumer and Business Sentiment H +4
Sovereign Credit Ratings f-7 ~
Damodaran Implied ERP Model 1 1 Default Spread Model t t
' A risk-free rate is the return available on a security that the market generally regards as free of the risk of default We discuss the background for using a normalized risk-free rate and our concluded normalized riskcfree rate In Section 3 "Estimating the Risk-Free Rate•, starting ori page 9. 4 The 20-year constant-maturity U.S. Treasury yield was 2.36%, as of January 29, 2016. Source: Board of Governors of the Federal Reserve System website at http://www.federa[reserve.gov/releases/h15/data.htm. 5 To access the CIIent Alert report documenting Duff & Phelps' prior U.S. ERP recommendation, visit: www.duffandphelps.com/costofcapitaL •Some of the factors in Exhibit 1 ·are discussed in greater de!aiI later in this report.
March 16, 2016 5
Duff & Phelps I Client Alert
Attachment BEL-7 Cause No. 44891
Page 6 of52
Taking these factors together, we find support for increasing our ERP
recommendation relative to our previous recommendation.7
TOBE CLEAR:
• The Duff & Phelps U.S. ERP recommendation as of January 31, 2016
(and thereafter, until further notice) is 5.5%, matched with a normalized
rif!k-free rate of 4.0%. This implies a 9.5% (4.0% + 5.5%) "base" U.S. cost
of equity capital estimate as of January 31, 2016.
• Many valuations are done at year-end. The Duff & Phelps U.S. ERP
recommendation for use with December 31', 2015 valuations is 5.0%,
matched with a normalized risk-free rate of 4.0%. This implies a 9.0%
(4.0% + 5.0%) "base" U.S. cost of equity capital estimate as of December
31, 2015.
7 The Duff & Phelps ERP estimate is made in relatfon to a risk-free rate (eHher "spot• or 'normalized"). A "normallzed"0 risk-free rate cii.n be developed using longer-term avef!!ges of Treasmy bond yields and the build-up framework oumned In Section 3 "Estlmatfng the Risk-Free Rate•, starting on page 9.
March 16, 2016 6
Section 02
Duff & Phelps I Cl!ent Alert
Attachment BEL-7 Cause No. 44891
Page 7 of52
Overview· of Duff & Phelps
ERP Methodology
March 16, 2016 7
Overview of Duff & Phelps ERP Methodology
Duff & Phelps I Client Alert
A Two-Dimensional Process
Attachment BEL-7 Cause No. 44891
Page 8 of52
There is no single universally accepted methodology for estimating the ERP;
consequently there Is wide diversity Jn practice among academics and financial
advisors with regards to ERP estimates. For this reason, Duff & Phelps employs a
two-dimenslonal process that takes into account a broad range of economic
Information and multiple ERP estimation methodologies to arrive at its
recommendation.
First, a reasonable range of normal or unconditional ERP Is established. Second,
based on current economic conditions, we estimate where in the range the true
ERP likely lies (top, bottom, or middle). ·
Long-term research Indicates that the ERP ls cycllcal.6 We use the term normal, or
unconditional ERP to mean the long-term average ERP without regard to current
market conditions. This concept differs from the conditional ERP, which reflects
current economic condltions.9 The "unconditional" ERP range versus a "conditional"
ERP is further distinguished as follows:
"What is the range?"
• Unconditional ERP Range - The objective is to establish a reasonable
range for a normal or uncondltlonal ERP that can be expected over an
entire business cycle. Based on an analysis of academic and financial
literature and various empirical studies, we have concluded that a
reasonable long-term estimate of the normal or unconditional ERP for the
U.S. Is in the range of 3.5% to 6.0%.10
"Where are we in the range?"
a Conditional ERP - The objective Is to determine where within the
unconditional ERP range the conditional ERP should be, based,on current
economic conditions. Research has shown that ERP fluctuates during the
business cycle. When the economy is near (or in) a recession, the
. conditional ERP is at the higher end of the normal, or unconditional ERP
range. As the economy improves, the conditional ERP moves back toward
the middle of the range and at the peak of an economic expansion, the
conditional ERP approaches the lower end of the range .
• 6 See for example Jolin Cochrane's "Discount Rates. American Anance Assoclatlon Presidential Address• on January a, 2011, where he presented research findings on !he cycllcallty of discount rates In general. His remarks were published as Cochrane, J. H. (2011), Presidential Address: Discount Rates. The Journal ofFinance, 66: 1047-1108. ·
9 The "condttlonal" ERP Is the ERP estimate published by Duff & Phelps as the 'Duff & Phelps Recommended ERP".
10 See Shannon P. Pratt and Roger J. Grabowski, Cost of Capital: Appl/cations and Examples, Fifth Edition, Chapter 6 'Equity Risk Premium", and accompanying Appendices BA 1md BB, for a detailed discussion oflhe ERP.
March 16, 2016 a
I I
Section 03
Duff & Phelps I· Client Alert
Attachment BEL-7 Cause No. 44891
Page 9 of52
Estimating the Risk-Free
Rate
Maroh 16, 2016 9
Estimating the Risk7Free Rate
Duff & Phelps 1 Client Alert
Attachment BEL-7 Cause No. 44891
Page 10 of52
The Risk-free Rate and Equity Risk Premium: Interrelated Concepts11
A rlsk-free rate is the return available, as of the valuation date, on 'a security that
the market generally regards as free of the risk of default.
For valuations denominated in U.S. dollars, valuation analysts have typically used
the spot yield to maturity (as of the valuation date) on U.S. government securities
as a proxy for the risk-free rate. The two most commonly used risk-free bond
maturities have been the 10- and 20-year U.S. government bond yields.
The use of (i) long-term U.S. government bonds, and (ii) an ERP estimated relative
to yields on long-term bonds most closely match the investment horizon and risks
that confront business managers who are making capital allocation decisions and
valuation analysts who are applying valuation methods to value a "going concern"
business.
The risk-free rate and the ERP are interrelated concepts. All ERP e8timates are, by
definition, developed in relation to the risk-free rate. Specifically, the ERP is the
extra return investors expect as compensation for assuming the additional risk
associated with an investment In a diversified portfolio of common stocks,
compared to the return they would expect from an investment in risk-free securities.
This brings us to an important concept. When developing cost of capital estimates,.
the valuation analyst should match the term of the risk-free rate used in the CAPM
or build-up formulas with the duration of the expected net cash flows of the
business, asset, or project being evaluated. Further, the term of the risk-free rate
should also match the term of the risk-free rate used to develop the ERP, as
illustrated in Exhibit 2.
Exhibit 2: The Risk-Free Rate and ERP Should be Consistent with the Duration of the
Net Cash Flows of the Business, Asset, or Project Being Evaluated
Tenn of risk-free rate use.ct in ::: CAPM or Build-up equation
Expected duration of the net cash flows ofthe business,
asset, or project being evaluated
::: Term of risk-free rate used to develop the ERP
11 This section was extracted from Chapter 3 of the Duff & Phelps 2016 Valuation Handbook - Guide to Cost of Capital (Hoboken, NJ: John Wiley & Sons, 2016). The discussion in this section was based on Information available at the time of writing (through February 23, 2016). Events and market conditions may have changed since then relative to when this report ls issued.
March 16, 2016 10
. "
Duff & Phelps I Client Alert
Attachment BEL-7 Cause No. 44891
Page 11 of52
In many of the cases In which one is valuing a business, a "going concern"
assumption is made (the life of the business is assumed to be indefinite), and
therefore selecting longer-term U.S. government bond yields (e.g., 20 years) as the
proxy for the risk-free rate is appropriate.
The risk-free rate and the ERP, like all components of the cost of equity capital
(and the cost of equity capital itself), are forward-looking concepts. The reason that
the cost of capital is a forward-looking concept is straightforward: when we value a
company (for instance), we are trying to value how much we would pay (now) for
the future economic benefits associated with owning the company. Since we will
ultimately use the cost of capital to discount these future economic benefits (usually
measured as expected cash flows) back to their present value, the cost of capital
Itself must a/so be forward-looking.
Spot Risk-Free Rates versus Normalized Risk-Free Rates
Beginning with the financial crisis of 2008 (the "Financial Crisis"), analysts have
had to reexamine whether the "spot'' rate is still a reliable building block upon which
to base their cost of equity capital estimates. The Financial Crisis challenged long
accepted practices and highlighted potential problems of simply continuing to use
the spot yield-to-maturity on a safe government security as the rtsk-free rate,
without any further adjustments.
During periods in which risk-free rates appear to be abnormally low due to flight to
quality or massive central bank monetary interventions, valuation analysts may
want to consider normalizing the risk-free rate. By "normalization" we mean
estimating a risk-free ,rate that more likely reflects the sustainable average return of
long-term U.S. Treasuries.
Why Normalize the Risk-Free Rate?
The yields of U.S. government bonds in certain periods during and after the
Financial Crisis may have been artificially repressed, and therefore likely
unsustainable. Many market participants will agree that nominal U.S. government
bond yields in recent periods have been artificially low. The Federal Reserve Bank
("Fed"), the central bank of the United States, kept a zero interest rate policy
(dubbed "ZIRP" in the financial press) for seven years, from December 2008 until
December 2.015.
Even members of the Federal Open Market Committee (FOMC) have openly
discussed the need to "normalize" interest rates over the last-couple of ye~rs.12 For
example, at an April 2015 conference, James Bullard, President of the Federal
12 The FOMC Is a committee wlthln the Federal Reseive System, charged under U.S. law with overseeing the nal!on's open market operations {I.e., the Fed's buying and selling of U ,S. Treasury sacurltles).
March 16, 2016 11
Duff & Phelps I Client Alert
Attachment BEL-7 Cause No. 44891
Page 12 of52
Reserve Bank of St. Louis, discussed "Some Considerations for U.S. Monetary
Normalization", where he stated:13
Wow may be a good time to begin normalizing· U.S. monetary policy so that it is set appropriately for an Improving economy over the next two years."
John C. Williams, President of the Federal Reserve Bank of San Francisco (not
currently an FOMC member); has also been very vocal about the need to start
normalizing Interest rates. During 2015, he gave several presentations and
speeches, where he mentioned the need to normalize interest rates. For example,
in a series of presentations· delivered in September and October 2015, he said: 14
"( ... ) an earlier starl to raising rates would allow us to engineer a smoother; more grad11at process of policy normalization."
In a more recent speech, he acknowledged, however, that even after normalization
takes place, tnterest rates may simply be lower than In pre-Financial Crisis years.
Discussing the Fed's short-term benchmark interest rate (the target federal funds
rate), he elaborated on that topic: 15•16
"As we make our way back to normal, we should consider what "normal" Wiii took like for interest rates.(. .. ) The evidence is building that the new no[maf for interest rates is quite a bit lower than anyone in this room is accustomed to.(. .. ) That doesn't mean they'll be zero, but compared with the pre-recession ~normal" funds rate of, say, between 4 and 4.5 percent we may now see the uqder/ying r-star guiding us towards a fed funds rate of around 3-3~ percent instead. ,.17
13 •same Considerations for U.S. Monetary Policy Normalization", presentatlon at the 24th Annual Hyman P. Minsky Conference ln Washington, D.C., April 15, 2015. A copy of the presentation can be found here: httos://www.stlouisfed.ornHmedla/F!les/PDFs/Bullard/remarks/Bullard-Mlnskv-15-Aprll-2015.pdf. For a list of speeches and presentations by President James Bullard, visit https://www.stloulsfed.org/from-the-pres!dent/speeches-and-presentatlons. 14 This series of presentations was entltled "The Economic Outiook: Live Long and Prospal". See for example, the presentation at UCLA Anderson School of Management, Los Angeles, California on September 28, 2016.Acopy of the remarks can be found here: http;//www.frbs{.org/our-dlstrlct/press/presidents-speeches/wRliams-speeches/2015/september/economlcou!look-live-lond-and-prosper-ucla/. For a list of speeches and presentations by President John C. Willlams, visit: http://www.fibsf.orolour-distdct/presslpresldents-speeches/wllllams-speeches/. 15 The federal fUnds rate Is the interest rate at which depository Institutions lend balances to each other overnlghl The target federal funds rate ls a short-tenn rate and Is used as the benchmark interest rate to Implement U.S. monetary policies, such as raising or reducing Interest rates. 18 "After the First Rate Hike", Presentation to California Bankers Assoclatlon, Santa Barbara, California on January B, 201 a. A copy of the remarks can be found here: htlp://www.frbs{.org/our-dlstdctlpress/presldents-speeches/willlams-speeches/2016/lanuarv/after-the-firstrate-hlke-econom!a-outlook!. 17 The so-called I"" (r-star) stands for the longer-run value of the neutral rate. President Williams defined r-star as essentially what inflation-adjusted interest rates (I.e. real rates) will be once the economy ls back to full strength.
March 16, 2016 12
Duff & Phelps l Cllent Alert
Attachment BEL-7 Cause No. 44891
Page 13 of 52
While the views of regional Fed Presidents or individual FOMC members do not
reflect the official positions of the committee, the reality is that the minutes of 2014
and 2015 FOMC meetings repeated the term "policy normalization" several times,
in the context of deciding if and when to raise interest rates.18
At its December 15-16, 2015 meeting, the Fed decided to raise the target range for
the federal funds rate for the first time in nine years, from a range of 0.00%-0.25%
to 0.25%-0.50% (a 25 basis point increase). In support of its decision, the Fed
highlighted the considerable improvement in the labor market over the course of
the year, and reiterated its expectation that inflation would rise over the medium
term to its target rate of 2.0%.19
Even then,. officials were very cautious on how to characterize the timing of
nominalization. policies, seemingly signaling that further increase In interest rates
will be gradual.
Nevertheless, in conjunction with the December 15-1_6, 2015 meeting, FOMC
members also submitted their projections of the most likely outcomes for real GDP
growth, unemployment rate, inflation, and the_ federal funds rate for each year from
2015 to 2018 and over the longer run. All of the 17 FOMC participants believed
that the target level for the federal funds rate should increase further during 2016,
with the median projection suggesting it could rise by another 100 basis points. The
median estimate for the longer-term federal funds rate is 3.5% (note: the federal
funds rate is a short-term Interest rate). However, given the recent headwinds in
global financial markets, investors are projecting a much slower pace of rate
hikes.2°
So what does it mean when someone says the current U.S. Treasury yields are not
"normal"? And even if interest rates are not considered "normal", why is that any
different from other periods in history? Remember, the risk-free rate is intended to
adjust the cost of equity capital for expected future inflation. Typically, valuation
analysts use a 20-year U.S. government bond yield when developing a U.S. dollar
denominated cost of equity capital. Therefore, the risk-free rate should reflect an
average expected return over those years.
'"To access minutes of FOMC meetings vlslt http:l/www.federalreserve.gov/monetarvpolicy/fomcclllendars.h!m. 19 Minutes of the Federal Open Market Committee December 1&-16, 2015", Board of Governors of the Federal ReseJVe System. For details visit: http://www.federalreserve.gov/monetarypollcy/fomccalendars.htm. 20 See, for example, the CME Group FedWatch Tool. The FedWatch Timi ls based on CME Group 30-Day Fed Fund futures j:lrlces, which are used to express the markefs views on the likelihood of changes in U.S. monetary poilcy. This tool allows market participants to view the probability of an upcoming federal funds rate hike up to one year out. For details visit http:f/www.cmegroup.com!tradinqlinterest-ratesfcountdoivn-to-fomc.html,
March 1B,2016 13
Duff & Phelps I Client Alert
Attachment BEL-7 Cause No. 44891
Page 14 of52
To be clear, in most circumstances we would prefer using the "spof' yield (i.e., the
yield available in the market) on a safe government security as a proxy for the risk
free rate.21 However, during times of flight to quality and/or high levels of central
bank intervention (such as the period beginning with the Financial Crisis) those
lower observed yields imply a lower cost of cap Ital (all other factors held the same),
just the opposite of what one would expect in times of relative economy-wide
distress and uncertainty. During these periods, using a non-normalized risk-free
rate (with no corresponding adjustments to the ERP) would likely lead to an
underestimated cost of equity capital, and so a "normalization" adjustment may be
a reasonable approach to address the apparent inconsistency.
Why isn't the Current Spot Risk-Free Rate Considered "Normal"? .
Part of the reason that U.S. Treasury yields are likely "artificially repressed" is that
the "Fed" has been te/Jing us that its actions are intended to push rates down, and
thus boost asset prices (e.g., stocks, housing). For example, at the September 13,
2012 FOMC press conference, the Fed Chainnan at the time, Ben Bernanke,
stated:
" ... the tools we have involve affecting financial asset prices ... To the extent that
home prices begin ·to rise, consumers will feel wealthier, they'll feel more
disposed to spend ... So house prices is one vehicle. Stock prices - many
people own stocks directly or indirectfy ... and if people feel that their financial
situation is better because their 401 (k) looks better or for whatever reason,
their house is worth more, they are more willing to go out and spend, and
that's going to provide the demand that firms need in order to be willing to·hire
and to invest."
In Exhibit 3, the balance sheet of the U.S. Federal Reserve is shown over time.
Since the Financial Crisis, the Fed has been purchasing massive quantities of U.S.
Treasuries and mortgage backed securities (MBS) through a series of so-called
quantitative easing (QE) measures. At the end of December 2015, the Fed's
balance sheet summed to $4,491 ,440 million ($4.5 tri/llon), virtually unchanged
from December 2014.22
21 Government bond yields can be found atthe Board of Governors of the Federal Reserve System website at http://www.faderalreserve.gov/releases/h15/date.hlm. "'Source of underlying data: Federal Reserve Bank of Cleveland. To learn more, visit: hl\ps://www.clevelandfed.org.
March 16, 2016 14
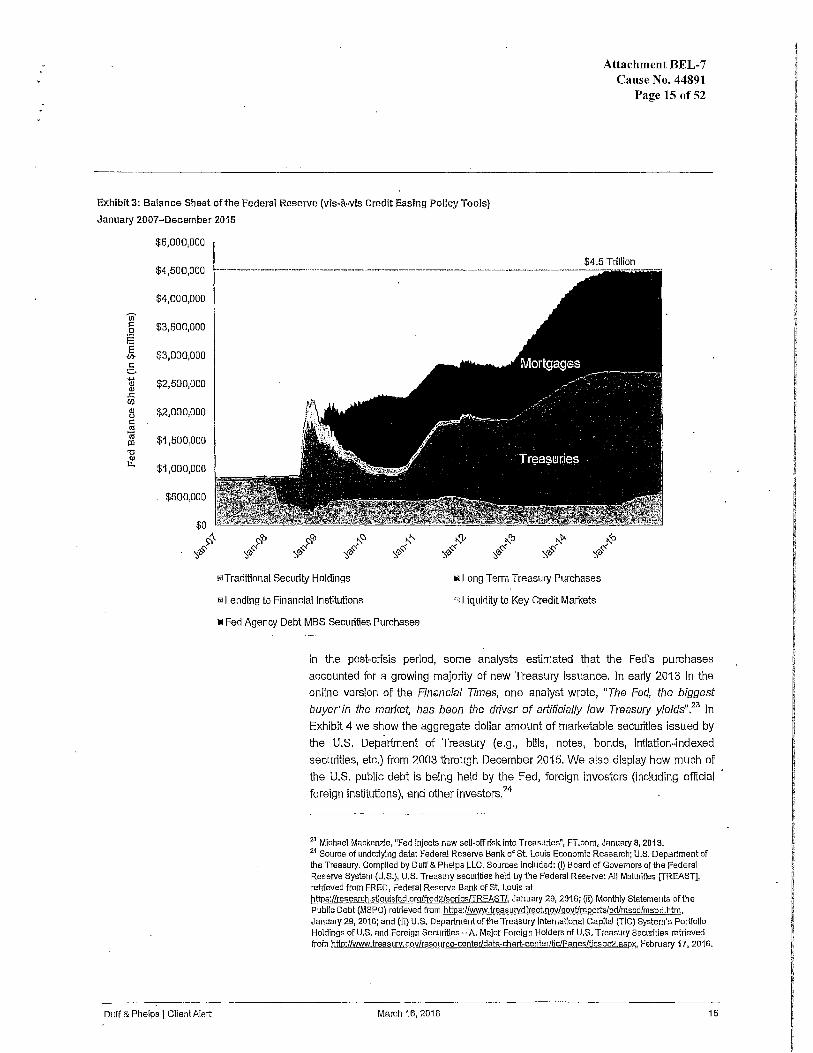
Attachment BEL-7 Cause No. 44891
Page 15 of 52
Exhibit 3: Balance Sheet of the Federal Reserve {vis-a-vis Credit Easing PoUCJy Tools)
January 2007-December 2015
$5,000,000 '---------------------------------------------------------------------------------~·5 Tril~.'.'._~$4,500,000
(j) c: $3,500,000 .2
~ $3,000,000 <;)-
:§. 'iii $2,500,000 <ll
.<:; U) <ll $2,000,000 u i:: «! iii $1,500,000 Ill "O <ll u. $1,000,000
$500,000
$0
~ ':,rt;«
Duff & Phelps I Client Alert
MTraditional Security Holdings a Long Term Treasury Purchases
Ii! Lending to Financial Institutions ·"!Liquidity to Key Credit Markets
•Fed Agency Debt MBS Securities Purchases
In the post-crisis period, some analysts estimated that the Fed's purchases
accounted for a growing majority of new Treasury issuance. In early 2013 in the
online version of the Financial Times, one analyst wrote, "The Fed, the biggest
buyer·in the market, has been the driver of artificially low Treasury yields''.23 Jn Exhibit 4 we show the aggregate dollar amount of marketable securities issued by
the U.S. Department of Treasury (e.g., bills, notes, bonds, inflation-indexed
securities, etc.) from 2003 through December 2015. We also display how much of
the U.S. public debt is being held by the Fed, foreign investors (including official
foreign institutions), and other investors.24
23 Michael Mackenzie, "Fed injects new sell-off risk into Treasuries•, FT.com, January 8, 2.013. 24 Source of underlying data: Federal Reserve Bank of St Louis Economic Research; U.S. Department of the Treasury. Compiled by Duff & Phelps LLC. Sources included: (I) Board of Governors of the Federal Reserve System (U.S.), U.S. Treasury securities held by the Federal Reserve: All Maturities [TREAST], retrieved from FRED, Federal Reserve Bank of St. Louis at https:ffresearch.st!ouisfed.org/fred2./seriesffREAST/, January 29, 2016; (ii) Monthly Statements of the Public Debt (MSPD) retrieved from ht!ps:llwww.treasurvdlrect.gov/govt/reports/pd/mspd/mspd.htm, January 29, 2.016; and (iii) U.S. Department of the Treasury International Capital (flC) System's Portfolio Holdings of U.S. and Foreign Securities -A. Major Foreign Holders of U.S. Treasury Securities retrieved frofn htto:/twww.treasmy.gov/resource-center/data-ch art-center/tic/P ages/ticsec2.aspx, February 17, 2.016.
March 16, 201 e 16
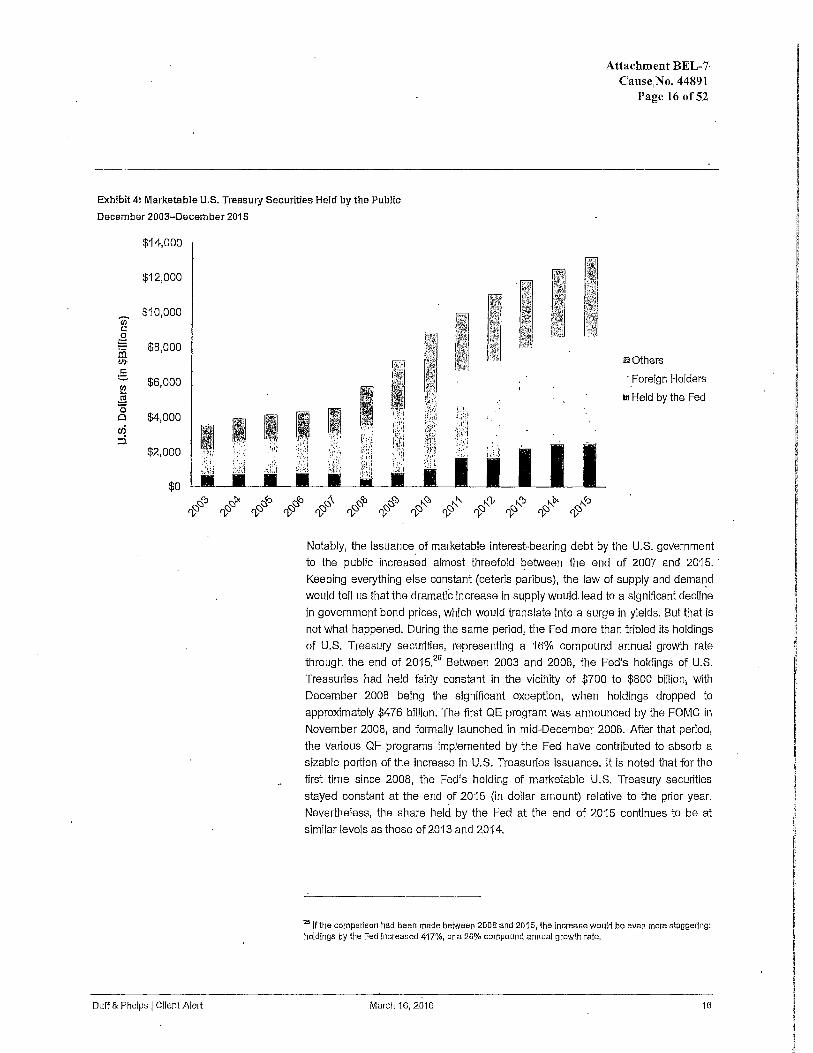
Attachment BEL-7· Cause,No. 44891
Page 16 of52
Exhibit 4: Marketable U.S. Treasury Securities Held by the Public
December 2003-December 2015
$14,000
$12,000
(ii' $10,000
r:::
~ $8,000 iii -117
:§. $6,000
!!? .!!! 0
$4,000 0
c4 ::i
$2,000 I I ~: ·!'.; I ;: .. ;
: ~: t .
~~~iii
$0
Duff & Phelps I Client Alert
&Others
·_Foreign Holders
m Held by the Fed
Notably, the issuance_ of marketable interest-bearing debt by the U.S. government
to the public increased almost threefold between the end of 2007 and 2015. ·
Keeping everything else constant (ceteris paribus), the law of supply and dema~d
would tell us that the dramatic increase in supply would. lead to a significant decline
in government bond prices, which would translate into a surge in yields. But that is
not what happened. During the same period, the Fed more than tripled its holdings
of U.S. Treasury securities, representing a 16% compound annual growth rate
through the end of 2015.20 Between 2003 and 2008, the Fed's holdings of U.S.
Treasuries had held fairly constant in the vicinity of $700 to $800 billion; with
December 2008 being the significant exception, when holdings dropped to
approximately $476 bmion. The first QE program was announced by the FOMG in
November 2008, and formally launched in mid-December 2008. After that period,
the various QE programs implemented by the Fed have contributed to absorb a
sizable portion of the increase in U.S. Treasuries issuance. It is noted that for the
first time since 2008, the Fed's holding of marketable U.S. Treasury securities
stayed constant at the end ?f 2015 (in dollar amount) relative to the prior year.
Nevertheless, the share held by the Fed at the end of 2015 continues to be at
similar levels as those of2013 and 2014.
25 If the comparison had been made between 2008 and 2015, the increase would be even more staggering: holdings by the Fed Increased 417%, ora 26% compound annual growth rate.
March 16, 2016 16
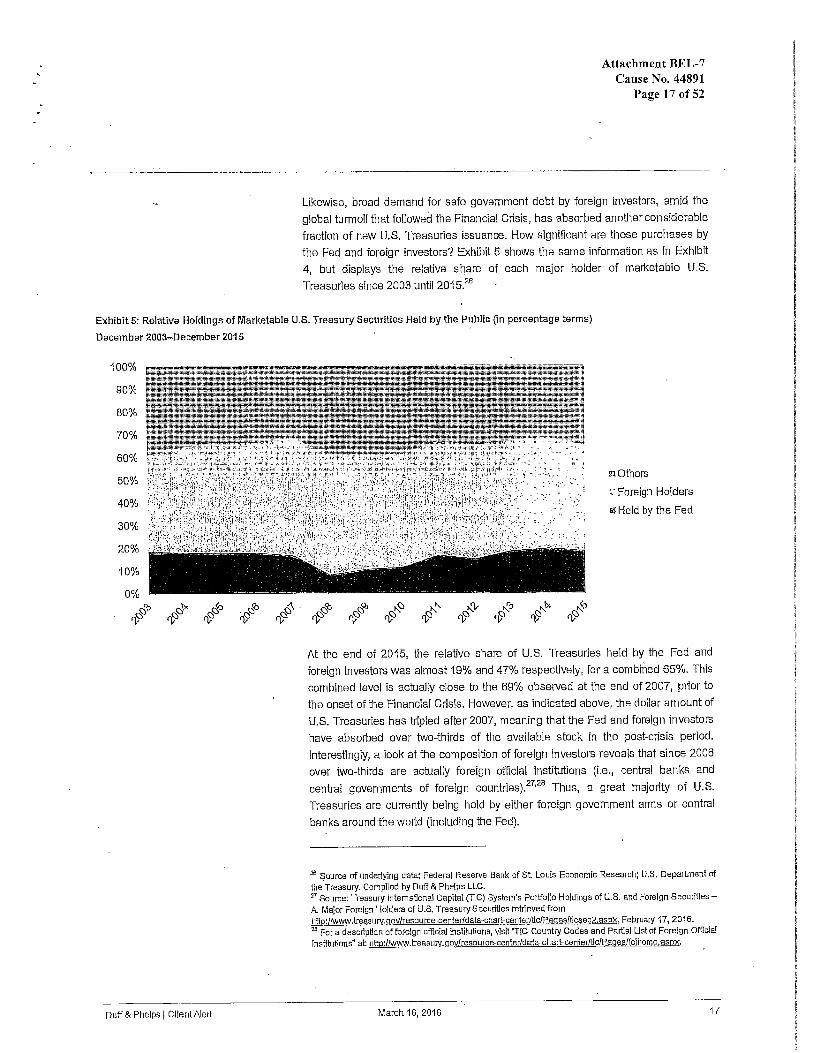
Attachment BEL-7 Cause No. 44891
Page 17 of52
Likewise, broad demand for safe government debt by foreign investors, amid the
global turmoll that followed the Financial Crisis, has absorbed another considerable
fraction of new U.S. Treasuries Issuance. How significant are these purchases by
the Fed and foreign Investors? Exhibit 5 shows the same information as in Exhibit
4, but displays the relative share of each major holder of marketable U.S.
Treasuries since 2003 until 2015.26
Exhibit 5: Relative Holdings of Marketable U.S. Treasury Securities Held by the Public (in percentage tenns)
December 2003-December 2015
100%
90%
80%
70%
60%
50%
40%
30%
20%
10%
0% s::>'b ~
!::)'><
"'<:5 !:)~ ~
Duff & Phelps I ClientAlert
!O • R)<::i 'V
mothers
~·Foreign Holders
ll¥ Held by the Fed
At the end of 2015, the relative share of U.S. Treasuries held by the Fed and
foreign investors was almost 19% and 47% respectively, for a combined 65%. Thls
combined level is actually close to the 69% observed at the end of 2007, prior to
the onset of the Financial Crisis. However, as indicated above, the dollar amount of
U.S. Treasuries has tripled after 2007, meaning that the Fed and foreign investors
have absorbed over two-thirds of the available stock in the post-crisis period.
Interestingly, a look at the composition of foreign investors reveals that since 2006
over two-thirds are actually foreign official institutions (i.e., central banks and
central governments of foreign countries).27'26 Thus, a great majority of U.S.
Treasuries are currently being held by either foreign government arms or central
banks around the world (including the Fed).
16 l'!ource of underlying data; Federal Reserve Bank of St Louis Economic Research; U.S. Department of ihe Treasury. Complied by Duff & Phelps LLC. Zl Source: Treasury International Capital (flC) System's Portfolfo Holdings of U.S. and Foreign Securities -A Major Foreign Holders of U.S. Treasury Securities retrieved from htto:llwww.treasury.govfresource-center1data-chart-centerlfic!Pagesltlcsec2.aspx. February 17, 2016. 211 For a description of foreign official lnstttutlons, visit •r1c Country Cad es and Parlial Llst of Foreign Official lnstltu!lons" at http://www.treasurv.govlresaurce-centerfdata-chart-centerftic/Pageslfojhome.aspx.
March 16, 2016 17
Duff & Phelps I Client Alert
Attachment BEL-7 Cause No. 44891
Page 18 of52
A team of researchers has recently studied the impact that this massive amou~t of
U.S. Treasury purchases by foreign investors and the Fed have had on long-term
real rates. Specifically, using data through November 2012, the authors estimated
that by 2008 foreign purchases of U.S. Treasuries had cumulatively reduced 10-
year real yields by around 80 basis points. The subsequent Fed purchases through
the various QE programs implemented in the 2008-2012 period was estimated to
incrementally depress 10-year real yields by around 140 basis points. Combining
the impact of Fed and foreign investor purchases of U.S. Treasuries, real 10-year
yields were depressed by 2.2% at the end of 2012, according to these authors'
estimates.29
When the Fed concluded its third round of QE measures (in October 2014) and
signaled that an increase in the target federal funds rate might be on the horizon,
the salient question was what would happen to rates as one of the largest
· purchasers in the market (the Fed) discontinued its QE operations. All other things
held the same, rates would be expected to rise. But ·again, that is not what
happened. In fact, the yield on 10-year U.S. Treasury bonds dropped from 2.4% at
the end of October to 2.2% at the end of December 2014. Likewise, the 20-year
yield dropped from 2.8% to 2.5% over the same period. Even.more concerning is
the behavior of interest rates following the Fed's decision on December 16, 2015 to
raise its target range for the federal funds rate for the first time in nine years. At
first, the yield on 10- and 20-year U.S. Treasury bonds increased, reaching 2.3%
and 2.7% respectively at December 31, 2015. In fact, yields had already been
rising since October 2015, .in anticipation of such a rate hike decision. However, by
January 31, 2016, 10- and 20-year yields were back at 1.9% and 2.4%,
respectively.
Why is that?
It may be useful to first distinguish short-term drivers versus long-term trends in
interest rates.
It is almost undisputed that aggressive monetary policies implemented as a
response to the Financial Crisis drove long-term interest rates in the U.S. and
several advanced economies to historically low levels. But many economists claim
that the current low rate environment is not just a cyclical story and that we can
expect to see a lower level of interest rC1tes in the long term (although not as low as
today's). A number of explanatory factors and theories have emerged, some more
pessimistic than others.
29 Kaminska, lryna and Zinna, Gabrie!e,-"Officia! Demand for U.S. Debt !mplicauons for U.S. Real Interest Rates". IMF Working PaperNo.14/66 (April 2014).
March 16, 2016 18
I
I I i
I ~ i !
I I
I I ~
i i ~
I I ! i ! I
I I
Duff & Phelps ] Client Alert
Attachment BEL-7 Cause No. 44891
Page 19 of52
It is not our place to select which; amongst the various theories, is more (or less) correct. Instead, we suggest that valuation specialists read different sources to get acquainted with such theories. A recent survey conducted by the Council of Economic Advisers lists various factors that could help explain why long-term interest rates are currently so low. According to the study, the following is a !lst of possible factors, bifurcated between those that are likely transitory in nature anq those that are likely longer-lived:30• 31
Factors that Are Likely Transitory
• Fiscal, Monetary, and Foreign-Exchange Policies • Inflation Risk and the TelTTI Premium • Private-sector Deleveraging
' Factors that Are Likely Longer-Lived
• Lower Global Long-run Output and Productivity Growth • Shifting Demographics • The Global "Saving Gluf' • Safe Asset Shortage • Tail Risks and Fundamental Uncertainty
The report concludes that it remains an open question whether the underlying factors linked to the· currently low rates are transitory, or do they Imply that the longrun equilibrium for long-term interest rates is lower than before the Financial Crisis.
The bottom line ls that the future path of interest rates is currently uncertain.32 So, for'now, we will focus on some the factors that may be keeping Interest rates ultralow in the near term and discuss whether one can expect an increase from these levels in the medium term.
30 The Council of Economic Advisers, an agency within the Execul!ve Office of the President of the United States, is charged with providing economic advice ta the U.S. President on the formulation of both domestic and international economic policy. 31 'Long-Term ln}erest Rates: A Survey', July 201s: The full report can be accessed here: h!!ps://www.whltehouse.gov/sjtesldefaultlflles/docs/interest rate report final V2.pdf. See also "The Decline in Long-Term Interest Rates", July 14, 2015, a short blog article by Maurice Obstfeld and Linda Tesar discussing the various possible drivers of low long-term Interest rales listed In the report. The article can be accessed here; https:/fwww.whitehouse.govlblog/2015/07/141decline-long-term-lnterest-rates. 321'or anotheranaiys!s of currentlong-term interest rates, see Jonathan Wilma~ 'When bonds aren't bonds · anymore", Crecfrt Suisse Global Investment Returns Yearbook 2016, February 201 s.
March 16, 2016 19
Duff & Phelps I Client Alert
Attachment BEL-7 Cause No. 44891
Page 20 of52
First of all, the size of the Fed's balance sheet is still considered enormous by
historical standards and the Fed has expressed the intent to keep its holdings for a
long time. For example, at its December 2015 meeting, when announcing the
increase by 25 basis points of the target range for the federal funds rate from
0.00%-0.25% to 0.25%-0.50%, the FOMC still stated that:33
"The Committee is maintaining !ts existing policy of reinvesting principal
payments from its holdings of agency debt and agency mortgage-backed
securities in agency mortgage-backed securities and of ro/Ung over matwing
Treasury securities at auction, and ft anticipates doing so until normalization of
the level of the federal funds rate is well under way. This po/fey, by keeping the
Committee's holdings of longer-term securities at sizable levels, should help
maintain accommodative financial condffions."
Translation: the Fed is keeping the size of its balance sheet constant for the
foreseeable future, because it still wants to keep long-term interest rates low.
A report released in November 2014 (following the conclusion of QE3) by Standard
& Poor's (S&P) appears to concur with our interpretation:34
"Since QE works via a stock effec~ as long as a central bank is maintaining a certah:1 stock of QE, it is stiff "doing'' QE. ff a .central bank has reached the
maximum point of expanding its balance sheet, it is a little perverse to describe
it as having "ended QE." Rather; what it will have ended are the asset
purchases required to get it to the point of having done the maximum amount
of QE it has decided to put in place."
So, while the process of rate normalization has formally begun, the Fed is planning
for a very gradual increase In Interest rates. For example, in the minutes of the
same December 2015 meeting, the FOMC also stated that:
"The Committee expects that economic conditions will evolve in a manner that
will warrant only gradual increases in the federal funds rate; the federal funds
rate is likely to remain, for some time, below levels that are expected to prevail
in the longer run.''
·~Press Release of FOMC's Monetary Policy Statement, December 16, 2015. For details visit: htlp://www.federalreseNe.gov/monetarvpolicylfomcca!endars.htm. 34 S&P Ratings Direct report entitled "Economic Research: The Fed Is Continuing, Not 'Ending,' Quantitative Easing•, November 4, 2014.
March 16, 2016 20
Duff & Phelps I Client Alert
Attachment BEL-7 Cause No. 44891
Page 21 of52
Secondly, another phenomenon has helped push U.S. interest rates lower over
time: purchases of U.S. Treasury securities by foreign investors have grown at a
fast pace over the last several years. 35 While 2015 was the first time in many year~ when net purchases increased by only a negligible amount, the reality is that the
total share of U.S. Treasuries owned by foreign investors is still very high (refer
back to Exhibit 4). Should foreign demand for U.S. Treasury securities drop, it
would still take some years for such significant holdings to be unwound (especially
given the level of globalization of the world economy). Notably, there are academic
studies that document a significant impact of foreign investors on U.S. interest
rates even prior to the onset of 2008 Financial Crisis. One such study (not to be
confused with the research cited above) estimated that absent the substantial
foreign inflows into U.S. government bonds, the (nominal) 10-year Treasury yield
would be 80 basis points higher using data through 2005.36 The impact of foreign
financial flows on long-term interest rates is not confined to the U.S. A recent
research paper estimates that the increase in foreign holdings of Eurozone bonds
between early 2000 and mid-2006 is associated with a reduction of Eurozone long
term interest rates by 1.55%.37
Thirdly, an environment of geopolitical and economic uncertainty led to flight to
quality movements during certain periods of 2015, which helped drive Interest rates
even lower for major safe havens countries. Flight to quality has been particularly
acute in early 2016.
Global investors had enough reasons to seek safe haven lnvestments during 2015,
In general, political conflicts continued in 2015 in various regions of the world.
Major examples include (i) the face-off between the Eurozone and Greece's new
radical left-leaning government, which culminated in Greece defaulting on its
sovereign debt with the International Monetary Fund {IMF), being forced to accept
a third bail-out package, and barely escaping an exit from the Eurozone; {ii) the
escalation of the civil war in Syria, leading to a refugee crisis, with an Increasing
.number of refugees seeking asylum in neighborin~ Middle Eastern countries and in
the European Union; and (iii) the strengthening of the lslamic State of Iraq and
Syria (!SIS), which continued to launch terrorist attacks across the globe, with the
greatest shock felt in November when !SIS carried out a series of coordinated
attacks in Paris, France.
35 Source: Treasury International Capital (TIC) System's Portfolio Holdings of U.S. and Foreign Securities -A. Major Foreign Holders of U.S. Treasury Securitles retrieved from http:/twww.treasury.gov/resource-center/data-chart-center/tic/Paqes/ticsec2.aspx, Febrnary 17, 2016. 36 Wamack, Francis E., and Veronica Cacdac Warnock, "International Capita! Flows and U.S. Interest Rates," Journal of Jntemaffonal Money and Finance 28 (2009): 903-919. ~ Carvalho, Daniel and Michael Fldora, "Capital Inflows and euro area long-term interest rates", ECB Working Paper 1798, June 2015. Nata !hat !he 'euro' was introduced to flnancfal markets on Jqnuary 1, 1999 as the new 'single currency' of what Is now known as the Eurowne.
March 16, 2016 21
Duff & Phelps I Client Alert
Attachment BEL-7 Cause No. 44891
Page22 of52
In addition, concerns about a slowing global economy and deflationary pressures
have also led global investors to seek safe haven investments, such as
government bonds issued by the U.S., Germany, and Switzerland, to name a few.
Oil prices continued to tumble from its mid_-2014 highs, reinforcing investor anxiety
over stagnant growth in the Eurozone and Japan, as well as a deceleration in
China and several other emerging-market countries.
Mid-August 2015 caught global markets by surprise, when China announced a
devaluation of the yuan, following dramatic sell-offs of Chinese equities throughout
the month of July. The surprise yuan devaluation was followed by a few days of
disappointing news about China's economy. The apparent slowdown In China's
economy (i) raised fears of a further global economic slowdown, (ii) significantly
depressed commodity prices (China is the world's largest Importer of several raw
materials), and (iii) weighed heavily on world financial markets. The Fed's
announcement In September that it would not raise rates (when the market
participant consensus had been predicting a rate hike), took into consideration the
increased economic uncertainty implied by the tumult observed in global markets.
On the other hand, the sharp decline in oil prices has put additional pressure in an
already very low inflation environment, considered by many as bordering on
deflation territory. For perspective, the prlce of Brent crude oil was at $115/barrel in
mid-June 2014; since then prices declined to $38/barrel at the end of 2015, a
cumulative 67% decline in the space of a year and a half. The collapse of oil prices
has continued in early 2016.38 The potential benefit of lower oil prices to oil
importing nations has not (yet, at least) been felt on economic growth. Worryingly,
should major economic regions such as the Eurozone enter into a deflationary
path, one could use Japan's "lost decades" as a parallel to what might happen in
the future.
Deflation risks and economic stagnation are precisely what led central banks in
Japan and Eurozone to recently boost their respective monetary easing policies. In
October 2014, Japan's central bank surprised the world by announcing a second
easing program self-dubbed as •quantitative and qualitative easing" (QQE).39 In
November, after the announcement of a second consecutive quarter of economic
contraction, Japan's prime minister Shinzo Abe also proclaimed snap parliamentary
elections, explicitly seeking endorsement to continue with the government's
expansionary economic policies (also known as "Abenomics"). While Abe's party
managed to keep its two-t~ird majority in the December 2014 elections, the QQE
measures fulled to spur real economic growth In 2015, with headline inflation far
below the Bank of Japan's (BOJ) 2.0% target.
sa Source: S &P Capital IQ database. 39 For a list of BOJ's monelary policy dec!slon.s, visit http://www.bo!.or.jp/en/mopo/mpmdeci/lndex.htm/,
March 16, 2016 22
Duff & Phelps I Client Alert
Attachment BEL-7 Cause No. 44891
Page 23 of52
In another surprise move, the BOJ announced on January 29, 2016 a landmark
decision to implement a negative interest rate policy (dubbed "NIRP" in the financial
press), in conjunction with its QQE. The BQJ now joins the European Central Bank
(ECB), as well as the Danish, the Swedish, and the Swiss central banks in adopting
this new form of unconventional monetary policies. NIR_P entails financial
institutions paying interest on the liabilities that the central bank issues to them.
The main idea of NlRP is to discourage savings, while creating incentives for
consumers to increase their spending and companies to expand their investment.
However, the consequence of such measures is to also pressure interest rates
further downwards. According to an S&P research report:40
"Negative interest rate policy appears to be able to exert downward pressure
on the whole yield curve via the portfolio rebalance effect as security prices,
. perturbed by the central bank's fixing of one price, adjust to restore
equilibrium."
According to recent Bloomberg calculations, more than $7 trillion of government
bonds globally offered negative yields in early February 2016, making up about
29% of the Bloomberg Global Developed Sovereign Bond lndex.41
In the Eurozone, lackluster growth trends, coupled with deflation fears, induced the
ECB to cut its benchmark rate to a new record low in early June 2014, while also
announcing an unprecedented measure to charge negative interest rates on
deposits held at the central bank.42 Responding to a weak third quarter, the ECB
again cut its benchmark rate to o:o5% in September 2014, and revealed details for
two different securities purchase programs. The continued threat of deflation led
the ECB to an.nounce a larger scale sovereign debt buying program in January
2015, consisting of €60 billion in monthly asset purchases. This program was
launched in March with an original target end-date of September 2016. Real GDP
growth did accelerate in the first quarter of 2015, with consumer price inflation and
job growth also showing signs of improvement. However, growth decelerated once
again in the second and third quarters. The November terrorist attacks in Paris, the
Syrian refugee crisis, and the mounting political uncertainty in Spain and Portugal
were all risk factors affecting the Eurozone at the end of 2015. Inflation was also
virtually stagnant In October and November. As a result, the ECB announced on
December 3, 2015 a further cut of the already-negative deposit facility rate and an
extension of monthly asset purchases to March 2017; markets were nevertheless
disappointed, as a further expansion of the QE program had been anticipated.
40 Standard & Poor's Rattngs Direct report entitled "Negative Interest Rates: Why Central Banks Can Defy 'Time Preference'", February 3, 2016. 41 World's Negative-Yielding Bond Pile Tops $7 Trillion: Chart", Fsbru!'lry 9, 2015. This article can be accessed here: http:/lwww.bloomberq,com/news/articles/2016-02·09/worfd-s-negative-yielding-bond-plletoos-7-trilllon-chart. 42 For a \ist-ofECB's monetary policy decisions, visit: https://www.ecb.europa.eu/press/govcdec/htmlnndex.en.html.
March 16, 2016 23
Duff & Phelps l Client Alert
Attachment BEL-7 Cause No. 44891
Page 24 of52
Markets are now expecting the ECB to expand its QE policies at its March 2016
meeting.43
The current economic conditions in the Eurozone and J·apan are in stark contrast
with the recent performance of the U.S. economy. Over the last two years, the U.S.
economy has been expanding at a healthy pace (albeit below its long-term
potential). That, coupled with solid jobs gains, made the Fed more confident that a
rise in short-term interest rates was in order,' back in December 2015. The
divergence in economic growth and monE?tary policies in the U.S. versus other
major economic regions is actually contributing to some of the decline in U.S.
Treasury yields. Ultimately, U.S. government bonds continue to offer more
attractive yields than bonds issued by other safe-haven countries, and a stronger
dollar enables foreign investors to pick up extra returns on U.S. investments.
Looking forward to 2016, many of the forces behind disappointing U.S. stock
market performance during 2015, such as low commodity prices, sluggish global
growth, and shrinking corporate profits (partly due to a strong ~.S. dollar), may still
be present in the coming year. This could contribute to a downward pressure in
global interest rates, including those in the U.S.
So, are artificially repressed U.S. Treasury yields sustainable? Sustainability
implies that something can go on forever, but Stein's Law tells us that "If something
cannot go on forever, it will stop".44 A possible corollary of Stein's Law is that if the
accommodative monetary policy (including the massive QE programs) by the Fed
since the Financial Crisis "cannot go on forever", then the Fed may really not have
much of a choice in whether to "stop" or not Put simply, things that are destined to
stop will stop by their own accord, one way or another. Whether it will be a
"graceful dismounf' is yet to be seen.
ln the short-term, there are probably still enough significant factors that will keep
interest rates at artificially low levels. However, in the medium-term, borrowing any
major setback in the global e.conomy, investors seem to be expecting U.S. interest
rates to start rising, albeit slowly, after 2016.
43 The discussion fn this section was based on information available at the time of writing (through February 23, 2016). Events and market conditions may have changed since then relative to when this report is Jssueel. 44 Professor Herbert Stein was a member and later chairman of the Council of Economic Advisers under Presidents Nixon and Ford. Source: Michael M. Weinstein, 'Herbert Stein, Nixon Adviser And Economist, Is Dead at83", New York Times, September 09, 1999.
March 16, 2016 24
I I i i I I I I r
I I I ! I
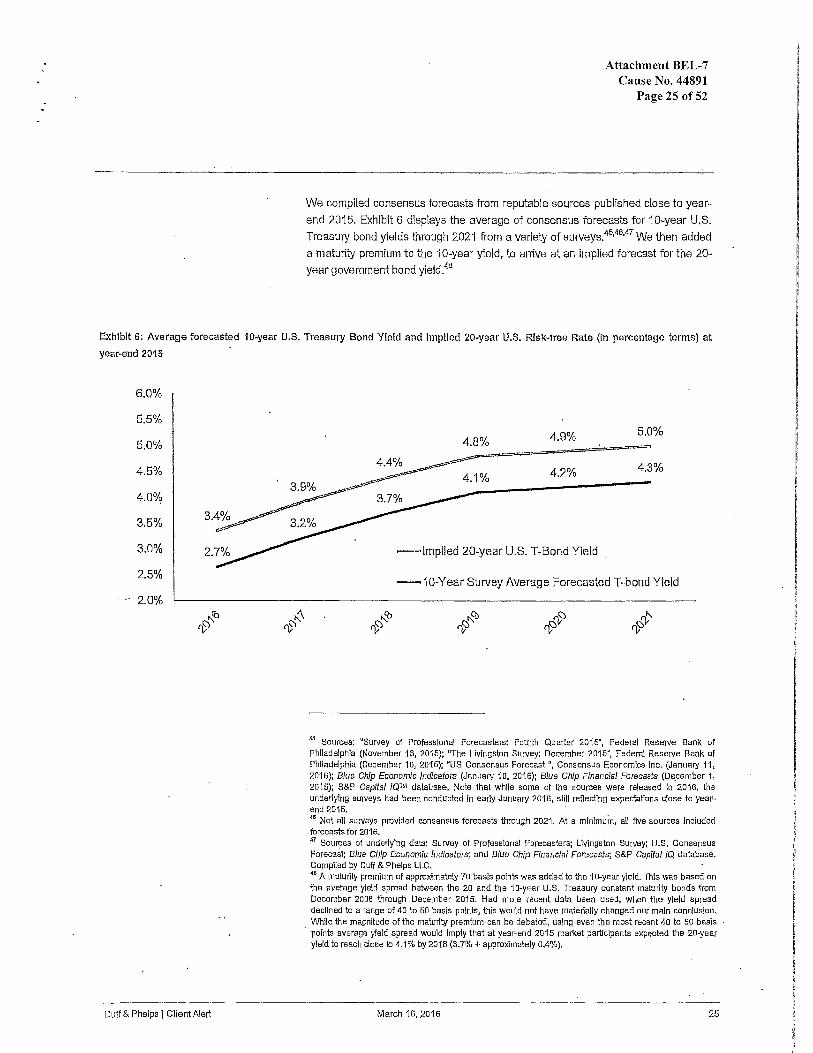
Attachment BEL-7 Cause No. 44891
Page25 of52
We compiled consensus forecasts from reputable sources published close to year
end 2015. Exhibit 6 displays the average of consensus forecasts for 10-year U.S. Treasury bond yields through 2021 from a variety of surveys.46•46.47 We then added a maturity premium to the 10-year yield, to arrive at an implied forecast for the 20-year government bond yield.48
Exhibit 6: Average forecasted 10-year U.S. Treasury Bond Yield and Implied 20-year U.S. Risk-free Rate (in percentage terms) at
year-end 2015
6.0%
5.5%
5.0%
4.5%
4.0%
3.5%
3.0%
2.5%
... 2.0%
Duff & Phelps I Cllent Alert
4.8% 4.9% 5.0%
4.2% 4.3%
=Implied 20..year U.S. T-Bond Yield .
-10-Year Survey Average Forecasted T-bond Yield
45 Sources: "Survey of Professional Forecasters: Fourth Quarter 2015•, Federal Reserve Bank of Phfladelphia (November 13, 2015); "The Livingston Survey: December 2015', Federal Reserve Bank of Philadelphia (December 10, 2015); 'US Consensus Forecast ", Consensus Economics Ina. (January 11, 2016); Blue Chip Economic Indicators (January 1 o, 2016}; Blue Chip Rnanclal Forecasts (D£;cember 1, 2015); S&P Capital /QlM database. Note ihat while soma of the sources were released In 2016, ihe underjylng surveys had been conducted in early January 2016, still reflectfng expec:!ations close to yearend 2015. 46 Not all surveys provided consensus forecasts through 2021. At a mlnlmuin, all 1lve sources Included forecasts for 2016. 47 Sources of underlying dala: Survey of Professional Forecasters; Livingston Survey; U.S. Consensus Forecast; Blue Chip Economic Indicators; and Blue Chip Rnanc/af Forecasts; S&P Capital IQ database. Compiled by Duff & Phelps LLC. •• A malutity premium of approximately 70 basis points was added to the 10-year yield. This was based on the average yield spread between the 20 and the 10-year U.S. Treasury constant maturity bonds from December 2008 through December 2015. Had more recent dala been used, when the yield spread declined io a range of 40 to 50 basis points, this would not have materially changed our main conclusion. While the magnitude of the maturity premium can be debated, using even the most recant 40 to 50 basis •
· · points average yield spread would Imply that at year-end 2015 market participants expected the 20-year yield to reach close to 4.1% by 2018 (3.7% +approximately 0.4%).
March 16, 2016 25
Duff & Phelps I Client Alert
Attachment BEL-7 Cause No. 44891
Page26 of52
The Congressional Budget Office (CBO), a non-partisan agency supporting the
U.S. Congressional budgeting process, ls more optimistic on how fast rates will
rise. ln its report "The Budget and Economic Outlook: 2016 to 2026", the CBO
estimates the 10-year yield to average 3.5% in 2017, which would imply a 20-year
yield around 4.2% using a maturity premium of 70 basis points. Its long-term
forecast for the 10-year yield is 4.1% starting in 2019, again implying a long-term 20-year yield around 4.8%.49
Methods of Risk-free Rate Normalization
Normalization of risk-free rates can be accomplished in a number of ways,
including (i) simple averaging, or (iO various "build-up" ~ethods.
The first normalization method entails calculating averages of yields to maturity on
1ong-term government securities over various periods. This method's implied
assumption is that government bond yields revert to the mean. ln Exhibit 7, the
solid blue line is the spot yield on a 20-year U.S. government bond (December
2007-January 2016), whereas the dashed black line shows a 3.7% average
monthly yield of the 20-year U.S. government bond over the previous 10 years
ending on January 2016 (at the end of December 2015, the long-term average
would still be 3.7%).50 Government bond spot yields at the end of December 2015,
and even more so at the end of January 2016, were lower than the monthly
average over the last 10 years. Taking the average over the last 10 years ls a simple way of "normalizing• the risk-free rate. An issue with using historical
averages, though, !s selecting an appropriate comparison period that can be used
as a reas?nabfe proxy for the future.
411 'The Budget and Economic Outlook: 2016 to 2026", released January 25, 2016, Again, using a maturity premium of 40 basis polnls would Imply a 20-year yield of ~.9% in 2017 and a long-term 20-year yield of 4,5% starting Jn 2019, Far more detaJ[s on this report, visit https://www.cbo.gov/sfles/defauft/files/114thconqress-2015-2016/reports/51129-20160u!!ook OneCol-2.pdf.
· •• Source of undetlylng data: 20-year U.S. government bond series. Board of Governors of the Federal serve System website at: http://www.Federalreserve.gov/releases!h15/data.htm.
Maroh 16, 2016 26
Exhibit 7: Spot and Average Yields on 20.year U.S. Government
December 2007-January 2016
5.0%
4.0%
3.0%
2.0%
1.0%
Financial Grists : ....... ·:
:.::· . i
...
--U.S. 20-year Treasury Yield (spot .rate)
---·Trailing 10-year (February 2006-January 2016) Average Monthly U.S. 20-year Treasury 'Yield
Atta.chment BEL-7 Cause No. 44891
Page27 of52
Avg. Monthly Yield (last 10years)
------------------------ 3.7%
December31, 2015 2.7%
January 29, 2016 2.4%
0~0% L...---~··~·~'·~·~·~ .. ·~·'-'-'-'----------------------------------
1' <;)0
Duff & Phelps I Client Alert March 16, 201 B 27
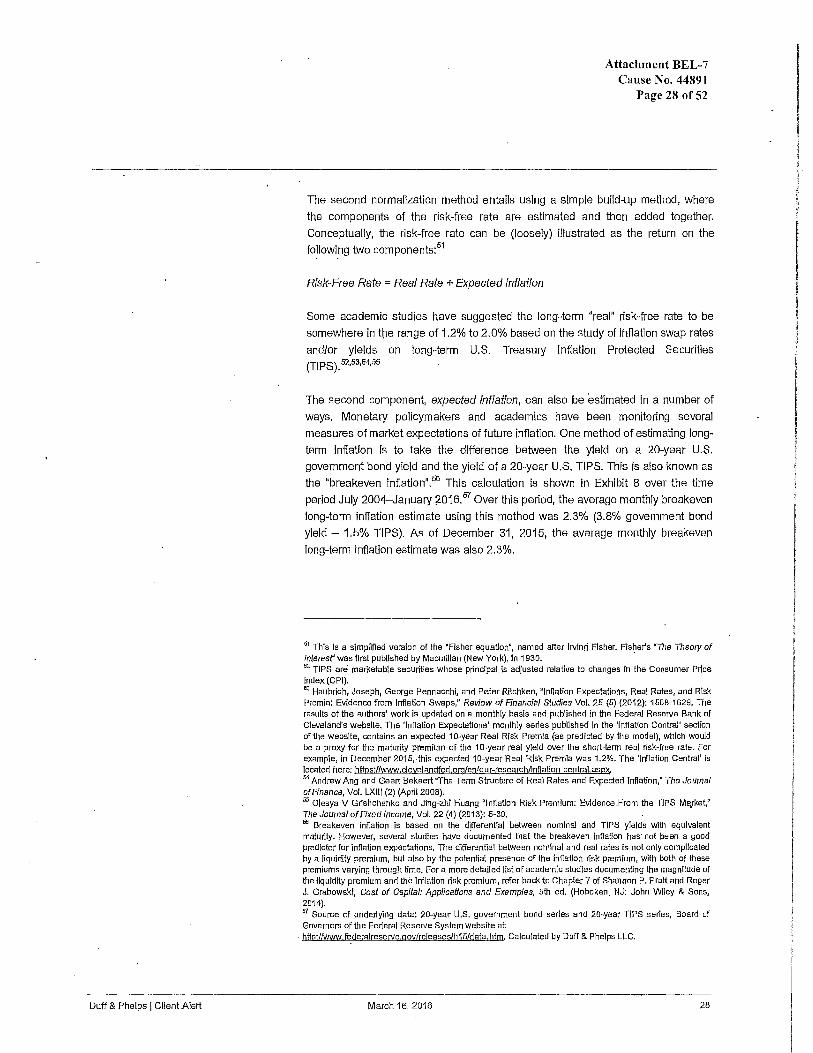
Duff & Phelps I Client Alert
Attachment BEL-7 Cause No. 44891
Page 28 of52
The second normalization method entails using a simple build-up method, where
the components of the risk-free rate are estimated and then added together.
Conceptually, the risk-free rate can be (loosely) illustrated as the return on the
followi.ng two components:51
Risk-Free Rate = Real Rate + Expected Inflation
Some academic studies have suggested the long-term "real" risk-free rate to be
somewhere in t~e range of 1.2% to 2.0% based on the study of inflation swap rates
and/or yields on long-term U.S. Treasury Inflation Protected Securities (TIPS). 52,53,54,55
The second component, expected inflation, can also be estimated in a number of
ways. Monetary policymakers and academics have been monitoring several
measures of market expectations of future inflation. One method of estimating long
term inflation is to take the difference between the yield on a 20-year U.S.
government bond yield and the yield of a 20-year U.S. TIPS. This is also known as
the "breakeven inflation".56 This calculation is shown in Exhibit 8 over the time
period July 2004---January ;2016. ot Over this period, the average monthly breakeven
long-term inflation estimate using this method was 2.3% (3.8% government bond
yield - 1.5% TIPS). As of December 31, 2015, the average monthly breakeven
long-term inflation estimate was also 2.3%.
51 This is a simplified version of the "Fisher equation•, named after Irving Fisher. Fisher's "The Theory of lnteresf' was first published by Macmillan (New York), in 1930. · "" TIPS are marketable securities whose princlpal ts adjusted relative to changes in the Consumer Price lndex(CPl). " Haubrich, Joseph, George Pennacchi, and Peter Ritchken, "lnftation Expectations, Real Rates, and Risk Premia: Evidence from lnftation Swaps," Review of Rnancial Studies Vol. 25 (5) {2012): 1588-1629. The results of the authors' work is updated on a monthly basis and published in the Federal Reserve Bank of Cleveland's website. The 'Inflation Expectations' monthly series published in the 'Inflation Central' section of the website, contains an expected 10-year Real Risk Premia (as predicted by the model), which would be a proxy for the maturity premium of the 10-year real yield over the short.Jenn real risk-free rate. For example, in December 2015,.this expected 10-year Real Risk Premla was 1.2%. The 'Inflation Central' ls located here: https:/lwww.clevelandfed.om/enfour-research/lnflation-central.aspx. 54 Andrew Ang and Geert Bekf\ert "The Term Structure of Real Rates and Expected Inflation,' The Journal of Finance, Vol. LXlll (2) (April 2008). 55 Oiesya V Grishchenko and Jing-zhi Huang "Inflation Risk Premium: Evidence.From the TIPS Meyket,' The Journal of Fixed Income, Vol. 22 (4) (2013): 5-30, "" Breakeven inflation is based on the differential between nominal and TIPS yields with equivalent maturity. However, several studies have documented that the breakeven inflation has· not been a good predictor for inflation expectations. The differential between nominal and real rates is not only complicated by a liquidity premium, but also by the potential presence of the inflation risk premium, with both of these premiums varying through time. For a more detailed list of academic studies documenting the magnitude of the liquidity premium and the Jnflallon risk premium, refer back to Chapter 7 of Shannon P. Pratt and Roger J. Grabowski, Casi of Capital: Applications and Examples, 5th ed. (Hoboken, NJ: John Wiley & Sons, 2014). SI Source of underlying data: 20-year U.S. government bond series and 20-year TIPS series, Board of Governors of the Federal Reserve System website at
. http:/rwww.fe;deralreserve.gov/releaseslh15/data.htm. Calculated by Duff & Phelps LLC.
March 16, 2016 28
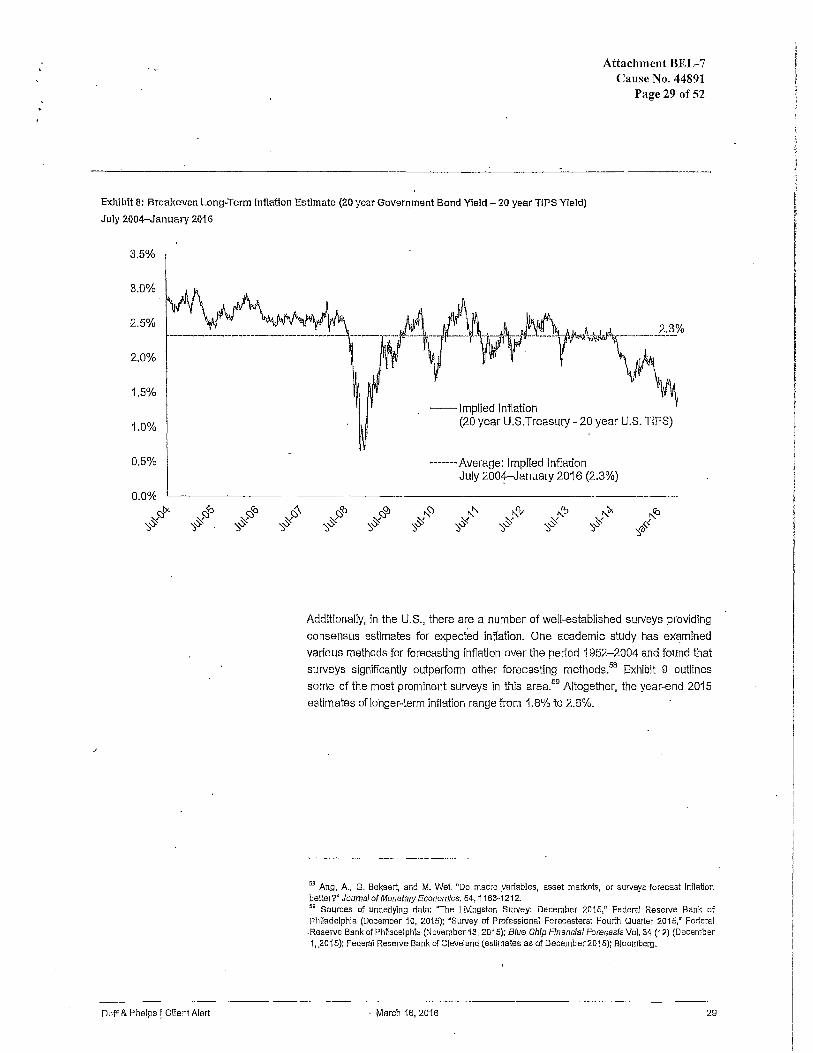
Attachment BEL-7 Cause No. 44891
Page29 of52
Exhibit a: Breakeven Long-Term Inflation Estimate (20 year Government Bond Yield - 20 year TIPS Yield)
July 2004-January 2016
3.5%
3.0%
2.5%
2.0%
1.5%
1.0%
0.5%
0.0% b< ':::(~ r<i Cl.
:::<c::i :::<<::s ~c::i '::,~ ':,'V- . ':,..;s. ':,~
Duff & Phalps I CllentA!art
--Implied Inflation (20 year U.S.Treasury- 20 year U.S. TIPS)
-------Average; Implied Inflation July 200+.-January 2016 (2.3%)
!l:l g, "c::i " ~"rv ~ ~ ~ ~c::s :::<'5 ~l' ~" ':,~ ~~ ~~ ~~ ':,~ ':,~ ':,~ "',)~«
Additionally, in the U.S., there are a number of well-established surveys providing consensus estimates for expected inflation. One academic study has ex~mined various methods for forecasting inflation over the period 1952-2004 and found that surveys significantly outperform other forecasting methods.58 Exhibit 9 outlines some of the most prominent surveys In this area.69 Altogether, the year-end 2015 estimates oflohger-term inflation range from 1.8% to 2.6%.
68 Ang, A., G. Bakaert, and M. Wei. "Do macro .vartables, asset markets, or surveys forecast Inflation better?" Journal of Monetary Economics. 54, 1163-1212. 59 Sources of undertylng data: "The Livingston Survey: December 2015," Federal Reserve Bank of Philadelphia (December 10, 2015); "Survey of Professional Forecasters: Fourth Quarter 2015," Federal
.Reserve Bank of Philadelphia (November 13, 2015); Blue Chip Financial Forecasts Vol. 34 (12) (December 1, ,2015); Federal Reserve Bank of Cleveland (estimates as of December 2015); Bloomberg.
· March 16, 2016 29
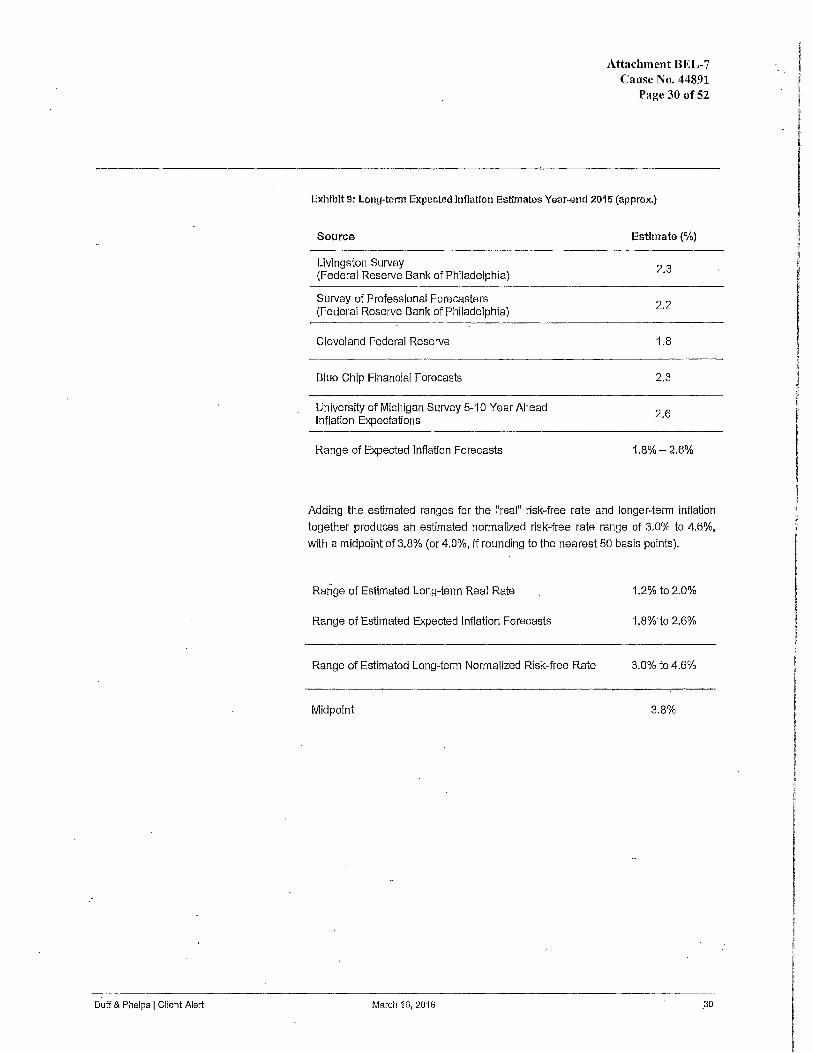
Duff & Phelps I Client Alert
Attachment BEL-7 Cause No. 44891
Page 30 of52
Exhibit 9: Long-term Expected Inflation Estimates Year-end 2015 (approx.)
Source
Livingston Survey (Federal Reserve Bank of Philadelphia)
Survey of Professional Forecasters (Federal Reserve Bank of Philadelphia)
Cleveland Federal Reserve
Blue Chip Financial Forecasts
University of Michigan Survey 5-10 Year Ahead Inflation Expectations
Range of Expected Inflation Forecasts
Estimate (%)
2.3
2.2
1.8
2.3
2.6
1.8%-2.6%
Adding the estimated ranges for the '.'real" risk-free rate and longer-term inflation
together produces an estimated normalized risk-free rate range of 3.0% to 4.6%, with a midpoint of 3.8% (or 4.0%, if rounding to the nearest 50 basis points).
Range of Estimated Long-term Real Rate 1.2% to2.0%
Range of Estimated Expected Inflation Forecasts 1.8%'to 2.6%
Range of Estimated Long-term Normalized Risk-free Rate 3.0% to4.6%
Midpoint 3.8%
March 16, 2016 _30
I I i I I !
I I
i
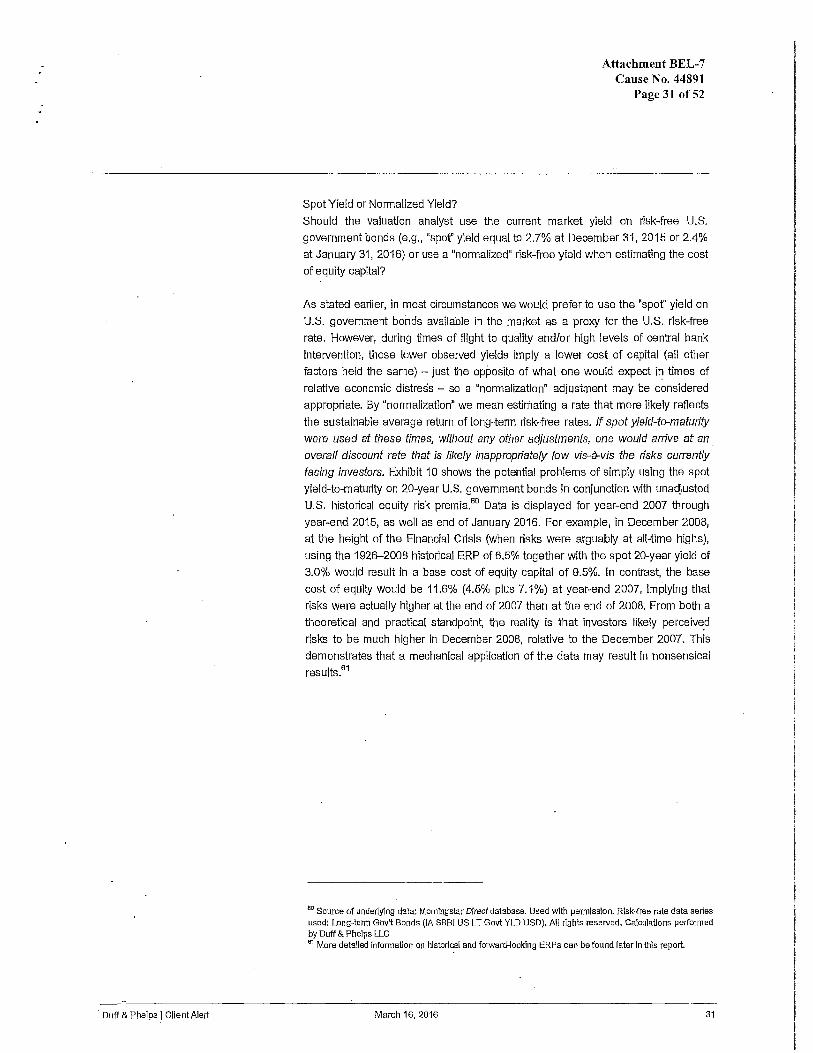
· Duff & Phelps .1 Client Alert
Spot Yield or Normalized Yield?
Attachment BEL-7 Cause No. 44891
Page 31of52
Should the valuation analyst use the current market yield on risk-free U.S.
government bonds (e.g., "spot" yield equal to 2.7% at December 31, 2015 or 2.4%
at January 31, 2016) or use a "normalized" risk-free yield when estimating the cost
of equity capital?
As stated earlier, in most circumstances we would prefer to use the "spot" yield on
U.S. government bonds available in the market as a proxy for the U.S. risk-free
rate. However, during times of flight to quality and/or high levels of central bank
intervention, those lower observed yields imply a lower cost of capital (all other
factors held the same) - just the opposite of what one would expect in times of
relative economic distress - so a "normalization" adjustment may be considered
appropriate. By "normalization" we mean estimating a rate that more likely reflects
the sustainable average return of long-term risk-free rates. If spot yje/d-to-maturity
were used at these times, without any other adjustments, one would arrive at an
overall discount rate that is likely inappropriately low vis-a-vis the risks currently
facing investors. Exhibit 10 shows the potential problems of simply using the spot
yield-to-maturity on 20-year U.S. government bonds in conjunction with unadjusted
U.S. historical equity risk premia.60 Data is displayed for year-end 2007 through
year-end 2015, as well as end of January 2016. For example, in December 2008,
at the height of the Financial Crisis (when risks were arguably at all-time highs),
using the 1926-2008 historical ERP of 6.5% together with the spot 20-year yield of
3.0% would result in a base cost of equity capital of 9.5%. In contrast, the base
cost of equity would be 11.6% (4.5% plus 7.1%) at year-end 2007, implying that
risks were actually higher at the end of 2007 than at the end of 2008. From both a
theoretical and practical standpoint, the reality is that investors likely perceive:d
risks to be much higher In December 2008, relative to the December 2007. This
demonstrates that a mechanical application of the data may result in nonsensical
results.61
60 Source of underlying data: Morningstar Direct database. Used with permission. Risk-free rate data series used: Long-tenn GOV't Bonds (IA SBBI US LT Govt YLD USD). All rights reserved. Calculatlons perfonned by Duff & Phelps LLC 61 More detailed informallon on historical and forward-looklng ERPs can be found later in this report.
March 16, 2016 31
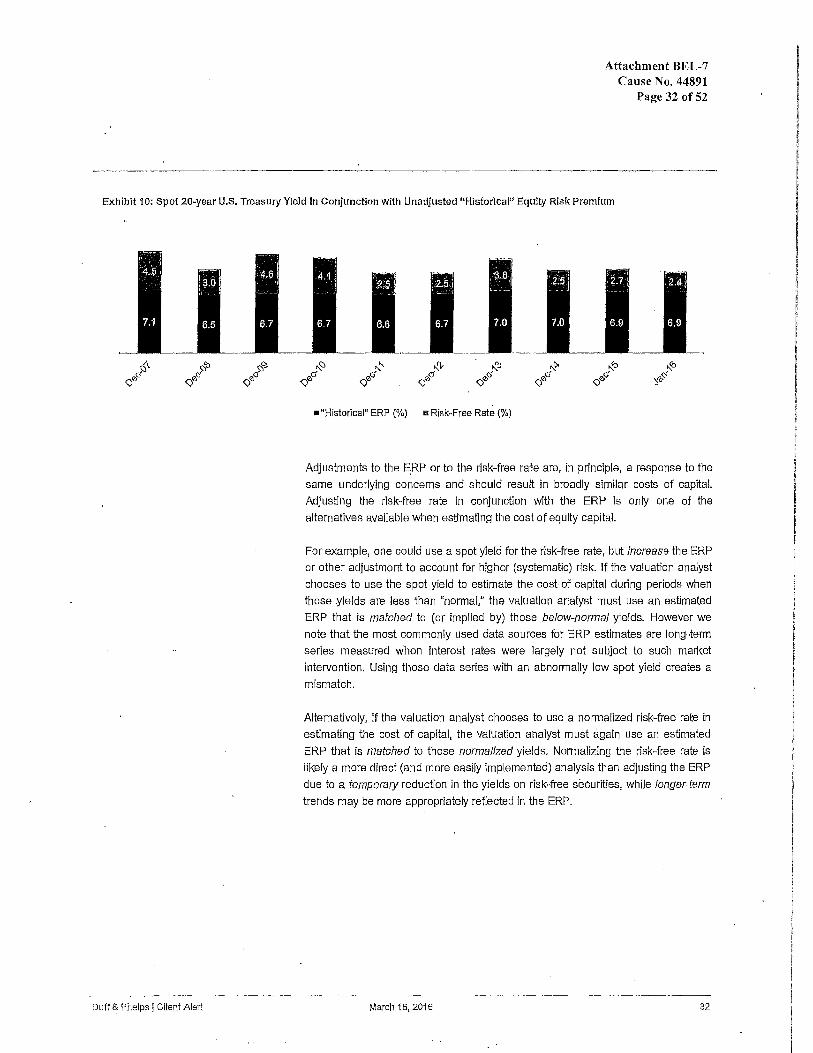
Attachment BEL-7 Cause No. 44891
Page32 of52
Exhibit 1 O: Spot 20-year U.S. Treasury Yield In Conjunction with Unadjusted "Historical" Equity Risk Premium
Duff & Pheips I Client Alert
1111 "Historical" ERP (%) a Risk-Free Rate (%)
Adjustments to the ~RP or to the risk-free rate are, in principle, a response to the
same underlying concerns and should result in broadly similar costs of capital.
Adjusting the rlsJ<...free rate in conjunction with the ERP is only one of the
alternatives available when estimating the cost of equity capital.
For example, one could use a spot yield for the risk-free rate, but increase the ERP
or other adjustment to account for higher (systematic) risk. If the valuation analyst
chooses to use the spot yield to estimate the cost of capital during periods when
those .yields are less than "normal," the valuation analyst must use an estimated
ERP that is matched to (or implied by) those be/ow-normal yields. However we
note that the most commonly used data sources for ERP estimates are long-term
series measured when interest rates were largely not subject to such market
intervention. Using those data series with an abnormalry low spot yield creates a
mismatch.
Alternatively, if the valuation analyst chooses to use a normalized risk-free rate in
estimating the cost of capital, the valuation analyst must again use an estimated
ERP that is matched to those normalized yields. Normalizing the risk-free rate is
likely a more direct (and more easily Implemented) analysis than adjusting the ERP
due to a temporary reduction in the yields on risk-free securities, while longer-term trends may be more appropriately reflected in the ERP.
March 16, 2016 32
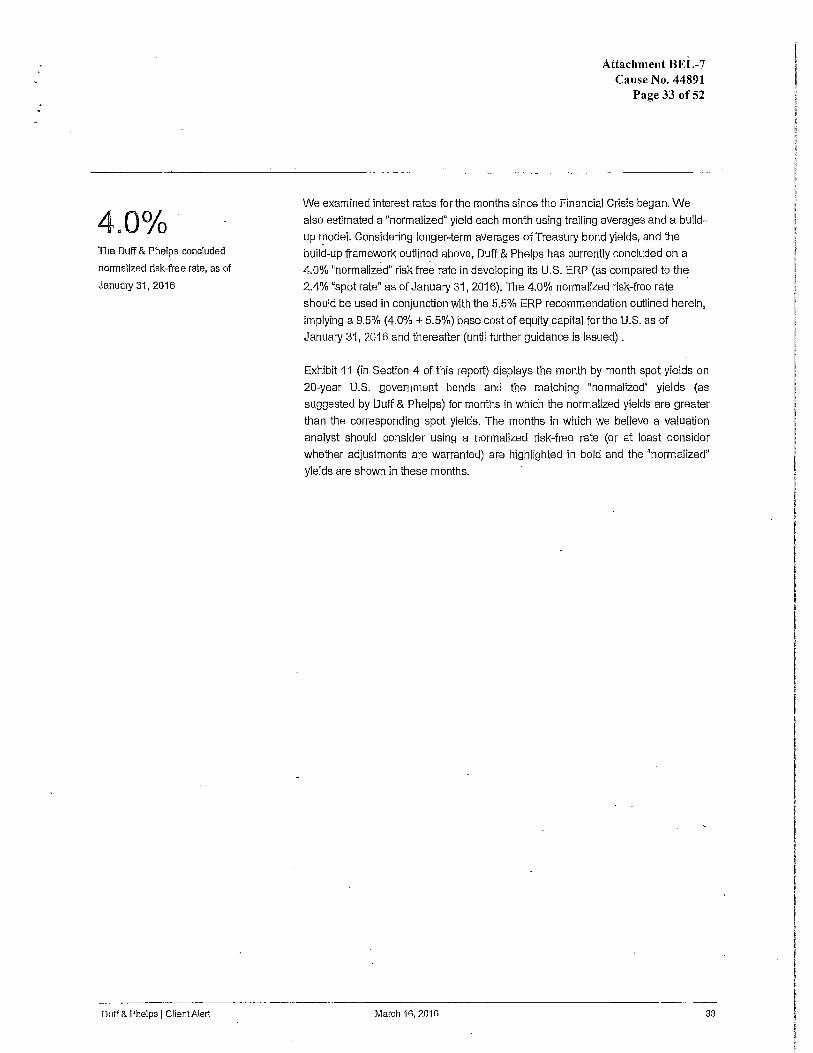
The Duff & Phelps concluded
normalized risk-free rate, as of
January 31, 2016
Duff & Phelps I Client Alert
Attachment BEL-7 Cause No. 44891
Page 33 of52
We examined interest rates for the months since the Financial Crisis began. We
also estimated a "normalized" yield each month using trailing averages and a build
up r:iodel. Considering longer-term averages of Treasury bond yields, and the
build-up frameVl".ork outlin~d above, Duff & Phelps has currently concluded on a
4.0% "normalized" risk free rate in developing its U.S. ERP (as compared to the
2.4% "spot rate" as of January 31, 2016). The 4.0% normalized risk-free rate
should be used in conjunction with the 5.5% ERP recommendation outlined herein,
implying a 9.5% (4.0% + 5.5%) base cost of equity capital for the U.S. as of
January 31, 2016 and thereafter (until further guidance is issued).
Exhibit 11 (in Section 4 of this report) displays the month by month spot yields on
20-year U.S. government bonds and the matching "normalized" yields (as
suggested by Duff & Phelps) for months in which the normalized yields are greater
than the corresponding spot yields. The months in which we believe a valuation
analyst should consider using a normalized risk-free rate (or at least consider
whether adjustments are warranted) are highl!ghted in bold and the "normalized"
yields are shown in these months.
March 16, 2016 33

Section 04
Duff & Phelps I Client Alert
Attachment BEL-7 Cause No. 44891
Page 34 of52
Basis for U.S. ERP
Recommendation as of
January·31, 2016
March 16, 2016 34
Basis for U.S. Recommended ERP as of January 31, 2016
.. Duff & Phelps [ Client Alert
Unconditional ERP
Attachment BEL-7 Cause No. 44891
Page 35 of52
ERP is a forward-looking concept. It is an expectation as of the valuation date for which no market quotes are directly observable. While an analyst can observe
premiums realized over tlme by referring to historical data {i.e., realized return approach or ex post approach), such realized premium data do not represent the
ERP expected In prior periods, nor do they represent the current ERP estlmate. Rather, realized premiums represent, at best, only a sample from prior pertods of
what may have then been the expected ERP.
To the extent that realized premiums on the average equate to expected premiums in prior periods, such samples may be representative of current expectations. But
to the extent that prtor events that are not expected to recur caused reallzed returns to differ from prior expectations, such samples should be adjusted to
remove the effects of these nonrecurring events. Such adjustments are needed to
improve the predictive power of the sample.
Alternatively, the analyst can derive forward-looking estimates for the ERP from
sources such as: (i) data on the underlying expectations of growth in corporate earnings and dividends; (ii) projections of specific analysts as to dividends and future "stock prices; or (iii) surveys (an ex-ante approach). The goal of these approaches is to estimate the true expected ERP as of the valuation date.
Duff & Phelps recognizes that making any ERP estimate requires a great degree of
judgment. In arriving at our recommended ERP, we weigh both economic and financial markets evidence. We choose to change our recommendations when the preponderance of evide.nce indicates a change ls justified. We try to avoid making
a change in one month to only find the evidence reversing itself the following
month.
As indicated in Section 2 "Overview of Duff & ~helps ERP Methodology", based on
the analysis of academic and financial literature and various empirical studies, we
have concluded that a reasonable long-tenn estimate of the nonnal or unconditional U.S. ERP Is in the range of 3.5% to 6.0%.
March 16, 2016 35
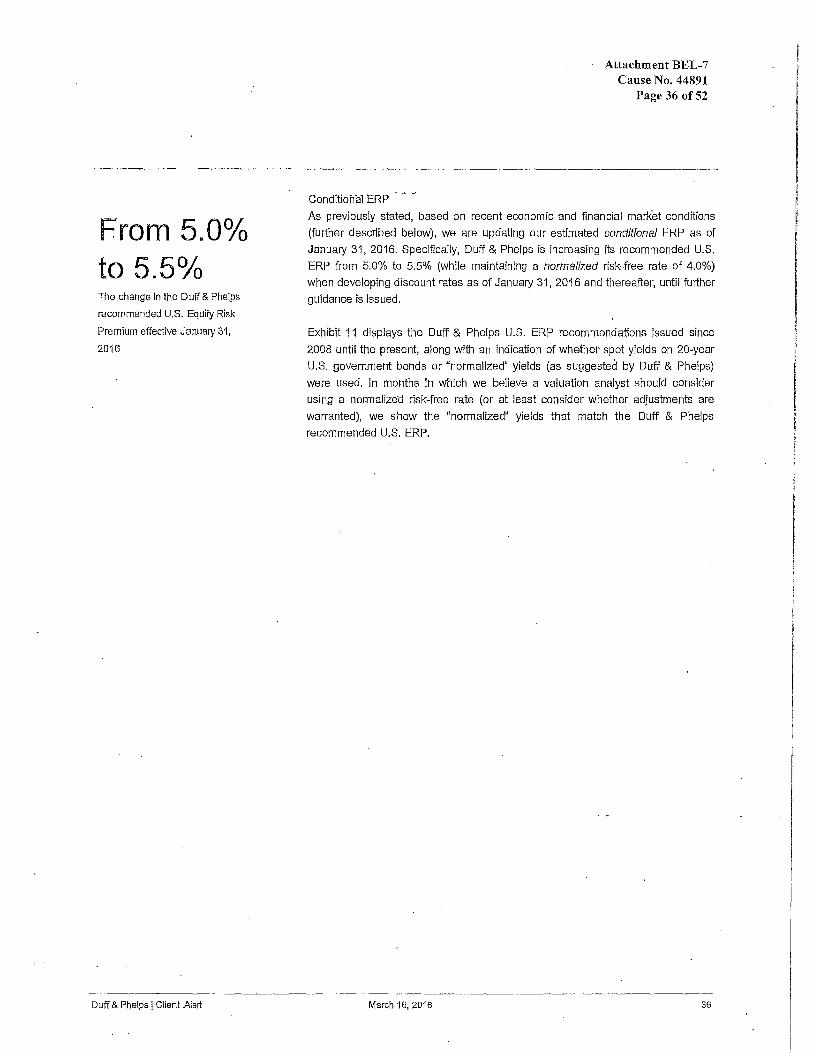
From 5.0% to 5.5o/o The change In the Duff & Phelps
recommended U.S. Equity Risk
Premium effective January 31,
2016
Duff & Phelps I Client Alert
Conditional ERP
Attachment BEL-7 Cause No. 44891
Page36 of52
As previously stated, based on recent economic and financial market conditions
(further described below), we are updating our estimated conditional ERP as of
January 31, 2016. Speclfically, Duff & Phelps is Increasing its recommended U.S.
ERP from 5.0% to 5.5% (while maintaining a normalized risk-free rate of 4.0%)
when developing discount rates as of January 31, 2016 and thereafter, until further
guidance is Issued.
Exhibit 11 displays the Duff & Phelps U.S. ERP recommendations issued since
2008 until the present, along with an indication of whether spot ylelds on 20-year
U.S. government bonds or "normalized" yields (as suggested by Duff & Phelps)
were used. In months in which we believe a valuation analyst should consider
using a nor.malize·d risk-free rate (or at least consider whether adjustments are
warranted), we show the "normalized" yields that match the Duff & Phelps
recommended U.S. ERP.
March 16, 2016 36
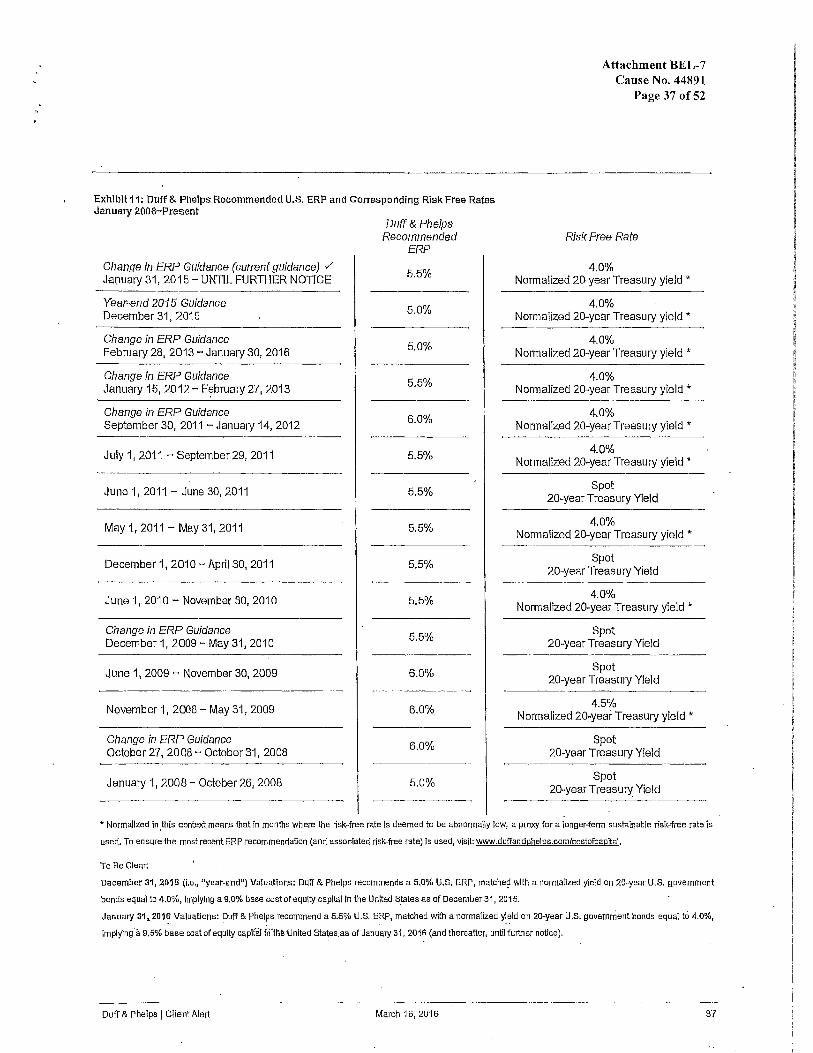
Exhibit 11: Duff & Phelps Recommended U.S. ERP and Corresponding Risk Free Rates Janua1y 2008-Present
Change in ERP Guidance (current guidance) v' January 31, 2015- UNTIL FURTHER NOTICE
Year-end 2015 Guidance December 31, 2015
Change in ERP Guidance February 28, 2013 - January 30, 2016
Change in ERP Guidance January 15, 2012- F~bruary27, 2013
Change in ERP Guidance September 30, 2011 - January 14, 2012
July 1, 2011 - September 29, 2011
June 1, 2011 - June 30, 2011
May 1, 2011 - May 31, 2011
December 1, 2010 - April 30, 2011
June 1, 2010 - November 30, 2010
Change in ERP Guidance December 1, 2009 - May 31, 2010
June 1, 2009 - November 30, 2009
November 1, 2008 - May 31, 2009
Change in ERP Guidance October 27, 2008- October 31, 2008
January 1, 2008 - October 26, 2008
Duff & Phelps Recommended
ERP
5.5%
5.0%
5.0%
5.5%
6.0%
5.5%
5.5%
5.5%
5.5%
5.5%
5.5%
6.0%
6.0%
6.0%
5.0%
Attachment BEL-7 Cause No. 44891
Page 37 of52
Risk Free Rate
4.0% Normalized 20-year Treasury yield *
4.0% Normalized 20-year Treasury yield*
4.0% Normalized 20-year Treasury yield *
4.0% Normalized 20-year Treasury yield *
4.0% Normalized 20-year Treasury yield *
4.0% Normalized 20-year Treasury yield*
Spot 20-year Treasury Yield
4.0% Normalized 20-year Treasury yield *
Spot 20-year Treasury Yield
4.0% Normalized 20-year Treasury yield*
Spot 20-year Treasury Yield
Spot 20-year Treasury Yield
4.5% Normalized 20-year Treasury yield *
Spot 20-year Treasury Yield
Spot 20-year Treasury Yield
*Normalized in ,this context means lhat in months where the risk-free rate is deemed to be abnormally low, a proxy for a longer-term sustainable risk-free rate ls
used. To ensure the most recent ERP recommendation (and assoclated risk-free rate) ls used, visit: www.duffandphelps.com/costofcapital.
To Be Clear:
Oe~ember 31, 2015 (i.e., "year-end") Valuations: Duff & Phelps recommends a 5.0% U.S. ERP, matchesf wlth a normalized yield on 20-year U.S. government
bonds equal to 4.0%, implying a 9.0% base cost of equity capital In the United s,tates as of December 31, 2015.
January'31,201~, Valuations: Duff & Phelps recommend a 5.5% U.S, ERP, matched with a normalized yield on 20-year U.S. govemmentbonds equal to 4.0%,
implying a 9,5% base cost of equity capitaI f1i'tlit»United Stafes as of January 31, 2016 (and thereafter, until further notice).
Duff & Phelps l Client Alert March 16, 2016 37
Duff & Phelps I Client Alert
Basfs for Duff & Phelps Recommended U.S. ERP62
Attachment BEL-7 Cause No. 44891
Page 38 of52
In estimating the conditional ERP, valuation analysts cannot simply use the long
term historical ERP, without further analysis. A better alternative would be to
examine approaches that are sensitive to the current economic conditions.
As previously discussed, Duff & Phelps employs a multi-faceted analysis to
estimate the conditional ERP that takes into account a broad range of economic
information and multiple ERP estimation methodologies to arrive at its
recommendation.63
First, a reasonable range of normal or unconditional ERP is establish~d.
Second, based on current economic conditions, Duff & Phelps estimates where in
the range the true ERP likely lies (top, bottom, or middle} by examining the current
state of the economy (both by examining the level of stock indices as a forward
indicator and examining economic forecasts), as well as the implied equity volatility
and corporate spreads as indicators of perceived ri~k.
For example, since December 31, 2014, while the evidence was somewhat mixed,
on balance we saw Indications that equity risk in financial markets had stayed
relatively constant through the end of 2015, when estimated against a normalized
risk-free rate of 4.0%. Exhibit 12-A summarizes the primary economic ana financial
market indicators we analyzed at December 31, 2015 and how they have moved
since December 31, 2014, with the corresponding relative impact on ERP
indications:
62 This discussion was extracted from Chapter 3 of the Duff & Phelps 2016 Valuation Handbook- Gulde to Cost of Capita/ (Hoboken, NJ: John Wiley & Sons, 2016}. The discussion In this section was based on
. lnfonnatlon avallal>le at the time of writing (through February 23, 2016}. Events and market conditions may have changed since then relative to when this report Is fssueci 63 To ensure you are always using the most recent ERP recommendation, visit www.duffandphelps.com/costofcapital.
March 16,2016 38
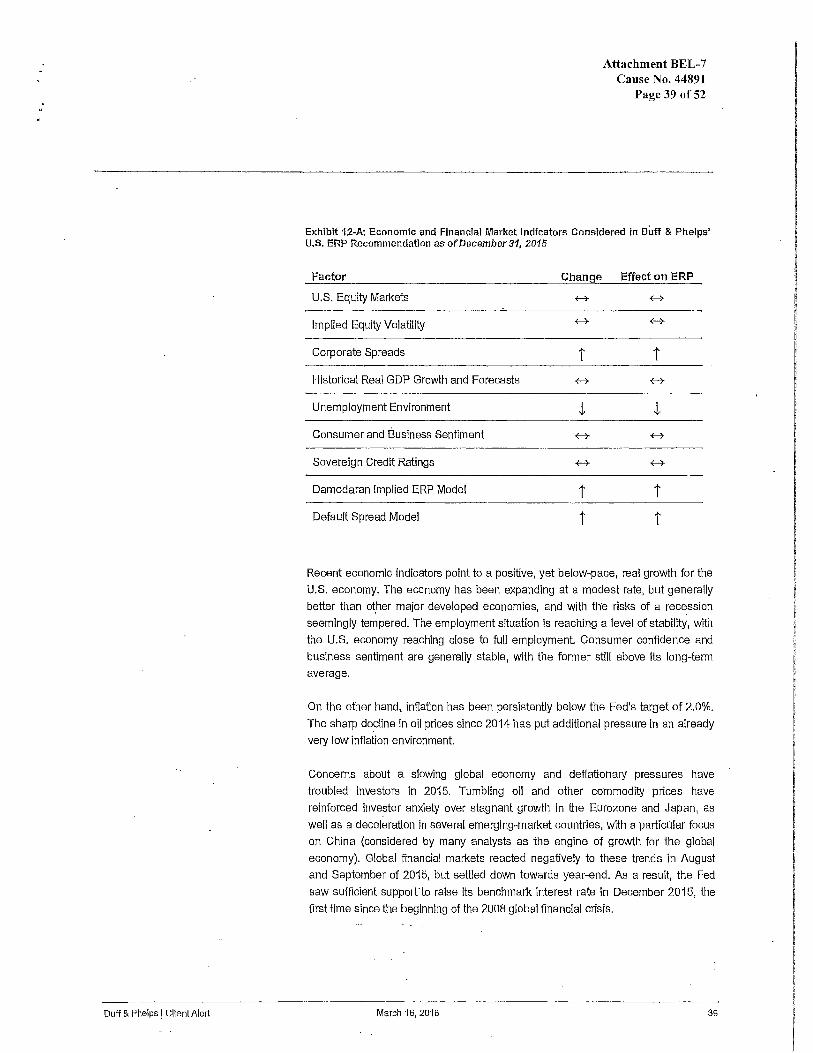
Duff & Phelps I Client Alert
Attachment BEL-7 Cause No. 44891
Page 39 of52
Exhibit 12-A: Economic and Financial Market Indicators Considered in Duff & Phelps' U.S. ERP Recommendation asofDecember31, 2015
Factor Change Effect on ERP
U.S. Equity Markets +--7 ~
Implied Equity Volatility +--7 ~
Corporate Spreads t t Historical Real GDP Growth and Forecasts +-+ +-+
Unemployment Environment t t Consumer and Business Sentiment ~ +--7
Sovereign Credit Ratings +-+ ~
Damodaran Implied ERP Model t t Default Spread Model t t
Recent economic indicators point to a positive, yet below-pace, real growth for the
U.S. economy. The economy has been expanding at a modest rate, but generally
better than o~her major developed economies, and with the risks of a recession
seemingly tempered. The employment situation is reaching a level of stability, with
the U.S. economy reaching close to full employment Consumer confidence and
business sentiment are generally stable, with the former stlll above its long-te1111
average.
On the other hand, inflation has been persistently below the Fed's target of 2.0%.
The sharp de~line in oil prices since 2014 has put additional pressure in an already
very low inflation environment.
Concerns about a slowing global economy and deflationary pressures have
troubled investors in 2015. Tumbling oil and other commodity prices have
reinforced investor anxiety over stagnant growth in the Eurozone and Japan, as
well as a deceleration in several emerging-market countries, with a particular focus
on China (considered by many analysts as the engine of growth for the global
economy). Global financial markets reacted negatively to these trends in August
and September of 2015, but settled down towards year-end. As a result, the Fed
saw sufficient support-to raise its benchmark interest rate in December 2015, the
first time since the beginning of the 2008 global financial crisis.
March 16, 2016 39
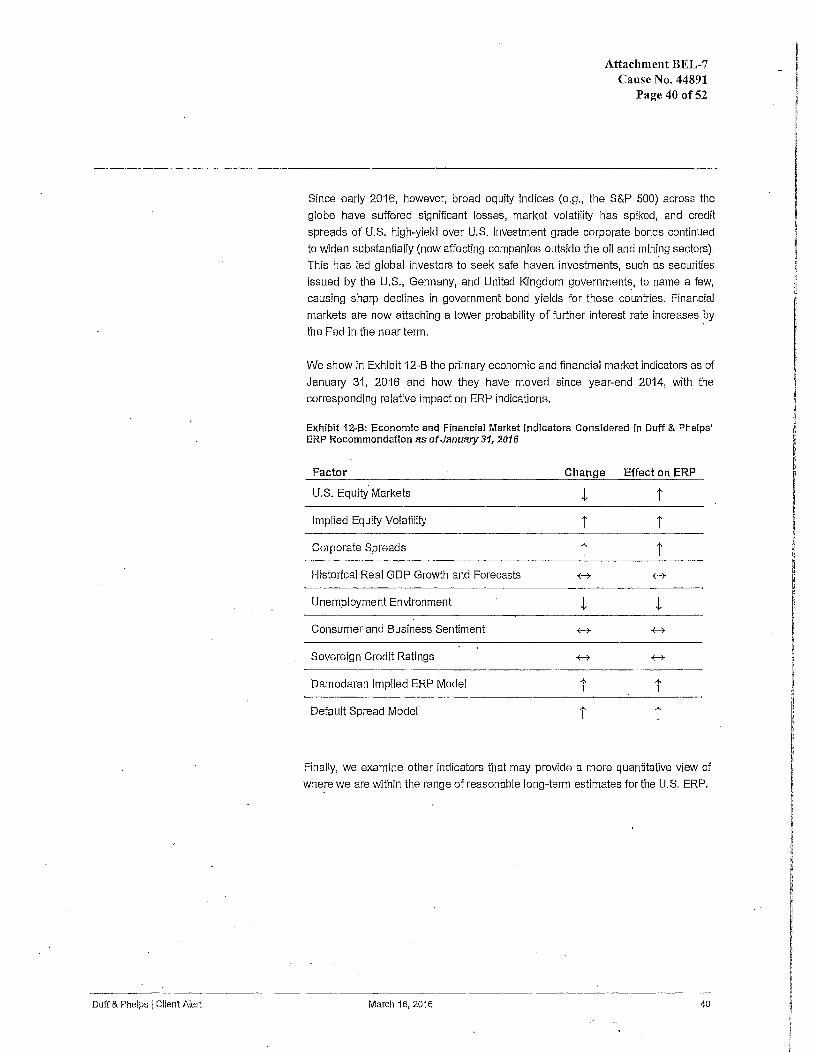
Duff & Phelps I Cllent Alert
Attachment BEL-7 Cause No. 44891
Page 40 of52
Since early 2016, however, broad equity Indices (e.g., the S&P 500) across the
globe have suffered significant losses, market volatility has spiked, and credit
spreads of U.S. high-yield over U.S. investment grade corporate bonds continued
to widen substantially (now affecting companies outside the oil and mining sectors).
This has led global investors to seek safe haven investments, such as securities
issued by the U.S., Germany, and United Kingdom governments, to name a few,
causing sharp declines in government bond yields for these countries. Financial
markets are now attaching a lower probability of further interest rate increases by
the Fed in the near term.
We show in Exhibit 12-B the primary economic and financial market indicators as of
January 31, 2016 and how they have moved since year-end 2014, with the
corresponding relative impact on ERP indications.
Exhibit 12-8: Economic and Financial Market Indicators Considered In Duff & Phelps' ERP Recommendation asofJanuary31, 2016
Factor Change Effect on ERP
U.S. Equity Markets L t Implied Equity Volatility t t Corporate Spreads t t Historical Real GDP Growth and Forecasts +-7 +-7
Unemployment Environment L L Consumer and Business Sentiment +-7 +-7
Sovereign Credit Ratings +-7 +-7
Damodaran Implied ERP Model t t Default Spread Model t t
Finally, we examine ·other Indicators that may provide a more quantitative view of
where we are within the range of reasonable long-tenn estimates for the U.S. ERP.
March 16, 2016 40

Duff & Phelps J Client Alert
Attachment BEL-7 Cause No. 44891
Page 41 of52
Duff & Phelps currently uses several models as corroborating evidence. We
reviewed these indicators both at year-end 2015 and at the end of January 2016.
• Damodaran Implied ERP Model - Professor Aswath Damodaran
calculates implied ERP estimates for the S&P 500 and publishes his
estimates on his website. Prof. Damodaran estimates an implied ERP by
first solving for the discount rate that equates the current S&P 500 index
level with his estimates of cash distributions (dividends and stock
buybacks) in future years. He then subtracts the current yield on 10-year
U.S. government bonds. Duff & Phelps then converts his estimate to an
arithmetic average equivalent measured against the 20-year U.S.
government bond rate.
Prof. Damodaran has recently added new capabilities to his implied equity
risk premium calculator. The new features introduced last year allow the
user to select a variety of base projected cash flow ylelds, as a well as
several expected growth rate choices for the following five years in the
forecast. Each option for cash flow yields is independent of the growth
rate assumptions, which means that the user can select up to 35 different
combinations to estimate an implied ERP. More recently, Prof.
Damodaran added a new feature that allows the terminal year's projected
cash flows to be adjusted to what he considers a more sustainable payout
ratio. This sustainable payout is computed using the long-term growth rate
(g) and the tralllng 12-month return on equity (ROE), as follows:
Sustainable Payout= 1 - g/ROE. lfthe user selects this option, the payout
ratio over the next (projected) five years Is based on a linear Interpolation
between today's payout ratio and the Sustainable Payout. otherwise, the
terminal year payout ratio will be the same as today's value throughout the
entire forecast.
Exhibit 13 shows the current options that a user can select to arrive at an
implied ERP indication. Each of these combinations can then be adjusted
for a sustainable payout, if the USt?r so decides. 64
64 Source of underlying data: Downloadable dataset entill~d "Spreadsheet to compute ERP for current month'. To obtain a copy, visit htto:l/people.stem.nyu.edu/adamodarl.
March 16, 2016 41
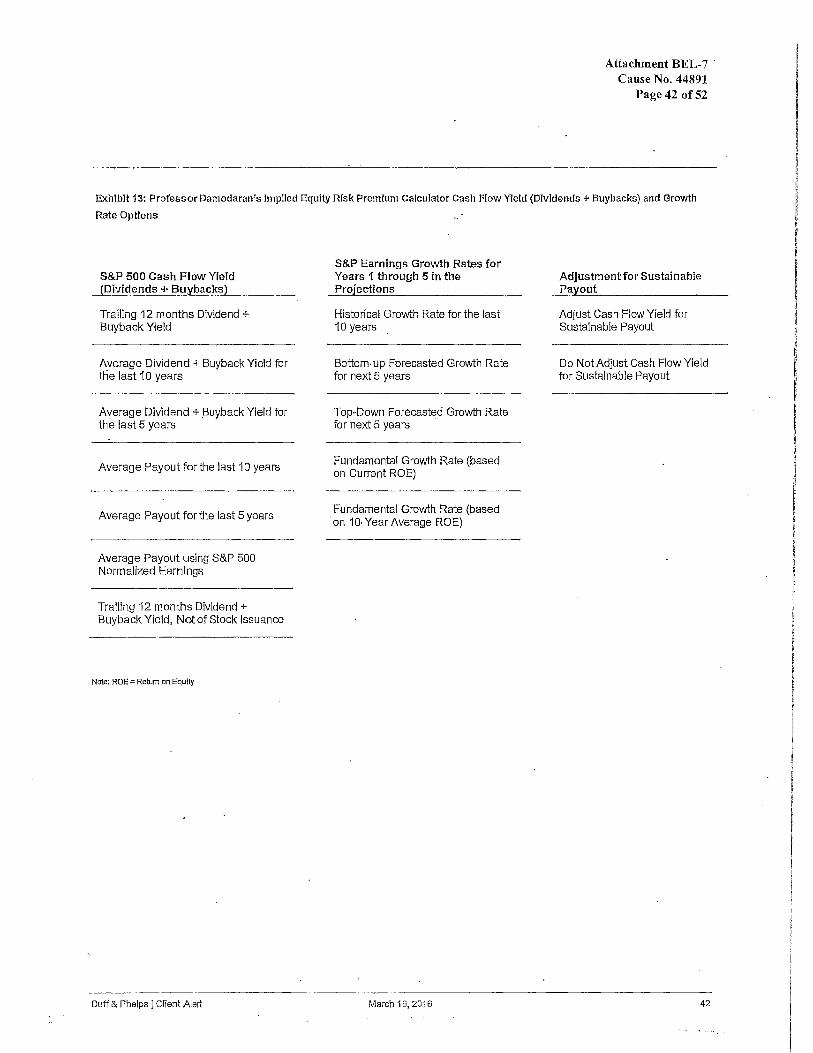
Attachment BEL-7 · Cause No. 44891
Page 42 of52
Exhibit 13: Professor Damodaran's Implied Equity Risk Premium Calculator Cash Flow Yield (Dividends + Buybacks) and Growth
Rate Options
S&P 500 Gash Flow Yield (Dividends+ Buybacks)
Trailing 12 months Dividend+ Buyback Yield
Average Dividend + Buyback Yield for tlie last 10 years
Average Dividend +.Buyback Yield for the last 5 years
Average Payout for the last 10 years
Average Payout for the last 5 years
Average Payout using S&P 500 Normalized Earnings
Trailing 12 months Dividend+ Buyback Yield, Net of Stock Issuance
Note; ROE"' Return on Equity
Duff & Phelps l Client Alert
S&P Earnings Growth Rates for Years 1 through 5 in the Projections
Historical Growth Rate for the last 10 years .
Bottom-up Forecasted Growth Rate for next 5 years
Top-Down Forecasted Growth Rate for next 5 years ·
Fundamental Growth Rate (based on Current ROE)
Fundamental Growth Rate (based ·on 10-Year Average ROE)
March 16, 2016
Adjustment for Sustainable Payout
Adjust Cash Flow Yield for Sustainable Payout
Do Not Adjust Cash Flow Yield for Sustainable Payout
42
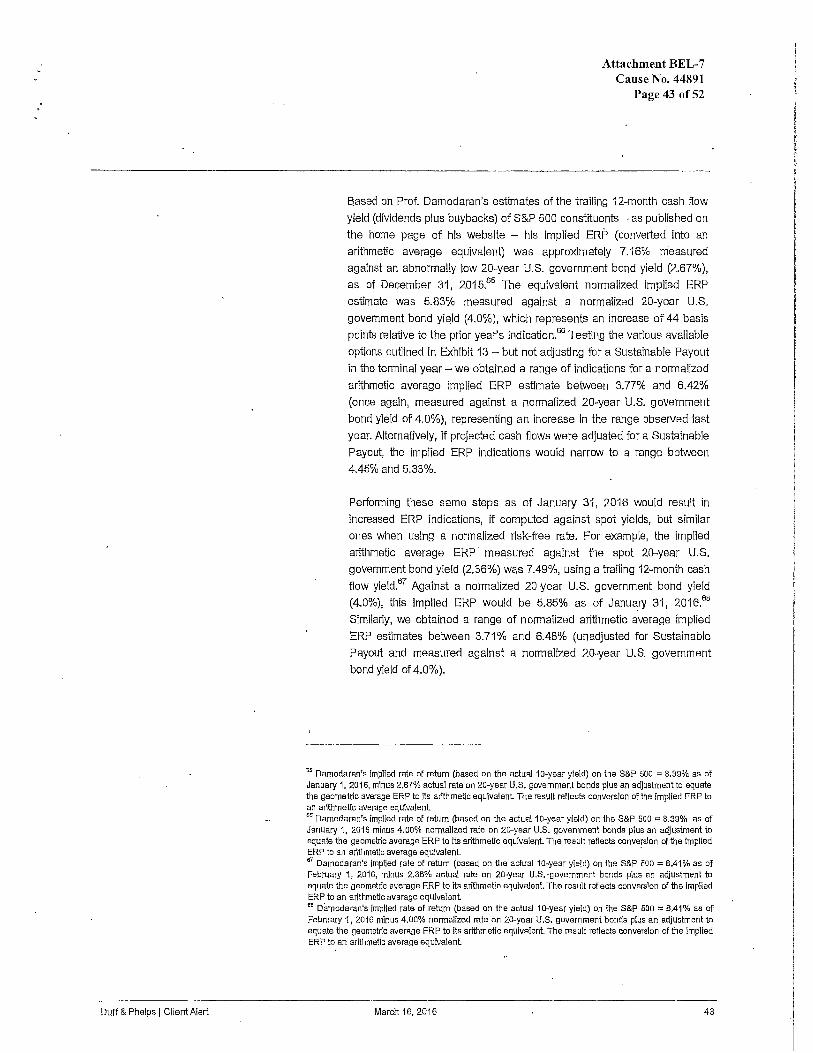
Duff & Phelps I C11ent Alert
Attachment BEL-7 Cause No. 44891
Page 43 of52
Elased on Prof. Damodaran's estimates of the trailing 12-month cash flow
yield {dividends plus buybacks) of S&P 500 constituents - as published on
the home page of his website - his Implied ERP (converted into an
arithmetic average equivalent) was approximately 7.16% measured
against an abnormally low 20-year U.S. government bond yield (2.67%),
as of Decembe.r 31, 2015.65 The equivalent nonnalized Implied ERP
estimate was 5.83% measured against a nonnalized 20-year U.S.
government bond yi~ld (4.0%), which represents an increase of 44 basis
points relative to the prior year's indication.66 Testing the various available
options outlined in Exhibit 13 - but not adjusting for a Sustainable Payout
in the tenninal year - we obtained a range of indications for a normalized
arithmetic average implied ERP estimate between 3.77% and 6.42%
(once again, measured against a nonnallzed 20-year U.S. government
bond yield of 4.0%), representing an increase in the range observed last
year. Alternatively, if projected cash flows were adjusted for a Sustainable
Payout, the implied ERP indications would narrow to a range between
4.45% and 5.33%.
Perfonning these same steps as of January 31, 2016 would result In
increased ERP indications, if computed against spot yields, but similar
ones when using a normalized risk-free rate. For example, the implied
arithmetic average ERP measured against the spot 20-year U.S.
government bond yield (2.36%) was 7.49%, using a trailing 12-month cash
flow yield.67 Against a nonnalized 20-year U.S. government bond yield
(4.0%), this implied ERP would be 5.85% as of Janw:uy 31, 2016.68
Similarly, we obtained a range of normalized arithmetic average Implied
ERP estimates between 3.71% and 6.48% (unadjusted for Sustainable
Payout and measured against a normalized 20-year U.S. government
bond yield of 4.0% ).
65 Damodaran's Implied rate of return (based on the actual 1 a-year yield) on the S&P 500 = 8,39% as of January 1, 2016, minus 2.67% actual rate on 20-year U.S. government bonds plus an adjustment to equate the geometric average ERP to its arithmetic equivalent The result reflects conversion of the Implied ERP to an artthme1Ic average equivalent · .. Damodaran's implied rate of return (based on the actual 1 CJ-year yield) on the S&P 500 "' 8,39% as of January 1, 2016 minus 4.00% normalized rate on 20-year U.S. government bonds plus an adjustment to equate the geometric average ERP to Its artthmetlc equivalent. The result reflects conversion of the implied ERP to an arithmetic average equivalent. · lfT Damodaran's Implied rate of return (based on the actual 10-year yield) on the S&P 500 = 8.41% as of February 1, 2016, minus 2.36% actual rate on 20-year U.S. ·government bonds plus an adjustment to equate the geometric average ERP to lts arlthmettc equivalent. The result reflects conversion of the implied ERP to an arithmetic average equivalent 68 Damodaran's Implied rate of return (based on the actual 10-year yield) on the S&P 500 = 8.41% as of February 1, 2016 minus 4.00% normalized rate on 20-year U.S. government bonds plus an ar;ijustment to equate the geometric average ERP to Its arithmetic equivalent. The result reflects conversion of the implied ERP to an arithmetic average equivalent
March 16, 2016 43
Duff & Phelps I Client Alert
Attachment BEL-7 Cause No. 44891
Page 44 of52
[Note: Appendix A summarizes the U.S. ERP implied by the Damodaran model
since· December 31, 2008, as converted by Duff_ & Phelps into an arithmetic
average equivalent against normalized 20-year U.S. government bonds.]
Default Spread Model (DSM) - The Default Spread Model is based on
the premise that the long term average ERP (the unconditional ERP) is
constant and deviations from that average over an economic cycle can be
measured by reference to deviations from the long term average of the
default spread (Baa - Aaa).69
At the end of December 2015 and January 2016, the conditional EF~P
calculated using the DSM model was 5.51 % and 5.65% respectively. For
perspective, the last time this model resulted in an implied ERP in excess
of 5.5% was back in August 2012. This model notably removes the risk
free rate itself as an input in the estimation of ERP. However, the ERP
estimate resulting from the DSM is still interpreted as an estimate of the
relative return of stocks in excess of risk-free securities.
[Note: Appendix B summarizes the conditional U.S. ERP (CERP) implied by
the Default Spread Model since December 31, 2008.]
• Hassett Implied ERP (Hassett) :-- Stephen Hassett has developed a
model for estimating the implied ERP, as well as the estimated S&P 500
index level, based on the current yield on long-term U.S. government
bonds and a risk premium factor (RPF).70 The RPF is the empirically
derived relationship between the risk-free rate, S&P 500 earnings, real
interest rates, and real GDP. growth to the S&P 500 index over time. The
RPF appears to change only infrequently. The model can be used monthly
to estimate the S&P 500 index level and the conditional ERP based on the
current level of interest rates.71
69 The Osfault Spread Model presented herein ls based on Jagannathan, Ravi, and Wang, Zhenyu," The Conditional GAPM and the Gross ..Section of Expected Returns," The Joumal of Finance, Volume 51, Issue 1, March 1996; 3-53. See also Elton, Edwin J. and Gruber, Martin J., Agrawal, Oeepak, and Mann, Christopher "ls There a Risk Premium in Corporate bonds?', Working Paper, http://pages.stern.nyu.edu/-eelton/working papsrs/corp%20bonds/ls%20there%20a%20risk%20premfum %20ln%20corporate%20bonds.pdf. Duff & Phelps uses (as did Jagannathan, Ravi, and Wang) the spreacl of high-grade corporates against lesser gracle corporates. Corporate bond series usect [n· analysis herein: Barclays US Gorp Baa Long Yid USP (Yield) and Barclays US Corp Aaa Long Yid USO (Yield); Source: Morningstar Direct. 70 Stephen D. Hassett, "The RPF Model for Calculating the Equity Risk Premium and Explaining the Value of the S&P with Two Variables," Journal of Applied Corporate Finance 22, 2 (Spring 2010): 118-130. 71 For a more detailed description of Hassett's Risk Premium Factor model see Pratt and Grabowski, op.cit., Chapter BA, 'Deriving ERP Estimates': 167-168".
March 16, 2016 44
:
5.5°/o The Duff & Phelps U.S. Equity
Risk Premium Recommendation
effective January 31, 2016
Duff & Phelps I Client Alert
Attachment BEL-7 Cause No. 44891
Page 45 of52
Hassett's analysis uses the spot 10-year risk-free rate for the period from January. 2008 through July 2011; thereafter, his analysis uses a normalized yield on U.S. Treasuries of 4.5% (2.0% real risk-free rate plus 2.5% lnflation).72 Using a normalized 4.5% risk-free rate at both December 2015 and January 2016, the S&P 500 index appeared to be slightly overvalued based on the Hassett model's predictions. Alternatively, based on the S&P 500 index level at the end of December 2015, the implied risk
free rate commensurate with the index closing price was 3.90%. At the end of January 2016, the implied risk-free rate was slightly up at·4.08%. Both of these indications for the risk-free rate are very close to the Duff &
Phelps concluded normalized risk-free rate of 4.0% at both dates.
While these additional models may be useful in suggesting the direction of changes in the conditional ERP, they are, like all methods of estimating the ERP, imperfect. The Damodaran Implied ERP Model, the Default Spread Model, and the Hassett Implied ERP Model all utlllze assumptions that are subjective in nature. For example, the Damodaran Implied ERP Model assumes a long-term growth rate for dividends and buybacks that is largely a matter of judgment Likewise, in the default spread model, the changes in spread are applied to a "benchmark" ERP estimate; the choice of that benchmark ERP is largely a matter of judgment
Again, the inherent "imperfection" of any single ERP estimation model ls precisely Why Duff & Phelps takes into account a broad range of economic information and multiple ERP estimation methodologies to arrive at our conditional ERP recommendation.
Taking these factors together, we find sypport for increasing our ERP recommendation relative to our previous recommendatiof"!
TO BE CLEAR:
• Many valuations are done at year-end. The Duff & Phelps U.S. ERP recommendation for use with December 31, 2015 valuations is 5.0%, matched with a normalized risk-free rate of 4.0%. This implies a 9.0% (4.0% + 5.0%) "base" U.S. cost of equity capital estimate as of December
31, 2Q15.
• The Duff & Phelps U.S. ERP recommendation as of January 31, 2016 (and thereafter, until further notice) is 5.5%, matched with a normalized risk-free rate of4.0%. This implies a 9.5% (4.0% + 5.5%) "base~ U.S. cost of equity capital estimate as of January 31, 2016.
72 "Dlssec:ting S&.P 500 2.015 Performance Using The RPF Model" by Steve Hassett, Retrlaved from: http:Hseeklngalpha.comlarttcla/38111 86-dlssecting-s-and-p-500-2015-perforrnance-uslng-rnf-model.
March 16, 2016 45
Section 05 Conclusion
Duff & Phelps I Client Alert March 16, 2016
Attachment BEL-7 Cause No. 44891
Page 46 of52
46
I ! i I I
I i t !
! ! I ! l
I I I
I
I I f
I I
. [
I I I
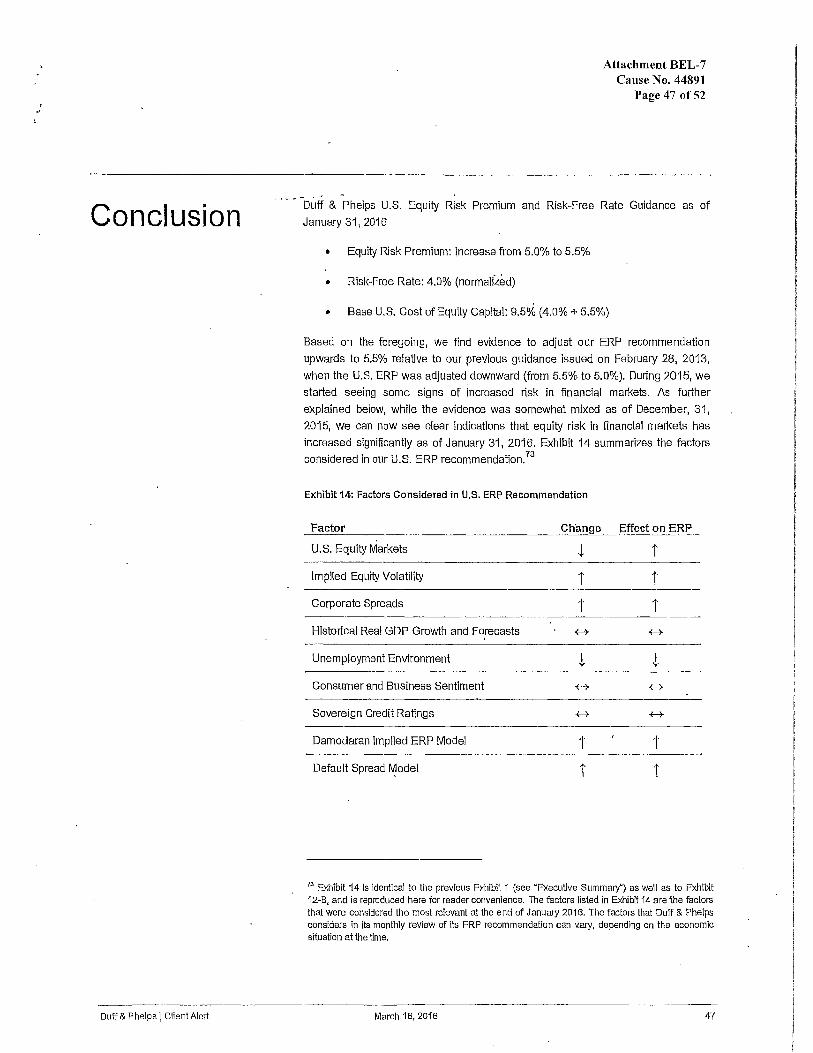
' ,.
Conclusion
Duff & Phelps I Client Alert
Attachment BEL-7 Cause No. 44891
Page 47 of52
· · - • -Duff & Phelps U.S. Equity Risk Premium and Risk-Free Rate Guidance as of
January 31, 2016
• Equity Risk Premium: Increase from 5.0% to 5.5%
• Risk-Free Rate: 4.0% (normalized)
• Base U.S. Cost of Equity Capital: 9.5% (4.0% + 5.5%)
Based on the foregoing, we find evidence to adjust our ERP recommendation
upwards to 5.5% relative to our previous guidance issued on February 28, 2013,
when the U.S. ERP was adjusted downward (from 5.5% to 5.0%). During 2015, we
started seeing some signs of increased risk in financial markets. As further
explained below, while the evidence was somewhat mixed as of December, 31,
2015, we can now see clear indications that equity risk in financial markets has
increased significantly as of January 31, 2016. Exhibit 14 summarizes the factors
considered in our U.S. ERP recommendation.73
Exhibit 14: Factors Considered in U.S. ERP Recommendation
Factor Change Effect on ERP
U.S. Equity Markets t t Implied Equity Volatility t t Corporate Spreads t t Historical Real GDP Growth and Forecasts +-+ +-+
Unemployment Environment t t Consumer and Business Sentiment -(--+ +-+
Sovereign Credit Ratings -(--+ +-+
Damodaran Implied ERP Model t t Default Spread rv)odel t t
73 Exhibit 14 ls identical to the previous Exhibit 1 (see "Executive Summary") as well as to Exhibit 12-B, and is reproduced here for reader convenience. The factors listed in Exhibit 14 are the factors that were considered the most relevant at the encl of January 2016. The factors that Duff & Phelps considers in Its monthly review of lts ERP recommendation can v,ary, depending on the economic situation at the time.
March 16, 2016 47
Duff & Phelps I Client Alert
Attachment BEL-7 Cause No. 44891
Page 48 of52
Recent economic indicators point to a positive, yet below-pace, real growth for the
U,S. economy. The U.S. economy has been expanding at a modest rate, but
generally better than other major developed economies, and with the risks of a
recession seemingly tempered. The employment situation rs reaching a level of
s.tability, with the U.S. economy reaching close to full employment. Consumer
confidence and business sentiment are generally stable, with the former still above
its long-term average.
On the other hand, inflation has been persistently below the Federal Reserve
Bank's (Fed) target of 2.0%. The sharp decline in oil prices since 2014 has put
additional pressure in an already very low inflation environment. For perspective,
_the price of Brent crude oil was at $115/barrel ln mid-June 2014; since then prices
declined to $38/barrel at the end of 2015, a cumulative 67% decline in the space of
a year and a half.
Concerns about a slowing global economy and deflationary pressures have
troubled investors in 2015. Tumbling oil and other commodity prices have
reinforced investor anxiety over stagnant growth in the Eurozone and Japan, as
well as a deceleration in several emerging-market countries, 'with a particular focus
on China (considered by many analysts as the engine of growth for the global
economy). Global financial markets reacted negatively to these trends in August
and September of 2015, but settled down towards year-end. Since the beginning of
2016, however, broad equity indices (e.g., the S&P 500) across the globe have
suffered significant losses, market volatility has spiked, and credit spreads of U.S.
high-yield bonds over U.S. investment grade corporate bonds continued to widen
substantially'(now affecting companies outside the oil and mining sectors).
This has led global investors to seek safe haven investments, such as securities
issued by the U.S., Germany, and United Kingdom governments, to name a few,
causing sharp declines in government bond yields for these countries. Despite the
fact that ln December 2015 the Fed decided to raise U.S. interest rates for the first
time since the tieginning of the 2008 global financial crisis, financial markets are
now attaching a lower probability of further increases in the near term.
Duff & 'Phelps monitors two additional quantitative models as corroboration of the
qualitative factors discussed above: 1) the Damodaran Implied ERP Model and (2)
the Default Spread Model. Both of these models indicated a higher ERP at the end
of January 2016 relative to our prior recommendation issued back February 2013.
Taken together, we found sufficient support for Increasing our ERP
recommendation relative to our previous recommendation. Accordingly, Duff &
Phelps recommends a U.S. Equity Risk Premium of 5.5% when developing
discount rates as of January 31, 2016 and thereafter, to be used in conjunction with
a normalized risk-free rate of 4.0%.
March 16, 2016 48

Section 06 Appendices
Duff & Phelps I Client Alert March 16, 2016
Attachment BEL-7 Cause No. 44891
Page 49 of52
49
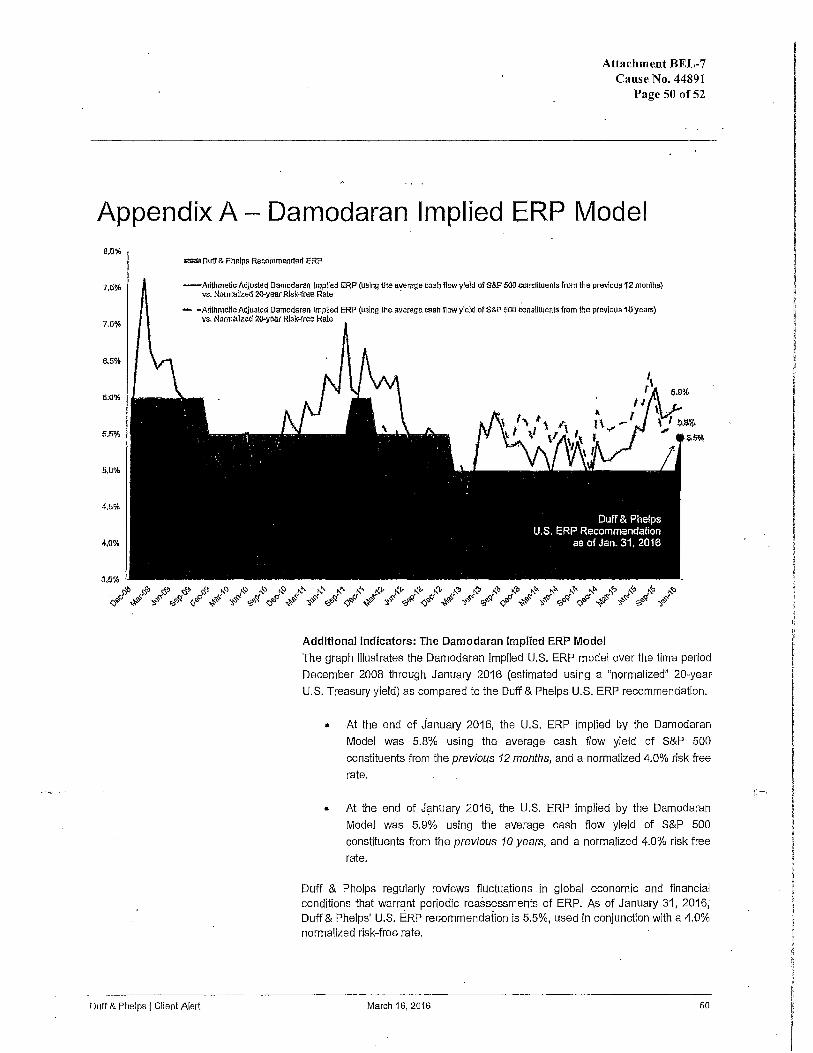
Attachment BEL-7 Cause No. 44891
Page 50 of52
Appendix A Damodaran Implied ERP Model
7,()%
7.<1%
-ouff & Phelps Recommended ERP
-Arithmetic> Adjusted tlamodaron lmplled ERP (using the aveflllle cas!J flow yield ofS&P 500 consll!uenls from !he previous 12 months} vs. Normallzed 20-year Risk-free Rate ·
- •Artlllmella AdJusll:ld oam<tdaran Implied E:RP (11$ing Uie avarage ci:ish !low yleld orS&P 500 consUtuen1s from the prevlou~ 10 years) vs. Norm~Hied 20.y$at Rlak-ffee Rate
Additional Indicators: T.he Damodaran Implied ERP Model
The graph illustrates the Damodaran Implied U.S. ERP model over the time period
December 2008 through January 2016 (estimated using a "normalized" 20-year
U.S. Treasury yield) as compared to the Duff & Phelps U.S. ERP recommendation.
• At the end of January 2016, the U.S. ERP implied by the Damodaran
Model was 5.8% using the average cash flow yield of S&P 500
constituents from the previous 12 months, and a normalized 4.0% risk free
rate.
• At the end of January 2016, the U.S. ERP implied by the Damodaran
Model was 5.9% using the average cash flow yield of S&P 500
constituents from the previous 1 O years, and a normalized 4.0% risk free
rate.
Duff & Phelps regularly reviews fluctuations . in global economic and financial conditions that warrant periodic reassessments of ERP. As of January 31, 2016, Duff & Phelps' U.S. ERP recommendation is 5.5%, used in conjunction with a 4.0% normalized risk-free rate.
Duff & Phelps I Client Alert March 16, 2016 50
1:-.
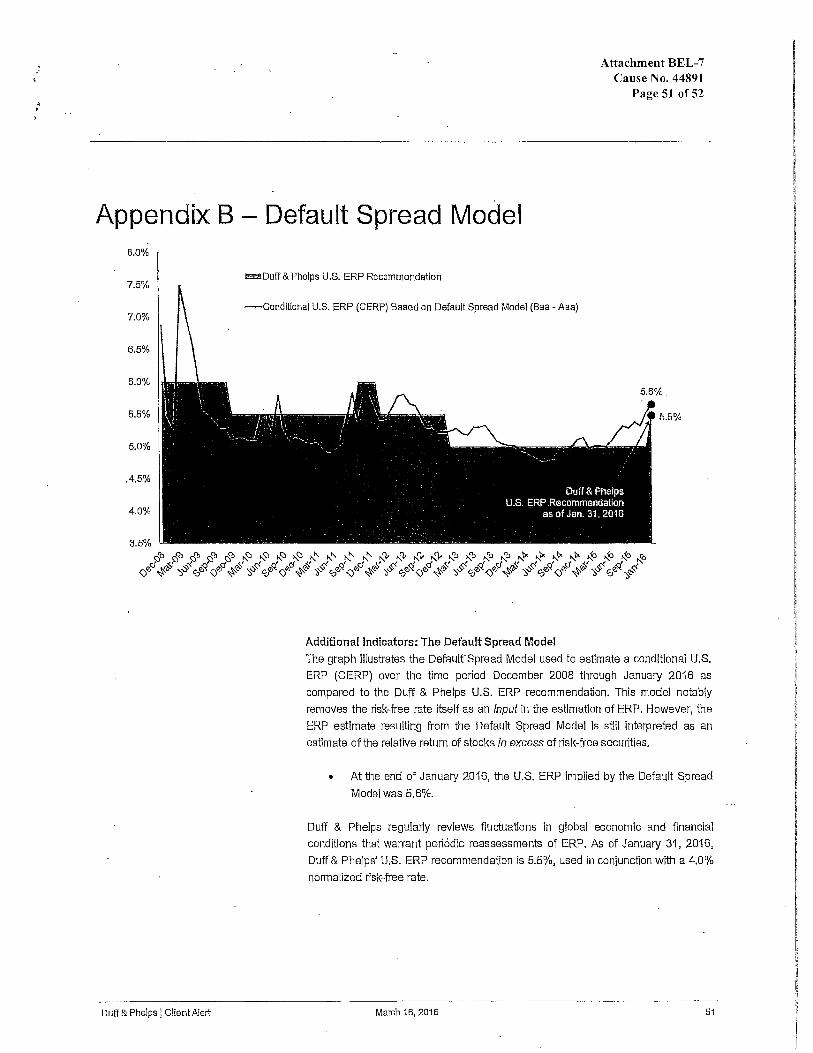
• '
Appendix B 8.0%
7.5%
7.0%
6.5%
6.0%
5.5%
5.0%
.4.5%
4.0%
Duff & Phelps I ClientAlert
'
Default Spread Model
liiii!Ouff& Phelps U.S. ERP Recommendation
-Conditional U.S. ERP (CERP) Based on Default Spread Model (Baa -Aaa)
Additional Indicators: The Default Spread Model
Attachment BEL-7 Cause No. 44891
Page 51 of52
5.5%
The graph illustrates the Default"Spread Model used to estimate a conditional U.S. ERP (CERP) over the time period December 2008 through January 2016 as compared to the Duff & Phelps U.S. ERP recommendation. This model notably removes the risk-free rate itself as an Input in the estimation of ERP. However, the ERP estimate resulting from the Default Spread Model Is still interpreted as an estimate of the relative return of stocks in excess of risk-free securities.
• At the end of January 2016, the U.S. ERP implied by the Default Spread Model was 5.6%.
Duff & Phelps regularly reviews fluctuations in global economic and financial conditions that warrant periodic reassessments of ERP. As of January 31, 2016, Duff & Phelps' U.S. ERP recommendation is 5.5%, used in conjunction with a 4.0% normalized risk-free rate.
March 16, 2016 51
For more information, visit: www.duffandphelps.com\costofcapital
Report Authors Roger J, Grabowski, FASA Managing Director
Carla S. Nunes, CFA Managing Director
James P. Harrington Director
Report Contributors
Kevin Madden Analyst
Attachment BEL-7 Cause No. 44891
Page 52 of52
DUFF&PHELPS
Duff & Phelps is the premier global valuation and corporate finance advisor with expertise in complex valuation, dispute and legal management C<Jnsulting, M&A, restructuring, and compliance and regulatory consulting, The firm's more than 2,000 employees serve a diverse range of clients from offices around the world. For more information, visit WNW.duffandphelps.com.
M&A advlsofY and capital raising services In the United States are provided by Duff & Phelps Securities, LLC. Member FINRNSIPC. Pagemill Partners /s a Division
of Duff & Phelps Securities, LLC. M&A advlsOfY and capital raising services In the United Kingdom and Gennany are provided by Duff & Phelps Securities Lid.,
which ls authorized and regulated by the Financial Conduct Authority.
I I I I
I I I " I i I ' !
I ~ ~ ~ ~
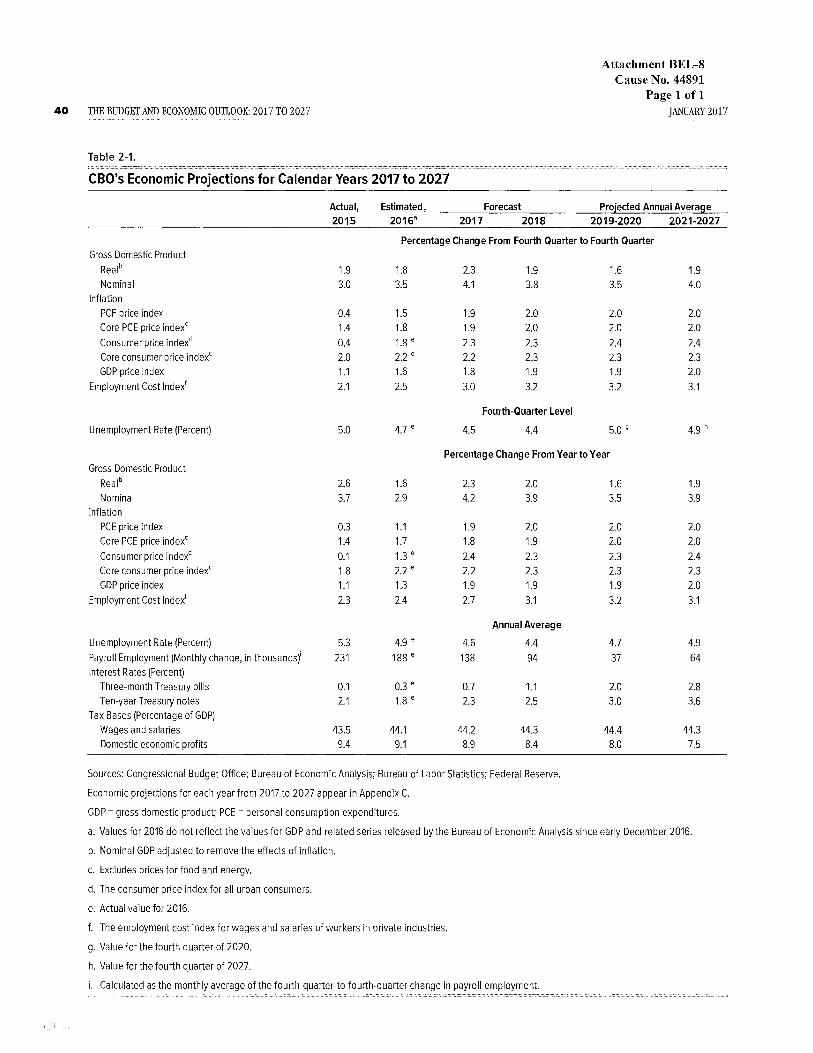
40
'·i
Attachment BEL-8 Cause No. 44891
Page 1of1 THE BUDGET AND ECONOMIC OUTIOOK: 2017 TO 2027 JANUARY 2017
Table 2-1.
CBO's Economic Projections for Calendar Years 2017 to 2027
Actual, Estimated, Forecast Projected Annual Average 2015 2016a 2017 2018 2019-2020 2021-2027
Percentage Change From Fourth Quarter to Fourth Quarter Gross Domestic Product
Rea lb 1.9 1.8 2.3 1.9 1.6 Nominal 3.0 3.5 4.1 3.8 3.5
Inflation PCE price index 0.4 1.5 1.9 2.0 2.0 Core PCE price index' 1.4 1.8 1.9 2.0 2.0 Consumer price indexd 0.4 1.8 e 2.3 2.3 2.4 Core consumer price index' 2.0 2.2 e 2.2 2.3 2.3 GDP price index 1.1 1.6 1.8 1.9 1.9
Employment Cost lndexf 2.1 2.5 3.0 3.2 3.2
Fourth-Quarter Level
Unemployment Rate (Percent) 5.0 4.7 e 4.5 4.4 5.0 g
Percentage Change From Year to Year Gross Domestic Product
Rea lb 2.6 1.6 2.3 2.0 Nominal 3.7 2.9 4.2 3.9
Inflation PCE price index 0.3 1.1 1.9 2.0 Core PCE price index' 1.4 1.7 1.8 1.9 Consumer price indexd 0.1 1.3 e 2.4 2.3 Core consumer price index' 1.8 2.2 e 2.2 2.3 GDP price index 1.1 1.3 1.9 1.9
Employment Cost lndexf 2.3 2.4 2.7 3.1
Annual Average
Unemployment Rate (Percent) 5.3 4.9 e 4.6 4.4 Payroll Employment (Monthly change, in thousandsi 231 188 e 138 94 Interest Rates (Percent)
Three-month Treasury bills 0.1 0.3 e 0.7 1.1 Ten-year Treasury notes 2.1 1.8 e 2.3 2.5
Tax Bases (Percentage of GDP) Wages and salaries 43.5 44.1 44.2 44.3 Domestic economic profits 9.4 9.1 8.9 8.4
Sources: Congressional Budget Office; Bureau of Economic Analysis; Bureau of Labor Statistics; Federal Reserve.
Economic projections for each year from 2017 to 2027 appear in Appendix C.
GDP= gross domestic product; PCE =personal consumption expenditures.
1.6 3.5
2.0 2.0 2.3 2.3 1.9 3.2
4.7 37
2.0 3.0
44.4 8.0
1.9 4.0
2.0 2.0 2.4 2.3 2.0 3.1
4.9 h
1.9 3.9
2.0 2.0 2.4 2.3 2.0 3.1
4.9 64
2.8 3.6
44.3 7.5
a. Values for 2016 do not reflect the values for GDP and related series released by the Bureau of Economic Analysis since early December 2016.
b. Nominal GDP adjusted to remove the effects of inflation.
c. Excludes prices for food and energy.
d. The consumer price index for all urban consumers.
e. Actual value for 2016.
f. The employment cost index for wages and salaries of workers in private industries.
g. Value for the fourth quarter of 2020.
h. Value for the fourth quarter of 2027.
i. Calculated as the monthly average of the fourth-quarter-to-fourth-quarter change in payroll employment.
WILEY
Customer Care Department: U.S. (800) 762-2974 International (317) 572-3993
Attachment BEL-9
Market 13t~tfft~4891 Pag;e l of23
Through 20 1 6
Preview Version
2017 SBBI Yearbook + l s, 8
(P ew
I. I! r.' I.~)-
' tio
U.S. Capital Markets Performance by Asset Class 1926-2016
This document is an abbreviated "Preview Version" of the key year-end (December 31, 2016) U.S. capital markets data available in the hardcover 207 7 Stocks, Bonds, Bills, and Inflation (SBBI) Yearbook ("207 7 SBBI Yearbook").
This document is made available to purchasers who have pre-ordered the 207 7 SBBI Yearbook. The purpose of this document is to provide key year-end 2016 U.S. capital markets data to pre-order purchasers while the hardcover 207 7 SBBI Yearbook is being printed.
WILEY DUFF PHELPS
Cover image: Duff & Phelps Cover design: James Harrington
Published by John Wiley & Sons, Inc., Hoboken, New Jersey.
Copyright © 2017 by John Wiley & Sons, Inc. All rights reserved. Published simultaneously in Canada.
Attachment BEL-9 Cause No. 44891
Page2 of23
No part of this publication may be reproduced, stored in a retrieval system, or transmitted in any form or by any means, electronic, mechanical, photocopying, recording, scanning, or otherwise, except as permitted under
Section 107 or 108 of the 1976 United States Copyright Act, without either the prior written permission of the Publisher, or authorization through payment of the appropriate per-copy fee to the Copyright Clearance Center, Inc., 222 Rosewood Drive, Danvers, MA 01923, (978) 750-8400, fax (978) 646-8600, or on the Web at
www.copyright.com. Requests to the Publisher for permission should be addressed to the Permissions Department, John Wiley & Sons, Inc., 111 River Street, Hoboken, NJ 07030, (201) 7 48-6011, fax (201) 7 48-6008,
or online at http://www.wiley.com/go/permissions.
The foregoing does not preclude end-users from using the 207 7 Stocks, Bills, Bonds, and Inflation (SBBJ) Yearbook and data published therein in connection with their internal business operations.
Limit of Liability/Disclaimer of Warranty: While the publisher and author have used their best efforts in preparing this book, they make no representations or warranties with respect to the accuracy or completeness of the contents of this book and specifically disclaim any implied warranties of merchantability or fitness for a particular purpose. No warranty may be created or extended by sales representatives or written sales materials. The advice and strategies contained herein may not be suitable for your situation. You should consult with a professional where appropriate. Neither the publisher nor author shall be liable for any loss of profit or any other commercial damages, including but not limited to special, incidental, consequential, or other damages.
For general information on our other products and services or for technical support, please contact our Customer Care Department within the United States at (800) 762-297 4, outside the United States at (317) 572-3993 or fax (317) 572-4002.
Wiley publishes in a variety of print and electronic formats and by print-on-demand. Some material included
with standard print versions of this book may not be included in e-books or in print-on-demand. If this book refers to media such as a CD or DVD that is not included in the version you purchased, you may download this
material at http://booksupport.wiley.com. For more information about Wiley products, visit www.wiley.com.
ISBN 978-1-119-36667-6 (Hardcover) ISBN 978-1-119-36714-7 (ePDF)
Printed in the United States of America 10 9 8 7 6 5 4 3 2 1
About the Data
Attachment BEL-9 Cause No. 44891
Page3 of23
The information and data presented in the 2017 Stocks, Bonds, Bills, and Inflation® (SBBJ®) Yearbook ("2017 SBBI Yearbook') has been obtained with the greatest of care from sources believed to be reliable, but is not guaranteed to be complete, accurate, or timely. Duff & Phelps, LLC (www.duffandphelps.com) and/or its data providers expressly disclaim any liability, including incidental or consequential damages, arising from the use of the 207 7 SBBI Yearbook or any errors or omissions that may be contained in the 2017 SBBI Yearbook, or any other product (existing or to be developed) based upon the methodology and/or data published herein. One of the primary sources of raw data used to produce the derived data and information herein is Morningstar, Inc. Use of raw data from Morningstar, Inc .. to produce the information herein does not necessarily constitute agreement by Morningstar, Inc. of any investment philosophy or strategy presented in this publication. "Stocks, Bonds, Bills, and Inflation" and "SBBI" are registered trademarks of Morningstar, Inc. All rights reserved. Used with permission.
2017 SBBI Yearbook (Preview Version) 3
About Duff and Phelps
Attachment BEL-9 Cause No. 44891
Page 4 of23
Duff & Phelps is the premier global valuation and corporate finance advisor with expertise in complex valuation, disputes and investigations, M&A, real estate, restructuring, and compliance and regulatory consulting. The firm's more than 2,000 employees serve a diverse range of clients from offices around the world. For more information, visit www.duffandphelps.com.
M&A advisory, capital raising and secondary market advisory services in the United States are provided by Duff & Phelps Securities, LLC. Member Fl NRA/Sf PC. Pagemill Partners is a Division of Duff & Phelps Securities, LLC. M&A advisory and capital raising advisory services are provided in a number of European countries through Duff & Phelps Securities Ltd, UK, which includes branches in Ireland and Germany. Duff & Phelps Securities Ltd, UK, is regulated by the Financial Conduct Authority.
2017 SBBI Yearbook (Preview Version) 4
Additional Resources
Attachment BEL-9 Cause No. 44891
Page 5 of23
Duff & Phelps authors five books that focus on U.S. and international valuation theory, dafa, and risk premia
(e.g., equity risk premia, risk-free rates, size premia, industry risk premia, betas, industry multiples and other
statistics, etc.) for use in valuation models.
Duff & Phelps produces one book that focuses on U.S. capital markets performance data (i.e., the history of
returns of the capital markets in the U.S. from 1926 to the present). This resource, the Stocks, Bonds, Bills, and Inflation® (SBBI®) Yearbook, has been published for over 30 years.1 The SBBI Yearbook does not provide
extensive valuation data or methodology.2
The six books are:3
U.S. and International Valuation Theory and Data
• Cost of Capital: Applications and Examples (5th edition) • Valuation Handbook - U.S. Guide to Cost of Capital • Valuation Handbook - U.S. Industry Cost of Capital • Valuation Handbook - International Guide to Cost of Capital • Valuation Handbook - International Industry Cost of Capital
U.S. Capital Markets Performance Data
• Stocks, Bonds, Bills, and Inflation (SBBI) Yearbook
All six Duff & Phelps books are published by John Wiley & Sons (Hoboken, NJ). Each of the six books is
summarized in the following sections.
1 "Stocks, Bonds, Bills, and Inflation" and "SBBI" are registered trademarks of Morningstar, Inc. All rights reserved. Used with permission. 2 Morningstar previously published two "Ibbotson SBBI" yearbooks: (i) The SBBI "Classic" Yearbook, which is now produced by Duff & Phelps and
published by John Wiley & Sons as the "SBBI Yearbook" starting in 2016 (the word "Classic" was dropped from the title), and (ii) the SBBI "Valuation" Yearbook, which was discontinued by Morningstar in 2013. The former SBBI Valuation Yearbook was replaced by the Valuation Handbook - U.S. Guide to Cost of Capital, also produced by Duff & Phelps and published by John Wiley & Sons, starting in 2014.
3 In years 2014 through 2016, the four books comprising the Valuation Handbook series were named as follows: Valuation Handbook - Guide to Cost of Capital, Valuation Handbook - Industry Cost of Capital, International Valuation Handbook - Guide to Cost of Capital, and International Valuation Handbook - Industry Cost of Capital. Starting with the 2017 Valuation Handbook editions, the names of the four books were changed to: Valuation Handbook - U.S. Guide to Cost of Capital, Valuation Handbook - U.S. Industry Cost of Capital, Valuation Handbook - International Guide to Cost of Capital, and Valuation Handbook - International Industry Cost of Capital, respectively. For simplicity, in all 2017 books, intra-year updates, marketing materials, online tools, etc., the new names are used (even when referring to pre-2017 editions).
2017 S881 Yearbook (Preview Version) 5

Cost of Capital: Applications and Examples 5th edition
Attachment BEL-9 Cause No. 44891
Page 6 of23
To learn more about the latest theory and practice in cost of capital estimation, see Cost of Capital: Applications and Examples 5th edition, by Shannon P. Pratt and Roger J. Grabowski (John Wiley & Sons, Inc., 2014).
The Cost of Capital: Examples and Applications, 5th Edition is the authoritative, comprehensive overview of valuation theory, best practices, and proper use of data. This book puts an emphasis on practical application.
The Cost of Capital: Applications and Examples 5th edition is a one-stop shop for background and current thinking on the development and uses of rates of return on capital. This book contains expanded materials on
estimating the basic building blocks of the cost of equity capital, the risk-free rate, and equity risk premium, plus in-depth discussion of the volatility created by the 2008 financial crisis, the subsequent recession and uncertain recovery, and how those events have fundamentally changed how we need to interpret the inputs to the models we use to develop these estimates.
The Cost of Capital: Applications and Examples 5th edition includes case studies providing comprehensive
discussion of cost of capital estimates for valuing a business and damages calculations for small and mediumsized businesses, cross-referenced to the chapters covering the theory and data. This book puts an emphasis
on practical application. To that end, this updated edition provides readers with exclusive access to a companion website filled with supplementary materials, allowing you to continue to learn in a hands-on fashion long after closing the book.
The Cost of Capital: Applications and Examples has been published since 1998, and is updated every three to four years. The 6th edition of this book is scheduled to be available in early 2018.
"Shannon Pratt and Roger Grabowski have produced a remarkably comprehensive review of the subject...it is a work that valuation practitioners, CFOs, and others will find an invaluable reference."
- Professor Richard Brealey, Emeritus Professor of Finance, London Business School (from the Foreword)
"Estimating the cost of capital is critical in determining the valuation of assets, in evaluating the capital structure of corporations, and in estimating the long-run expected return of investments. Shannon Pratt and Roger Grabowski have the most thorough text on the subject, not only providing various estimation methods, but also numerous ways to use the cost of capital."
- Professor Roger G. Ibbotson, Professor Emeritus of Finance at the Yale School of Management, Chairman and Chief Investment Officer of Zebra Capital LLC, and former Chairman and founder of Ibbotson Associates, now part of Morningstar, Inc.
2017 SBBI Yearbook (Preview Version) 6

Valuation Handbook - U.S. Guide to Cost of Capital
Attachment BEL-9 Cause No. 44891
Page 7 of23
This annual book includes the U.S. cost of capital data inputs (equity risk premia, size premia, industry risk
premia, risk premia over the risk-free rate, risk-free rates) that were previously published in the
Morningstar/lbhotson Stocks, Bonds, Bills, and Inflation (SBBI) Valuation Yearbook and the Duff & Phelps Risk Premium Report.
The Valuation Handbook - U.S. Guide to Cost of Capital can be used to develop cost of equity capital estimates
(using both the build-up method and CAPM) for an individual business, business ownership interest, security, or
intangible asset. Includes many examples for using the data properly.
The Valuation Handbook - U.S. Guide to Cost of Capital has been published since 2014, and is updated annually
with data through December 31 of the previous year (e.g., the 207 4 Valuation Handbook - U.S. Guide to Cost of Capital is "data through" December 31, 2013; the 207 5 Valuation Handbook - U.S. Guide to Cost of Capital is
"data through" December 31, 2014. etc.). This book includes three optional intra-year quarterly updates (March,
June, and September).
Valuation Handbook - U.S. Industry Cost of Capital
This annual book provides industry-level cost of capital estimates (cost of equity capital, cost of debt capital,
and weighted average cost of capital, or WACC), plus detailed industry-level statistics for sales, market
capitalization, capital structure, various levered and unlevered beta estimates (e.g., ordinary-least squares (OLS)
beta, sum beta, peer group beta, downside beta, etc.), valuation (trading) multiples, financial and profitability
ratios, equity returns, aggregate forward-looking earnings-per share (EPS) growth rates, and more. Over 300
critical industry-level data points are calculated for approximately 180 U.S. industries (depending on data
availability). Industries are organized by standard industrial classification (SIC) code.
The Valuation Handbook - U.S. Industry Cost of Capital can be used to benchmark, augment, and support the
analyst's own custom analysis of the industry in which a subject business, business ownership interest,
security, or intangible asset resides.
The Valuation Handbook - U.S. Industry Cost of Capital has been published since 2014, and is updated annually
with data through March 31 of the current year (e.g., the 2074 Valuation Handbook - U.S. Industry Cost of Capital is "data through" March 31, 2014; the 207 5 Valuation Handbook - U.S. Industry Cost of Capital is "data
through" March 31, 2015, etc.). This book includes three optional intra-year quarterly updates (June, September,
and December).
2017 SBBI Yearbook (Preview Version) 7
Valuation Handbook - International Guide to Cost of Capital
Attachment BEL-9 Cause No. 44891
Page 8 of23
This annual book provides country-level equity risk premia (ERPs), relative volatility (RV) factors, and country risk premia (CRPs).
This book can be used to estimate country-level cost of equity capital globally, for up to 188 countries, from the perspective of investors based in any one of up to 56 countries (depending on data availability).
The Valuation Handbook - International Guide to Cost of Capital has been published since 2014, and is updated annually with data through December of the previous year and March of the current year (e.g., the 2074 Valuation Handbook - International Guide to Cost of Capital is "data through" December 31, 2013 and March 31, 2014; the 207 5 Valuation Handbook - International Guide to Cost of Capital is "data through" December 31, 2014 and March 31, 2015 etc.). This book includes one optional semi-annual update with data through June and September.
"Measuring the impact of country risk in determining the international cost of capital is one of the most vexing issues in finance. Any company doing international cost of capital estimation must, at minimum, consult the International Valuation Handbook - Guide to Cost of Capital".
- Campbell R. Harvey, Professor of International Business at the Fuqua School of Business, Duke University
Valuation Handbook - International Industry Cost of Capital
This annual book provides the same type of rigorous industry-level analysis published in the U.S.-centric Valuation Handbook - U.S. Industry Cost of Capital, on a global scale.
This book includes industry-level analyses for four global economic areas: (i) the "World," (ii) the European Union, (iii) the Eurozone, and (iv) the United Kingdom. 4 Industries in the book are identified by their Global Industry Classification Standard (GICS) code. Each of the four global economic area's industry analyses are presented in three currencies: (i) the euro (€or EUR), (ii) the British pound (£or GBP), and (iii) the U.S. dollar($ or
USD).
This annual book provides industry level cost of capital estimates (cost of equity capital, cost of debt capital,
and weighted average cost of capital, or WACC), plus detailed industry-level statistics for sales, market capitalization, capital structure, various levered and unlevered beta estimates (e.g., ordinary-least squares (OLS) beta, sum beta, peer group beta, downside beta, etc.), valuation (trading) multiples, financial and profitability ratios, equity returns, aggregate forward-looking earnings-per share (EPS) growth rates, and more. Over 300 critical industry-level data points are calculated for each industry (depending on data availability). Industries are organized by global industry classification standard (GICS) code.
4 In the Valuation Handbook - International Industry Cost of Capital, "World" companies are defined as companies that (i) are components of the MSCI ACWI IMI, and (ii) satisfy the rigorous screening requirements that are employed to define the company sets used therein.
2017 SBBI Yearbook (Preview Version) 8
Attachment BEL-9 Cause No. 44891
Page 9 of23 The Valuation Handbook - International Industry Cost of Capital can be used to benchmark, augment, and
support the analyst's own custom analysis of the industry in which a subject business, business ownership
interest, security, or intangible asset resides.
The Valuation Handbook - International Industry Cost of Capital has been published since 2015, and is updated
annually with data through March 31 of the current year (e.g., the 2015 Valuation Handbook - International Industry Cost of Capital is "data through" March 31, 2015; the 2016 Valuation Handbook - International Industry Cost of Capital is "data through" March 31, 2016, etc.). This book includes one optional semi-annual update with
data through September.
To learn more about cost of capital issues, and to ensure that you are using the most recent Duff & Phelps
Recommended ERP, visit www.duffandphelps.com/CostofCapital.
Stocks, Bonds, Bills, and Inflation (SBBI) Yearbook
This annual book has been the definitive annual resource for historical U.S. capital markets performance data
for over 30 years.
Starting with the 2016 edition, the Stocks, Bonds, Bills, and Inflation (SBBI) Yearbook is now produced by Duff &
Phelps and published by John Wiley & Sons. The SBBI Yearbook was previously published by Morningstar, Inc.
under the name "Ibbotson Stocks, Bonds, Bills, and Inflation (SBB/) Classic Yearbook". 5
This book includes returns, index values, and statistical analyses of U.S. large company stocks, small company
stocks, long-term corporate bonds, long-term government bonds, intermediate-term government bonds, U.S.
Treasury bills, and inflation from January 1926 to present (monthly).
Anyone serious about investments or investing needs an appreciation of capital market history. Such an
appreciation, which can be gained from this book, is equally valuable to the individual and institutional investor,
practitioners and scholars in finance, economics, and business; portfolio strategists; and security analysts
seeking to benchmark their own investment performance. The SBBI Yearbook is a thinking person's guide to
using historical data to understand the financial markets and make decisions.
5 The SBB/ Yearbook was published by Morningstar, Inc. from 2007 through 2015, and by Ibbotson Associates in years prior to 2007.
2017 S881 Yearbook (Preview Version) 9
Purchasing Information
U.S. and International Valuation Theory and Data
• Cost of Capital: Applications and Examples (5th edition) ·Valuation Handbook - U.S. Guide to Cost of Capital ·Valuation Handbook - U.S. Industry Cost of Capital • Valuation Handbook - International Guide to Cost of Capital • Valuation Handbook - International Industry Cost of Capital
To order Duff & Phelps valuation data resources published by John Wiley & Sons, please visit
www.wiley.com/go/ValuationHandbooks, or call: U.S. (800) 762-297 4 International (317) 572-3993 or fax (317) 572-4002.
U.S. Capital Markets Performance Data
• Stocks, Bonds, Bills, and Inflation (SBBI) Yearbook
Attachment BEL-9 Cause No. 44891
Page 10 of23
To order additional copies of the SBBI Yearbook, please visit www.wiley.com/go/sbbiyearbook, or call:
U.S. (800) 762-2974 International (317) 572-3993 or fax (317) 572-4002.
2017 SBBI Yearbook (Preview Version) 10
Table of Contents
Results for 2016 Capital Markets
Exhibit 1: Wealth Indexes of Investments in the U.S. Capital Markets
Exhibit 2: Basic Series: Annual Total Returns in Percent
Exhibit 3: Portfolios: Annual Total Returns in Percent
Exhibit 4: Basic Series: Monthly and Quarterly Returns in Percent
Exhibit 5: Portfolios: Monthly and Quarterly Returns in Percent
Exhibit 6: Basic Series: Monthly Index Values
Exhibit 7: Portfolios: Monthly Index Values
Exhibit 8: Basic Series and Portfolios: Summary Statistics of Annual Total Returns in Percent
Exhibit 9: Derived Series: Monthly and Quarterly Returns in Percent
Exhibit 10: Derived Series: Monthly Index Values
2017 SBBI Yearbook (Preview Version)
Attachment BEL-9 Cause No. 44891
Page 11 of23
12
14
15
16
17
18
19
20
21
22
23
11
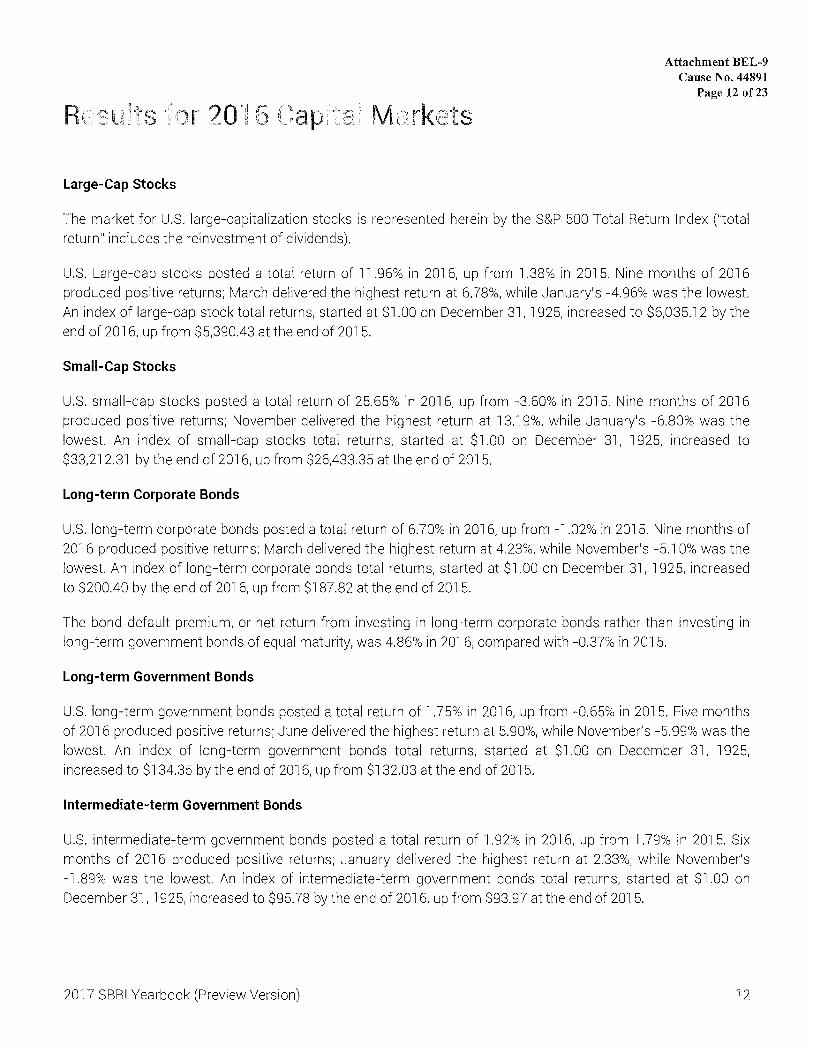
Results for 2016 Capital Markets
Large-Cap Stocks
Attachment BEL-9 Cause No. 44891
Page 12 of23
The market for U.S. large-capitalization stocks is represented herein by the S&P 500 Total Return Index ("total return" includes the reinvestment of dividends).
U.S. Large-cap stocks posted a total return of 11.96% in 2016, up from 1.38% in 2015. Nine months of 2016 produced positive returns; March delivered the highest return at 6.78%, while January's -4.96% was the lowest. An index of large-cap stock total returns, started at $1.00 on December 31, 1925, increased to $6,035.12 by the end of 2016, up from $5,390.43 at the end of 2015.
Small-Cap Stocks
U.S. small-cap stocks posted a total return of 25.65% in 2016, up from -3.60% in 2015. Nine months of 2016 produced positive returns; November delivered the highest return at 13.19%, while January's -6.80% was the lowest. An index of small-cap stocks total returns, started at $1.00 on December 31, 1925, increased to $33,212.31 by the end of 2016, up from $26,433.35 at the end of 2015.
Long-term Corporate Bonds
U.S. long-term corporate bonds posted a total return of 6.70% in 2016, up from -1.02% in 2015. Nine months of 2016 produced positive returns; March delivered the highest return at 4.23%, while November's -5. l 0% was the lowest. An index of long-term corporate bonds total returns, started at $1.00 on December 31, 1925, increased to $200.40 by the end of 2016, up from $187.82 at the end of 2015.
The bond default premium, or net return from investing in long-term corporate bonds rather than investing in long-term government bonds of equal maturity, was 4.86% in 2016, compared with -0.37% in 2015.
Long-term Government Bonds
U.S. long-term government bonds posted a total return of 1.75% in 2016, up from -0.65% in 2015. Five months of 2016 produced positive returns; June delivered the highest return at 5.90%, while November's -5.99% was the lowest. An index of long-term government bonds total returns, started at $1.00 on December 31, 1925, increased to $134.35 by the end of 2016, up from $132.03 at the end of 2015.
Intermediate-term Government Bonds
U.S. intermediate-term government bonds posted a total return of 1.92% in 2016, up from 1.79% in 2015. Six months of 2016 produced positive returns; January delivered the highest return at 2.33%, while November's -1.89% was the lowest. An index of intermediate-term government bonds total returns, started at $1.00 on December 31, 1925, increased to $95.78 by the end of 2016, up from $93.97 at the end of 2015.
2017 SBBI Yearbook (Preview Version) 12
Treasury Bills
Attachment BEL-9 Cause No. 44891
Page 13 of23
U.S. Treasury bills posted a total return of 0.20% in 2016, up from the 0.02% posted in 2015. All 12 months of 2016 produced positive returns; December delivered the highest return at 0.02534%, while January's 0.00604%
was the lowest. An index of Treasury Bills total returns, started at $1.00 on December 31, 1925, increased to $20.63 by the end of 2016, up from $20.59 at the end of 2015.
lnflation6
Inflation increased to 2.07% in 2016, compared to 0.73% in 2015. The result is lower than the long-term historical annual average (1926-2016) of 3.0%. Inflation has remained below 5% for 34 of the last 35 years (the exception was the 6.11 % rate in 1990). A cumulative inflation index, beginning at $1.00 at year-end 1925,
finished 2016 at $13.47, up from $13.20 at year-end 2015. That is, a "basket" of consumer goods and services that cost $1.00 in 1925 would cost $13.47 today. The two baskets are not identical, but are intended to be comparable.
6 The inflation rate used for the single month of December 2015 in last year's 207 6 SBB/ Yearbook (0.00105760) was an estimate in the data provider's database. The value has been revised to -0.00341710, representing a difference of -0.00447 470, or -0.4%. We use the revised December 2015 value in all calculations in the 207 7 SBBI Yearbook; this may cause slight differences in year-end 2015 inflation calculations as appeared in the 207 6 SBBJ Yearbook when compared to year-end 2015 inflation calculations as appear in the 207 7 SBBJ Yearbook. For example, the annual inflation rate reported for calendar year (January-December) 2015 in last year's 207 6 SBBI Yearbook was 1.18% using the estimated December 2015 value, but the annual inflation rate reported for calendar year (January-December) 2015 is reported as 0.73% in the 207 7 SBBI Yearbook using the revised December 2015 value. Longer-term statistics are unaffected (e.g., the long-term 1926-2015 average annual inflation rate (2.98%) is identical using both the estimated and the revised December 2015 monthly value). This issue does not recur in the 207 7 SBBJ Yearbook; the inflation rate used for the single month of December 2016 herein is not an estimate; it is taken directly from the United States Department of Labor, Bureau of Labor Statistics, Consumer Price Index for All Urban Consumers, or CPl-U, not seasonally adjusted, at https://www.bls.gov/cpi/.
2017 SBBI Yearbook (Preview Version) 13
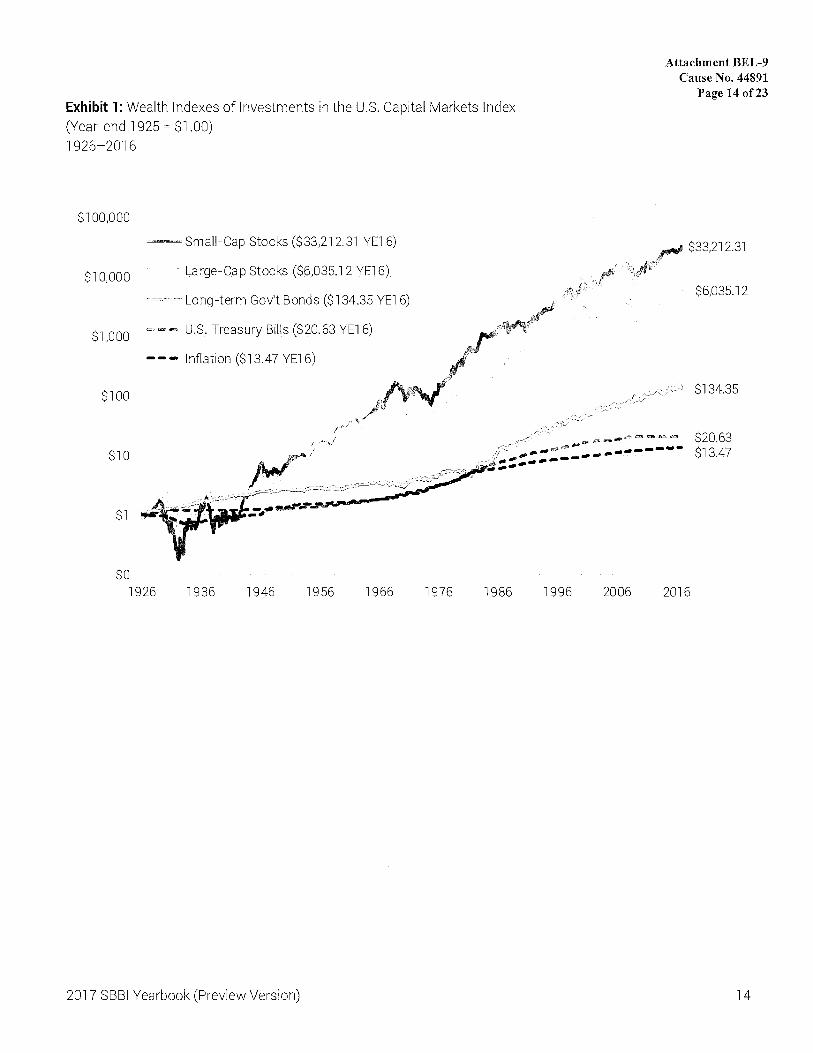
Exhibit 1: Wealth Indexes of Investments in the U.S. Capital Markets Index
(Year-end 1925 = $1.00)
1926-2016
$100,000
-small-Cap Stocks ($33,212.31YEl6)
$10,000 -~<HQ~-Qap_StQGkS ($(?,Q~5.12YE:J6)
- Long-term Gov't Bonds ($134.35 YEl 6)
$1,000 --- lJ .. s .. Tr~cisury Bil[~ ($2_0,§3 YE:l 6)
--- Inflation ($13.47 YE16)
$100
$10
$1
$0 1926 1936 1946
2017 SBBI Yearbook (Preview Version)
1956 1966 1976 1986 1996 2006
Attachment BEL-9 Cause No. 44891
Page 14 of23
$33,212.31
2016
$6,035.12
$134.35
$20.63 $13.47
14
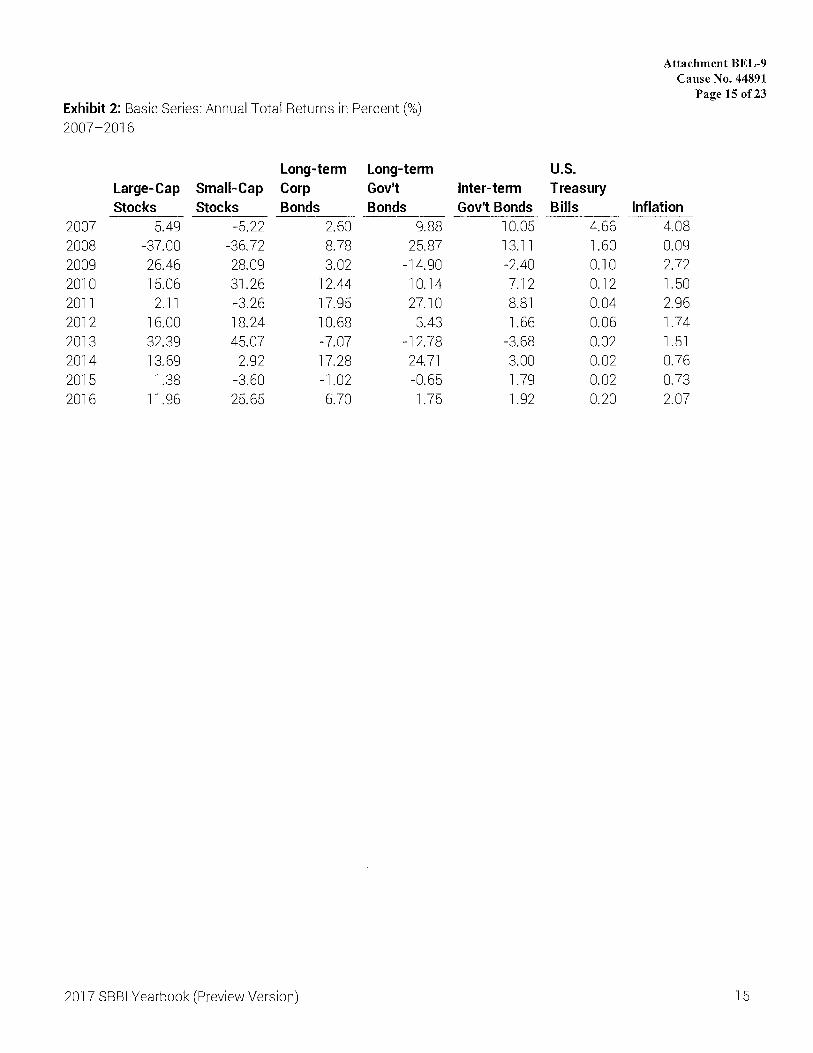
Attachment BEL-9 Cause No. 44891
Page 15 of23 Exhibit 2: Basic Series: Annual Total Returns in Percent(%) 2007-2016
Long-term ·Long-term U.S. Large-Cap Small-Cap Corp Gov't Inter-term Treasury Stocks Stocks Bonds Bonds Gov't Bonds Bills Inflation
2007 5.49 -5.22 2.60 9.88 10.05 4.66 4.08 2008 -37.00 -36.72 8.78 25.87 13.11 1.60 0.09 2009 26.46 28.09 3.02 -14.90 -2.40 0.10 2.72 2010 15.06 31.26 12.44 10.14 7.12 0.12 1.50 2011 2.11 -3.26 17.95 27.10 8.81 0.04 2.96 2012 16.00 18.24 10.68 3.43 1.66 0.06 1.74 2013 32.39 45.07 -7.07 -12.78 -3.68 0.02 1.51 2014 13.69 2.92 17.28 24.71 3.00 0.02 0.76 2015 1.38 -3.60 -1.02 -0.65 1.79 0.02 0.73 2016 11.96 25.65 6.70 1.75 1.92 0.20 2.07
2017 SBBI Yearbook (Preview Version) 15
Attachment BEL-9 Cause No. 44891
Page 16 of23 Exhibit 3: Portfolios: Annual Total Returns in Percent(%) 2007-2016
100% Long-100% Large term Gov't
Stocks 90/10 70/30 50/50 30170 10/90 Bonds 2007 5.49 6.03 7.03 7.95 8.79 9.54 9.88 2008 -37.00 -32.14 -21.55 -9.72 3.43 18.02 25.87 2009 26.46 21.86 12.97 4.49 -3.58 -11.23 -14.90 2010 15.06 14.97 14.52 13.70 12.53 11.02 10.14 2011 2.11 4.69 9.81 14.88 19.85 24.72 27.10 2012 16.00 14.86 12.48 10.00 7.43 4.78 3.43 2013 32.39 27.14 17.16 7.85 -0.84 -8.94 -12.78 2014 13.69 14.80 17.03 19.24 21.44 23.62 24.71 2015 1.38 1.35 1.18 0.84 0.36 -0.28 -0.65 2016 11.96 11.04 9.13 7.13 5.04 2.87 1.75
2017 SBBI Yearbook (Preview Version) 16
Exhibit 4: Basic Series: Monthly and Quarterly Returns in Percent(%)
Large-cap Stocks ~w--•----
2016 Capital Monthly Total Income Appreciation Total Total Returns Return Return Return Return Return Dec-15 -1.58 0.18 -1.75 -4.90 0.00
Jan-16 -4.96 0.11 -5.07 -6.80 0.67
Feb-16 -0.13 0.28 -0.41 1.10 2.32
Mar-16 6.78 0.18 6.60 7.08 4.23
Ap1·-15 0.39 0.12 0.27 1.08 1.46
May-16 1.80 0.26 1.53 1.07 0.16
Jun-16 0.26 0.17 0.09 -0.17 3.77
Jul-16 3.69 0.13 3.56 5.02 2.45
Aug-16 0.14 0.26 -0.12 1.59 0.16
Sep-16 0.02 0.14 -0.12 0.72 -1.19
Oct-16 -1.82 0.12 -1.94 -3.53 -2.63
Nov-16 3.70 0.29 3.42 13.19 -5.10
Dec-16 1.98 0.16 1.82 4.06 0.59
2016 Annual Returns 2016 11.96 2.26 9.54 25.65 6.70
2016 Quarterly Returns 01-16 1.35 0.55 0.77 0.90 7.36
02-16 2.46 0.55 1.90 1.99 5.46
03-16 3.85 0.54 3.31 7.46 1.39
04-16 3.82 0.56 3.25 13.63 -7.05
2017 SBBI Yearbook (Preview Version)
U.S. long-terrn Intermediate-term Gov't bonds Gov't bondt; Bilis -"·-.---"--·~·"-----~~---"----~-----·-- --~-------~--~-·------····-· ··----"""'- ~----·-·-"·- -··,·-··-··-----
Capital Capital Total Income Appreciation Total Income Appreciation
Return Return Return Return Return Return -0.22 0.22 -0.44 -0.17 0.14 -0.31 4.76 0.21 4.55 2.33 0.15 2.18 2.94 0.20 2.75 0.57 0.12 0.45
-0.03 0.18 -0.22 0.45 0.11 0.34 -0.53 0.17 -0.70 -0.10 0.10 -0.20 0.82 0.20 0.63 -0.21 0.11 -0.33
5.90 0.18 5.72 1.75 0.11 1.64 0.81 0.14 0.66 0.04 0.08 -0.04
-1.40 0.16 -1.56 -0.64 0.09 -0.74 -1.24 0.15 -1.40 0.27 0.10 0.17 -3.14 0.16 -3.31 -0.52 0.10 -0.62 -5.99 0.18 -6.16 -1.89 0.11 -1.99 -0.57 0.22 -0.79 -0.07 0.15 -0.22
1.75 2.30 -0.40 1.92 1.36 0.58
7.80 0.61 7.18 3.38 0.39 2.99 6.21 0.55 5.64 1.43 0.32 1.10
-1.85 0.45 -2.29 -0.34 0.27 -0.61 -9.46 0.53 -9.98 -2.47 0.35 -2.81
Total Return
0.01
0.01 0.02
0.02
0.01 0.01
0.02
0.02 0.02 0.02 0.02
0.01
0.03
0.20
0.05 0.04
0.06 0.06
Rate -0.34
0.17 0.08
0.43 0.47
0.40 0.33
-0.16
0.09 0.24 0.12
-0.16
0.03
2.07
0.68 1.21
0.17 0.00
~ (j ...... I» ~
'"d = =I» ~ s ~ ~ ~ ...... p ...... ¥-,"""" C:l d I""- i'"l ..... QO t"' N\01 (;; ...... \a
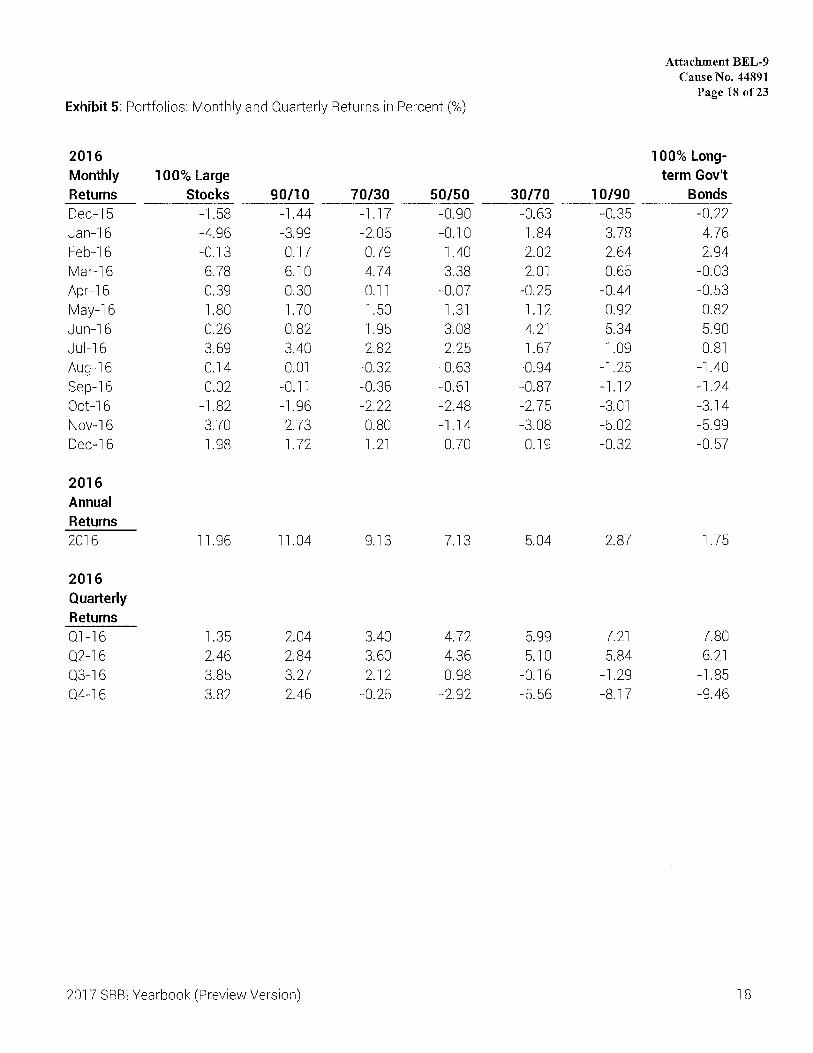
Attachment BEL-9 Cause No. 44891
Page 18 of23 Exhibit 5: Portfolios: Monthly and Quarterly Returns in Percent (%)
2016 100% Long-Monthly 100% Large term Gov't Returns Stocks 90/10 70/30 50/50 30/70 10/90 Bonds Dec-15 -1.58 -1.44 -1.17 -0.90 -0.63 -0.35 -0.22 Jan-16 -4.96 -3.99 -2.05 -0.10 1.84 3.78 4.76 Feb-16 -0.13 0.17 0.79 1.40 2.02 2.64 2.94 Mar-16 6.78 6.10 4.74 3.38 2.01 0.65 -0.03 Apr-16 0.39 0.30 0.11 -0.07 -0.25 -0.44 -0.53
May-16 1.80 1.70 1.50 1.31 1.12 0.92 0.82 Jun-16 0.26 0.82 1.95 3.08 4.21 5.34 5.90 Jul-16 3.69 3.40 2.82 2.25 1.67 1.09 0.81 Aug-16 0.14 -0.01 -0.32 -0.63 -0.94 -1.25 -1.40 Sep-16 0.02 -0.11 -0.36 -0.61 -0.87 -1.12 -1.24
Oct-16 -1.82 -1.96 -2.22 -2.48 -2.75 -3.01 -3.14 Nov-16 3.70 2.73 0.80 -1.14 -3.08 -5.02 -5.99 Dec-16 1.98 1.72 1.21 0.70 0.19 -0.32 -0.57
2016 Annual Returns 2016 11.96 11.04 9.13 7.13 5.04 2.87 1.75
2016 Quarterly Returns 01-16 1.35 2.04 3.40 4.72 5.99 7.21 7.80 02-16 2.46 2.84 3.60 4.36 5.10 5.84 6.21
03-16 3.85 3.27 2.12 0.98 -0.16 -1.29 -1.85
04-16 3.82 2.46 -0.25 -2.92 -5.56 -8.17 -9.46
2017 SBBI Yearbook (Preview Version) 18
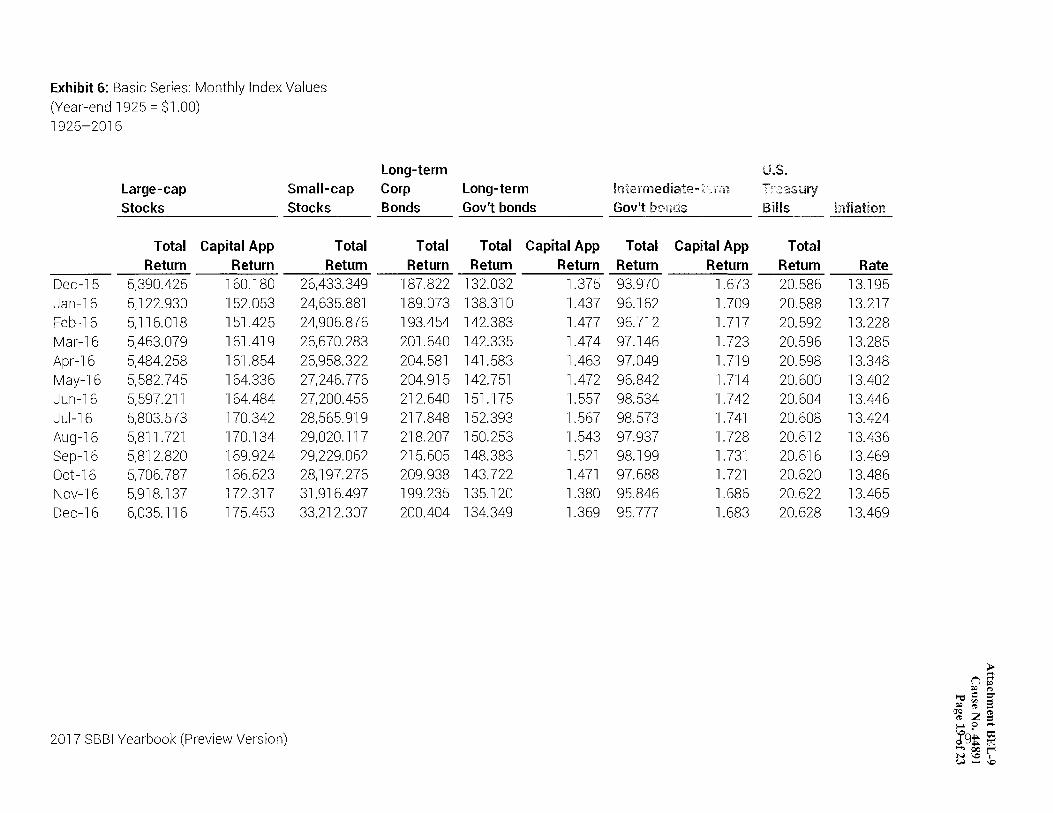
Exhibit 6: Basic Series: Monthly Index Values (Year-end 1925 = $1 .00) 1926-2016
Long-term Large-cap Small-cap Corp Long-term Stocks Stocks Bonds Gov't bonds
Total Capital App Total Total Total Capital App Return Return Return Return Return Return
Dec-15 5,390.425 160.180 26,433.349 187.822 132.032 1.375 Jan-16 5,122.930 152.053 24,635.881 189.073 138.310 1.437 Feb-16 5,116.018 151.425 24,906.876 193.454 142.383 1.477 Mar-16 5,463.079 161.419 26,670.283 201.640 142.335 1.474 Apr-16 5,484.258 161.854 26,958.322 204.581 141.583 1.463 May-16 5,582.745 164.336 27,246.776 204.915 142.751 1.472 Jun-16 5,597.211 164.484 27,200.456 212.640 151.175 1.557 Jul-16 5,803.573 170.342 28,565.919 217.848 152.393 1.567 Aug-16 5,811.721 170.134 29,020.117 218.207 150.253 1.543 Sep-16 5,812.820 169.924 29,229.062 215.605 148.383 1.521 Oct-16 5,706.787 166.623 28,197.276 209. 938 143. 722 1.471 Nov-16 5,918.137 172.317 31,916.497 199.235 135.120 1.380 Dec-16 6,035.116 175.453 33,212.307 200.404 134.349 1.369
2017 SBBI Yearbook (Preview Version)
Intermediate-term Gov't bonds
Total Capital App Return Return 93.970 1.673 96.162 1.709 96.712 1.717 97.146 1.723 97.049 1.719 96.842 1.714 98.534 1.742 98.573 1.741 97.937 1.728 98.199 1.731 97.688 1.721 95.846 1.686 95.777 1.683
U.S. Treasury Bills
Total Return 20.586 20.588 20.592 20.596 20.598 20.600 20.604 20.608 20.612 20.616 20.620 20.622 20.628
Inflation
Rate 13.195 13.217 13.228 13.285 13.348 13.402 13.446 13.424 13.436 13.469 13.486 13.465 13.469
> (j ::I: ~ ~
'"d = =~ ; s ~ :z ~ ...... 0 ....
:9:.. g; ..... ~ t"' N l.C> I ~ .... l.C>

Attachment BEL-9 Cause No. 44891
Page 20 of23 Exhibit 7: Portfolios: Monthly Index Values (Year-end 1925 = $1.00) 1926-2016
100% Long-100% Large term Gov't
Stocks 90/10 70/30 50/50 30/70 10/90 Bonds Dec-15 5,390.425 4,372.613 2,579.192 1,317.611 583.874 224.548 132.032 Jan-16 5,122.930 4,198.116 2,526.392 1,316.245 594.616 233.044 138.310 Feb-16 5,116.018 4,205.381 2,546.325 1,334.738 606.633 239.189 142.383 Mar-16 5,463.079 4,461.997 2,666.985 1,379.786 618.836 240.739 142.335 Apr-16 5,484.258 4,475.208 2,669.997 1,378.817 617.268 239.688 141.583 May-16 5,582.745 4,551.229 2,710.166 1,396.884 624.157 241.897 142.751 Jun-16 5,597.211 4,588.700 2,763.060 1,439.909 650.424 254.807 151.175 Jul-16 5,803.573 4,744.659 2,841.049 1,472.254 661.287 257.594 152.393 Aug-16 5,811.721 4,743.992 2,831.874 1,462.951 655.066 254.375 150.253 Sep-16 5,812.820 4,738.896 2,821.676 1,453.987 649.396 251.531 148.383 Oct-16 5,706.787 4,646.209 2,759.054 1,417.887 631.562 243.960 143.722 Nov-16 5,918.137 4,773.266 2,781.041 1,401. 711 612.119 231.723 135.120 Dec-16 6,035.116 4,855.456 2,814.759 1,411.565 613.304 230.991 134.349
2017 SBBI Yearbook (Preview Version) 20
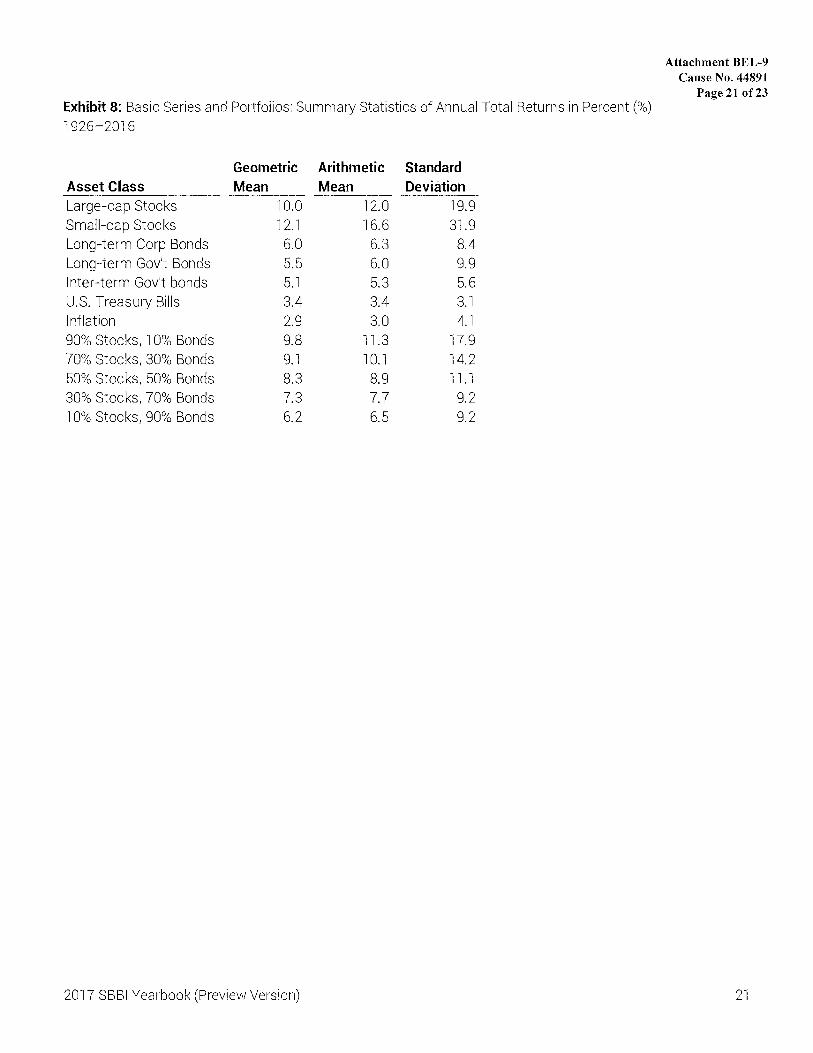
Exhibit 8: Basic Series and Portfolios: Summary Statistics of Annual Total Returns in Percent(%) 1926-2016
Geometric Arithmetic Standard Asset Class Mean Mean Deviation Large-cap Stocks 10.0 12.0 19.9 Small-cap Stocks 12.1 16.6 31.9 Long-term Corp Bonds 6.0 6.3 8.4 Long-term Gov't Bonds 5.5 6.0 9.9 Inter-term Gov't bonds 5.1 5.3 5.6 U.S. Treasury Bills 3.4 3.4 3.1 Inflation 2.9 3.0 4.1 90% Stocks, 10% Bonds 9.8 11.3 17.9 70% Stocks, 30% Bonds 9.1 10.1 14.2 50% Stocks, 50% Bonds 8.3 8.9 11.1 30% Stocks, 70% Bonds 7.3 7.7 9.2 10% Stocks, 90% Bonds 6.2 6.5 9.2
2017 SBBI Yearbook (Preview Version)
Attachment BEL-9 Cause No. 44891
Page21 of23
21
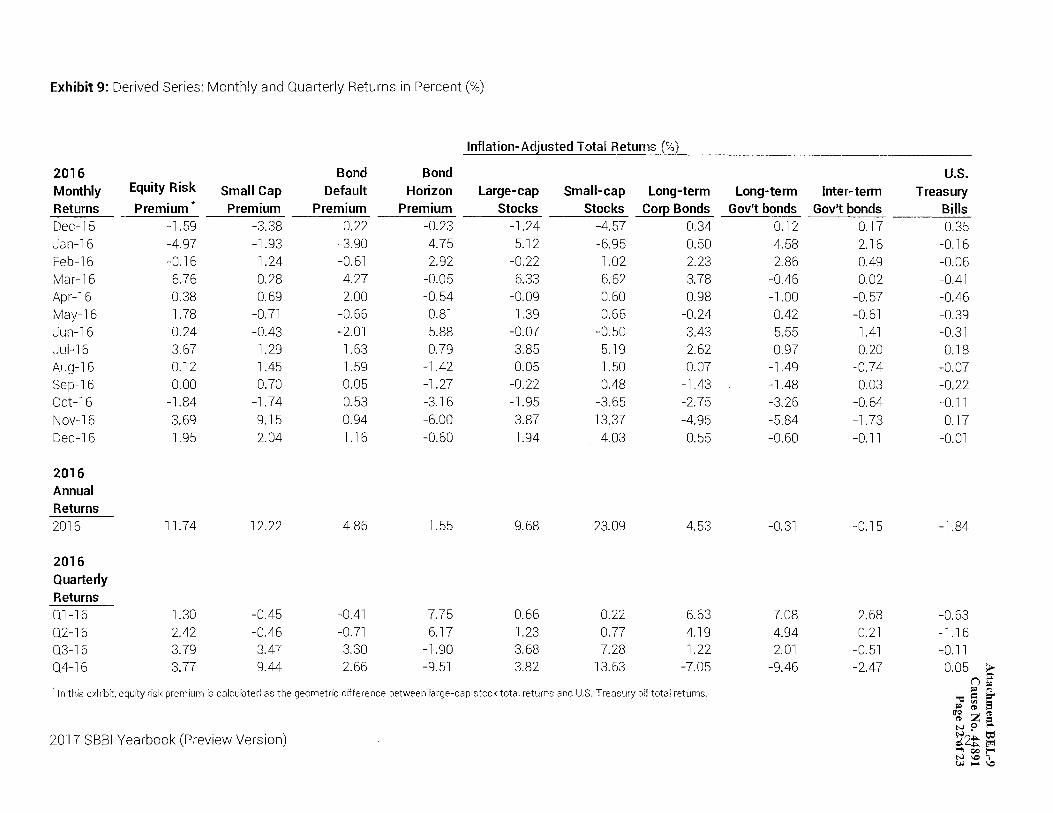
Exhibit 9: Derived Series: Monthly and Quarterly Returns in Percent(%)
2016 Monthly Returns Dec-15 Jan-16 Feb-16 Mar-16 Apr-16 May-16 Jun-16 Jul-16 Aug-16 Sep-16 Oct-16 Nov-16 Dec-16
2016 Annual Returns 2016
2016 Quarterly Returns 01-16 02-16 03-16 04-16
Equity Risk
Premium* -1.59 -4.97 -0.16 6.76 0.38 1.78 0.24 3.67 0.12 0.00
-1.84 3.69 1.95
11.74
1.30 2.42 3.79 3.77
Small Cap Premium
-3.38 -1.93 1.24 0.28 0.69
-0.71 -0.43 1.29 1.45 0.70
-1.74 9.15 2.04
12.22
-0.45 -0.46 3.47 9.44
Bond Default
Premium ----0.22
-3.90 -0.61 4.27 2.00
-0.66 -2.01 1.63 1.59 0.05 0.53 0.94 1.16
4.86
-0.41 -0.71 3.30 2.66
Bond Horizon
Premium ----0.23 4.75 2.92
-0.05 -0.54 0.81 5.88 0.79
-1.42 -1.27 -3.16 -6.00 -0.60
1.55
7.75 6.17
-1.90 -9.51
Total Betums ------~··--··-·--·~
Large-cap Small-cap Long-term long-term Inter-term
___ S_to_cks _ Stoc._~~ Sorp B_C_?_!!~~- Gov't ~gnds _§_<>,~t-~~n~~ -1.24 -4.57 0.34 0.12 0.17 -5.12 -0.22 6.33
-0.09 1.39
-0.07 3.85 0.05
-0.22 -1.95 3.87 1.94
9.68
0.66 1.23 3.68 3.82
-6.95 1.02 6.62 0.60 0.66
-0.50 5.19 1.50 0.48
-3.65 13.37 4.03
23.09
0.22 0.77 7.28
13.63
0.50 2.23 3.78 0.98
-0.24 3.43 2.62 0.07
-1.43 -2.75 -4.95 0.55
4.53
6.63 4.19 1.22
-7.05
4.58 2.86
-0.46 -1.00 0.42 5.55 0.97
-1.49 -1.48 -3.26 -5.84 -0.60
-0.31
7.08 4.94
-2.01 -9.46
2.16 0.49 0.02
-0.57 -0.61 1.41 0.20
-0.74 0.03
-0.64 -1.73 -0.11
-0.15
2.68.
0.21 -0.51 -2.47
In this exhibit, equity risk premium is calculated as the geometric difference between la1·ge-cap stock total returns and U.S. Treasury bill total returns.
2017 SBBI Yearbook (Preview Version)
U.S. Treasury
Bills ----·--0.35
-0.16 -0.06 -0.41 -0.46 -0.39 -0.31 0.18
-0.07 -0.22 -0.11 0.17
-0.01
-1.84
-0.63 -1.16 -0.11 0.05 >
n S' i::o ..,
""=' = =-i::o ~ = ~ ~ § N? ..+-
~2t ~ ..., 00 t"' N\Or (JJ ,_. \0
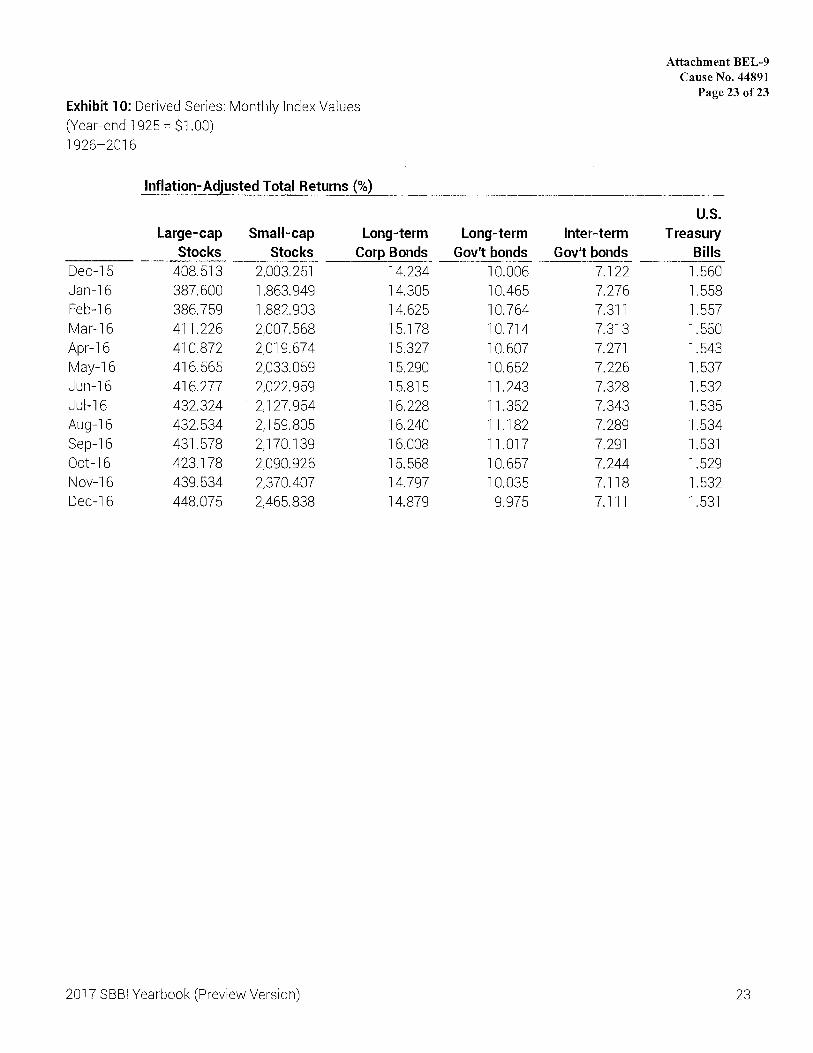
Attachment BEL-9 Cause No. 44891
Page23 of23 Exhibit 1 O: Derived Series: Monthly Index Values (Year-end 1925 = $1.00) 1926-2016
Inflation-Adjusted Total Returns(%)
U.S. Large-cap Small-cap Long-term Long-term Inter-term Treasury
Stocks Stocks Corp Bonds Gov't bonds Gov't bonds Bills Dec-15 408.513 2,003.251 14.234 10.006 7.122 1.560 Jan-16 387.600 1,863.949 14.305 10.465 7.276 1.558 Feb-16 386.759 1,882.903 14.625 10.764 7.311 1.557 Mar-16 411.226 2,007.568 15.178 10.714 7.313 1.550 Apr-16 410.872 2,019.674 15.327 10.607 7.271 1.543 May-16 416.565 2,033.059 15.290 10.652 7.226 1.537 Jun-16 416.277 2,022.959 15.815 11.243 7.328 1.532 Jul-16 432.324 . 2,127.954 16.228 11.352 7.343 1.535 Aug-16 432.534 2,159.805 16.240 11.182 7.289 1.534 Sep-16 431.578 2,170.139 16.008 11.017 7.291 1.531 Oct-16 423.178 2,090.926 15.568 10.657 7.244 1.529 Nov-16 439.534 2,370.407 14.797 10.035 7.118 1.532 Dec-16 448.075 2,465.838 14.879 9.975 7.111 1.531
2017 SBBI Yearbook (Preview Version) 23
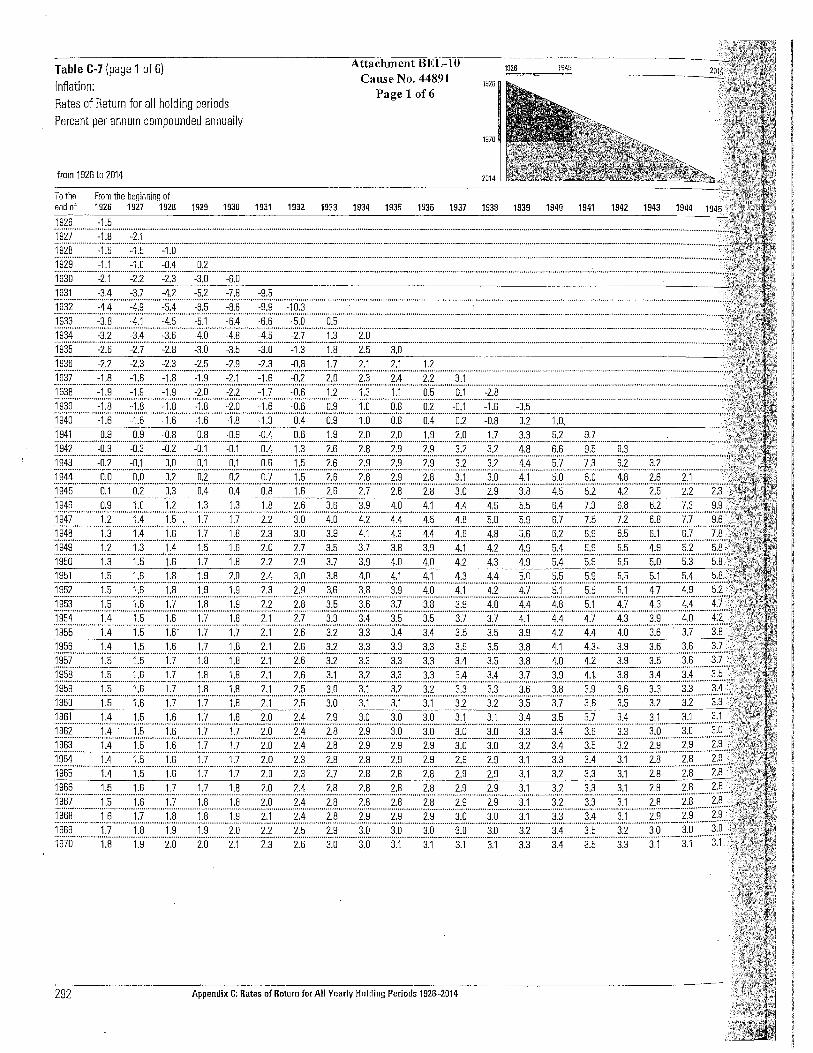
Table C-7 (page 1 of 6) Inflation: Rates of Return for all holding periods Percent per annum compounded annually
from 1926 to 2014
To tha From the beginning of
Attachment BEL-10 Cause No. 44891
Page 1 of6 1926
1970
2014
end of 1926 1927 1928 1929 1930 1931 1932 1933 1934 1935 1936 1937 1936 1939 1940 1941 1942 1943
292 Appendix C:; Rates of Return for All Yearly Holding Periods 1926-2£114
;, i'.
Table ·c-7 {page 2 of 6) · 1nflaticin: · Rates of Return for all holding periods
Perceht per annum compounded annually
from 1926 to 2014
To the From the beginning of
Attachment BEL-10 Cause No. 44891
Page 2 of6 1926
1971
2014
end of 1926 192.7 1928 1929 1930 1931 1932 1933 1934 1935 1936 1937 1938 1939 1940 1941 1942 1943 1944 1945
1971 1.8 1.9 2.0 2.1 2J 2.3 2.6 3.0 3.0 3.1 3.1 3.1 3.1 3.3 3.4 3.5 3.3 3.1 3.1 3.1
]~?3.::~::::~:::s~:~:::::::I(:::::::::3.~:::=::~-fi~~:::~:E:~::::::I~:~::::::~3.;~:::::::::IQ:::::::::::~;r:::::::::E:::~::::II::~::::~Ii::~::::::IL::~:~:~;~~::::::::fi:::::::::::~;~::~::::::I~:::::::~~Ir~~~~::~;r:~::::::?.I::::: 1973 2.0 2.1 2.2 2.2 . 2.3 2.5 2.8 3.1 3.2 3.2 3.2 3.3 3.3 3.5 3.6 3.7 3.5 3.3 3.3 3.3 ··-····-···········-········· ................................... ._ ................ _.,, ........................................... -...................................................................... _,, .................................. , .... _ ......................................................................................................... . 1m U ~ U U ~ U M ~ U M M ll ll D M ll V M M M ......................................................................... -................ ,_ .................................................................................................................................................................................................... ._,_ .... , __ ,,. ................................................. . 1975 2.3 2.4 2.5 2.5 2.6 2.8 3.1 3.4 3.5 3.5 3.5 3.6 3.6 3.8 3.9 4.0 3.8 3.7 3.7 3.7
-~~?..?_ .... _ ....... n ............ ?.:t ..... -.3.:~ ....... _.3:~ .. -, ....... ?.:~ ........... ?.:L ....... ?.:! ... _ .... _.?.:.~-.......... ?.:~ ... -....... ?.:§ ............ ?.:~.: .......... ?.:~ ........... ?.:.? ............ ?.:~ ........... ~:~ .. ---.. -~:~ ......... _?.:~ ..... _ .... ?.L ......... ?.:?. ........... ?.:~ ..... .. 1m U ~ ~ U U ~ D ll M M M D D M W U ll M M ll ......................................... - .................................................................................................................................. _ ......................................................................... -.... _ .. ,, ..................................................................................................... . 1m ~ W U U U ~ ~ M D D M M M U U U U U W W .......................................... _,,, ................................................................................ -..................... - .................. ,_ .......... -.............. _ ............................................. _ ............................................................................................................ . 1979 2.7 2.8 2.9 3.0 3.0 3.2 3,5 3.8 3.9 4.0 4.0 4.0 4.1 4.2 4.4 4.4 4.3 4.2 4.2 4.3 ........................................... - ............ _ ...................................................................... -................................................................................................................................................................................................................................. .. 1~ ~ ~ ~ U U M V W U U U U U « ~ U ~ « « ~
1981 3.0 3.1 3.2 3.3 3.3 3.5 3.8 4.1 4.2 4.2 4.3 4.3 4.4 4.5 4.6 4.7 4.6 4.5 4.5 4.6 ............................................................................................................................................................................ -............................................. -........................................................... ._ ............................................... -............ ,, ___ ., .. .. 1982 3.0 3.1 3.2 3.3 3,3 3.5 3.8 4.1 4.2 4.2 4.2 4.3 4.3 4.5 4.6 4.7 4.6 4.5 4.5 4.6 ........................................................................................................................................................................................................................................................................... -. ............... _ ....................................................................... .. . ~.~~.?. .... _ ....... ..?.:9 ........... ~:! ........ -.~:? ..... -.... -~~~ .... _ ...... ?.:~ ............ ?.:§._ .... _ .. ~:~ ...... -... -~:2 ..... _ ... ~~?_ .......... ~~~ .... _ .... ~:? ............ E_ ...... ~:L ....... 1:§ ............ 1:~ ..... _._ .. 1:?... .......... ~:~ ........ -.. 1:~ ......... _.~:~ ........... ~:~ ... -1• M ~ U ll M ll M U U U U U U U W U U ~ ~ U ................... _ ............................................................................. -........................................................................................................................................................................................................... _ ................................................... . 1& ~ ~ U U U ll M U U U U U U U U U U « ~ U 1~ M ~ U ~ ~ ll M W U U U U U « ~ U ~ « « « ................................................................................................ _ ............................................................................................................................... -....................................................................................................................... _.,_ ... _ ... , .1.~!!?.._ ...... --~:~ ........ 3:! ........... ~:?. ........ _.~:?. ............ ?.:~ .. :: ........ ?.:~ .... -..... ~~~ ........... ~:9 ..... _. __ ~:!.-......... ~:! ............ ~:? .......... -~:?.-....... ~:? ........... ~:~ ... -... ...1:~ ............ ~:§: ........... ~:L ... _ .. 1::L ...... 1:.~ ...... _ .. ~:L .. . 1~~ ............. ..?.:! ........... ?.:L ........ ~:L ... _.3:?. ............ ?.:1 ............ ?.:~.-....... ..?.:~ .......... _1:9_ .......... ~:L ......... ~:1...-...... E ........ _1:?.-......... ~:~ ..... -..... 1:~ ........... 1:~.--........ 1:~_ .......... ~:?. ........... 1:'.! .. _ .. _ ... 1:'.! .... _ .. _1:'.!_ .. .. . ~.~~~ ....... -..... ~:L ........ ~:?. ........... ~:?. ... _ .. _ .. ?.:~ ......... -~:'.! ....... _.?.:~ ....... _ ... ?.:~ ............ ~:L ....... ~:.l ........... ~:? ... _ ... _.~:? ......... _.1:?. ........... 1:~ .. -·-··-··1:L .. -... ~~~ ......... --~:~ ...... ___ 1:.?. ... -...... ~:'.! ... -.... -~~ .......... 1:'.! .... .. 1B ~ U U M M M M U U U U U U Y ~ U U « « ~
!~~] ... _ ..... - ... ~~1 ........... ~:~ .......... ..?.~ ............ ?.:1 ......... -.?.:'.! ........... ?.:~ ... -....... ?.:~ ........... ~:~ ............ ~:! ............ ~:? ... _ ....... ~:?. ........... ~~?. ........... ~~~ .......... ~:~ ........... ~:~ ....... -... ~:~ ............ 1:~ .... -..... ~:~ .. , ........ 1:'.! .......... ~:~ ..... .. . 1.~~.?. ............. _?.:! ....... _ ... ?.:?. ........... ?.:~ ........... ~.:L ....... ~:'.! ........ -~:~-......... ~~~ ........ -.. ~:! ............ ~:~.-....... ~:? ............ ~:? ____ ..... ~:? .. -........ 1:~ ........ _J~.-........ ~:§ ............ ~:§ .. -....... ~:L ........ ~:~ ............ ~:'.! ....... -.~:~ .... .. . 1.~~~ ............... ~.:! ........... ~:?. ....... -.. ~.:?. ... _ ...... ?.:~ ........... ~~1 ........... ?.:§_ .......... ?.:~ ............ ~:9 ... _ ....... ~:! ...... _ .... ~:! ............ 1:! ............ ~:? ............ E .......... ~:~ .......... -~:'.! ........... ~:~ .. -..... _1:'.! .. -...... ~::?. .... -..... 1:~ ........... ~:1 ..... .. 1~ ~ U ~ ll M ll M W U U U U U U « ~ « U U Y 1995 .............. i1 ........... :3:2 ........... i3_ .. ___ , .. 3:3' ........... 3:4' ......... i5 ........... ii"' ......... 4:a· .. -...... 4:ii ... -........ ff ....... _4:1 ............ 4:1" .......... 4:2 ........ -·4.3·-........ 4:4' .......... 4~4 ........... 4.3"" ........ 4:3'-... -.. ;G ......... 4:3' ... .. 1996 . 3.1 3.2 3.3 3.3 3.4 3.5 3.7 4.0 4.0 4.1 4.1 4.1 4.1 4.3 4.4 4.4 4.3 4.2 4.3 4.3 ·-........ -................................... _ ............. _,,, .................................................................................................. -..................................................................... , ... _,_., ........................................................................................................... . . !~~?. .............. ~:! ........... g ........ 3:~ ...... -.... ?.:~ .... ,_.,_.?.:'.! ........... ?.~ ........... ?.:?. ... _ ..... _?.:~-·· .. --~:9 ............ ~:9 ............ 1:~ ........ _.~:! ............ ~:! .. _ .. _ .... 1:?. .... -..... ~:9 ............ 1:'.! ........... 1:~ ............ ~:?. .......... ~:?. ...... _.~:?. ..... . 1998 3.1 3.1 3.2 3.3 3.3 3.5 3.7 3.9 4.0 4.0 4.0 4.0 4.1 4.2 4.3 4.3 4.2 4.1 4.2 4.2 .................................... _ ........................... * ................................... - .................................................................................................................................................................... _ .............................. ,_ ..................................................... .
1~ ~ ~ ll ~ ll M U M ll W W W W U U U U U U U ..................................................................................................................................... ~ ............... ---··"'"''"'"''""'""''"""'""'"'""•"""''"""''"'"''"""''''""""'"'''"''"''""'''"'"""'"'""'"''"'''''''''"''"'"'"''"'""'"''"'""'''"'''""'"••"'"""''"""""" ~ ~ ~ ll ~ " ll D U ll W W. W W ~ U U U U U U ?.Q~.1 ......... -..... ?.:! ............ ?.:! .......... ?.:?. ........... ~:? ........ _.~:~ ........... ~:1 ............ ?.:~ ........... ~:~ ............ ~:~ ........... ?.:~ .... _ ...... ?.:~ ........... ~:~ ..... ---~:Q ............ ~:L ......... ~:?. ... -..... ~:L ..... -~:! ............ 1:1 ............ H .......... ~:2 ..... -?.QQ~ ................ ~.:~ ........... ~:! ........ -.~:~ ........... 9.:? ........... ~:~ ............ ?.:1 ............ ?.:§ ........... ~:~ ...... -.... ?.:~-...... --~;~ ... -....... ?.:~ ......... : .. ~:9_ .......... 1:Q ....... , .... 1:!: ........... ~:?. ........... ~:? ............ ~:L ........ ~:9 ............ ~:Q ........... 1~L .. .. 2003 3.0 3.1 3.2 3.2 3.3 3.4 3.6 3.8 3.8 3.9 3.9 3.9 3,9 4.0 4.1 4.2 4.1 4.0 4.0 4.0 ................................. -................ ~ ...................................................................................................................................... ~.-· .................................................................................................................................... _. ............................. .. 2004 3.0 3.1 3.2 3.2 3.3 3.4 3.B 3.8 3.8 3.9 3.9 3.9 3.9 4.0 4.1 4.2 4.1 4.0 4.0 4.0 ....................................................................................................................................................................................................................................................................................................................................................................... 2005 3.0 3.1 3.2 3.2 3.3 3.4 3.6 3.8 3.8 3.9 3.9 3.9 3.9 4.0 4.1 4.1 4.1 4.0 4.0 4.0 2006 3.0 3.1 3.2 3.2 3.3 3.4 3.6 3.8 3.8 3.8 3.8 3.9 3.9 4.0 4.1 4.1 4.0 4.0 4.0 4.0 ..................................................................................................................... -.............................................. _ .... , ........................................................................................................................................................................................... . ~ ~ ~ U U ~ M M M M M ll ll ll W U U W W W W ...... -.... ~ ........................................ -...................................................... _, ................................................................................................................................................................ _ ........................................................................ -........ .. ?.Q9.L ... _ ... _.~:9 ........... ~:! .......... 1:! ... _ ....... ~:? ......... -.?.:? ............ ?.:~ .... -...... ?.:§ ... _.,_ ... ?.:?. ....... _ ... ?.:~-.......... ?.~~ ...... _ .. _?.:~ .... -...... ?;~ .... -..... ?.:~ .......... _?.:~ ........... ~:9 .. -........ 1:L ....... -~:9 ........ -.. ?.:~ ... -... -.?.:~ ........... ?.:~ ...... . 2009 3.0 3.1 3.1 3.2 3.2 3.3 3.5 3.7 3,8 3.8 3.8 3.8 3.8 3.9 4.0 4.0 4.0 3.9 3.9 3.9 ......................................................................................................................... _, ____ ............................................................................................................................................................................................. ,_ ................................... . 2010 3.0 3.0 3.1 3.2 31 3.3 3.5 3.7 3.7 3.7 3.8 3.8 3.8 3.9 4.0 4.0 3.9 3.8 3.9 3.9 2011 3.0 3.0 3.1 3.2 3.2 3.3 3.5 3.7 3.7 3.7 3.7 3.8 3.8 3.9 3.9 4.0 3.9 3.8 3.8 3.9 ..................................................................................................................................... ._ ....................................................................................... _, ................................................................................................................................... .. ?.Q.13. ......... _ .... ?~ .......... ..?.:2 ... -...... ~.L._ ..... ~:! ............ ?.:L ...... ~:~ ............ ?.:~ ............ ?.:~ ............ ?.:?. ............ ?.:?. ..... _._ .. ?.:?.. ........ _.?.:~ ........... ?.:~ ...... -.... ?.:~ ...... _ ... ?.:~-......... 1:9 ............ ?.:~ ..... _ ... _?.:~ ........... ~:~ .......... ?.~~--.. ·· 3.Q1.?. .............. 9.:9 ........... ~~~ ............ ?.:! ..... _ ..... ?.:! ........... ~:? ............ ?.~~ ............ ?.:~ ........ ~.?.:~ ............ ?.:?.. ... _ ...... ~:?. ............ ?.:?. ........... .?.:?. ............ ?.:?. ... --..... ?.:~ .......... _?.:~ ............ ?.:~ ............ ?.:~ ............ ?.:~ .......... ~:~ ........... ?.:~ ..... .. ~4 ~ M ~ ~ ~ U M ll M M D V V ll M M M D D M
2015 Ibbotson® SBBI® Classfc Yearbook Morningstar 293
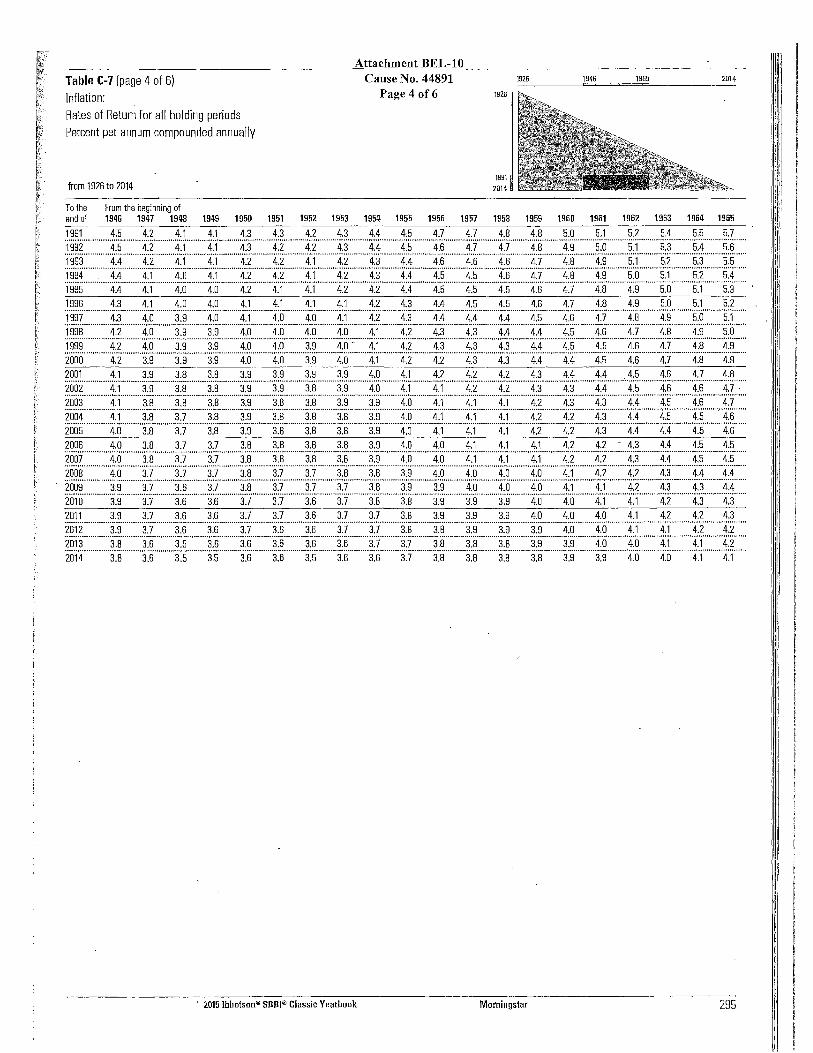
Table C-7 (page 4 of 6) Inflation: Rates of Return for all holding periods Percent per annum compounded annually
from 1926 to 2014
To the From the beginning of
Attachment BEL-10 Cause No. 44891
Page 4 of6 1925
1991 2014
1926 1945 1965 2014
end of 19Q6 1947 1943 1949 1950 1951 1952 1953 1954 1955 1956 1957 1958 1959 1960 1961 1962 1963 1964 1965
.~.~~.~ ............... ±:~ ............ 4.:~ ........... ±:l ............ 4.:l ............ 4.:~ ............ 4.:~ ........... ~:~ ............ 4.:~ ............ 4.:± ............ 4.:~ ............ E .......... ±:7. ............ 4.:.0 ........... ±:§ ............ 5.:9 ............ 5.:l ............ 5.:? ............ 5.:± ........... 5.:~ ........... 5.:?. ...... .
. 1.~~? ............... 4.:~ ........... ±:? ........... ±:l ............ 4.:l ........... :1::~ ............ 4.:? ........... 4.:~ ............ 4.:~ ............ 4.:± ........... 4.:~ ........... 4.:~ ............ 4.:?. .......... 4.:7.. .......... 4.:§ ............ 4.:~ ............ 5.:9 ............ 5.:.~ ............ 5.:~ ............ 5.:± .......... 5.:~ ...... . 1993 4.4 4.2 4.1 4.1 4.2 4.2 4.1 4.2 4.3 4.4 4.6 4.6 4.6 4.7 4.8 4.9 5.1 5.2 5.3 5.5 .................................................................................................................................................................... , .................................................................. ., ............................................................................ , ...... -......................................... . 1994 4.4 4.1 4.0 4.1 4.2 4.2 4.1 4.2 4.3 4.4 4.5 4.5 4.6 4.7 4.8 4.9 5.0 5.1 5.2 5.4 ............................................................................................................................................................................................................................................................ , ......................................................................................................... . 1995 4.4 4.1 4.0 4.0 4.2 4.1 4.1 4.2 4.2 4.4 4.5 4.5 4.5 4.6 4.7 4.8 4.9 5.0 5.1 5.3 1996 4.3 4.1 4.0 4.0 4.1 4.1 4.1 4.1 4.2 4.3 4.4 4.5 4.5 4.6 4.7 4.8 4.9 5.0 5.1 5.2 ....................................................................................................................................................................................................................................................................................................................................................................... 1997 4.3 4.0 3.9 4.0 4.1 4.0 4.0 4.1 4.2 4.3 4.4 4.4 4.4 4.5 4.6 4.7 4.8 4.9 5.0 5.1 ....................................................................................................................................................................................................................................................................................................................................................................... 1998 4.2 4.0 3.9 3.9 4.0 4.0 4.0 4.0 4.1 4.2 4.3 4.3 4.4 4.4 4.5 4.6 4.7 4.8 4.9 5.0 ....................................................................................................................................................................................................................................................................................................................................................................... 1999 4.2 4.0 3.9 3.9 4.0 4.0 3.9 4.0.. 4.1 4.2 4.3 4.3 4.3 4.4 4.5 4.5 4.6 4.7 4.8 4.9 ....................................................................................................................................................................................................................................................................................................................................................................... 2000 4.2 3.9 3.9 3.9 4.0 4.0 3.9 4.0 4.1 4.2 4.2 4.3 4.3 4.4 4.4 4.5 4.6 4.7 4.8 4.9
?.0.9.! ............... ~:~ ............ 3.:~ ............ 3.:~ ............ 3.:~ ........... ~.:~ ............ 3.:~ ............ ~.:~ ............ 3.:~ ........... ~:9 ............ 4.:L ........... 4.:~ ............ 4.:? ............ ~:? ............ 4.:~ ............ ~:± ........... 4.:'.! ........ : .. 4.:~ ............ 4.:~ ............ 4.:?... ......... ~:~ ...... . 2002 4.1 3.9 3.8 3.8 3.9 3.9 3.8 3.9 4.0 4.1 4.1 4.2 4.2 4.3 4.3 4.4 4.5 4.6 4.6 4.7 . ....................................................................................................................................................................................................................................................................................................................................................................... 2003 4.1 3.8 3.8 3.8 3.9 3.8 3.8 3.9 3.9 4.0 4.1 4.1 4.1 4.2 4.3 4.3 4.4 4.5 4.6 4.7 iiiii4 ............... 4::1 ........... iii ........... 3-:7 ........... 3:8 ........... 'i9 ............ iii ............ ia ........... iii ........... 3:9 ............ 4:a· .......... 4:1······· .. ·-4-:J ........... 4:1 ........... 4:2· .......... 4:2··· ......... 4:3 ............ 4:t·· ....... ,fii ............ 4:5 ........... 4:5··· .. .. ....................................................................................................................................................................................................................................................................................................................................................................... 2005 4.0 3.8 3.7 3.8 3.9 3.8 3.8 3.8 3.9 4.0 4.1 4.1 4.1 4.2 4.2 4.3 4.4 4.4 4.5 4.6
?0.9.~ ............... 4.:9 ............ 3.:~ ............ 3.:?... .......... 3.:?. ............ 3.:~ ............ 3.:§ .......... ..3.:~ ............ 3.:§ .......... ..3.:9. ............ 4.:9 ............ 1:9 ............ ~:~ ............ ~:1. .......... 1:~ ............ 4.:~ ............ 4.:? ...... : .... ~:3. ............ 1:~ .......... 4.:~ .......... ~:~ .... .. ?0.97 ............... ±:9 ............ 3.:~ ............ 3.:7... .......... 3.:?.. ........... 3.:~ ............ 3.:~ .......... ..3.:~ ............ 3.:~ ........... ~.:9. ........... 4.:9 ............ 4.:9 ............ ~:.1 ............ 4.:.1 ............ 4.:~ ............ 4.:? ............ 4.:? ........... ~:3. ............ ~:~ ............ 4.:~ ........... 4.:~ ...... . 2008 4.0 3.7 3.7 3.7 3.8 3.7 3.7 3.8 3.8 3.9 4.0 4.0 4.0 4.0 4.1 4.2 4.2 4.3 4.4 4.4 - ziios .............. iii ........... ii ......... 3:6 ........... ii ........... iii ......... "i7 ............ ii ........... ii ........... 3:ii ............ is ............ 3:!i ............ 4:a·· ......... 4:o ............ ii:ii ............ 4:1" .......... 4:1· ........... 4~2···· ....... ii:3" .......... 4:a .......... 4x .... . .......................................................................................................................................................................................................................................................................................... , ............................ , ............................................. .. 2010 3.9 3.7 3.6 3.6 3.7 3.7 3.6 3.7 3.8 3.8 3.9 3.9 3.9 4.0 4.0 4.1 4.1 4.2 4.3 4.3
?0..!.!.... ........... ~:9. ............ ~.:?. ........... ~:~ ............ 3.:~ ........... ~:7. ............ 3.:?... .......... 3.:~ ............ 3.:7. ............ 3.:?. ............ 3.:~ ............ 3.:9. .......... ..3.:~ ............ 3.:~ ............ 4.:g ............ 4.:9 ........... 4.:9 ............ ~:~ ............ 4.:? ............ 4.:?. .......... 4.:3. ...... . ?0..!.? .............. 3..:9. ............ 3.:?. ........... ~:§ .......... ~.:~ ........... 3.:?. ........... ~:§ ............ 3.:§ ........... .3.:7. ............ 3.:?. ............ 3.:~ ............ 3.:§ ............ 3.:9. ............ 3.:9. ............ 3.:9. ............ 4.:9 ............ 4.:9 ............ ~:.1 ............ ~:.~ ............ E ......... ~:?... ... . 2013 3.8 3.6 3.5 3.6 3.6 3,6 3.6 3.6 3.7 3.7 3.8 3.8 3.8 3.9 3.9 4.0 4.0 4.1 4.1 4.2 .......................................................................................................... ., ......................................................................................................................................................................................................................................................... .. 2014 3.8 3.6 3.5 3.5 3.6 3.6 3.5 3.6 3.6 3.7 3.8 3.8 3.8 3.8 3.9 3.9 4.0 4.0 4.1 4.1
· 2015 lbbotson® SBBI® Classic Yearbook Morningstar 295
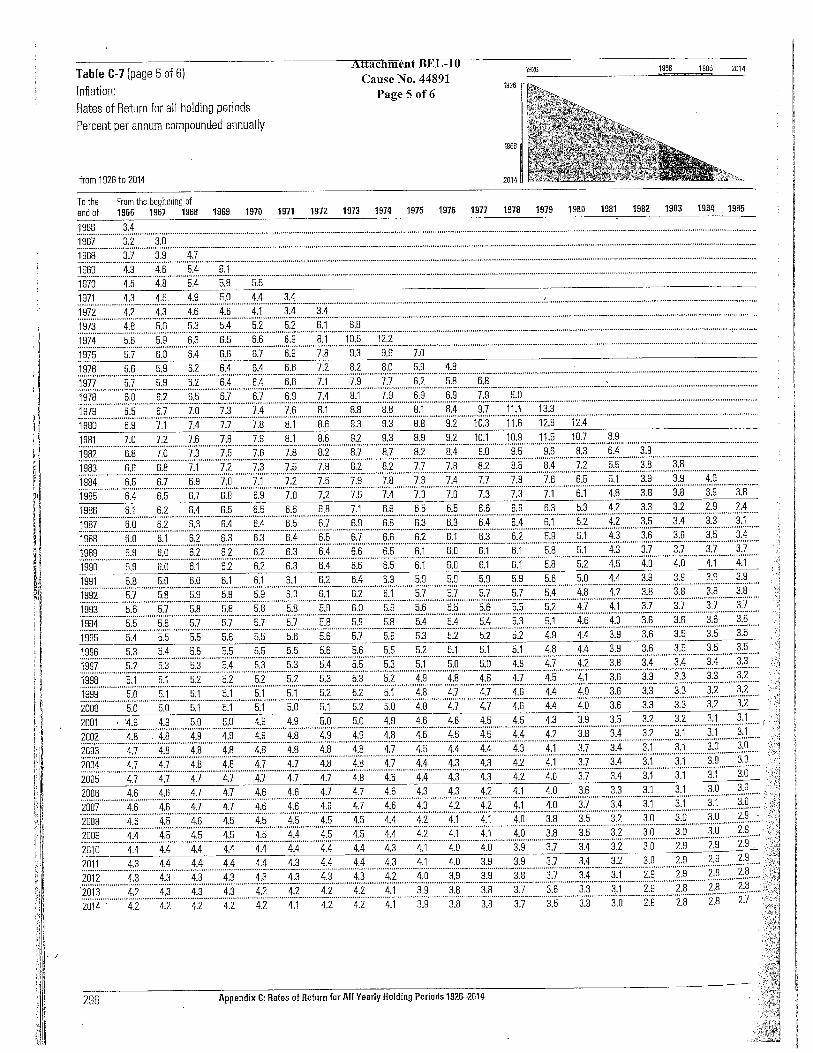
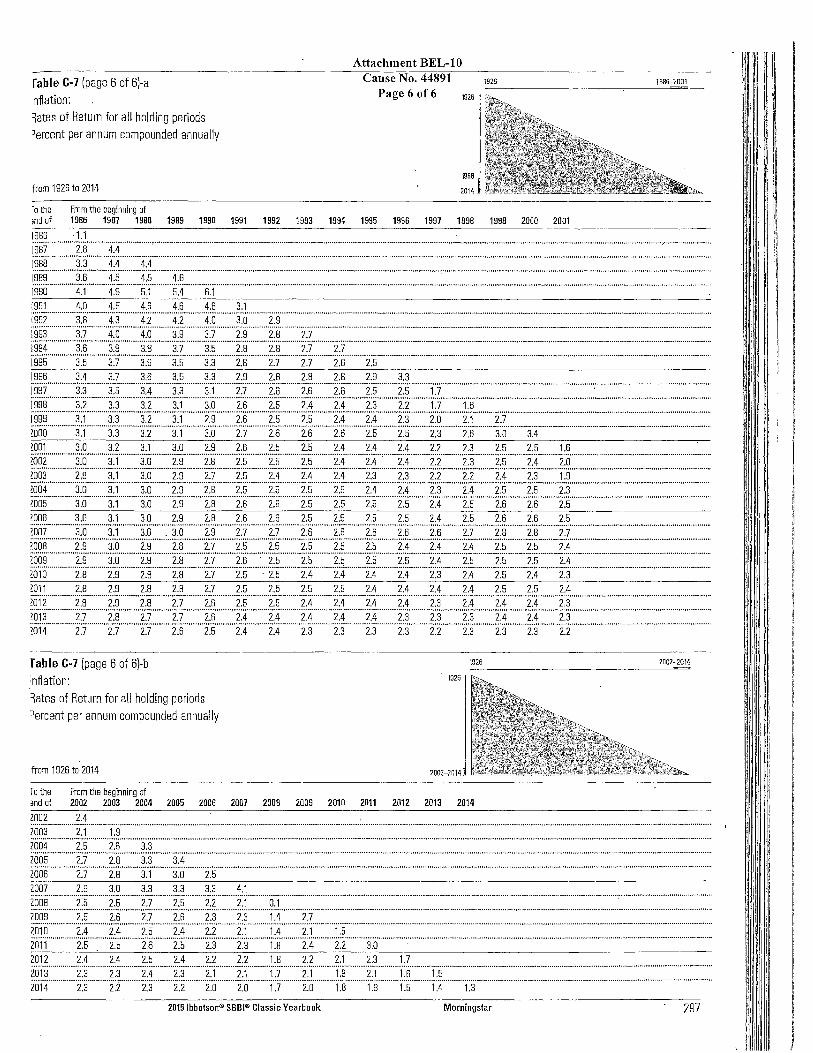
fable C-7 (page 6 of 6)-a nflation: Mes of Return for all holding periods )ercent per annum compounded annually
from 1926 to 2014
-o the From the beginning of
Attachment BEL-10 Cause No. 44891
Page 6 of 6 1926
1986
2014
1926
md of 1986 1987 1988 1989 1990 1991 1992 1993 1994 1995 1996 1997 1998 1999 2000 2001
1986 · 1.1
1986-2001
1·997····· .. ·······2:0··-·······4:4········-····-\•····--·-······-··························"········· .......................... ._ ............................................................................................... _ ......... _ ............................................... _.. ..................... ~-·--······-········ .. 19-0·0 .. _ ........ -3:3_ ......... 4:4 ............ ¥:4 .......... -..... -....................................................... -.... --.-.............................................................. _ ........................................................................................................................................... .. i'iiilii'''''''''"""ii~6'"""'"'4:5""'"""'4.5"'"'"'"4:ii'"-''"'"""'"'""'"'"'""'"'"-'""'-'""'"''"'"'"'"""'"'""'"'"""'""'"'''"''"''"'''''"'''"'"'''-'""'"'"'""'"'""'''"'""""'"'''""'"'''"'"'"'''"'''"'"'""""'"''"'""""'""'""'"'"'''"'''"'"'"'"'""""''""'" i'ii9Ci"""""""'4:1'""'"""4.9""""'"5:1'"""""5:4""""'"ii:1"'"'"""'""'""""'"'"'""'"'"'""""""""'"'"'""'"""""""'""""'""'""""'"'"""'-................................................................................................................................................. .
'-~~.! ............... ~~9 ............ ~;~ .......... ~:~ ............ ~:~ ............ ~:~ ............ ~1 ....................................................................................................................... .-............. -...................................................................................................... .. 1992 3.8 4.3 4.2 4.2 4.0 3.0 2.9 lii93"'""""'""i7''"''""'4:ii·"••"""4:ii"""'"''"i9'''"""""i7"'"'""'"2]""''"""2.ii""""""'2j'""'"""'"-'"""""'""'"''"''""'""'""""'""""'""'"'""'"'""'"'"'"'''""'"'"''"-'""'''"""""""'-·"""'"""'"''""'""""""""'-·•"""'""'"'""'''""'"' 199".i"'""'"'""'iii""'"'"''i9""""""'iii""""'"i7'"•"""'i5""'""""2~8"'"""'2.ii"'""""2:7"""•""'2:7'-·""""'-·"•""""'""'"""""""'"""'""""'"""""'""'"""""'"""""""""""""""'"""'"""'""'"'"""""'"'"'"''"'"'""'""'"'"""'" 1·99·5 .............. 3:5' .......... 3:7 ........... iii ........... i5 ........... i:r···--2:ii ........... 2::; ........... 2::; ........... 2:fi ........... 2:ii ........................... -.... -.......................................................................................................................................... .
'-~~-~ ............... ~:~ ........... ~:7-.......... ~:~ ............ ~:?. ......... 3:~ ............ ?.:~ ............ ?.:~ ........... 3.:~ ......... 3;~ ........... ?;~ ............ ?.:~ ............................................................................... _ .................. -.. _ ......... -...... _ ................................ .. ~~~?. .............. ~:~ ............ ?.:?. ........... ~:~ .......... ~~ .. ·----~1-...... ?.:?. ............ ?.:§ ............ ?.~ ............ ?.:§ ......... -?.:?. ............ ?.:?. ............ !.:?. ................................................................................ .' ..................................................... - ... .. 1998 3.2 3.3 3.2 3.1 3.0 2.6 2.5 2.4 2.4 2.3 2.2 1.7 1.6
i:~~~::=::::::::Ic::::::~;~::::::::::I~::::::~::~;c:::::I~:::::::::::?.I::::::::3.I:::::::::~;~~:::::::jI:::::::::E::::::::I~::::::::::?.;~::::::::::?.I:::::::~:~;z.:::::=~::=::::::::::::::::::::::::~::::::::::~::::::::::::::::::::~:::::::::::::::::::::: moo ~ ~ ll ~ M u 26 26 26 25 25 2~ 26 ao 3A ill01 3,0 3.2 3.1 3.0 2.9 2.6 2.5 2.5 2.4 2.4 2A 2.2 2.3 2.5 2.5 1.6 lDiiii""'"""'"iii'""'""'i1"'""""3':o"'""""'2:9""""""2:S""""""2:5·"""'"'2:5"""'"""2:5·""""'2X'""""2:4'~· ...... 2X"'-""2:2'"'"""2.3""""'"2:5 ........... 2:4-""'""2~o""""""'"""""""""'"'"""""'""""'"'""'-"'-"' liiii3 ........... -2:9 ........... ii ............ iii .......... 2:9· ........... 2:7 ........ -·2:5 ... -... T4 .......... 2X .......... 2X .......... 2:3· ........... 2:3 ............ ff ......... 2.2 ............ 2X .......... 2:3· .......... i·:9·-· ............... -.................................................... .. ········-····-.......................................................... ,_,_,,, ............................................ ,_,_,,, ....................... ,_ .. ,, ............. ,_,,,,, ............................................................................................................................................... ,_,,, ....................... . ~gQ.~ ......... _ .. ~:9 ........... ~.:l ........... ~:9 ......... 3.:§ ............ ?.:~ ............ ?.:?. ............ ?;~ .......... 3.:?. ............ ?.:?. ......... ...?.:1. ........... ?.:~ ........... ?.:~ ........... 3.:~ ........... ?.:?. ............ ?.:?. ............ ?.:~ ........................................................................ .. mo5 3.o 3.1 3.o 29 2.0 2.6 2.6 2.5 2.5 2.5 2.5 2.4 2.5 2.6 2.6 2.5
?gQ.?. ............. }:9 ........... ~:l ........... ~:Q ............ ?.:§ ............ ?.:~ ............ ?.:~ ........... 3.:~ .......... 3.:?. ...... _ .. ...?.:?. ............ ?.~~ ............ ?.:?. ........... 3-:~ .......... X~ .......... 3.:?. ............ ?.:~ ............ ?.:?. ............. -......................................................... . l007 3.0 3.1 3.0 . 3.0 2.9 2.7 2.7 2.6 2.6 2.6 2.6 2.6 2.7 2.8 2.8 2.7 ~iio'ii' ............. 2:9· .......... iii .......... I!i ........... 2:0 ........... 2:7'· .......... 2:5 .......... 2:5 ........... 2:5 ........... 2:5·-·-·· .. 2~·-·· .... ··2:;;:-· ......... 2.4" ........ 2~4 .......... 2:5··-...... 2:5 ........... 2:4" ...................................................................... . ................................................ -..................................................................................................................... -....... _,, ............... -........................................................................ _ .... ,_ ... , .......................................................................... .. ~QQ.~ ............... ?.:~ ........... ~:Q ........... .?.:~ ............ ?.:~ ............ ?.:?. .......... ..?.:~ ........... 3.:?. ............ ?.:?. ... -........ ?.:§ ........... 3.:?. ............ ?.:§ ............ ?~~ ........... ?.:~ .......... .?.:?. ............ ?.:?. ............ ?.:~ ....................................................................... .. m10 2.0 2.9 2.0 2.0 21 2.5 - 2.5 2.4 2.4 2.4 2.4 2.3 2.4 2.5 2.4 2.3 m11 2.0 2.9 2.0 2.0 21 2.5 2.5 2.5 2.5 2.4 2.4 2.4 2.4 2.5 2.5 2.4 ......................................................................................................................................................... --.. -··· .......................... ,_ .. , ................ _ .. ,, .............. -...... -. ....... _ .................................... _, ................................................................... .. W12 2.8 2.9 2.8 2.7 26 2.5 2.5 2.4 2.4 2.4 2.4 2.3 2.4 2.4 2.4 2.3
~!ff~:~::::::::::~;?:::::::::::3.;~::::~::::3.I:::::::=?.I::::::::~~::::::::::IL:::::::~I::::::::E:::::~?I::::::::E::::::::I~:::::~:::::?.I::~:::I~:::::::::::~I::::::::E::::::::::?.T::::::::::::~::::::=:::::::::::::::::::~:::::::::::::::::::::: Z014 2.7 2.7 2.7 2.6 25 2.4 2.4 2.3 2.3 2.3 2.3 2.2 2.3 2.3 2.3 2.2
fable C·7 (page 6 of 6)-b :nflation: 1ates of Return for all holding periods Jercent per annum compounded annually
from 1926 to 2014
f o the From tHe beginning of
1926
. 1926
201l2--2014
3nd of 2002 2003 2004 2005 2006 2007 2008 2009 2010 2011 2012 2013 2014
Z002 2.4 ;
2002-2014
..................... --~··-........ _,._, ___ .. , ............................................................................. -............................................................................................................................................................................................................................... . 2003 2.1 1.9 ...................................................................................................................................................................................................................................................................................................................................... ,_ ........................... .. 2004 2.5 2.6 3.3 ....................................................................................................................................................................................................................................................................................................................................................................... ?.QQ.?. .............. ?.:Z. .. _ ... ...?.:!!, .......... ~.:~ ........... ~:~ ..................................................................................................................................................................................................... _ .............................................................................. .. 2006 2.7 2.8 3.1 3.0 2.5
?.9.Q.?. .............. 3.~~ ........... ~:Q ........... ~.:~ ........... 9.:~ ........... ~:~ ........... :'.1::1 ................................................................................................................................................................................................................................................... . ?_gg_~ ............... 3-:~ ............ ?.:?. ......... ...?.:?. ........... 3.:~ ............ ?.:? ............ ?.:.~ ............ Q:~ ....................................................................................................................................................................................................................... _, ......... . ?.Q9.~ ............... ?.:~ ............ ?.:?. ............ ?;?. .... ,.,_ .. ?.:~ ............ ?;~ ............ ?} ............ 1:~ ............ ?.:?. ............................................................................................................................ _ ................................................................................. .. ?.9.1.~ ............... ?.:~ ........... 3.:1 ........... 3.:?. ........... 3.:~ .......... ?.:~ .......... ?.:!... ....... ..1.:1 ............ ?.:l .......... J.:?. ............................................................................................................................................................................................... .. 2011 2.5 2.5 2.6 2.5 2.3 2.3 1.8 2.4 2.2 3.0
?.Q1.?. ............ ...?.:~ ............ ?.:~ ........... 3.:~ ........... ?.:~ ........... .?.:? ........... 3.:? ............ !.:~ ........... :?.:~ ............ ?.:l ........... ?.~~ ............ !.:?. .............................................................................................................................................................. . 2013 2.3 2.3 2.4 2.3 2.1 Z.1 1.7 2.1 1.9 2.1 1.6 1.5 2014''""'"'''""2:3"'''""'"21""""''2j"'""''"''2:2"''""""2:ii"''"'""'"2~ii"'"'"'''i'f'""""'2:ii"'''"''"'i':ii'"''"''"'i':9"'""'"'1:5·""''""i':4···· ...... 1.::3""''"'"'"'"''"""""'"'""''""''''"'''"''""''"'""'"""'"'"''"'"•""'"'"'"''"'"'""''""""'""'"'-··
Z015 Ibbotson"' SBBI"' Classic Yearbook Morningstar 297
CERTIFICATE OF SERVICE
This is to certify that a copy of the foregoing I11diana Office of Utility Cons11mer
Co1mselor P11blic~s Exltibit No. 4 Testimo1iy of Bradley E; Lorton has been served upon the
following counsel of record in the captioned proceeding by electronic service on April 20, 2017.
Clayton C. Miller Bamberger, Foreman, Oswald & Halm, LLP 201 N. Illinois Street, Suite 1225 Indianapolis, IN 46204 cmiller@bamberger;com
S. Mark Kerney Ollio Valley Gas C01poration 111 Energy Park Drive P. O.Box469 Winchester, IN 47394-0469 [email protected]
Scott Franson Deputy Consumer Counselor
INDIANA OFFICE OF UTILITY CONSUMER COUNSELOR 115 West Washington Street Suite 1500 South Indianapolis, IN 46204 [email protected] 317/232-2494-Phone 317 /232-5923 - Facsimile
Related Documents


