OFFICE TENANT IMPROVEMENT COST GUIDE PROJECT & DEVELOPMENT SERVICES NORTH AMERICA 2021

Welcome message from author
This document is posted to help you gain knowledge. Please leave a comment to let me know what you think about it! Share it to your friends and learn new things together.
Transcript

OFFICE TENANT IMPROVEMENT COST GUIDE PROJECT & DEVELOPMENT SERVICES NORTH AMERICA 2021

CONTENTS CURRENT MARKET ACTIVITY MATERIAL COSTS TENANT IMPROVEMENT COSTS LOCAL MARKET DATA
The enclosed cost data is representative of hard costs only and does not reflect the total project costs. Soft costs, furniture, fixtures and equipment, and other costs should be additive to the cost data included.
The construction market on a global basis has seen great fluctuation in materials, commodities, labor and supply chain. The values included herein are based on local contracting data that may have changed from the time of publishing due to rapidly evolving impacts of the pandemic. Please contact your local Cushman & Wakefield Project & Development Services professional for real time updates regarding the specifics of your project requirements.
2 cushmanwakefield.com
OFFICE TENANT IMPROVEMENT COST GUIDE

Visit Cushman & Wakefield’s Construction Cost Interactive Map
3OFFICE TENANT IMPROVEMENT COST GUIDE

The pandemic has disrupted many different industries, resulting in a well-reported slowdown in real estate activity. In 2020, North American office leasing was 35% below the 10-year average (43% in Canada and 34% in the U.S.). Organizations—many of which are leveraging increased levels of remote work during the pandemic—have been cautious about making new commitments for space. Renewals make up an increased proportion of leasing activity and short-term renewals were elevated throughout 2020, pointing to an inclination among occupiers to get to the other side of the lingering health concerns before implementing long-term portfolio changes.
1 Dodge Data & Analytics: New Construction Starts Report
This reduction of activity, combined with an increased focus on cost management as is typical during any recession, have led to a drop in tenant improvement construction projects. Additionally, new construction activity is also lower than it was a year ago—with new construction starts down 22% year-over-year (YoY) as of November 2020. While significant, it pales in comparison to the steepest YoY drop during the Great Financial Crisis (GFC), which was -37% in January 2009.1
New office construction had been relatively conservative during the economic expansion of the last decade. However, by Q2 2020, North American office space inventory
under construction had hit an all-time high of 157.4 million square feet (msf), which represented 4.1% of Canadian inventory and 2.5% of U.S. inventory. In the subsequent two quarters, new projects were put on hold and approximately 28 msf of construction was completed. By the end of the year, the under-construction pipeline was down 7.5%, which is the biggest 2-quarter drop since 2010. The U.S. pipeline started the year down 8.8% from mid-year 2020 and is at its lowest point in two years.
CONSTRUCTION ACTIVITY DOWN
4 cushmanwakefield.com
CURRENT MARKET ACTIVITY

NEW CONSTRUCTION STARTS Dodge Index, (2000=100, SA) 12-Month Trailing Average
80
100
120
140
160
180
200
22012-Month Average
Source: Dodge Data & Analytics: New Construction Starts Report
Organizations—many of which are leveraging
increased levels of remote work during the pandemic—
have been cautious about making new commitments for space.
5OFFICE TENANT IMPROVEMENT COST GUIDE

Markets with the largest decline in office construction pipeline (measured as a percentage of the market’s total inventory YoY) include Miami -282 basis points (bps), Salt Lake City (-268 bps), Nashville (-190 bps), Minneapolis / St. Paul (-187 bps) and Charlotte (-179 bps). On the other side of the spectrum, there are some markets with larger office construction pipelines today than they had at the end of 2019. The eight North American markets where the pipeline as a percentage of office inventory increased by over 40 bps YoY include: Raleigh/Durham (+409 bps), San Diego (+223 bps), Boston (+186 bps), Phoenix (+99 bps), Upstate NY (+85 bps), Vancouver (+83 bps), San Francisco (+70 bps) and Montreal (+47 bps).
0%
1%
2%
3%
4%
5%
2001
Q1
2002
Q1
2003
Q1
2004
Q1
2005
Q1
2006
Q1
2007
Q1
2008
Q1
2009
Q1
2010
Q1
2011
Q1
2012
Q1
2013
Q1
2014
Q1
2015
Q1
2016
Q1
2017
Q1
2018
Q1
2019
Q1
2020
Q1
Canada United States
0
20
40
60
80
100
120
140
160
2001
Q1
2001
Q3
2002
Q1
2002
Q3
2003
Q1
2003
Q3
2004
Q1
2004
Q3
2005
Q1
2005
Q3
2006
Q1
2006
Q3
2007
Q1
2007
Q3
2008
Q1
2008
Q3
2009
Q1
2009
Q3
2010
Q1
2010
Q3
2011
Q1
2011
Q3
2012
Q1
2012
Q3
2013
Q1
2013
Q3
2014
Q1
2014
Q3
2015
Q1
2015
Q3
2016
Q1
2016
Q3
2017
Q1
2017
Q3
2018
Q1
2018
Q3
2019
Q1
2019
Q3
2020
Q1
2020
Q3
MS
F
Canada United States
OFFICE UNDER CONSTRUCTIONNORTH AMERICA
OFFICE: UNDER CONSTRUCTION AS % OF INVENTORYNORTH AMERICA
1. RALEIGH/DURHAM2. SAN DIEGO3. BOSTON4. PHOENIX5. UPSTATE NY
TOP 5 PIPELINE INCREASES
Source: Cushman & Wakefield Research
6 cushmanwakefield.com
CURRENT MARKET ACTIVITY

0%
5%
10%
15%
20%
25%
0
1
2
3
4
5
6
Uni
ted
Sta
tes
Atl
anta
Au
stin
Bal
tim
ore
Bo
sto
nC
har
lott
eC
hic
ago
Cin
cinn
ati
Co
lum
bu
sD
alla
sD
enve
rD
etro
itH
ous
ton
Ind
ian
apo
lisK
ansa
s C
ity
Los
Ang
eles
Low
er C
TM
iam
i/S
. Flo
rid
aM
inne
apo
lisN
ash
ville
New
Jer
sey
New
Yor
kO
rang
e C
oun
tyO
rlan
do
Phi
lad
elp
hia
Pho
enix
Po
rtla
nd
Ral
eig
h-D
urha
mS
acra
me
nto
Sal
t La
ke C
ity
San
Die
go
San
Fra
nci
sco
San
Jo
seS
eatt
leS
t. L
ou
isT
amp
aU
pst
ate
New
…W
ash
DC
Met
roC
anad
aV
anco
uver
To
ront
oM
on
tre
alC
alg
ary
Me
xico
Cit
yM
on
terr
ey U
nd
er C
on
stru
ctio
n a
s %
of
To
tal M
arke
t In
ven
tory
MS
F
2019 Completions 2020 Completions2019 UC as % Inv 2020 UC as % Inv
OFFICE COMPLETIONS AND UNDER CONSTRUCTION FELL ACROSS MARKETS IN 2020
Source: Cushman & Wakefield Research
7OFFICE TENANT IMPROVEMENT COST GUIDE

It is hard to generalize about costs because there are a number of factors in play at any given time. The global pandemic created challenges in the supply chain, which impacted timeliness and increased the cost of obtaining goods in some cases. Conversely, recessions typically have downward pressure on contractor pricing—as they get more aggressive to win the limited number of projects occurring—and on labor costs.
Accordingly, during the GFC, the ENR building cost index and the construction cost index dropped in a synchronized way in 2009 and then followed a similar path of recovery over the next two years.2 However, during this “unique” recession, the building cost index (a measurement of cost of goods) actually increased at a higher rate in 2020 than 2019 while the construction cost index (which takes labor into account to a greater degree) was flat in 2020.
As a broader vaccine distribution rolls out, there is optimism for supply chains to return to full capacity. However, there are reasons to believe challenges related to goods and materials will subsist
2 From the ENR website, “The CCI can be used where labor costs are a high proportion of total costs. The BCI is more applicable for structures.”3 Skyrocketing steel, lumber costs threaten to slow construction jobs, Construction Dive. https://www.constructiondive.com/
news/skyrocketing-steel-lumber-costs-threaten-to-slow-construction-jobs/594969/4 U.S. Chamber of Commerce Commercial Construction Index - 2020 Q4. https://www.uschamber.com/
report/us-chamber-of-commerce-commercial-construction-index-2020-q4-05 U.S. Bureau of Labor Statistics; Moody’s Analytics Forecasted6 Payne, David. Kiplinger. “Business Spending: Strong Momentum in
New Year.” https://www.kiplinger.com/economic-forecasts/business-spending. Accessed March 3, 2021.
throughout much of 2021. Drivers ranging from factories that pulled back production when demand dropped in early-2020 to lingering supply chain hiccups that have caused ships to stack up outside of ports to tariffs on lumber and even last summer’s wildfires in the West.3 Construction contractors’ confidence in the construction market is rising, but as of Q4 2020, 71% of them are experiencing some sort of shortage in building products and materials.4
This, of course, is impacting material pricing. After decreasing in 2019, lumber and copper prices ended 2020 up 37% and 22% YoY, respectively. Prices for both commodities are expected to continue to rise over the next two years. Copper is forecast to increase 11% in 2021 while lumber prices are forecast to increase 5% by the end of the year.5
The cost of projects has been occupier-friendly in the wake of the pandemic as contractors have been aggressive in attempts to win business. On the other side of the pandemic, leasing activity and
tenant improvement activity are set to accelerate, and the build-out costs borne by tenants are likely to increase in order to cover rising materials and labor expenses. There are already signs of increased business activity as capital spending is up 6.6% YoY, surpassing pre-pandemic levels.6 Businesses are pushing ahead with expansion plans to prepare for recovery.
Venture capital (VC) can be a source of growth for build-out projects. In the period between 2015 through 2018, VC investment and technology office leasing grew in lockstep at a compound rate of 10% and 13%, respectively. Through 2020, VC investment continued unabated with a total of $170 billion, a 22% increase YoY. Two-thirds of the VC raised went to later stage companies, indicating that as VC-backed occupiers restart hiring and office space lease decision making, some of that capital could be put to build-out use soon.
FLUCTUATIONS IN COST; PENDING DEMAND
8 cushmanwakefield.com
OFFICE TENANT IMPROVEMENT COST GUIDEMATERIAL COSTS

-2%
0%
2%
4%
6%20
06
200
7
200
8
200
9
2010
2011
2012
2013
2014
2015
2016
2017
2018
2019
202
0
202
1
202
2
202
3
Recession Construction Cost Index Building Cost Index
ENR COST INDICES
Source: Engineering News Record (ENR) (McGraw-Hill), Moody’s Analytics Forecasted
100
200
300
400
500
600
700
200
6Q
1
200
6Q
4
200
7Q
3
200
8Q
2
200
9Q
1
200
9Q
4
2010
Q3
2011
Q2
2012
Q1
2012
Q4
2013
Q3
2014
Q2
2015
Q1
2015
Q4
2016
Q3
2017
Q2
2018
Q1
2018
Q4
2019
Q3
202
0Q
2
202
1Q1
202
1Q4
202
2Q3
Co
st In
dex
Forecast Lumber Steel (Pipe and Tube) Copper
22% increase YOY
37% increase YOY
RISING COMMODITY PRICES
Source: Cushman & Wakefield Research, Moody’s Analytics, U.S. Bureau of Labor Statistics
0
5
10
15
20
25
30
$40
$60
$80
$100
$120
$140
$160
$180
2015 2016 2017 2018 2019 2020
Tec
h L
easi
ng
(M
SF
)
Cap
ital
Inve
sted
($
Bill
ion
s)
$Raised Tech Office Leasing
CAGR 13%2015-2018
CAGR 10%2015-2018
VENTURE CAPITAL AND TECH OFFICE LEASING
Source: Cushman & Wakefield Research, Pitchbook
Potential pent-up demand for new space and corresponding build-outs as VC-funding was high in 2020, but occupiers were reticent to lease new space.
AN
NU
AL
CH
AN
GE
IN IN
DE
X
9OFFICE TENANT IMPROVEMENT COST GUIDE

Cushman & Wakefield’s Americas Project & Development Services team prepared a set of typical fit out plans and asked local partners in 45 markets across the U.S. and Canada to price the work. The results were reviewed and compiled to understand variations in pricing and approach. The cost of a tenant’s build-out is highly dependent upon the organization’s needs, layout, furniture and finishes. Even with those variances, it can be helpful to have a cost benchmark for planning and budgeting. Accordingly, this report lays out the average costs for key construction categories—carpentry & walls, floors & finishes, general conditions, mechanical, electrical and plumbing (MEP), and miscellaneous construction—for a typical, functional office with the following characteristics:
• Finishes: midline finishes in employee areas with slightly upgraded finishes in client-facing areas
• Technology: includes single drops to each workstation with video conference capability in the conference rooms
7 U.S. Gateway Markets: Boston, Chicago, DC, Los Angeles, New York, San Francisco8 Western U.S. Markets: Denver, Los Angeles, Orange County, Portland, Salt Lake, San Diego,
San Francisco, San Jose, Seattle9 Southeast U.S. Markets: Atlanta, Charlotte, Miami/ S. FL, Nashville, Orlando, Raleigh,
Tampa10 Southwest U.S. Markets: Austin, Dallas, Houston,
Phoenix
The location of office space is a critical factor in costs. Across 45 U.S., Mexico, Latin America and Canadian markets, the total cost of a first generation build-out varies from a low of $70 per square foot (psf) in Baltimore to over $200 psf in New York and San Francisco. Second generation costs are lower, and the gap not as extreme. The range goes from $47 psf in Baltimore to $165 psf in San Jose (Silicon Valley). Costs are highest across primary U.S. gateway office markets7 with first generation costs averaging nearly $150 psf and second generation at an average of $112 psf.
Regionally, it costs more to build out space in Western markets8 where first generation costs run an average of $131 psf and second generation costs average $99 psf. First generation costs are lowest in Southeastern9 markets at an average of $80 psf and Southwestern10 markets have the lowest second generation costs with an average of $70 psf.
U.S. national build-out costs are on par with Canadian averages.
The cost of U.S. first generation build-outs average $107 psf, slightly above the Canadian average of $100 psf. Second generation costs are relatively equal across both the U.S. and Canada at around $85 psf.
On a typical project, the largest category of expense is related to mechanical, electrical and plumbing (i.e., MEP systems), which usually accounts for 40-45% of the project cost on a first generation build-out. Of course, that can vary. In Boston and Seattle, MEP systems account for an even larger proportion of the total project cost (58% and 56%). While in Minneapolis, MEP systems average approximately a third of the total cost while carpentry and walls account for 45%. Nationally, carpentry and walls typically account for a fourth of the total project cost, while general conditions comprise nearly a fifth of the build-out cost.
CONSTRUCTION COST FACTORS
10 cushmanwakefield.com
TENANT IMPROVEMENT COSTS

$0
$25
$50
$75
$100
$125
$150
$175
$200
$225
San
Fra
nN
ew Y
ork
New
Jer
sey
San
Jo
seS
eatt
leB
ost
on
Los
Ang
eles
Ch
icag
oP
ort
lan
dO
rang
e C
oun
tyS
an D
ieg
oP
uert
o R
ico
Co
sta
Ric
aLo
wer
CT
Mo
ntr
eal
Det
roit
Min
neap
olis
Cal
gar
y &
Van
cou
ver
Gre
ater
To
ront
oP
hila
del
phi
aN
ort
hern
New
Yo
rkK
ansa
s C
ity
St.
Lo
uis
Pho
enix
Den
ver
Was
hing
ton,
DC
Mia
mi/
S. F
lori
da
Sal
t La
keH
ous
ton
Mo
nte
rre
yA
ust
inC
inci
nnat
iC
olu
mb
us
Ind
ian
apo
lisS
acra
me
nto
Me
xico
Cit
yN
ash
ville
Orl
and
oT
amp
aA
tlan
taD
alla
sC
har
lott
eR
alei
gh-
Dur
ham
Gua
dal
ajar
aB
alti
mo
re
1st Generation 2nd Generation
TENANT IMPROVEMENT COSTSSource: Cushman & Wakefield Project & Development Services
$0
$25
$50
$75
$100
$125
$150
$175
$200
$225
New
Yor
kS
an F
ran
cisc
oN
ew J
erse
yS
an J
ose
Sea
ttle
Bo
sto
nLo
s A
ngel
esC
hic
ago
Po
rtla
nd
Ora
nge
Co
unty
San
Die
go
Low
er C
TM
on
tre
alD
etro
itM
inne
apo
lisW
este
rn C
anad
aO
nta
rio
Phi
lad
elp
hia
Up
stat
e N
ew Y
ork
Kan
sas
Cit
yS
t. L
ou
isP
hoen
ixD
enve
rW
ashi
ngto
n, D
CM
iam
i/S
. Flo
rid
aS
alt
Lake
Ho
usto
nA
ust
inC
inci
nnat
iC
olu
mb
us
Ind
ian
apo
lisA
tlan
taN
ash
ville
Orl
and
oT
amp
aD
alla
sC
har
lott
eR
alei
gh
Bal
tim
ore
1st Generation 2nd Generation
11OFFICE TENANT IMPROVEMENT COST GUIDE

COSTS BY SEGMENT AND MARKET
SEGMENT COST BY MARKET (FIRST GENERATION)$0 $50 $100 $150 $200 $250
AtlantaAustin
BaltimoreBoston
Calgary & VancouverCharlotteChicago
CincinnatiColumbusLower CT
Costa RicaDallas
DenverDetroit
GuadalajaraHouston
IndianapolisKansas CityLos AngelesMexico City
Miami/S. FloridaMinneapolis
MonterreyMontrealNashville
New JerseyNew York
Upstate New YorkOrange County
OrlandoPhiladelphia
PhoenixPortland
Puerto RicoRaleigh-Durham
SacramentoSalt Lake
San DiegoSan FranSan Jose
SeattleSt. Louis
TampaGreater TorontoWashington, DC
USD
Source: Cushman & Wakefield Project & Development Services
AtlantaGeneral Conditions Misc Construction Carpentry & Walls Floors & Finishes MEP Systems
AtlantaGeneral Conditions Misc Construction Carpentry & Walls Floors & Finishes MEP Systems
AtlantaGeneral Conditions Misc Construction Carpentry & Walls Floors & Finishes MEP Systems
AtlantaGeneral Conditions Misc Construction Carpentry & Walls Floors & Finishes MEP Systems
AtlantaGeneral Conditions Misc Construction Carpentry & Walls Floors & Finishes MEP Systems
AS OF MARCH 2021
12 cushmanwakefield.com
TENANT IMPROVEMENT COSTS

0% 20% 40% 60% 80% 100%
AtlantaAustin
BaltimoreBoston
Calgary & VancouverCharlotteChicago
CincinnatiColumbusLower CT
Costa RicaDallas
DenverDetroit
GuadalajaraHouston
IndianapolisKansas CityLos AngelesMexico City
Miami/S. FloridaMinneapolis
MonterreyMontrealNashville
New JerseyNew York
Upstate New YorkOrange County
OrlandoPhiladelphia
PhoenixPortland
Puerto RicoRaleigh-Durham
SacramentoSalt Lake
San DiegoSan FranSan Jose
SeattleSt. Louis
TampaGreater TorontoWashington, DC
AtlantaGeneral Conditions Misc Construction Carpentry & Walls Floors & Finishes MEP Systems
AtlantaGeneral Conditions Misc Construction Carpentry & Walls Floors & Finishes MEP Systems
AtlantaGeneral Conditions Misc Construction Carpentry & Walls Floors & Finishes MEP Systems
AtlantaGeneral Conditions Misc Construction Carpentry & Walls Floors & Finishes MEP Systems
AtlantaGeneral Conditions Misc Construction Carpentry & Walls Floors & Finishes MEP Systems
Source: Cushman & Wakefield Project & Development Services
SEGMENT COST COMPOSITION BY MARKET (FIRST GENERATION)
13OFFICE TENANT IMPROVEMENT COST GUIDE

14
METHODOLOGYCushman & Wakefield’s Project & Development Services team prepared a set of typical fit out plans and asked local partners in 45 markets across the United States, Mexico, Latin America and Canada to price the work. The results were reviewed and compiled to understand variations in pricing and approach. Trends are identified as these same plans are priced over periods of time. The cost of a tenant’s build-out is highly dependent upon the organization’s needs, layout, furniture and finishes. Even with those variances, it can be helpful to have a cost benchmark for planning and budgeting. Accordingly, this report lays out the average costs for key construction categories—carpentry & walls, floors & finishes, general conditions, mechanical, electrical and plumbing (MEP), and miscellaneous construction—for a typical, functional office with the following characteristics: • Finishes: midline finishes in employee areas with slightly upgraded finishes in client facing areas • Technology: includes single drops to each workstation with video conference capability in the conference rooms
Project pricing structure varies across markets. Accordingly, some markets may have blank line items or additional cost components. If a specific component is blank or not shown, those costs have been accounted for in a different line item.
ATLANTA1st
Generation2nd
Generation
General Requirements $0.21 $0.23
Demo Existing $1.39
Final Cleaning $0.28 $0.30
Architectural Woodwork $4.47 $4.85
Thermal Insulation
Openings $3.59 $2.08
Glazing $5.13 $5.56
Metal Stud Framed Partitions $7.13 $8.04
Tiling $0.22 $0.24
Acoustical Ceilings $4.45 $1.73
Resilient Flooring $0.37 $0.41
Carpeting $3.02 $3.89
Painting $1.22 $1.12
Signage
Fire Extinguishers $0.10 $0.10
Appliances $0.64 $0.69
Window Shades $0.64 $0.69
Fire Protection $1.79 $1.73
Domestic Water Piping $1.44 $1.56
HVAC $14.26 $9.29
Electrical $17.82 $12.08
Subtotal $66.78 $55.96
General Conditions $2.79 $3.17
GL Insurance
GC contingency $6.96 $5.91
GC Fee $3.48 $2.96
Total $80.00 $68.00
AUSTIN1st
Generation2nd
Generation
General Requirements $1.00 $0.69
Demo Existing $0.46 $1.25
Final Cleaning $0.17 $0.17
Architectural Woodwork $4.19 $4.19
Thermal Insulation $0.74 $0.27
Openings $3.72 $3.43
Glazing $3.77 $3.77
Metal Stud Framed Partitions $4.30 $4.30
Tiling $0.39 $0.39
Acoustical Ceilings $3.95 $0.96
Resilient Flooring $0.50 $0.50
Carpeting $4.44 $4.44
Painting $3.78 $3.78
Signage $0.50 $0.50
Fire Extinguishers $0.08 $0.08
Appliances $0.40 $0.40
Window Shades $1.00 $1.00
Fire Protection $2.43 $2.43
Domestic Water Piping $2.50 $2.50
HVAC $14.99 $5.08
Electrical $17.98 $9.99
Subtotal $71.29 $50.12
General Conditions $4.82 $3.46
GL Insurance $1.00 $0.80
GC contingency
GC Fee $2.06 $1.48
Total $79.17 $55.87
Sales Tax Total $4.61
Contingency (10% of Total) $7.92 $5.59
Total with Tax and Contingency $87.09 $66.06
*Inclusive of tax and contingency
14 cushmanwakefield.com
LOCAL MARKET DATA

METHODOLOGYCushman & Wakefield’s Project & Development Services team prepared a set of typical fit out plans and asked local partners in 45 markets across the United States, Mexico, Latin America and Canada to price the work. The results were reviewed and compiled to understand variations in pricing and approach. Trends are identified as these same plans are priced over periods of time. The cost of a tenant’s build-out is highly dependent upon the organization’s needs, layout, furniture and finishes. Even with those variances, it can be helpful to have a cost benchmark for planning and budgeting. Accordingly, this report lays out the average costs for key construction categories—carpentry & walls, floors & finishes, general conditions, mechanical, electrical and plumbing (MEP), and miscellaneous construction—for a typical, functional office with the following characteristics: • Finishes: midline finishes in employee areas with slightly upgraded finishes in client facing areas • Technology: includes single drops to each workstation with video conference capability in the conference rooms
Project pricing structure varies across markets. Accordingly, some markets may have blank line items or additional cost components. If a specific component is blank or not shown, those costs have been accounted for in a different line item.
BALTIMORE1st
Generation2nd
Generation
General Requirements $3.73 $3.15
Demo Existing
Final Cleaning $0.23 $0.23
Architectural Woodwork $6.01 $6.01
Thermal Insulation $0.18 $0.15
Openings $3.64 $3.21
Glazing $4.52 $4.52
Metal Stud Framed Partitions $5.23 $4.70
Tiling $0.37 $0.37
Acoustical Ceilings $2.61 $0.43
Resilient Flooring $0.59 $0.27
Carpeting $3.12 $3.01
Painting $1.40 $1.32
Signage $0.16 $0.16
Fire Extinguishers $0.27 $0.27
Appliances $0.85 $0.85
Window Shades $0.70 $0.27
Fire Protection $2.24 $1.90
Domestic Water Piping $1.22 $0.83
HVAC $14.17 $2.90
Electrical $11.55 $7.91
Subtotal $62.81 $42.46
General Conditions
GL Insurance $0.45 $0.38
GC contingency $2.13 $1.60
GC Fee $4.31 $2.61
Total $69.69 $47.04
BOSTON1st
Generation2nd
Generation
General Requirements $3.00 $2.00
Demo Existing $3.50
Final Cleaning $0.45 $0.45
Architectural Woodwork $6.40 $6.40
Thermal Insulation
Openings $4.05 $4.05
Glazing $2.60 $2.60
Metal Stud Framed Partitions $13.59 $8.40
Tiling $1.87 $1.87
Acoustical Ceilings $4.60 $4.07
Resilient Flooring $0.85 $0.85
Carpeting $5.84 $5.84
Painting $1.50 $1.44
Signage $0.50 $0.50
Fire Extinguishers $0.06 $0.06
Appliances $0.48 $0.48
Window Shades
Fire Protection $2.75 $2.00
Domestic Water Piping $2.00 $2.00
HVAC $40.00 $24.00
Electrical $35.00 $32.00
Subtotal $125.54 $102.51
General Conditions $5.24 $5.24
GL Insurance $1.05 $1.05
GC contingency $3.30 $2.72
GC Fee $3.04 $2.51
Total $138.17 $114.03
*Inclusive of tax and contingency *Inclusive of tax and contingency
15OFFICE TENANT IMPROVEMENT COST GUIDE
LOCAL MARKET DATA

16
METHODOLOGYCushman & Wakefield’s Project & Development Services team prepared a set of typical fit out plans and asked local partners in 45 markets across the United States, Mexico, Latin America and Canada to price the work. The results were reviewed and compiled to understand variations in pricing and approach. Trends are identified as these same plans are priced over periods of time. The cost of a tenant’s build-out is highly dependent upon the organization’s needs, layout, furniture and finishes. Even with those variances, it can be helpful to have a cost benchmark for planning and budgeting. Accordingly, this report lays out the average costs for key construction categories—carpentry & walls, floors & finishes, general conditions, mechanical, electrical and plumbing (MEP), and miscellaneous construction—for a typical, functional office with the following characteristics: • Finishes: midline finishes in employee areas with slightly upgraded finishes in client facing areas • Technology: includes single drops to each workstation with video conference capability in the conference rooms
Project pricing structure varies across markets. Accordingly, some markets may have blank line items or additional cost components. If a specific component is blank or not shown, those costs have been accounted for in a different line item.
CHARLOTTE1st
Generation2nd
Generation
General Requirements $1.43 $1.37
Demo Existing $0.16 $2.96
Final Cleaning $0.41 $0.40
Architectural Woodwork $5.03 $4.83
Thermal Insulation $0.17 $0.16
Openings $2.00 $1.51
Glazing $7.06 $6.79
Metal Stud Framed Partitions $6.60 $5.81
Tiling $0.27 $0.26
Acoustical Ceilings $4.15 $2.11
Resilient Flooring $0.62 $0.59
Carpeting $3.26 $3.14
Painting $1.36 $1.30
Signage $0.08 $0.08
Fire Extinguishers $0.07 $0.06
Appliances $0.42 $0.41
Window Shades $0.95 $0.08
Fire Protection $1.60 $1.23
Domestic Water Piping $0.82 $0.80
HVAC $8.88 $6.85
Electrical $21.01 $17.07
Subtotal $66.36 $57.81
General Conditions $4.45 $4.43
GL Insurance $0.64 $0.56
GC contingency $0.92 $0.81
GC Fee $2.62 $2.40
Total $75.00 $66.00
CHICAGO1st
Generation2nd
Generation
General Requirements $3.24 $3.30
Demo Existing $2.94
Final Cleaning $0.54 $0.55
Architectural Woodwork $8.03 $8.18
Thermal Insulation
Openings $4.89 $4.46
Glazing $5.08 $5.17
Metal Stud Framed Partitions $12.09 $9.17
Tiling
Acoustical Ceilings $5.76 $2.73
Resilient Flooring $1.54 $1.57
Carpeting $6.43 $6.55
Painting $3.34 $3.41
Signage $0.26 $0.26
Fire Extinguishers $0.08 $0.08
Appliances $0.62 $0.63
Window Shades $1.70 $0.26
Fire Protection $3.37 $1.75
Domestic Water Piping $2.83 $2.88
HVAC $16.72 $7.60
Electrical $29.59 $26.21
Subtotal $106.12 $87.69
General Conditions $9.26 $9.43
GL Insurance $1.33 $1.12
GC contingency $5.84 $4.91
GC Fee $2.45 $3.09
Total $125.00 $106.25
*Inclusive of tax and contingency *Inclusive of tax and contingency
16 cushmanwakefield.com
LOCAL MARKET DATA

METHODOLOGYCushman & Wakefield’s Project & Development Services team prepared a set of typical fit out plans and asked local partners in 45 markets across the United States, Mexico, Latin America and Canada to price the work. The results were reviewed and compiled to understand variations in pricing and approach. Trends are identified as these same plans are priced over periods of time. The cost of a tenant’s build-out is highly dependent upon the organization’s needs, layout, furniture and finishes. Even with those variances, it can be helpful to have a cost benchmark for planning and budgeting. Accordingly, this report lays out the average costs for key construction categories—carpentry & walls, floors & finishes, general conditions, mechanical, electrical and plumbing (MEP), and miscellaneous construction—for a typical, functional office with the following characteristics: • Finishes: midline finishes in employee areas with slightly upgraded finishes in client facing areas • Technology: includes single drops to each workstation with video conference capability in the conference rooms
Project pricing structure varies across markets. Accordingly, some markets may have blank line items or additional cost components. If a specific component is blank or not shown, those costs have been accounted for in a different line item.
CINCINNATI1st
Generation2nd
Generation
General Requirements $1.29 $1.81
Demo Existing $1.61
Final Cleaning $0.38 $0.35
Architectural Woodwork $5.30 $4.84
Thermal Insulation
Openings $3.42 $2.91
Glazing $2.96 $2.70
Metal Stud Framed Partitions $13.88 $11.79
Tiling $0.40 $0.43
Acoustical Ceilings $3.09 $2.54
Resilient Flooring $0.32 $0.29
Carpeting $6.30 $5.75
Painting $1.99 $2.15
Signage $0.43 $0.39
Fire Extinguishers $0.09 $0.06
Appliances $0.43 $0.39
Window Shades $1.32 $0.91
Fire Protection $2.43 $1.33
Domestic Water Piping $1.43 $1.11
HVAC $12.16 $9.48
Electrical $16.33 $13.55
Subtotal $73.95 $64.40
General Conditions $2.71 $2.11
GL Insurance $0.33 $0.37
GC contingency $3.46 $2.87
GC Fee $4.54 $3.77
Total $85.00 $73.53
COLUMBUS1st
Generation2nd
Generation
General Requirements $1.35 $1.73
Demo Existing $1.69
Final Cleaning $0.26 $0.24
Architectural Woodwork $6.38 $6.27
Thermal Insulation
Openings $3.66 $3.04
Glazing $2.39 $2.41
Metal Stud Framed Partitions $12.05 $10.48
Tiling $0.52 $0.59
Acoustical Ceilings $3.27 $2.80
Resilient Flooring $0.36 $0.38
Carpeting $6.88 $6.37
Painting $2.09 $2.16
Signage $0.38 $0.35
Fire Extinguishers $0.11 $0.05
Appliances $0.51 $0.47
Window Shades $1.27 $1.18
Fire Protection $2.15 $1.60
Domestic Water Piping $1.48 $1.53
HVAC $12.35 $8.21
Electrical $15.85 $12.15
Subtotal $73.30 $63.70
General Conditions $2.94 $2.47
GL Insurance $0.30 $0.28
GC contingency $3.65 $3.06
GC Fee $4.81 $4.00
Total $85.00 $73.53
*Inclusive of tax and contingency *Inclusive of tax and contingency
17OFFICE TENANT IMPROVEMENT COST GUIDE
LOCAL MARKET DATA

18
METHODOLOGYCushman & Wakefield’s Project & Development Services team prepared a set of typical fit out plans and asked local partners in 45 markets across the United States, Mexico, Latin America and Canada to price the work. The results were reviewed and compiled to understand variations in pricing and approach. Trends are identified as these same plans are priced over periods of time. The cost of a tenant’s build-out is highly dependent upon the organization’s needs, layout, furniture and finishes. Even with those variances, it can be helpful to have a cost benchmark for planning and budgeting. Accordingly, this report lays out the average costs for key construction categories—carpentry & walls, floors & finishes, general conditions, mechanical, electrical and plumbing (MEP), and miscellaneous construction—for a typical, functional office with the following characteristics: • Finishes: midline finishes in employee areas with slightly upgraded finishes in client facing areas • Technology: includes single drops to each workstation with video conference capability in the conference rooms
Project pricing structure varies across markets. Accordingly, some markets may have blank line items or additional cost components. If a specific component is blank or not shown, those costs have been accounted for in a different line item.
DALLAS1st
Generation2nd
Generation
General Requirements $1.13 $1.47
Demo Existing $1.00 $1.20
Final Cleaning $0.25 $0.25
Architectural Woodwork $3.37 $3.20
Thermal Insulation $0.53 $0.56
Openings $3.24 $2.99
Glazing $3.31 $3.15
Metal Stud Framed Partitions $10.05 $10.05
Tiling $0.31 $0.29
Acoustical Ceilings $3.14 $1.49
Resilient Flooring $0.40 $0.40
Carpeting $3.70 $3.70
Painting $3.05 $3.00
Signage $0.42 $0.42
Fire Extinguishers $0.13 $0.12
Appliances $0.48 $0.45
Window Shades $1.43 $0.29
Fire Protection $2.47 $2.10
Domestic Water Piping $0.62 $0.51
HVAC $11.54 $6.75
Electrical $13.59 $11.58
Subtotal $64.17 $53.98
General Conditions $4.20 $4.20
GL Insurance $1.05 $0.85
GC contingency
GC Fee $2.21 $1.78
Total $71.63 $60.79
Sales Tax Total
Contingency (10% of Total) $7.16 $6.08
Total with Tax and Contingency $78.79 $66.87
COSTA RICA1st
Generation2nd
Generation
General Requirements $5.46 $2.33
Demo Existing $0.00 $2.03
Final Cleaning $1.56 $1.56
Architectural Woodwork $4.55 $4.55
Thermal Insulation $0.00 $0.00
Openings $2.71 $1.65
Glazing $3.25 $3.25
Metal Stud Framed Partitions $4.55 $3.19
Tiling $0.00 $0.00
Acoustical Ceilings $2.86 $1.00
Resilient Flooring $4.06 $4.06
Carpeting $4.55 $4.55
Painting $2.60 $2.60
Signage $0.59 $0.59
Fire Extinguishers $0.11 $0.11
Appliances $0.72 $0.72
Window Shades $2.08 $0.27
Fire Protection $5.07 $2.03
Domestic Water Piping $1.30 $0.81
HVAC $15.61 $8.63
Electrical $19.25 $10.55
Subtotal $80.90 $54.48
General Conditions $5.66 $3.81
GL Insurance $1.38 $1.40
GC contingency $8.09 $5.45
GC Fee $8.09 $5.45
Total $104.12 $70.58
*Inclusive of tax and contingency. Figures provided are USD.
18 cushmanwakefield.com
LOCAL MARKET DATA
METHODOLOGYCushman & Wakefield’s Project & Development Services team prepared a set of typical fit out plans and asked local partners in 45 markets across the United States, Mexico, Latin America and Canada to price the work. The results were reviewed and compiled to understand variations in pricing and approach. Trends are identified as these same plans are priced over periods of time. The cost of a tenant’s build-out is highly dependent upon the organization’s needs, layout, furniture and finishes. Even with those variances, it can be helpful to have a cost benchmark for planning and budgeting. Accordingly, this report lays out the average costs for key construction categories—carpentry & walls, floors & finishes, general conditions, mechanical, electrical and plumbing (MEP), and miscellaneous construction—for a typical, functional office with the following characteristics: • Finishes: midline finishes in employee areas with slightly upgraded finishes in client facing areas • Technology: includes single drops to each workstation with video conference capability in the conference rooms
Project pricing structure varies across markets. Accordingly, some markets may have blank line items or additional cost components. If a specific component is blank or not shown, those costs have been accounted for in a different line item.
DENVER1st
Generation2nd
Generation
General Requirements $1.79 $1.69
Demo Existing $0.20 $2.12
Final Cleaning $0.31 $0.31
Architectural Woodwork $4.67 $4.67
Thermal Insulation $0.02 $0.01
Openings $3.98 $3.34
Glazing $4.13 $4.12
Metal Stud Framed Partitions $7.11 $5.67
Tiling $0.26 $0.26
Acoustical Ceilings $4.37 $1.86
Resilient Flooring $0.48 $0.50
Carpeting $3.81 $4.10
Painting $1.65 $1.62
Signage $0.18 $0.18
Fire Extinguishers $0.07 $0.07
Appliances $0.50 $0.50
Window Shades $1.25 $0.18
Fire Protection $3.22 $1.59
Domestic Water Piping $0.74 $0.69
HVAC $14.71 $5.27
Electrical $17.48 $12.10
Subtotal $70.93 $50.85
General Conditions $3.88 $3.50
GL Insurance $0.98 $0.72
GC contingency
GC Fee $3.95 $2.97
Total $79.75 $58.03
Sales Tax Total $3.84 $2.79
Contingency (10% of Total) $7.97 $5.80
Total with Tax and Contingency $91.56 $66.62
DETROIT1st
Generation2nd
Generation
General Requirements $2.04 $1.78
Demo Existing $2.44
Final Cleaning $0.34 $0.37
Architectural Woodwork $5.63 $4.32
Thermal Insulation
Openings $5.87 $6.35
Glazing $4.69 $5.08
Metal Stud Framed Partitions $7.04 $3.15
Tiling
Acoustical Ceilings $5.87 $1.63
Resilient Flooring $1.23 $1.33
Carpeting $2.74 $2.97
Painting $2.58 $2.80
Signage $0.26 $0.28
Fire Extinguishers $0.09 $0.10
Appliances $0.38 $0.41
Window Shades $1.55 $1.68
Fire Protection $1.76 $2.44
Domestic Water Piping $1.78 $1.93
HVAC $15.73 $11.18
Electrical $24.88 $19.06
Subtotal $84.48 $69.30
General Conditions $7.75 $8.39
GL Insurance $1.36 $1.47
GC contingency $2.35 $2.54
GC Fee $4.07 $3.30
Total $100.00 $85.00
*Inclusive of tax and contingency
19OFFICE TENANT IMPROVEMENT COST GUIDE
LOCAL MARKET DATA
20
METHODOLOGYCushman & Wakefield’s Project & Development Services team prepared a set of typical fit out plans and asked local partners in 45 markets across the United States, Mexico, Latin America and Canada to price the work. The results were reviewed and compiled to understand variations in pricing and approach. Trends are identified as these same plans are priced over periods of time. The cost of a tenant’s build-out is highly dependent upon the organization’s needs, layout, furniture and finishes. Even with those variances, it can be helpful to have a cost benchmark for planning and budgeting. Accordingly, this report lays out the average costs for key construction categories—carpentry & walls, floors & finishes, general conditions, mechanical, electrical and plumbing (MEP), and miscellaneous construction—for a typical, functional office with the following characteristics: • Finishes: midline finishes in employee areas with slightly upgraded finishes in client facing areas • Technology: includes single drops to each workstation with video conference capability in the conference rooms
Project pricing structure varies across markets. Accordingly, some markets may have blank line items or additional cost components. If a specific component is blank or not shown, those costs have been accounted for in a different line item.
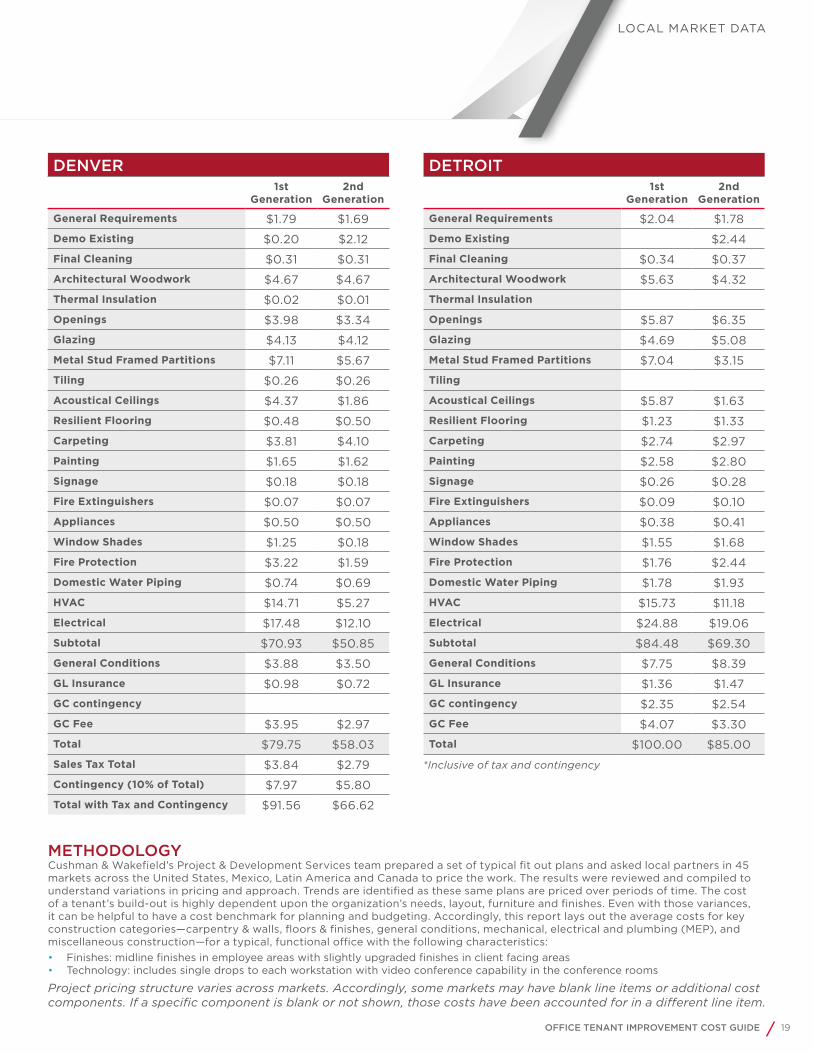
HOUSTON1st
Generation2nd
Generation
General Requirements $1.06 $1.03
Demo Existing $0.08 $2.07
Final Cleaning $0.33 $0.33
Architectural Woodwork $4.22 $3.77
Thermal Insulation $0.11 $0.09
Openings $3.73 $2.10
Glazing $3.93 $3.47
Metal Stud Framed Partitions $7.64 $6.23
Tiling $1.78 $1.60
Acoustical Ceilings $4.97 $1.33
Resilient Flooring $0.67 $0.56
Carpeting $3.60 $3.19
Painting $0.96 $0.82
Signage $0.50 $0.34
Fire Extinguishers $0.07 $0.04
Appliances $0.98 $0.92
Window Shades $0.12 $0.12
Fire Protection $1.78 $1.54
Domestic Water Piping $1.05 $0.93
HVAC $18.14 $11.67
Electrical $15.87 $10.55
Subtotal $71.60 $52.71
General Conditions $5.48 $4.88
GL Insurance $1.40 $0.98
GC contingency
GC Fee $2.33 $1.85
Total $80.81 $60.42
Sales Tax Total $4.98
Contingency (10% of Total) $8.08 $6.04
Total with Tax and Contingency $88.89 $71.45
GUADALAJARA, MEXICO1st
Generation2nd
Generation
General Requirements $2.77 $1.53
Demo Existing $1.27
Final Cleaning $0.93 $0.93
Architectural Woodwork $2.62 $2.62
Thermal Insulation $0.00 $0.00
Openings $1.97 $1.20
Glazing $2.37 $2.37
Metal Stud Framed Partitions $2.59 $1.34
Tiling
Acoustical Ceilings $2.29 $1.58
Resilient Flooring $2.51 $2.51
Carpeting $3.25 $3.25
Painting $1.10 $0.68
Signage $0.42 $0.42
Fire Extinguishers $0.09 $0.09
Appliances $0.57 $0.57
Window Shades $1.66 $0.65
Fire Protection $3.69 $1.47
Domestic Water Piping $0.54 $0.41
HVAC $12.49 $7.43
Electrical $15.40 $8.44
Subtotal $57.27 $38.76
General Conditions $2.86 $1.94
GL Insurance $1.10 $1.10
GC contingency $5.73 $3.88
GC Fee $6.30 $4.26
Total $73.26 $49.94
*Inclusive of tax and contingency. Figures provided are USD.
20 cushmanwakefield.com
LOCAL MARKET DATA

METHODOLOGYCushman & Wakefield’s Project & Development Services team prepared a set of typical fit out plans and asked local partners in 45 markets across the United States, Mexico, Latin America and Canada to price the work. The results were reviewed and compiled to understand variations in pricing and approach. Trends are identified as these same plans are priced over periods of time. The cost of a tenant’s build-out is highly dependent upon the organization’s needs, layout, furniture and finishes. Even with those variances, it can be helpful to have a cost benchmark for planning and budgeting. Accordingly, this report lays out the average costs for key construction categories—carpentry & walls, floors & finishes, general conditions, mechanical, electrical and plumbing (MEP), and miscellaneous construction—for a typical, functional office with the following characteristics: • Finishes: midline finishes in employee areas with slightly upgraded finishes in client facing areas • Technology: includes single drops to each workstation with video conference capability in the conference rooms
Project pricing structure varies across markets. Accordingly, some markets may have blank line items or additional cost components. If a specific component is blank or not shown, those costs have been accounted for in a different line item.
INDIANAPOLIS1st
Generation2nd
Generation
General Requirements $1.39 $1.52
Demo Existing $1.91
Final Cleaning $0.33 $0.30
Architectural Woodwork $6.54 $6.35
Thermal Insulation
Openings $3.74 $2.94
Glazing $2.91 $2.67
Metal Stud Framed Partitions $12.08 $10.61
Tiling $0.43 $0.43
Acoustical Ceilings $3.32 $2.83
Resilient Flooring $0.36 $0.33
Carpeting $6.28 $5.76
Painting $1.92 $1.96
Signage $0.47 $0.43
Fire Extinguishers $0.09 $0.08
Appliances $0.47 $0.43
Window Shades $1.40 $1.28
Fire Protection $2.22 $1.90
Domestic Water Piping $1.87 $1.39
HVAC $12.56 $8.91
Electrical $15.40 $11.83
Subtotal $73.77 $63.87
General Conditions $2.61 $2.28
GL Insurance $0.24 $0.26
GC contingency $3.55 $2.83
GC Fee $4.83 $4.28
Total $85.00 $73.53
KANSAS CITY1st
Generation2nd
Generation
General Requirements $0.35 $0.44
Demo Existing $0.23 $3.57
Final Cleaning $0.24 $0.24
Architectural Woodwork $5.36 $5.31
Thermal Insulation $0.56 $0.28
Openings $6.07 $6.01
Glazing $0.69 $0.68
Metal Stud Framed Partitions $9.86 $9.13
Tiling $0.31 $0.31
Acoustical Ceilings $3.76 $0.23
Resilient Flooring $1.45 $1.44
Carpeting $6.83 $6.77
Painting $2.40 $2.37
Signage $0.16 $0.16
Fire Extinguishers $0.17 $0.17
Appliances $0.60 $0.59
Window Shades $0.23 $0.23
Fire Protection $6.00 $5.15
Domestic Water Piping $1.56 $1.55
HVAC $14.96 $8.72
Electrical $19.19 $15.06
Subtotal $80.97 $68.42
General Conditions $3.72 $3.27
GL Insurance $0.59 $0.52
GC contingency $3.94 $3.46
GC Fee $5.79 $5.09
Total $95.00 $80.75
*Inclusive of tax and contingency *Inclusive of tax and contingency
21OFFICE TENANT IMPROVEMENT COST GUIDE
LOCAL MARKET DATA

22
METHODOLOGYCushman & Wakefield’s Project & Development Services team prepared a set of typical fit out plans and asked local partners in 45 markets across the United States, Mexico, Latin America and Canada to price the work. The results were reviewed and compiled to understand variations in pricing and approach. Trends are identified as these same plans are priced over periods of time. The cost of a tenant’s build-out is highly dependent upon the organization’s needs, layout, furniture and finishes. Even with those variances, it can be helpful to have a cost benchmark for planning and budgeting. Accordingly, this report lays out the average costs for key construction categories—carpentry & walls, floors & finishes, general conditions, mechanical, electrical and plumbing (MEP), and miscellaneous construction—for a typical, functional office with the following characteristics: • Finishes: midline finishes in employee areas with slightly upgraded finishes in client facing areas • Technology: includes single drops to each workstation with video conference capability in the conference rooms
Project pricing structure varies across markets. Accordingly, some markets may have blank line items or additional cost components. If a specific component is blank or not shown, those costs have been accounted for in a different line item.
LOS ANGELES1st
Generation2nd
Generation
General Requirements $0.32 $0.32
Demo Existing $0.34 $1.46
Final Cleaning $0.17 $0.17
Architectural Woodwork $3.73 $3.73
Thermal Insulation $0.34 $0.34
Openings $5.82 $4.99
Glazing $5.73 $3.44
Metal Stud Framed Partitions $12.90 $8.60
Tiling $0.86 $0.86
Acoustical Ceilings $5.73 $2.01
Resilient Flooring $0.52 $0.52
Carpeting $4.01 $4.01
Painting $3.15 $3.15
Signage $0.17 $0.09
Fire Extinguishers $0.13 $0.09
Appliances $0.86 $0.86
Window Shades $2.29 $1.15
Fire Protection $5.16 $3.84
Domestic Water Piping $3.50 $2.01
HVAC $20.65 $9.41
Electrical $40.14 $28.67
Subtotal $116.55 $79.72
General Conditions $2.81 $2.81
GL Insurance $0.86 $0.86
GC contingency
GC Fee $4.63 $3.13
Total $124.85 $86.53
Sales Tax Total $0.00 $0.00
Contingency (10% of Total) $12.48 $8.65
Total with Tax and Contingency $137.33 $95.18
LOWER CONNECTICUT1st
Generation2nd
Generation
General Requirements $2.68 $2.42
Demo Existing $1.32
Final Cleaning $0.31 $0.31
Architectural Woodwork $4.50 $4.50
Thermal Insulation $0.43 $0.43
Openings $0.66 $0.66
Glazing $11.20 $10.62
Metal Stud Framed Partitions $9.79 $7.01
Tiling $0.31 $0.31
Acoustical Ceilings $6.49 $3.94
Resilient Flooring $0.97 $0.94
Carpeting $4.86 $4.86
Painting $1.70 $1.70
Signage $0.44 $0.44
Fire Extinguishers $0.09 $0.09
Appliances $0.26 $0.26
Window Shades $1.10 $0.28
Fire Protection $2.17 $1.27
Domestic Water Piping $1.23 $0.70
HVAC $18.94 $11.38
Electrical $16.83 $11.78
Subtotal $85.00 $65.00
General Conditions $5.35 $4.11
GL Insurance $1.46 $1.12
GC contingency $8.50 $6.50
GC Fee $2.84 $2.18
Total $103.15 $78.91
*Inclusive of tax and contingency
22 cushmanwakefield.com
LOCAL MARKET DATA

METHODOLOGYCushman & Wakefield’s Project & Development Services team prepared a set of typical fit out plans and asked local partners in 45 markets across the United States, Mexico, Latin America and Canada to price the work. The results were reviewed and compiled to understand variations in pricing and approach. Trends are identified as these same plans are priced over periods of time. The cost of a tenant’s build-out is highly dependent upon the organization’s needs, layout, furniture and finishes. Even with those variances, it can be helpful to have a cost benchmark for planning and budgeting. Accordingly, this report lays out the average costs for key construction categories—carpentry & walls, floors & finishes, general conditions, mechanical, electrical and plumbing (MEP), and miscellaneous construction—for a typical, functional office with the following characteristics: • Finishes: midline finishes in employee areas with slightly upgraded finishes in client facing areas • Technology: includes single drops to each workstation with video conference capability in the conference rooms
Project pricing structure varies across markets. Accordingly, some markets may have blank line items or additional cost components. If a specific component is blank or not shown, those costs have been accounted for in a different line item.
MEXICO CITY, MEXICO1st
Generation2nd
Generation
General Requirements $3.72 $2.04
Demo Existing $0.00 $1.39
Final Cleaning $1.25 $1.25
Architectural Woodwork $3.64 $3.64
Thermal Insulation $0.00 $0.00
Openings $2.17 $1.32
Glazing $2.60 $2.60
Metal Stud Framed Partitions $3.64 $1.89
Tiling $0.00 $0.00
Acoustical Ceilings $2.29 $1.58
Resilient Flooring $2.51 $2.51
Carpeting $3.25 $3.25
Painting $1.21 $0.74
Signage $0.46 $0.46
Fire Extinguishers $0.09 $0.09
Appliances $0.57 $0.57
Window Shades $1.66 $0.65
Fire Protection $4.06 $1.62
Domestic Water Piping $0.74 $0.56
HVAC $12.49 $7.43
Electrical $15.40 $8.44
Subtotal $61.76 $42.06
General Conditions $4.34 $2.94
GL Insurance $1.10 $1.10
GC contingency $6.20 $4.20
GC Fee $7.44 $5.04
Total $80.85 $55.33
*Inclusive of tax and contingency. Figures provided are USD.
MIAMI/S. FLORIDA1st
Generation2nd
Generation
General Requirements
Demo Existing $3.98
Final Cleaning $0.45 $0.44
Architectural Woodwork $4.58 $4.49
Thermal Insulation
Openings $3.91 $3.83
Glazing $6.09 $5.97
Metal Stud Framed Partitions $6.13 $4.09
Tiling $0.36 $0.36
Acoustical Ceilings $4.37 $2.86
Resilient Flooring
Carpeting $7.67 $7.52
Painting $1.95 $1.75
Signage
Fire Extinguishers $0.16
Appliances $0.42 $0.41
Window Shades $1.00
Fire Protection $1.95 $1.72
Domestic Water Piping $0.67 $0.46
HVAC $12.16 $10.32
Electrical $25.29 $19.20
Subtotal $77.16 $67.38
General Conditions $5.22 $5.12
GL Insurance $1.03 $0.91
GC contingency
GC Fee $6.59 $5.80
Total $90.00 $79.20
*Inclusive of tax and contingency
23OFFICE TENANT IMPROVEMENT COST GUIDE
LOCAL MARKET DATA

24
METHODOLOGYCushman & Wakefield’s Project & Development Services team prepared a set of typical fit out plans and asked local partners in 45 markets across the United States, Mexico, Latin America and Canada to price the work. The results were reviewed and compiled to understand variations in pricing and approach. Trends are identified as these same plans are priced over periods of time. The cost of a tenant’s build-out is highly dependent upon the organization’s needs, layout, furniture and finishes. Even with those variances, it can be helpful to have a cost benchmark for planning and budgeting. Accordingly, this report lays out the average costs for key construction categories—carpentry & walls, floors & finishes, general conditions, mechanical, electrical and plumbing (MEP), and miscellaneous construction—for a typical, functional office with the following characteristics: • Finishes: midline finishes in employee areas with slightly upgraded finishes in client facing areas • Technology: includes single drops to each workstation with video conference capability in the conference rooms
Project pricing structure varies across markets. Accordingly, some markets may have blank line items or additional cost components. If a specific component is blank or not shown, those costs have been accounted for in a different line item.
MONTERREY, MEXICO1st
Generation2nd
Generation
General Requirements $4.26 $1.92
Demo Existing $2.65
Final Cleaning $1.43 $1.43
Architectural Woodwork $4.18 $4.18
Thermal Insulation
Openings $2.49 $1.17
Glazing $2.98 $2.98
Metal Stud Framed Partitions $4.18 $2.30
Tiling
Acoustical Ceilings $2.63 $1.65
Resilient Flooring $2.45 $2.45
Carpeting $3.17 $3.17
Painting $1.39 $1.39
Signage $0.53 $0.53
Fire Extinguishers $0.10 $0.10
Appliances $0.66 $0.66
Window Shades $1.91 $0.25
Fire Protection $4.65 $2.05
Domestic Water Piping $0.85 $0.26
HVAC $12.17 $8.03
Electrical $15.01 $8.56
Subtotal $65 $46
General Conditions $6.50 $4.57
GL Insurance $1.20 $1.20
GC contingency $6.50 $4.57
GC Fee $8.46 $5.95
Total $87.71 $62.02
MINNEAPOLIS1st
Generation2nd
Generation
General Requirements $0.64 $0.52
Demo Existing $4.87
Final Cleaning $0.68 $0.55
Architectural Woodwork $8.02 $6.54
Thermal Insulation
Openings $1.17 $0.95
Glazing $23.76 $19.38
Metal Stud Framed Partitions $12.13 $8.32
Tiling $0.43 $0.35
Acoustical Ceilings
Resilient Flooring $2.18 $1.78
Carpeting $4.77 $3.89
Painting $1.78 $1.45
Signage $0.25 $0.20
Fire Extinguishers $0.09 $0.07
Appliances $0.48 $0.40
Window Shades $0.06 $0.05
Fire Protection $2.79 $2.28
Domestic Water Piping $3.11 $2.53
HVAC $9.38 $7.65
Electrical $18.64 $15.20
Subtotal $90.34 $76.98
General Conditions $5.65 $4.61
GL Insurance $0.86 $0.73
GC contingency
GC Fee $3.15 $2.68
Total $100.00 $85.00
*Inclusive of tax and contingency *Inclusive of tax and contingency. All figures provide are USD.
24 cushmanwakefield.com
LOCAL MARKET DATA

METHODOLOGYCushman & Wakefield’s Project & Development Services team prepared a set of typical fit out plans and asked local partners in 45 markets across the United States, Mexico, Latin America and Canada to price the work. The results were reviewed and compiled to understand variations in pricing and approach. Trends are identified as these same plans are priced over periods of time. The cost of a tenant’s build-out is highly dependent upon the organization’s needs, layout, furniture and finishes. Even with those variances, it can be helpful to have a cost benchmark for planning and budgeting. Accordingly, this report lays out the average costs for key construction categories—carpentry & walls, floors & finishes, general conditions, mechanical, electrical and plumbing (MEP), and miscellaneous construction—for a typical, functional office with the following characteristics: • Finishes: midline finishes in employee areas with slightly upgraded finishes in client facing areas • Technology: includes single drops to each workstation with video conference capability in the conference rooms
Project pricing structure varies across markets. Accordingly, some markets may have blank line items or additional cost components. If a specific component is blank or not shown, those costs have been accounted for in a different line item.
MONTREAL, CANADA1st
Generation2nd
Generation
General Requirements $0.83 $0.70
Demo Existing $0.14 $2.03
Final Cleaning $0.34 $0.36
Architectural Woodwork $5.02 $5.27
Thermal Insulation
Openings $5.47 $5.74
Glazing $5.44 $5.70
Metal Stud Framed Partitions $7.32 $3.76
Tiling $0.43 $0.45
Acoustical Ceilings $5.81 $2.76
Resilient Flooring $0.57 $0.59
Carpeting $4.45 $5.42
Painting $2.54 $2.66
Signage $0.28 $0.29
Fire Extinguishers $0.14 $0.15
Appliances $0.56 $0.58
Window Shades $2.03 $0.23
Fire Protection $1.94 $1.52
Domestic Water Piping $1.94 $1.17
HVAC $17.44 $12.19
Electrical $24.22 $20.32
Subtotal $86.90 $71.90
General Conditions $4.45 $4.42
GL Insurance $0.56 $0.58
GC contingency $5.56 $5.83
GC Fee $2.54 $2.27
Total $100.00 $85.00
NASHVILLE1st
Generation2nd
Generation
General Requirements
Demo Existing $1.79
Final Cleaning $0.55 $0.51
Architectural Woodwork $2.20 $2.05
Thermal Insulation
Openings $2.20 $2.05
Glazing $5.49 $5.12
Metal Stud Framed Partitions $6.32 $5.88
Tiling $1.37 $1.28
Acoustical Ceilings $3.35 $0.51
Resilient Flooring $0.82 $0.77
Carpeting $4.39 $4.09
Painting $1.37 $1.28
Signage $0.08 $0.08
Fire Extinguishers $0.04 $0.04
Appliances $0.47 $0.43
Window Shades $1.54
Fire Protection $1.37 $1.54
Domestic Water Piping $4.39 $4.61
HVAC $10.43 $8.70
Electrical $20.59 $17.40
Subtotal $66.98 $58.12
General Conditions $5.49 $5.12
GL Insurance $0.66 $0.77
GC contingency $2.75 $2.56
GC Fee $4.12 $3.84
Total $80.00 $70.40
*Inclusive of tax and contingency*Inclusive of tax and contingency. Figures provided are USD.
25OFFICE TENANT IMPROVEMENT COST GUIDE
LOCAL MARKET DATA

26
METHODOLOGYCushman & Wakefield’s Project & Development Services team prepared a set of typical fit out plans and asked local partners in 45 markets across the United States, Mexico, Latin America and Canada to price the work. The results were reviewed and compiled to understand variations in pricing and approach. Trends are identified as these same plans are priced over periods of time. The cost of a tenant’s build-out is highly dependent upon the organization’s needs, layout, furniture and finishes. Even with those variances, it can be helpful to have a cost benchmark for planning and budgeting. Accordingly, this report lays out the average costs for key construction categories—carpentry & walls, floors & finishes, general conditions, mechanical, electrical and plumbing (MEP), and miscellaneous construction—for a typical, functional office with the following characteristics: • Finishes: midline finishes in employee areas with slightly upgraded finishes in client facing areas • Technology: includes single drops to each workstation with video conference capability in the conference rooms
Project pricing structure varies across markets. Accordingly, some markets may have blank line items or additional cost components. If a specific component is blank or not shown, those costs have been accounted for in a different line item.
NEW JERSEY1st
Generation2nd
Generation
General Requirements $6.85 $6.85
Demo Existing $0.26 $2.48
Final Cleaning
Architectural Woodwork $6.74 $6.74
Thermal Insulation
Openings $2.98 $1.46
Glazing $12.49 $12.49
Metal Stud Framed Partitions $9.82 $10.20
Tiling $0.41 $0.41
Acoustical Ceilings $8.89 $1.35
Resilient Flooring $1.90 $1.90
Carpeting $5.61 $5.61
Painting $2.42 $2.42
Signage $0.20 $0.20
Fire Extinguishers $0.05 $0.02
Appliances $0.37 $0.37
Window Shades $2.08 $0.26
Fire Protection $3.34 $2.00
Domestic Water Piping $1.48 $0.97
HVAC $33.06 $17.51
Electrical $43.97 $25.45
Subtotal $142.91 $98.68
General Conditions $11.43 $7.89
GL Insurance $7.15 $4.93
GC contingency $14.29 $9.87
GC Fee $6.86 $4.74
Total $182.64 $126.12
NEW YORK1st
Generation2nd
Generation
General Requirements $8.32 $8.32
Demo Existing $0.29 $2.78
Final Cleaning
Architectural Woodwork $7.56 $7.56
Thermal Insulation
Openings $3.34 $1.64
Glazing $14.01 $14.01
Metal Stud Framed Partitions $11.01 $11.44
Tiling $0.46 $0.46
Acoustical Ceilings $9.98 $1.52
Resilient Flooring $2.13 $2.13
Carpeting $6.29 $6.29
Painting $2.72 $2.72
Signage $0.23 $0.23
Fire Extinguishers $0.06 $0.02
Appliances $0.41 $0.41
Window Shades $2.34 $0.29
Fire Protection $3.74 $2.25
Domestic Water Piping $1.66 $1.09
HVAC $37.09 $19.65
Electrical $49.33 $28.55
Subtotal $160.99 $111.36
General Conditions $14.28 $14.28
GL Insurance $7.86 $5.62
GC contingency $16.10 $11.14
GC Fee $7.65 $5.47
Total $206.88 $147.87
*Inclusive of tax and contingency *Inclusive of tax and contingency
26 cushmanwakefield.com
LOCAL MARKET DATA

METHODOLOGYCushman & Wakefield’s Project & Development Services team prepared a set of typical fit out plans and asked local partners in 45 markets across the United States, Mexico, Latin America and Canada to price the work. The results were reviewed and compiled to understand variations in pricing and approach. Trends are identified as these same plans are priced over periods of time. The cost of a tenant’s build-out is highly dependent upon the organization’s needs, layout, furniture and finishes. Even with those variances, it can be helpful to have a cost benchmark for planning and budgeting. Accordingly, this report lays out the average costs for key construction categories—carpentry & walls, floors & finishes, general conditions, mechanical, electrical and plumbing (MEP), and miscellaneous construction—for a typical, functional office with the following characteristics: • Finishes: midline finishes in employee areas with slightly upgraded finishes in client facing areas • Technology: includes single drops to each workstation with video conference capability in the conference rooms
Project pricing structure varies across markets. Accordingly, some markets may have blank line items or additional cost components. If a specific component is blank or not shown, those costs have been accounted for in a different line item.
UPSTATE NEW YORK1st
Generation2nd
Generation
General Requirements $2.75 $2.48
Demo Existing $2.71
Final Cleaning $0.41 $0.41
Architectural Woodwork $4.27 $4.27
Thermal Insulation
Openings $4.57 $4.57
Glazing $2.79 $2.65
Metal Stud Framed Partitions $10.09 $7.22
Tiling $1.15 $1.15
Acoustical Ceilings $4.47 $2.71
Resilient Flooring $1.08 $1.05
Carpeting $3.52 $3.52
Painting $2.49 $2.49
Signage $0.29 $0.29
Fire Extinguishers $0.34 $0.34
Appliances $0.57 $0.57
Window Shades $1.90 $0.47
Fire Protection $3.50 $2.05
Domestic Water Piping $3.12 $1.79
HVAC $14.74 $8.85
Electrical $15.80 $11.06
Subtotal $77.86 $60.67
General Conditions $4.68 $3.59
GL Insurance $1.12 $0.86
GC contingency $7.79 $6.07
GC Fee $5.73 $4.40
Total $97.18 $75.59
GREATER TORONTO, CANADA1st
Generation2nd
Generation
General Requirements $1.78 $1.69
Demo Existing $2.50
Final Cleaning $0.30 $0.30
Architectural Woodwork $0.41 $5.03
Thermal Insulation
Openings $3.64 $3.72
Glazing $3.61 $5.31
Metal Stud Framed Partitions $10.06 $7.85
Tiling $0.28 $0.28
Acoustical Ceilings $5.75 $2.95
Resilient Flooring $0.48 $0.51
Carpeting $2.65 $4.01
Painting $1.68 $2.05
Signage $0.32 $0.43
Fire Extinguishers $0.06 $0.05
Appliances $0.39 $0.42
Window Shades $1.82 $0.50
Fire Protection $2.44 $1.49
Domestic Water Piping $1.63 $1.14
HVAC $17.61 $11.79
Electrical $29.27 $20.54
Subtotal $84.19 $72.57
General Conditions $3.76 $3.49
GL Insurance $0.43 $0.37
GC contingency $8.88 $6.28
GC Fee $2.75 $2.30
Total $100.00 $85.00
*Inclusive of tax and contingency *Inclusive of tax and contingency. Figures provided are USD.
27OFFICE TENANT IMPROVEMENT COST GUIDE
LOCAL MARKET DATA

28
METHODOLOGYCushman & Wakefield’s Project & Development Services team prepared a set of typical fit out plans and asked local partners in 45 markets across the United States, Mexico, Latin America and Canada to price the work. The results were reviewed and compiled to understand variations in pricing and approach. Trends are identified as these same plans are priced over periods of time. The cost of a tenant’s build-out is highly dependent upon the organization’s needs, layout, furniture and finishes. Even with those variances, it can be helpful to have a cost benchmark for planning and budgeting. Accordingly, this report lays out the average costs for key construction categories—carpentry & walls, floors & finishes, general conditions, mechanical, electrical and plumbing (MEP), and miscellaneous construction—for a typical, functional office with the following characteristics: • Finishes: midline finishes in employee areas with slightly upgraded finishes in client facing areas • Technology: includes single drops to each workstation with video conference capability in the conference rooms
Project pricing structure varies across markets. Accordingly, some markets may have blank line items or additional cost components. If a specific component is blank or not shown, those costs have been accounted for in a different line item.
ORANGE COUNTY1st
Generation2nd
Generation
General Requirements $2.01 $1.72
Demo Existing $1.25 $2.25
Final Cleaning $0.33 $0.33
Architectural Woodwork $6.77 $6.77
Thermal Insulation $0.29 $0.23
Openings $4.30 $2.87
Glazing $2.58 $2.58
Metal Stud Framed Partitions $8.03 $5.73
Tiling $2.00 $2.00
Acoustical Ceilings $5.16 $2.82
Resilient Flooring $1.08 $1.08
Carpeting $5.02 $5.02
Painting $2.01 $2.01
Signage $0.29 $0.29
Fire Extinguishers $0.09 $0.04
Appliances $0.57 $0.57
Window Shades $1.90 $0.29
Fire Protection $4.01 $3.01
Domestic Water Piping $1.15 $0.86
HVAC $14.34 $7.74
Electrical $34.98 $20.07
Subtotal $98.14 $68.28
General Conditions $4.01 $2.87
GL Insurance $1.49 $1.15
GC contingency
GC Fee $3.94 $2.75
Total $107.59 $75.04
Sales Tax Total $0.00 $0.00
Contingency (10% of Total) $10.76 $7.50
Total with Tax and Contingency $118.35 $82.55
ORLANDO1st
Generation2nd
Generation
General Requirements $0.63
Demo Existing $2.04 $2.98
Final Cleaning $0.58 $0.68
Architectural Woodwork $2.33 $4.67
Thermal Insulation
Openings $2.33 $3.52
Glazing $5.82 $8.98
Metal Stud Framed Partitions $6.69 $7.97
Tiling $1.45
Acoustical Ceilings $0.58 $2.52
Resilient Flooring $0.87 $7.73
Carpeting $4.65
Painting $1.45 $2.26
Signage $0.09
Fire Extinguishers $0.04 $0.14
Appliances $0.49
Window Shades $0.44
Fire Protection $1.74 $2.20
Domestic Water Piping $5.23 $0.63
HVAC $9.89 $6.81
Electrical $19.77 $5.43
Subtotal $66.04 $57.55
General Conditions $5.82 $4.07
GL Insurance $0.87
GC contingency $2.91 $5.75
GC Fee $4.36 $3.03
Total $80.00 $70.40
*Inclusive of tax and contingency
28 cushmanwakefield.com
LOCAL MARKET DATA

METHODOLOGYCushman & Wakefield’s Project & Development Services team prepared a set of typical fit out plans and asked local partners in 45 markets across the United States, Mexico, Latin America and Canada to price the work. The results were reviewed and compiled to understand variations in pricing and approach. Trends are identified as these same plans are priced over periods of time. The cost of a tenant’s build-out is highly dependent upon the organization’s needs, layout, furniture and finishes. Even with those variances, it can be helpful to have a cost benchmark for planning and budgeting. Accordingly, this report lays out the average costs for key construction categories—carpentry & walls, floors & finishes, general conditions, mechanical, electrical and plumbing (MEP), and miscellaneous construction—for a typical, functional office with the following characteristics: • Finishes: midline finishes in employee areas with slightly upgraded finishes in client facing areas • Technology: includes single drops to each workstation with video conference capability in the conference rooms
Project pricing structure varies across markets. Accordingly, some markets may have blank line items or additional cost components. If a specific component is blank or not shown, those costs have been accounted for in a different line item.
PHILADELPHIA1st
Generation2nd
Generation
General Requirements $1.80 $1.73
Demo Existing $1.96
Final Cleaning $0.37 $0.37
Architectural Woodwork $5.51 $4.15
Thermal Insulation $1.13 $0.86
Openings $0.73 $1.10
Glazing $4.75 $2.77
Metal Stud Framed Partitions $12.41 $10.00
Tiling $0.88
Acoustical Ceilings $6.16 $3.34
Resilient Flooring $0.35
Carpeting $6.51 $7.75
Painting $2.96 $2.96
Signage $0.44 $0.24
Fire Extinguishers
Appliances $0.48 $0.48
Window Shades
Fire Protection $3.07 $0.46
Domestic Water Piping $1.67 $0.23
HVAC $13.35 $9.34
Electrical $25.04 $15.40
Subtotal $87.60 $63.15
General Conditions $5.86 $5.86
GL Insurance $1.98 $1.69
GC contingency
GC Fee $4.01 $3.68
Total $99.45 $74.38
*Inclusive of tax and contingency
PHOENIX1st
Generation2nd
Generation
General Requirements $1.06 $1.15
Demo Existing $1.94
Final Cleaning $0.21 $0.21
Architectural Woodwork $5.36 $5.36
Thermal Insulation $0.69 $0.53
Openings $2.12 $2.12
Glazing $7.46 $6.41
Metal Stud Framed Partitions $6.42 $5.05
Tiling $0.17 $0.17
Acoustical Ceilings $4.53 $4.00
Resilient Flooring $0.46 $0.46
Carpeting $3.60 $3.27
Painting $1.12 $1.12
Signage $0.23 $0.23
Fire Extinguishers $0.12 $0.12
Appliances $0.46 $0.23
Window Shades $0.57 $0.34
Fire Protection $2.41 $1.45
Domestic Water Piping $0.69 $0.69
HVAC $15.20 $9.00
Electrical $18.07 $12.00
Subtotal $70.94 $55.83
General Conditions $3.70 $4.01
GL Insurance $0.89 $0.88
GC contingency
GC Fee $3.70 $3.70
Total $79.23 $64.43
Sales Tax Total $4.83 $3.93
Contingency (10% of Total) $7.92 $6.44
Total with Tax and Contingency $91.99 $74.80
29OFFICE TENANT IMPROVEMENT COST GUIDE
LOCAL MARKET DATA

30
METHODOLOGYCushman & Wakefield’s Project & Development Services team prepared a set of typical fit out plans and asked local partners in 45 markets across the United States, Mexico, Latin America and Canada to price the work. The results were reviewed and compiled to understand variations in pricing and approach. Trends are identified as these same plans are priced over periods of time. The cost of a tenant’s build-out is highly dependent upon the organization’s needs, layout, furniture and finishes. Even with those variances, it can be helpful to have a cost benchmark for planning and budgeting. Accordingly, this report lays out the average costs for key construction categories—carpentry & walls, floors & finishes, general conditions, mechanical, electrical and plumbing (MEP), and miscellaneous construction—for a typical, functional office with the following characteristics: • Finishes: midline finishes in employee areas with slightly upgraded finishes in client facing areas • Technology: includes single drops to each workstation with video conference capability in the conference rooms
Project pricing structure varies across markets. Accordingly, some markets may have blank line items or additional cost components. If a specific component is blank or not shown, those costs have been accounted for in a different line item.
PORTLAND1st
Generation2nd
Generation
General Requirements $3.04 $3.53
Demo Existing $0.20 $2.19
Final Cleaning $0.81 $0.86
Architectural Woodwork $3.44 $3.44
Thermal Insulation $0.84 $0.84
Openings $2.64 $1.04
Glazing $0.19 $0.19
Metal Stud Framed Partitions $35.00 $22.94
Tiling $0.24 $0.24
Acoustical Ceilings $5.45 $0.29
Resilient Flooring $0.38 $0.38
Carpeting $2.98 $2.98
Painting $2.01 $2.01
Signage $0.29 $0.29
Fire Extinguishers $0.05 $0.05
Appliances $0.34 $0.34
Window Shades $0.14 $0.14
Fire Protection $2.52 $1.72
Domestic Water Piping $0.29 $0.29
HVAC $19.21 $13.48
Electrical $21.51 $16.06
Subtotal $101.57 $73.28
General Conditions $6.04 $4.35
GL Insurance $1.76 $1.27
GC contingency
GC Fee $4.03 $2.90
Total $113.40 $81.79
Sales Tax Total $0.00 $0.00
Contingency (10% of Total) $11.34 $8.18
Total with Tax and Contingency $124.74 $89.97
PUERTO RICO1st
Generation2nd
Generation
General Requirements $5.46 $2.33
Demo Existing $0.00 $2.03
Final Cleaning $1.56 $1.56
Architectural Woodwork $4.55 $4.55
Thermal Insulation $0.00 $0.00
Openings $2.71 $1.65
Glazing $3.25 $3.25
Metal Stud Framed Partitions $4.55 $3.19
Tiling $0.00 $0.00
Acoustical Ceilings $2.86 $1.00
Resilient Flooring $4.06 $4.06
Carpeting $4.55 $4.55
Painting $2.60 $2.60
Signage $0.59 $0.59
Fire Extinguishers $0.11 $0.11
Appliances $0.72 $0.72
Window Shades $2.08 $0.27
Fire Protection $5.07 $2.03
Domestic Water Piping $1.30 $0.81
HVAC $15.61 $8.63
Electrical $19.25 $10.55
Subtotal $80.90 $54.48
General Conditions $5.66 $3.81
GL Insurance $1.38 $1.40
GC contingency $8.09 $5.45
GC Fee $8.09 $5.45
Total $104.12 $70.58
*Inclusive of tax and contingency. Figures provided are USD.
30 cushmanwakefield.com
LOCAL MARKET DATA

METHODOLOGYCushman & Wakefield’s Project & Development Services team prepared a set of typical fit out plans and asked local partners in 45 markets across the United States, Mexico, Latin America and Canada to price the work. The results were reviewed and compiled to understand variations in pricing and approach. Trends are identified as these same plans are priced over periods of time. The cost of a tenant’s build-out is highly dependent upon the organization’s needs, layout, furniture and finishes. Even with those variances, it can be helpful to have a cost benchmark for planning and budgeting. Accordingly, this report lays out the average costs for key construction categories—carpentry & walls, floors & finishes, general conditions, mechanical, electrical and plumbing (MEP), and miscellaneous construction—for a typical, functional office with the following characteristics: • Finishes: midline finishes in employee areas with slightly upgraded finishes in client facing areas • Technology: includes single drops to each workstation with video conference capability in the conference rooms
Project pricing structure varies across markets. Accordingly, some markets may have blank line items or additional cost components. If a specific component is blank or not shown, those costs have been accounted for in a different line item.
RALEIGH-DURHAM1st
Generation2nd
Generation
General Requirements $1.44 $1.51
Demo Existing $0.14 $3.01
Final Cleaning $0.34 $0.33
Architectural Woodwork $5.42 $5.33
Thermal Insulation $0.18 $0.12
Openings $2.30 $1.80
Glazing $7.13 $7.00
Metal Stud Framed Partitions $6.27 $5.56
Tiling $0.25 $0.24
Acoustical Ceilings $4.00 $2.02
Resilient Flooring $0.53 $0.52
Carpeting $3.22 $3.16
Painting $1.25 $1.21
Signage $0.05 $0.05
Fire Extinguishers $0.06 $0.06
Appliances $0.43 $0.42
Window Shades $0.76 $0.08
Fire Protection $1.78 $1.37
Domestic Water Piping $0.88 $0.87
HVAC $10.37 $7.20
Electrical $19.37 $15.71
Subtotal $66.17 $57.57
General Conditions $4.52 $4.68
GL Insurance $0.73 $0.63
GC contingency $0.72 $0.64
GC Fee $2.86 $2.48
Total $75.00 $66.00
Sales Tax Total $0.00 $0.00
Contingency (10% of Total) $10.76 $7.50
Total with Tax and Contingency $118.35 $82.55
SACRAMENTO1st
Generation2nd
Generation
General Requirements $0.00 $0.00
Demo Existing $0.00 $4.38
Final Cleaning $0.22 $0.22
Architectural Woodwork $2.72 $2.72
Thermal Insulation $0.53 $0.53
Openings $4.20 $2.59
Glazing $5.88 $5.88
Metal Stud Framed Partitions $10.82 $7.68
Tiling $0.46 $0.46
Acoustical Ceilings $3.51 $0.88
Resilient Flooring $0.72 $0.72
Carpeting $3.79 $3.79
Painting $1.20 $1.02
Signage $0.09 $0.09
Fire Extinguishers $0.08 $0.08
Appliances $0.00 $0.00
Window Shades $0.00 $0.54
Fire Protection $1.31 $0.66
Domestic Water Piping $0.65 $0.65
HVAC $17.07 $8.31
Electrical $17.53 $15.12
Subtotal $70.77 $56.31
General Conditions $2.89 $2.41
GL Insurance $0.88 $0.70
GC contingency $3.93 $3.13
GC Fee $4.10 $3.27
Total $82.58 $65.83
*Inclusive of tax and contingency
31OFFICE TENANT IMPROVEMENT COST GUIDE
LOCAL MARKET DATA

32
METHODOLOGYCushman & Wakefield’s Project & Development Services team prepared a set of typical fit out plans and asked local partners in 45 markets across the United States, Mexico, Latin America and Canada to price the work. The results were reviewed and compiled to understand variations in pricing and approach. Trends are identified as these same plans are priced over periods of time. The cost of a tenant’s build-out is highly dependent upon the organization’s needs, layout, furniture and finishes. Even with those variances, it can be helpful to have a cost benchmark for planning and budgeting. Accordingly, this report lays out the average costs for key construction categories—carpentry & walls, floors & finishes, general conditions, mechanical, electrical and plumbing (MEP), and miscellaneous construction—for a typical, functional office with the following characteristics: • Finishes: midline finishes in employee areas with slightly upgraded finishes in client facing areas • Technology: includes single drops to each workstation with video conference capability in the conference rooms
Project pricing structure varies across markets. Accordingly, some markets may have blank line items or additional cost components. If a specific component is blank or not shown, those costs have been accounted for in a different line item.
SAN DIEGO1st
Generation2nd
Generation
General Requirements $2.00 $1.73
Demo Existing $1.50 $2.25
Final Cleaning $0.35 $0.35
Architectural Woodwork $3.44 $3.44
Thermal Insulation $0.77 $0.66
Openings $6.04 $4.03
Glazing $2.73 $2.73
Metal Stud Framed Partitions $8.69 $6.10
Tiling $1.98 $1.98
Acoustical Ceilings $3.41 $0.29
Resilient Flooring $1.10 $1.10
Carpeting $4.75 $4.75
Painting $1.41 $1.41
Signage $0.09 $0.09
Fire Extinguishers $0.10 $0.05
Appliances $0.55 $0.55
Window Shades $1.92 $0.30
Fire Protection $2.97 $1.98
Domestic Water Piping $0.79 $0.79
HVAC $14.50 $7.32
Electrical $30.00 $20.00
Subtotal $89.09 $61.90
General Conditions $3.41 $3.41
GL Insurance $0.53 $0.53
GC contingency
GC Fee $2.08 $2.08
Total $95.11 $67.92
Sales Tax Total $0.00 $0.00
Contingency (10% of Total) $9.51 $6.79
Total with Tax and Contingency $104.62 $74.71
SALT LAKE CITY1st
Generation2nd
Generation
General Requirements $0.59 $0.02
Demo Existing $0.20 $2.34
Final Cleaning $0.31 $0.31
Architectural Woodwork $3.74 $3.74
Thermal Insulation $0.68 $0.52
Openings $3.78 $2.06
Glazing $6.34 $6.34
Metal Stud Framed Partitions $7.50 $5.68
Tiling $0.29 $0.29
Acoustical Ceilings $3.11 $0.62
Resilient Flooring $0.53 $0.53
Carpeting $3.31 $3.31
Painting $1.21 $1.21
Signage
Fire Extinguishers $0.06 $0.06
Appliances $0.69 $0.69
Window Shades $1.72 $0.14
Fire Protection $1.55 $1.33
Domestic Water Piping $0.44 $0.44
HVAC $14.21 $7.11
Electrical $18.19 $12.86
Subtotal $68.45 $49.62
General Conditions $3.04 $3.04
GL Insurance $1.33 $0.98
GC contingency
GC Fee $3.44 $2.53
Total $76.26 $56.17
Sales Tax Total $6.10 $4.49
Contingency (10% of Total) $7.63 $5.62
Total with Tax and Contingency $89.98 $66.29
32 cushmanwakefield.com
LOCAL MARKET DATA

METHODOLOGYCushman & Wakefield’s Project & Development Services team prepared a set of typical fit out plans and asked local partners in 45 markets across the United States, Mexico, Latin America and Canada to price the work. The results were reviewed and compiled to understand variations in pricing and approach. Trends are identified as these same plans are priced over periods of time. The cost of a tenant’s build-out is highly dependent upon the organization’s needs, layout, furniture and finishes. Even with those variances, it can be helpful to have a cost benchmark for planning and budgeting. Accordingly, this report lays out the average costs for key construction categories—carpentry & walls, floors & finishes, general conditions, mechanical, electrical and plumbing (MEP), and miscellaneous construction—for a typical, functional office with the following characteristics: • Finishes: midline finishes in employee areas with slightly upgraded finishes in client facing areas • Technology: includes single drops to each workstation with video conference capability in the conference rooms
Project pricing structure varies across markets. Accordingly, some markets may have blank line items or additional cost components. If a specific component is blank or not shown, those costs have been accounted for in a different line item.
SAN JOSE1st
Generation2nd
Generation
General Requirements $9.00 $9.00
Demo Existing $1.50 $4.50
Final Cleaning $0.50 $0.50
Architectural Woodwork $10.00 $9.00
Thermal Insulation $1.00 $1.00
Openings $4.50 $4.50
Glazing $4.00 $4.00
Metal Stud Framed Partitions $9.25 $8.00
Tiling $0.57 $0.57
Acoustical Ceilings $7.50 $5.00
Resilient Flooring $1.29 $1.29
Carpeting $4.30 $4.30
Painting $3.50 $3.50
Signage $0.50 $0.50
Fire Extinguishers $0.25 $0.25
Appliances $0.43 $0.43
Window Shades $3.44 $3.44
Fire Protection $2.50 $3.00
Domestic Water Piping $2.29 $2.29
HVAC $35.00 $30.00
Electrical $49.00 $40.00
Subtotal $150.33 $135.08
General Conditions $9.18 $9.18
GL Insurance $1.50 $1.36
GC contingency
GC Fee $4.75 $4.35
Total $165.75 $149.97
Sales Tax Total $0.00 $0.00
Contingency (10% of Total) $16.58 $15.00
Total with Tax and Contingency $182.33 $164.96
SAN FRANCISCO1st
Generation2nd
Generation
General Requirements $5.16 $4.50
Demo Existing $5.45 $3.50
Final Cleaning $0.48 $0.48
Architectural Woodwork $8.53 $8.99
Thermal Insulation $0.75 $0.30
Openings $6.23 $5.11
Glazing $5.46 $5.46
Metal Stud Framed Partitions $12.33 $11.52
Tiling $0.49 $0.49
Acoustical Ceilings $8.32 $3.62
Resilient Flooring $2.29 $1.17
Carpeting $5.63 $5.17
Painting $3.43 $3.04
Signage $0.29 $0.29
Fire Extinguishers $0.14 $0.14
Appliances $0.69 $0.69
Window Shades $1.99 $0.29
Fire Protection $4.39 $2.64
Domestic Water Piping $2.44 $1.29
HVAC $47.31 $18.51
Electrical $50.47 $41.75
Subtotal $172.28 $118.95
General Conditions $8.95 $7.35
GL Insurance $1.83 $1.25
GC contingency
GC Fee $5.07 $1.74
Total $188.12 $129.28
Sales Tax Total $0.00 $0.00
Contingency (10% of Total) $18.81 $12.93
Total with Tax and Contingency $206.93 $142.21
33OFFICE TENANT IMPROVEMENT COST GUIDE
LOCAL MARKET DATA

34
METHODOLOGYCushman & Wakefield’s Project & Development Services team prepared a set of typical fit out plans and asked local partners in 45 markets across the United States, Mexico, Latin America and Canada to price the work. The results were reviewed and compiled to understand variations in pricing and approach. Trends are identified as these same plans are priced over periods of time. The cost of a tenant’s build-out is highly dependent upon the organization’s needs, layout, furniture and finishes. Even with those variances, it can be helpful to have a cost benchmark for planning and budgeting. Accordingly, this report lays out the average costs for key construction categories—carpentry & walls, floors & finishes, general conditions, mechanical, electrical and plumbing (MEP), and miscellaneous construction—for a typical, functional office with the following characteristics: • Finishes: midline finishes in employee areas with slightly upgraded finishes in client facing areas • Technology: includes single drops to each workstation with video conference capability in the conference rooms
Project pricing structure varies across markets. Accordingly, some markets may have blank line items or additional cost components. If a specific component is blank or not shown, those costs have been accounted for in a different line item.
SEATTLE1st
Generation2nd
Generation
General Requirements $3.65 $3.58
Demo Existing $0.20 $2.22
Final Cleaning $0.86 $0.88
Architectural Woodwork $4.78 $4.78
Thermal Insulation
Openings $3.71 $2.45
Glazing $4.13 $4.13
Metal Stud Framed Partitions $4.68 $5.16
Tiling $0.24 $0.24
Acoustical Ceilings $6.72 $5.65
Resilient Flooring $0.62 $0.50
Carpeting $4.75 $3.03
Painting $1.74 $1.74
Signage $0.29 $0.29
Fire Extinguishers $0.40 $0.40
Appliances $0.69 $0.52
Window Shades $0.37 $0.37
Fire Protection $4.86 $3.10
Domestic Water Piping $1.50 $1.54
HVAC $48.86 $36.56
Electrical $34.90 $26.04
Subtotal $127.96 $103.18
General Conditions $2.34 $2.67
GL Insurance $0.78 $0.52
GC contingency
GC Fee $2.70 $2.16
Total $133.77 $108.53
Sales Tax Total $13.51 $10.96
Contingency (10% of Total) $13.38 $10.85
Total with Tax and Contingency $160.66 $130.35
ST LOUIS1st
Generation2nd
Generation
General Requirements $5.15 $4.39
Demo Existing $4.31
Final Cleaning $0.52 $0.57
Architectural Woodwork $8.61 $9.42
Thermal Insulation
Openings $3.79 $2.51
Glazing $12.16 $13.44
Metal Stud Framed Partitions $6.34 $3.50
Tiling
Acoustical Ceilings $4.50 $1.51
Resilient Flooring
Carpeting $5.20 $5.74
Painting $2.69 $2.97
Signage $0.03 $0.04
Fire Extinguishers $0.12 $0.07
Appliances $0.54 $0.60
Window Shades $1.22 $0.16
Fire Protection $2.17 $2.71
Domestic Water Piping $1.48 $1.03
HVAC $19.34 $8.55
Electrical $16.63 $15.39
Subtotal $90.48 $76.90
General Conditions
GL Insurance
GC contingency
GC Fee $4.52 $3.85
Total $95.00 $80.75
*Inclusive of tax and contingency
34 cushmanwakefield.com
LOCAL MARKET DATA

METHODOLOGYCushman & Wakefield’s Project & Development Services team prepared a set of typical fit out plans and asked local partners in 45 markets across the United States, Mexico, Latin America and Canada to price the work. The results were reviewed and compiled to understand variations in pricing and approach. Trends are identified as these same plans are priced over periods of time. The cost of a tenant’s build-out is highly dependent upon the organization’s needs, layout, furniture and finishes. Even with those variances, it can be helpful to have a cost benchmark for planning and budgeting. Accordingly, this report lays out the average costs for key construction categories—carpentry & walls, floors & finishes, general conditions, mechanical, electrical and plumbing (MEP), and miscellaneous construction—for a typical, functional office with the following characteristics: • Finishes: midline finishes in employee areas with slightly upgraded finishes in client facing areas • Technology: includes single drops to each workstation with video conference capability in the conference rooms
Project pricing structure varies across markets. Accordingly, some markets may have blank line items or additional cost components. If a specific component is blank or not shown, those costs have been accounted for in a different line item.
WASHINGTON, DC1st
Generation2nd
Generation
General Requirements $3.50 $2.00
Demo Existing $0.50 $0.50
Final Cleaning
Architectural Woodwork $5.00 $5.00
Thermal Insulation $0.14 $0.14
Openings $0.69 $0.69
Glazing $4.17 $4.17
Metal Stud Framed Partitions $9.50 $6.00
Tiling $0.42 $0.42
Acoustical Ceilings $9.00 $3.00
Resilient Flooring $4.58 $4.58
Carpeting $2.61 $1.61
Painting $2.08 $2.08
Signage $0.42 $0.42
Fire Extinguishers $0.17 $0.17
Appliances $0.47 $0.47
Window Shades $0.25 $0.25
Fire Protection $1.25 $1.25
Domestic Water Piping
HVAC $12.00 $12.00
Electrical $25.00 $14.00
Subtotal $81.75 $58.75
General Conditions $5.00 $2.00
GL Insurance
GC contingency
GC Fee $3.47 $2.43
Total $90.22 $63.18
TAMPA1st
Generation2nd
Generation
General Requirements $2.48 $2.45
Demo Existing $4.25
Final Cleaning
Architectural Woodwork $5.97 $5.90
Thermal Insulation
Openings $1.94 $1.08
Glazing $4.03 $3.98
Metal Stud Framed Partitions $8.18 $8.08
Tiling $0.25 $0.25
Acoustical Ceilings $5.41 $1.43
Resilient Flooring
Carpeting $6.92 $6.84
Painting $2.12 $2.09
Signage
Fire Extinguishers $0.08 $0.08
Appliances
Window Shades
Fire Protection $1.46 $0.93
Domestic Water Piping $0.72 $0.72
HVAC $8.16 $5.69
Electrical $19.86 $15.01
Subtotal $67.58 $58.77
General Conditions $6.49 $6.42
GL Insurance
GC contingency
GC Fee $5.93 $5.21
Total $80.00 $70.40
*Inclusive of tax and contingency *Inclusive of tax and contingency
35OFFICE TENANT IMPROVEMENT COST GUIDE
LOCAL MARKET DATA

36
METHODOLOGYCushman & Wakefield’s Project & Development Services team prepared a set of typical fit out plans and asked local partners in 45 markets across the United States, Mexico, Latin America and Canada to price the work. The results were reviewed and compiled to understand variations in pricing and approach. Trends are identified as these same plans are priced over periods of time. The cost of a tenant’s build-out is highly dependent upon the organization’s needs, layout, furniture and finishes. Even with those variances, it can be helpful to have a cost benchmark for planning and budgeting. Accordingly, this report lays out the average costs for key construction categories—carpentry & walls, floors & finishes, general conditions, mechanical, electrical and plumbing (MEP), and miscellaneous construction—for a typical, functional office with the following characteristics: • Finishes: midline finishes in employee areas with slightly upgraded finishes in client facing areas • Technology: includes single drops to each workstation with video conference capability in the conference rooms
Project pricing structure varies across markets. Accordingly, some markets may have blank line items or additional cost components. If a specific component is blank or not shown, those costs have been accounted for in a different line item.
CALGARY & VANCOUVER1st
Generation2nd
Generation
General Requirements $0.83 $0.85
Demo Existing $0.05 $3.02
Final Cleaning $0.71 $0.80
Architectural Woodwork $6.54 $7.30
Thermal Insulation
Openings $3.30 $2.95
Glazing $5.93 $6.62
Metal Stud Framed Partitions $7.16 $7.22
Tiling $0.25 $0.28
Acoustical Ceilings $5.79 $1.41
Resilient Flooring $0.70 $0.79
Carpeting $5.04 $5.62
Painting $3.42 $3.43
Signage $0.27 $0.30
Fire Extinguishers $0.11 $0.06
Appliances $0.52 $0.58
Window Shades $1.90 $0.30
Fire Protection $2.58 $2.13
Domestic Water Piping $2.22 $1.36
HVAC $14.85 $8.48
Electrical $21.44 $15.77
Subtotal $83.63 $69.23
General Conditions $5.12 $5.82
GL Insurance $0.70 $0.64
GC contingency $5.25 $4.25
GC Fee $5.30 $5.06
Total $100.00 $85.00
*Inclusive of tax and contingency. Figures provided are USD.
AUTHORS: BRIAN UNGLES Project & Development Services, Americas Leader [email protected]
DAVID SMITH Head of Occupier Insights, Global Research [email protected]
SANDY ROMERO Senior Analyst Research [email protected]
REGIONAL PDS LEADS: BRIAN JAFFE Executive Managing Director Western Region Lead, Project & Development Services [email protected]
RICHARD JANTZ Executive Managing Director Tri-State Region Lead, Project & Development Services [email protected]
TOM FIORETTI Executive Managing Director Central Region Lead, Project & Development Services [email protected]
GARY HELMINSKI Executive Managing Director Northeast & Mid-Atlantic Region Lead, Project & Development Services [email protected]
36 cushmanwakefield.com
LOCAL MARKET DATA

©2021 Cushman & Wakefield. All rights reserved. The information contained within this report is gathered from multiple sources believed to be reliable. The information may contain errors or omissions and is presented without any warranty or representations as to its accuracy.
Cushman & Wakefield (NYSE: CWK) is a leading global real estate services firm that delivers exceptional value for real estate occupiers and owners. Cushman & Wakefield is among the largest real estate services firms with approximately 50,000 employees in 400 offices and 60 countries. In 2020, the firm had revenue of $7.8 billion across core services of property, facilities and project management, leasing, capital markets, valuation and other services. To learn more, visit www.cushmanwakefield.com or follow @CushWake on Twitter.
Cushman & Wakefield is a leading global real estate services firm that helps clients transform the way people work, shop, and live.
Related Documents